Embed Size (px)
Citation preview

AN ENERGY MARKET ASSESSMENT NOVEMBER 2011
ENERGY SUPPLY AND DEMAND PROJECTIONS TO 2035
Canada’s Energy Future:

energy futureENERGY SUPPLY AND DEMAND PROJECTIONS TO 2035
Canada’s Energy Future:
AN ENERGY MARKET ASSESSMENT NOVEMBER 2011

© Her Majesty the Queen in Right of Canada as represented by the National Energy Board 2011
Cat. No. NE23-15/2011E-PDF ISBN 978-1-100-19464-6
This report is published separately in both official languages. This publication is available upon request in multiple formats.
© Sa Majesté la Reine du chef du Canada représentée par l’Office national de l’énergie 2011
Nº de cat. NE23-15/2011F-PDF ISBN 978-1-100-98122-2
Ce rapport est publié séparément dans les deux langues officielles. On peut obtenir cette publication sur supports multiples, sur demande.
Permission to Reproduce
Materials may be reproduced for personal, educational and/or non-profit activities, in part or in whole and by any means, without charge or further permission from the National Energy Board, provided that due diligence is exercised in ensuring the accuracy of the information reproduced; that the National Energy Board is identified as the source institution; and that the reproduction is not represented as an official version of the information reproduced, nor as having been made in affiliation with, or with the endorsement of the National Energy Board.
If a party wishes to rely on material from this report in any regulatory proceeding before the NEB, it may submit the material, just as it may submit any public document. Under these circumstances, the submitting party in effect adopts the material and that party could be required to answer questions pertaining to the material.
This report does not provide an indication about whether any application will be approved or not. The Board will decide on specific applications based on the material in evidence before it at that time.
For permission to reproduce the information in this publication for commercial redistribution, please e-mail: [email protected]
Autorisation de reproduction
Le contenu de cette publication peut être reproduit à des fins personnelles, éducatives et(ou) sans but lucratif, en tout ou en partie et par quelque moyen que ce soit, sans frais et sans autre permission de l’Office national de l’énergie, pourvu qu’une diligence raisonnable soit exercée afin d’assurer l’exactitude de l’information reproduite, que l’Office national de l’énergie soit mentionné comme organisme source et que la reproduction ne soit présentée ni comme une version officielle ni comme une copie ayant été faite en collaboration avec l’Office national de l’énergie ou avec son consentement.
Quiconque souhaite utiliser le présent rapport dans une instance réglementaire devant l’Office peut le soumettre à cette fin, comme c’est le cas pour tout autre document public. Une partie qui agit ainsi se trouve à adopter l’information déposée et peut se voir poser des questions au sujet de cette dernière.
Le présent rapport ne fournit aucune indication relativement à l’approbation ou au rejet d’une demande quelconque. L’Office étudie chaque demande en se fondant sur les documents qui lui sont soumis en preuve à ce moment.
Pour obtenir l’autorisation de reproduire l’information contenue dans cette publication à des fins commerciales, faire parvenir un courriel à : [email protected]

C h a p t e r O n e
natiOnal energy BOard i
List of Figures and Tables iii
List of Acronyms and Abbreviations v
List of Units vi
Foreword vii
Executive Summary viii
Chapter 1: Introduction 1
Chapter 2: Key Drivers 2 Energy Prices 2 Economic Growth 5 Key Uncertainties to the Outlook 6
Chapter 3: Energy Demand Outlook 7 Energy Consumption by Sector 9 Key Uncertainties to the Outlook 15
Chapter 4: Crude Oil Outlook 16 Crude Oil and Bitumen Resources 16 Canadian Crude Oil Production Outlook 17 Supply and Demand Balance 23 Key Uncertainties to the Outlook 25
Chapter 5: Natural Gas Outlook 27 Natural Gas Resources 27 Canadian Natural Gas Production Outlook 28 Supply and Demand Balance 33 Key Uncertainties to the Outlook 34
Chapter 6: Natural Gas Liquids Outlook 36 Natural Gas Liquids Supply and Disposition 36 Key Uncertainties to the Outlook 40
Chapter 7: Electricity Outlook 41 Capacity and Generation 41 Exports, Imports and Interprovincial Transfers 46 Key Uncertainties to the Outlook 46
Chapter 8: Coal Outlook 48 Key Uncertainties to the Outlook 50
t a B l e O f C O n t e n t s

Canada’s energy futureii
Chapter 9: Conclusions 51
Glossary 52
Conversion Tables 60
Guide to Appendices 62
C h a p t e r O n e
natiOnal energy BOard iii
l i s t O f f i g u r e s a n d t a B l e s
List of figuresES.1 Price and GDP Growth to 2035, All Cases viiiES.2 Production of Crude Oil, Natural Gas and Electricity, Reference Case ixES.3 Comparison of Historical and Projected Growth Rates of Population,
Real Gross Domestic Product (GDP), and End-use Demand, Reference Case x
2.1 West Texas Intermediate Crude Oil Price at Cushing, Oklahoma, All Cases 22.2 Henry Hub Natural Gas Price at Louisiana, All Cases 32.3 Real Gross Domestic Product, All Cases 5
3.1 Energy Demand by Sector, Reference Case 73.2 Energy Demand, 2020 and 2035, All Cases 83.3 Residential Sector Energy Demand by Fuel, Reference Case 93.4 Commercial Sector Energy Demand by Fuel, Reference Case 113.5 Industrial Sector Energy Demand by Fuel, Reference Case 123.6 Transportation Sector Energy Demand by Mode, Reference Case 133.7 Transportation Sector Energy Demand by Fuel, Reference Case 14
4.1 Total Canadian Oil Production, Reference Case 174.2 Oil Sands Production, Reference Case 184.3 Purchased Natural Gas for Oil Sands, Reference Case 204.4 Western Canada Sedimentary Basin Conventional Oil Production,
Reference Case 214.5 Eastern Canada Oil Production, All Cases 224.6 Total Canada Oil Production, All Cases 224.7 Net Available Oil Supply, Reference Case 234.8 Supply and Demand Balance, Light Crude Oil, Reference Case 244.9 Supply and Demand Balance, Heavy Crude Oil, Reference Case 25
5.1 Natural Gas Prices and Natural Gas Wells Drilled, All Cases 295.2 Natural Gas Production by Type, Reference Case 305.3 Western Canada Natural Gas Production Regions 305.4 Total Canadian Marketable Gas Production, All Cases 325.5 Canadian Net Natural Gas Available for Export, Reference Case 335.6 Canadian Net Natural Gas Available for Export, All Cases 34
6.1 Natural Gas Liquids Production, Reference Case 376.2 Pentanes Plus Supply and Demand, Reference Case 376.3 Western Canada Sedimentary Basin Ethane Availability in Raw Gas and
Ethane Production, Reference Case 386.4 Ethane Supply and Demand Balance, Reference Case 39

Canada’s energy futureiv
7.1 Electricity Generating Capacity, Reference Case 417.2 Generation by Fuel, Reference Case 427.3 Canadian Generation Mix in 2010 and 2035, Reference Case 437.4 Canadian Electricity Generation, All Cases 437.5 Net Electricity Available for Export and Interprovincial Transfers,
Reference Case 49
8.1 Canadian Coal Production and Disposition, Reference Case 51
List of tabLes4.1 Estimated Initial Capital Expenditure (CAPEX) and Threshold Prices for
New Oil Sands Projects 195.1 Remaining Marketable Natural Gas Resources, as of 31 December 2009 27

C h a p t e r O n e
natiOnal energy BOard v
l i s t O f a C r O n y m s a n d a B B r e v i a t i O n s
ACTL Alberta Carbon Trunk Line
CAPEX capital expenditure
CAPP Canadian Association of Petroleum Producers
CBM coalbed methane
CCS carbon capture and storage
CNG compressed natural gas
CO2 carbon dioxide
CSS cyclic steam stimulation
DSM demand side management
EGH EnerGuide for Houses
EMA Energy Market Assessment
EOR enhanced oil recovery
ERCB Energy Resources Conservation Board
EV electric vehicle
GDP gross domestic product
GHG greenhouse gas
GO gross output
IEA International Energy Agency
IP initial production
LNG liquefied natural gas
NEB National Energy Board
NECB National Energy Code for Buildings
NGLs natural gas liquids
NGV natural gas vehicle
OECD Organisation for Economic Co-operation and Development
PHEV plug-in hybrid vehicles
PHRCC Petroleum Human Resources Council of Canada
SAGD steam-assisted gravity drainage
SOEP Sable Offshore Energy Project
THAITM toe-to-heel air injection
WCSB Western Canada Sedimentary Basin
WTI West Texas Intermediate

Canada’s energy futurevi
C h a p t e r O n e
bbl barrels
bbl/d barrels per day
Bcf billion cubic feet
Bcf/d billion cubic feet per day
GW gigawatt
GW.h gigawatt hour
kg kilogram
km kilometre
m3 cubic metre
m3/d cubic metres per day
MMcf million cubic feet
MMBtu million British thermal units
Mt megatonne
MW megawatt
PJ petajoules
$ or Cdn$ Canadian dollars
US$ U.S. dollars
Tcf trillion cubic feet
TW.h terawatt hour
l i s t O f u n i t s

natiOnal energy BOard vii
forewordThe National Energy Board (the NEB or the Board) is an independent federal regulator whose purpose is to promote safety and security, environmental protection and efficient infrastructure and markets in the Canadian public interest1 within the mandate set by Parliament for the regulation of pipelines, energy development, and trade.
The Board's main responsibilities include regulating the construction and operation of interprovincial and international oil and gas pipelines, international power lines, and designated interprovincial power lines. Furthermore, the Board regulates the tolls and tariffs for the pipelines under its jurisdiction. With respect to the specific energy commodities, the Board regulates the export of natural gas, oil, natural gas liquids and electricity, and the import of natural gas. Additionally, the Board regulates oil and gas exploration and development on frontier lands and offshore areas not covered by provincial or federal management agreements.
The Board also monitors energy markets, and provides its view of the reasonably foreseeable requirements for energy use in Canada having regard to trends in the discovery of oil and gas.2 The Board periodically publishes assessments of Canadian supply and demand of energy and natural gas markets in support of its ongoing market monitoring. These assessments address various aspects of energy markets in Canada. This Energy Market Assessment (EMA), Canada’s Energy Future: Energy Supply and Demand Projections to 2035, is one such assessment. This particular EMA projects Canadian energy supply and demand trends out to 2035.
In addition to its own quantitative analysis undertaken in this assessment, the NEB sought the views of Canadian energy experts and interested stakeholders through consultation sessions held in the spring of 2011. The NEB would like to take this opportunity to thank the participants in the consultation process. The views collected helped shape the report’s assumptions and analysis.
If a party wishes to rely on material from this report in any regulatory proceeding before the NEB, it may submit the material, just as it may submit any public document. Under these circumstances, the submitting party in effect adopts the material and that party could be required to answer questions pertaining to the material.
This report does not provide an indication about whether any application will be approved or not. The Board will decide on specific applications based on the material in evidence before it at that time.
Comments or questions on this report can be directed to: Abha Bhargava, Project Manager at [email protected]
1 The public interest is inclusive of all Canadians and refers to a balance of economic, environmental, and social considerations that change as society's values and preferences evolve over time.
2 This activity is undertaken pursuant to the Board’s responsibilities under Part VI of the National Energy Board Act and the Board’s decision in GHR-1-87.

CANADA’S ENERGY FUTUREviii
EXECUTIVE SUMMARY
Background
• This report is a continuation of the NEB’s Energy Futures series. The Board released the last full report, Canada’s Energy Future: Reference Case and Scenarios to 2030, in 2007. This was followed by 2009 Reference Case Scenario: Canadian Energy Demand and Supply to 2020, which provided an update to the 2007 Reference Case Scenario in light of the rapidly changing economic conditions occurring at the time.
• Canada’s Energy Future: Energy Supply and Demand Projections to 2035 includes a Reference Case and four sensitivity cases projecting energy supply and demand to 2035.3 The Reference Case is a baseline projection and is considered the “mostly likely” outcome for Canada’s energy future, given the underlying assumptions.
• Each sensitivity case differs from the Reference Case by changing one key assumption (Figure ES.1). The NEB’s suite of models then estimates the impact on the energy system and economy. Sensitivity analysis is a simple and effective means for analyzing uncertainty by isolating the effect of a change in one variable. This approach differs from the 2007 report’s three scenarios, wherein each scenario was a self-contained view of a possible outcome for Canada’s energy future. At that time, each scenario was developed independently of the others and included its own internally consistent set of assumptions.
3 The last year for which detailed energy demand data is available is 2009. As a result, the energy demand projections in this report begin in 2010. In general, historical data on economic indicators, prices and production are available for 2010 and these projections begin in 2011.
REFERENCE CASE
Economic Growth?
Energy Prices?
High
Low
Fast
Slow
Reference “most likely”
WTI Oil Price, 2010US$/bbl,
2035
HH Natural Gas Price, 2010US$/
MMBtu, 2035
Real GDP Growth, 2010-2035
$155 $10.70 2.3%
$85 $6.40 2.3%
$115 $8.00 2.3%
$121 $8.90 3.2%
$112 $6.75 1.8%
F I G U R E E S . 1
Price and GDP Growth to 2035, All Cases

natiOnal energy BOard ix
• As with previous versions, Canada’s Energy Future: Energy Supply and Demand Projections to 2035 provides a valuable opportunity for the Board to communicate with Canadians on current and emerging energy trends.
• In developing this report, the NEB met with various energy experts and interested stakeholders, including representatives from industry and industry associations, government, environmental non-governmental organizations and academia to gather input and feedback on the preliminary projections. The information obtained from these consultations helped shape the key assumptions and final projections.
Key Findings
• The key findings of Canada’s Energy Future: Energy Supply and Demand Projections to 2035 are:
• Energy supply grows to record levels
The emergence of unconventional production as the dominant source of supply growth over the projection period drives this result (Figure ES.2). Based in input assumptions, oil sands production is expected to triple by 2035, increasing its share to 86 per cent of Canada’s total oil supply, up from 54 per cent currently. Conventional oil production continues its historical decline over the projection period. However, an increase in oil-directed drilling and the application of multi-stage hydraulic fracturing in tight oil plays results in growing production in the near term. East coast offshore oil production maintains near current levels until 2025, as new production facilities are built. By 2025, production begins a steady decline until the end of the projection period.
By 2016, increasing Canadian tight and shale gas development reverse the current downward trajectory in Canadian natural gas production. The trend continues, with production reaching the record levels of 2001 near the end of the projection period. A majority of the new supply originates in British Columbia, which has several shale and tight gas plays currently under development. A number of prospective shale resources have been identified in Alberta and producer interest has grown of late. However, given the early stages of this development, specific Alberta shale gas plays have not
2000 2005 2010 2015 2020 2025 2030 20350
2000
4000
6000
8000
10000
12000
14000
16000
Petajoules
Crude Oil Natural Gas Electricity
History Forecast
F I G U r E E S . 2
Production of Crude Oil, Natural Gas and Electricity, Reference Case

Canada’s energy futurex
been separated out from the conventional and tight gas categories in these projections. Given further development, this could have an upward influence on future projections.
Electricity supply also increases to record levels, as new generating capacity is built to meet steadily increasing demand. A number of federal and provincial policies and regulations result in a cleaner electricity supply mix in Canada. The addition of more renewable-based capacity, such as wind, hydro and biomass, as well as the application of carbon capture and storage (CCS) technology, reduce the emissions intensity of the electricity sector.
• Energy demand growth slows from its historical pace
Total end-use energy demand growth slows from 1.4 per cent per year between 1990 and 20084 to 1.3 per cent per year over the projection period. Despite this modest slowing in aggregate demand growth, the detailed results indicate a marked slowdown in many of the energy demand drivers (Figure ES.3). These drivers include slowing population growth, higher energy prices, lower than historical economic growth, and enhanced efficiency and conservation programs. Compared to historical growth rates, energy demand growth in the commercial and transportation sectors slows considerably. In the commercial sector, average annual growth falls from 2.0 per cent historically to 1.0 per cent in the projection, while transportation growth falls from 1.9 per cent to 1.4 per cent. In addition, federal and provincial government programs result in notable penetration of biodiesel and ethanol in the transportation sector. Demand growth in the residential sector falls from 0.7 per cent per year over the 1990 to 2008 period to 0.6 per cent from 2010 to 2035.
Offsetting this slowdown is demand growth in the industrial sector, which made up nearly half of Canadian energy demand in 2010. Robust growth in a number of industries outweighs the declines in energy intensity exhibited by this sector over the
4 The 1990 to 2008 period is used for a historical reference period in this report. Historical data for 2009 is available but given the significant impact of the 2009 global recession on the economy and energy demand, the 1990-2008 period is more illustrative when comparing future trends to history.
Population Real GDP End-use Energy Demand
0.0
0.5
1.0
1.5
2.0
2.5
3.0
Average annual growth (%)
1990-2008 2010-2035
F I G U r E E S . 3
Comparison of Historical and Projected Growth Rates of Population, Real Gross Domestic Product (GDP), and End-use Energy Demand, Reference Case

natiOnal energy BOard xi
outlook period. Industrial energy demand grows at 1.6 per cent per year over the projection period, compared to 1.2 per cent over the 1990 to 2008 period.
• Supply and Demand will impact trade and infrastructure
Changing trends in energy supply and demand will have important implications for energy trade and needs for additional infrastructure. Oil sands production growth, coupled with modest growth in petroleum product demand, more than triples net crude oil available for export by 2035. Meanwhile, increased demand for natural gas in Canada is expected to reduce the net natural gas available for export gradually until 2020. After 2020 net natural gas available for export is flat for the remainder of the outlook period. Net electricity available for export doubles over the outlook period.
• There are four key simplifying assumptions for this report:
• All energy production will find markets and infrastructure will be built as needed. The analysis of these factors was not undertaken.
• Economic factors are the key determinant of various energy supply and demand outcomes. Other considerations, such as environmental and socio-economic impacts are important factors in Canada’s energy future but remain beyond the scope of this report.
• Only policies and programs that are law or near law at the time of writing are included in the projections. As a result, any policies under consideration, or new policies developed after the projections were completed, are not included in this analysis.
• Energy markets are evolving constantly. The analysis presented in this report is based on the best available information at the time.
• Overall, Canada’s Energy Future: Energy Supply and Demand Projections to 2035 suggests that energy markets in Canada will continue to function well, providing adequate energy for Canadians. In the Reference Case, oil, natural gas and electricity supply remain robust, while end-use energy demand growth increases at a slightly slower pace than the historical rate. While energy from fossil fuels remains the dominant source of supply, various programs and policies encourage emerging fuels and technologies to gain market share.

natiOnal energy BOard 1
C h a p t e r O n e
introduction• This report projects energy supply and demand for Canada to the year 2035. It includes a
Reference Case, with baseline projections based on the current macroeconomic outlook, a moderate view of energy prices, and government policies and programs in place at the time the report was prepared. It is considered the “most likely” outcome for Canada’s energy future, given the underlying assumptions.
• In addition to the Reference Case, the report considers four sensitivity cases to provide a broader perspective and reflect the uncertainty around energy prices and economic growth. The four sensitivity cases are referred to as the High and Low Cases (for high and low prices) and the Fast and Slow Cases (for fast and slow economic growth).
• The following chapters discuss the key factors influencing the Reference and sensitivity cases, highlighting key changes in Canadian energy supply and demand trends. The detailed data tables supporting this discussion are available in the Appendices on the NEB website.

Canada’s energy future2
C h a p t e r O n eC h a p t e r t w O
Key drivers• This report considers five cases – a Reference Case, which reflects a moderate view of
future energy prices and economic growth – and four sensitivity cases. These sensitivity cases represent a range of possible outcomes for the Canadian energy system over the projection period. Higher and lower crude oil and natural gas prices characterize the first two cases, whereas faster and slower growth of the Canadian economy distinguishes the other two cases. These four sensitivities are referred to as the High, Low, Fast and Slow Cases.
Energy Prices
Crude Oil Prices
• In the Reference Case, the West Texas Intermediate (WTI) crude oil price is assumed to average US$90/bbl in 2011. The real price increases slowly over the projection period, reaching US$115/bbl by 2035 (in U.S. 2010 dollars) (Figure 2.1). This gradual increase takes place as the global economy continues to recover from the 2009 global recession and as supplies become increasingly difficult to access. Price growth in the oil price outlook reflects global energy supply and demand fundamentals that imply an increasingly tight global crude oil market over the long term.
• In the Low Case, the WTI crude oil price is assumed to be US$30/bbl below the Reference Case price, reaching just over US$85/bbl in 2035. In the High Case, it is assumed to be $40 higher than the Reference Case price, growing to US$155/bbl by 2035.
2000 2005 2010 2015 2020 2025 2030 20350
20
40
60
80
100
120
140
160
2010 US$ per barrel
Reference High Low Fast Slow
History Forecast
F I G U r E 2 . 1
West Texas Intermediate Crude Oil Price at Cushing, Oklahoma, All Cases

natiOnal energy BOard 3
• In the Fast and Slow Cases, the oil price is assumed to differ by only a few dollars above and below the Reference Case. Faster or slower economic growth in Canada and the U.S. is expected to have a relatively small impact on global crude oil demand and the crude oil price. In the Fast Case, the oil price reaches nearly US$121/bbl by 2035 while in the Slow Case it is US$112/bbl.
• In early 2011, the North American benchmark WTI oil price began trading at a significant discount to the Brent oil price, a major crude oil price marker in Europe. Historically, the two prices have tracked very closely to one another. This spread, which has reached more than US$20/bbl in 2011, is largely due to excess supply of crude oil available in the U.S. Midwest. This excess supply is a result of increasing Canadian and U.S. crude oil production and insufficient take-away pipeline capacity at Cushing, Oklahoma (the pricing point for the WTI contract). The assumption that infrastructure will be built as necessary suggests that this excess supply will only be temporary, and the spread between Brent and WTI will dissipate over time.
Natural Gas Prices
• The Henry Hub price of natural gas in the Reference Case is assumed to increase from US$4.50/MMBtu in 2011 to US$8.00/MMBtu in 2035 (in U.S. 2010 dollars) (Figure 2.2). The increase in the real price reflects growing demand for natural gas in North America and gradually increasing costs of discovering and producing the gas.
• Historically, the price of natural gas tended to move in relation to the oil price, with natural gas trading at a small discount to an energy equivalency-ratio of 6:1 (oil prices in US$/bbl relative to gas prices in US$/MMBtu). This ratio has increased in the past several years to 18:1 in 2010. This is due to the large new natural gas production potential brought about by increased utilization of multi-stage hydraulic fracturing technology combined with few opportunities to switch between petroleum-based fuels and natural gas. In the Reference Case, the ratio slowly declines to just over 14:1 by 2035 based on the oil and gas price projections. With considerable uncertainty surrounding the crude oil and natural gas price relationship, price projections for oil and natural gas were developed independently.
• In the Low Case, the natural gas price is assumed to reach US$6.40/MMBtu by 2035 and US$10.70/MMBtu in the High Case.
2000 2005 2010 2015 2020 2025 2030 20350
2
4
6
8
10
12
2010 US$ per MMBtu
Reference High Low Fast Slow
History Forecast
F I G U r E 2 . 2
Henry Hub Natural Gas Price at Louisiana, All Cases

Canada’s energy future4
• Unlike oil prices, which are determined in a global market, the Henry Hub natural gas price is primarily determined on a continental basis, as the North American market lacks significant links to global natural gas markets. The impact of North American economic growth on the natural gas price is larger than on the oil price. As a result, the natural gas price varies more widely than the oil price from the Reference Case in the Fast and Slow Cases, reaching US$8.90/MMBtu and US$6.75/MMBtu, respectively, by 2035.
Electricity Prices
• Electricity prices are determined in regional markets. Consumer prices for electricity are mainly composed of generation, transmission and distribution costs. Prices are generally lowest in the hydro-based provinces (British Columbia, Manitoba, and Quebec), which benefit from a high proportion of low-cost heritage assets, such as hydro-generating stations. These assets are often many decades old and the costs to build them are largely paid off.
• Prices in most jurisdictions are based on the actual cost of providing service to consumers, including a regulated rate of return on the generation, transmission and distribution assets. Provincial and, in some cases, municipal regulators are responsible for approving these costs. All provinces and the territories except Alberta and Ontario follow this model. In Alberta, competitive wholesale markets determine electricity prices. Ontario is a hybrid of the two methodologies, with both regulated and market-based prices.
• Typically, prices tend to be higher for residential customers and lower for large volume commercial and industrial customers, reflecting the cost of serving these markets. In addition, large customers may have direct access to wholesale markets, where power costs can be lower than the rates offered by the retail distribution utilities. This requires open access5 to transmission systems (or wholesale access). All provinces have some form of wholesale access.
• In the Reference Case, the average retail electricity price (including the residential, commercial and industrial prices) is projected to be 42 per cent higher in 2035 compared to 2010, in real terms. This reflects the increasing cost of sourcing new generation and planned improvements to transmission systems. Electricity prices in the sensitivity cases do not differ widely from the Reference Case.
Coal Prices
• Canadian coal prices for power generation vary substantially by region, with prices in Western Canada generally lower, reflecting the cost of integrated mining and power generation (mine mouth power plants). Prices of coal imported to Nova Scotia, New Brunswick and Ontario reflect the competitive international market.
• In all sensitivity cases, coal prices are assumed to stay relatively constant in real terms, staying at 2011 levels over the projection period.
5 Open access to transmission in this report refers to the possibility for eligible market participants (e.g. utilities, direct customers, exporters) to have access to transmission lines under a set of rules, conditions and tariffs. Open access is essential for competitive wholesale power markets, allowing eligible buyers to purchase electricity from the most competitive generation sources.

natiOnal energy BOard 5
Economic Growth
• The Canadian economy is a key driver of the energy picture in all five cases (Figure 2.3). Economic growth, industrial output, inflation, exchange rates and population growth are key macroeconomic factors that influence the energy supply and demand outlook.
• Overall, the global economy continues to recover from the 2009 recession, with developing nations returning to brisk growth. Developed nations have recovered more slowly by comparison, but most have returned to positive GDP growth. This trend is projected to continue, with economies in countries like China, India and Brazil becoming increasingly important drivers of global economic growth. The Reference Case macroeconomic outlook reflects these underlying global trends.
• Canadian real GDP growth is estimated to be 2.6 per cent in 2011, reflecting a continuation of the economic recovery.
• Long-term economic growth is dependent on the growth of Canada’s population, labour force and productivity. Productivity growth is expected to improve over the Reference Case projections while slowing population and labour force growth trends will have a dampening effect on economic growth. From 2010 to 2035, annual GDP growth is projected to average 2.3 per cent.
• Energy prices influence economic conditions in Canada. In particular, the global crude oil price has influenced the exchange rate, especially in recent years. As the crude oil price moved higher, such as in the first half of 2008, the Canadian dollar has appreciated against the American dollar. Similarly, the currency has tended to depreciate when crude oil prices fall. The High and Low Cases explore the economic and energy dynamics resulting from different price assumptions.
• The pace of future economic growth represents a key uncertainty for Canadian energy supply and demand. The Fast and Slow Cases capture a range of this uncertainty. In the Fast Case, the Canadian economy exhibits average annual growth of 3.2 per cent; for the Slow Case this is 1.8 per cent. U.S. economic growth, Canadian labour participation and labour productivity were altered from the Reference Case to construct the two economic growth sensitivity cases.
2000 2005 2010 2015 2020 2025 2030 20350.0
0.5
1.0
1.5
2.0
2.5
3.0
1997Cdn$ (Trillions)
Reference High Low Fast Slow
History Forecast
F I G U r E 2 . 3
Real Gross Domestic Product, All Cases

Canada’s energy future6
Key Uncertainties to the Outlook
• Future movements in the global crude oil price are a key uncertainty. While the High and Low Cases capture much of this volatility, the possibility for even higher or lower prices, or dramatic short-term price swings, exists and could have future implications.
• Economic conditions can have a significant impact on the Canadian energy system as evidenced by the wide swings in energy supply, demand and prices brought about by the 2009 global recession. The Fast and Slow Cases represent a wide range of economic outcomes, but the potential remains for periods of growth outside of the range included in the analysis.
• In recent years, developments in multi-stage hydraulic fracturing technology have allowed previously untapped shale and tight natural gas resources to be economically developed. The result has been significant additions to production and resources in the U.S. and, increasingly, Canada. These lower-cost additions have partially offset long-term declines in conventional gas production in North America and have contributed to lower prices in the last few years.
The widespread development of these natural gas resources is still relatively new in Canada and observers have noted various environmental factors associated with the process. As a result, achieving robust production levels of shale and tight gas at the price levels included in this analysis remains an uncertainty. In particular, Alberta natural gas shale plays are in the early stages of development and there is potential for production to be different than this analysis projects.
• Exploitation of tight oil resources, which also employs multi-stage hydraulic fracturing technology, is in its early stages. If such technology becomes more widely applied, as it has in extracting tight and shale gas, conventional oil production could be higher than in the Reference Case projection.
• As noted earlier, the Reference and four sensitivity cases include only policies and programs that are law or near law at the time of writing. As a result, any policies under consideration, or new policies developed after the projections were completed, are not included in this analysis.
• Over the 25-year outlook period, it is likely that developments beyond the realm of normal expectations will occur, such as geopolitical events or technological breakthroughs. Likewise, new information will become available and trends, policies and technology will evolve. Readers of this report should consider the projections a baseline for discussing Canada’s energy future, not a prediction of what will take place.

C h a p t e r O n e
natiOnal energy BOard 7
C h a p t e r t h r e e
energy demand outLooK• In this report, end-use (secondary) energy demand includes energy used in four sectors:
residential, commercial (includes institutional and pipelines), industrial and transportation.6
• In the Reference Case, total end-use energy demand increases by an average of 1.3 per cent per year (Figure 3.1). This growth is led by the industrial sector, which grows at an annual average rate of 1.6 per cent, followed by transportation at 1.4 per cent. Residential and commercial demands grow at average annual rates of 0.6 and 1.0 per cent, respectively.
• Overall, energy demand growth slows modestly compared to history, where demand grew at an average of 1.4 per cent per year from 1990 to 2008. The industrial sector, which grows faster than its 1990 to 2008 average rate of 1.2 per cent per year, largely drives this level of energy demand growth. Industrial growth is related to strong growth in energy-intensive manufacturing industries, as well as energy used in the oil and gas sector. Demand growth projections in the residential, commercial, and transportation sectors are lower than historical levels. From 1990 to 2008, the residential sector grew at an average annual rate of 0.7 per cent, commercial by 2.0 per cent, and transportation at 1.9 per cent.
• Total energy intensity, measured as energy use per dollar of real Canadian GDP, decreases by an average annual rate of 1.1 per cent over the projection period. This continues the
6 End-use energy demand excludes the energy used to generate electricity. The data used in this analysis is primarily sourced from Statistics Canada, Natural Resources Canada’s Office of Energy Efficiency, and Environment Canada.
2000 2005 2010 2015 2020 2025 2030 20350
2000
4000
6000
8000
10000
12000
14000
16000
Petajoules
Residential Commercial Industrial Transportation
History Forecast
F I G U r E 3 . 1
Energy Demand by Sector, Reference Case
Canada’s energy future8
historical trend where energy intensity declined by an average of 1.2 per cent per year from 1990 to 2008.7
• There are several new programs, policies and standards that are included in the Reference Case that were not included in previous NEB outlooks. Two examples are the recent Passenger Automobile and Light Truck Greenhouse Gas Emission Regulations8 and the Renewable Fuels Regulations.9 Policies or regulations that are currently in development but not finalized are not included.
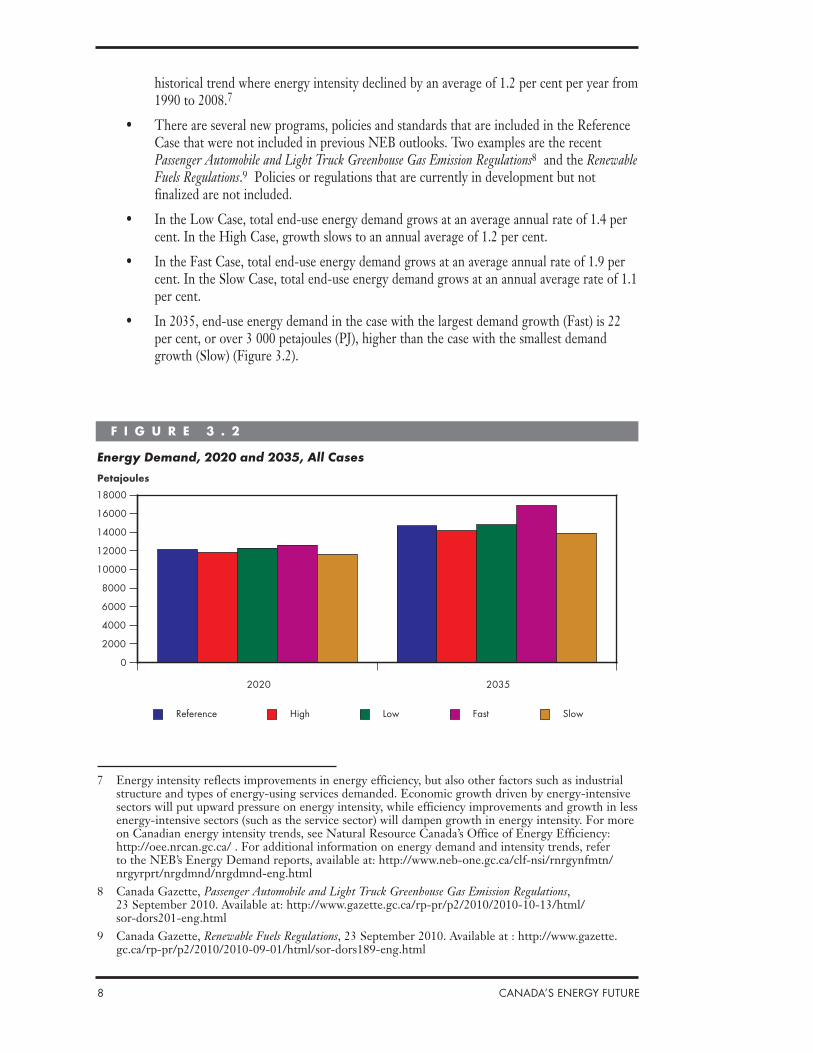
• In the Low Case, total end-use energy demand grows at an average annual rate of 1.4 per cent. In the High Case, growth slows to an annual average of 1.2 per cent.
• In the Fast Case, total end-use energy demand grows at an average annual rate of 1.9 per cent. In the Slow Case, total end-use energy demand grows at an annual average rate of 1.1 per cent.
• In 2035, end-use energy demand in the case with the largest demand growth (Fast) is 22 per cent, or over 3 000 petajoules (PJ), higher than the case with the smallest demand growth (Slow) (Figure 3.2).
7 Energy intensity reflects improvements in energy efficiency, but also other factors such as industrial structure and types of energy-using services demanded. Economic growth driven by energy-intensive sectors will put upward pressure on energy intensity, while efficiency improvements and growth in less energy-intensive sectors (such as the service sector) will dampen growth in energy intensity. For more on Canadian energy intensity trends, see Natural Resource Canada’s Office of Energy Efficiency: http://oee.nrcan.gc.ca/ . For additional information on energy demand and intensity trends, refer to the NEB’s Energy Demand reports, available at: http://www.neb-one.gc.ca/clf-nsi/rnrgynfmtn/nrgyrprt/nrgdmnd/nrgdmnd-eng.html
8 Canada Gazette, Passenger Automobile and Light Truck Greenhouse Gas Emission Regulations, 23 September 2010. Available at: http://www.gazette.gc.ca/rp-pr/p2/2010/2010-10-13/html/sor-dors201-eng.html
9 Canada Gazette, Renewable Fuels Regulations, 23 September 2010. Available at : http://www.gazette.gc.ca/rp-pr/p2/2010/2010-09-01/html/sor-dors189-eng.html
2020 2035
0
2000
4000
6000
8000
10000
12000
14000
16000
18000
Petajoules
Reference High Low Fast Slow
F I G U r E 3 . 2
Energy Demand, 2020 and 2035, All Cases

natiOnal energy BOard 9
Energy Consumption by Sector
Residential Sector
• Residential energy use is the energy consumed by Canadian households. This includes energy used for space and water heating, air conditioning, large appliances, and other energy-using devices like televisions and computers.
• In 2009, Canadian residential energy demand was 1 419 PJ, and accounted for 14 per cent of total Canadian energy demand. Residential energy demand increases at an average annual rate of 0.6 per cent over the projection period, reaching 1 664 PJ in 2035 (Figure 3.3). Residential is the slowest-growing sector, and its share of total energy demand drops to 11 per cent by 2035.
• Demand management programs and policies contribute to the low energy demand growth in the residential sector. Federal programs, such as the ecoEnergy Retrofit-Homes program, have been employed with various provincial programs. Space heating energy efficiency will benefit from new federal regulations for furnaces and boilers. In 2009 and 2010, amendments to the federal Energy Efficiency Act have increased minimum energy performance standards for more than a dozen home devices. There has also been a renewed commitment for utility-based demand side management (DSM) programs.
• All provinces and territories have voluntary programs encouraging greater energy efficiency in new homes and equipment. Many of these programs offer incentives to consumers such as rebates, low-interest loans, and education and awareness campaigns. Also, several provinces have recently moved forward with building codes that include more stringent minimum energy performance standards. Based on the federal EnerGuide for Houses (EGH) rating system, Ontario, British Columbia, Manitoba, and Nova Scotia have essentially mandated requirements for an EGH 80 rating for new homes.10 New home
10 An EnerGuide rating of 80 represents an energy-efficient new house. For perspective, a typical new home in 2002 would rate between 70-71 and an early 1970s home would rate approximately 65. For more information, see the NEB Energy Briefing Note Codes, Standards and Regulations Influencing Energy Demand, 2008. Available at: http://www.neb-one.gc.ca/clf-nsi/rnrgynfmtn/nrgyrprt/nrgdmnd/cdstndrdrgltn2008/cdstndrdrgltn-eng.html
2000 2005 2010 2015 2020 2025 2030 20350
200
400
600
800
1000
1200
1400
1600
1800
Petajoules
Electricity Natural Gas Oil Biofuels and Emerging Energy Other
History Forecast
F I G U r E 3 . 3
Residential Sector Energy Demand by Fuel, Reference Case(a)
(a) Biofuels and emerging energy include wood, biomass, biofuels blended with heating oil, and solar and geothermal hot water heating.

Canada’s energy future10
energy performance is often part of broad emissions and energy reduction strategies (e.g. British Columbia’s Clean Energy Act and Ontario’s Green Energy Act).
• Natural gas and electricity make up the majority of the energy used in the residential sector, accounting for 87 per cent of residential energy use in 2009. Over the projection period, the share of electricity remains stable at 40 per cent, while the natural gas share increases slightly from 47 to 50 per cent. The share of oil used for heating in the residential sector continues its historical decline. This is aided by the recent amendment to Canada’s Renewable Fuels Regulations that requires two per cent renewable fuel content in heating oil. Solar and geothermal hot water heating gains marginal market share over the course of the projection period, accounting for 0.2 per cent of total residential energy demand in 2035, or three PJ.
• Energy prices, end-use energy requirements and regional availability of fuel, determine the mix of fuel used across Canada. Atlantic Canada meets almost all its residential energy needs with electricity, oil and biomass, as natural gas has been available in very limited areas. Quebec, Manitoba and British Columbia have relatively low cost hydroelectricity supply and rely more heavily on electric energy. Alberta and Saskatchewan rely more heavily on natural gas than other provinces.
• Emerging natural gas infrastructure in Nova Scotia and New Brunswick has allowed natural gas to penetrate the residential, commercial, and industrial sectors. In the Reference Case, the share of natural gas in total residential demand increases from 1.1 to 2.2 per cent in Nova Scotia, and 1.6 to 3.2 per cent in New Brunswick.
• In the Low Case, residential energy demand grows at an average annual rate of 0.62 per cent. In the High Case, growth slows to an annual average of 0.50 per cent.
• In the Fast Case, residential energy demand grows at an average annual rate of 0.64 per cent. In the Slow Case, residential demand grows at an annual average rate of 0.56 per cent.
• In 2035, energy demand in the case with the largest demand growth (Fast) is four per cent higher than the case with the smallest demand growth (High), a difference of 60 PJ.
Commercial Sector
• The commercial sector is a broad category that includes offices, retail, warehousing, government and institutional buildings, utilities, communications, and other service industries. It also includes energy consumed by street lighting and oil and natural gas transmission pipelines. The buildings portion of the commercial sector uses energy for space and water heating, air conditioning, lighting, and electrical plug load. The pipeline portion uses energy to power pumps or compressors that move the oil and natural gas through the pipeline.
• In 2009, Canadian commercial energy demand was 1 466 PJ, and accounted for 14 per cent of total Canadian energy demand. Commercial energy demand increases at an average of 1.0 per cent per year over the outlook period, reaching 1 891 PJ in 2035 in the Reference Case (Figure 3.4). Its share of total demand decreases to 13 per cent by 2035.
• An extensively revised National Energy Code for Buildings (NECB) was finalized in the spring of 2011. This companion to the National Building Code puts a greater emphasis on energy performance in buildings than in the past. The code change is expected to improve energy performance in new commercial, institutional, and multi-unit residential complexes by 25 per cent over the previous code (1997). Adoption of the new NECB is ultimately up to the provincial, territorial, or, in some cases, municipal authority. However, this revision

natiOnal energy BOard 11
took a consensus-based approach with broad stakeholder support including that of the provinces, so it is likely to be adopted.
• Several provinces have taken a pre-emptive approach and specified building energy performance ahead of new national standards. British Columbia, Ontario, Manitoba, and Nova Scotia have scheduled requirements in the 2010 to 2012 timeframe.
• The commercial sector demand projection also includes the impact of more stringent energy efficiency regulations on heating, ventilation, air conditioning and electronics in the 2010 to 2012 timeframe.
• In the Low Case, commercial energy demand grows at an average annual rate of 1.0 per cent. In the High Case, growth slows slightly to an annual average of 0.9 per cent.
• In the Fast Case, commercial energy demand grows at an average annual rate of 1.2 per cent. In the Slow Case, commercial demand grows at an annual average rate of 1.0 per cent.
• In 2035, energy demand in the case with the largest demand growth (Fast) is six per cent higher than the case with the smallest demand growth (High), a difference of over 110 PJ.
Industrial Sector
• The industrial sector includes manufacturing, forestry, fisheries, agriculture, construction, and mining. The majority of industrial energy use is consumed by a handful of energy-intensive industries, such as iron and steel, aluminum, cement, chemicals and fertilizers, and pulp and paper manufacturing, petroleum refining, and oil and gas extraction.11
• The industrial sector makes up the largest share of Canadian end-use energy demand, accounting for 47 per cent, or 4 803 PJ, in 2009. It is also the fastest-growing sector over the projection period, increasing at an average annual rate of 1.6 per cent to 7 413 PJ in 2035 (Figure 3.5). In the Reference Case, its share of total demand increases to 51 per cent in 2035.
11 In 2009, energy-intensive industries accounted for 78 per cent of industrial energy demand. Other industries, such as light manufacturing, agriculture, forestry and construction, each consume a relatively small proportion of industrial energy use, but taken together account for 22 per cent.
2000 2005 2010 2015 2020 2025 2030 20350
200
400
600
800
1000
1200
1400
1600
1800
2000
Petajoules
Electricity Natural Gas Oil Biofuels and Emerging Energy Other
History Forecast
F I G U r E 3 . 4
Commercial Sector Energy Demand by Fuel, Reference Case

Canada’s energy future12
• The Canadian industrial demand projection is closely related to the economic growth projections discussed in Chapter 2, as well as the projections of oil and gas production. In particular, the global economic recovery and increasing oil sands production are key drivers of the industrial demand projection.12
• Various utility DSM programs focused on the industrial sector, as well as federal and provincial programs aimed at energy savings, have been maintained or expanded in recent years. These are included in the Reference Case projection.
• Several provinces have made commitments and enacted enabling legislation to participate in the Western Climate Initiative cap-and-trade system. However, its potential effects on demand are not included in the projections, as the final regulations are still in development.
• In the industrial sector, energy demand in the High Case grows slightly faster than in the Low Case (average annual growth rates of 1.51 and 1.49 per cent, respectively). This is an opposite trend from the other sectors, where demand growth in the High Case is less than in the Low Case. The difference is due to oil and gas production activity in the industrial sector. In the High Case, oil and gas production is higher, and so is demand for energy used in its production (and vice-versa for the Low Case). For the other energy-intensive industrial sectors, higher energy prices lead to lower demand as the energy used in producing goods becomes more expensive. These trends are more evident in the regional results. For example, in Alberta, an energy-producing province, industrial demand in the High Case grows about 0.5 per cent per year faster than the Low Case. Conversely, in Ontario industrial demand in the High Case grows about 0.7 per cent per year slower than in the Low Case.
• In the Fast Case, industrial energy demand grows at an average annual rate of 2.3 per cent per year. In the Slow Case, industrial demand grows at an annual average rate of 1.4 per cent per year.
• In 2035, energy demand in the case with the largest demand growth (Fast) is 25 per cent higher than the case with the smallest demand growth (Slow), a difference of nearly 1 800 PJ.
12 For more on energy use by oil sands, see the Crude Oil Supply Outlook, Chapter 4.
2000 2005 2010 2015 2020 2025 2030 20350
1000
2000
3000
4000
5000
6000
7000
8000
Petajoules
Electricity Natural Gas Oil Biofuels and Emerging Energy Other
History Forecast
F I G U r E 3 . 5
Industrial Sector Energy Demand by Fuel, Reference Case

natiOnal energy BOard 13
Transportation Sector
• The transportation sector includes passenger and freight on-road transportation, as well as air, rail, marine, and non-industrial off-road travel.13
• The transportation sector accounted for 25 per cent of total end-use demand in 2009, or 2 611 PJ. It grows at an average annual rate of 1.4 per cent over the Reference Case projection to 3 729 PJ in 2035 (Figure 3.6). Its share of total energy demand remains at 25 per cent throughout the outlook period.
• The freight side of the transportation sector is the main driver of transportation demand growth, growing at an average annual rate of 1.9 per cent over the projection period. The passenger sector is projected to grow about half as fast, at 0.9 per cent per year (Figure 3.6). Freight activity is strongly related to industrial activity, hence the higher growth in freight energy use.
• In late 2010, the federal government finalized regulations for light duty vehicle emissions. The Passenger Automobile and Light Truck Greenhouse Gas Emission Regulations set progressively more stringent limitations on tailpipe emissions for new vehicles in the 2012 to 2016 timeframe. The regulation is based on manufacturers’ fleet make-up from 2011. It is expected that a large portion of the emissions reductions will coincide with an improvement in fuel economy, which will put downward pressure on vehicle energy demand.
• The transportation emissions reductions strategy aligns Canada’s regulations with the U.S. regulations. Regulations for heavy-duty trucks for the 2014 to 2018 period,14 and light-duty vehicles beyond 2016, are currently in development. Therefore, these are not included in this projection.
13 Passenger and freight transportation demand includes consumption by foreign airline and marine consumers. Non-industrial off-road demand includes all-terrain vehicles, lawnmowers, and miscellaneous small equipment. It accounts for less than five per cent of transportation demand. Industrial off-road demand is included in the industrial sector.
14 Environment Canada, Consultation Document for Discussion of the Main Elements of the Proposed Regulations under the Canadian Environmental Protection Act, 1999 to Limit Greenhouse Gas Emissions from New On-Road Heavy-Duty Vehicles and Engines, 9 August 2011. (Proposed regulations expected in early 2012). Available at: http://www.ec.gc.ca/lcpe-cepa/default.asp?lang=En&n=A7A02DDF-1
2000 2005 2010 2015 2020 2025 2030 20350
500
1000
1500
2000
2500
3000
3500
4000
Petajoules
Passenger Freight Off-Road
History Forecast
F I G U r E 3 . 6
Transportation Sector Energy Demand by Mode, Reference Case

Canada’s energy future14
• In 2009, gasoline and diesel accounted for 87 per cent of transportation energy use. This share declines to 81 per cent in the Reference Case by 2035. Gasoline’s share declines from 55 per cent in 2009 to 46 per cent due to slow growth of the passenger sector (which consumes the majority of gasoline) and the increasing penetration of alternative transportation fuels over the projection period. The share of diesel increases from 31 per cent in 2009 to 35 per cent in 2035 (Figure 3.7). This is due to strong growth in the freight sector, which consumes the majority of diesel.
• Canada’s Renewable Fuels Regulations set a minimum requirement of five per cent renewable fuel content in gasoline starting in December 2010. The regulation was recently amended to include two per cent renewable content in diesel and heating distillate oil starting in July 2011. This, in combination with various provincial regulations, causes the share of biofuels in the transportation to increase from 1.1 per cent of total transportation demand in 2009, to 3.3 per cent in the Reference Case by 2035.
• Several provinces are supportive of alternative vehicle technologies and alternative fuels. Quebec, Ontario, Manitoba, and British Columbia have programs and policies to support growth in electric vehicles (EV) and plug-in hybrid vehicles (PHEV), including rebates and pilot projects. In 2035, EV and PHEV use 7.5 PJ of electricity, 0.5 per cent of total passenger transportation demand. This is approximately equivalent to 700 000 EV and PHEVs on the road.15
• There is also growing interest in natural gas vehicles (NGV), with much of the interest in the western provinces. The most likely application of NGVs is for medium and heavy-duty trucks, especially in fleet operations. At the time of writing, no specific policy incentives or subsidies are in place to encourage widespread NGV uptake. However, the oil to natural gas price spread in the projection supports a modestly paced, incremental increase in NGV to target markets. In 2035, freight NGVs use 60 PJ of natural gas, 3.5 per cent of
15 Assuming 200 watt hour /km per EV, driving 15 000 km/yr. Consistent with Electric Vehicle Technology Roadmap for Canada, EV Industry Steering Committee, 2010. Available at: http://canmetenergy-canmetenergie.nrcan-rncan.gc.ca/eng/transportation/hybrid_electric_vehicles/evtrm.html
2000 2005 2010 2015 2020 2025 2030 20350
500
1000
1500
2000
2500
3000
3500
4000
Petajoules
Aviation Fuel Motor Gasoline Diesel Heavy Fuel Oil Biofuels Other
History Forecast
F I G U r E 3 . 7
Transportation Sector Energy Demand by Fuel, Reference Case(a)
(a) heavy fuel oil is used in marine and rail transportation. Biofuels include ethanol and biodiesel blended with petroleum products. Other includes natural gas, electricity, and propane.

natiOnal energy BOard 15
total freight demand. This is approximately equivalent to 56 000 medium- and heavy-duty freight NGVs.16
• British Columbia’s Renewable and Low-carbon Fuel Requirement calls for a ten per cent decrease in carbon intensity for transportation fuels by 2020. The Reference Case assumes this will be met in part by decreasing gasoline and diesel fuel shares, and increases in ethanol, biodiesel, EV/PHEV, and NGV over the 2012 to 2020 timeframe.
• In the Low Case, transportation energy demand grows at an average annual rate of 1.7 per cent. In the High Case, growth slows to an annual average of 1.1 per cent.
• In the Fast Case, transportation energy demand grows at an average annual rate of 2.1 per cent. In the Slow Case, transportation demand grows at an annual average rate of 1.0 per cent.
• In 2035, energy demand in the case with the largest demand growth (Fast) is 33 per cent higher than the case with the smallest demand growth (Slow), a difference of over 1 100 PJ.
Key Uncertainties to the Outlook
• Policies, programs, and regulations are continually under development at the federal, provincial, territorial, and municipal levels to meet various government commitments, objectives, and targets. Implementing policies that are currently in development or making other changes to meet existing targets, may have significant implications for energy demand. These effects may be in the form of reducing energy demand growth, or changing the types of energy Canadians use.
• The oil and gas industry is one of the main sources of energy demand growth in the industrial sector. In recent years, this industry has undergone rapid transformations in both the types of resources extracted, and the technologies used to extract them. Depending on the future development of these resources and technologies, the energy used in this industry may be higher or lower than projected.
16 Assuming heavy trucks travelling 200 000 km/yr with a fuel efficiency of 62 l/100km, and medium trucks traveling 60 000 km/yr with a fuel efficiency of 39 l/100km. This is consistent with National Gas Use in the Canadian Transportation Sector, Natural Gas Use in Transportation Roundtable. There are many more EVs assumed than NGVs, but much less electricity use. This difference is due to passenger EVs being relatively less energy-intensive per kilometre travelled, and travelling few kilometres per year.

Canada’s energy future16
C h a p t e r O n e
crude oiL outLooK
Crude Oil and Bitumen resources
• Canada has abundant resources of crude oil, with an estimated remaining ultimate potential of 54.5 billion cubic metres (343 billion barrels). Of this, oil sands bitumen accounts for 90 per cent and conventional crude oil makes up 10 per cent. Alberta currently accounts for all of the bitumen resources. Efforts are ongoing to assess bitumen deposits in Saskatchewan; however, no official estimate of resource size is yet available. For conventional crude oil, 72 per cent of the estimated remaining resources are found in the frontier regions that include East Coast offshore, northern Canada and other frontier basins that are still relatively unexplored.17 The more developed conventional light and conventional heavy oil deposits in the Western Canada Sedimentary Basin (WCSB) account for the remaining 28 per cent.
• Resources become reserves only after it is proven that economic recovery can be achieved. Canada has remaining oil reserves of 27.5 billion cubic metres (173 billion barrels), with 98 per cent of this attributed to oil sands bitumen, and the remaining to conventional oil sources.18 According to the Oil & Gas Journal,19 Canada is in third place globally in terms of proven oil reserves, behind Saudi Arabia and Venezuela.
• There is considerable potential to add to Canada’s oil reserves. The Grosmont Carbonate formation accounts for 21 per cent of the oil sands resources in Alberta, but has not yet been assigned any reserves. New extraction technologies are being piloted and the establishment of economic recovery in this area would boost oil sands reserves. Similarly, oil sands reserves could be recognized for Saskatchewan in the future.
• The application of horizontal drilling and multi-stage hydraulic fracturing has given new life to previously low-producing or unproductive oil reservoirs in the WCSB. This technology has the potential to be applied in many regions of Canada. Since this extraction technology is still in its early stages of development in Canada, the ultimate impact on resource potential is unclear.
• Prospects for enhanced oil recovery by means of carbon dioxide flooding have increased through federal and provincial government financial support of several projects in western Canada designed to capture carbon dioxide from large emitters and distribute it to candidate oil pools. Since it is early days for this initiative, the full impact will remain unclear for some time.
17 Further detail on Canada's oil resources can be found in Appendix 3.118 Further detail on Canada's oil reserves can be found in Appendix 3.219 Oil & Gas Journal, December 6, 2010
C h a p t e r f O u r

natiOnal energy BOard 17
Canadian Crude Oil Production Outlook
• By 2035, Canadian crude oil production in the Reference Case reaches 958 thousand m3/d (6.0 million bbl/d), or about double 2010 production rates. In 2035, oil sands account for nearly 85 per cent of production, compared to 54 per cent in 2010. Figure 4.1 illustrates the Reference Case oil production outlook. The major drivers of increased oil production levels are:
• Higher oil prices and lower natural gas prices have encouraged a switch to more oil-directed drilling, with 63 per cent of drilling efforts in the first quarter of 2011 targeting oil, and the remaining targeting natural gas.
• Oil sands activity is rebounding from the effects of the 2009 global recession, and benefiting from increased levels of both domestic and foreign investment.
• Conventional crude oil in the WCSB has reversed its long-standing declining trend. Production is ramping up based on the successful application of horizontal drilling and multi-stage hydraulic fracturing methods to tight oil20 reservoirs. Because this technology is in its infancy and the full impact on future production levels unclear, the incremental production volumes assumed in the projection are limited. Decline resumes in the 2015 to 2016 timeframe.
• In Eastern Canada, the Newfoundland and Labrador offshore fields dominate production. Production in this area has been declining, but this decline will moderate with the addition of two large fields. The Hebron Field is scheduled to begin production in 2017. In the Reference Case, an additional field is assumed to be discovered and commences operation by 2022.
Oil Sands Production
• In the Reference Case, the assumed oil price (US$90/bbl WTI in 2011) is sufficient to promote active growth in oil sands capacity. Several projects put on hold because of the
20 Tight oil refers to oil produced from organic-rich shales or from low permeability sandstone, siltstone, limestone or dolostone reservoirs. Tight oil reservoirs typically require the combination of horizontal drilling and multi-stage hydraulic fracturing to establish sufficient fluid flow to achieve economic rates of recovery.
2000 2005 2010 2015 2020 2025 2030 20350
200
400
600
800
1000
1200
0
1
2
3
4
5
6
7
Thousand m3/d Million bbl/d
Eastern Canada
WCSB Conventional Light
WCSB Conventional Heavy
WCSB Condensate
Mined Bitumen
In Situ Bitumen
History Forecast
F I G U r E 4 . 1
Total Canadian Oil Production, Reference Case
Canada’s energy future18
2009 global recession have restarted. Several major operating companies have announced expansion plans and foreign entities are investing significant amounts of capital to buy oil sands interests, in many cases forming partnerships with Canadian companies.
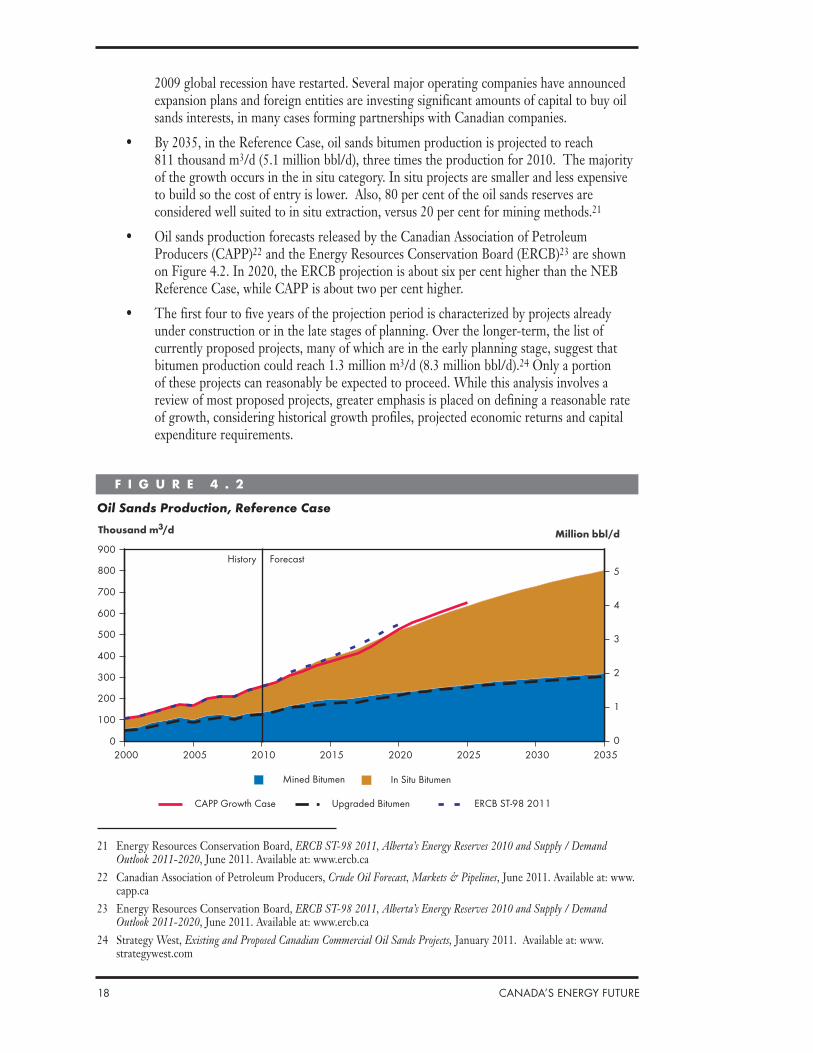
• By 2035, in the Reference Case, oil sands bitumen production is projected to reach 811 thousand m3/d (5.1 million bbl/d), three times the production for 2010. The majority of the growth occurs in the in situ category. In situ projects are smaller and less expensive to build so the cost of entry is lower. Also, 80 per cent of the oil sands reserves are considered well suited to in situ extraction, versus 20 per cent for mining methods.21
• Oil sands production forecasts released by the Canadian Association of Petroleum Producers (CAPP)22 and the Energy Resources Conservation Board (ERCB)23 are shown on Figure 4.2. In 2020, the ERCB projection is about six per cent higher than the NEB Reference Case, while CAPP is about two per cent higher.
• The first four to five years of the projection period is characterized by projects already under construction or in the late stages of planning. Over the longer-term, the list of currently proposed projects, many of which are in the early planning stage, suggest that bitumen production could reach 1.3 million m3/d (8.3 million bbl/d).24 Only a portion of these projects can reasonably be expected to proceed. While this analysis involves a review of most proposed projects, greater emphasis is placed on defining a reasonable rate of growth, considering historical growth profiles, projected economic returns and capital expenditure requirements.
21 Energy Resources Conservation Board, ERCB ST-98 2011, Alberta’s Energy Reserves 2010 and Supply / Demand Outlook 2011-2020, June 2011. Available at: www.ercb.ca
22 Canadian Association of Petroleum Producers, Crude Oil Forecast, Markets & Pipelines, June 2011. Available at: www.capp.ca
23 Energy Resources Conservation Board, ERCB ST-98 2011, Alberta’s Energy Reserves 2010 and Supply / Demand Outlook 2011-2020, June 2011. Available at: www.ercb.ca
24 Strategy West, Existing and Proposed Canadian Commercial Oil Sands Projects, January 2011. Available at: www.strategywest.com
2000 2005 2010 2015 2020 2025 2030 20350
100
200
300
400
500
600
700
800
900
0
1
2
3
4
5
Thousand m3/d Million bbl/d
Mined Bitumen In Situ Bitumen
CAPP Growth Case ERCB ST-98 2011Upgraded Bitumen
History Forecast
F I G U r E 4 . 2
Oil Sands Production, Reference Case

natiOnal energy BOard 19
• In the Reference Case, the average annual growth rate between 2010 and 2020 is about nine per cent for in situ projects and about five per cent for bitumen mining projects. In the later part of the projection period growth rates ease, as higher production levels result in more need for maintenance capital and fewer high-quality reservoirs remain untapped. The average annual growth rate between 2025 and 2035 is about three per cent for in situ projects and about two per cent for mining projects.
Oil Sands Upgrading
• In early 2011, the Alberta government signed an agreement with North West Upgrading Inc. to process bitumen in the province under the provincial bitumen royalty-in-kind initiative.25 Upgraded bitumen volumes from the first phase of the North West Upgrader project in 2014 and subsequent phases in 2021 and 2027, are included in the Reference Case.
• Table 4.1 sets out estimates, based on publicly available industry information, of the cost to build a given type of oil sands project, and the oil price required to encourage a producer to undertake such a project. For example, integrated mining and upgrading projects are estimated to cost in the order of Cdn$85,000 to $105,000/bbl (in 2010 Canadian dollars) of capacity to build, requiring an oil price of US$85 to $95/bbl (in 2010 U.S. dollars) to make a greenfield project economic.
• Both mining and in situ operations provide bitumen feedstock to upgraders. In 2010, essentially all mined production and about 11 per cent of in situ production was upgraded.26 In the Reference Case projection, upgraded bitumen volumes roughly double to 302 thousand m3/d (1.9 million bbl/d) by 2035, but do not keep pace with the overall increase in bitumen production. The portion of total bitumen production that is upgraded declines from 49 per cent in 2010 to 37 per cent in 2035. Over the period 2008 to 2010 the differential between light and heavy crude oil prices has been relatively narrow, and is projected to remain narrow for the near to medium term. This, combined with the very high capital costs of constructing upgraders, is not supportive of building greenfield upgrading facilities.
25 Northwest Upgrading News Release, 16 February 2011. Available at: http://www.northwestupgrading.com/images/pdf/press_releases/BRIK_Announcement_News_Release_Feb_16.2011.pdf
26 Energy Resources Conservation Board, ERCB ST-98 2011, Alberta’s Energy Reserves 2010 and Supply / Demand Outlook 2011-2020, June 2011. Available at: www.ercb.ca
CAPEX
($Cdn / bbl of capacity, Cdn$2010)
Economic Threshold (wti us$ equivalent /
bbl, us$2010)
mining, extraction and upgrading $85,000-$105,000 $85-$95
mining and extraction Only (no upgrading)
$60,000-$75,000 $65-$75
steam-assisted gravity drainage (sagd)/Cyclic steam stimulation (Css)
$25,000-$40,000 $50-$60
(a) includes a realistic after-tax rate of return, commonly in the order of 10 to 15%.
T A B L E 4 . 1
Estimated Initial Capital Expenditure (CAPEX) and Threshold(a) Prices for New Oil Sands Projects

Canada’s energy future20
Natural Gas for Oil Sands
• Oil sands bitumen extraction is energy-intensive, and requires large volumes of natural gas as fuel and feedstock. New technologies27 and efficiency enhancements are expected to decrease the intensity of gas use over time. As well, as operators gain experience with their projects they are able to make them more energy-efficient. For the Reference Case, gas use intensity is assumed to improve by 0.5 per cent annually for mining-only, integrated mining and upgrading projects. For in situ projects, intensity is assumed to improve by 1.5 per cent annually.
• In the Reference Case, requirements for purchased natural gas, including for cogeneration associated with oil sands projects, rise to 104 million m3/d (3.7 Bcf/d) by 2035 (Figure 4.3).
Conventional Oil Production
• Figure 4.4 shows the historical and projected production for conventional crude oil in the WCSB. For Saskatchewan and Manitoba, the charts indicate a resurgence in production taking place over the period 2006 to 2015. For Alberta, the period of increased production extends from 2009 to 2014. In part, this is explained by increased activity due to higher oil prices. Further, it is also indicative of the application of horizontal drilling and multi-stage hydraulic fracturing methods to tight oil plays, such as the Bakken play in Saskatchewan. Other formations, such as the Viking, Lower Shaunavon, Cardium, and Lower Amaranth are also showing increased production. These wells tend to be much more prolific than vertical wells.
• In 2010, drilling activity was higher than in 2009 with more than 60 per cent of wells targeting oil and the remaining targeting natural gas, a reversal of the long-term historical trend of drilling more gas than oil wells. Horizontal drilling in Western Canada for both oil and gas was at record levels in 2010.
27 For example, there are a number of solvent-added processes currently being used, and others in the pilot stage, that feature small amounts of solvents such as butane and propane added to the steam injected in SAGD and CSS projects that increase recovery efficiency. There are also a number of pilot projects that are testing electrical– stimulation methods. The Toe-to-Heel Air Injection (THAITM) is an in situ combustion method that uses very little natural gas and is gaining traction.
2000 2005 2010 2015 2020 2025 2030 20350
20
40
60
80
100
120
0
1
2
3
4
Million m3/dBcf/d
Natural Gas Consumption
History Forecast
F I G U r E 4 . 3
Purchased Natural Gas for Oil Sands, Reference Case

natiOnal energy BOard 21
• Manitoba production has been increasing since 2006, with production expected to reach 6.5 thousand m3/d (41 thousand bbl/d) by 2014, before declining.
• The exploitation of tight oil reservoirs in Canada is in its early stages and it is quite possible that resource estimates and production projections will need revisions in future analyses.
• The projections also include carbon dioxide (CO2) flooding enhanced oil recovery (EOR) in Saskatchewan and Alberta. Saskatchewan has two projects currently in operation, at the Weyburn and Midale oil fields, and a third project has been announced. In Alberta, the provincial government has approved an application from Enhance Energy Inc. and partner North West Upgrading Inc. to build the Alberta Carbon Trunk Line (ACTL).28 This project will receive funding from both the Alberta government ($495 million) and the Canadian government ($63 million). In the Reference Case, it is assumed that EOR production from this project will begin in 2015.
28 The ACTL is designed to gather CO2 from several sources in Alberta’s Industrial Heartland (near Edmonton) and transport the CO2 to existing mature oil fields throughout South-Central Alberta, to facilitate CO2-EOR recovery.
2000 2005 2010 2015 2020 2025 2030 20350
10
20
30
40
50
60
70
80
90
0
100
200
300
400
500
Thousand m3/d Thousand bbl/d
Conventional Light Conventional Heavy Condensate
History Forecast
2000 2005 2010 2015 2020 2025 2030 20350
10
20
30
40
50
60
70
80
90
0
100
200
300
400
500
Thousand m3/d Thousand bbl/d
2000 2005 2010 2015 2020 2025 2030 20350
1
2
3
4
5
6
7
8
9
10
0
10
20
30
40
50
60
Thousand m3/d Thousand bbl/d
2000 2005 2010 2015 2020 2025 2030 20350
1
2
3
4
5
6
7
8
9
10
0
10
20
30
40
50
60
Thousand m3/d Thousand bbl/d
History Forecast
History Forecast History Forecast
Alberta Saskatchewan
Manitoba British Columbia
F I G U r E 4 . 4
Western Canada Sedimentary Basin Conventional Oil Production, Reference Case

Canada’s energy future22
• In British Columbia, conventional oil production shows a consistent decline. However, volumes of condensate are growing because of increasing production of liquids-rich natural gas in that province.
• Eastern Canada production includes relatively small amounts of oil production from Ontario but primarily represents the Newfoundland and Labrador offshore fields (Figure 4.5). Production from this region has been in decline since 2006.With the recent addition of the North Amethyst pool and several additional satellite pools offshore Newfoundland to be connected over the 2012 to 2015 period, the current decline will be pushed into the future.
Total Canada Oil Production
• The differences in the oil production projections for the five cases reflect the oil price assumptions and the recent success of horizontal drilling and multi-stage hydraulic fracturing applied to reservoirs in the WCSB (Figure 4.6). In all cases, there is an increase
2000 2005 2010 2015 2020 2025 2030 20350
10
20
30
40
50
60
70
0
50
100
150
200
250
300
350
400
Thousand m3/d Thousand bbl/d
Reference High Low Fast Slow
History Forecast
F I G U r E 4 . 5
Eastern Canada Oil Production, All Cases
2000 2005 2010 2015 2020 2025 2030 20350
200
400
600
800
1000
1200
0
1
2
3
4
5
6
7
Thousand m3/d Million bbl/d
Reference High Low Fast Slow
History Forecast
F I G U r E 4 . 6
Total Canada Oil Production, All Cases

natiOnal energy BOard 23
in conventional production over the period from 2010 to about 2015, mostly due to increased production from tight oil plays. However, production growth is predominantly from oil sands.
• For Eastern Canada, in the Reference Case it is assumed a new offshore discovery of 500 million barrels in size begins production in 2022. In the High Case, it is assumed this new discovery comes on two years earlier, in 2020, and that higher prices also serve to extend the life of existing pools. For the Low Case, no new pool discovery is assumed.
• In the Reference Case, production reaches 958 thousand m3/d (6.0 million bbl/d) by 2035, double 2010 levels. In the High Case, production is 1.1 million m3/d (6.7 million bbl/d), 11 per cent higher relative to the Reference Case. In the Low Case, production growth slows, but still reaches 760 thousand m3/d (4.8 million bbl/d) by 2035.
• For the Fast and Slow Cases, because the oil price assumptions are only slightly different than in the Reference Case, the production profiles are also only slightly different. Production in the Fast Case is three per cent greater, while in the Slow Case it is three per cent lower by 2035.
Supply and Demand Balance
• Net available oil supply (Figure 4.7) is the amount of oil production that is available to the market after adjustments for processing losses, blending requirements for heavy oil and non-upgraded bitumen, and volumes of condensate diluents that are locally recycled. Upgrading yields vary among the different bitumen upgrading facilities, but in aggregate, about 85 per cent of bitumen feedstock is turned into a synthetic crude oil product. All of the non-upgraded bitumen and most of the conventional heavy production must be blended with a light hydrocarbon, usually condensate, to reduce its viscosity and allow it to meet specifications for pipeline transportation. About 23 per cent of the condensate used for blending is recovered in upgrading facilities and refineries in Alberta and Saskatchewan, and returned for re-use.
• Typically, blended bitumen contains about 30 per cent condensate, while blended conventional heavy crude oil contains about seven per cent condensate. The rising volume of heavy blend shown in Figure 4.7 results in a growing demand for condensate
2000 2005 2010 2015 2020 2025 2030 20350
200
400
600
800
1000
1200
0
1
2
3
4
5
6
7
Thousand m3/d Million bbl/d
Conventional Light Heavy Blend Total Synthetic
History Forecast
F I G U r E 4 . 7
Net Available Oil Supply, Reference Case

Canada’s energy future24
and other light hydrocarbon diluents. It is assumed that condensate imports or similar products from the U.S. or from offshore sources, combined with the manufacture of diluents in Canadian refineries and upgraders, will meet most of the diluent demand. To a small degree, butanes, synthetic crude oil and light conventional crude oil are currently used for blending. Growth in volumes from these sources to meet demand is difficult to predict. In the Reference Case, volumes from these latter sources will grow at five per cent annually. Based on this assumption, blending requirements are met by 12 thousand m3/d (76 thousand bbl/d) of butanes, 17 thousand m3/d (100 thousand bbl/d) of light crude oil (synthetic and conventional) and 127 thousand m3/d (800 thousand bbl/d) of condensate by 2035. This would require 106 thousand m3/d (670 thousand bbl/d) of condensate to be imported.
• Required crude oil feedstock for refining is a function of petroleum product demand. The oil refining sector in Canada relies on both domestic and imported crude to produce the products that Canadians use. Canada also imports refined petroleum products, as it is economic to do so in some regions.
• From 2011 to 2035, total Canadian refinery feedstock requirements rise by 28 per cent to 379 thousand m3/d (2.4 million bbl/d) in the Reference Case.
• Canadian crude oil available for export has been rising and will continue to respond to increases in supply from Alberta's oil sands and changes in supply from conventional sources. Crude oil available for export is surplus to domestic demand and responds directly to increases or decreases in supply.
• In the Reference Case, total crude oil (light and heavy) available for export rises 148 per cent to 801 thousand m3/d (5.0 million bbl/d) from 2011 to 2035. Light crude oil exports peak at 224 thousand m3/d (1.4 million bbl/d) in 2024 and gradually decline to 201 thousand m3/d (1.3 million bbl/d) in 2035 (Figure 4.8). The decline reflects lower production of light crude oil and increased domestic demand. Heavy crude oil exports rise by 243 per cent to 600 thousand m3/d (3.8 million bbl/d) reflecting increases in production from Alberta’s oil sands (Figure 4.9).
2000 2005 2010 2015 2020 2025 2030 20350
50
100
150
200
250
300
350
400
450
0.0
0.5
1.0
1.5
2.0
2.5
Thousand m3/d Million bbl/d
Domestic Light Supply Domestic Disposition Net Available for Export
History Forecast
F I G U r E 4 . 8
Supply and Demand Balance, Light Crude Oil, Reference Case

natiOnal energy BOard 25
• In the Fast and Slow Cases, total oil available for export grows by 174 and 159 per cent, respectively over the next 25 years.
• In the High and Low Cases, total oil available for export grows by 211 and 103 per cent, respectively over the next 25 years.
Key Uncertainties to the Outlook
• These long-term projections envision gradually changing prices. However, oil price spikes in either direction are not uncommon. Periods of lower oil prices would slow activity levels. The exchange rate is also important, because oil exporters are paid for their product in U.S. dollars and a rising Canadian dollar means lower economic returns.
• While the outlook for cost inflation is relatively low at the time of writing, there are a number of large oil sands projects in the construction and planning stage. These projects will be facing competition for labour and materials from conventional oil and gas projects, as well as other large projects. Although companies have taken steps to control construction costs, cost inflation does have the potential to slow the pace of expansion.
• According to the Petroleum Human Resources Council of Canada (PHRCC) the oil and gas industry faces a major challenge in the coming years. There is evidence that a shortage of skilled workers is developing as the workforce ages and overall demand for labour increases. Many of the oil and gas industry's most experienced and skilled workers will be retiring in the next decade. At the same time, the Canadian labour force is shrinking. Under a scenario of high oil and gas prices, the PHRCC is predicting a requirement of 130,000 new hires by 2020.29 This challenge is being addressed through a number of government and industry initiatives, but a potential labour shortage may increase construction costs and the pace of oil development.
29 Petroleum Human Resources Council of Canada, The Decade Ahead: Labour Market Projections and Analysis to 2020, March 2011. Available at: http://www.petrohrsc.ca/
2000 2005 2010 2015 2020 2025 2030 20350
100
200
300
400
500
600
700
0.0
0.5
1.0
1.5
2.0
2.5
3.0
3.5
4.0
Thousand m3/d Million bbl/d
Domestic Heavy Supply Domestic Disposition Net Available for Export
History Forecast
F I G U r E 4 . 9
Supply and Demand Balance, Heavy Crude Oil, Reference Case

Canada’s energy future26
• Rules and regulations regarding oil sands development continue to evolve. For example, the Government of Alberta has issued new rules regarding tailings ponds30 and water use,31 and recently announced a plan to rescind about 20 per cent of oil sands leases to establish conservation areas.32
• Industry and governments in many jurisdictions are currently examining issues related to multi-stage hydraulic fracturing. These include the amount of fresh water used in the fracturing process, maintaining the separation between fracturing fluids and ground water, and the chemical composition and safe disposal of fracturing fluids. There is potential for these developments to affect the pace and level of production.
• Over the 25-year outlook period, it is possible that technological breakthroughs will occur that accelerate the pace of development in conventional and/or oil sands resources.
• A key simplifying assumption in this report is that there will be sufficient infrastructure to deliver Canadian oil production, and that there will be sufficient markets, domestically and internationally, to absorb the projected production levels.
30 Energy Resources Conservation Board, ERCB Directive 074 Tailings Performance Criteria and Requirements for Oil Sands Mining Schemes, 3 February 2009. Available at: www.ercb.ca
31 Energy Resources Conservation Board, Draft Directive, Requirements for Water Measurement, Reporting, and Use for Thermal In Situ Oil Sands Schemes, 18 February 2009. Available at: www.ercb.ca
32 Government of Alberta, Draft Lower Athabasca Integrated Regional Plan 2011 – 2021, 5 April 2011.Available at: https://landuse.alberta.ca/Documents/LARP%20Draft%20Lower%20Athabasca%20Regional%20Plan%20Strategic%20Plan%20and%20Implementation%20Plan-P3-2011-03.pdf

C h a p t e r O n e
natiOnal energy BOard 27
naturaL gas outLooK
Natural Gas resources
• According to the latest Board resource assessment,33 there were 11 940 billion m3 (424 Tcf) of remaining marketable natural gas resources in Canada as of year-end 2009. Most of this was conventional natural gas at 9 742 billion m3 (346 Tcf) (Table 5.1). That estimate was limited, however, by what few modern assessments are publicly available on tight gas, shale gas, and coalbed methane (CBM) resources in Canada. For the purpose of this report, additional marketable resources have been assigned to these categories (available in Appendix A4.1) and remaining Canadian potential is assumed to be 18 811 billion m3 (664 Tcf) in the Reference Case, current to year-end 2010. However, there is greater certainty around the shale gas and CBM estimates based on provincial reserves data and completed studies. There is less certainty around the tight gas estimates given the limited number of studies and work currently underway. The estimate of 18 811 billion m3 (664 Tcf) should therefore be treated as tentative.
• Tight gas is a subset of the conventional gas category, and refers to gas produced from low-permeability reservoirs.34 Tight gas reservoirs will typically not have sufficient natural pathways through the rock for natural gas to successfully flow to the wellbore. Therefore they require some form of artificial stimulation to create pathways, such as multi-stage hydraulic fracturing. Currently, the total tight gas resource potential of Canada is not well known, though is expected to be very large given trends in development, especially for the Montney play and Deep Basin tight gas plays of Alberta and British Columbia.
• Frontier resources, another subset of conventional gas, include gas resources in Northern Canada and offshore resources. For the purpose of this report, Northern Canada is estimated to contain 3 283 billion m3 (116 Tcf) of remaining marketable gas, of which
33 National Energy Board, Ultimate Potential for Unconventional Natural Gas in Northeastern British Columbia’s Horn River Basin, May 2011. Available at www.neb-one.gc.ca.
34 The areas of tight gas recognized in this report include: certain Cretaceous zones in the Deep Basin; the Milk River, Medicine Hat and Second White Specks formations in southeast Alberta and southwest Saskatchewan; and the Jean Marie and Montney formations in northeastern British Columbia.
C h a p t e r f i v e
WCSB West Coast
Northern Canada
Ontario East Coast Canada(a)
billion m3 5 542 485 3 285 33 2 591 11 940
tcf 197 17 117 1 91 424
(a) totals may not add due to rounding
T A B L E 5 . 1
Remaining Marketable Natural Gas Resources, as of 31 December 2009

Canada’s energy future28
53 per cent is in the Mackenzie-Beaufort area and 34 per cent in the Arctic Islands. Remaining marketable gas off the East Coast is estimated at 2 548 billion m3 (90 Tcf) and frontier British Columbia35 is estimated to contain 485 billion m3 (17 Tcf) of remaining marketable gas.
• Unconventional gas resources in this report are shale gas and CBM. As of 2010, there were 68 billion m3 (2.4 Tcf) remaining CBM reserves in Alberta.36 Shales of the Horn River Basin in northeastern British Columbia were estimated to contain 2 198 billion m3 (78 Tcf) of remaining marketable gas at the end of 2010.37 There are other potential shale gas resources in Canada that could add to this total. However, potential shale resources have not yet been assessed because of their very early stage of development. These include the Duvernay and Exshaw plays in Alberta, the Utica shale in Quebec, and Horton Bluff shale in New Brunswick.
Canadian Natural Gas Production Outlook
Drilling
• Canadian natural gas production has dropped 15 per cent since 2008, a direct result of a downturn in drilling activity due to gas price declines. Activity in the last few years has increasingly focused on deeper conventional, tight, and shale gas resources as technological advancements in horizontal drilling and/or multi-stage hydraulic fracturing have lowered their supply costs.38 Shallow gas resources largely remain unprofitable throughout the projection period.
• Deeper wells generally produce more natural gas than shallow wells. Average initial production39 (IP) rates in Western Canada have climbed over the last few years with lower proportions of shallow wells being drilled. The average IP in Western Canada for all wells drilled in 2005 was 13.6 thousand m3/d (0.48 MMcf/d), in 2010 the average was 24.9 thousand m3/d (0.88 MMcf/d), and it is expected that, in 2035, the average IP will be 64.6 thousand m3/d (2.28 MMcf/d).
• Better prospects tend to be drilled earlier in the development of a particular resource area. As activity shifts over time to less-prolific areas, the average IP of new wells would tend to decline. However, improvements in drilling and well completion technology over time may offset these declines and allow IP rates to remain constant. The assumption of constant IPs is applied to most areas in Western Canada. The exceptions are some tight gas areas where IPs have been increasing and shallow gas areas where IPs have consistently been declining.
• In this analysis, IPs are held constant over the projection period for the Montney tight gas play (113.3 thousand m3/d (4 MMcf/d) marketable gas) and Horn River shale gas play (226.6 thousand m3/d (8 MMcf/d) marketable gas). Average IP rates have consistently been increasing over the last few years as wells have gotten longer (horizontal part of a well) and
35 Intermontane basins (basins between mountain ranges) and offshore.36 Energy Resources Conservation Board, ERCB, ST98-2011, Alberta’s Energy Reserves 2010 and Supply/Demand Outlook
2011-2020, June 2011. Available at www.ercb.ca.37 National Energy Board, Ultimate Potential for Unconventional Natural Gas in Northeastern British Columbia’s Horn
River Basin, May 2011. Available at www.neb-one.gc.ca.38 National Energy Board, Natural Gas Supply Costs in Western Canada in 2009, November 2010. Available at: www.
neb-one.gc.ca39 The highest average monthly production rate over the first three months of production.

natiOnal energy BOard 29
more hydraulic fracture stages per well are applied. Future IPs are expected to level off as an optimal number of fracture stages are reached and activity moves to the non-core areas over time.
• Natural gas prices gradually climb in the Reference Case projection. This leads to increased drilling activity, especially for the more economic resources like deeper tight gas and shale gas. However, gas wells drilled per year remain about one-fifth of the peaks seen in 2005 through 2008 (Figure 5.1). Strong production rates from the deeper wells lead to increased production in the latter half of the projection, as additions of new gas outpace production declines from older wells. This would lead to increased revenues available to fund additional drilling, and thus more gas wells and more gas production.
• Higher gas prices in the High Case lead to an increase in wells drilled (over 3 000 wells per year over the projection period), higher gas production, and greater capital spending. The High Case, while still having a significant proportion of deep wells, has the highest proportion of shallow wells compared to the other four cases because the higher prices allow for economic production from shallow wells.
• The Low Case sees a gradual decline in gas wells over the projection period as revenues to fund capital are below Reference Case levels due to lower prices and lower production. In 2035, around 1 600 gas wells are projected to be drilled, as compared to over 4 000 in 2010. The Low Case sees the highest proportion of the more economic deeper wells, and the lowest proportion of the less economic shallow wells.
• Gas prices in the Fast Case are slightly higher than the Reference Case, leading to about 100 more gas wells per year than in the Reference Case.
• The number of gas wells in the Slow Case is just slightly above the Low Case by about 120 wells a year.
Production
• Canadian marketable natural gas production in the Reference Case declines slightly until 2015, from 383.2 million m3/d (13.5 Bcf/d) in 2011 to 372.3 million m3/d (13.1 Bcf/d) in
2000 2005 2010 2015 2020 2025 2030 20350
2
4
6
8
10
12
Henry Hub Natural Gas Price (US$/MMBtu)
Reference High Low Fast Slow
History Forecast
2000 2005 2010 2015 2020 2025 2030 20350
2000
4000
6000
8000
10000
12000
14000
16000
18000
20000
Number of Gas Wells (per year)
History Forecast
F I G U r E 5 . 1
Natural Gas Prices and Natural Gas Wells Drilled, All Cases (a)
(a) Chart does not include the proposed gas wells for the mackenzie delta.

CANADA’S ENERGY FUTURE30
2015. Production then starts to increase, reaching 510.2 million m3/d (18.0 Bcf/d) in 2035 (Figure 5.2). Natural gas from the deeper and more productive conventional, tight, and shale wells more than compensates for production declines from older wells and less gas being added from shallower areas. With higher-productivity wells, it takes fewer wells to maintain overall production than it did before.
• Recently, companies have been focusing on tight and shale resources. These include the Montney tight gas play in northeast British Columbia and western Alberta, the Horn River shale gas resource in northeastern British Columbia, and the Cretaceous tight gas zones in the Deep Basin in western Alberta, shown in Figure 5.3. This focus is expected to continue throughout the projection period as these resources have some of the best economics in Western Canada.
• Montney production includes natural gas liquids (NGLs) that sell at prices linked to oil prices, which are higher than gas prices on an energy-equivalent basis, making drilling more profitable. Montney production from British Columbia grows from 24.3 million m3/d (857 MMcf/d) in 2011 to 144.5 million m3/d (5.1 Bcf/d) in 2035, with
2000 2005 2010 2015 2020 2025 2030 20350
100
200
300
400
500
600
0
5
10
15
20
Million m3/d Bcf/d
Conventional Tight Shale CBM Solution Gas Northern Territories
History Forecast
Marketable production Marketable production
F I G U R E 5 . 2
Natural Gas Production by Type, Reference Case
Horn River Basin
Montney
CBM
ShallowGas
Deep Basin
BCAB
SKMB
F I G U R E 5 . 3
Western Canada Natural Gas Production Regions

natiOnal energy BOard 31
a total of 937 billion m3 (33.1 Tcf) produced over the projection period in the Reference Case.40
• Horn River shale gas producers benefit from strong production rates, with total shale gas production increasing from 13.4 million m3/d (473 MMcf/d) in 2011 to 114.3 millionm3/d (4.0 Bcf/d) in 2035. Total production from the Horn River shales is 594.9 billion m3 (21.0 Tcf) over the Reference Case projection.
• Economics for the Cretaceous tight gas zones in the Alberta Deep Basin benefit from higher NGL contents, existing infrastructure, and recent changes to the Alberta royalty regime. Production from these zones in the Reference Case increases from 51.0 million m3/d (1.8 Bcf/d) in 2011 to 79.3 million m3/d (2.8 Bcf/d) in 2035, as production from new wells more than offsets production declines from older wells.
• The trend toward targeting tight gas and shale gas brings about some pronounced shifts in Canadian production. By 2014, tight gas production becomes larger than all other conventional production in Canada and stays larger over the projection period, accounting for 49 per cent of total Canadian production in 2035 in the Reference Case. The proportion of shale gas also grows, making up 22 per cent of production in 2035. The growth of the Montney tight gas play and Horn River shale play increases production in northeast British Columbia, surpassing Alberta production by 2019 and remaining higher for the rest of the projection period. The production projections in this report do not separate specific shale gas plays in Alberta from the conventional and tight gas categories. The various shale targets in Alberta are prospective and insufficient information is available to identify their properties reliably. If shale gas activity was to accelerate significantly in Alberta, it could have an upward influence on future projections.
• CBM production declines over the projection period, as investment is drawn to other resources. CBM activity will be concentrated in the Horseshoe Canyon resource, as producers are able to drill a shallow CBM well in roughly one day and those with an existing land base will find the play provides adequate economics. Smaller producers who lack financial resources to drill deeper wells may still be able to drill shallow CBM wells efficiently. In the Reference Case, CBM production drops from 21.0 million m3/d (743 MMcf/d) in 2011 to 6.5 million m3/d (230 MMcf/d) in 2035.
• Production of solution gas (gas produced from oil wells) increases slightly through 2014 along with conventional oil production. As conventional and tight oil production decreases over the projection period after 2014, so does the production of solution gas. Total solution gas in Canada declines to 20.5 million m3/d (0.7 Bcf/d) by 2035 from about 36.7 million m3/d (1.3 Bcf/d) currently.
• Atlantic Canada total natural gas production is projected at 7.9 million m3/d (280 MMcf/d) in 2011, 18.8 million m3/d (665 MMcf/d) in 2021, and 15.0 million m3/d (528 MMcf/d) in 2035. Production at the Sable Offshore Energy Project (SOEP) continues to decline and ends by 2018. However, Nova Scotia’s total production increases in November 2011 as the offshore Deep Panuke project starts producing, more than compensating for SOEP declines.41 New Brunswick onshore production is currently at about 0.6 million m3/d (20 MMcf/d) and is projected to stay relatively flat over the projection period. There is shale gas potential in the province that could potentially increase production but its assessment is at too early of a stage to include in this projection.
40 Remaining marketable natural gas, as of 2010, is estimated to range from 1 562 billion m3 in the Low Case to 6 195 billion m3 in the High Case (55 to 219 Tcf) for the Montney play.
41 Deep Panuke is expected to produce a total of 25.5 billion m3 (900 Bcf) over the next 15 years.

Canada’s energy future32
• The projected increase in 2020 and 2021 Atlantic Canada production comes from offshore Newfoundland. Currently, natural gas is produced with oil from Newfoundland’s offshore oil projects, but is being re-injected into the reservoir to maintain pressure for oil production rather than reaching a market. On the assumption that oil production from these fields will taper off, by 2020, gas re-injection could be discontinued and gas could potentially be delivered to market via compressed natural gas (CNG) or liquefied natural gas (LNG) tankers or possibly by pipeline. In the Reference Case, Newfoundland gas is slated to reach market in 2020, but this could be delayed by the discovery of additional oil pools or unfavourable economics of bringing the gas to market. In 2020, Newfoundland marketable production is projected at 8.9 million m3/d (313 MMcf/d) and ramps up to an estimated 14.2 million m3/d (500 MMcf/d) from 2021 to 2035.
• Marketable natural gas production in Ontario is projected to continue declining, from 0.5 million m3/d (16 MMcf/d) in 2011 to zero by 2031. Shale gas potential exists in Quebec; however, insufficient data is available and Quebec shale production is not included in the projection.
• Currently, there is 0.5 million m3/d (18 MMcf/d) marketable natural gas production in the NWT and Yukon. Recent production declines continue until Mackenzie Delta natural gas reaches market. Given the price assumptions, Mackenzie gas is assumed to begin flowing in 2020 in the Reference, Fast, and High Cases, but not until 2030 in the Slow Case, and not at all in the Low Case (Figure 5.4). Mackenzie marketable production in the first year is projected to average 27.0 million m3/d (953 MMcf/d) and 34.0 million m3/d (1.2 Bcf/d) over the remainder of the projection period.
• Marketable Canadian natural gas production in the High Case reaches 584.2 million m3/d (20.6 Bcf/d) in 2035. Production increases in tight, shale, and Mackenzie gas exceed other conventional gas declines.
• Production in the Low Case remains mostly constant over the projection period, at 357.1 million m3/d (12.6 Bcf/d) in 2035. Tight gas and shale gas production increases over the projection, but is offset by declines in non-tight conventional gas. There is no production from Mackenzie and Newfoundland in this case.
2000 2005 2010 2015 2020 2025 2030 20350
100
200
300
400
500
600
700
0
5
10
15
20
Million m3/d Bcf/d
Reference High Low Fast Slow
History Forecast
Production Production
F I G U r E 5 . 4
Total Canadian Marketable Gas Production, All Cases

natiOnal energy BOard 33
• Production in the Fast Case grows slightly faster than in the Reference Case. Total Canadian production reaches 528.8 million m3/d (18.7 Bcf/d) in 2035. Production of Mackenzie and Newfoundland gas both start in 2020.
• In the Slow Case, Canadian production increases slightly over the projection period to reach 418.7 million m3/d (14.8 Bcf/d) in 2035, with Mackenzie gas coming on in 2030 and no marketable production from Newfoundland.
Supply and Demand Balance
• The difference between Canadian production and demand is the net amount of gas that would be available for export each year (net exports). In the Reference Case, this volume trends slightly downwards (Figure 5.5), except for a bump in 2020 that marks the onset of Mackenzie and Newfoundland production. In 2011, 131.0 million m3/d (4.6 Bcf/d) is available for export and in 2035 that decreases to 102.3 million m3/d (3.6 Bcf/d), a 22 per cent drop. The increase in natural gas demand in Canada outweighs the increase in Canadian marketable production over the projection period, leading to the slightly declining trend in net gas available for export. Natural gas supply increases by 33 per cent from 2011 to 2035, but demand (excluding natural gas used in production and processing) increases by 62 per cent, from 252.0 million m3/d (8.9 Bcf/d) in 2011 to 407.7 million m3/d (14.4 Bcf/d) in 2035. Demand increases in Canada are largely from the oil sands sector and for power generation.
• Net gas available for export is highest in the High Case (Figure 5.6), increasing by 34 per cent from 2011 to reach 186.5 million m3/d (6.6 Bcf/d) in 2035. This is a result of higher production than in the Reference Case, but slightly lower demand due to the dampening effect of higher prices.
• In the Low Case, lower production levels drive the decrease in net gas available for export, as production drops six per cent from 2011 to 2035. Without Mackenzie gas to boost production levels, the supply and demand projections in the Low Case imply Canada becomes a net importer of gas by 2029.
• Net gas available for export in the Fast Case is very similar to the Reference Case until the mid 2020s, with production and demand very similar in the two cases. After about 2025,
2000 2005 2010 2015 2020 2025 2030 20350
100
200
300
400
500
600
0
5
10
15
20
Million m3/d Bcf/d
Production Domestic Demand Net Available for Export
History Forecast
F I G U r E 5 . 5
Canadian Net Natural Gas Available for Export, Reference Case

Canada’s energy future34
demand grows faster than production when compared to the Reference Case, leading to a decline in net gas available for export. In 2035, net gas available for export reaches 68.3 million m3/d (2.4 Bcf/d).
• The Slow Case sees a downward trend in net gas available for export over the projection period, except for an increase in 2030 from Mackenzie gas. Net gas available for export drops to nearly zero by 2035, as production grows slower than demand.
Key Uncertainties to the Outlook
• Future natural gas prices are a key uncertainty in the production projections. The Reference and four sensitivity cases cover a wide range of natural gas prices to assess possible price volatility in the future. Since 2000, annual average gas prices in North America have had large swings, doubling from 2003 to 2005 and then falling by more than half from 2008 to 2009. These price swings have significant implications for the industry, including swings in producer revenues and the amount of capital re-invested into the industry.
• As stated in the Crude Oil Chapter, potential labour shortages could impact the pace of development in the oil and gas sector.
• The large and rapid growth of shale gas production in the U.S. has outweighed production declines from other resources. The overall increase in U.S. production has helped to dampen North American natural gas prices since 2009. The future growth of U.S. shale gas production and its impact on North American gas prices will influence Canadian production, producer revenues and the amount of Canadian gas demanded by the U.S. If the U.S. begins to export significant volumes of U.S.-produced LNG, oversupply conditions could be reduced.
• Demand for natural gas, in Canada and internationally, could vary beyond the range considered in this analysis. The growth of gas use for power generation could ramp up more quickly, either to replace older coal plants or if planned new nuclear plants are not built. Domestic natural gas demand could also vary due to production or technology changes in fuel requirements for the oil sands. Changes in demand for Canadian and U.S. natural gas would have an impact on North American natural gas prices.
2000 2005 2010 2015 2020 2025 2030 2035-50
0
50
100
150
200
250
300
-1.8
-0.0
1.7
3.5
5.3
7.0
8.8
10.6
Million m3/d Bcf/d
Reference High Low Fast Slow
History Forecast
F I G U r E 5 . 6
Canadian Net Natural Gas Available for Export, All Cases

natiOnal energy BOard 35
• Industry and governments in many jurisdictions are currently examining issues related to multi-stage hydraulic fracturing. These include the amount of fresh water used in the fracturing process, maintaining the separation between fracturing fluids and ground water, and the chemical composition and safe disposal of fracturing fluids. There is potential for these developments to affect the pace and level of production.
• Other potential uncertainties include the development of additional natural gas sources, like other shale deposits in Alberta, British Columbia or elsewhere in Canada. The development of gas hydrates is also a possibility in the longer term.
• Average well production rates could be higher or lower than assumed in this analysis.
• This report and its analysis makes a simplifying assumption that there will be sufficient infrastructure to move Canadian gas to domestic and export markets and that there will be enough demand in export markets for Canadian gas. Any shortfall in infrastructure or market demand for Canadian gas will reduce the projections of future production.

Canada’s energy future36
C h a p t e r O n e
naturaL gas Liquids outLooK Natural Gas Liquids Supply and Disposition
• Raw natural gas as it comes from the wellhead is mostly composed of methane, but also contains various heavier hydrocarbons as well as some contaminants.42 These heavier hydrocarbons, which consist of ethane, propane, butanes and pentanes plus,43 are called natural gas liquids or NGLs.
• In Canada, most NGLs are produced at gas processing plants, with the remainder produced as a byproduct of oil refining. Hundreds of field plants located in the gas-producing areas of British Columbia, Alberta and Saskatchewan account for most propane, butanes and pentanes plus production, and some ethane production. The majority of ethane production is concentrated in the straddle plants, with the difference coming from field plants with ethane extraction capability. The straddle plants are large gas processing facilities located on major gas pipelines close to consuming centres or gas export points in Alberta and British Columbia. At these locations, these plants have access to high volumes of gas that allow them to take advantage of economies of scale to overcome the high capital investment required for ethane extraction (also called deep-cut extraction).
• Refineries account for only about six per cent of total NGL production. However, they contribute a larger share of propane and butanes production, accounting for approximately 11 and 19 per cent of propane and butanes production, respectively. Oil sands off-gas NGL production only represented one per cent of total NGL production in 2009, but it is expected to increase in the future.
• In the Reference Case, total Canadian NGL production is expected to decline. A fall in ethane production is the biggest contributor to the declining trend in total NGL production. In general, production of propane, butanes and pentanes plus is expected to decline in the near term but stabilize after 2015, as discussed below (Figure 6.1).
• In the Reference Case, propane supply declines in the near term, due to falling non-tight conventional natural gas production. It starts a slow recovery in 2014 when new natural gas production from Montney and increased off-gas processing increases supply. Domestic demand for propane is projected to grow 0.3 per cent per year over the projection period. Propane available for export is expected to decrease early in the projection period, but stabilize from 2015 onwards.
• The production of butanes in the Reference Case behaves similarly to propane. Production is expected to decline from 2010 to 2015, and then stabilize until a mild recovery in 2021. Butanes demand is expected to grow at 1.7 per cent per year over the projection period,
42 Common contaminants are water, carbon dioxide, and hydrogen sulphide.43 Pentanes plus, or condensate, is a gaseous mixture comprised of pentane and heavier hydrocarbons.
C h a p t e r s i x

natiOnal energy BOard 37
as use of butanes as diluents in oil sands production continues. Refinery butanes demand grows marginally over the projection period, as no significant expansions in Canadian refinery capacity are expected in the long term and ethanol makes further inroads into the Canadian gasoline pool, supported by government biofuels mandates. The combination of growing demand and the decline in butanes supply makes Canada a net importer of butanes after 2013.
• Pentanes plus supply is expected to decline early in the Reference Case projection period, and then stabilize from 2020 onwards. Growth in oil sands production will be the main driver of condensate demand. Although some synthetic crude oil could be used for bitumen dilution in the future, bitumen diluent demand is expected to grow at an average rate of 5.7 per cent per year over the projection period, outstripping available domestic supplies. Imports of condensate increase at an average rate of 10 per cent per year over the projection period, reaching 106 thousand m3/d (668 thousand bbl/d) by 2035 (Figure 6.2).
2000 2005 2010 2015 2020 2025 2030 20350
20
40
60
80
100
120
140
0
100
200
300
400
500
600
700
800
Thousand m3/d Thousand bbl/d
Ethane Propane Butanes Pentanes Plus
History Forecast
F I G U r E 6 . 1
Natural Gas Liquids Production, Reference Case
2000 2005 2010 2015 2020 2025 2030 20350
20
40
60
80
100
120
140
0
100
200
300
400
500
600
700
800
Thousand m3/d Thousand bbl/d
Conventional Field Condensate Demand Net implied Imports
History Forecast
F I G U r E 6 . 2
Pentanes Plus Supply and Demand, Reference Case

Canada’s energy future38
• The cases with higher prices (Fast and High) show a slight recovery of propane, butanes and pentanes production post-2021. In the lower price cases (Slow and Low), the decline in NGL supply is slightly greater compared to the Reference Case.
Ethane Supply and Demand
• The amount of NGLs available from natural gas production, particularly ethane, increases in the Reference Case after 2012 due to rising gas production from the Montney play in British Columbia and to a lesser extent the Deep Basin in Alberta (Figure 6.3). Approximately half of the total ethane available in raw gas production in Western Canada is currently extracted. If no new ethane extraction capacity is developed to process new tight gas production in British Columbia and within Alberta, the percentage of ethane recovered will decline.
• Despite the growing availability of ethane in raw gas in the Reference Case, ethane production is expected to decline in the projection (Figure 6.3). This occurs because gas production growth is largely occurring in British Columbia where ethane extraction capacity is minimal. In Alberta, non-tight conventional production is falling while gas demand is rising. These factors combine to reduce the amount of gas reaching the major ethane extraction facilities located near Alberta’s borders. Transfers of British Columbia gas into Alberta are expected to increase, but they are not significant enough to reverse the downward trend of the gas available for ethane extraction in the province. Mackenzie Delta gas could increase Western Canada gas supplies available for ethane extraction for a few years, after which ethane production continues to fall.
• The wave of cancellations and downsizing of upgrading projects in Alberta after the 2009 global recession has negatively affected off-gas supply. In the short term, ethane from off-gas is projected to start in mid-2011 at very low levels of 0.1 thousand m3/d (0.6 thousand bbl/d), ramping up to 1.78 thousand m3/d (11.2 thousand bbl/d) by late 2013. However, a significant amount of actual and future upgrading capacity that has not yet incorporated off-gas processing could result in more ethane from off-gas in the future.
2000 2005 2010 2015 2020 2025 2030 20350
20
40
60
80
100
0
100
200
300
400
500
600
Thousand m3/d Thousand bbl/d
AB BC SK Ethane ProductionAvailability:
ForecastHistory
F I G U r E 6 . 3
Western Canada Sedimentary Basin Ethane Availability in Raw Gas and Ethane Production, Reference Case

natiOnal energy BOard 39
• The Alberta government’s Incremental Ethane Extraction Program has been successful in developing additional supplies of ethane for Alberta’s petrochemical industry. As of July 2011, two projects are in operation.44 Five additional projects45 are under consideration and could further increase future ethane production. There are also several proposals to import ethane into Canada.46
• Alberta’s ethane demand is mostly concentrated in the petrochemical sector. Ethane demand in Alberta has become supply-constrained as ethane supplies have fallen in recent years below the petrochemical capacity. In the absence of other sources such as imports or new indigenous supply, ethane consumption is expected to continue to decline (Figure 6.4).
• Although growing tight gas production in British Columbia and Alberta could offer a new source of ethane supplies for Western Canada, there is little information about potential projects to produce ethane from this new source. Therefore, the Reference Case assumes no building of new ethane extraction (deep-cut) facilities over the projection period.
44 Rimbey Ethane Extraction Project (0.79 thousand m3/d (5 thousand bbl/d)) and the Empress V Expansion Deep Cut Project (1.11 thousand m3/d (7.0 thousand bbl/d)).
45 Musreau Deep Cut Project (0.9 thousand m3/d (6.0 thousand bbl/d)), Harmattan Plant Co-Stream Project (1.91 thousand m3/d (12.0 thousand bbl/d)), Scotford Fuel Gas Recovery Project ( 0.19 thousand m3/d (1.2 thousand bbl/d)), Hidden Lake Streaming Project (0.40 thousand m3/d (2.5 thousand bbl/d)), and Williams Off-gas Ethane Extraction Project (1.59 thousand m3/d (10.0 thousand bbl/d)).
46 In Eastern Canada, there are four proposals under different stages of development to deliver ethane produced from the Marcellus shale gas area into Sarnia. It is expected that ethane import flows could start at approximately 7.15 thousand m3/d (45 thousand bbl/d) by 2014, with the potential to reach up to 9.53 thousand m3/d (60 thousand bbl/d) pending the closing of commercial agreements and regulatory approval. In Western Canada, there is an ethane pipeline import project (Vantage) currently under review by the Board. The project looks to build a pipeline to import ethane from the Bakken oil play in North Dakota to Alberta. If regulatory approval is granted, the pipeline could start shipping 4.77 thousand m3/d (30 thousand bbl/d) of ethane in late 2012, which could increase up to 9.53 thousand m3/d (45 thousand bbl/d) by 2017.
2000 2005 2010 2015 2020 2025 2030 20350
5
10
15
20
25
30
35
40
45
0
50
100
150
200
250
Thousand m3/d Thousand bbl/d
Conventional Production
Off-Gas Production
Other Production
Petrochemical Capacity
Ethane Demand
Net Shortfall
History Forecast
F I G U r E 6 . 4
Ethane Supply and Demand Balance, Reference Case

Canada’s energy future40
Key Uncertainties to the Outlook
• Projects to import ethane into Canada are currently under consideration. These are not included in the projection because they are currently pending regulatory decisions. If approved and constructed, they will be included in future projections.
• NGLs are a byproduct of natural gas production, and NGL supply is sensitive to any Canadian natural gas supply uncertainties. Since NGL content varies between formations, the mix of natural gas production sources also has an impact on future NGL supply.
• If new deep-cut gas processing facilities are developed to extract ethane from the growing availability of tight gas in the Montney region of British Columbia, total NGL supply could be higher than projected.
• A significant amount of actual and future upgrading capacity has not yet incorporated off-gas processing. If this were to change, it could result in more ethane supplies from this non-conventional source in the future.
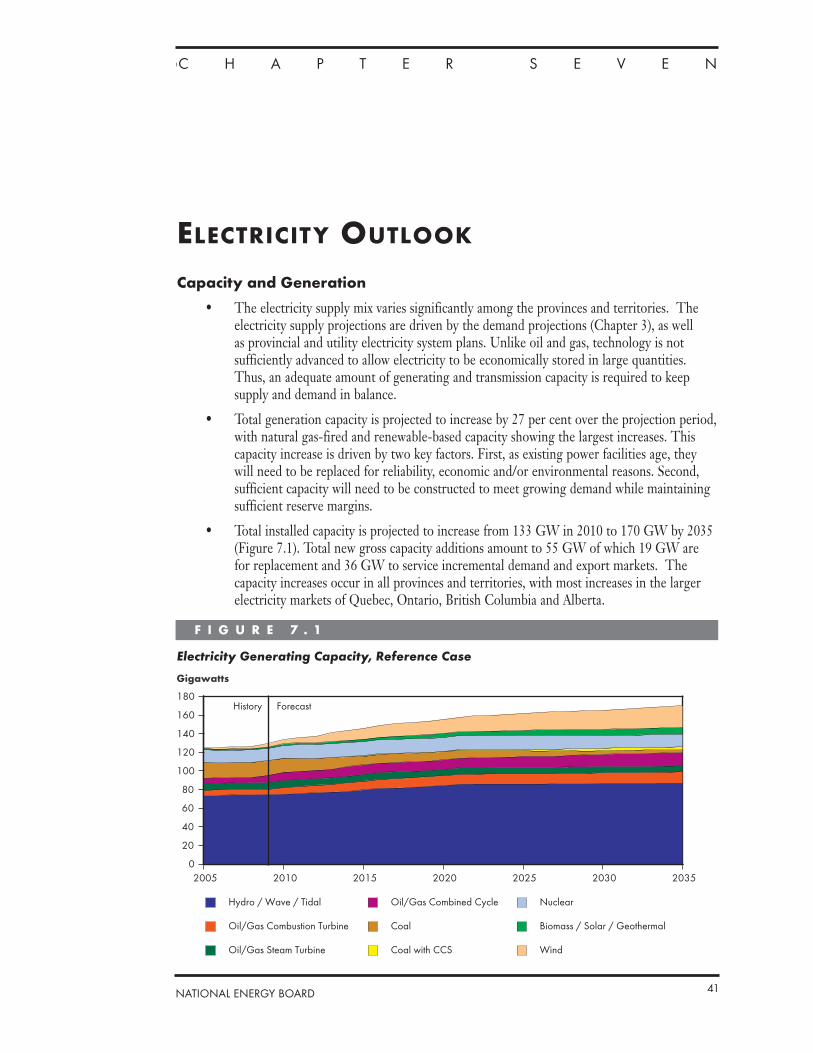
C h a p t e r O n e
natiOnal energy BOard 41
eLectricity outLooK
Capacity and Generation
• The electricity supply mix varies significantly among the provinces and territories. The electricity supply projections are driven by the demand projections (Chapter 3), as well as provincial and utility electricity system plans. Unlike oil and gas, technology is not sufficiently advanced to allow electricity to be economically stored in large quantities. Thus, an adequate amount of generating and transmission capacity is required to keep supply and demand in balance.
• Total generation capacity is projected to increase by 27 per cent over the projection period, with natural gas-fired and renewable-based capacity showing the largest increases. This capacity increase is driven by two key factors. First, as existing power facilities age, they will need to be replaced for reliability, economic and/or environmental reasons. Second, sufficient capacity will need to be constructed to meet growing demand while maintaining sufficient reserve margins.
• Total installed capacity is projected to increase from 133 GW in 2010 to 170 GW by 2035 (Figure 7.1). Total new gross capacity additions amount to 55 GW of which 19 GW are for replacement and 36 GW to service incremental demand and export markets. The capacity increases occur in all provinces and territories, with most increases in the larger electricity markets of Quebec, Ontario, British Columbia and Alberta.
C h a p t e r s e v e n
2005 2010 2015 2020 2025 2030 20350
20
40
60
80
100
120
140
160
180
Gigawatts
Hydro / Wave / Tidal
Oil/Gas Combustion Turbine
Oil/Gas Steam Turbine
Oil/Gas Combined Cycle
Coal
Coal with CCS
Nuclear
Biomass / Solar / Geothermal
Wind
History Forecast
F I G U r E 7 . 1
Electricity Generating Capacity, Reference Case

Canada’s energy future42
• Canadian electricity generation increases at an average annual rate of 1.0 per cent over the projection period, with faster growth in the 2010 to 2020 timeframe (Figure 7.2). The main sources of base load generation vary among the provinces over the projection period. In Quebec, British Columbia and Manitoba, baseload generation is projected to remain predominantly hydro-based. In Saskatchewan, generation continues to be mainly coal-fired, with implementation of Carbon Capture and Storage (CCS) technology growing over the projection period. Alberta gradually shifts from coal to natural gas to meet baseload electricity demand. Nuclear continues to play a key role in providing baseload generation in New Brunswick and Ontario, while contributing a small share to baseload generation in Quebec. The anticipated hydro development of the Lower Churchill in Labrador, and the related transmission expansion in Atlantic Canada, is projected to reduce fossil-fuelled baseload generation in Nova Scotia and New Brunswick. Generation to serve demand during peak periods comes mostly from gas-fired and, especially in isolated areas, oil-fired power plants over the projection period.
• The projected changes in generation mix (Figure 7.3) reflect government and industry efforts to curb energy-related GHG emissions and take into account provincial energy strategies, utility expansion plans, and the relative economics of generation options. Canadian electricity supply becomes cleaner over the projection period, as the share of non-CO2-emitting generation sources (such as nuclear, renewable and plants with CCS) increases from 76 per cent in 2010 to 79 per cent in 2035. The share of renewable-based generation increases from 62 per cent in 2010 to 68 per cent in 2035.
• In the four sensitivity cases, the environmental policies and technological drivers are the same as in the Reference Case. Therefore, in the short- to medium-term, installed capacity is the same in all five cases. In this timeframe, total generation and flows of electricity differ between the cases to reflect differences in demand (Figure 7.4).
• After 2020, installed capacity differs as the differences in demand between the cases become more pronounced. This is especially true for the Fast Case, where electricity demand is over 15 per cent higher than the Reference Case in 2035. The Fast Case has higher natural gas, hydro, and other renewable capacity to help meet this higher demand.
2005 2010 2015 2020 2025 2030 20350
100000
200000
300000
400000
500000
600000
700000
800000
GW.h
Hydro/Wave/Tidal
Natural Gas
Oil
Coal and Coke
Coal with CCS
Uranium
Biomass/Solar/Geothermal
Wind
History Forecast
F I G U r E 7 . 2
Generation by Fuel, Reference Case

natiOnal energy BOard 43
Hydro
• Canada is a world leader in hydroelectricity generation. Hydroelectricity will remain a dominant source of electricity supply in Canada over the projection period. It has the advantages of being a flexible, low-cost source of non-CO2 emitting base load electricity, which contributes to maintaining competitive and stable electricity prices.47
47 Hydro power is flexible in the sense that the output from hydro generating stations can be adjusted quickly with variations in demand. This is often referred to as the load-following characteristic of hydro power. Hydro power can contribute to maintaining price stability because it is not subject to volatility of fuel costs.
59%
9%
1%
14%
0%
14%
2% 1%
Hydro/Wave/Tidal
Natural Gas
Oil
Coal and Coke
Coal with CCS
Uranium
Biomass/Solar/Geothermal
Wind
56%
15%
0.4%
3%
3%
11%
6%6%
2010 2035
F I G U r E 7 . 3
Canadian Generation Mix in 2010 and 2035, Reference Case
2005 2010 2015 2020 2025 2030 20350
100000
200000
300000
400000
500000
600000
700000
800000
900000
GW.h
Reference High Low Fast Slow
History Forecast
F I G U r E 7 . 4
Canadian Electricity Generation, All Cases

Canada’s energy future44
• By taking into account provincial utility planned projects, the Reference Case assumes significant hydropower expansion. Hydro-based capacity, including small hydro, increases from 75 GW in 2010 to 87 GW in 2035. This capacity expansion reflects a number of large hydro projects currently under construction as well as utility-planned projects including Muskrat Falls (824 MW) in Labrador, Romaine (1 550 MW) and Eastmain1-A/ Sarcelles (918 MW) in Quebec, Keeyask (630 MW) in Manitoba and Peace River Site C (900 MW) in British Columbia.
• As a result of projected hydro-based capacity expansion, annual hydroelectricity production increases from 346 TW.h in 2010 to 420 TW.h in 2035. Due to faster growth in other forms of generation, such as wind-based and gas-fired generation, the share of hydroelectricity declines from 59 per cent of total generation in 2010 to 56 per cent in 2035.
Non-hydro Renewable
• In addition to abundant hydro resources, Canada has significant non-hydro renewable resources including wind power, biomass, solar, tidal and wave power. These technologies have grown in the last few years, despite challenges relating to availability and cost. Policy and incentives have helped their growth, such as Ontario’s feed-in tariff.
• Wind power has experienced strong growth in recent years. Over the projection period, it makes the largest contribution to non-hydro renewable growth. The availability of large hydro storage capacity in Canada facilitates the development of wind power as hydro may be used as a back-up source of power when intermittent wind resources are not available.
• Total installed wind power capacity quintuples over the projection period, reaching 23 GW in 2035. The largest capacity additions are in Quebec, Ontario and Alberta. The share of wind-based generation triples from less than two per cent of total generation to six per cent by 2035. Total combined capacity of biomass, solar and geothermal is also expected to grow, with net capacity additions over the projection period of over 5 400 MW, accounting for nearly six per cent of total generation by 2035.
Nuclear
• Nuclear energy currently accounts for 14 per cent of total electricity generation in Canada.48 It plays a significantly larger role in Ontario, accounting for 50 per cent of electricity generation in 2010. Excluding hydro, nuclear is currently the only baseload generation option that provides emission-free electricity at prices that are competitive with other generation options if construction costs are well managed.
• Annual nuclear generation is projected to increase slightly over the entire projection period, rising from 82 TW.h in 2010 to 83 TW.h in 2035. As a result of higher growth in other types of generation, such as wind and gas-fired, the share of nuclear in total electricity generation declines to 11 per cent by 2035, compared to 14 per cent in 2010.
• These projections include the Point-Lepreau generating station in New Brunswick resuming service in 2012, and the Gentilly-2 nuclear generating station in Quebec being refurbished. In Ontario, two new 1 000-MW reactors are projected to come online, one in 2021 and the other in 2023, in addition to the current and planned refurbishments.
48 Based on statistics from the International Energy Agency, this is the same share as in the world electricity supply.

natiOnal energy BOard 45
Coal-Fired
• A key feature of the electricity supply outlook is the declining role of coal used in power generation. This trend reflects various government and industry initiatives to limit GHGs, including stricter regulation of GHG emissions from large industrial polluters such as coal-fired power plants and the complete phase-out of coal in power generation in Ontario. Natural gas is expected to replace part of the retired coal-fired power plants.
• By year-end 2014, the remaining coal-fired power plants in Ontario totaling over 4 000 MW of capacity will be retired. Additional retirements occur in Alberta, Saskatchewan and Nova Scotia. At the national level, over 9 000 MW of coal-fired capacity will be retired over the 2010 to 2035 period, or about two-thirds of the total coal-fired capacity in 2010.
• Coal-fired generation is projected to decline from 78 TW.h in 2010 to 41 TW.h by 2035. As a result, the share of non-CCS coal-fired generation declines from 14 per cent in 2010 to three per cent in 2035.
• By 2035, CCS capacity in Alberta and Saskatchewan increases to nearly 3 000 MW. Much of the growth in CCS occurs after 2020, replacing retired coal capacity or as a retrofit to existing coal plants.
Natural Gas-Fired
• Several factors support a greater role for natural gas power generation in Canada. They include: lower GHG emissions than coal-fired power plants; shorter construction time and permitting delays; lower investment costs than coal or nuclear power plants; the ability to be built in smaller increments to better match load growth; and well-developed gas supply infrastructure in Canada. The recent low price of natural gas has also enhanced the attractiveness of this form of generation.
• Total gas-fired capacity increases from 18 GW in 2010 to 28 GW by 2035 in the Reference Case. Capacity increases in several provinces, with Alberta registering the largest increase. This is due to the continued use of gas in cogeneration facilities for oil sands development and the continued substitution of coal generation with gas.
• Annual gas-fired generation more than doubles over the projection period, rising from 50 TW.h in 2010 to 114 TW.h in 2035. The share of gas-fired generation increases from nine per cent in 2010 to 15 per cent in 2035.
Oil-Fired
• Oil-fired power plants currently account for four per cent of total installed capacity in Canada. They are used to generate electricity during peak demand periods or in areas where other generation options are not widely available, such as Yukon, Northwest Territories and Nunavut.
• In the Reference Case, total oil-fired plant capacity is projected to decline from 5 519 MW in 2010 to 4 282 MW by 2035. This reflects the retirements of ageing units, which are typically replaced by renewable units or natural-gas fired units when possible.
• Due to its low utilization, oil-fired generation currently accounts for about one per cent of total generation and is expected to maintain a very small share over the projection period.

Canada’s energy future46
Exports, Imports and Interprovincial Transfers
• Canada is a net exporter of electricity. Exports originate mostly from hydro-based provinces and generally account for less than ten per cent of total generation. The levels of annual exports are largely influenced by hydro conditions as well as local supply and demand balances. In the 2005 to 2010 period, annual exports fluctuated in the range of 43 TW.h to 56 TW.h. Canada’s electricity imports have fluctuated in the range of 17 TW.h to 24 TW.h. Most imports occur during off-peak periods when prices in neighboring markets are low.
• In the Reference Case, net electricity available for export has the potential to increase significantly. This is largely due to the projected growing surplus of clean and competitively-priced power from hydro-based provinces. By 2035, net electricity available for export is projected to reach 44 TW.h annually compared to 25 TW.h in 2010 (Figure 7.5).
• Inter-provincial electricity transfers are projected to increase from 54 TW.h in 2010 to 70 TW.h in 2035. A portion of this increase comes from the Lower Churchill hydro development in Labrador, assumed to begin operating in 2019. The power not used by Newfoundland and Labrador moves through other Atlantic provinces, where Nova Scotia uses a portion and the rest is exported.
Key Uncertainties to the Outlook
• Electricity supply projections are demand-driven. Therefore, factors that will have an impact on the demand side will impact the supply side. Technological developments, new policies, and changing prospects of fuel supply and fuel prices may influence the choice of generation options and the generation mix in the future. In some cases, social and local acceptability of electricity infrastructure projects is an important factor as well.
• The relative economics of new power plant projects depend on fuel and overall capital costs. These vary by the type of technology under consideration. In general, the fuel cost of renewables is considered as nil, and fossil-fuel generation typically has a higher fuel cost component than nuclear generation. Uncertainty in the costs of the fuels used in power
2010 2020 2035
0
10000
20000
30000
40000
50000
60000
70000
80000
GW.h
Interprovincial Transfers Net Available for Export
F I G U r E 7 . 5
Net Electricity Available for Export and Interprovincial Transfers, Reference Case

natiOnal energy BOard 47
generation has an impact on the type of technologies and projects that are pursued and therefore on the future supply mix.
• Currently, non-hydro renewables, such as wind and solar power, have higher costs than conventional sources of generation. Their deployment is supported in some markets by financial incentives such as feed-in-tariffs. There are also reliability concerns for how much variable renewable-based generation may be integrated into a power system. Reduction or elimination of incentives without a corresponding cost reduction due to technological improvement, or grid integration issues, may constrain growth of these generation sources.
• Government regulation and policies impacting investments and operations of power plants continue to evolve. These may impact the outlook.
Canada’s energy future48
C h a p t e r O n e
coaL outLooK
• Coal is the major source of power generation worldwide, accounting for over 40 per cent currently. In projections by the International Energy Agency (IEA) and Energy Information Administration, this share ranges between about 32 per cent and 43 per cent by 2035. The higher end of the range assumes that relevant policies remain similar to today. The lower end reflects expectations for new policies that would limit emissions from industries including power generation. Concerns about the eventual impact of burning coal on air quality and the ability to meet GHG emissions targets create uncertainty about the outlook for coal consumption. In contrast to these concerns, there is a renewed interest in cost-efficient economic development, as coal remains one of the lowest-cost primary energy sources.
• One reason for the relative low cost of coal is its abundance and wide distribution globally. According to the IEA, the world’s total proven recoverable coal reserves are 935 billion tonnes spread across 70 countries. This would take about 150 years to deplete at current production rates. Canada holds about 6.6 billion tonnes of proven recoverable coal reserves, or 100 years of production at the current production rate.49
• Power generation accounts for two-thirds of coal consumption worldwide (using mostly thermal coals), with the remainder used mainly by the steel industry (using metallurgical coals). The IEA’s ‘new policies’ scenario50 projects global coal demand to increase by about 0.6 per cent per year until 2035, with the shares between the power and industrial sectors remaining similar to today. Almost all of the growth in coal demand occurs in the developing economies, such as China and India. Coal demand in the OECD countries is expected to decline in absolute terms.
• In Canada, thermal demand accounts for about 88 per cent of coal consumption, mostly for electric power generation (Figure 8.1). Within Canada, the decline in thermal coal demand is much greater than the increasing demand in the steel and other industrial sectors over the outlook period. About 80 per cent of coal exports are the higher-grade metallurgical coals. For the most part, these are shipped from west coast ports to Japan and Southeast Asia. Smaller amounts are sent to the U.S., Central America and Europe. Both types of coal are imported to Ontario and Atlantic Canada.
• A key feature of the declining domestic coal demand and imports is the phase-out of coal generation in Ontario by 2015. Primarily due to this initiative, imports of coal into Canada decrease from 20.5 megatonnes (Mt) in 2008 to 7.2 Mt in 2015, and decline moderately thereafter. Some declines in coal demand occur in other provinces, reflecting
49 Natural Resources Canada, Canadian Minerals Yearbook (CMY) – 2009. Available at: http://www.nrcan.gc.ca/mms-smm/busi-indu/cmy-amc/2009revu/coa-cha-eng.htm
50 International Energy Agency, World Energy Outlook 2010, November 2010. Available at: http://www.iea.org/weo/index.asp
C h a p t e r e i g h t

natiOnal energy BOard 49
plant retirements and efficiency improvements from retrofits and new units. Coal demand in Alberta and Saskatchewan peaks in 2019 and 2023, respectively. Demand in the steel industry is expected to increase, but not reach the pre-2009 levels. Overall, Canadian demand for coal decreases from 58.4 Mt in 2008 to 37.2 Mt in 2035.
• The great majority of Canadian coal resources are located in Western Canada. Coal production in Western Canada increases at a high rate from 2012 to 2016, due to multiple mining projects that come on stream. Most of these projects plan to produce metallurgical coal for export, increasing the exports of metallurgical coal from 26.5 Mt in 2008 to 40.3 Mt in 2016. In the East, small amounts of coal have been produced in New Brunswick and Nova Scotia. However, with the closure of the Minto mine in New Brunswick, reported coal production in the Maritimes is now zero. This region is not expected to produce much coal until 2014, when a new metallurgical coal mine (for export) opens in Nova Scotia. In contrast to the declining domestic demand and imports, total Canadian coal production increases from 67.8 Mt in 2008 to 94.7 Mt in 2035. In this period, net coal available for export increases at an average annual growth rate of 6.7 per cent in the Reference Case.
• Relative to the Reference Case, there is slightly more and less demand for coal in the High and Low Cases, respectively. This is because more natural gas (and less coal) is used for power generation when gas prices are low. In 2035, coal production is 94.8 Mt in the High Case and 94.5 Mt in the Low Case. The Fast and Slow Economic Growth Cases vary more from the Reference Case due to changes in the steel industry’s demand. Total production is 95.8 Mt in the Fast Case, and 93.9 Mt in the Slow Case.
2008 2020 2035
0
10
20
30
40
50
60
70
80
Megatonnes
ThermalMetallurigical and End-Use DemandNet Available for Export
F I G U r E 8 . 1
Canadian Coal Production and Disposition, Reference Case

Canada’s energy future50
Key Uncertainties to the Outlook
• The assumption regarding coal plant retirements is a key uncertainty in the coal demand projection. Based on anticipated regulatory action,51 industry is pursuing alternatives to coal in power generation. The electricity capacity projections reflect this, as retiring coal plants are replaced with cleaner options, including natural gas and plants with CCS.
• The increase in coal exports is expected to offset the decline in domestic demand; however, the potential exists for these export markets to switch to other sources of energy and rely less on coal supply from exporting countries such as Canada.
51 The proposed Reduction of Carbon Dioxide Emissions from Coal-Fired Generation of Electricity Regulations for public consultation were released August 2011. Available at: http://www.ec.gc.ca/Content/2/E/5/2E5D45F6-E0A4-45C4-A49D-A3514E740296/E_Consultation.pdf

C h a p t e r O n e
natiOnal energy BOard 51
concLusions• Canada’s Energy Future: Energy Supply and Demand Projections to 2035 provides a projection
of Canadian energy supply and demand to the year 2035. The projections employ currently available information, trends, policies and technologies to form a view of the Canadian energy system over the next 25 years. Over the projection period, new information will become available, trends, policies and technology will evolve, and certain assumptions made in the report may no longer apply. Readers of this report should consider the projections a baseline for discussing Canada’s energy future, not a prediction of what will take place.
• The results of the Reference Case imply three broad conclusions:
• Energy supply grows to record levels
New and innovative ways of producing energy causes Canadian energy supply to reach its highest levels ever. Oil production doubles by 2035, with oil sands providing the majority of new production. Natural gas production reverses its historical declining trend by 2016 with tight and shale gas extraction driving production above record levels by the end of the projection period. Electricity production grows gradually as renewables, such as wind, hydro and biomass, make up a greater portion of the generating mix.
• Energy demand growth slows from its historical pace
Slower population and economic growth, higher energy prices, and enhanced efficiency and conservation programs all contribute to slowing demand in the residential, commercial and transportation sectors. In the industrial sector, strong oil and gas production, as well as robust economic growth in a number of energy-intensive industries, result in faster demand growth than the historical pace.
• Supply and demand will impact trade and infrastructure
Record supply levels and slowing demand results in sizeable surplus energy available for export. Net oil and electricity available for export increase considerably, while net natural gas available for export declines gradually before leveling off by 2020.
• In addition to the Reference Case, the Report employs four sensitivity cases: High, Low, Fast and Slow. These sensitivity cases attempt to provide a broader perspective and reflect the uncertainty around energy prices and economic growth. The High and Low Cases highlight Canada’s role as both a large producer and consumer of energy. The Fast and Slow Cases suggest that the economy and energy demand remain closely linked.
Finally, the projections suggest Canadians can expect energy markets to continue to function well. Supplies of oil, natural gas and electricity remain in excess of Canadian requirements for the foreseeable future.
C h a p t e r n i n e

Canada’s energy future52
g l O s s a r y
Alternative or Emerging Technologies
New and emerging environmentally-friendly technologies used as an alternative to existing resource-intensive methods to produce energy. Alternative technologies make limited use of resources, and include fuel cells and clean coal technologies, for example.
Barrel One barrel is equal to approximately 0.159 cubic metres or 158.99 litres or 35 imperial gallons.
Baseload (electricity) The minimum amount of electric power delivered or required over a given period.
Biomass Organic material, such as wood, crop waste, municipal solid waste, hog fuel and pulping liquor, processed for energy production.
Biodiesel It is a diesel fuel substitute that can be made from vegetable oil or recycled cooking oil.
Bitumen or crude bitumen A highly viscous mixture, mainly hydrocarbons heavier than pentanes. In its natural state, it is not usually recoverable at a commercial rate through a well because it is too thick to flow.
Butane A light hydrocarbon gas composed of four carbon atoms and 10 hydrogen atoms with a straight–chain or branch chain molecular structure, obtained from natural gas processing and petroleum refining. It could be easily stored in liquid for transportation. The main use of Butanes are in gasoline manufacturing, petrochemicals, and fuel applications (lighters, cooking and camping).
Capacity (Electricity) The maximum amount of power that a device can generate, use or transfer, usually expressed in megawatts.
Carbon capture and storage (CCS) or carbon capture and sequestration
A method of capturing (and storing) CO2, such that it is not released into the atmosphere, hence reducing GHG emissions. Carbon dioxide is compressed into a transportable form, moved by pipeline or tanker, and stored in some medium, such as a deep geological formation.

natiOnal energy BOard 53
CO2 flooding CO2 flooding is a process of enhanced oil recovery, in which CO2, in a liquid form, is injected into oil-bearing reservoirs in an effort to increase the amount of oil that can be extracted.
Coalbed methane (CBM) An unconventional form of natural gas that is trapped within the matrix of coal seams. Coalbed methane is distinct from typical sandstone or other conventional gas reservoir, as the methane is stored within the coal by a process called adsorption.
Cogeneration Production of electricity and another form of useful thermal energy, such as heat or steam, from the same energy source. Either the by-product heat from industrial processes can be used to power an electrical generator or surplus heat from an electric generator can be used for industrial purposes.
Condensate A low-density mixture comprised mainly of pentanes and heavier hydrocarbons recovered as a liquid from field separators, scrubbers or other oil and gas gathering facilities or at the inlet of a natural gas processing plant before the gas is processed.
Conventional crude oil Crude oil, which at a particular point in time, can be technically and economically produced through a well using normal production practices and without altering the natural viscous state of the oil.
Conventional natural gas Natural gas that is found in the reservoir and produced through a wellbore with known technology and where the drive for production is provided by expansion of the gas or by pressure from an underlying aquifer.
Compressed natural gas (CNG)
Natural gas that has been compressed to between 2,500 and 4,000 psi such that it can be transported in pressurized containers. Compression reduces the volume by a factor of 300 (or more) compared with gas at normal temperature and pressure.
Crude Oil A mixture of hydrocarbons of different molecular weights that exists in the liquid phase in underground reservoirs and remains liquid at atmospheric pressure and temperature. Crude oil may contain small amounts of sulphur and other non-hydrocarbons, but does not include liquids obtained from the processing of natural gas.
Cyclic steam stimulation (CSS)
A repeatable, thermal in situ recovery technique involving steam injection followed by oil production from wells injected with steam. Steam injection increases oil mobility and allows heated bitumen to flow into a well.

Canada’s energy future54
Deep-cut facilities A gas plant next to or within gas field plants or gas pipelines that can extract ethane and other natural gas liquids using turbo-expander or absorption technologies.
Demand-side management Actions undertaken by a utility that result in a change and/or sustained reduction in demand for energy. This can reduce or delay new capital investment in power plants, pipelines or other infrastructure and improve overall system efficiency.
Diluent Any lighter hydrocarbon, usually pentanes plus, added to heavy crude oil or bitumen in order to facilitate its transport in crude oil pipelines.
End-use demand Energy used by consumers in the residential, commercial, industrial and transportation sectors. This is also referred to as secondary energy demand.
Energy efficiency Technologies and measures that reduce the amount of energy and/or fuel required for the same work.
Energy intensity The amount of energy used per unit of activity. Two common forms of energy intensity are energy use per capita and energy use per unit of GDP.
Enhanced oil recovery (EOR)
The extraction of additional crude oil from reservoirs through a production process other than natural depletion. Includes both secondary and tertiary recovery processes such as pressure maintenance, cycling, water flooding, thermal methods, chemical flooding, and the use of miscible and immiscible displacement fluids.
Ethane The simplest straight-chain hydrocarbon structure with two carbon atoms. It is mainly produced from natural gas processing or as a by-product of petroleum refining. Its main use is as petrochemical feedstock for ethylene manufacturing.
Feedstock Natural gas or other hydrocarbons used as an essential component of a process for the production of a product.
Fossil fuel Hydrocarbon-based fuel sources such as coal, natural gas, natural gas liquids and crude oil.
Frontier areas Generally, the northern and offshore areas of Canada.
Fuel economy The average amount of fuel consumed by a vehicle to travel a certain distance, measured in litres per 100 kilometres.
Gas hydrates Ice-like substances composed of water and natural gas that form when gases combine with water at low temperature and high pressure. They are typically found under large portions of the world's Arctic areas and deep under the oceans.

natiOnal energy BOard 55
Gas well A well bore with one or more geological horizons capable of producing natural gas.
Generation (electricity) The process of producing electric energy by transforming other forms of energy. Also, the amount of energy produced.
Geothermal energy The use of geothermal heat to generate electricity. Also used to describe ground-source heating and cooling (also known as geoexchange or ground-source heat pump).
Greenhouse gases (GHG) Gases such as carbon dioxide, methane and nitrogen oxide, which actively contribute to the atmospheric greenhouse effect. Greenhouse gases also include gases generated through industrial processes such as hydroflurocarbons, perflurocarbons and sulphur hexafluoride.
Gross Domestic Product (GDP)
GDP is a measure of economic activity within a country. It is the market value of all goods and services in a year within Canada’s borders.
Heating oil Also known as No. 2 fuel oil. A distillate fuel oil commonly used for household space heating.
Heavy crude oil Generally, a crude oil that has a density greater than 900 kg/m3.
Henry Hub (price) Henry Hub is the pricing point for natural gas futures traded on the New York Mercantile Exchange. The hub is a point on the natural gas pipeline owned by Sabine Pipe Line and located in Louisiana.
Heritage assets Existing generation (and/or transmission) equipment and facilities that were built well in the past and are largely paid for.
Hydroelectric generation A form of renewable energy wherein electricity is produced from hydropower.
In situ recovery The recovery of bitumen through the use of wellbores, generally in areas where depth of burial precludes surface-mining operations.
Integrated mining/upgrading plant
A combined mining and upgrading operation where oil sands are mined from open pits. The bitumen is then separated from the sand and upgraded by a refining process.
Light crude oil Generally, crude oil having a density less than 900 kg/m3. Also a collective term used to refer to conventional light crude oil, upgraded heavy crude oil and pentanes plus.

Canada’s energy future56
Liquefied natural gas (LNG)
Liquefied natural gas is natural gas in its liquid form. Natural gas is liquefied by cooling to minus 162 degrees Celsius (minus 260 degrees Fahrenheit), and the process reduces the volume of gas by more than 600 times, allowing for efficient transport via LNG tanker.
Marketable natural gas The volume of gas that can be sold to the market after allowing for removal of impurities and after accounting for any volumes used to fuel surface facilities. As used in this report for undiscovered volumes, it is determined by applying the average surface loss from existing pools in that formation to the recoverable volumes of undiscovered pools of the same formation.
Metallurgical coal Anthracite or high-grade bituminous coal primarily used in the steelmaking industry.
Mine mouth generation A method of integrated mining and power generation, wherein a power generation facility is located near its source coal mine.
Multi-stage hydraulic fracturing
A technique in which fluids are injected underground, in multiple stages, to create or expand existing fractures in the rock, allowing oil or gas to flow out of the formation, or to flow at a faster rate.
Natural gas liquids (NGL) Those hydrocarbon components recovered from natural gas as liquids. These liquids include, but are not limited to, ethane, propane, butanes and pentanes plus.
Net available for export Total production of a commodity less domestic demand for that commodity. The remainder equals the net (gross exports less gross imports) of the commodity available for export.
Oil sands Sand and other rock material that contains bitumen. Each particle of oil sand is coated with a layer of water and a thin film of bitumen.
Oil sands off-gas A mixture of hydrogen and light hydrocarbon gases produced when bitumen is upgraded to produce synthetic crude oil.
Peak demand The maximum load consumed or produced in a stated period of time
Pentanes Plus A low density mixture mainly of pentanes and heavier hydrocarbons obtained from the processing of raw gas, condensate or crude oil. Includes isopentane, natural gasoline, and plant condensate.

natiOnal energy BOard 57
Petroleum product A wide range of products derived from crude oil through the refining process such as gasoline, diesel, heating oil, and jet fuel, among others.
Primary energy demand The total requirement for all uses of energy, including energy used by the final consumer, intermediate uses of energy in transforming one energy form to another, and energy used by suppliers in providing energy to the market.
Propane A light hydrocarbon gas composed of three carbon atoms and six hydrogen atoms which can be easily stored in a liquid form, and is obtained from natural gas processing and petroleum refining. Propane main uses are as fuel in heating applications, cooking and camping, aerosol propellants and petrochemicals.
Real price Price levels that are held constant at a base year, eliminating the effect of inflation.
Reliability The degree of performance of any element of an electricity system, which results in electricity being delivered to customers within acceptable standards and in the amount desired. Reliability can be measured by frequency, duration or magnitude of adverse effects on electricity supply.
Reserve margin Reserve margin, or reserve capacity, is a measure of available capacity over and above the capacity needed to meet peak demand.
Reserves Reserves are estimated remaining marketable quantities of oil and natural gas and related substances anticipated to be recoverable from known accumulations, as of a given date, based on: analysis of drilling, geological, geophysical, and engineering data; the use of established technology; and specified economic conditions, which are generally accepted as being reasonable, and shall be disclosed.
Reserves - Proven Proved reserves are those reserves that can be estimated with a high degree of certainty to be recoverable. It is likely that the actual remaining quantities recovered will exceed the estimated proved reserves.
Resources (Oil and Natural Gas)
As used in this report, resources refers to the remaining total volume of recoverable oil and natural gas that is thought to exist. Resources include deposits not economic to extract at current oil and gas prices, but may become economic as prices rise. Resources also include an undiscovered component, which may have been bypassed in current wells or have yet to be found. Resources can also include an additional amount of oil and gas that may be recovered as technology improves beyond current capabilities.

Canada’s energy future58
Resources – Ultimate Potential
An estimate of all the resources that may become recoverable or marketable, having regard for the geological prospects and anticipated technology.
Secondary energy demand See End-use demand.
Shale gas A form of unconventional gas that is trapped within shale, a sedimentary rock originally deposited as clay or silt and characterised by extremely low permeability. The majority of the gas exists as free gas or adsorbed gas though some gas can also be found in a dissolved state within the organic material.
Solar energy Includes active and passive solar heat collection systems and photovoltaics.
Solution gas Natural gas produced along with oil from oil wells.
Steam assisted gravity drainage (SAGD)
SAGD is a steam stimulation technique using pairs of horizontal wells in which the bitumen drains, by gravity, into the producing wellbore, after it has been heated by the steam. In contrast to cyclic steam stimulation, steam injection and oil production are continuous and simultaneous.
Straddle plant A reprocessing plant located on a gas pipeline. It extracts natural gas liquids from previously processed gas.
Supply cost All costs associated with resource exploitation as an average cost per unit of production over the project life. It includes capital costs associated with exploration, development, production, operating costs, taxes, royalties and producer rate of return.
Synthetic crude oil Synthetic crude oil is a mixture of hydrocarbons generally similar to light sweet crude oil, derived by upgrading crude bitumen or heavy crude oil.
Tailings ponds A man-made earthen structure designed to store the waste-water slurry, or tailings, from mining and extraction processes, and allow the settling of solids from the water. Oil sands mining and hot-water extraction processes produce tailings that are a mixture of water, clay, sand and residual bitumen.
Thermal coal Lignite, sub-bituminous or lower-grade bituminous coal primarily used for power generation or heating purposes.
Tight gas A form of unconventional natural gas that is held in the pore space of a rock that has a lower permeability or ability to flow than usual for that type of rock.

natiOnal energy BOard 59
Tight oil Oil produced from organic-rich shales or from low permeability sandstone, siltstone, limestone or dolostone reservoirs. Tight oil reservoirs typically require the combination of horizontal drilling and multi-stage hydraulic fracturing to establish sufficient fluid flow to achieve economic rates of recovery.
Unconventional crude oil Crude oil that is not classified as conventional crude oil (e.g., bitumen).
Unconventional natural gas Natural gas that is contained in a non-traditional reservoir rock that requires significant additional stimulus to allow gas flow. It may be that the gas is held by the matrix material such as coal, ice, or shale; or where the reservoir has an unusually low amount of porosity and permeability. In this report unconventional gas is divided into coalbed methane, shale gas and gas hydrates.
Upgrading (bitumen) The process of converting bitumen or heavy crude oil into a higher quality crude oil either by the removal of carbon (coking) or the addition of hydrogen (hydroprocessing).
Wave / Tidal power Also known as tidal energy, tidal or wave power makes use of the rise and fall in sea levels, or tidal flow, to create hydropower.
West Texas Intermediate (WTI)
WTI is a light sweet crude oil, produced in the United States, which is the benchmark grade of crude oil for North American price quotations.

Canada’s energy future60
C O n v e r s i O n t a B l e s
Imperial and Metric Conversions
Unit Equivalentm metre 3.28 feetm3 cubic metres 6.3 barrels (oil); 35.3 cubic feet (gas)t metric tonne 2200 pounds
Energy Content Equivalents
Energy Measure Energy ContentGJ gigajoule 0.95 million btuPJ petajoule 1 000 000 GJ
Electricity
W Watt 1 joule per second MW megawatt One million wattsGW.h gigawatt hour 3 600 GJ or 1 000 MW.hTW.h terawatt hour 3.6 PJ or 1 000 GW.h
Natural Gas
Mcf thousand cubic feet 1.05 GJBcf billion cubic feet 1.05 PJTcf trillion cubic feet 1.05 EJ
Natural Gas Liquids
m3 ethane 18.36 GJm3 propane 25.53 GJm3 butane 28.62 GJ
Crude Oil
m3 Light 38.51 GJm3 Heavy 40.90 GJm3 Pentanes plus 35.17 GJ

natiOnal energy BOard 61
Coal
t Anthracite 27.70 GJt Bituminous 27.6 GJt Subbituminous 18.80 GJt Lignite 14.40 GJ
Petroleum Products
m3 Aviation Gasoline 33.52 GJm3 Motor Gasoline 34.66 GJm3 Petrochemical Feedstock 35.17 GJm3 Naphtha Specialties 35.17 GJm3 Aviation Turbo Fuel 35.93 GJ m3 Kerosene 37.68 GJ m3 Diesel 38.68 GJm3 Light Fuel Oil 38.68 GJ m3 Lubricants 39.16 GJm3 Heavy Fuel Oil 41.73 GJ m3 Still Gas 41.73 GJm3 Asphalt 44.46 GJ m3 Petroleum Coke 42.38 GJm3 Other Products 39.82 GJ

Canada’s energy future62
g u i d e t O a p p e n d i C e s
Appendices are available on the Boards’ Website at www.neb-one.gc.ca, and include the following detailed data.
Appendix 1 Key Drivers
Table A1.1 Economic Indicators, Canada
Tables A1.2 to A1.12 Economic Indicators, Provinces and Territories
Appendix 2 Energy Demand
Table A2.1 Demand, Reference Case, Canada
Tables A2.2 to A2.14 Demand, Reference Case, Provinces and Territories
Table A2.15 Demand, Low Case, Canada
Tables A2.16 to A2.28 Demand, Low Case, Provinces and Territories
Table A2.29 Demand, High Case, Canada
Tables A2.30 to A2.42 Demand, High Case, Provinces and Territories
Table A2.43 Demand, Fast Case, Canada
Tables A2.44 to A2.56 Demand, Fast Case, Provinces and Territories
Table A2.57 Demand, Slow Case, Canada
Tables A2.58 to A2.70 Demand, Slow Case, Provinces and Territories
Appendix 3 Oil and Natural Gas Liquids
Table A3.1 Crude Oil and Bitumen Ultimate Potential Resources
Table A3.2 Crude Oil and Bitumen Reserves
Table A3.3 Refinery Feedstock Requirements and Sources, Canada
Tables A3.4 to A3.8 Refinery Feedstock Requirements and Sources, Provinces
Table A3.9 Supply and Disposition of Light Domestic Crude Oil and Equivalent, Canada
Table A3.10 Supply and Disposition of Heavy Domestic Crude Oil and Equivalent, Canada
Table A3.11 to A3.14 NGL Supply, Demand and Potential Exports, Reference Case
Table A3.15 to A3.18 NGL Supply, Demand and Potential Exports, Low Case
Table A3.19 to A3.22 NGL Supply, Demand and Potential Exports, High Case

natiOnal energy BOard 63
Table A3.23 to A3.26 NGL Supply, Demand and Potential Exports, Fast Case
Table A3.27 to A3.30 NGL Supply, Demand and Potential Exports, Slow Case
Table A3.31 Oil, Reference Case, Production by Province
Table A3.32 Oil, Low Case, Production by Province
Table A3.33 Oil, High Case, Production by Province
Table A3.34 Oil, Fast Case, Production by Province
Table A3.35 Oil, Slow Case, Production by Province
Appendix 4 Natural Gas
Table A4.1 Natural Gas Resources
Table A4.2 Natural Gas, Reference Case, Production
Table A4.3 Natural Gas, Low Case, Production
Table A4.4 Natural Gas, High Case, Production
Table A4.5 Natural Gas, Fast Case, Production
Table A4.6 Natural Gas, Slow Case, Production
Table A4.7 Natural Gas, Reference Case, Outlook for Gas Wells Drilled in Western Canada
Table A4.8 Natural Gas, Low Case, Outlook for Gas Wells Drilled in Western Canada
Table A4.9 Natural Gas, High Case, Outlook for Gas Wells Drilled in Western Canada
Table A4.10 Natural Gas, Fast Case, Outlook for Gas Wells Drilled in Western Canada
Table A4.11 Natural Gas, Slow Case, Outlook for Gas Wells Drilled in Western Canada
Appendix 5 Electricity
Table A5.1 Capacity by Plant Type, Reference Case
Table A5.2 Capacity by Primary Fuel, Reference Case
Table A5.3 Generation by Plant Type, Reference Case
Table A5.4 Generation by Primary Fuel, Reference Case
Table A5.5 Interchange, Reference Case
Table A5.6 Capacity by Plant Type, Low Case
Table A5.7 Capacity by Primary Fuel, Low Case
Table A5.8 Generation by Plant Type, Low Case
Table A5.9 Generation by Primary Fuel, Low Case
Table A5.10 Interchange, Low Case

Canada’s energy future64
Table A5.11 Capacity by Plant Type, High Case
Table A5.12 Capacity by Primary Fuel, High Case
Table A5.13 Generation by Plant Type, High Case
Table A5.14 Generation by Primary Fuel, High Case
Table A5.15 Interchange, High Case
Table A5.16 Capacity by Plant Type, Fast Case
Table A5.17 Capacity by Primary Fuel, Fast Case
Table A5.18 Generation by Plant Type, Fast Case
Table A5.19 Generation by Primary Fuel, Fast Case
Table A5.20 Interchange, Fast Case
Table A5.21 Capacity by Plant Type, Slow Case
Table A5.22 Capacity by Primary Fuel, Slow Case
Table A5.23 Generation by Plant Type, Slow Case
Table A5.24 Generation by Primary Fuel, Slow Case
Table A5.25 Interchange, Slow Case
Appendix 6 Coal
Table A6.1 Coal Supply and Demand, Canada, Reference Case
Table A6.2 Coal Supply and Demand, Canada, Low Case
Table A6.3 Coal Supply and Demand, Canada, High Case
Table A6.4 Coal Supply and Demand, Canada, Fast Case
Table A6.5 Coal Supply and Demand, Canada, Slow Case