Embed Size (px)
Citation preview

Can You Explain That, Better? ComprehensibleText Analytics for SE Applications
Amritanshu AgrawalComputer Science DepartmentNC State, Raleigh, NC, USAEmail: [email protected]
Huy TuComputer Science DepartmentNC State, Raleigh, NC, USA
Email: [email protected]
Tim MenziesComputer Science DepartmentNC State, Raleigh, NC, USA
Email: [email protected]
Abstract—Text mining methods are used for a wide range ofSoftware Engineering (SE) tasks. The biggest challenge of textmining is high dimensional data, i.e., a corpus of documents cancontain 104 to 106 unique words. To address this complexity,some very convoluted text mining methods have been applied.Is that complexity necessary? Are there simpler ways to quicklygenerate models that perform as well as the more convolutedmethods and also be human-readable?
To answer these questions, we explore a combination ofLDA (Latent Dirichlet Allocation) and FFTs (Fast and FrugalTrees) to classify NASA software bug reports from six differentprojects. Designed using principles from psychological science,FFTs return very small models that are human-comprehensible.When compared to the commonly used text mining methodand a recent state-of-the-art-system (search-based SE methodthat automatically tune the control parameters of LDA), theseFFT models are very small (a binary tree of depth d = 4 thatreferences only 4 topics) and hence easy to understand. They werealso faster to generate and produced similar or better severitypredictions.
Hence we can conclude that, at least for datasets exploredhere, convoluted text mining models can be deprecated in favorof simpler method such as LDA+FFTs. At the very least,we recommend LDA+FFTs (a) when humans need to read,understand, and audit a model or (b) as an initial baseline methodfor the SE researchers exploring text artifacts from softwareprojects.
Index Terms—LDA, NASA, SVM, Search-Based Software En-gineering, Differential Evolution, LDADE
I. INTRODUCTION
Software analytics have been focusing on working withadept and state-of-the-art data miners in order to find theoptimal results. One sub-topic for software analytics is theuse of sophisticated text mining techniques [1]. Text miningis much more complex task as it involves dealing with highdimensional textual data that are inherently unstructured [1],[2]. These complex methods often generate models not com-prehensible to humans (e.g., using synthetic dimensions gen-erated by an SVM kernel [3]). This complexity might notbe necessary if simpler methods can be found to achieve thesame performance, while at the same time generating easy-to-understand models [4]. We define our terminologies “simple”and “comprehensible” in this paper as:
• simple - (1) has low dimensionality of features (in 10s andnot 100 to 1000s); (2) generate small set of theories and
(3) is not computationally expensive. Otherwise, we call it“complex”.
• comprehensible - (1) comprise of small rules and (2) rulesthat quickly lead to decisionsMoeyersoms et al. [5] comment that predictive models not
only need to be accurate but also comprehensible, demandingthat the user can understand the motivation behind the model’sprediction. They further remark that, to obtain such predictiveperformance, comprehensibility is often sacrificed and vice-versa. Do simpler methods perform worse? Martens et al. [6]referred comprehensibility as to how well humans grasp theclassifier induced or how strong the mental fit of the classifieris. Dejaeger et al. [7] said comprehensible models are oftenneeded in order to inspire confidence in a business setting andimprove model acceptance. Business users are vocal in theircomplaints about analytics [8], stating that there are rarelyproducible models that business users can comprehend.
Researchers in SE use complex methods, such as SupportVector Machine (SVM) with 1,000 to 10,000s of Term Fre-quency (TF) or Term Frequency - Inverse Document Fre-quency (TFIDF) features in order to achieve high perfor-mance of prediction. Yet, they do not try to comprehend themodel itself [9]–[14] making business users more hesitantto adopt their methodologies and losing the value of theirwork. Though, Latent Dirichlet Allocation (LDA) uses lessnumber of features but does require 100s of features forfinding an optimal model and be human-comprehensible [15],[16]. An alternative, better, search-based SE method (LDADE)was proposed recently which tries to find optimal parametersof LDA that can make the model more stable and achieveoptimal results [17]. The problem with this model is thatit is quite expensive in terms of CPU usage and still need100s of features for it to be comprehensible. We need asimple method which: 1) offers comparable performance; and2) human comprehensible.
This paper study’s a simple data miner taken from thepsychological science literature, i.e., FFT which outputs smalltrees, (and generally, smaller is better comprehensible [18],[19]). In this study, FFT uses LDA features (K = 10) withits default parameters, which does not require any expensiveoptimization to find the optimal K, and build its trees. We seekfew rules through FFT that can report severe and non-severefor the datasets under study. We compared this method against
arX
iv:1
804.
1065
7v1
[cs
.SE
] 2
7 A
pr 2
018

complex and most commonly used methods in SE literature,which are 1) TFIDF+SVM [9], [11], [20], [21]; and 2) arecent state-of-the-art system, LDADE+SVM [17]. Based onthis comparative analysis, we answer two research questions:
RQ1: How does simpler method perform against mostcommon sophisticated and recent state-of-the-art SearchBased SE (SBSE) methods?
For software analytics, most text mining techniques use highdimensional TF or TFIDF features with complex classifierslike SVM [9]–[14], [20]–[24]. These features are large innumber, in the range of 1,000 to 10,000s making any classifier,complex. Researchers shifted their focus on using LDA fea-tures in text mining since it is a good way for dimensionalityreduction [15], [25], [26]. SBSE is recently introduced to findthe optimal parameters at the expense of heavy runtime [17],[27], [28]. Agrawal et al. [17] tuned the parameters of LDA tofind the optimal number of topics (K) which is further used bySVM for classification task (state-of-the-art SBSE method).
We show that, FFT (with a depth, d = 4) uses just 10topics from LDA (simpler method) to achieve comparableperformance as SVM with TFIDF features (sophisticatedmethod) as well as LDADE with SVM (SBSE method). Theruntime for building the simpler method is about 10 minutesslower than the sophisticated method’s runtime but this maynot be an arduous increase given the gains from its power ofcomprehensibility, whereas simpler method is 100 times fasterthan SBSE method. Hence, we conclude that,
Result 1Simpler method (LDA+FFT) offers similar performanceas the sophisticated method (TFIDF+SVM) and the SBSEmethod (LDADE+SVM). Though simpler LDA+FFT methodtakes an extra 10 minutes than the baseline, but it is ordersof magnitude faster than the SBSE method.
RQ2: Is simpler method more explainable or compre-hensible relative to the most common sophisticated andrecent state-of-the-art SBSE methods?
We answered the question that simpler method can showcomparable performance against sophisticated, and SBSEmethods. Now, we dive into the core of our study whichis about comprehensibility. Why do we need comprehensiblemodels? We need it to have some actionable insights fromthe model which will boost the confidence for businesses toaccept the model for their software.
Representative characteristics help a model to be moreexplainable, i.e., small, visualized easily, and comprised offewer rules that can quickly lead to decisions. The rangeof features between 1,000 to 10,000s, makes any classifierbig and non-comprehensible by default. LDA features offermore comprehensibility aspect to the model than TFIDF orTF features [15], [26].
We show that FFT with K = 10 LDA features, referencingonly 4 topics (depth, d = 4) provide explainable modelsatisfying the characteristics mentioned earlier. Also, we do
not need a SBSE method which is orders of magnitude timesslower to find optimal K, when a simpler method can providea well comprehensible model. Hence, we conclude that
Result 2FFT generates fewer rules referencing only 4 topics foundby LDA are far more comprehensible than the most commonsophisticated and SBSE methods.
In summary, the main contributions of this paper are:• A novel inter-disciplinary contribution of the application of
psychological science in comprehensibility of text miningmodels.
• LDA+FFTs offer comparable performance against a com-mon text mining method, TFIDF+SVM.
• LDA+FFTs are better, faster, and more comprehensibleagainst the recent state-of-the-art method, LDADE+SVM.
• A new, very simple baseline data mining method(LDA+FFTs) against which more complex methods can becompared.
• A reproduction package containing all the data and algo-rithms of this paper, see https://github.com/ai-se/LDA FFT.The rest of this paper is structured as follows: Section II
talks about the background and theory of comprehensibility.Section III describes the experimental setup of this paper andabove research questions are answered in Section IV. Lastly,we discuss the validity of our results and a section describingour conclusions.
II. MOTIVATION AND RELATED WORK
This sections talks about theory of comprehensibility, themost commonly used text mining method for bug reportsclassification, curse of dimensionality, and power of computa-tionally faster methods. We also show how FFTs are generatedwhich is a great alternative to the existing approaches.
A. Theory of Comprehensibility
For software analytics, it is a necessity to find such modelsthat can produce simple and actionable insights for the soft-ware practitioners to interpret and act upon [29]. Models areeffectively useless if they cannot be interpreted by researchers,developers, and testers [4]. Business users have been vocalin their complaints about analytics [8], saying that there arerarely producible models that they can comprehend. Accordingto several researchers [30]–[32], actionable insights from soft-ware artifacts are the core deliverable of software analytics.These insights are then used by the users to enhance theirproductivity, which is measured in terms of the task that areaccomplished. However, is model comprehensibility taken intoconsideration in the process of development?
Machine learners generate theories and people read theories.But how many of such learners generate the kind of theoriesthat machine learning practitioners can read? In practice, withavailability of big data and tremendous amount of information,yet limited time and resources to explore, such as manager
2

rushing with deadlines to release a software or stockbro-kers making instant decisions about buying or selling stocks.Rather, in such a critical situation, a person might insteadjust want to have the least expert-level comprehension of thatdomain to achieve the most benefits. It therefore follows thatmachine learning for these practical cases should not strivefor elaborated theories or expressive power of the language. Abetter goal for machine learning would be to find the smallestset of theories with the most impacts and benefits [33].
Also, in today’s businesses, the problem is not accessingdata but ignoring the irrelevant data. Most modern businessescan electronically access large amounts of data such as transac-tions for the past two years or the state of their assembly line.The trick is effectively using the available data. In practice,this means summarizing large datasets to find the “pearls inthe dust” - that is, the data that really matters [33].
That is why, Gleicher [34] developed their framework ofcomprehensibility [34] and concluded that many researchersdo not consider the power of comprehensibility and miss outon important aspects of their results. According to Gleicher:1) Comprehensibility makes us understand a prediction to
appropriately trust it, or a predictive process to trust in itsability to make predictions.
2) Comprehensibility helps in prescriptiveness, which is thequality of a model that allows its user to act on somethingwith a result, e.g., its ability to inform action.
3) Understanding of a model can drive iterative refinementthat is applied to improve predictive accuracy, efficiency,and robustness.
4) While a statistical model usually uncovers correlations,discovers causality, it can also be a useful starting pointfor theory building, or an approach towards testing theory.
5) Comprehensibility can characterize by easily interpretingwhat the model can do and where it can be applied.
6) It can generalize modeling to other situations which can bepart of other (future) applications.
7) It can identify the success (or failures) in one model,modeling application, or modeling process, that can helpus to improve our practices for future applications.Comprehensibility is defined as the ability of the various
stakeholders to understand relevant aspects of the modelingprocess. How can a model be comprehensible? According tovarious researchers [4], [34]–[36], a comprehensible modelcan be represented with a rule-based learning [37], [38],or size of the output, i.e., smaller models [39], or bettervisualization [34].
According to Phillips et al. [37], a model shown to becomprehensible enough for human, when a human can fit themodel into their Long Term Memory (LTM) [40] and whenthe rules within the model can efficiently lead to decisions.Imagine a model as shown in Figure 1 of SVM, a human wouldnot be able to reason from such a sophisticated output becauseof 2 reasons: 1) The model is mostly points of transformeddata on a new multi-dimensional feature space automaticallyinferred by some kernel function. Due to the arcane natureof these kernels, it is hard for humans to attribute meaning
Fig. 1. An example of SVM model from [43]
to these points [3], [41]; and 2) The model infers a decisionboundary or hyperplane (as shown in Figure 1) without anygeneralization [42]. A SVM defines its decision boundary interms of the vectors nearest that boundary. All these “supportvectors” are just points in space so understanding any one ofthem incurs the problems.
Further, SVMs offer much less support for understandingthe entire set of these points than, say, some rule-basedrepresentation (as shown in Figure 2 which is an examplecreated by our proposed method on the dataset under study).To understand this, consider a condition a > 4 that might befound in a rule-based representation, and within the hyperspaceof all data, this inequality defines a region within which centerconclusions are true, regardless of other attributes. That is, thiscondition a > 4 is a generalization across a large space ofexamples, a region that humans can understand as “withinthis space, certain properties exist”. The same is not truefor support vectors. Such vectors do not tell humans whichattributes are most important for selecting one conclusion overanother, nor can they divide a space of examples into multipleregions. Rule-based representations do not have that limitation.They can divide space into multiple sectors within whichhumans know how far they can adjust a few key attributesin order to move from one classification to another.
Consequently, psychological scientists have developed FFTas a rule-based model that is quickly comprehensible, compris-ing of few rules. A FFT tree is a binary tree classifier, whereeither one or both node has a terminating branch to a decisionnode. Basically, it will trigger an immediate understandingand action for each question being asked or topic informationfeature. As shown in Figure 2, the same complex model of
if topic 1 > 0.80 then falseelse if topic 7 > 0.60 then trueelse if topic 3 > 0.65 then trueelse if topic 5 ≤ 0.50 then trueelse false
Fig. 2. Example of a much simpler FFT model. How this FFT is generatedis explained in Section II-E. The premise of this paper is that such simplemodels can perform as well, or better than more complex models that useextra dimensions, like Figure 1. This is an example created by our proposedmethod on the dataset PitsA under study.
3
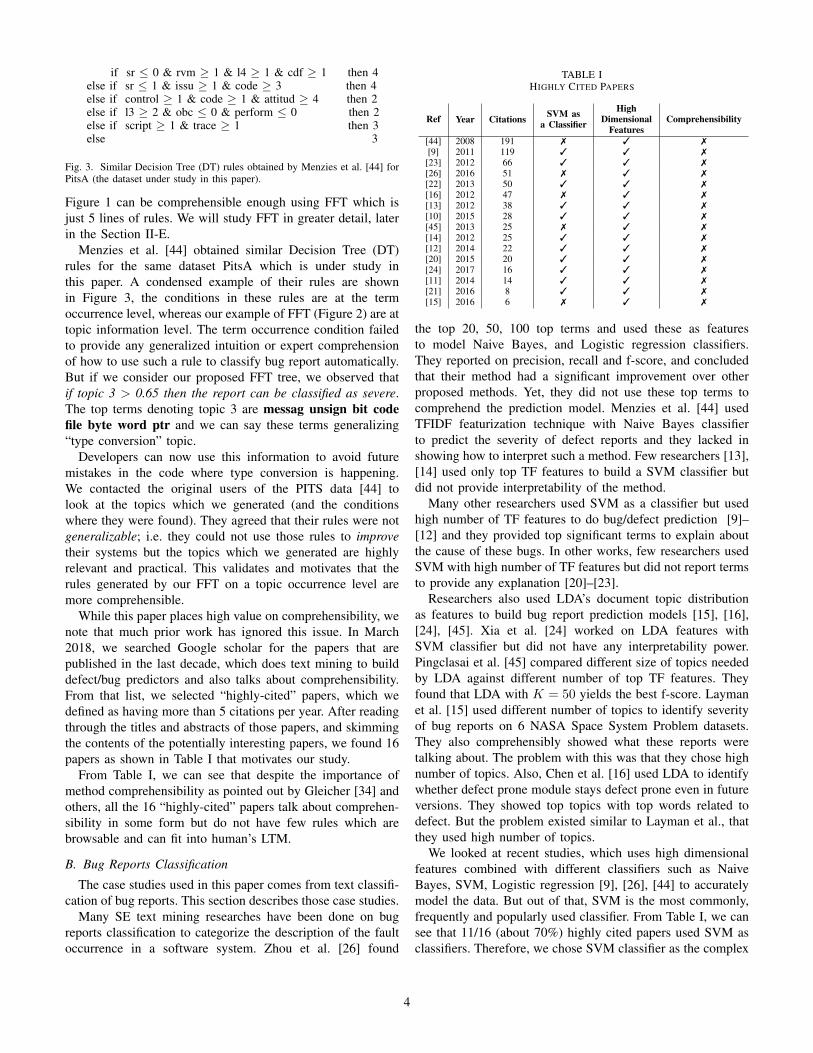
if sr ≤ 0 & rvm ≥ 1 & l4 ≥ 1 & cdf ≥ 1 then 4else if sr ≤ 1 & issu ≥ 1 & code ≥ 3 then 4else if control ≥ 1 & code ≥ 1 & attitud ≥ 4 then 2else if l3 ≥ 2 & obc ≤ 0 & perform ≤ 0 then 2else if script ≥ 1 & trace ≥ 1 then 3else 3
Fig. 3. Similar Decision Tree (DT) rules obtained by Menzies et al. [44] forPitsA (the dataset under study in this paper).
Figure 1 can be comprehensible enough using FFT which isjust 5 lines of rules. We will study FFT in greater detail, laterin the Section II-E.
Menzies et al. [44] obtained similar Decision Tree (DT)rules for the same dataset PitsA which is under study inthis paper. A condensed example of their rules are shownin Figure 3, the conditions in these rules are at the termoccurrence level, whereas our example of FFT (Figure 2) are attopic information level. The term occurrence condition failedto provide any generalized intuition or expert comprehensionof how to use such a rule to classify bug report automatically.But if we consider our proposed FFT tree, we observed thatif topic 3 > 0.65 then the report can be classified as severe.The top terms denoting topic 3 are messag unsign bit codefile byte word ptr and we can say these terms generalizing“type conversion” topic.
Developers can now use this information to avoid futuremistakes in the code where type conversion is happening.We contacted the original users of the PITS data [44] tolook at the topics which we generated (and the conditionswhere they were found). They agreed that their rules were notgeneralizable; i.e. they could not use those rules to improvetheir systems but the topics which we generated are highlyrelevant and practical. This validates and motivates that therules generated by our FFT on a topic occurrence level aremore comprehensible.
While this paper places high value on comprehensibility, wenote that much prior work has ignored this issue. In March2018, we searched Google scholar for the papers that arepublished in the last decade, which does text mining to builddefect/bug predictors and also talks about comprehensibility.From that list, we selected “highly-cited” papers, which wedefined as having more than 5 citations per year. After readingthrough the titles and abstracts of those papers, and skimmingthe contents of the potentially interesting papers, we found 16papers as shown in Table I that motivates our study.
From Table I, we can see that despite the importance ofmethod comprehensibility as pointed out by Gleicher [34] andothers, all the 16 “highly-cited” papers talk about comprehen-sibility in some form but do not have few rules which arebrowsable and can fit into human’s LTM.
B. Bug Reports Classification
The case studies used in this paper comes from text classifi-cation of bug reports. This section describes those case studies.
Many SE text mining researches have been done on bugreports classification to categorize the description of the faultoccurrence in a software system. Zhou et al. [26] found
TABLE IHIGHLY CITED PAPERS
Ref Year Citations SVM asa Classifier
HighDimensional
FeaturesComprehensibility
[44] 2008 191 7 3 7[9] 2011 119 3 3 7[23] 2012 66 3 3 7[26] 2016 51 7 3 7[22] 2013 50 3 3 7[16] 2012 47 7 3 7[13] 2012 38 3 3 7[10] 2015 28 3 3 7[45] 2013 25 7 3 7[14] 2012 25 3 3 7[12] 2014 22 3 3 7[20] 2015 20 3 3 7[24] 2017 16 3 3 7[11] 2014 14 3 3 7[21] 2016 8 3 3 7[15] 2016 6 7 3 7
the top 20, 50, 100 top terms and used these as featuresto model Naive Bayes, and Logistic regression classifiers.They reported on precision, recall and f-score, and concludedthat their method had a significant improvement over otherproposed methods. Yet, they did not use these top terms tocomprehend the prediction model. Menzies et al. [44] usedTFIDF featurization technique with Naive Bayes classifierto predict the severity of defect reports and they lacked inshowing how to interpret such a method. Few researchers [13],[14] used only top TF features to build a SVM classifier butdid not provide interpretability of the method.
Many other researchers used SVM as a classifier but usedhigh number of TF features to do bug/defect prediction [9]–[12] and they provided top significant terms to explain aboutthe cause of these bugs. In other works, few researchers usedSVM with high number of TF features but did not report termsto provide any explanation [20]–[23].
Researchers also used LDA’s document topic distributionas features to build bug report prediction models [15], [16],[24], [45]. Xia et al. [24] worked on LDA features withSVM classifier but did not have any interpretability power.Pingclasai et al. [45] compared different size of topics neededby LDA against different number of top TF features. Theyfound that LDA with K = 50 yields the best f-score. Laymanet al. [15] used different number of topics to identify severityof bug reports on 6 NASA Space System Problem datasets.They also comprehensibly showed what these reports weretalking about. The problem with this was that they chose highnumber of topics. Also, Chen et al. [16] used LDA to identifywhether defect prone module stays defect prone even in futureversions. They showed top topics with top words related todefect. But the problem existed similar to Layman et al., thatthey used high number of topics.
We looked at recent studies, which uses high dimensionalfeatures combined with different classifiers such as NaiveBayes, SVM, Logistic regression [9], [26], [44] to accuratelymodel the data. But out of that, SVM is the most commonly,frequently and popularly used classifier. From Table I, we cansee that 11/16 (about 70%) highly cited papers used SVM asclassifiers. Therefore, we chose SVM classifier as the complex
4

baseline learner to compare against the simple FFT model.
C. Curse of Dimensionality
All the text mining techniques model high dimensionaldata, i.e., a corpus of documents that contains 104 to 106
unique words. The common problem associated with suchdata is that when the dimensionality increases, the volume ofthe space increases drastically which leads to available datagetting sparsed [41]. This sparsity is problematic when wetry to find statistically sound and reliable result, the amountof data needed to support the result often grows exponentiallywith the dimensionality. Also, modeling such high dimensionaldata often relies on detecting areas where objects form groupswith similar properties, however in high dimensional data, allobjects appear to be sparse and dissimilar in many ways,which prevents common data organization strategies frombeing efficient [46].
High dimensional data also increases the complexity fordata modeling, and is a curse for finding comprehensiblemodels. Researchers use TF and TFIDF feature extractiontechniques [12], [44] which provides 1,000 to 10,000s offeatures for a learner to model it. These numerous featureswould not offer smaller concise comprehensible models. FromTable I, we can see that all the 16 papers have high di-mensional features driving us to find alternate methods forreduction in dimensionality.
To tackle the curse of dimensionality, researchers em-ploy different dimensionality reduction techniques like fea-ture transformation (Principal Component Analysis, LatentDirichlet Allocation), Sampling, Feature Selection Techniques,and many more [47], [48]. For text mining, researchers usedmostly a feature transformation or feature selection techniqueto reduce the feature space in order to find the top words fromthe corpus which can the be used in classifiers [13], [14], [26].
Latent Dirichlet Allocation (LDA) is a common techniqueobserved in text mining for dimensionality reduction [15],[17]. LDA provides topics that are comprehensible enoughand researchers can browse through them to make decisionsas shown by Agrawal et al [17]. We agree with their workand their motivation of choosing such a feature extractiontechnique. That’s why, we chose LDA as a feature extractiontechnique (since we get concise topics) and after combiningit with FFT (depth, d = 4), we get few rules that arecomprehensible enough while having better or comparableresults classification performance.
D. Computationally Inexpensiveness
There always exists a trade-off between the effectivenessand the cost of running any method. The method should notbe expensive to apply (measured in terms of required CPU, orruntime). Before a community can adopt a method, we needto first ensure that the method executes very quickly. Somemethods, especially which are used to solve the problem ofhyperparameter optimization (the problem of choosing a set ofoptimal parameters for a learning algorithm), can require hoursto days to years of CPU-time to terminate [17], [49]. Hence,
unlike such methods, we need to select baseline methods thatare reasonably fast.
One such resource expensive method is recently introducedby Agrawal et al. [17], where they optimized the hyperpa-rameters of LDA to find the optimal settings. They optimizedthe LDA for <n score which was the measure of how stablethe generated topics are. They showed that stable topics areneeded if developers/users are using these topics for furtheranalysis, especially when it comes to unsupervised learning.They also used these stable topics for supervised learningand showed that the prediction performance is comparableagainst the commonly used text mining technique of TFIDFwith SVM classifier. The major drawback with their method isthat it is computationally expensive, and is about three to fivetimes slower. It is computationally expensive due to 2 reasons:1) Use of computationally expensive optimizer (DifferentialEvolution) and 2) Number of Topics, which has direct relationwith its runtime, i.e., the more number of topics, the more therun time.
As previously mentioned, the reason for choosing LDAfeatures was its power of comprehensibility. Though we donot want to use an expensive technique like LDADE, when wehave the option of using default parameters without sacrificingthe performance while achieving much better comprehensibil-ity with FFT.
E. How are FFTs generated?
Psychological scientists have developed FFTs (Fast andFrugal Trees) as one way to generate comprehensible modelsconsisting of separate tiny rules [29], [37], [50]. A FFT isa decision tree made for binary classification problem withexactly two branches extending from each node, where eitherone or both branches is an exit branch leading to a leaf [50].That is to say, in an FFT, every question posed by a node willtrigger an immediate decision (so humans can read every leafnode as a separate rule).
We used the similar implementation of FFT as offered by Fuand Chen et al. [29], [51]. An FFT of depth d has a choice oftwo “exit policies” at each level: the existing branch can selectfor the negation of the target, i.e., non-severe, (denoted “0”)or the target (denoted “1”), i.e., severe. The right-hand-sidetree in Figure 4 is 01110 since:• The first level found a rule that exits to the negation of the
target: hence, “0”.• While the next tree levels found rules that exit first to target;
hence, “111”.• And the final line of the model exits to the opposite of the
penultimate line; hence, the final “0”.Following the advice of [29], [37], [51], for all the experi-
ments of this paper, we use a depth d = 4. For trees of depthd = 4, there are 24 = 16 possible trees which can be denotedas 00001, 00010, 00101, ... , 11110. During FFT training, all2d trees are generated, then we select the best one (using thetraining data). This single best tree is then applied to the testdata. Note that FFTs of such small depths are very succinct(see examples in Figures 2 and 4). Such FFTs generate rules
5
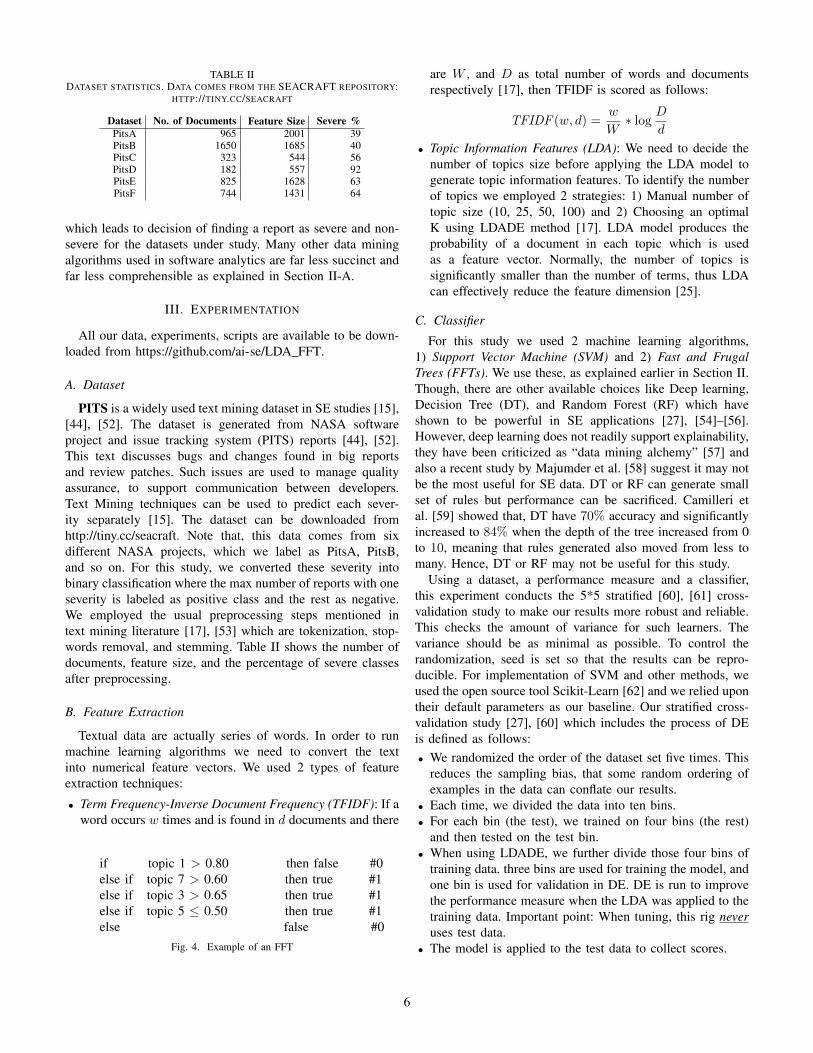
TABLE IIDATASET STATISTICS. DATA COMES FROM THE SEACRAFT REPOSITORY:
HTTP://TINY.CC/SEACRAFT
Dataset No. of Documents Feature Size Severe %PitsA 965 2001 39PitsB 1650 1685 40PitsC 323 544 56PitsD 182 557 92PitsE 825 1628 63PitsF 744 1431 64
which leads to decision of finding a report as severe and non-severe for the datasets under study. Many other data miningalgorithms used in software analytics are far less succinct andfar less comprehensible as explained in Section II-A.
III. EXPERIMENTATION
All our data, experiments, scripts are available to be down-loaded from https://github.com/ai-se/LDA FFT.
A. Dataset
PITS is a widely used text mining dataset in SE studies [15],[44], [52]. The dataset is generated from NASA softwareproject and issue tracking system (PITS) reports [44], [52].This text discusses bugs and changes found in big reportsand review patches. Such issues are used to manage qualityassurance, to support communication between developers.Text Mining techniques can be used to predict each sever-ity separately [15]. The dataset can be downloaded fromhttp://tiny.cc/seacraft. Note that, this data comes from sixdifferent NASA projects, which we label as PitsA, PitsB,and so on. For this study, we converted these severity intobinary classification where the max number of reports with oneseverity is labeled as positive class and the rest as negative.We employed the usual preprocessing steps mentioned intext mining literature [17], [53] which are tokenization, stop-words removal, and stemming. Table II shows the number ofdocuments, feature size, and the percentage of severe classesafter preprocessing.
B. Feature Extraction
Textual data are actually series of words. In order to runmachine learning algorithms we need to convert the textinto numerical feature vectors. We used 2 types of featureextraction techniques:
• Term Frequency-Inverse Document Frequency (TFIDF): If aword occurs w times and is found in d documents and there
if topic 1 > 0.80 then false #0else if topic 7 > 0.60 then true #1else if topic 3 > 0.65 then true #1else if topic 5 ≤ 0.50 then true #1else false #0
Fig. 4. Example of an FFT
are W , and D as total number of words and documentsrespectively [17], then TFIDF is scored as follows:
TFIDF (w, d) =w
W∗ log D
d
• Topic Information Features (LDA): We need to decide thenumber of topics size before applying the LDA model togenerate topic information features. To identify the numberof topics we employed 2 strategies: 1) Manual number oftopic size (10, 25, 50, 100) and 2) Choosing an optimalK using LDADE method [17]. LDA model produces theprobability of a document in each topic which is usedas a feature vector. Normally, the number of topics issignificantly smaller than the number of terms, thus LDAcan effectively reduce the feature dimension [25].
C. Classifier
For this study we used 2 machine learning algorithms,1) Support Vector Machine (SVM) and 2) Fast and FrugalTrees (FFTs). We use these, as explained earlier in Section II.Though, there are other available choices like Deep learning,Decision Tree (DT), and Random Forest (RF) which haveshown to be powerful in SE applications [27], [54]–[56].However, deep learning does not readily support explainability,they have been criticized as “data mining alchemy” [57] andalso a recent study by Majumder et al. [58] suggest it may notbe the most useful for SE data. DT or RF can generate smallset of rules but performance can be sacrificed. Camilleri etal. [59] showed that, DT have 70% accuracy and significantlyincreased to 84% when the depth of the tree increased from 0to 10, meaning that rules generated also moved from less tomany. Hence, DT or RF may not be useful for this study.
Using a dataset, a performance measure and a classifier,this experiment conducts the 5*5 stratified [60], [61] cross-validation study to make our results more robust and reliable.This checks the amount of variance for such learners. Thevariance should be as minimal as possible. To control therandomization, seed is set so that the results can be repro-ducible. For implementation of SVM and other methods, weused the open source tool Scikit-Learn [62] and we relied upontheir default parameters as our baseline. Our stratified cross-validation study [27], [60] which includes the process of DEis defined as follows:• We randomized the order of the dataset set five times. This
reduces the sampling bias, that some random ordering ofexamples in the data can conflate our results.
• Each time, we divided the data into ten bins.• For each bin (the test), we trained on four bins (the rest)
and then tested on the test bin.• When using LDADE, we further divide those four bins of
training data. three bins are used for training the model, andone bin is used for validation in DE. DE is run to improvethe performance measure when the LDA was applied to thetraining data. Important point: When tuning, this rig neveruses test data.
• The model is applied to the test data to collect scores.
6
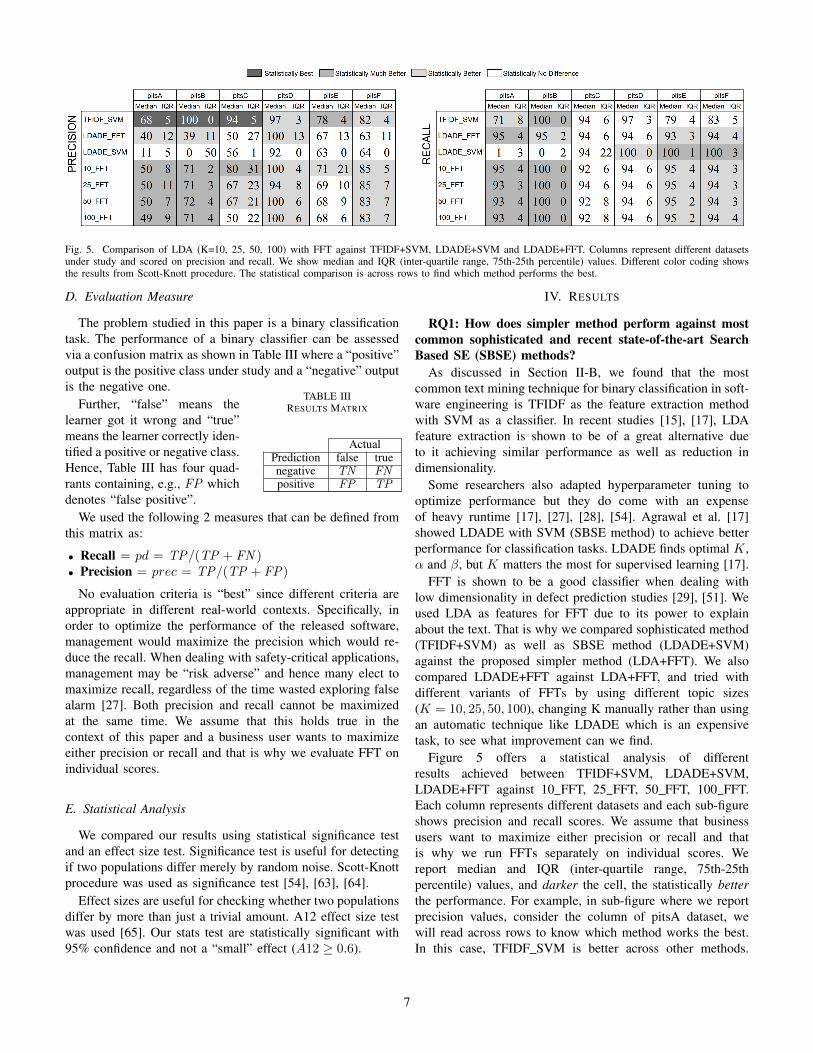
Fig. 5. Comparison of LDA (K=10, 25, 50, 100) with FFT against TFIDF+SVM, LDADE+SVM and LDADE+FFT. Columns represent different datasetsunder study and scored on precision and recall. We show median and IQR (inter-quartile range, 75th-25th percentile) values. Different color coding showsthe results from Scott-Knott procedure. The statistical comparison is across rows to find which method performs the best.
D. Evaluation Measure
The problem studied in this paper is a binary classificationtask. The performance of a binary classifier can be assessedvia a confusion matrix as shown in Table III where a “positive”output is the positive class under study and a “negative” outputis the negative one.
TABLE IIIRESULTS MATRIX
ActualPrediction false truenegative TN FNpositive FP TP
Further, “false” means thelearner got it wrong and “true”means the learner correctly iden-tified a positive or negative class.Hence, Table III has four quad-rants containing, e.g., FP whichdenotes “false positive”.
We used the following 2 measures that can be defined fromthis matrix as:
• Recall = pd = TP/(TP + FN )• Precision = prec = TP/(TP + FP)
No evaluation criteria is “best” since different criteria areappropriate in different real-world contexts. Specifically, inorder to optimize the performance of the released software,management would maximize the precision which would re-duce the recall. When dealing with safety-critical applications,management may be “risk adverse” and hence many elect tomaximize recall, regardless of the time wasted exploring falsealarm [27]. Both precision and recall cannot be maximizedat the same time. We assume that this holds true in thecontext of this paper and a business user wants to maximizeeither precision or recall and that is why we evaluate FFT onindividual scores.
E. Statistical Analysis
We compared our results using statistical significance testand an effect size test. Significance test is useful for detectingif two populations differ merely by random noise. Scott-Knottprocedure was used as significance test [54], [63], [64].
Effect sizes are useful for checking whether two populationsdiffer by more than just a trivial amount. A12 effect size testwas used [65]. Our stats test are statistically significant with95% confidence and not a “small” effect (A12 ≥ 0.6).
IV. RESULTS
RQ1: How does simpler method perform against mostcommon sophisticated and recent state-of-the-art SearchBased SE (SBSE) methods?
As discussed in Section II-B, we found that the mostcommon text mining technique for binary classification in soft-ware engineering is TFIDF as the feature extraction methodwith SVM as a classifier. In recent studies [15], [17], LDAfeature extraction is shown to be of a great alternative dueto it achieving similar performance as well as reduction indimensionality.
Some researchers also adapted hyperparameter tuning tooptimize performance but they do come with an expenseof heavy runtime [17], [27], [28], [54]. Agrawal et al. [17]showed LDADE with SVM (SBSE method) to achieve betterperformance for classification tasks. LDADE finds optimal K,α and β, but K matters the most for supervised learning [17].
FFT is shown to be a good classifier when dealing withlow dimensionality in defect prediction studies [29], [51]. Weused LDA as features for FFT due to its power to explainabout the text. That is why we compared sophisticated method(TFIDF+SVM) as well as SBSE method (LDADE+SVM)against the proposed simpler method (LDA+FFT). We alsocompared LDADE+FFT against LDA+FFT, and tried withdifferent variants of FFTs by using different topic sizes(K = 10, 25, 50, 100), changing K manually rather than usingan automatic technique like LDADE which is an expensivetask, to see what improvement can we find.
Figure 5 offers a statistical analysis of differentresults achieved between TFIDF+SVM, LDADE+SVM,LDADE+FFT against 10 FFT, 25 FFT, 50 FFT, 100 FFT.Each column represents different datasets and each sub-figureshows precision and recall scores. We assume that businessusers want to maximize either precision or recall and thatis why we run FFTs separately on individual scores. Wereport median and IQR (inter-quartile range, 75th-25thpercentile) values, and darker the cell, the statistically betterthe performance. For example, in sub-figure where we reportprecision values, consider the column of pitsA dataset, wewill read across rows to know which method works the best.In this case, TFIDF SVM is better across other methods.
7

Similarly other dataset’s results can be read. Also, if the samecolor exists across, they are either statistically insignificant orare different only via a small effect (as stated by the statisticalmethods described in Section III-E).
For recall, we observe that 10 FFT, 25 FFT, 50 FFT, and100 FFT (LDA FFTs) are performing statistically similaragainst all 6 datasets, whereas for precision scores, 10 FFT,25 FFT, 50 FFT, 100 FFT are performing similar in 4 out of6 datasets and 10 FFT wins on the remaining 2 occasions.This came as a surprise since value of K are shown tohave effect on the classification performance in recent SBSEmethod [17] whereas FFT has minimal effect on what valueof K is used. From now on, that is why all our comparisonsare with 10 FFT.
We note that simpler methods (10 FFT) are statisticallybetter or similar on 5 out of 6 datasets against TFIDF+SVM(sophisticated method) when compared on recall but it per-forms similar on 2 out of 6 datasets when we look at precisionvalue. This tells that simple FFT method have comparableperformance against the complex method.
We also found that 10 FFT is winning on precision bya big margin on all 6 datasets when compared againstLDADE SVM. On the other hand, 10 FFT method offeredcomparable performance against the other 6 datasets for recall.This changes a recent study’s conclusion [17] where Agrawalet al. showed LDADE SVM, new simpler state-of-the-artmethod, defeating the sophisticated method (TFIDF+SVM).The datasets under study are different than what Agrawal etal. used, which might have affected our results. Though, ourfindings say that:
LDADE+SVM is worse than LDA+FFT and TFIDF+SVMbut LDA+FFT is similar to TFIDF+SVM.
• LDA FFT with K = 10 offers comparable performanceagainst TFIDF+SVM.
• LDA FFT with K = 10 are wining against LDADE+SVMin majority cases.
With any empirical study, besides classification power, wehave to look at the runtimes as another criteria to evaluatethe methods performance. Table IV shows the runtimes inminutes. From the table, it can be observed that LDA+FFT isonly somewhat slower than TFIDF+SVM which may not bean arduous increase given the gains from its power of com-prehensibility discussed in RQ2. However, it can be observedthat LDA+FFT combination is orders of magnitude faster (100fold) than SBSE method (LDADE+SVM). This concludes thatSBSE method is quite expensive and our picked alternativesolution, i.e., LDA+FFT, is a promising candidate.
Lastly, we would like to make a point that, complexand time-costly model like LDADE or other K values of25, 50, 100 is not needed. We can use K = 10 as the optimalnumber of features to build a simple FFT model. Hence,
TABLE IVRUNTIMES (IN MINUTES)
Dataset TFIDF SVM 10 FFT LDADE SVMPitsA <1 <8 <900PitsB <1 <9 <500PitsC <1 <3 <200PitsD <1 <2 <150PitsE <1 <7 <400PitsF <1 <8 <400
Result 1Simpler method (LDA+FFT) offers similar performanceas the sophisticated method (TFIDF+SVM) and the SBSEmethod (LDADE+SVM). Though simpler LDA+FFT methodtakes an extra 10 minutes than the baseline, but it is ordersof magnitude faster than the SBSE method.
RQ2: Is simpler method more explainable or compre-hensible against the most common sophisticated and recentstate-of-the-art SBSE methods?
Beside the comparable performance of the simpler methodagainst the most common sophisticated method and the recentSBSE method, it would not bring any merits to practicefor software analytics without having explainable insightsthat can be easily interpreted from the model. Representativecharacteristics that help a model more explainable, includessmall architecture, easily visualized, and comprise of fewerrules that can quickly lead to decisions. From Table II, withlarge features size range of 550-2000 features from the sixdatasets of our study, the classifier built on top of that willbe too big and complex. Since 2013, researchers have startedfocusing on using LDA features instead of TFIDF to offer thecomprehensible aspect of the models. However, LDA featuresonly provide better sense of interpretability if we have 10s offeatures not 100s. Researchers have showed both the top keywords from TFIDF or LDA [10]–[12], [15], [17] features in anattempt to compensate for the comprehensibility of the modelbut there were no simple decision-making process embeddedwith it, so the model is not actionable.
For this study, support vector machines were picked as themost common sophisticated method in text mining. SVMsachieve the results after synthesizing new dimensions throughthe kernel function which are totally unfamiliar to humanusers. Hence, it is hard to explain to the users.
The proposed simple model of FFT with K = 10 LDAtopics, depth d = 4, references the trend of only 4 topics fromLDA. At each level d of the FFT tree, the existing branch canselect for the severeness target, i.e., true (denoted “1”), or thenon-severeness target, i.e., false (denoted “0”), as it’s exitingpolicies. The exiting policies selected by FFT are a trace of themodel sampling around the space toward the sections of thedata containing the targets of severe class of bug reports. Withthis architecture, the LDA+FFT would be more explainable fortext mining to determine the severity of the bug.
Figure 6 demonstrates how our models can be explainable.The right hand side of the figure shows the four most important
8

PITS A Dataset:if topic 1 > 0.80 then falseelse if topic 7 > 0.60 then trueelse if topic 3 > 0.65 then trueelse if topic 5 ≤ 0.50 then trueelse false
Topic 1: type data line code statu packet word functionTopic 7: mode point control project attitud rate error prdTopic 3: messag unsign bit code file byte word ptrTopic 5: file variabl code symbol messag line initi access
PITS B Dataset:if topic 2 > 0.70 then trueelse if topic 4 > 0.75 then falseelse if topic 7 > 0.65 then trueelse if topic 6 ≤ 0.80 then trueelse false
Topic 2: command gce counter step bgi test state antennaTopic 4: line code function file declar comment return useTopic 7: ace command fsw shall level state trace packetTopic 6: test interfac plan file dmr document section data
PITS C Dataset:if topic 1 > 0.70 then falseelse if topic 6 > 0.55 then trueelse if topic 8 > 0.73 then trueelse if topic 2 > 0.85 then falseelse false
Topic 1: requir fsw command specif state specifi shall groundTopic 6: tim trace section document traceabl matrix rqt requirTopic 8: appropri thermal field integr test valid ram violatTopic 2: header zero posit network indic action spacecraft base
PITS D Dataset:if topic 6 ≤ 0.50 then falseelse if topic 1 > 0.80 then trueelse if topic 4 > 0.85 then falseelse if topic 9 > 0.60 then falseelse true
Topic 6: essenti record heater occurr indic includ rollovTopic 1: fsw csc trace data field fpa tabl commandTopic 4: enabl wheel use disabl respons control protect faultTopic 9: line cpp case switch default projectd file fsw
PITS E Dataset:if topic 8 > 0.75 then trueelse if topic 5 > 0.70 then falseelse if topic 7 > 0.50 then falseelse if topic 10 < 0.9 then falseelse true
Topic 8: line file function cmd paramet ccu fsw vmlTopic 5: inst phx test project set document softwar verifiTopic 7: ptr size time prioriti ega defin data nullTopic 10: word fsw enabl capabl follow vagu present emic
PITS F Dataset:if topic 5 ≤ 0.80 then falseelse if topic 8 > 0.75 then trueelse if topic 2 > 0.50 then trueelse if topic 9 > 0.65 then trueelse false
Topic 5: requir projectf tabl ref boot bsw fsw sectionTopic 8: fsw requir test projectf procedur suffici softwarTopic 2: code variabl test point build defin float valuTopic 9: number byte word limit buffer dump ffp error
Fig. 6. Comprehensible models generated by FFT for all 6 datasets
topics as a list of top relevant words per dataset. The left handside includes decision rules of the best performing FFT treethat fit with the LDA generated topics. Some of the possibleinterpretations of the FFT models from Figure 6 include:
• The FFT tree from PitsC dataset, say for depth 1, the exitingpolicy says that when a report of the dataset will haveprobability of topic 1 higher than 0.7 then that report willbe a non-severe report.
• In other case, the exiting policies for PitsE FFT is “10001”.It starts off with deciding the severeness targeting somelow hanging fruit of severe bug reports. Only after clearingaway all the non-severe examples at levels two, three, four,it makes a final “true” conclusion. Note that all the exits,except the first and the last, are “false”.
• For PitsF FFT’s exiting policies of “01110”. It is similarto “10001” where “01110” starts off with clearing awaythe non-severe examples then commit on finding the targetclasses and then clear the rest of non-severe examples. Notethat all the exits, except the first and the last, are “true”.
In practice, business users/experts can use this explainableand comprehensible method to identify a new unseen/notlabeled report into severe and non-severe, reducing the timeand cost spent by business in labeling these reports [66],[67]. For e.g., once FFT tree is built on the seen examples
using LDA, a new bug report instance will use LDA toautomatically come up with topic probabilities of this report(like topic 1 = 0.7, topic 2 = 0.02 and so on). We can thenuse the probabilities to traverse through the built FFT treeto classify the severeness of the bug report automatically.With the comparable performance demonstrated in RQ1, thismethod shall confidently give those experts an actionable andintuitive but more scientific way to quickly label the severenessof the bug report.
Moreover, comprehensibility aspect of the model also letthe expert testing theories appropriately. For instance, someof the top words from topic 6 generated for the PitsB dataset(Figure 6) include “test, plan, document, data” in which testplanning topic can be easily inferred from. By following therespective FFT model, the development team would now taketest planning into more serious consideration in the softwaredevelopment lifecycle to minimize future sever bugs in thesoftware. The team will have the autonomy to easily refinethe method accordingly or generalize this method for futureapplications, which is the two strongly suggested characteris-tics of the power of comprehensibility by Gleicher [34].
On the other hand, the models generated from complex orSBSE method will look like Figure 1. As discussed earlier inSection II-A, SVM model generates synthetic feature space
9
and an imaginary hyperplane boundary that lack the powerof explainability of such a model to humans. We can not usesuch a decision space to reason from or make it actionable.
Altogether, our proposed LDA+FFT method has more ac-tionable and comprehensible aspects against TFIDF+SVM,our most sophisticated method, and LDADE+SVM, SBSEmethod. Moreover, the cost of running LDA+FFT in RQ1 willbe compensated with the interpretability of the model. Hence,
Result 2FFT generates fewer rules referencing only 4 topics foundby LDA are far more comprehensible than the most commonsophisticated and SBSE methods.
V. DISCUSSION
We found that FFT with small feature space (10 features)found by LDA works as well as SVM with 100s to 1000sTFIDF features and much better than the combination ofLDADE and SVM which makes the discussion important onwhy FFT works. There could be two reasons behind this:1) The exit policies selected by FFTs are like a trace of the
reasoning jumping around the data. For example, a tree with11110 policy jumps towards sections of the data containingmost severe reports. Also, a 00001 tree shows anothermodel trying to jump away from severe reports until, inits last step, it does one final jump towards severe. Thistells us that software data could be “lumpy”, i.e., it dividesinto a few separate regions, each with different properties.In such a “lumpy” space, a learning policy like FFT workswell since its exit policies let a learner discover how tobest jump between the “lumps” and other learners fail inthis coarse-grained lumpy space [29], [51].
2) FFT combines good and bad attributes together to find thebest decision policy [37]. FFT finds a rule by identifyingthe exit policy that has the highest probability of that ruleleading to a particular class even if the rule contains mixedclass distribution. On the other hand, learners like SVM,transform the data into different feature space which couldstill contain noisy relationship between the transformedspace and the decisions.
Based on the above discussion, we will need to extend theusage of FFT in other software analytics tasks on morecomplex data to see whether the results from this paper holdstrue for them or not.
VI. THREATS TO VALIDITY
As with any empirical study, biases can affect the finalresults. Therefore, any conclusions made from this work mustconsider the following issues in mind.
Order bias: With each dataset how data samples are dis-tributed in training and testing set is completely random.Though there could be times when all good samples arebinned into training set. To mitigate this order bias, we runthe experiment 25 times by randomly changing the order ofthe data samples each time.
Sampling bias threatens any classification experiment, i.e.,what matters here may not be true there. For e.g., the datasetsused here comes from the SEACRAFT repository and weresupplied by one individual. These datasets have been used invarious case studies by various researchers [15], [44], [52],i.e., our results are not more biased than many other studiesin this arena. That said, our 6 open-source datasets are mostlyfrom NASA. Hence it is an open issue if our results will holdtrue for both proprietary and open source projects from othersources. Also, our FFT results can also be affected by the sizeof each datasets. These datasets are smaller in corpus size, soin future, we plan to extend this analysis on larger and higherdimensional datasets.
Learner bias: For LDADE, we selected parameters asdefault as provided by Agrawal et al. [17]. But there couldbe some datasets where by tuning them there could be largerimprovement. We only used SVM as classifier but there couldbe other classifiers which can change our conclusions. DataMining is a large and active field and any single study canonly use a small subset of the known data miners.
Evaluation bias: This paper uses topic similarity (<n) forLDADE, and precision and recall for classifiers, but there areother measures which are used in software engineering whichincludes perplexity, accuracy, etc. Moreover, based on ourexperiment, we picked precision, and there would be loss inrecall performance and vice-versa. Assessing the performanceof both the metrics together showing there trade-offs is leftfor future work.
We would also like to point out that FFTs are only forbinary classification, however for multi-class the FFTs can beimprovised upon to accommodate this request. Also, FFTs donot scale well with 1000s of features and becomes compu-tationally expensive, which can further be improved. In thisstudy, we used a default depth of 4 to build the trees (in total16 trees are build to find the best one), but we also need to trywith other depth size to see what performance changes willwe see making it a clear focus for future.
VII. CONCLUSION
This paper has shown that a simple and comprehensible datamining algorithm, called Fast and Frugal trees (FFTs) devel-oped by psychological scientist, is remarkably effective forcreating few decision rules that are actionable and browsable.
Despite their succinctness, LDA+FFTs are remarkably ef-fective in showing comparable performance on recall andprecision when compared against the most common techniqueof TFIDF with SVM as well as state-of-the-art SBSE method(LDADE+SVM). It can also be said that, we do not needcomputationally expensive methods to find succinct models.
From the above, we conclude that, there is much forsoftware analytics community that could be learned frompsychological science. Proponents of complex methods shouldalways baseline against simpler alternative methods. For exam-ple, FFTs could be used as a standard baseline learner againstwhich other software analytics tools can compare.
10

REFERENCES
[1] A.-H. Tan et al., “Text mining: The state of the art and the challenges,”in Proceedings of the PAKDD 1999 Workshop on Knowledge Disocoveryfrom Advanced Databases, vol. 8. sn, 1999, pp. 65–70.
[2] W. Zhang, T. Yoshida, and X. Tang, “Text classification based on multi-word with support vector machine,” Knowledge-Based Systems, vol. 21,no. 8, pp. 879–886, 2008.
[3] T. Menzies, O. Mizuno, Y. Takagi, and T. Kikuno, “Explanation vsperformance in data mining: A case study with predicting runawayprojects.” JSEA, vol. 2, no. 4, pp. 221–236, 2009.
[4] A. Vellido, J. D. Martın-Guerrero, and P. J. Lisboa, “Making machinelearning models interpretable.” in ESANN, vol. 12. Citeseer, 2012, pp.163–172.
[5] J. Moeyersoms, E. J. de Fortuny, K. Dejaeger, B. Baesens, andD. Martens, “Comprehensible software fault and effort prediction: Adata mining approach,” Journal of Systems and Software, vol. 100, pp.80–90, 2015.
[6] D. Martens, J. Vanthienen, W. Verbeke, and B. Baesens, “Performanceof classification models from a user perspective,” Decision SupportSystems, vol. 51, no. 4, pp. 782–793, 2011.
[7] K. Dejaeger, T. Verbraken, and B. Baesens, “Toward comprehensiblesoftware fault prediction models using bayesian network classifiers,”IEEE Transactions on Software Engineering, vol. 39, no. 2, pp. 237–257,2013.
[8] J. Hihn and T. Menzies, “Data mining methods and cost estimationmodels: Why is it so hard to infuse new ideas?” in Automated SoftwareEngineering Workshop (ASEW), 2015 30th IEEE/ACM InternationalConference on. IEEE, 2015, pp. 5–9.
[9] A. Lamkanfi, S. Demeyer, Q. D. Soetens, and T. Verdonck, “Comparingmining algorithms for predicting the severity of a reported bug,” inSoftware Maintenance and Reengineering (CSMR), 2011 15th EuropeanConference on. IEEE, 2011, pp. 249–258.
[10] X. Xia, D. Lo, E. Shihab, X. Wang, and B. Zhou, “Automatic, high ac-curacy prediction of reopened bugs,” Automated Software Engineering,vol. 22, no. 1, pp. 75–109, 2015.
[11] P. S. Kochhar, F. Thung, and D. Lo, “Automatic fine-grained issuereport reclassification,” in Engineering of Complex Computer Systems(ICECCS), 2014 19th International Conference on. IEEE, 2014, pp.126–135.
[12] X. Xia, D. Lo, W. Qiu, X. Wang, and B. Zhou, “Automated configurationbug report prediction using text mining,” in Computer Software andApplications Conference (COMPSAC), 2014 IEEE 38th Annual. IEEE,2014, pp. 107–116.
[13] K. Chaturvedi and V. Singh, “Determining bug severity using machinelearning techniques,” in Software Engineering (CONSEG), 2012 CSISixth International Conference on. IEEE, 2012, pp. 1–6.
[14] M. Sharma, P. Bedi, K. Chaturvedi, and V. Singh, “Predicting the priorityof a reported bug using machine learning techniques and cross projectvalidation,” in Intelligent Systems Design and Applications (ISDA), 201212th International Conference on. IEEE, 2012, pp. 539–545.
[15] L. Layman, A. P. Nikora, J. Meek, and T. Menzies, “Topic modelingof nasa space system problem reports: research in practice,” in MiningSoftware Repositories (MSR), 2016 IEEE/ACM 13th Working Confer-ence on. IEEE, 2016, pp. 303–314.
[16] T.-H. Chen, S. W. Thomas, M. Nagappan, and A. E. Hassan, “Explainingsoftware defects using topic models,” in Proceedings of the 9th IEEEWorking Conference on Mining Software Repositories. IEEE Press,2012, pp. 189–198.
[17] A. Agrawal, W. Fu, and T. Menzies, “What is wrong with topicmodeling? and how to fix it using search-based software engineering,”Information and Software Technology, 2018.
[18] H. Brighton, “Robust inference with simple cognitive models.” in AAAIspring symposium: Between a rock and a hard place: Cognitive scienceprinciples meet AI-hard problems, 2006, pp. 17–22.
[19] G. Gigerenzer, J. Czerlinski, and L. Martignon, “How good are fast andfrugal heuristics?” in Decision science and technology. Springer, 1999,pp. 81–103.
[20] Y. Tian, D. Lo, X. Xia, and C. Sun, “Automated prediction of bug reportpriority using multi-factor analysis,” Empirical Software Engineering,vol. 20, no. 5, pp. 1354–1383, 2015.
[21] Y. Tian, N. Ali, D. Lo, and A. E. Hassan, “On the unreliability ofbug severity data,” Empirical Software Engineering, vol. 21, no. 6, pp.2298–2323, 2016.
[22] Y. Tian, D. Lo, and C. Sun, “Drone: Predicting priority of reported bugsby multi-factor analysis,” in Software Maintenance (ICSM), 2013 29thIEEE International Conference on. IEEE, 2013, pp. 200–209.
[23] F. Thung, D. Lo, and L. Jiang, “Automatic defect categorization,”in Reverse Engineering (WCRE), 2012 19th Working Conference on.IEEE, 2012, pp. 205–214.
[24] X. Xia, D. Lo, Y. Ding, J. M. Al-Kofahi, T. N. Nguyen, and X. Wang,“Improving automated bug triaging with specialized topic model,” IEEETransactions on Software Engineering, vol. 43, no. 3, pp. 272–297, 2017.
[25] D. M. Blei, A. Y. Ng, and M. I. Jordan, “Latent dirichlet allocation,”Journal of machine Learning research, vol. 3, no. Jan, pp. 993–1022,2003.
[26] Y. Zhou, Y. Tong, R. Gu, and H. Gall, “Combining text mining and datamining for bug report classification,” Journal of Software: Evolution andProcess, vol. 28, no. 3, pp. 150–176, 2016.
[27] A. Agrawal and T. Menzies, “Is “better data” better than “better dataminers” (benefits of tuning smote for defect prediction),” InternationalConference on Software Engineering, 2018.
[28] W. Fu, T. Menzies, and X. Shen, “Tuning for software analytics: Is itreally necessary?” Information and Software Technology, vol. 76, pp.135–146, 2016.
[29] D. Chen, W. Fu, R. Krishna, and T. Menzies, “Applicationsof psychological science for actionable analytics,” arXiv preprintarXiv:1803.05067, 2018.
[30] M. Kim, T. Zimmermann, R. DeLine, and A. Begel, “The emergingrole of data scientists on software development teams,” in Proceedingsof the 38th International Conference on Software Engineering, ser.ICSE ’16. New York, NY, USA: ACM, 2016, pp. 96–107. [Online].Available: http://doi.acm.org/10.1145/2884781.2884783
[31] H. K. Dam, T. Tran, and A. Ghose, “Explainable softwareanalytics,” CoRR, vol. abs/1802.00603, 2018. [Online]. Available:http://arxiv.org/abs/1802.00603
[32] Z. C. Lipton, “The mythos of model interpretability,” CoRR, vol.abs/1606.03490, 2016. [Online]. Available: http://arxiv.org/abs/1606.03490
[33] T. Menzies and Y. Hu, “Data mining for very busy people,” Computer,vol. 36, no. 11, pp. 22–29, 2003.
[34] M. Gleicher, “A framework for considering comprehensibility in mod-eling,” Big data, vol. 4, no. 2, pp. 75–88, 2016.
[35] D. Martens, B. Baesens, T. Van Gestel, and J. Vanthienen, “Compre-hensible credit scoring models using rule extraction from support vectormachines,” European journal of operational research, vol. 183, no. 3,pp. 1466–1476, 2007.
[36] D. Martens and F. Provost, “Explaining data-driven document classifica-tions,” Management Information Systems Quarterly, vol. 38, no. 1, pp.73–99, 2014.
[37] N. D. Phillips, H. Neth, J. K. Woike, and W. Gaissmaier, “Fftrees: Atoolbox to create, visualize, and evaluate fast-and-frugal decision trees,”Judgment and Decision Making, vol. 12, no. 4, p. 344, 2017.
[38] H. Brighton, “Robust inference with simple cognitive models,” inBetween a rock and a hard place: Cognitive science principles meetAI-hard problems: Papers from the AAAI Spring Symposium. AAAIPress, 2006, pp. 17–22.
[39] O. Maimon and L. Rokach, “Decomposition methodology for knowledgediscovery and data mining,” in Data mining and knowledge discoveryhandbook. Springer, 2005, pp. 981–1003.
[40] J. Larkin, J. McDermott, D. P. Simon, and H. A. Simon, “Expert andnovice performance in solving physics problems,” Science, vol. 208, no.4450, pp. 1335–1342, 1980.
[41] N. M. Nasrabadi, “Pattern recognition and machine learning,” Journalof electronic imaging, vol. 16, no. 4, p. 049901, 2007.
[42] B. Haasdonk, “Feature space interpretation of svms with indefinite ker-nels,” IEEE Transactions on Pattern Analysis and Machine Intelligence,vol. 27, no. 4, pp. 482–492, 2005.
[43] Cathy Yeh, “Support Vector Machines for classification,” http://efavdb.com/svm-classification/, 2015, online accessed 24 April 2018.
[44] T. Menzies and A. Marcus, “Automated severity assessment of softwaredefect reports,” in Software Maintenance, 2008. ICSM 2008. IEEEInternational Conference on. IEEE, 2008, pp. 346–355.
[45] N. Pingclasai, H. Hata, and K.-i. Matsumoto, “Classifying bug reports tobugs and other requests using topic modeling,” in Software EngineeringConference (APSEC), 2013 20th Asia-Pacific, vol. 2. IEEE, 2013, pp.13–18.
11

[46] J. H. Friedman, “On bias, variance, 0/1loss, and the curse-of-dimensionality,” Data mining and knowledge discovery, vol. 1, no. 1,pp. 55–77, 1997.
[47] L. Van Der Maaten, E. Postma, and J. Van den Herik, “Dimensionalityreduction: a comparative,” J Mach Learn Res, vol. 10, pp. 66–71, 2009.
[48] I. K. Fodor, “A survey of dimension reduction techniques,” LawrenceLivermore National Lab., CA (US), Tech. Rep., 2002.
[49] T. Wang, M. Harman, Y. Jia, and J. Krinke, “Searching for betterconfigurations: a rigorous approach to clone evaluation,” in Proceedingsof the 2013 9th Joint Meeting on Foundations of Software Engineering.ACM, 2013, pp. 455–465.
[50] L. Martignon, K. V. Katsikopoulos, and J. K. Woike, “Categorizationwith limited resources: A family of simple heuristics,” Journal ofMathematical Psychology, vol. 52, no. 6, pp. 352–361, 2008.
[51] W. Fu, T. Menzies, D. Chen, and A. Agrawal, “Building better qual-ity predictors using “ε-dominance”,” arXiv preprint arXiv:1803.04608,2018.
[52] T. Menzies, “Improving iv&v techniques through the analysis of projectanomalies: Text mining pits issue reports-final report,” Citeseer, 2008.
[53] R. Feldman and J. Sanger, Text Mining Handbook: Advanced Ap-proaches in Analyzing Unstructured Data. New York, NY, USA:Cambridge University Press, 2006.
[54] B. Ghotra, S. McIntosh, and A. E. Hassan, “Revisiting the impact ofclassification techniques on the performance of defect prediction mod-els,” in Proceedings of the 37th International Conference on SoftwareEngineering-Volume 1. IEEE Press, 2015, pp. 789–800.
[55] M. White, C. Vendome, M. Linares-Vasquez, and D. Poshyvanyk,“Toward deep learning software repositories,” in Mining Software Repos-itories (MSR), 2015 IEEE/ACM 12th Working Conference on. IEEE,2015, pp. 334–345.
[56] X. Yang, D. Lo, X. Xia, Y. Zhang, and J. Sun, “Deep learning for just-in-time defect prediction,” in Software Quality, Reliability and Security(QRS), 2015 IEEE International Conference on. IEEE, 2015, pp. 17–26.
[57] A. T. . I. R. Synced. (2017) Lecun vs rahimi: Has machine learningbecome alchemy? [Online]. Available: https://medium.com/@Synced/lecun-vs-rahimi-has-machine-learning-become-alchemy-21cb1557920d
[58] S. Majumder, N. Balaji, K. Brey, W. Fu, and T. Menzies, “500+ timesfaster than deep learning (a case study exploring faster methods for textmining stackoverflow),” in Mining Software Repositories (MSR), 2018IEEE/ACM 15th International Conference on. ACM, 2018.
[59] M. Camilleri and F. Neri, “Parameter optimization in decision treelearning by using simple genetic algorithms,” WSEAS Transactions onComputers, vol. 13, pp. 582–591, 2014.
[60] P. Refaeilzadeh, L. Tang, and H. Liu, “Cross-validation,” in Encyclope-dia of database systems. Springer, 2009, pp. 532–538.
[61] R. Kohavi et al., “A study of cross-validation and bootstrap for accuracyestimation and model selection,” in Ijcai, vol. 14, no. 2. Stanford, CA,1995, pp. 1137–1145.
[62] F. Pedregosa, G. Varoquaux, A. Gramfort, V. Michel, B. Thirion,O. Grisel, M. Blondel, P. Prettenhofer, R. Weiss, V. Dubourg et al.,“Scikit-learn: Machine learning in python,” Journal of Machine LearningResearch, vol. 12, no. Oct, pp. 2825–2830, 2011.
[63] N. Mittas and L. Angelis, “Ranking and clustering software costestimation models through a multiple comparisons algorithm,” IEEETransactions on software engineering, vol. 39, no. 4, pp. 537–551, 2013.
[64] A. Agrawal, A. Rahman, R. Krishna, A. Sobran, and T. Menzies, “Wedon’t need another hero? the impact of “heroes” on software develop-ment,” in Proceedings of the 40th International Conference on SoftwareEngineering: Software Engineering in Practice Track, ser. ICSE-SEIP’18, 2018, to Appear, preprint: https://arxiv.org/abs/1710.09055.
[65] A. Arcuri and L. Briand, “A practical guide for using statistical teststo assess randomized algorithms in software engineering,” in SoftwareEngineering (ICSE), 2011 33rd International Conference on. IEEE,2011, pp. 1–10.
[66] J. Deng, O. Russakovsky, J. Krause, M. S. Bernstein, A. Berg, andL. Fei-Fei, “Scalable multi-label annotation,” in Proceedings of theSIGCHI Conference on Human Factors in Computing Systems. ACM,2014, pp. 3099–3102.
[67] D. Chen, K. T. Stolee, and T. Menzies, “Replicating and scaling upqualitative analysis using crowdsourcing: A github-based case study,”arXiv preprint arXiv:1702.08571, 2017.
12