Embed Size (px)
Citation preview

Vision Research xxx (2015) xxx–xxx
Contents lists available at ScienceDirect
Vision Research
journal homepage: www.elsevier .com/locate /v isres
Can two dots form a Gestalt? Measuring emergent featureswith the capacity coefficient q
http://dx.doi.org/10.1016/j.visres.2015.04.0190042-6989/� 2015 Elsevier Ltd. All rights reserved.
q Author note: This research took place while the first author was a student atIndiana University. He is now at Stanford University, Stanford, CA 94305, USA. Thiswork was supported by National Institute of Mental Health Grant 05771710awarded to J.T.T. We thank Devin Burns for helpful comments on the experimentreported, Jim Pomerantz and Mary Portillo for illuminating conversations aboutemergent features and Gestalt theory, and Patricia Knapp for her assistance in datacollection.⇑ Corresponding author.
E-mail address: [email protected] (R.X.D. Hawkins).
Please cite this article in press as: Hawkins, R. X. D., et al. Can two dots form a Gestalt? Measuring emergent features with the capacity coefficientResearch (2015), http://dx.doi.org/10.1016/j.visres.2015.04.019
Robert X.D. Hawkins a,⇑, Joseph W. Houpt b, Ami Eidels c, James T. Townsend a
a Indiana University, Bloomington, United Statesb Wright State University, United Statesc University of Newcastle, Australia
a r t i c l e i n f o
Article history:Received 27 November 2014Received in revised form 25 April 2015Available online xxxx
Keywords:Perceptual organizationVisual perceptionWorkload capacity
a b s t r a c t
While there is widespread agreement among vision researchers on the importance of some local aspectsof visual stimuli, such as hue and intensity, there is no general consensus on a full set of basic sources ofinformation used in perceptual tasks or how they are processed. Gestalt theories place particular value onemergent features, which are based on the higher-order relationships among elements of a stimulusrather than local properties. Thus, arbitrating between different accounts of features is an important stepin arbitrating between local and Gestalt theories of perception in general. In this paper, we present thecapacity coefficient from Systems Factorial Technology (SFT) as a quantitative approach for formalizingand rigorously testing predictions made by local and Gestalt theories of features. As a simple, easily con-trolled domain for testing this approach, we focus on the local feature of location and the emergent fea-tures of Orientation and Proximity in a pair of dots. We introduce a redundant-target change detectiontask to compare our capacity measure on (1) trials where the configuration of the dots changed alongwith their location against (2) trials where the amount of local location change was exactly the same,but there was no change in the configuration. Our results, in conjunction with our modeling tools, favorthe Gestalt account of emergent features. We conclude by suggesting several candidateinformation-processing models that incorporate emergent features, which follow from our approach.
� 2015 Elsevier Ltd. All rights reserved.
1. Introduction or location of an item in a scene to stimulus-specific properties like
One of the central problems in vision science concerns the pro-cess by which raw visual input is organized into meaningful per-cepts that can ultimately be used to make decisions (Kimchi,Behrmann, & Olson, 2003; Palmer, 1999). Accounts of many per-ceptual tasks, such as visual search (Wolfe, 1994), object recogni-tion (Biederman, 1987), attention allocation (Moore & Egeth,1998), categorization (Kruschke, 1992, 1986) and memory (Luck& Vogel, 1997), rely on the notion of perceptual ‘‘features’’, the ele-mental information that the perceptual system extracts from rawvisual input and builds into percepts. Examples of proposed fea-tures range from basic physical properties like the hue, intensity,
the eyes of a face or line orientations of block letters. Despite theimportance of features in the psychological literature, there is noconsensus about which of the infinite set of possible features aremost informative, and how they interact in different contexts(Pinker, 1984; Pomerantz & Portillo, 2012; Schyns, Goldstone, &Thibaut, 1998; Treisman, 1988; Wolfe & Horowitz, 2004). Thisproblem is also crucial for work in machine learning and computervision, where systems must encode or learn a feature ‘vocabulary’over which to make inferences (e.g. Austerweil & Griffiths, 2011;Blum & Langley, 1997).
To some extent, the debate over Gestalt processing is primarilya debate over features: when the perceptual system encounters acomplex stimulus, does it break the stimulus into a set of local fea-tures that are subsequently pieced together into a percept, or doesit act directly on higher-order (emergent or holistic) features thatcannot be decomposed? We call the former view the local theoryof features and the latter the Gestalt theory. In this paper, we pre-sent the capacity coefficient, CðtÞ, as a quantitative tool to arbitratebetween these two views on features, and therefore as an approachto quantitatively test the predictions of Gestalt theory in general.
. Vision

2 R.X.D. Hawkins et al. / Vision Research xxx (2015) xxx–xxx
The capacity coefficient is a nonparametric measure of work-load capacity that derives from an extensive body of work usingstochastic processes to model reaction time distributions underdifferent information-processing constraints. This measure is partof a set of related tools for assessing the architecture, stopping rule,and independence of channels, known collectively as SystemsFactorial Technology (SFT; Townsend & Nozawa, 1995). The capac-ity coefficient measures change in performance as additional itemsare added to the display, giving a principled way of integratingreaction time distributions about the ‘parts’ to make predictionsabout the ‘whole’. Thus, the capacity coefficient can be directlyinterpreted as a measure of processing efficiency, which can be com-pared to the performance of certain well-defined benchmark mod-els such as the parallel race model (Miller, 1982, 1991).
In brief, we define the capacity coefficient in terms of process-ing times for two sources of information: A and B presented eithertogether or in isolation. Using the response times produced whenthe sources are presented in isolation, we estimate the predictedresponse time distribution when presented together assuming aparallel race model (i.e., A and B are processed in parallel at thesame rate they would be if they were in isolation and a responseoccurs as soon as either of A or B are finished processing). In thecapacity coefficient, we carry out the comparison between pre-dicted performance and observed performance (with both sourcespresent) in terms of the cumulative hazard function,HðtÞ ¼ � logðFðtÞÞ, where FðtÞ is the cumulative distribution func-tion. In these terms, the ratio of the redundant-target hazard func-tion (the ‘whole’) and the sum of the individual channel hazardfunctions (the ‘parts’) should be equal to one. Ratio values belowone indicate worse performance than a race model while aboveone indicates better performance than a race model. Further detailsof the measure are given below in the Systems Factorial Technologysection.1
1 See Townsend andmathematical derivation
Please cite this articlResearch (2015), http
CðtÞ ¼ HABðtÞHAðtÞ þ HBðtÞ
ð1Þ
The application of a model-based approach in general, and anapproach based on the capacity coefficient in particular, yields anumber of advantages for the quantitative study of emergent fea-tures and Gestalt perception:
(i) Framing the problem of configural perception in terms ofworkload capacity supplements and enriches the vocabularytypically used to characterize Gesalt phenomena. This is inline with the larger push toward theory-driven methodologyin the psychological sciences: by considering the capacitycoefficient as a theoretical construct, we can design a tar-geted, well-controlled experiment which may also show dif-ferences at the mean RT level.
(ii) A model-based analysis is a first step in moving beyond thecrucial, foundational taxonomy-building stage exemplifiedby Pomerantz and colleagues (Pomerantz, 1983;Pomerantz & Portillo, 2011; Treisman & Paterson, 1984) topin down not only whether certain configural features exist,but how they are processed, at an algorithmic level. Thecapacity coefficient allows us to pose questions about themanner in which different sources of information are inte-grated (or not) in more complex stimuli, about which chan-nels of information are salient in the first place, and aboutvarious ways that processing differs from baseline modelsof theoretical interest.
Nozawa (1995) and Houpt and Townsend (2012) forand treatment of the capacity coefficient.
e in press as: Hawkins, R. X. D., et al. Can two dots form a://dx.doi.org/10.1016/j.visres.2015.04.019
(iii) The capacity coefficient provides a more theoretically princi-pled, robust, and interpretable measure of efficiency thanmean RT or accuracy can capture. In other words, if wewould like to characterize the efficiency with which the per-ceptual system processes configural features, compared tolocal features, traditional measures like mean RT and accu-racy are often insufficient for discriminating among evenbasic properties of perceptual processes (e.g., seeTownsend, 1990a & Townsend, 1990b).
In previous studies, the capacity coefficient has been used tomodel configural effects in the word processing (Houpt,Townsend, & Donkin, 2014), face processing (Burns, Houpt, &Townsend, 2010), perceptual learning (Blaha, 2011), audio-visualintegration (Altieri & Townsend, 2011), and visual feature discrim-ination (Eidels, Townsend & Pomerantz, 2008) domains. However,the complex, domain-specific nature of the stimuli used in thesestudies makes it difficult to generalize their conclusions to theoverarching theory of Gestalt processing.
Consider, for example, the aforementioned study by Eidels,Townsend and Pomerantz (2008). In their study, participants werepresented with stimuli akin to those used by Pomerantz, Sager andStoever (1977): various combinations of a diagonal line (either left,\, or right, /) and a right angle (open either to the right, x, or to the left,y). Capacity was estimated from response-time data to inform anal-yses of the underlying processing mechanisms. However, the com-plex interplay between basic features such as lines and angles andhigher order features such as closure, symmetry, and even topolog-ical similarities between items in the set had made it hard to inter-pret each effect in isolation (additionally, these researchers were notultimately interested in isolating effects of selected features).
In the current study we conducted a careful manipulation of thefeatures posited by Gestalt theory by focusing on one of the sim-plest perceptual tasks in which the local and Gestalt views comeinto direct conflict: detecting a location change in a pair of dots.Based on the capacity coefficient predictions, we developed a suit-able redundant-target task to collect the reaction time data neededto compute capacity for different combinations of two of thelowest-level configural features posited by the Gestalt view in apair of dots, Orientation and Proximity, and tested how they affectour model-informed capacity measure. Answering this questionin an easy-to-control domain, where we can isolate features, mayshed light on the processing mechanisms that underlie Gestalt per-ception in general.
1.1. Components or configurations?
Historically, there have been two main schools of thought onwhat constitutes a feature. The first supposes that a perceptualscene can be segmented into component pieces (e.g. the eyes, nose,and mouth of a face or the objects in a visual array), and the intrin-sic physical properties of those pieces (e.g., location, color, bright-ness, size, spatial frequency) are the fundamental sources ofperceptual information (e.g. Luck & Vogel, 1997; Nosofsky, 1986;Treisman & Gelade, 1980; Wolfe & Horowitz, 2004).
Typically, these features are characterized as static and able tobe processed independently of one another, perceived as the samewhether they appear together or in isolation (Garner, 1974;Rogosky & Goldstone, 2005). Local properties are easily extractedfrom a stimulus using image processing algorithms and are there-fore implicitly utilized in template matching techniques, makinglocal features popular and successful in computer vision (e.g.Brunelli & Poggio, 1993; Li & Allinson, 2008).
Another perspective comes from Gestalt studies demonstratingthat people perceive a whole as different from the sum of its parts.For example, Tanaka and Farah (1993, 2003) showed that parts of a
Gestalt? Measuring emergent features with the capacity coefficient. Vision
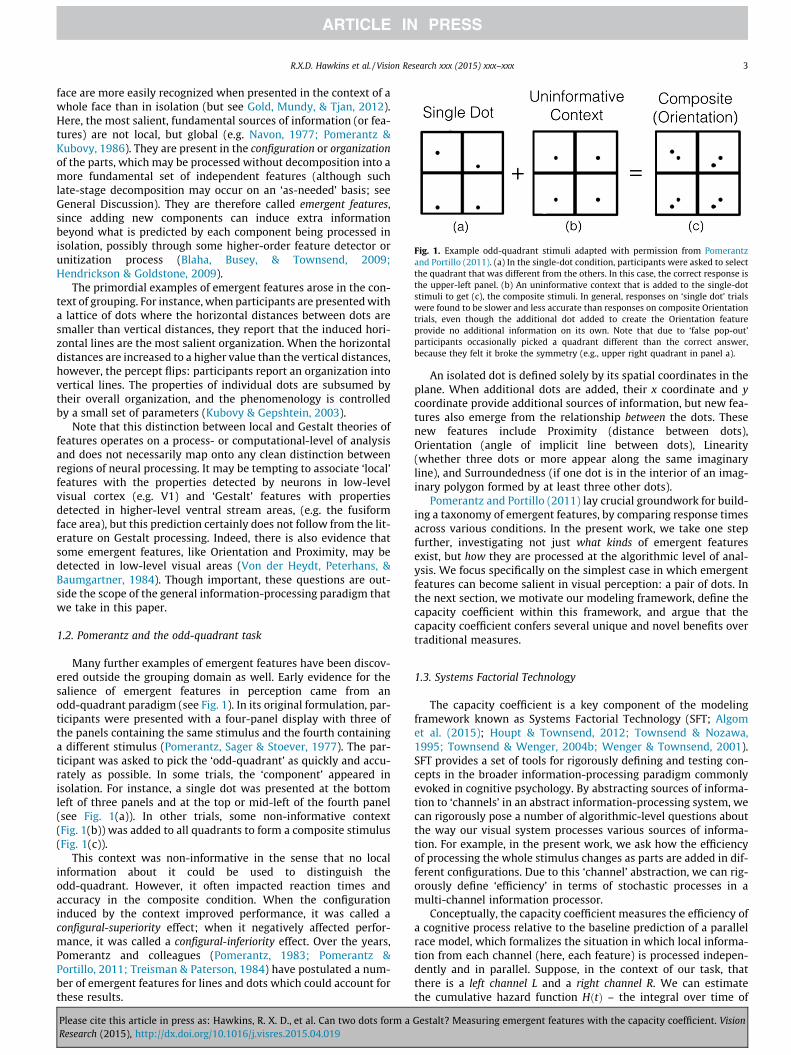
Fig. 1. Example odd-quadrant stimuli adapted with permission from Pomerantzand Portillo (2011). (a) In the single-dot condition, participants were asked to selectthe quadrant that was different from the others. In this case, the correct response isthe upper-left panel. (b) An uninformative context that is added to the single-dotstimuli to get (c), the composite stimuli. In general, responses on ‘single dot’ trialswere found to be slower and less accurate than responses on composite Orientationtrials, even though the additional dot added to create the Orientation featureprovide no additional information on its own. Note that due to ‘false pop-out’participants occasionally picked a quadrant different than the correct answer,because they felt it broke the symmetry (e.g., upper right quadrant in panel a).
R.X.D. Hawkins et al. / Vision Research xxx (2015) xxx–xxx 3
face are more easily recognized when presented in the context of awhole face than in isolation (but see Gold, Mundy, & Tjan, 2012).Here, the most salient, fundamental sources of information (or fea-tures) are not local, but global (e.g. Navon, 1977; Pomerantz &Kubovy, 1986). They are present in the configuration or organizationof the parts, which may be processed without decomposition into amore fundamental set of independent features (although suchlate-stage decomposition may occur on an ‘as-needed’ basis; seeGeneral Discussion). They are therefore called emergent features,since adding new components can induce extra informationbeyond what is predicted by each component being processed inisolation, possibly through some higher-order feature detector orunitization process (Blaha, Busey, & Townsend, 2009;Hendrickson & Goldstone, 2009).
The primordial examples of emergent features arose in the con-text of grouping. For instance, when participants are presented witha lattice of dots where the horizontal distances between dots aresmaller than vertical distances, they report that the induced hori-zontal lines are the most salient organization. When the horizontaldistances are increased to a higher value than the vertical distances,however, the percept flips: participants report an organization intovertical lines. The properties of individual dots are subsumed bytheir overall organization, and the phenomenology is controlledby a small set of parameters (Kubovy & Gepshtein, 2003).
Note that this distinction between local and Gestalt theories offeatures operates on a process- or computational-level of analysisand does not necessarily map onto any clean distinction betweenregions of neural processing. It may be tempting to associate ‘local’features with the properties detected by neurons in low-levelvisual cortex (e.g. V1) and ‘Gestalt’ features with propertiesdetected in higher-level ventral stream areas, (e.g. the fusiformface area), but this prediction certainly does not follow from the lit-erature on Gestalt processing. Indeed, there is also evidence thatsome emergent features, like Orientation and Proximity, may bedetected in low-level visual areas (Von der Heydt, Peterhans, &Baumgartner, 1984). Though important, these questions are out-side the scope of the general information-processing paradigm thatwe take in this paper.
1.2. Pomerantz and the odd-quadrant task
Many further examples of emergent features have been discov-ered outside the grouping domain as well. Early evidence for thesalience of emergent features in perception came from anodd-quadrant paradigm (see Fig. 1). In its original formulation, par-ticipants were presented with a four-panel display with three ofthe panels containing the same stimulus and the fourth containinga different stimulus (Pomerantz, Sager & Stoever, 1977). The par-ticipant was asked to pick the ‘odd-quadrant’ as quickly and accu-rately as possible. In some trials, the ‘component’ appeared inisolation. For instance, a single dot was presented at the bottomleft of three panels and at the top or mid-left of the fourth panel(see Fig. 1(a)). In other trials, some non-informative context(Fig. 1(b)) was added to all quadrants to form a composite stimulus(Fig. 1(c)).
This context was non-informative in the sense that no localinformation about it could be used to distinguish theodd-quadrant. However, it often impacted reaction times andaccuracy in the composite condition. When the configurationinduced by the context improved performance, it was called aconfigural-superiority effect; when it negatively affected perfor-mance, it was called a configural-inferiority effect. Over the years,Pomerantz and colleagues (Pomerantz, 1983; Pomerantz &Portillo, 2011; Treisman & Paterson, 1984) have postulated a num-ber of emergent features for lines and dots which could account forthese results.
Please cite this article in press as: Hawkins, R. X. D., et al. Can two dots form aResearch (2015), http://dx.doi.org/10.1016/j.visres.2015.04.019
An isolated dot is defined solely by its spatial coordinates in theplane. When additional dots are added, their x coordinate and ycoordinate provide additional sources of information, but new fea-tures also emerge from the relationship between the dots. Thesenew features include Proximity (distance between dots),Orientation (angle of implicit line between dots), Linearity(whether three dots or more appear along the same imaginaryline), and Surroundedness (if one dot is in the interior of an imag-inary polygon formed by at least three other dots).
Pomerantz and Portillo (2011) lay crucial groundwork for build-ing a taxonomy of emergent features, by comparing response timesacross various conditions. In the present work, we take one stepfurther, investigating not just what kinds of emergent featuresexist, but how they are processed at the algorithmic level of anal-ysis. We focus specifically on the simplest case in which emergentfeatures can become salient in visual perception: a pair of dots. Inthe next section, we motivate our modeling framework, define thecapacity coefficient within this framework, and argue that thecapacity coefficient confers several unique and novel benefits overtraditional measures.
1.3. Systems Factorial Technology
The capacity coefficient is a key component of the modelingframework known as Systems Factorial Technology (SFT; Algomet al. (2015); Houpt & Townsend, 2012; Townsend & Nozawa,1995; Townsend & Wenger, 2004b; Wenger & Townsend, 2001).SFT provides a set of tools for rigorously defining and testing con-cepts in the broader information-processing paradigm commonlyevoked in cognitive psychology. By abstracting sources of informa-tion to ‘channels’ in an abstract information-processing system, wecan rigorously pose a number of algorithmic-level questions aboutthe way our visual system processes various sources of informa-tion. For example, in the present work, we ask how the efficiencyof processing the whole stimulus changes as parts are added in dif-ferent configurations. Due to this ‘channel’ abstraction, we can rig-orously define ‘efficiency’ in terms of stochastic processes in amulti-channel information processor.
Conceptually, the capacity coefficient measures the efficiency ofa cognitive process relative to the baseline prediction of a parallelrace model, which formalizes the situation in which local informa-tion from each channel (here, each feature) is processed indepen-dently and in parallel. Suppose, in the context of our task, thatthere is a left channel L and a right channel R. We can estimatethe cumulative hazard function HðtÞ – the integral over time of
Gestalt? Measuring emergent features with the capacity coefficient. Vision

4 R.X.D. Hawkins et al. / Vision Research xxx (2015) xxx–xxx
the likelihood of the response process terminating at time t giventhat it has persisted until that point in time – for each channelby collecting response time distributions for a channel in isolation.These two hazard functions are denoted HLðtÞ and HRðtÞ for the leftand right channels, respectively. The parallel race model predictsthat if targets are present in both channels (i.e. in aredundant-target condition, denoted LR) and the participant isasked to respond as soon as a target is observed in either channel(i.e. an OR stopping rule), the pertinent cumulative hazard func-tion, HLRðtÞ, should be the sum of the individual channels’ cumula-tive hazard functions. In other words, the ratio of theredundant-target hazard function and the sum of the individualchannel hazard functions is equal to one. The capacity coefficientis therefore defined as the ratio:
Please cite this articlResearch (2015), http
CðtÞ ¼ HLRðtÞHLðtÞ þ HRðtÞ
ð2Þ
where, again, HLR is the cumulative hazard function derived fromthe response time distribution when both sources of informationindicate a target simultaneously (i.e. on redundant-target trials)and HL;HR are the cumulative hazard functions derived from theresponse time distribution when each target is presented in isola-tion. The hazard function can be derived as the negative log of thesurvivor function SðtÞ, which is simply 1� FðtÞ, where FðtÞ is theempirical response time CDF. Note that these functions utilize theentire RT distribution, licensing stronger inferences than summarystatistics like the mean (Townsend, 1990b).
The capacity coefficient is typically used as an absolute measurecategorizing a process as limited, unlimited, or supercapacitydepending on whether CðtÞ is less than, equal to, or greater than 1,respectively. Here we use it instead as a sensitive relative measureacross conditions. Following (Houpt & Townsend, 2012) we use az-score capacity measure, Cz, which is a convenient summary statis-tic for CðtÞ. This measure focuses on correct response times, althoughit treats incorrect responses as censoring events for the correctresponse process (see Houpt & Townsend, 2012, for more details).Because CðtÞ and the capacity z score are different transformationsof the same data, we use the terms interchangeably in the text.
In addition to its explicit connection to process-level models ofcognition, this formulation of efficiency has several advantagesover other measures that could be used, like mean response timeor accuracy. First, because there is a clearly defined baseline interms of an information-processing model, we can interpret theabsolute value of CðtÞ in a meaningful way, unlike mean RT, whichis solely used as a relative measure to show a difference betweenconditions. Second, the capacity coefficient provides a unifiedspace to compare diverse phenomena in vision science(Townsend & Eidels, 2011). Different tasks, different stimuli, or dif-ferent conditions of the same task may have intrinsically differentresponse demands (e.g. base times), leading to ostensibly differentmean RT or accuracy measures. To measure the efficiency of pro-cessing multiple sources of information together across thesecases, we require a method to appropriately account for that vari-ation. The capacity coefficient achieves this goal by defining effi-ciency as the ratio between multiple channels and single channels.
Finally, although mean RT and accuracy results are sometimesthe same as capacity results, they do not license the same infer-ences. Mean RT and accuracy measures of the configural stimulusdo not account for the processing time of individual channels.Thus, comparing mean RTs and accuracies for two-dot displaysmay be misleading in a redundant-target paradigm. For instance,suppose the configuration in the two-dot configural ‘Orientation’condition had a faster mean RT than the configuration in the corre-sponding control condition, and one used this fact to conclude thatGestalt processing was involved. This conclusion could be flawed:
e in press as: Hawkins, R. X. D., et al. Can two dots form a://dx.doi.org/10.1016/j.visres.2015.04.019
suppose the single-dot components of the configural conditionwere processed more quickly than the single-dot components ofthe control condition. Then the faster mean RT in the configuralcondition could simply be attributed to faster processing in theindividual channels without any real gains in efficiency. The capac-ity coefficient would not make this error. It is able to normalize thereaction times for the whole by the reaction times of the parts inorder to facilitate this comparison. We attempted to be careful inour experimental design to equilibrate all single-dot trials, but thiscannot be expected in general.
For the above reasons, we consider the capacity coefficient to bethe primary dependent variable of interest, and perhaps the mostvalid one. Because of its unprecedented application in this setting,however, we also decided to include results for mean reaction timeand accuracy against which the capacity coefficient can be com-pared. For some tests, all three measures agree, while for otherstheir assessments diverge. We will discuss these points of diver-gence below, but from the theoretical perspective articulated here,the capacity coefficient takes precedence.
2. Overview of the experiments
Our definition of the capacity coefficient suggests a correspond-ing experimental paradigm to test the local and Gestalt theories offeatures in pairs of dots. We set channels L and R to be the dot onthe left and right side of the display, respectively. We thus gener-ated some trials in which participants provide responses for thesedots in isolation, to estimate HLðtÞ and HRðtÞ, and other trials inwhich both dots are present (called ‘redundant-target’ trials), toestimate HLRðtÞ. To test the local theory against the Gestalt theory,we also designed one condition in which emergent features arepresent in the redundant-target stimulus and a control conditionin which they were not.
Participants were presented with a reference display showingeither a stimulus to the left of the center (L only), a stimulus tothe right of center (R only), or stimuli in both positions (R & L;see Fig. 2(a)). The reference screen was followed by a brief maskingstimulus, then the participant was shown a display in which thedot(s) were in either the same location as the reference or a differ-ent location (Fig. 2(b) and (c)). The masking duration was cali-brated to the shortest level at which pilot participants no longerreported apparent motion cues.
Participants were asked to respond whether or not the dot(s)were in the same location before and after the mask. When two dotswere displayed in the reference screen, either both dots moved orneither moved. Trials in which both dots were in a different positionthan the reference contain redundant information; noticing any oneof the components moving by itself is sufficient to complete thetask, but if the Gestalt account of emergent features is correct, thenwe predict that when both dots are present, additional configuralinformation is available to participants. Thus, for the study of holis-tic or Gestalt effects, it is instructive to compare performance whencomponents appear together (R & L) against baseline performanceexpected when they appear in isolation (L only or R only).
There are two main advantages that a redundant-target taskholds over the odd-quadrant task introduced by Pomerantz,Sager and Stoever (1977). First, the odd-quadrant task is knownto induce a ‘false pop-out’ effect for certain stimuli (Orsten &Pomerantz, 2012), in which another level of configural groupingis made across separate quadrants. While an interesting phe-nomenon in its own right, this effect interferes with thelower-level grouping phenomena under investigation. Forinstance, in Fig. 1, a configural-inferiority effect was found, despitethe change in Orientation, because participants chose the quadrantthat was not ‘pointing toward the center’ and therefore breaking
Gestalt? Measuring emergent features with the capacity coefficient. Vision

(a)
(b) (c)
Fig. 2. Stimuli and procedure in change detection task. (a) The three classes of reference stimuli, containing one or both of the channels of local information. (b) The sequenceof displays in a ‘control’ trial. Because the dots changed location in the second frame, the participant should respond ‘change’. (c) The sequence of displays in a ‘configural’trial. Both channels provide the same amount of location change information, but there is also a change in the Orientation of the dots, which Gestalt theories predict will leadto more efficient processing.
R.X.D. Hawkins et al. / Vision Research xxx (2015) xxx–xxx 5
the higher-order symmetry. Our task avoids false pop-out effectsby limiting the presentation to a single component or configurationon the screen at a time. Second, the design lends itself to analysesof data using Systems Factorial Technology and its associated mea-sures of capacity.
We present three experiments in which the capacity coefficientis used to conduct a critical test of local and Gestalt theories.Experiments 1 and 2 test the local features of dot location againstthe emergent feature of Orientation. While they use the same stim-uli, they differ in the block structure used to present these stimuli.This allows us to test the robustness of our measure with respect todetails of the experimental procedure, and to replicate our overallresults. Experiment 3 proceeds to test the local features of dot loca-tion against the emergent feature of Proximity.
All three experiments used a 2� 2 within-subject factorialdesign manipulating (1) the presence or absence of configural cuesin redundant-target trials and (2) the presence or absence of anexplicit line connecting the dots. For readers familiar with SFT,note that unlike previous SFT studies, which employ a double fac-torial paradigm, we do not manipulate the salience of configuralcues, just their presence or absence. This modification reservesthe second dimension of the factorial design to test the presenceof a line. In the redundant-target trials, the components eithermoved in the same direction to preserve Orientation (‘‘control’’;e.g., both dots moving up, as in Fig. 2(b)) or moved in oppositedirection to induce a change in emergent feature (‘‘configural’’;Fig. 2(c)). In both cases, there is the same amount of local informa-tion available, since the components move the same amount ineither direction. Hence, the local theory predicts that the capacitycoefficient will be the same in control and configural trials. TheGestalt theory, on the other hand, predicts that the capacity
Please cite this article in press as: Hawkins, R. X. D., et al. Can two dots form aResearch (2015), http://dx.doi.org/10.1016/j.visres.2015.04.019
coefficient will be larger in the configural trial, since the changein emergent feature serves as an additional source of information.
Since the Orientation and length of an explicit line is canonicallyconsidered a local feature, the second manipulation compares theinformation provided by the implicit (or imaginary) line betweenthe dots to the information provided by an explicit line. The localtheory predicts a strong interaction: capacity should be higher inthe ‘explicit line’ condition than the ‘implicit line’ condition whenconfigural cues are available, since additional information aboutOrientation and length is available. The Gestalt theory predicts thatthere will not be a strong effect of the line, since the physical fea-tures provided by the line were already present as emergent fea-tures in the dots. To our knowledge, this is the first study to testthis physical vs. emergent feature difference in simple dot stimuli.In the domain of illusory contours, where the Gestalt view of fea-tures is well-established, visual discrimination experiments com-paring processing of illusory contours vs. real contours foundminor speed-ups in reaction time for real contours (Larsson et al.,1999). Since our stimuli are much simpler, if the Gestalt view iscorrect, any effects of the line in our paradigm would be weak atmost. Thus, the application of SFT and specifically the capacitycoefficient provides a critical test for the role of emergent featuresand therefore of Gestalt perception.
3. Experiment 1
3.1. Methods
3.1.1. ParticipantsTwenty-one paid individuals between the ages of 18 and 24
were recruited from the Indiana University student population to
Gestalt? Measuring emergent features with the capacity coefficient. Vision

6 R.X.D. Hawkins et al. / Vision Research xxx (2015) xxx–xxx
participate in two 50 min sessions. Six participants were removedfrom the study after their first session due to high error ratesð> 30%Þ. We pre-set this exclusion criterion based on previouswork showing that the CðtÞ measure is stable up to error rates ofapproximately 30% and can become unreliable at higher values(Townsend & Wenger, 2004b). Of the participants that completedboth sessions, ten were female, five were male, and all had normalor corrected-to-normal vision. In accordance with the Declarationof Helsinki, the procedures were approved by local IRBs and signedconsent forms were obtained from individual participants beforethe experiment.
3.1.2. MaterialsAll stimuli were created using a scripting language for the
open-source graphics editor GIMP (Peck, 2006) and presentedusing the display system DMDX to collect response times(Forster & Forster, 2003) on a 1700 in. ViewSonic CRT monitor(ViewSonic Corporation, Walnut, CA) at 1024 � 768 resolutionwith a 75 GHz refresh rate and luminance of 150 cd/m2. The dotsin the stimuli were grey with 50% the luminance of the background(hex: 7F7F7F) and with a diameter of 0:34� in visual angle, at a sit-ting distance of approximately 70 cm. Responses were collectedusing a button box connected with a PCI-DIO24 Interface Card(Measurement Computing Corporation, Norton, MA).
Fig. 3. (a) Possible locations of dots in Experiments 1 and 2. Note that all possible locatioequivalence class under the metric of Euclidean distance. Single-dot stimuli were presentantipodal points on the circle (i.e. Green 2, Blue 3 or Green 4, Blue 1), holding Proximityadding a new position on the same horizontal line.
Please cite this article in press as: Hawkins, R. X. D., et al. Can two dots form aResearch (2015), http://dx.doi.org/10.1016/j.visres.2015.04.019
We used four different classes of stimuli, in which the distancebetween the dots’ inner contours was always held at a constantvisual angle of 1:10� to avoid possible confounds with Proximity.Fig. 3 displays the possible positions of each dot. Note that eachpossible target position (denoted by the filled circles) is an equaldistance away from the reference position (open circles). The greencircles correspond to possible positions for the left channel, andblue circles correspond to possible positions for the right channel.The green and blue colors are only used for illustration purposes inthe figure. For each of the following classes of two-dot stimuli, cor-responding single-dot stimuli were presented to collect responsetimes for the isolated components:
1. Configural, no line: Each dot is 0:74� of visual angle away fromits initial positions to a point opposite the other on a circle(Fig. 3). The implicit line between them is approximately 60�
away from the horizontal. There are two variations of this stim-ulus – one where the left dot goes up and the right dot goesdown (Green 2, Blue 3; panel (b)) and another where the leftdot goes down and the right dot goes up (Green 4, Blue 1; panel(c)). The appropriate degree of configural change was chosenusing the results of a pilot study measuring the d0 for differentlevels of Orientation (Supplemental Fig. S1).
ns for each dot are the same distance away from the reference location, forming aned for every position. (b) and (c) Configural stimuli are formed by moving the dots to
constant. (d)–(g) For each point on the circle, a control stimulus can be formed by
Gestalt? Measuring emergent features with the capacity coefficient. Vision

No Lines Lines
Two Dot Response Times
RT
350
450
550
650 Configural
ControlDistractor
No Lines Lines
Two Dot Accuracy
Mea
n A
ccur
acy
0.80
0.85
0.90
0.95
1.00
−10
−8
−6
−4
−2
02
Capacity Z−Scores
Cz
ConfiguralControl
No Lines Lines
(a) (b) (c)
Fig. 4. (a) Mean response times and (b) accuracy for each condition in Experiment 1 (Orientation with separate blocks for configural and control trials). Configural trialsdiffered from the reference in Orientation as well as the location of each element. In control trials, both elements were in a different location than the reference squares, butthe Orientation was the same. In distractor trials, both elements were in the same location as the reference squares. Error bars indicate 95% highest density intervals of theposterior. (c) Mean capacity z-scores for each condition in Experiment 1. Positive numbers indicate better than the unlimited capacity, independent parallel baseline, whilenegative numbers indicate worse than the baseline. In general, higher numbers indicate more efficient responding. Error bars indicate 95% highest density intervals of theposterior.
R.X.D. Hawkins et al. / Vision Research xxx (2015) xxx–xxx 7
2. Control, no line: Both dots are still the same distance from thereference point as in the configural conditions, but move in thesame direction (Green 1, Blue 1; Green 2, Blue 2, etc.; panels(d)–(g)) Thus, the implicit line between them remains horizon-tal and there is no change in configural features.
3. Configural, line present: Like the other configural condition,but on double-dot trials, a line connected the two dots.
4. Control, line present: Like the other control condition, but aline connected the two dots.
3.1.3. ProcedureThe sequence of displays in a trial is shown in Fig. 2(b) and (c).
On each trial, a fixation cross appeared in the center of the screenfor 200 ms, followed by a blank display for 27 ms. On single-dottrials, a blue square was presented 0:72� of visual angle to eitherthe left or the right of the center fixation. On double-dot trials, bluesquares were presented in both positions simultaneously. Online-present trials, the connecting line was only present in theprobe, not on the reference screen. The reference screen remainedfor 120 ms and was then masked for 240 ms by one of five ran-domly generated Gaussian noise patterns. The probe stimuluswas displayed for 120 ms, followed by a blank screen for1880 ms. Response times were calculated from stimulus onset.
At the beginning of the session, participants were instructed topress one button (‘no change’) if the probe dots were in the samelocations as the reference squares and another button (‘change’)if the probe dots were in a different location. Participants receivedfeedback on negative responses and time-outs for 20 practice trialsat the beginning of each session, but did not receive any feedbackfor the remainder of the session.
Each subject participated in two 50-min sessions of 960 trialsper session. One session contained exclusively ‘line-present’ trials,while the other contained exclusively ‘line-absent’ trials.Configural and control stimuli were split into separate blocks.Within each session, there were three contiguous blocks of ‘config-ural’ trials and three contiguous blocks of ‘control’ trials, withoptional rest breaks between blocks. The corresponding‘single-dot’ trials were mixed into each block. The ordering of ses-sions and the ordering of ‘configural’ and ‘control’ block sets withineach session was counterbalanced across participants. The distri-bution of stimuli within each block was chosen to balance the con-ditional probabilities: there was a 25% chance of no change(negative response), 25% chance of a double-dot change (positiveresponse) and 50% single-dot change (positive response) trials
Please cite this article in press as: Hawkins, R. X. D., et al. Can two dots form aResearch (2015), http://dx.doi.org/10.1016/j.visres.2015.04.019
evenly spread over all possible locations. The three varieties of‘no change’ trials, the two variations of configural trials, and thefour variations of control trials were evenly distributed withintheir respective blocks.
3.2. Results
Bayesian ANOVAs (Rouder et al., 2012) were used to analyzemean correct response times and accuracy. Within this framework,we calculated Bayes Factor (BF) for each effect of interest, with theconvention that BF > 10 is strong evidence and BF > 100 is decisiveevidence (see Jeffreys, 1961). BF < 3 is weak evidence, and BF < 1 is‘negative’ evidence, in favor of the null model. Fig. 4 shows themean response times (a) and accuracies (b) for trials in whichtwo dots were present along. Error bars indicate 95% highest den-sity intervals (HDIs) of the posterior distribution representing ourbeliefs about the true value of these measures after observing thedata. The HDI is the smallest interval of the posterior distributioncontaining 95% of the density.
The analysis of correct response times for two dot stimuli indi-cated main effects of configuration (BF ¼ 2:3 � 1070) and of lines(BF ¼ 1:5 � 1022) and was nearly equivocal with respect the pres-ence of an interaction (BF ¼ :53). In the accuracy data, there wasvery strong evidence against an interaction between the configura-tion and the presence of lines (BF ¼ :025). There was decisive evi-dence for main effects of configuration (BF ¼ 9:8 � 1019) and lines(BF ¼ 1:2 � 105).
For capacity we use the (Houpt & Townsend (2012)) z score(denoted Cz) as a summary statistic for CðtÞ that can be subjectedto inferential tests. Capacity z scores of zero indicate unlimitedcapacity. Capacity z scores could also be positive or negative, indi-cating super- or limited-capacity, respectively. The BayesianANOVA on capacity Z scores (shown in Fig. 4(c)) indicated thatthe most likely model includes a main effect for only configuration(BF ¼ 1:2 � 106 over a subject only model). Evidence against includ-ing an additional main effect of the line was again weak(BF ¼ 0:34) and there was substantial evidence of the configuralmain effect only model relative to the model with both maineffects and an interaction (BF ¼ 5:4). The mean posterior advan-tage of configural over control on the capacity z-scores was 3.15(HDI ¼ ½2:14;4:12�). The mean posterior difference between capac-ity z-scores without lines and with lines was �0:43(HDI ¼ ½�1:29;0:47�).
Gestalt? Measuring emergent features with the capacity coefficient. Vision
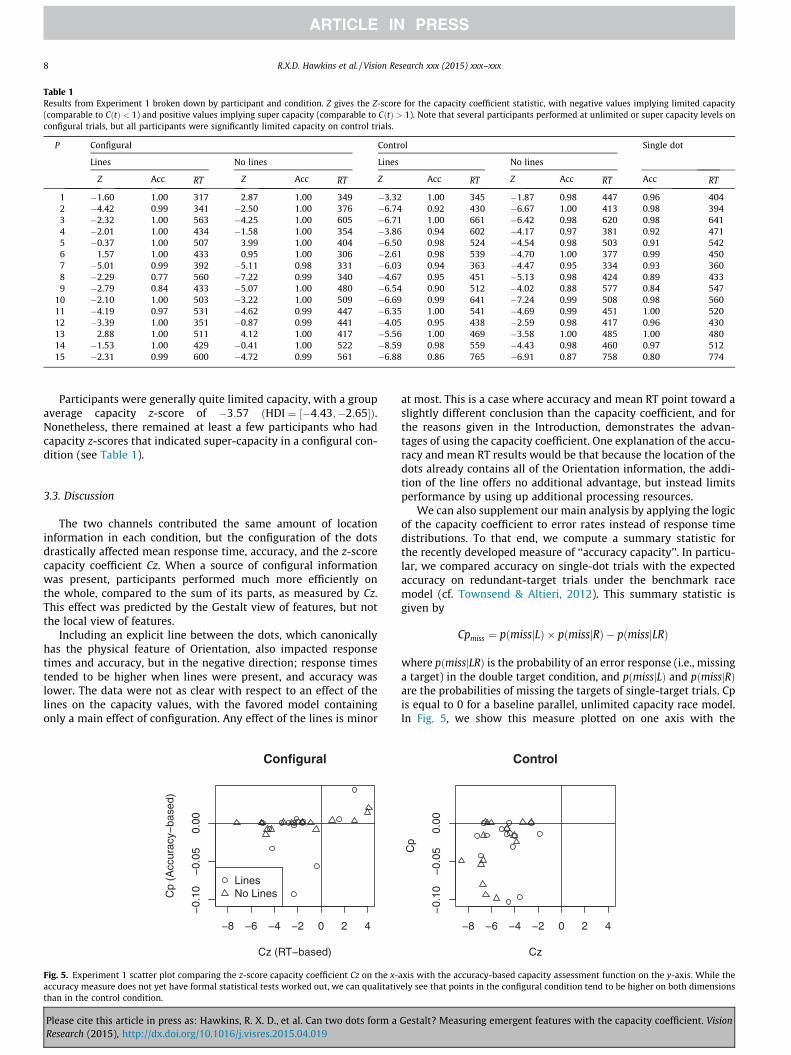
Table 1Results from Experiment 1 broken down by participant and condition. Z gives the Z-score for the capacity coefficient statistic, with negative values implying limited capacity(comparable to CðtÞ < 1) and positive values implying super capacity (comparable to CðtÞ > 1). Note that several participants performed at unlimited or super capacity levels onconfigural trials, but all participants were significantly limited capacity on control trials.
P Configural Control Single dot
Lines No lines Lines No lines
Z Acc RT Z Acc RT Z Acc RT Z Acc RT Acc RT
1 �1.60 1.00 317 2.87 1.00 349 �3.32 1.00 345 �1.87 0.98 447 0.96 4042 �4.42 0.99 341 �2.50 1.00 376 �6.74 0.92 430 �6.67 1.00 413 0.98 3943 �2.32 1.00 563 �4.25 1.00 605 �6.71 1.00 661 �6.42 0.98 620 0.98 6414 �2.01 1.00 434 �1.58 1.00 354 �3.86 0.94 602 �4.17 0.97 381 0.92 4715 �0.37 1.00 507 3.99 1.00 404 �6.50 0.98 524 �4.54 0.98 503 0.91 5426 1.57 1.00 433 0.95 1.00 306 �2.61 0.98 539 �4.70 1.00 377 0.99 4507 �5.01 0.99 392 �5.11 0.98 331 �6.03 0.94 363 �4.47 0.95 334 0.93 3608 �2.29 0.77 560 �7.22 0.99 340 �4.67 0.95 451 �5.13 0.98 424 0.89 4339 �2.79 0.84 433 �5.07 1.00 480 �6.54 0.90 512 �4.02 0.88 577 0.84 547
10 �2.10 1.00 503 �3.22 1.00 509 �6.69 0.99 641 �7.24 0.99 508 0.98 56011 �4.19 0.97 531 �4.62 0.99 447 �6.35 1.00 541 �4.69 0.99 451 1.00 52012 �3.39 1.00 351 �0.87 0.99 441 �4.05 0.95 438 �2.59 0.98 417 0.96 43013 2.88 1.00 511 4.12 1.00 417 �5.56 1.00 469 �3.58 1.00 485 1.00 48014 �1.53 1.00 429 �0.41 1.00 522 �8.59 0.98 559 �4.43 0.98 460 0.97 51215 �2.31 0.99 600 �4.72 0.99 561 �6.88 0.86 765 �6.91 0.87 758 0.80 774
8 R.X.D. Hawkins et al. / Vision Research xxx (2015) xxx–xxx
Participants were generally quite limited capacity, with a groupaverage capacity z-score of �3:57 ðHDI ¼ ½�4:43;�2:65�Þ.Nonetheless, there remained at least a few participants who hadcapacity z-scores that indicated super-capacity in a configural con-dition (see Table 1).
3.3. Discussion
The two channels contributed the same amount of locationinformation in each condition, but the configuration of the dotsdrastically affected mean response time, accuracy, and the z-scorecapacity coefficient Cz. When a source of configural informationwas present, participants performed much more efficiently onthe whole, compared to the sum of its parts, as measured by Cz.This effect was predicted by the Gestalt view of features, but notthe local view of features.
Including an explicit line between the dots, which canonicallyhas the physical feature of Orientation, also impacted responsetimes and accuracy, but in the negative direction; response timestended to be higher when lines were present, and accuracy waslower. The data were not as clear with respect to an effect of thelines on the capacity values, with the favored model containingonly a main effect of configuration. Any effect of the lines is minor
−8 −6 −4 −2 0 2 4
−0.
10−
0.05
0.00
Configural
Cz (RT−based)
Cp
(Acc
urac
y−ba
sed)
LinesNo Lines
Fig. 5. Experiment 1 scatter plot comparing the z-score capacity coefficient Cz on the x-accuracy measure does not yet have formal statistical tests worked out, we can qualitativthan in the control condition.
Please cite this article in press as: Hawkins, R. X. D., et al. Can two dots form aResearch (2015), http://dx.doi.org/10.1016/j.visres.2015.04.019
at most. This is a case where accuracy and mean RT point toward aslightly different conclusion than the capacity coefficient, and forthe reasons given in the Introduction, demonstrates the advan-tages of using the capacity coefficient. One explanation of the accu-racy and mean RT results would be that because the location of thedots already contains all of the Orientation information, the addi-tion of the line offers no additional advantage, but instead limitsperformance by using up additional processing resources.
We can also supplement our main analysis by applying the logicof the capacity coefficient to error rates instead of response timedistributions. To that end, we compute a summary statistic forthe recently developed measure of ‘‘accuracy capacity’’. In particu-lar, we compared accuracy on single-dot trials with the expectedaccuracy on redundant-target trials under the benchmark racemodel (cf. Townsend & Altieri, 2012). This summary statistic isgiven by
−0.
10−
0.05
0.00
Cp
axis with the aely see that p
Gestalt? Mea
Cpmiss ¼ pðmissjLÞ � pðmissjRÞ � pðmissjLRÞ
where pðmissjLRÞ is the probability of an error response (i.e., missinga target) in the double target condition, and pðmissjLÞ and pðmissjRÞare the probabilities of missing the targets of single-target trials. Cpis equal to 0 for a baseline parallel, unlimited capacity race model.In Fig. 5, we show this measure plotted on one axis with the
−8 −6 −4 −2 0 2 4
Control
Cz
ccuracy-based capacity assessment function on the y-axis. While theoints in the configural condition tend to be higher on both dimensions
suring emergent features with the capacity coefficient. Vision

R.X.D. Hawkins et al. / Vision Research xxx (2015) xxx–xxx 9
capacity coefficient z-score on the other axis. We see that both mea-sures tend to be higher in the configural condition than the controlcondition, giving qualitative evidence that emergent features areprocessed more efficiently, even when using accuracy as the vari-able of interest.
Still, it is possible that our results can be accounted for by theblock structure of configural and control trials. By isolating stimulifrom each condition in separate blocks, participants could havebeen biased to focus on the information provided by obviousOrientation differences to the exclusion of the location informa-tion. To address this concern and also to provide a replication ofour results, we ran a second experiment where everything wasthe same except the blocks were mixed together. This block struc-ture does not allow participants to use different processing strate-gies a priori.
4. Experiment 2
4.1. Methods
4.1.1. ParticipantsTwenty paid individuals between the ages of 18 and 26 were
recruited from the Indiana University community to participatein two 60 min sessions. Five participants were removed from thestudy after their first session due to unacceptably high error ratesof 30% or greater. Of the participants that completed both sessions,fourteen were female, one was male, and all had normal orcorrected-to-normal vision. In accordance with the Declaration ofHelsinki, the procedures were approved by local IRBs and signedconsent forms were obtained from individual participants beforethe experiment.
4.1.2. MaterialsAll equipment and stimuli were the same as in the previous
experiment.
4.1.3. ProcedureThe procedure was identical to Experiment 1 except that config-
ural and control trials, along with their corresponding single-dottrials, were mixed together and presented in random order across4 blocks with short rest breaks between blocks. Also, instead of 960trials per 50-min session, we used 1152 trials per 60-min session.Again, one session contained only ‘line’ trials and the other con-tained only ‘no line’ trials, and the distribution of trial types was
No Lines Lines
Two Dot Response Times
RT
350
450
550
650 Configural
ControlDistractor
No Lines
Two Do
Mea
n A
ccur
acy
0.80
0.85
0.90
0.95
1.00
(a) (b)
Fig. 6. (a) Mean response times and (b) accuracy for each condition in Experiment 2 (Oriereference in Orientation as well as the location of each element. In control trials, both elemthe same. In distractor trials, both elements were in the same location as the referencecapacity z-scores for each condition in Experiment 2. Positive numbers indicate better tindicate worse than the baseline. In general, higher numbers indicate more efficient res
Please cite this article in press as: Hawkins, R. X. D., et al. Can two dots form aResearch (2015), http://dx.doi.org/10.1016/j.visres.2015.04.019
the same except the 25% dedicated to double-dot change trialswas evenly split between ‘configural’ and ‘control’ trials.
4.2. Results
Fig. 6 shows the mean response times (a) and accuracies (b) fortrials in which two dots were present along with the 95% highestdensity intervals of the posterior. The analysis of correct responsetimes for two dot stimuli indicated main effects of configuration(BF ¼ 2:7 � 1069) and of lines (BF ¼ 2:3 � 103) and was nearly equiv-ocal with respect the presence of an interaction (BF ¼ :51). In theaccuracy data, there was decisive evidence for an interactionbetween the configuration and the presence of lines (BF ¼ 104).When the interaction was disregarded, there was decisive evidenceof a main effect of configuration (BF ¼ 2:0 � 1065) and nearly equiv-ocal evidence against a main effect of lines (BF ¼ :53).
Capacity Z scores were again calculated following Houpt andTownsend (2012) for each participant in each condition and areshown in Fig. 6(c). Those values were then compared using aBayesian ANOVA across the configurality-control manipulationand the implicit-explicit line manipulation. The most likely modelincluded only a main effect of configuration (BF ¼ 6:8 � 1012 over asubject only model) however there was only weak evidence forleaving out an additional main effect of the line (BF ¼ 2:8). Theanalysis did indicate substantial evidence for the configuration onlymodel when compared to a model including both lines and an inter-action (BF ¼ 8:0). The mean posterior advantage of configural overcontrol on the capacity z-scores was 5.83 (HDI ¼ ½4:77;6:91�). Themean posterior difference between capacity z-scores without linesand with lines was �0:387 (HDI ¼ ½�1:32;0:567�).
The grand mean for the capacity z scores at the group level wasnegative, �4:94 (HDI ¼ ½�5:96;�3:94�), implying limited capacity.However, in the configural condition, there was some variabilityacross participants, with several participants’ data indicating supercapacity (positive z score) or indistinguishable from unlimitedcapacity (z � 0; see Table 2).
4.3. Discussion
We replicated the results of Experiment 1 with configural andnon-configural trials intermixed. This ruled out the possibility thatparticipants only performed at higher capacity in the presence ofan Orientation cue because they were primed to expect it by theblock composition. The likelihood that the upcoming target would
Lines
t Accuracy
−10
−8
−6
−4
−2
02
Capacity Z−Scores
Cz
ConfiguralControl
No Lines Lines
(c)
ntation with mixed configural and control blocks). Configural trials differed from theents were in a different location than the reference squares, but the Orientation was
squares. Error bars indicate 95% highest density intervals of the posterior. (c) Meanhan the unlimited capacity, independent parallel baseline, while negative numbersponding. Error bars indicate 95% highest density intervals of the posterior.
Gestalt? Measuring emergent features with the capacity coefficient. Vision

Table 2Results from Experiment 2 broken down by participant and condition in the same format as Experiment 1.
P Configural Control Single dot
Lines No lines Lines No lines
Z Acc RT Z Acc RT Z Acc RT Z Acc RT Acc RT
1 �3.32 0.99 522 �6.24 1.00 398 �10.76 0.88 608 �7.29 0.90 469 0.88 5082 �7.55 0.85 549 �8.65 0.99 464 �10.76 0.77 480 �10.19 0.99 493 0.90 4543 �1.71 0.98 608 �0.19 1.00 371 �10.19 0.96 628 �9.33 0.94 414 0.95 5204 2.50 0.99 506 2.76 0.99 476 �5.11 0.72 618 �4.21 0.90 534 0.76 5465 �3.23 0.99 429 �3.52 1.00 334 �7.69 0.97 429 �5.49 0.99 353 0.99 4116 �4.05 0.99 380 �2.47 1.00 385 �7.63 0.92 444 �3.53 0.95 432 0.93 4217 �1.91 1.00 456 �2.45 0.97 526 �8.80 0.96 580 �9.53 0.90 637 0.95 6078 0.11 1.00 409 2.42 1.00 443 �6.93 0.94 483 �8.89 0.92 497 0.93 4779 �1.12 0.99 401 �0.98 0.99 506 �9.27 0.95 413 �7.74 0.96 528 0.92 476
10 �4.74 0.99 502 �4.23 0.99 471 �7.21 0.94 564 �6.44 0.94 567 0.97 57011 �0.50 0.98 406 �0.11 0.99 323 �9.96 0.85 506 �10.16 0.97 367 0.90 40512 �0.18 0.99 543 �1.43 1.00 615 �5.99 1.00 569 �10.81 0.99 698 0.97 64413 �5.01 1.00 512 0.00 1.00 461 �7.75 0.99 559 �5.05 0.99 484 0.98 54314 �2.47 0.99 392 �3.39 0.98 466 �7.49 0.90 438 �5.85 0.86 552 0.74 50815 0.72 0.99 330 0.32 1.00 347 �7.97 0.97 330 �10.12 0.98 371 0.96 363
10 R.X.D. Hawkins et al. / Vision Research xxx (2015) xxx–xxx
be identifiable only using differences in location was equivalent tothe likelihood that it could be identifiable using differences in con-figuration, so participants could not have successfully adopted astrategy of ignoring location information.
Although the overall pattern of results matches Experiment 1almost perfectly, there were some minor differences. First, themagnitude of the capacity advantage for configural trials over con-trol trials was larger in Experiment 2 (5.83 compared with 3.15).This is likely due to the relatively worse capacity for the control tri-als in Experiment 2 because the mean capacity z scores for the con-figural trials are nearly identical across the two experiments. Thisdrop in efficiency on control trials may be due to participants giv-ing processing priority to detecting a configural cue in the mixedcondition, then checking location if the configural cue is absent(see General Discussion). In Experiment 1, when the control trialswere in their own block, participants would not gain any advan-tage from checking for configural differences because there werenot any.
A second difference between Experiments 1 and 2 was thatthere was clear evidence for an interaction between the lines andthe configuration in Experiment 2, although only in the accuracymeasure. It is clear from Fig. 6(b) that the interaction has a fairlysmall magnitude, and the accuracy measure is not of theoreticalinterest, so we will not dwell on it here beyond noting that it seems
−10 −6 −2 0 2
−0.
4−
0.2
0.0
Configural
Cz (RT−based)
Cp
(Acc
urac
y−ba
sed)
LinesNo Lines
Fig. 7. Experiment 2 scatter plot comparing the z-score capacity coefficient on the x-axaccuracy measure does not yet have formal statistical tests worked out, we can qualitativthan in the control condition.
Please cite this article in press as: Hawkins, R. X. D., et al. Can two dots form aResearch (2015), http://dx.doi.org/10.1016/j.visres.2015.04.019
to be driven by an increase in accuracy for the target present trialsdue to the additional line context and a decrease in the distractortrials with the addition of lines.
In Fig. 7, we plot ‘‘accuracy capacity’’ alongside participants’capacity coefficient z scores, observing that participants tend tobe higher on both dimensions in the configural condition. Thisagain reinforces the validity of our measure when participants donot perform at near-ceiling accuracy. Since the choice of ‘mixed’or ‘separated’ block designs did not affect our conclusions, we pro-ceeded to test the emergent feature of Proximity using the simpler‘separated blocks’ design from experiment 1.
5. Experiment 3
5.1. Methods
5.1.1. ParticipantsTwenty-four paid individuals between the ages of 20 and 32
were recruited from the Indiana University community to partici-pate in two 50 min sessions. Two participants dropped out of thestudy after their first session, and six were removed from the studyafter the first session due to unacceptably high error rates of 30%
or greater. Of the sixteen participants that completed both ses-sions, thirteen were female, three were male, and all had normal
−10 −6 −2 0 2
−0.
4−
0.2
0.0
Control
Cz
Cp
is with the accuracy-based capacity assessment function on the y-axis. While theely see that points in the configural condition tend to be higher on both dimensions
Gestalt? Measuring emergent features with the capacity coefficient. Vision

Fig. 8. (a) Possible locations of dots in Experiment 3. Green dots denote possible locations for the left dot, and blue dots denote possible locations for the right dot. Note thatall possible locations for each dot are the same distance away from the reference location, forming an equivalence class under the metric of Euclidean distance. Single-dotstimuli were presented for every position. (b) Configural stimuli are formed by moving the dots in opposite directions (Green 1, Blue 2), increasing the distance between themby a factor of 1.72. (c) and (d) For both of these outer positions, a control stimulus was formed by moving the opposite dot such that the distance between the reference dotswas preserved.
R.X.D. Hawkins et al. / Vision Research xxx (2015) xxx–xxx 11
or corrected-to-normal vision. In accordance with the Declarationof Helsinki, the procedures were approved by local IRBs and signedconsent forms were obtained from individual participants beforethe experiment.
5.1.2. MaterialsUsing the same settings as Experiments 1 and 2, we created two
new classes of stimuli, with the dots always lying on a horizontalaxis (0�) to avoid confounds with the emergent feature ofOrientation. Fig. 8(a) displays the possible positions of each dot.Note again that each possible target position (denoted by the filledcircles) is an equal distance away from the reference position (opencircles). For each of the following classes of two-dot stimuli, corre-sponding single-dot stimuli were presented to collect responsetimes for the isolated components:
1. Configural, no line: Each dot is displaced by 0:17� of visualangle away from its initial position toward the edge of the dis-play (Green 1, Blue 2; Fig. 8(b)). This expands the initial dis-tance between reference points by a factor of 1.72, therebyinducing a change in the emergent feature of Proximity. Theappropriate degree of configural change was chosen using theresults of a pilot study measuring the d0 for different levels ofProximity change (Fig. S2).
2. Control, no line: The individual dots are displaced the sameamount as in the configural condition, but in the same direction(Green 2, Blue 2 and Green 1, Blue 1; panels c and d, respec-tively). Thus, the Proximity between the dots remains constantwhile the individual ‘channels’ contain the same informationabout location change.
3. Configural, line present: Like the other configural condition,but on double-dot trials, a line connected the two dots.
4. Control, line present: Like the other control condition, but aline connected the two dots.
2 We ran the analyses including the three low accuracy subjects. The magnitudes ofthe reported values were slightly different but none of the conclusions changed.
5.1.3. ProcedureThe task and protocol were identical to Experiment 1.
Please cite this article in press as: Hawkins, R. X. D., et al. Can two dots form aResearch (2015), http://dx.doi.org/10.1016/j.visres.2015.04.019
5.1.4. ResultsFig. 9 shows the mean response times (a) and accuracies (b) for
trials in which two dots were present along with the 95% highestdensity intervals of the posterior. The analysis of correct responsetimes for two dot stimuli indicated main effect of configuration(BF ¼ 4:6 � 1070) but very strong evidence against main effect oflines (BF ¼ 0:026) and substantial evidence against a full modelincluding an interaction relative to the model only including amain effect of configuration (BF ¼ :11). In the accuracy data, therewas decisive evidence for an interaction between the configurationand the presence of lines relative to the main effects only model(BF ¼ 1:4 � 1052). When the interaction was disregarded thereremained decisive evidence of main effects of configuration(BF ¼ 4:0 � 1043) and lines (BF ¼ 5:4 � 104).
While overall error rates were lower than 30% for all sixteenparticipants who completed the study, three participants had errorrates equal to or worse than chance when restricted to trials fromone or more of the four conditions (e.g., the configural trials withlines). Since the capacity coefficient analysis only uses responsetimes from correct responses, this potential difference in responsethresholds could bias comparisons between conditions. For the fol-lowing analysis, we only report the thirteen participants withabove chance accuracies in all conditions.2
The Bayesian ANOVA on capacity Z scores (shown in Fig. 9(c))indicated that the most likely model included both main effectsand an interaction (BF ¼ 1:3 � 108 over the subject only model).There was substantial evidence for the full model over the nextbest model, which included only main effect of configuration(BF ¼ 9:9) and strong evidence over the third best model, whichincluded both main effects (BF ¼ 12).
The mean marginal posterior advantage of configural over con-trol on the capacity z-scores was 4.44 (HDI ¼ ½3:47;5:41�). Themean posterior difference between capacity z-scores without linesand with lines was �0:778 (HDI ¼ ½�1:73;0:176�).
Participants were again generally limited capacity, with a groupaverage capacity z-score of �1:56 (HDI ¼ ½�2:92;�0:0821�). In one
Gestalt? Measuring emergent features with the capacity coefficient. Vision

No Lines Lines
Two Dot Response TimesR
T
350
450
550
650 Configural
ControlDistractor
No Lines Lines
Two Dot Accuracy
Mea
n A
ccur
acy
0.80
0.85
0.90
0.95
1.00
−6
−4
−2
02
46
Capacity Z−Scores
Cz
ConfiguralControl
No Lines Lines
(a) (b) (c)
Fig. 9. (a) Mean response times and (b) accuracy for each condition in Experiment 3 (using Proximity and separate configural and control blocks). Configural trials differedfrom the reference in Proximity as well as the location of each element. In control trials, both elements were in a different location than the reference squares, but theProximity was the same. In distractor trials, both elements were in the same location as the reference squares. (c) Mean capacity z-scores for each condition. Positive numbersindicate better than the unlimited capacity, independent, parallel baseline, while negative numbers indicate worse than the baseline. In general, higher numbers indicatemore efficient responding. In all panels, error bars indicate 95% highest density intervals of the posterior.
Table 3Results from Experiment 3 broken down by participant and condition in the same format as Table 1.
P Configural Control Single dot
Lines No lines Lines No lines
Z Acc RT Z Acc RT Z Acc RT Z Acc RT Acc RT
1 �2.29 0.98 438 0.67 0.98 533 �7.67 0.67 573 �5.36 0.66 839 0.76 5912 0.34 0.98 453 3.56 1.00 511 �3.43 0.80 485 �2.98 0.78 580 0.79 4813 5.57 0.98 465 2.83 0.98 414 0.02 0.95 531 �5.56 0.95 436 0.89 4604 �5.82 0.87 494 �1.85 0.99 302 �2.19 0.82 437 �6.53 0.78 375 0.85 4135 �1.88 1.00 297 2.30 0.99 454 �4.90 0.99 370 �6.39 1.00 583 0.93 5096 �0.83 0.98 494 0.17 0.99 424 �5.47 0.98 534 �5.92 0.96 505 0.87 5067 3.97 1.00 420 4.89 0.99 504 0.01 0.97 495 �0.97 0.98 542 0.90 5438 �4.23 1.00 478 2.31 1.00 540 �8.36 0.98 549 �5.97 0.97 627 0.83 6819 �3.03 0.99 730 �1.90 1.00 570 �4.32 1.00 630 �6.13 1.00 551 0.92 641
10 2.06 0.99 510 2.45 1.00 342 0.52 1.00 493 �0.39 0.99 458 0.88 53811 �5.03 1.00 395 �0.33 1.00 461 �5.16 0.99 465 �5.15 0.98 496 0.90 56212 0.87 1.00 394 2.91 0.98 498 �3.37 0.92 446 �2.46 0.97 532 0.85 51213 3.60 0.92 778 7.34 0.99 590 �1.47 0.81 960 0.13 0.97 704 0.71 840
12 R.X.D. Hawkins et al. / Vision Research xxx (2015) xxx–xxx
condition, configural without lines, performance wassuper-capacity at the group level (Cz ¼ 1:95, HDI ¼ 0:0193;3:45�).There were also a few participants whose individual data indicatedsuper capacity in the configural condition with lines, but none ineither of the control conditions (see Table 3).
5.1.5. DiscussionFirst, the capacity coefficient measure is again larger in the con-
figural condition than the control condition, indicating thatProximity is indeed an emergent feature providing additionalinformation above and beyond the contribution of the individualdot locations. The accuracy interaction was again present and stillhad a limited effect size, however the crossover from Experiment 2is not evident in these data. Instead, the accuracy effect seems to bedriven by a larger magnitude drop in the distractor correct rejec-tions between the ‘line’ and ‘no lines’ conditions.
In Fig. 10, we plot ‘‘accuracy capacity’’ alongside participants’z-score capacity values from Experiment 3 toobtainSupplemental information about configural processing frompatterns of errors. We observe that participants tend to be higheron both dimensions in the configural condition, corroborating thestatistical tests above.
Unlike the previous two experiments focusing on Orientation,however, we also see an interaction between the line manipulationand the configural condition on the capacity z-scores. In
Please cite this article in press as: Hawkins, R. X. D., et al. Can two dots form aResearch (2015), http://dx.doi.org/10.1016/j.visres.2015.04.019
Experiments 1 and 2 there was weak evidence against an effectof lines and substantial evidence against an interaction. The benefitof the configural cue of Proximity compared to the control condi-tion, measured in terms of capacity, was greater when the two dotswere not connected by a line. The presence of a line appears toinhibit the contribution of configural information. This is the oppo-site of the interaction predicted by the local theory, and also by theliterature on redundant signals, which suggest that the presence ofadditional explicit cues should improve detection.
The most likely account of this interaction is through theGestalt phenomenon of ‘element connectedness’ (Palmer & Rock,1994), where connecting two dots by a line segment strengthenstheir tendency to be grouped together. Our Proximity manipula-tion causes the dots to appear farther apart (due to increased phys-ical distance), while the grouping effect due to connectedness maycause the dots to appear closer together (albeit in psychologicaldistance). This counteracting force would lead to a weaker effectin the ‘lines’ condition than the ‘no lines’ condition, where no addi-tional grouping effect was present. Interestingly, element connect-edness does not seem to affect performance in the controlcondition, where Proximity stays constant. While there have beenrigorous psychophysical studies of the strength of grouping byProximity as a function of distance (Kubovy, Holcombe, &Wagemans, 1998), there is no psychophysical data about theimpact of element connectedness on the perception of Proximity.
Gestalt? Measuring emergent features with the capacity coefficient. Vision

−5 0 5
−0.
4−
0.2
0.0
0.2
Configural
Cz (RT−based)
Cp
(Acc
urac
y−ba
sed)
LinesNo Lines
−5 0 5
−0.
4−
0.2
0.0
0.2
Control
Cz
Cp
Fig. 10. Experiment 3 scatter plot comparing the capacity coefficient on the x-axis with the accuracy-based capacity assessment function on the y-axis. While the accuracymeasure does not yet have formal statistical tests worked out, we can qualitatively see that points in the configural condition tend to be higher on both dimensions than inthe control condition.
R.X.D. Hawkins et al. / Vision Research xxx (2015) xxx–xxx 13
Some evidence against this account, however, comes from Han,Humphreys, and Chen (1999), who used a global letter discrimina-tion task to show that grouping elements by Proximity can be asfast and efficient as grouping by connectedness. They found no dif-ference between a condition using only Proximity cues and a con-dition using both Proximity and connectedness cues. In theirexperiments, though, Proximity and connectedness were not putin opposition; furthermore, since element connectedness has onlybeen discussed in the context of global grouping tasks, we cannotexpect these results to generalize exactly to psychophysicalchange-detection tasks settings in which only two elements arepresent. Our task is an example where multiple Gestalt principlescome into conflict, which remains an important direction for fur-ther investigation.
6. General discussion
In all three experiments, we used the capacity coefficient as adiagnostic measure to show that the Gestalt theory of features pro-vides a better explanation of the data than the local theory. Whenthere is a change in emergent features of Orientation or Proximity,the perceptual system experiences gains in efficiency that cannotbe accounted for in terms of how it processes the parts.Moreover, the presence of an explicit line does not provide anyinformation not already present in emergent features betweendots, and in the case of Proximity actually inhibits processing.This comparison of the whole against the sum of the parts has beenat the core of Gestalt theory since its inception, and the capacitycoefficient provides a way of rigorously integrating how the partsare processed to make predictions about the whole.
We now turn to some details of our results that raise interestingquestions for future work. First, note that while Cz was much largeron configural trials than on control trials, there was still high vari-ation across individuals. This is troubling for a natural characteri-zation of configurality as high absolute performance relative tothe parallel independent race model. Often, participants were stillperforming with limited capacity (Cz < 0), in the configural condi-tion, which implies less efficiency than if local information wasprocessed independently. One explanation for this effect is theexistence of attentional factors that may interfere with processingand generally reduce workload capacity. However, because anysuch factors affect all trials evenly, it does not affect our compar-ison with control trials. Hence, when modeling the contributionof emergent features, we should be careful to measure degrees ofconfigurality – as we did here – instead of making an absolutejudgement.
Please cite this article in press as: Hawkins, R. X. D., et al. Can two dots form aResearch (2015), http://dx.doi.org/10.1016/j.visres.2015.04.019
If the model containing only local information does not accountfor the data, we are left with the question of what model is appro-priate. The SFT framework, and the capacity coefficient in particu-lar, naturally suggests several candidates. These models areunequivocally in the information-processing paradigm, andembody different hypotheses about the sources of information,the order of processing that information, and the way that infor-mation is ultimately combined into a decision. All of these aspectsof information-processing are intimately tied into the SFT frame-work and can most easily be framed in terms of its stochasticprocess-based measures. Further work is needed to distinguishamong them, and we suggest some potential variations of ourchange-detection task that may do so.
1. Additional Channels: Emergent features like Orientation andProximity could constitute separate sources of informationand ‘‘race’’ in parallel against local information coming fromthe individual dots. Under this theory, configural effects appearwhen channels containing information higher-order featuresoverpower the channels containing local information in thatrace. It has recently been suggested that topological similaritymay play such a role (Eidels, Townsend & Pomerantz, 2008;Pomerantz, 2003), and is also implicitly endorsed byPomerantz and Portillo’s (Pomerantz & Portillo, 2011) Theoryof Basic Gestalts, which posits direct detectors for emergent fea-tures. This model also has the advantage of generalizing easilyto more complex stimuli (e.g. three or more dots), with addi-tional higher-order features like co-linearity or symmetry suc-cessively overpowering lower-order features. Its potentialscalability makes it a promising contender for implementationin a computer vision system. However, other properties of therace remain unclear, such as the degree of facilitatory and inhi-bitory interaction between channels (Eidels et al., 2011).
2. Configuration-First Processing: The visual system first takesholistic features like Orientation or Proximity into accountand only examines local information if the holistic featuresare not informative enough to make the decision. There wassome support for this model in the mixed design ofExperiment 2. Recall that we found a decrease in processingefficiency for control trials when mixed together with configu-ral trials, as compared to the same trials in Experiment 1, whereparticipants could plausibly use a ‘‘location-only’’ strategy. The‘‘configuration-first’’ model could be more carefully testedagainst the ‘‘additional channels’’ model by designing new stim-uli in which Orientation or Proximity changes the same amountas in the present study, but the degree of location change of the
Gestalt? Measuring emergent features with the capacity coefficient. Vision

14 R.X.D. Hawkins et al. / Vision Research xxx (2015) xxx–xxx
individual dots is much larger. Top-down processing predictsthat there would be no difference in the results, since the infor-mation from individual dots would not be considered. However,the additional-channels model predicts that given enough of aboost, the channel containing local information could over-power the configural channel.
3. Coactivation: The location information from each dot could poolinto a common channel that takes featural information intoaccount (Colonius & Townsend, 1997; Miller, 1982). This modelis theoretically appealing since it specifies an internal transfor-mation by which local, physical information is transformed intohigher-order percepts. However, our findings that stimuli con-taining emergent features are processed with limited capacityrule out this model, which predicts super capacity (Townsend& Nozawa, 1995). Coactivation was also recently ruled out asa viable model for configural processing because of its inabilityto predict behavior in trials containing distractors (Eidels,Townsend & Pomerantz, 2008).
We expect that SFT and the capacity coefficient will be instru-mental in distinguishing between these models. SFT was initiallydeveloped precisely because of the critical mimicry problems fac-ing traditional measures and analyses. For example, mean reactiontime and accuracy measures famously cannot distinguish betweenparallel and serial architectures in domains like visual search(Townsend & Wenger, 2004). Although it may not be technicallyimpossible to distinguish between the three specific models pre-sented in our General Discussion using traditional measures, weworry about the historical failings of these measures, and expectthe tools introduced in this paper to pose fewer problems downthe road.
In conclusion, we have presented strong evidence from a newexperimental task, with inferences drawn using the powerful mod-eling approach of the capacity coefficient, that the simple emergentfeatures of Orientation and Proximity between two dots confers abenefit to efficiency above and beyond the contribution of its com-ponent parts. Although these features are not local, physical prop-erties of the stimulus, their contribution is indistinguishable from(and sometimes more efficient than) the local information pro-vided by the Orientation and length of an explicit line. By illustrat-ing the critical role that the capacity coefficient played in ourformalization and testing of Gestalt and local theories in this sim-ple domain, we set the foundation for further work systematicallyinvestigating the processing of emergent features.
Appendix A. Supplementary data
Supplementary data associated with this article can be found, inthe online version, at http://dx.doi.org/10.1016/j.visres.2015.04.019.
References
Algom, D., Eidels, A., Hawkins, R. X. D., Jefferson, B., & Townsend, J. T. (2015).Features of response times: Identification of cognitive mechanisms throughmathematical modeling. In J. R. Busemeyer, Z. Wang, J. T. Townsend, & A. Eidels(Eds.), The Oxford Handbook of Computational and Mathematical Psychology(pp. 63–98). New York City, NY: Oxford University Press.
Altieri, N., & Townsend, J. T. (2011). An assessment of behavioral dynamicinformation processing measures in audiovisual speech perception. Frontiersin Psychology, 2.
Austerweil, J. L., & Griffiths, T. L. (2011). A rational model of the effects ofdistributional information on feature learning. Cognitive Psychology, 63(4),173–209.
Biederman, I. (1987). Recognition-by-components: A theory of human imageunderstanding. Psychological Review, 94(2), 115.
Blaha, L. M. (2011). A dynamic Hebbian-style model of configural learning(Unpublished doctoral dissertation), Indiana University.
Please cite this article in press as: Hawkins, R. X. D., et al. Can two dots form aResearch (2015), http://dx.doi.org/10.1016/j.visres.2015.04.019
Blaha, L. M., Busey, T., & Townsend, J. T. (2009). An LDA approach to the neuralcorrelates of configural learning. In Proceedings of the 31st annual conference ofthe cognitive science society. Austin, TX: Cognitive Science Society.
Blum, A. L., & Langley, P. (1997). Selection of relevant features and examples inmachine learning. Artificial Intelligence, 97(1), 245–271.
Brunelli, R., & Poggio, T. (1993). Face recognition: Features versus templates. IEEETransactions on Pattern Analysis and Machine Intelligence, 15(10), 1042–1052.
Burns, D., Houpt, J., & Townsend, J. (2010). Facial perception as a configural process.Journal of Vision, 10(7). 688–688.
Colonius, H., & Townsend, J. T. (1997). Activation-state representation of models forthe redundant-signals-effect. In A. A. J. Marley (Ed.), Choice, decision, andmeasurement: Essays in honor of R. Duncan Luce (pp. 245–254). Mahwah: NJLawrence Erlbaum Associates Publishers.
Eidels, A., Houpt, J. W., Altieri, N., Pei, L., & Townsend, J. T. (2011). Nice guys finishfast and bad guys finish last: Facilitatory vs. inhibitory interaction in parallelsystems. Journal of Mathematical Psychology, 55(2), 176–190.
Eidels, A., Townsend, J. T., & Pomerantz, J. R. (2008). Where similarity beatsredundancy: The importance of context, higher order similarity, and responseassignment. Journal of Experimental Psychology: Human perception andperformance, 34(6), 1441–1463.
Forster, K. I., & Forster, J. C. (2003). Dmdx: A windows display program withmillisecond accuracy. Behavior Research Methods, Instruments, & Computers,35(1), 116–124.
Garner, W. R. (1974). The processing of information and structure. Lawrence Erlbaum.Gold, J. M., Mundy, P. J., & Tjan, B. S. (2012). The perception of a face is no more than
the sum of its parts. Psychological Science, 23(4), 427–434.Han, S., Humphreys, G. W., & Chen, L. (1999). Uniform connectedness and classical
gestalt principles of perceptual grouping. Perception & Psychophysics, 61(4),661–674.
Hendrickson, A. T., & Goldstone, R. L. (2009). Perceptual unitization in part-wholejudgments. In Proceedings of the thirty-first annual conference of the cognitivescience society (pp. 1084–1089). Amsterdam, Netherlands: Cognitive ScienceSociety.
Houpt, J. W., & Townsend, J. T. (2012). Statistical measures for workload capacityanalysis. Journal of Mathematical Psychology, 56(5), 341–355.
Houpt, J. W., Townsend, J. T., & Donkin, C. (2014). A new perspective on visual wordprocessing efficiency. Acta Psychologica, 145, 118–127.
Jeffreys, H. (1961). The theory of probability. Oxford University Press.Kimchi, R., Behrmann, M., & Olson, C. (2003). Perceptual organization in vision:
Behavioral and neural perspectives. Taylor & Francis.Kruschke, J. K. (1992). Alcove: an exemplar-based connectionist model of category
learning. Psychological Review, 99(1), 22.Kubovy, M., & Gepshtein, S. (2003). Perceptual grouping in space and in space-time:
An exercise in phenomenological psychophysics. In R. Kimchi, M. Behrmann, &C. R. Olson (Eds.), Perceptual organization in vision: Behavioral and neuralperspectives (pp. 45–86). Mahwah, NJ: Lawrence Erlbaum Associates Publishers.
Kubovy, M., Holcombe, A. O., & Wagemans, J. (1998). On the lawfulness of groupingby proximity. Cognitive Psychology, 35(1), 71–98.
Larsson, J., Amunts, K., Gulyás, B., Malikovic, A., Zilles, K., & Roland, P. E. (1999).Neuronal correlates of real and illusory contour perception: Functional anatomywith PET. European Journal of Neuroscience, 11(11), 4024–4036.
Li, J., & Allinson, N. M. (2008). A comprehensive review of current local features forcomputer vision. Neurocomputing, 71(10), 1771–1787.
Luck, S. J., & Vogel, E. K. (1997). The capacity of visual working memory for featuresand conjunctions. Nature, 390(6657), 279–281.
Miller, J. (1982). Divided attention: evidence for coactivation with redundantsignals. Cognitive Psychology, 14(2), 247–279.
Miller, J. (1991). Channel interaction and the redundant-targets effect in bimodaldivided attention. Journal of Experimental Psychology: Human Perception andPerformance, 17(1), 160.
Moore, C. M., & Egeth, H. (1998). How does feature-based attention affect visualprocessing? Journal of Experimental Psychology: Human Perception andPerformance, 24(4), 1296.
Navon, D. (1977). Forest before trees: The precedence of global features in visualperception. Cognitive Psychology, 9(3), 353–383.
Nosofsky, R. M. (1986). Attention, similarity, and the identification–categorizationrelationship. Journal of Experimental Psychology: General, 115(1), 39.
Orsten, K., & Pomerantz, J. R. (2012). False pop out: Evidence of configuraldisruption in conventional pop out. Journal of Vision, 12(9). 1287–1287.
Palmer, S. (1999). Vision science: Photons to phenomenology. Cambridge, MA: MITPress.
Palmer, S., & Rock, I. (1994). Rethinking perceptual organization: The role ofuniform connectedness. Psychonomic Bulletin & Review, 1(1), 29–55.
Peck, A. (2006). Beginning gimp: From novice to professional. Apress.Pinker, S. (1984). Visual cognition: An introduction. Cognition, 18(1), 1–63.Pomerantz, J. R. (1983). Global and local precedence: Selective attention in
form and motion perception. Journal of Experimental Psychology: General,112(4), 516.
Pomerantz, J. R. (2003). Wholes, holes, and basic features in vision. Trends inCognitive Sciences, 7(11), 471–473.
Pomerantz, J. R., & Kubovy, M. (1986). Theoretical approaches to perceptualorganization. In K. R. Boff, L. Kaufman, & J. P. Thomas (Eds.), Handbook ofperception and human performance (pp. 1–46). New York: John Wiley & Sons.
Pomerantz, J. R., & Portillo, M. C. (2011). Grouping and emergent features in vision:Toward a theory of basic gestalts. Journal of Experimental Psychology: HumanPerception and Performance, 37(5), 1331–1349.
Gestalt? Measuring emergent features with the capacity coefficient. Vision

R.X.D. Hawkins et al. / Vision Research xxx (2015) xxx–xxx 15
Pomerantz, J. R., & Portillo, M. (2012). Emergent features, gestalts, and featureintegration theory. In J. Wolfe & L. Robertson (Eds.), From perception toconsciousness: Searching with Anne Treisman (pp. 187–192). New York, NY:Oxford University Press.
Pomerantz, J. R., Sager, L. C., & Stoever, R. J. (1977). Perception of wholes and of theircomponent parts: Some configural superiority effects. Journal of ExperimentalPsychology: Human perception and performance, 3(3), 422–435.
Rogosky, B. J., & Goldstone, R. L. (2005). Adaptation of perceptual and semanticfeatures. In L. A. Carlson & E. van der Zee (Eds.), Functional features in languageand space: Insights from perception, categorization and development(pp. 257–273). Oxford: England Oxford University Press.
Rouder, J. N., Morey, R. D., Speckman, P. L., & Province, J. M. (2012). Default bayesfactors for anova designs. Journal of Mathematical Psychology, 56(5), 356–374.
Schyns, P. G., Goldstone, R. L., & Thibaut, J.-P. (1998). The development of features inobject concepts. Behavioral and Brain Sciences, 21(01), 1–17.
Tanaka, J. W., & Farah, M. J. (1993). Parts and wholes in face recognition. TheQuarterly Journal of Experimental Psychology, 46(2), 225–245.
Tanaka, J. W., & Farah, M. J. (2003). The holistic representation of faces. In M. A.Peterson & G. Rhodes (Eds.), Perception of faces, objects, and scenes: Analytic andholistic processes (pp. 53–74). New York: Oxford University Press.
Townsend, J. T. (1990a). Serial vs. parallel processing: Sometimes they look liketweedledum and tweedledee but they can (and should) be distinguished.Psychological Science, 1(1), 46–54.
Townsend, J. T. (1990b). Truth and consequences of ordinal differences in statisticaldistributions: Toward a theory of hierarchical inference. Psychological Bulletin,108(3), 551.
Townsend, J. T., & Altieri, N. (2012). An accuracy–response time capacity assessmentfunction that measures performance against standard parallel predictions.Psychological Review, 119(3), 500.
Please cite this article in press as: Hawkins, R. X. D., et al. Can two dots form aResearch (2015), http://dx.doi.org/10.1016/j.visres.2015.04.019
Townsend, J. T., & Eidels, A. (2011). Workload capacity spaces: A unifiedmethodology for response time measures of efficiency as workload is varied.Psychonomic Bulletin & Review, 18, 659–681.
Townsend, J. T., & Nozawa, G. (1995). Spatio-temporal properties of elementaryperception: An investigation of parallel, serial, and coactive theories. Journal ofMathematical Psychology, 39, 4.
Townsend, J. T., & Wenger, M. J. (2004). The serial-parallel dilemma: A case study ina linkage of theory and method. Psychonomic Bulletin & Review, 11(3), 391–418.
Townsend, J. T., & Wenger, M. J. (2004b). A theory of interactive parallel processing:New capacity measures and predictions for a response time inequality series.Psychological Review, 111(4), 1003–1035.
Treisman, A. (1988). Features and objects: The fourteenth bartlett memorial lecture.The Quarterly Journal of Experimental Psychology, 40(2), 201–237.
Treisman, A., & Gelade, G. (1980). A feature-integration theory of attention.Cognitive Psychology, 12(1), 97–136.
Treisman, A., & Paterson, R. (1984). Emergent features, attention, and objectperception. Journal of Experimental Psychology: Human Perception andPerformance, 10(1), 12.
Von der Heydt, R., Peterhans, E., & Baumgartner, G. (1984). Illusory contours andcortical neuron responses. Science, 224(4654), 1260–1262.
Wenger, M., & Townsend, J. T. (2001). Faces as gestalt stimuli: Processcharacteristics. In M. Wenger & J. T. Townsend (Eds.), Computational,geometric, and process perspectives on facial cognition: Contexts and challenges(pp. 229–284). Erlbaum Press.
Wolfe, J. M. (1994). Guided search 2.0: A revised model of visual search.Psychonomic Bulletin & Review, 1(2), 202–238.
Wolfe, J. M., & Horowitz, T. S. (2004). What attributes guide the deployment ofvisual attention and how do they do it? Nature Reviews Neuroscience, 5(6),495–501.
Gestalt? Measuring emergent features with the capacity coefficient. Vision