Embed Size (px)
Citation preview

1
Can Menu Costs Justify Inflation?
Peter Sinclair1
31 July 2003
(please do not quote without permission)
Bank of England and University of Birmingham
1 I should like to thank Peter Andrews, Ian Bond, Roger Clews, John Fender, Francesco Giavazzi, BenMcCallum, Lavan Mahadeva and Tony Yates very much for helpful discussions, but to absolve them fromblame from any errors; and also to express gratitude to the Trustees of the Houblon Norman Fund for theopportunity to conduct this research.

2
1. Introduction and summary of the argument
The most celebrated answer to the question, What should the rate of inflation be, is Milton
Friedman’s. He argued (1969) that the trend in the price level should be negative, at the real
rate of interest. Only then will real money balances go untaxed, and in an ideal economy that
must be best. An immense subsequent literature has sometimes qualified this result. But, as
Lucas (2000) shows, detailed analysis usually shows Friedman’s rule to be remarkably robust.
The issue in this paper is whether menu costs can overturn it.
Nominal rigidities are an acknowledged fact of economic life, and any model of inflation (or
deflation) needs to take them into account. There are many possible explanations for them.
The simplest of these is menu costs, the real costs of altering nominal prices2. Menu costs are
triggered whenever nominal prices are changed. It makes sense to assume that they are
independent of the size of the price change, and that they vary little, if at all3, with the volume
or value of sales for the product.
In an ideal economy, the optimum rate of price deflation is the real rate of interest. The
Friedman rule is absolutely unassailable in these circumstances. The real interest rate is
normally positive. Given this, the Friedman rule prescribes negative inflation. It may be an
open question, however, whether they carry over to a world with distortions and rigidities of
various kinds.
2 Nominal rigidities may be explained by various phenomena, including regulation and administration bygovernment, about which Dexter et al (2002) provide important evidence. But even these can be thought of asa form of menu cost.3 In the present paper, they are assumed to be wholly fixed.

3
If it is costly for a firm to alter its prices, the firm must enjoy the power to set, and revise those
prices. So menu costs testify to the presence of some element of monopoly power. The most
natural hypothesis for firms’ behaviour is that they aim to maximize profit. In the absence of
perfect price discrimination or perfect contestability, profit maximization by a firm with market
power will lead to prices above marginal cost. This will normally entail a direct, first-order
welfare loss.
If it is profit maximization that guides price-setting, it is only natural that it should also extend
to the determination of the interval of time between nominal price revisions. That interval
should not, then, be treated as exogenous4. This reasoning implies that the length of the interval
is not constant, but will normally5 shrink with an increase in the modulus of the difference
between the rate of inflation and zero. In fact the relationship is inelastic. (When the real
interest rate is zero or non-zero, an octupling of the rate of inflation or deflation roughly halves
the interval between optimized price revisions). So the elasticity of the optimal interval to the
rate of inflation (or deflation) is typically about two thirds.
A positive real interest rate implies that, when inflation is positive, firms worry somewhat more
about the profits sacrificed due to overpricing early on in this interval, than about the adverse
effects of underpricing later. This means that real average prices will tend to fall as the rate of
inflation increases, at least over a range of low inflation rates, when the interval between
revisions becomes large. By contrast, negative inflation makes for larger average real prices.
With discounting, initial underpricing assumes greater importance in the eyes of the firm’s 4 Calvo (1983) assumes that any firm has a given and known probability of being able to alter its nominal priceat each date. This is a very useful simplification in many models, and is widely employed (recently in thecontext of optimum inflation by Khan et al (2002) for example). But the notion that this probability isindependent of the rate of inflation is strongly counter-intuitive.5 Sheshinski and Weiss construct an example of piecewise linear, kinked product demand makes for a non-monotonic relationship between the rate of inflation, and the duration of the interval between price revisions.But this is exceptional.
4
owner than later overpricing. The size of this effect is most pronounced when the interval
between price revisions is long, that is, when the rate of inflation is almost zero.
Strictly positive inflation could well, then, generate welfare gains, and these may well be large
enough to offset the resulting menus costs generated. Similarly, strictly negative inflation will
tend to be deleterious for welfare. On the other hand, the waste introduced by a distortionary
tax on currency (which arises whenever inflation exceeds minus the real interest rate) will have
to be taken into account, and may qualify or negate this observation.
Quite independent of the effect inflation exerts on average real prices, it will also cause
systematic movements in real prices during the interval between nominal price changes. The
welfare effects of these can often be negative, and allowance needs to be made for them.
In the absence of discounting, so that the real interest rate is vanishingly small, it may still be
true that inflation lowers average real prices. But the relationship can go either way. A
boundary condition at which there is no effect will be identified. And in the absence of
discounting, it will be seen that the net welfare effect of both inflation and deflation is almost
invariably negative.
With discounting, however, it is at least possible that a sufficiently modest rate of inflation
raises welfare above the level that would be attained under the Friedman rule. It will be seen
that the Friedman rule delivers higher welfare than at least some slower rates of price deflation,
however, and that, in the absence of a productivity trend, the welfare maximizing rate of

5
inflation – if positive – is extremely small. Typically, it is a miniscule fraction (of about half of
one thousandth) of the real interest rate6.
Productivity gains are typically more widespread, and larger, in manufacturing than in services.
Manufacturing also often tends to display weaker competition. In fact, long suspected two-way
links may connect monopoly with technical progress, and the productivity gains it permits. If
firms confronting menu costs display a common positive productivity trend, the optimum
inflation rate (if positive) increases virtually one-for-one with that trend when product demand
is isoelastic. In simple cases, menu costs are minimized when the average rate of inflation in
the rest of the economy is set to equal this productivity trend, because nominal prices will then
never have to be revised. The optimum inflation rate (if positive) is normally just a very little
higher than this. Large enough shoe leather costs will, however, always save the Friedman
rule. The rate of inflation should then equal minus the real rate of interest. There is no
compromise, though: inflation at a smaller negative rate, or at a positive rate below the rate of
growth of productivity, will typically be worse than at the Friedman point, and may well be a
good deal worse than when it is slightly above the productivity growth rate.
When productivity trends differ across price-setting firms, and shoe leather costs are weak
enough for the Friedman rule to be dominated, optimum inflation may be close to the fastest
productivity trend.
6 The result that the optimum rate of inflation may be strictly positive can arise in other contexts – mostconspicuously, perhaps, in search models, such as Diamond’s (1993). For Diamond, this is not just apossibility – it is guaranteed. And it happens because inflation has some tendency to lower average real pricescharged by monopolists – precisely the phenomenon explored in the present paper.
Khan et al (2002) also argue, in a search setting, that Friedman’s Rule is suboptimal, but that slower rates ofprice deflation (and not inflation) are best. The latter paper relies, however, upon Calvo pricing. By contrast,the current paper assumes that firms are free to reprice whenever they wish, at a fixed cost. A further twist tothe search approach is the idea that the duration of contracts is reduced by inflation, which must therefore bewelfare-reducing, is due to Fershtman et al (2003). That paper relies, however, on a simplifying assumption thatthe real interest rate is zero, and the present paper reaches the same conclusion under that assumption. Whethera positive real interest rate allows the possibility that sufficiently modest inflation could be optimal in theFershtman set up – as it does in the present paper – is a moot point not yet resolved.

6
The structure of the paper is as follows. Section 2 explores the codetermination of prices and
price revision intervals when the real interest rate is zero. This assumption is repealed in
Section 3. Section 4 analyses the consequences of altering the elasticity of demand, and the
partial equilibrium setting of these three sections is replaced by a small general model in
Section 5. Section 6 examines what happens when a productivity trend is introduced, and
conclusions, qualifications and further observations are gathered in Section 7.
2 Partial equilibrium, when the real interest rate is zero
Let us begin by examining a world with no real discounting7. We shall assume that D(p(t))
represents the demand for a product whose real price is p(t) at date t. Let T denote an interval
during which nominal prices are fixed. Suppose that there is a constant marginal cost of
production, c, and that storage is prohibitively expensive for the producer or his customers, so
D(p(t)) represents production as well as sale of output. If p denotes the initial real price, � the
rate of inflation, taken to be constant and known, and T the optimal duration of the interval
between price changes, p will be chosen to maximize the following integral between T and 0:
� = ��
T
T0
1 [ ctp �� }exp{ � ] exp{( pD dtt})�� . (1)
Let � * be the value of this integral maximized with respect to p . T will meanwhile be chosen
to maximize
)/*( Tz�� . (2)

7
Here, z is the (real) menu cost that will be incurred at the end of the interval between price
revisions, an interval taken to have just begun at 0 . The resulting first order condition gives an
implicit solution for T :
)]/*( nTTz ����� � . (3)
Inflation can affect welfare under these conditions in a number of ways. First, menu costs are
minimized when � vanishes, because nominal prices will not then ever have to be reset.
Second, inflation generates a systematic variation in prices, which may or may not be welcome
for the consumers of the product, or the owners of the firm producing it. Thirdly, the average
real price set may change as a result of inflation.
Let us explore the last of these effects first. There is a special case when this effect does not
materialize. This is when marginal cost vanishes, and demand for the product is of the form
�� exp{�D )/�P , where P denotes price. This demand curve has the special characteristic of a
constant semi-elasticity of demand to price ( PnD ��� /� ) and a partial equilibrium expression
for consumers’ surplus that is linear in P . When the real price starts off at p , and then drifts
downward during the interval between nominal price adjustments at the rate � , the resulting
expression for � can be integrated with respect to time, and differentiated with respect to p to
give a constant real price of � .
When the semi-elasticity of demand increases with price, as arises for example when demand
is linear, the average real value of the product price decreases when inflation increases. The
7 The early formal work on this subject – and extensions where real interest rates are positive - was by Barro(1972) and Sheshinski and Weiss (1977). The focus in both these papers is, however, positive rather thannormative (aside from some closing remarks).

8
opposite is true when the semi-elasticity of demand decreases with price, as for example when
demand is isoelastic. A reduction (rise) in the average real price is prima facie welfare-
increasing (reducing), given the presence of a profit-maximizing monopolist who is charging
more than marginal cost already.
What may be gained from lower average real prices8, can, however, get swamped by what is
lost due to the variation in real prices. When this second effect, and the effect of menu costs
are both added in, it turns out (with one minor exception to which we shall turn in a moment)
that welfare is maximized with an inflation rate of zero. This is also true when demand
semielasticity decreases in price; and, in both cases, negative inflation is just as bad as – in fact,
infinitesimally worse than - positive inflation. Zero inflation here corresponds, incidentally, to
the Friedman rule that the rate of deflation should equal the real rate of interest, since real
interest is itself zero. Consequently, the absence of a real interest rate is sufficient (in the
presence of menu costs) for confirming the Friedman rule.
The partial equilibrium welfare consequences of the second and third effects of inflation are
interesting. Here is an illustration of two cases: (a) when demand elasticity is constant at 2, and
(b) when demand is linear.
In the first of these two cases, an inflation rate of zero minimizes the average real price.
Departures in either direction increase it. The average real price always affects net welfare
(average real profits net of menu costs, plus consumer’s surplus) negatively. So from a purely
average real price standpoint, welfare is highest with zero inflation. Price volatility, on the
other hand, which any departure from zero inflation increases, exerts a positive effect on net
welfare (except when the rate of inflation is extremely close to zero - lower than 0.00005 in

9
absolute value). The gain that faster inflation (or deflation) generally brings to welfare is,
however, almost never sufficient to offset the negative effect via average real prices.
In the second case of linear demand, a zero rate of inflation maximizes the average real price.
Positive or negative inflation thus contributes to a rise in net welfare from this viewpoint. Price
volatility is, however, welfare-reducing. Zero inflation is best from the price volatility angle.
Unlike the effect on average real prices, the effect of price inflation and deflation is not quite
symmetrical. Taking the two effects together, the second effect is almost always stronger than
the first. There is just one exception: this is the range for the inflation rate between plus
0.00012 and minus 0.00012. Here welfare exceeds its value when inflation is zero, as the
volatility effect of inflation is dominated by the average real price effect in this region.
Relative maxima for welfare occur close to plus and minus 0.0001. Of this pair, the slightly
negative inflation rate yields a little higher welfare than the positive one, and zero inflation
provides a relative minimum for welfare.
Friedman’s rule of price deflation at the real rate of interest implies that inflation should be
zero in both these cases. And in these two cases, Friedman’s rule dominates non-trivial rates of
price inflation or deflation. But when demand is linear, tiny rates of either positive or negative
inflation can improve, just a little, upon the Friedman rule; of the two, the latter has a slight
edge.
8 And will be, when demand semielasticity increases with price.

10
Unless specified to the contrary, we shall assume that the real rate of interest – introduced in
the following section – is three per cent, and also that, when inflation is also at this rate, the
size of the menu cost is such that the time interval between price adjustments is one year9.
3 Partial equilibrium, when the real interest rate is positive
Menu costs imply that real prices will almost always be too high or too low from the standpoint
of maximum profit. There is but one fleeting moment in the gap between revisions when they
will equal what they would have been, had the firm been able to reset its nominal price
continuously. In the absence of a real rate of interest, the profits sacrificed during the interval
between price changes, a sacrifice necessitated by menu costs, are treated symmetrically. With
a positive real interest rate, profits sacrificed earlier weigh more heavily in the calculus of the
firm’s owners than profits sacrificed later on. This has very little significance when the interval
is brief, as it will be when inflation is rapid. But it becomes especially important when the rate
of inflation (or deflation) is very small, because the gap in time between nominal price changes
will be large.
A miniscule positive rate of inflation will be associated with a very long gap between price
revisions. For the first half or so of this interval, the real price will be higher than it would
have been in the absence of menu costs. Profits lost through overcharging in this period will
matter much more than what is sacrificed due to undercharging later on. So the firm will
respond by setting a lower initial real price.
9 This assumed frequency of price changes is somewhat lower than in the base line of model of Golosov andLucas (2003). Here, under determinstic quarterly inflation at one per cent annually, and a real rate of interest offour per cent, 23 per cent of firms change nominal prices each month. The Klenow and Krystov’s evidence(2002) on which their model is calibrated has nearly 22% of firms changing price each month when annualinflation is 3.66%. Our model implies that just over one tenth of firms would change their nominal prices eachmonth with quarterly inflation at 1 per cent. Our paper differs from Golosov and Lucas, however, in assumingthat the elasticity of demand (when constant) is two, rather than (in their benchmark case) seven. Raisingdemand elasticity has the effect of increasing the frequency of price changes.

11
One should therefore expect that a rise in the rate of inflation should lower the average real
price charged when the inflation rate is very low, but positive. Furthermore, this should apply
not just to the case where the semi-elasticity of demand increases in price, as in the previous
section, but to the case when it falls as price rises, too.
When the rate of inflation is appreciable, however, this effect should be countered – and
perhaps swamped – by an opposite tendency. Faster inflation will reduce the interval between
price revisions. This will diminish the force of the above argument. The real price will be too
high, from a profit maximizing standpoint, for progressively shorter periods as the rate of
inflation goes up. And the early overcharging, while it still receives more weight than later
undercharging, will receive progressively smaller emphasis as this interval shrinks. The
average real price may still be less than it would have been without inflation, but the marginal
effect of higher inflation upon it could well swing positive.
Are these expectations fulfilled? Consider first the case where demand has a constant elasticity
of two. What happens to average real prices? While they are less than their zero-inflation value
of double marginal cost with inflation rates up from zero to 0.015, half the real interest rate, the
marginal effect of higher inflation is to raise average real prices when inflation exceeds about
one thousandth of this value. These results come from amending (1), (2) and (3) to take
account of the positive real interest rate r , and specializing the demand function to
)2exp{)( 2 taptD ��
� . First the firm sets its initial real price, p , to maximize
�� dttaprtctrpT
}2exp{})exp{})(exp{(0
2���
�
���� . (4)

12
This implies that ))((/))2((2 �� ����� rTNrTcNp , and ))2((4/))](([ 2 ��� ����� rTcNrTNaT .
Here, )(xN is the Naperian transform xx /]1}[exp{ � . The next step is to set T to maximize the
discounted present value of the infinite sequence of � net of menu costs:
})exp{(}]exp{1[ 1 rTzrT ����
� � . (5)
Hence T solves
nTrTNz ����� /)( �� . (6)
When 03.0�� r� at 1�T , (6) implies that caz 4/00014999.0� .
Scrutiny reveals that P , the average real price, will equal c2 in two cases: when the rate of
inflation equals half the real rate of interest (0.015), and when there is no inflation at all. If
prices drift downward, or upward at a rate greater than half the real interest rate, P will exceed
c2 . But for positive inflation rates less than 0.015, P is less than c2 . The value of P is given by
))]((/[)]())][2(([2 rTNTNrTNcP ���� ��� . (7)
The average real price reaches its minimum with an inflation rate of about 0.0000122. This is
strikingly low: prices take almost 56,000 years to double. But the reduction in price thus
achieved is not negligible: it falls by 0.0713%. This is where what we might call “gross
welfare” (GW), the sum of average profits (gross of menu costs) and average consumers’
surplus, is very close to being maximized. Nominal price revisions occur every 182 years or so.
“Net welfare”, NW, which may be defined as GW minus menu costs, reaches its maximum at
an infinitesimally lower inflation rate. The key point here is that tiny positive inflation rates are
capable of generating an appreciable gain to total welfare. Whether they do so or not depends
13
upon shoe leather costs, which will clearly be higher with positive inflation than at the
Friedman rule (which minimizes them).
Let us focus specifically upon the range for inflation between plus and minus the real rate of
interest. We shall assume that the nominal rate of interest cannot go negative, so Friedman’s
rule is the lower bound. There are two relationships that matter for welfare. These are NW
(the excess of GW over menu costs) and shoe leather costs.
Shoe leather costs are minimized at Friedman’s lower bound, and increase monotonically with
the equilibrium nominal rate of interest ( r�� ). The exact form this third relationship takes
depends upon the function form assumed: let us for the moment assume10 that shoe leather
costs are negative exponential in real money holdings, and therefore proportional to the
nominal rate of interest (the opportunity cost of holding real money). So, in Figure 1, they are
captured by the line S, which slopes up and crosses the inflation axis at the Friedman point.
Average menu costs vanish with zero inflation, since they are inversely proportional to T ,
which is infinite when 0�� . Elsewhere they are positive, although, given (6), very modest,
and approximately loglinear (but inelastic) in the rate of inflation11. They can be depicted by a
saucer shaped curve, which is horizontal at the origin. In Fig 1, they are subtracted from GW
to show net welfare.
10 This issue is revisited below.11 With an elasticity of approximately two thirds, at least in the cases studied here.

14
Net welfare, the sum of average consumer’s surplus and average real profits net of average
menu costs, is the higher curve, labelled NW. Its shape is complicated. Algebraically it is
given by
]8/)}(/2}{{1)[/( TNTgcagNW �� ��� z� /T (8)
where ))2((/)())(( rTNTNrTNg ��� ��� . When inflation is zero, NW reduces to 75.0 ca / .
When inflation is negative, down to the zero bound of minus the real interest rate12, it is
consistently below this, first climbing, then falling steeply, and then, as the rate of inflation
climbs towards zero, rising very sharply. In the positive inflation area, the NW curve first
continues rising sharply over a brief interval, then subsides monotonically.
Seven possible types of candidate for the optimal rate of inflation can be identified. These are:
(i) the Friedman point: r��� ;
(ii) the range of negative inflation rates to the right of the Friedman point, where the
NW curve is rising (and in this region, concave);
(iii) the range to the right of this, where the NW curve slopes down;
(iv) the small range of miniscule negative inflation rates to the right of this, where the
NW curve rises again, and sharply (it is convex here);
(v) the origin, where inflation is zero;
(vi) the range of very low positive inflation rates where NW is rising; and
(vii) the range of higher, positive rates of inflation.
The boundaries between regions (ii) and (iii), (iii) and (iv), and (vi) and (vii) are identified
where the average real price displays its turning points. If marginal net welfare is to change

15
sign as inflation increases, that can only be because the average real price starts to rise or
decline, inducing changes in mean consumer’s surplus that swamp those in mean profits.
An extremum for total welfare occurs wherever the NW curve is parallel to the S curve. This
means that an interior optimum cannot occur in regions (iii) or (vii): the NW curve could not be
parallel to the S curve in such places: the S curve can only slope up. Region (iv) can also be
ruled out, as the second order condition would fail. The origin is also disqualified, as some
point to the immediate right of the origin, in area (vi), must dominate it.
This reasoning leaves us with three remaining possibilities: (i), (ii) and (vi). The first of these
is a corner solution, which will certainly hold if the S curve is steep enough – that is, if the
marginal shoe leather costs of inflation are sufficiently pronounced. For this to occur, the
gradient of the S curve at the Friedman point (i) must exceed that of the NW curve: were it less,
a move to a smaller rate of price deflation would raise total welfare. And if the Friedman point
is to dominate the best point in region (vi), that issue too depends primarily upon the steepness
of the S curve. In fact, with S linear, the local optimum in region (ii) must be dominated by
either the Friedman point or the local optimum in region (vi); it lies below a straight line
between these latter points.
Qualitatively quite similar results emerge from replacing the isoelastic product demand curve
by a linear one. The contrast between these two is quite stark when the real interest rate is
omitted, but is much less pronounced when it is introduced. Here, interior optima in regions
(ii) and (vi) remain logical possibilities, although, with linear S, region (ii) is in fact dominated,
as before, by the optimum in region (vi) whenever this is superior to the Friedman point. So, if
S is sufficiently flat, an interior equilibrium with positive (though very small) inflation is 12 I take this to bind. See McCallum (2000) and Yates (2003) for analysis of the issues involved here.

16
certainly best. Again, the optimal rate of inflation is approximately 0.0000122. The net welfare
curve is proportional to ba 8/2 when a is the vertical intercept of the demand curve and 1�� b its
gradient.
A demand curve with a constant elasticity of 2 is, however, a special case. What happens if the
elasticity of demand were to change? The next section addresses this issue.
4 Changing the elasticity of demand
When demand is linear, the parameter that captures the elasticity of demand is (the reciprocal
of) the gradient of the demand curve. This parameter has no effect on the way inflation affects
prices; it merely alters a multiplicative constant which is common for all rates of inflation. But
what a fall in b will achieve is an enlargement in the values of gross and net welfare. This
means that the chance of a positive inflation rate being optimal will increase. This finding is
important, because it suggests that the menu-cost argument for (low) positive inflation is not
based on the idea of large markups by monopolists with great market power. In fact, lower b
will imply a lower mark-up as well as a greater likelihood that optimum inflation is positive.
When demand is isoelastic, with an elasticity of 2, we saw that inflation lowers average real
prices so long as it is less than half the real interest rate. If the elasticity of demand is � , this
condition changes: the rate of inflation needs to be less than �/r for this to be observed. So
increasing the elasticity of demand has the effect of narrowing the range of inflation rates that
exert this favourable effect on welfare. A higher elasticity of demand (� ) intensifies the profit
sacrificed (as compared with a zero inflation equilibrium) both early and late in the interval
between price revisions. Net receipts fall away faster in the early phase, and rise faster later on

17
when the product is underpriced. The duration of the optimum interval therefore shrinks. If
T = 1 when the inflation and real interest rate are both 0.03, T falls to just under 0.6 (to
0.57912) when � = 3, for example. The broad shape of the )(�GW function alters somewhat,
with its main effect being to intensify the swings close to � = 0, and to raise the welfare loss
from price deflation.
If inflation rises from zero to 0.001, for example, gross and net welfare rise in both cases, but
the net welfare gain is barely two thirds as large with � at 3 rather than 2. At this point, the
interval between price revisions is some 5 years and 7 months, as against 9 years and 8 months
when � is 2. Menu costs erode 0.014% of average profits when � is 3 (up from 0.0063% when
demand elasticity was 2). Most of this change occurs as a result of the shortening of the
interval between price changes, with the remainder due to the fact that the higher demand
elasticity lowers the profit mark up.
With inflation much smaller, at 0.0000122, T is nearly 182 years with � at 2, and about 104
years with � at 3. Gross welfare registers a peak gain here of 0.0713% in the first case, but
nearly double this – 0.136% - in the second. Menu costs erode barely 1 per cent of the gross
welfare gain in that latter case. The rate of inflation is absolutely miniscule here: nominal
prices are frozen for over a century, and jump by less than 0.13% when revised; and the
nominal price level takes over 560 centuries to double.
If inflation is held to the Friedman optimum of –0.03 (the negative of the real interest rate),
gross welfare suffers far more as the demand elasticity rises. Gross welfare is a full 2.82%
below the zero-inflation level when � = 3, and menu costs increase this loss a little further.
This loss compares with only 0.02% when� = 2. The damage done by the rise in average real
prices, which price deflation induces, is considerably enlarged as the demand for special goods

18
becomes more elastic. The intuition for this can be seen by recalling the principles of Ramsey-
efficient indirect taxation. The greater the elasticity of (compensated) demand, the larger the
injury from a given tax rate. Price inflation acts like a subsidy, deflation like a tax.
The amplification of the welfare swings as � departs slightly from zero implies that an interior,
strictly positive optimum for inflation becomes likelier to dominate the Friedman rule as the
demand for special goods become more price-elastic. The size of the optimum inflation rate, if
positive, hardly changes. So if a higher nominal interest elasticity of money demand serves to
strengthen the case for deflation at the real rate of interest, higher product demand elasticity
will weaken it. The relationship between these two elasticities is critical, therefore, for
determining whether inflation should be negative or slightly positive.
5 A general equilibrium setting
We shall suppose now that there is a single “standard” good, the marginal utility of consuming
which is positive and constant, and a continuum of “special” goods with three characteristics
that the standard good does not share. These are that the marginal utility from consuming them
is (positive but) declining; that they are each produced by a monopolist who maximizes profit,
cannot price discriminate and enjoys immunity from contest in his market; and that changing
their nominal prices triggers a fixed real menu cost of z .
Utility is increasing but concave – most conveniently, logarithmic – in leisure, and labour is the
sole factor of production, displaying constant returns in the special and standard goods sectors.
Let the cost of transactions be subtractable from consumption of the standard good, and

19
represent this as a decreasing and convex function of real money balances (nominal money,
divided by the price of the standard good, which is unity because it serves as numeraire).
There is a single (type of) agent, who receives income from four sources: wages earned in the
standard good sector; wages in the special goods sector; profits received from the special goods
sector; and the return of seignorage from the monetary authority, treated as a lump sum.
Disbursements from this income are threefold: purchases of the standard good (consumption
plus shoe leather costs; purchases of special goods; and seignorage, defined as real balances
multiplied by the sum of inflation and real interest rates.
The agent’s maximand may therefore be written
� �� ������������� )]()()()([)()())(( ���� rmdiiqiPQXdiiwhhEnmFQdiiqf � (9)
Here, )(iq is the quantity of the special good i consumed, )(iP its price and )(i� the profits
earned from its production; and )(mFQ � is the quantity of the standard good purchased, net of
“shoe leather” costs, with m denoting real balances. E is the endowment of time, h the supply
of labour, and w the real wage rate. Labour is the sole factor of production. Seignorage
returned is X . f is increasing and concave, and F decreasing and convex. It is convenient (but
not necessary) to assume that F vanishes when the nominal interest rate is zero.
The FOC for this problem are:
�0 )()(')/{)())(('1 rmFwhEiPiqf ���������� ������ (10)

20
and assumptions on F and f ensure that an interior equilibrium satisfying these will be a
maximum. These conditions allow one to infer that )))(('())(( 1 iPffiqf �
� . This is a general
expression for the consumer’s surplus from good i . The real price of good i starts off (at time
zero, say) at p and then declines at the rate � until the next price revision (at T ). So the
average value of consumer’s surplus equals
}exp{('( 1
0
1 tpffTT
����
� .))dt
One important issue is the shoe leather function, )(mF . This function is decreasing and convex
in real money balances. It can take a wide range of forms. Three simple ones are particularly
useful:
(a) )/exp{)( ��� mmF �� ; (11a)
(b) 2/)( 2mmmF ��� ��� ; and (11b)
(c) ��� mmF /)( � . (11c)
All parameters here are assumed positive. The first order conditions imply that
)()(' ���� rmF . Differentiating and substituting back into the equations for )(mF give indirect
shopping costs, call them *)(mF , of ���� 2/)(),( 2�� rr 13 and [ �
�� )( �r ] )1/(1 �� respectively. In
the first case, shopping or shoe leather costs are proportional to the nominal interest rate14. In
the second, they are proportional to its square, and in the third, they are concave in the nominal
interest rate (proportional to its square root if � is unitary). In the first and the third cases, no
point in region (ii) in Figs 1 can be optimal, as either the Friedman point, or a strictly positive
13 Plus a constant that can be set to zero.14 This case does not deviate greatly from the shape given in the calculations of Bakhshi, Martin and Yates(2002). There, money balances are taken to be proportional to consumption and not just sensitive to nominalinterest rates. An example of an amended form for F that has this feature is examined below. These authors’results imply that the shoe leather cost of reducing inflation from 10 per cent to zero is equivalent to about onethousandth of income.
21
inflation rate, must dominate. But in the second, shoe leather costs are convex, and some
points in region (ii) may dominate both these rivals.
Assuming that each member of the continuum of monopolistic firms producing special goods
reprices its product at a different moment, and with an equal and infinitesimal interval of time
after its predecessor, we can substitute the first order conditions into the representative agent’s
optimization problem to obtain indirect utility. When demand is isoelastic, with an elasticity of
2, and with both � and w unitary, this will be:
��������������� }8/)exp{1))()2((/))(((1)]{)2((/))()()(()[(/(1 TTrNTrNTrNTNTrNcaEU ������
- Tz / *)(mF� (12)
and with linear demand and marginal cost,
*)(/]4/)2()})2((/))(({1)[2/(1 22 mFTzTNTrNTrNbaEU ��������� ��� . (13)
These two equations are simply linear transforms of the expressions for net welfare minus shoe
leather costs examined above in section 3, with )(mF generalized from (11a).
Further extensions are possible. It may be objected that the three shapes for )(mF fail to allow
for a scaling variable such as consumption or income in the money demand function. We may
replace (11a) for example by
}/exp{)()( ImImF ���� �� (11d)
22
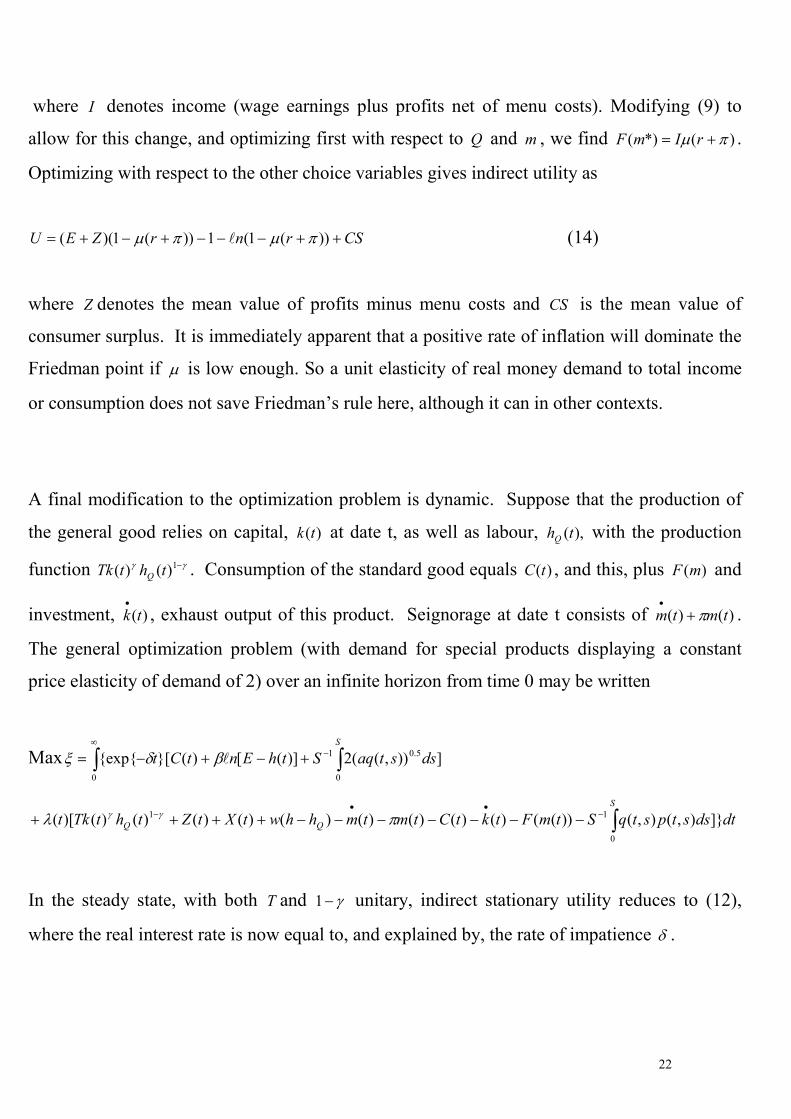
where I denotes income (wage earnings plus profits net of menu costs). Modifying (9) to
allow for this change, and optimizing first with respect to Q and m , we find )(*)( �� �� rImF .
Optimizing with respect to the other choice variables gives indirect utility as
CSrnrZEU ��������� ))(1(1))(1)(( ���� � (14)
where Z denotes the mean value of profits minus menu costs and CS is the mean value of
consumer surplus. It is immediately apparent that a positive rate of inflation will dominate the
Friedman point if � is low enough. So a unit elasticity of real money demand to total income
or consumption does not save Friedman’s rule here, although it can in other contexts.
A final modification to the optimization problem is dynamic. Suppose that the production of
the general good relies on capital, )(tk at date t, as well as labour, ),(thQ with the production
function �� �1)()( thtTk Q . Consumption of the standard good equals )(tC , and this, plus )(mF and
investment, )(tk�
, exhaust output of this product. Seignorage at date t consists of )()( tmtm ��
�
.
The general optimization problem (with demand for special products displaying a constant
price elasticity of demand of 2) over an infinite horizon from time 0 may be written
Max ])),((2)]([)(}[{exp{0
5.0
0
1 dsstaqSthEntCtS
���
�
����� ����
dtdsstpstqStmFtktCtmtmhhwtXtZthtTktS
QQ ]}),(),())(()()()()()()()()()()[(0
11�
�
��
�
����������� ����
In the steady state, with both T and ��1 unitary, indirect stationary utility reduces to (12),
where the real interest rate is now equal to, and explained by, the rate of impatience � .

23
6 Introducing a productivity trend
Suppose now that the level of marginal cost for special products declines exponentially over
time, at the rate � . When demand is isoelastic, the real prices of special product display a
downward trend across price revision dates at this rate. If numeraire inflation is also equal to
� , the nominal prices of special goods are stationary and menu costs never have to be incurred.
If general products also display a productivity trend (of � , let us say), numeraire inflation
needs to be set at the rate of �� � to keep the nominal prices of special goods constant.
A productivity trend is easily accommodated when demand is isoelastic. But if it is not, an
equilibrium, with initial real prices that decline at a constant rate, and stationary pricing
intervals, cannot be found. If demand were linear, for example, and menu costs were
negligible, the real price of the monopolist’s product would lie halfway between the
(unchanging) vertical intercept of the demand curve and the (continuously declining) level of
marginal cost. So real prices would decline at a decelerating rate. Introducing menu costs
would make the search for a recursive solution (where both the detrended initial real price and
interval between price revisions were stationary) quite impossible. There is just one exception
to this: when marginal cost is zero. But then the productivity trend would have no meaning,
and no significance. Incorporating productivity trends therefore requires demand to be
isoelastic.
The NW curve in Fig.1 is displaced rightwards when productivity has a positive trend. The
“neutral” point is now where NW equals the base case of three quarters of ca / in the case
where the demand elasticity is constant at two, and that corresponds to general goods inflation
at the productivity growth rate. Menu costs vanish at this point, too. But shoe leather costs are
24
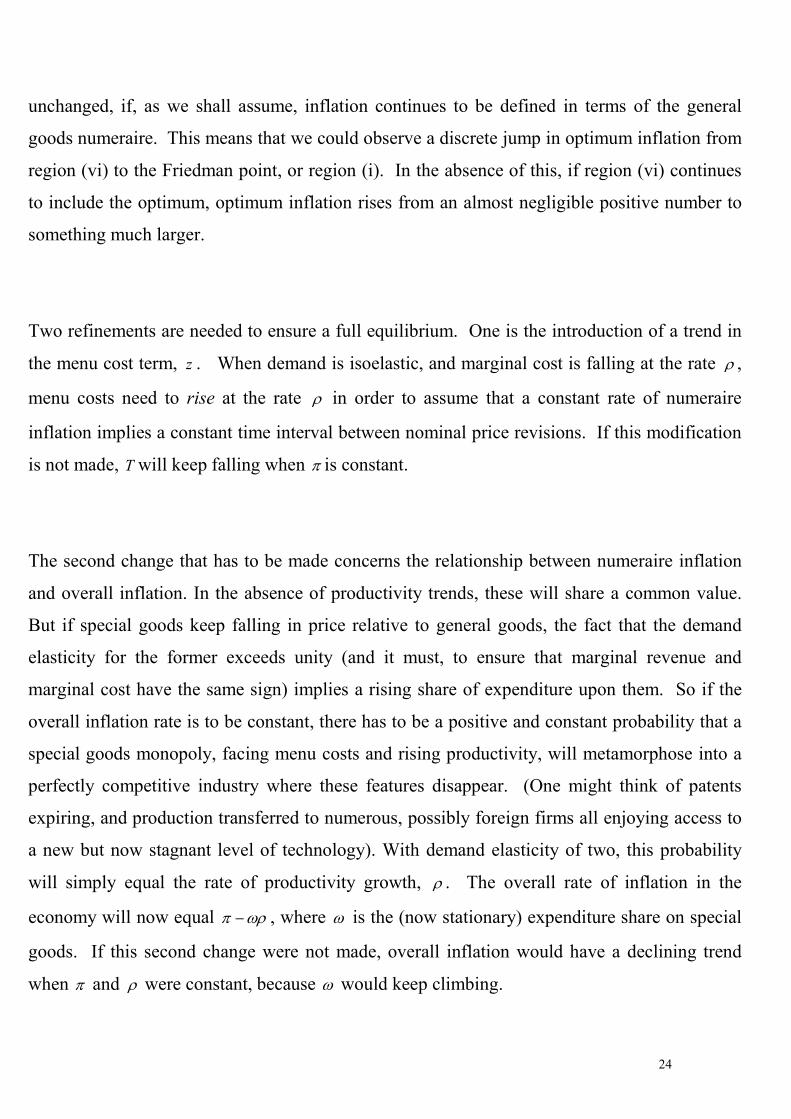
unchanged, if, as we shall assume, inflation continues to be defined in terms of the general
goods numeraire. This means that we could observe a discrete jump in optimum inflation from
region (vi) to the Friedman point, or region (i). In the absence of this, if region (vi) continues
to include the optimum, optimum inflation rises from an almost negligible positive number to
something much larger.
Two refinements are needed to ensure a full equilibrium. One is the introduction of a trend in
the menu cost term, z . When demand is isoelastic, and marginal cost is falling at the rate � ,
menu costs need to rise at the rate � in order to assume that a constant rate of numeraire
inflation implies a constant time interval between nominal price revisions. If this modification
is not made, T will keep falling when � is constant.
The second change that has to be made concerns the relationship between numeraire inflation
and overall inflation. In the absence of productivity trends, these will share a common value.
But if special goods keep falling in price relative to general goods, the fact that the demand
elasticity for the former exceeds unity (and it must, to ensure that marginal revenue and
marginal cost have the same sign) implies a rising share of expenditure upon them. So if the
overall inflation rate is to be constant, there has to be a positive and constant probability that a
special goods monopoly, facing menu costs and rising productivity, will metamorphose into a
perfectly competitive industry where these features disappear. (One might think of patents
expiring, and production transferred to numerous, possibly foreign firms all enjoying access to
a new but now stagnant level of technology). With demand elasticity of two, this probability
will simply equal the rate of productivity growth, � . The overall rate of inflation in the
economy will now equal ��� � , where � is the (now stationary) expenditure share on special
goods. If this second change were not made, overall inflation would have a declining trend
when � and � were constant, because � would keep climbing.
25
Suppose there are different productivity trends among the special goods. If these are
uniformally spaced, and the welfare peak in region (vi) continues to dominate regions (i) and
(ii), optimum inflation will be at the highest of these productivity growth rates. This is because
of the lopsidedness of the NW curve for each product. It falls much more slowly after the peak
in region (vi) than to the left, so a vertical sum of NW curves peaking in arithmetic progression
will itself peak at the optimum inflation rate for the sector displaying the fastest productivity
growth rate. So with productivity growth rates in five otherwise identical sectors at 0.005,
0.01, 0.015, 0.02 and 0.025, general-goods inflation should be very slightly above 0.025. If
some of the productivity growth rates cluster, however, the peak for overall gross welfare could
well lie to the left of that for the sector with the highest growth rate. This can also happen
when the levels of ca / differ between industries.
With the elasticity of demand above unity, and productivity growth rates differing across
sectors, another issue arises. Expenditure on these goods grows at different rates, and fastest
where costs fall fastest. So an initially small special goods sector with very rapid productivity
growth will outpace the others, and, as time proceeds, may well lead to an increase in the
economy’s overall optimum rate of inflation expressed in general goods.
7 Qualifications and Concluding Observations
Measuring the rate of inflation accurately is a challenge. New goods, changes in quality,
substitution, geographical differences, sampling short cuts – all pose difficulties15. The fact
that the net welfare function is so markedly asymmetric means that uncertainty about the true

26
value of the rate of inflation is important. It constitutes an argument for erring on the high side,
given that the NW curve is so much flatter to the right than to the left of its peak. A little too
little inflation can be really serious; a little too much inflation barely matters in comparison.
And exactly the same point holds if the productivity growth16 rates in the special goods sector
are uncertain. The message is that less than perfectly informed inflation targeters should aim
up a bit. Inflation-uncertainty calls for less inflation-aversion.
The rate of inflation has been defined in terms of a general goods numeraire. This is innocuous
when productivity is stationary everywhere, because relative prices have no trends, and with
firms’ price revisions evenly spread, the average real prices for special goods are stationary too.
But the admission of (different) productivity trends make relative prices drift. And with
demand elastic, special goods where productivity climbs fastest will display a rising share of
total expenditure. The true rate of inflation will be somewhat less than the numeraire rate of
inflation. How much less will depend on expenditure shares and relative productivity trends.
And the gap will keep widening.
Gaps in time during which the nominal price of goods is unchanged may be caused by menu
costs in the product market. But they can also testify to menu costs in input markets, such as
that for labour. Let product demand be isoelastic, and labour the sole factor of production,
displaying constant returns. If the money wage rate is fixed for an interval, so will the profit-
maximizing nominal price, no matter what the rate of inflation or the rate of interest or the
elasticity of demand. Goods market nominal rigidities will then simply reflect nominal
rigidities in the labour market. In such circumstances, the minimization of menu costs would
15 Ambiguity about the rate of inflation is a non-trivial problem, as shown by Boskin et al (1996) in the UScase, and, in Japan’s, most recently by Ariga and Matsui (2003). Lebrow and Rudd (2003) have a recent surveyon these issues.
16 Debates about productivity trends, their definition and measurement, reveal that ambiguity is a seriouspractical matter here too.
27
imply that monetary policy should aim to keep money wages steady; in the context of a general
trend in labour productivity, that would imply negative, as opposed to positive inflation. But if
monopoly is present in the labour market, and enters into all aspects of wage setting,
discounting will restore advantages for inflation. Unions will then be more concerned about
the jobs lost from excess real pay soon after a money wage revision, than about the fact that
real pay is too low later. The resulting squeeze in average real wage rates should lead to some
gain in efficiency.
References
Ariga, K. and K. Matsui (2003), Mismeasurement of the CPI, National Bureau of Economic Research Working
Paper 9436, January
Bakhshi, H., B. Martin and T. Yates (2002), How Uncertain are the Welfare Effects of Inflation?, Bank of
England working paper 152, February
Barro, R.J. (1972), A Theory of Monopolistic Price Adjustment, Review of Economic Studies, 39, 17-26
Boskin, M.J. and others (1996), Final Report of the Advisory Commission to Study the Consumer Price Index,
U.S Government Printing Office
Calvo, G.A. (1983), Staggered Prices in a Utility Maximizing Framework, Journal of Monetary Economics, 12,
383-398
Dexter, A. S., M. D. Levi and B. R. Nault (2002), Sticky Prices: the Impact of Regulation, Journal of Monetary
Economics, v. 49, 797-821
Diamond, P.A. (1993) Inflation, Search and Sticky Prices, Review of Economic Studies, v.60, 53-68
Dupor, B. (2002), Optimal Monetary Policy with Nominal Rigidities, mimeo, Wharton School, University of
Pennsylvania
Fershtman, C., A. Fishman and A. Simhon (2003), Inflation and Efficiency in a Search Economy, International
Economic Review, v.44, 205-223
Friedman, M. (1969), The Optimum Quantity of Money, in The Optimum Quantity of Money and Other
Essays, Aldine, Chicago
Golosov, M. and R.E. Lucas (2003), Menu Costs and Phillips Curves, Universities of Minnesota and Chicago
and the Reserve Bank of Minneapolis, mimeo, May

28
Goodfriend, M. (1997), A Framework for the Analysis of Moderate Inflations, Journal of Monetary
Economics, v. 39, 45-65
Khan, A., R.G. King and A.L. Wolman (2002), Optimal Monetary Policy, National Bureau of Economic
Research Working Paper 9402, December
Klenow, P.J. and O. Kryvstov (2003), State Dependent Pricing and the Variance of U.S. Inflation, 1988-2002,
Federal Reserve Bank of Minneapolis working paper
Lebrow, D. L. and J. B Rudd (2003), Measurement Error in the Consumer Price Index: Where do we Stand?,
Journal of Economic Literature, 41, 159-201
Lucas, R. E. (2000), Inflation and Welfare, Econometrica, v. 68, 247-274
McCallum, B. T (2000), Theoretical Analysis Regarding a Zero Lower Bound on Nominal Interest Rates,
Journal of Money, Credit and Banking, v. 32, 4, 870-904
Sheshinski, E. and Y. Weiss (1977), Inflation and the Costs of Price Adjustment, Review of Economic Studies,
v. 44, 287-303
Yates, T. (2003), Monetary Policy and the Zero Bound to Nominal Interest Rates, Bank of England Quarterly
Bulletin, v 43, 1, 27-37