Embed Size (px)
Citation preview

Can Marshall’s Clusters Survive Globalization?
Giulio Buciuni Gary P. Pisano
Working Paper 15-088

Working Paper 15-088
Copyright © 2015 by Giulio Buciuni and Gary P. Pisano
Working papers are in draft form. This working paper is distributed for purposes of comment and discussion only. It may not be reproduced without permission of the copyright holder. Copies of working papers are available from the author.
Can Marshall’s Clusters Survive Globalization?
Giulio Buciuni University of Venice Cà Foscari
Gary P. Pisano Harvard Business School
Abstract It is widely presumed that in today’s globalized economy, the value of geographic clustering of
manufacturing industries is no longer valuable. Manufacturing is represented as a highly mobile
“commodity” that can be sourced from anywhere in the world where factor costs are favorable.
This paper re-examines this assumption, and suggests that not all manufacturing is highly mobile.
We suggest that manufacturing sectors should be viewed along a continuum from highly mobile
to highly “sticky”. Manufacturing clusters can decline for two completely different reasons. The
first is a change in technology that reduces the value of co-location (stickiness). This tends to
lead to the decoupling of design and production activities and to a broad geographic diffusion of
manufacturing. The second is a shift in the relative comparative advantage of clusters located in
one region versus another. Under this scenario, geographic concentration is still valuable, but the
center of production activity can shift from one location to another. The paper then analyzes how
firm supply chain strategies impact stickiness and the survival manufacturing clusters.

Can Marshall’s Clusters Survive Globalization?
Giulio Buciuni University of Venice Cà Foscari
Gary P. Pisano Harvard Business School
FIRST DRAFT
March 26, 2015
I. Introduction The migration of manufacturing industries from one place to another has been happening since
the Middle Ages. The past century and the past few decades in particular have witnessed a
number of dramatic mass migrations of manufacturing. New England was one of the word’s
largest textile producers at beginning of the 20th century—today, it has no textile mills. In 1985,
75% of semiconductor manufacturing capacity was located in either Japan or the US (Maher,
Mowery, and Simcoe 2002). By 2009, the US and Japanese share had shrunk to 40%, while
Taiwan, Korea, China, and other Southeast Asian countries accounted for 50% of production
capacity.1 Driven by falling trade barriers and the opening of once closed markets (like China,
India, Eastern Europe and Russia), declines of long established manufacturing clusters in the US
and Europe have occurred in industries as diverse as apparel, automobiles, bicycles, chemicals,
consumer electronics, furniture, shoes, sports equipment, shipbuilding, and steel. Migration also
occurs within countries. In the US, manufacturing had historically been concentrated in the so-
called “manufacturing belt”, running approximately from the upper Midwest to the northeast
(Krugman, 1991). Today, the southeastern US—once dominated by cotton and tobacco—has
emerged as the new industrial heartland. Overall, the potent forces of globalization have lead
some to question the future viability of Marshallian industrial clusters (e.g. De Marchi and
Grandinetti, 2014).
1 By 2009, the Japanese share had fallen to 25% and the US share to 14%; Taiwan had grown to 18%, Korea to 17%, and China to 9%. Manufacturing and Technology News, February 12, 2012, vol 17, no 3. “US Becomes Bit Player in Global Semiconductor Industry.”

Mass manufacturing migration is such a prominent part of the globalization discourse that it is
easy to forget that a surprising amount of manufacturing actually stays put (some of it for quite a
long time). Tuscany has been a leading center of high quality wool fabric and luxury apparel
production since the 13th century Goldthwaite (2009); Faber-Castell has produced pencils in
Germany since 1761; guns have been manufactured in Springfield, Massachusetts since the late
1700s. Boeing first began producing airplanes in Washington state in 1910, close to its current
plant in Everett. Despite its well-publicized woes and the rise of foreign transplant operations in
the southeast, the Detroit region is still the largest producer of cars and trucks within the United
States.2 Harley Davidson has been producing motorcycle engines in the Milwaukee area since
1903. Like the US, Europe’s industrial base has long been concentrated in a ‘manufacturing
belt’—running from southern Scandinavia through Germany’s Ruhr Valley and Eastern France
through the northern half of Italy.
Despite the global shift in manufacturing from developed to developing countries, and the growing
international fragmentation of production, certain types of manufacturing activities remain
entrenched in specific locales or industrial districts. Not only do these manage to survive in a
globalizing economy, but they also prosper and remain the loci for innovation development (e.g.
Breznitz and Buciuni, forthcoming). Manufacturing clusters, at least in some contexts, appear to
be surviving globalization (Markusen, 1996). This trend is not occurring in all manufacturing
sectors alike, nor is it involving all the firms competing in a given manufacturing industry. The
existence of both across-industry and within-industry variance suggests room for further analysis
and triggers a challenging question: When and why do some manufacturing clusters survive
globalization?
The answer matters for several reasons. First, it will help us understand the extent to which lower
barriers to trade pose real or imagined threats to specific industries in specific locations. Second,
2 http://www.detroitchamber.com/economic-development-2/chamber-initiatives/michauto-universal-name/the-auto-industry-in-michigan/

it sheds light on the potential for manufacturing to return to places that have previously de-
industrialized. Recently, there has been a spate of optimistic predictions about the re-shoring of
manufacturing to the US. Such prognostications are predicated on the assumption that
manufacturing capabilities are highly mobile, and that manufacturing moves quickly with changes
in factor cost changes. Finally, managers needing to make long-term commitments toward supply
chain configurations can be helped by understanding how location matters to manufacturing
performance.
This paper is organized as follows. Section II provides some high level trends on the organization
and locus of production globally. Section III examines various types of global supply chain
configurations and how they influence the organization of production across geographies. We
examine more closely what exactly it means for a supply chain to be “global.” Using a simple
framework that distinguishes between “concentration/dispersion of supply chain activities” and
“distance from end markets”, we identify four basic types of global supply chain configuration. We
discuss the properties of each, and the implications for manufacturing mobility/stickiness. Section
IV provides a comparative case study analysis of four ‘industrial districts’ in Northeastern Italy, all
located within approximately 45 miles of one another. The varying patterns of evolution and
performance of each region enables us to draw some preliminary conjectures about the factors
driving manufacturing mobility/stickiness. We end the paper with a discussion of potential
management and policy implications, and open questions for further research.
II. The Global Organization of Manufacturing: Aggregate Evidence
How has the geographic face of manufacturing changed over the past few decades? There is
plenty of anecdotal evidence about the globalization of manufacturing supply chains (e.g Gereffi,
Humphrey and Sturgeon, 2005). We hear all the time about companies who have shuttered
plants in the US or Europe and moved production to China or Eastern Europe. Critics complain

that Apple enjoys huge profits in the US but does no manufacturing there. A drive through the
industrial heartland of advanced industrial countries (the American mid-west, the British midlands,
Germany’s Ruhr Valley, Northern Italy’s manufacturing districts, etc.) will reveal no shortage of
long-abandoned factories. The impression is that places like the US and some parts of Europe
have already entered the post-industrial era. But what do the data say?
It has become common in both academic and policy circles to equate the relative strength or
weakness of US manufacturing with the percentage of GDP associated with manufacturing.
Andrew Liveris, author of Making It in America, for instance, laments the decline of US
manufacturing and draws the following comparison between the US and Germany: “The German
government has a keen sense of the importance of manufacturing, and has made investment to
support the sector, even as they transition their economy. That’s why manufacturing makes ups
20% of the German economy, but only 11 percent of the US economy. And it’s why in the race for
a competitive long-term future, German is far ahead of the pack.”3
The problem with the much cited “manufacturing as percentage of GDP” figure is that it really
does not tell us much about the amount of manufacturing happening in an economy. The actual
figure being cited is the percentage of GDP attributable to manufacturing sectors like automobiles,
apparel, and vehicles. Before globalized supply chains, the domestic output of a manufacturing
sector, say cars, was largely generated by manufacturing activities, and thus the overall share of
GDP from manufacturing sectors was a reasonable proxy for the amount of manufacturing taking
place in the economy. However, with the rise of global supply chains, it is not uncommon for
companies in the manufacturing sector to do R&D in one place (say the US) and to source
production from a foreign location. Because the profits which flow back to the enterprise become
part of the value added of the domestic economy, it is entirely possible for manufacturing activity
to decline (due to say offshoring) while value added of a sector increases. This is going to be
3 Liveris, page 6.

particularly true in sectors where intangibles, like intellectual property, are a significant source of
value.
To get a read on actual production taking place, we need to look specifically at industrial
production data assembled by the Federal Reserve (for a description see
http://www.federalreserve.gov/releases/g17/current/). These data are based on surveys
conducted by the Bureau of Labor Statistics of individual establishments and are derived
specifically from physical counts of production. The advantage of these data is that they tell us
something about the amount of physical production in the US economy. The downside is that
physical units are difficult to compare across sectors, and thus we can not compare absolute
production levels across sectors or between manufacturing sectors and services. Industrial
production data (at the overall economy and at the sector levels) are indices.
Figure 1 below shows the overall trend in industrial production between 1980 and 3Q/2014 (the
data are reported every quarter, but for visual clarity the X axis ‘ticks’ only the 3Q of each year).
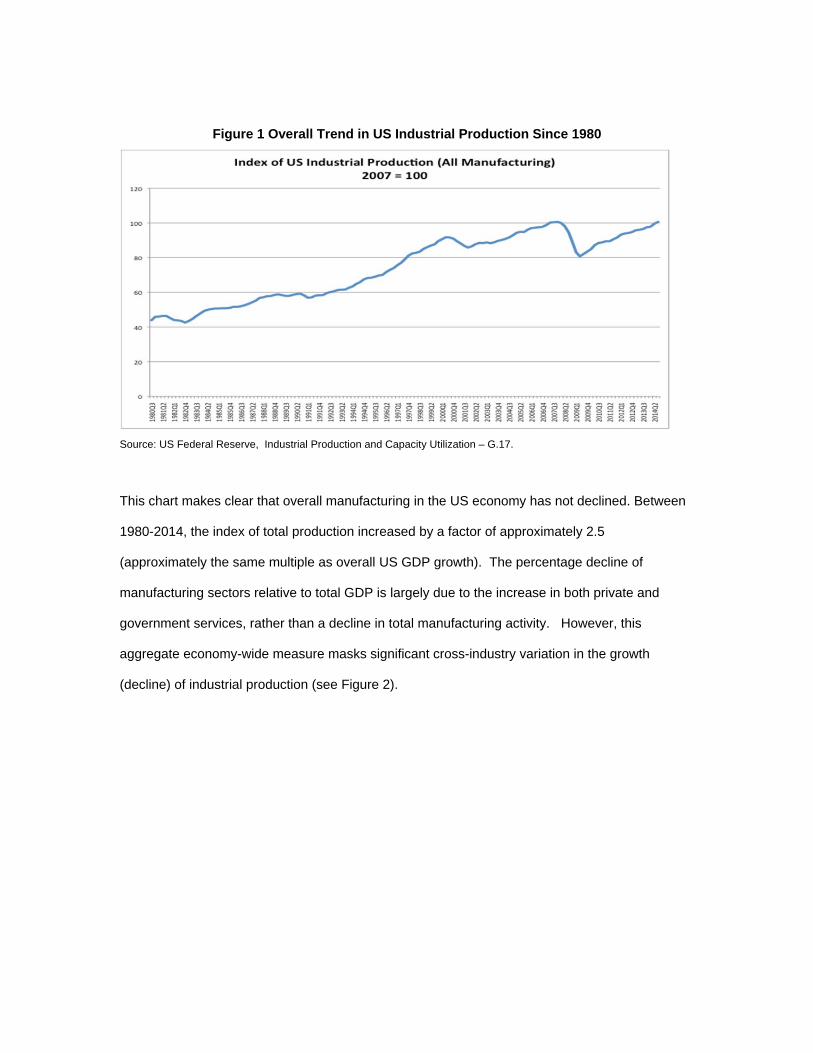
Figure 1 Overall Trend in US Industrial Production Since 1980
Source: US Federal Reserve, Industrial Production and Capacity Utilization – G.17.
This chart makes clear that overall manufacturing in the US economy has not declined. Between
1980-2014, the index of total production increased by a factor of approximately 2.5
(approximately the same multiple as overall US GDP growth). The percentage decline of
manufacturing sectors relative to total GDP is largely due to the increase in both private and
government services, rather than a decline in total manufacturing activity. However, this
aggregate economy-wide measure masks significant cross-industry variation in the growth
(decline) of industrial production (see Figure 2).

Figure 2: Industrial Production Indexes by Sector (1980-2014)
Source: Federal Reserve, Industrial Production and Capacity Utilization. G.17
Roughly speaking, the growth patterns of US manufacturing fall into 4 categories: absolute
decline (textiles; apparel and leather goods); stagnant/weak growth (e.g. food and beverages,
wood, primary metals, fabricated metals, furniture, and aerospace); average growth (chemicals,
plastics, machinery, and motor vehicles), and hyper-growth (computer and electronic products).
Additional visual clarity of these differences can be viewed in Figure 3 that isolates a select sub-
set of sectors.

Figure 3: Selected Sector Industrial Production Indices
Such turbulence at the sectorial level should not be surprising. One of the attributes of a dynamic
economy is the ability to re-allocate resources across sectors in response to changes in factor
costs, productivity, and demand. In addition, this is a time of dramatic institutional changes in the
global economy reducing barriers to trade. The dramatic declines of textile and apparel
production coincide with the approval of the WTO Agreement on Textile and Clothing (Uruguay
Round) that went into effect January 1, 1995.
In absolute terms, these data provide a mixed picture. The familiar lament that the US no longer
manufacturers is clearly overblown; that said, growth in manufacturing has occurred in only a
relatively narrow band of sectors and product areas. Unfortunately, more disaggregated data are
not available to further probe within sector differences, but at least, anecdotal evidence suggests
significant within sector differences (product level). Intel, for instance, maintains a very large
domestic manufacturing capability in microprocessors, but the vast majority of memory chips are
now produced outside the US. Even in mature sectors hit hard by foreign competition, like
furniture, we see the emergence of specialist producers that continue to thrive based on
innovation and customization (Buciuni, Coro, and Micelli 2014). Based on case study evidence,
0
50
100
150
200
250
300
3501980Q3
1982Q2
1984Q1
1985Q4
1987Q3
1989Q2
1991Q1
1992Q4
1994Q3
1996Q2
1998Q1
1999Q4
2001Q3
2003Q2
2005Q1
2006Q4
2008Q3
2010Q2
2012Q1
2013Q4
Manufacturing(SIC);s.a.IP
Textilesandproducts(NAICS=313,4);s.a.IP
Apparelandleathergoods(NAICS=315,6);s.a.IP
Computerandelectronicproduct(NAICS=334);s.a.IP
Motorvehiclesandparts(NAICS=3361‐3);s.a.IP

Pisano and Shih (2012) document a number of specific technological capabilities that left US
shores over the past two decades.
A clearer picture of manufacturing mobility would emerge with international comparisons of
production output. Unfortunately, such data are not available across countries on a comparable
basis (there is data on gross output and value added of ‘manufacturing’ industries, but these data
do not isolate the value created by production activities per se, and other contributors to value
added or gross output (such as R&D). Industry-specific data is perhaps the best way to glean
insights about how manufacturing capabilities have diffused across countries over time. Some of
the best available data come from the automobile industry. Figure 4 below depicts the changing
shares of global auto production by country since 1970 as reported in Ward’s Automotive
Yearbook. Note, these data include all production in a country from both domestic and foreign
owned factories. Also, we have included data on both passenger vehicles and trucks/buses given
the increasingly blurry distinction between large passenger cars and trucks (e.g. pick-up trucks,
sport utility vehicles are classified as trucks).
Several trends are apparent. The first is the relative decline, and then rebound of the US-based
production. Two underlying factors drove this trend. The first was the rapid growth of the small
truck/sport utility vehicle market in the US. The second was the establishment of American
manufacturing plants by a number of foreign producers beginning in the late 1980s and
continuing through the early 2000s (Toyota, Honda, Nissan, VW, BMW, Mercedes, etc.). The
second trend is the decline of Japanese auto production—this was largely due to the decline of
the Japanese market (following the crash of 1997) and a shift toward foreign direct investment by
major Japanese automobile companies. And finally, in the latest period, we see the emergence of
China as a major producer (virtually all production for domestic consumption). The 2010 data for
European and US production are almost certainly severely impacted by the Great Recession of
2008-2010.
Figure 4 Geographic Distribution of Vehicle Production

A deeper look at individual companies reveals how heavily globalized vehicle production has
become via foreign direct investment. By 1998, most major auto companies (top ten US,
European, and Japanese producers) had expanded production outside their home regions.
However, even then, just about all did the majority of their production inside their home region
(North America for US producers, Western Europe for European producers, and Japan for
Japanese producers). According to data compiled by the OICA
(http://www.oica.net/category/production-statistics/2013-statistics/), Toyota, for instance, built
68% of its vehicles in Japan; GM and Ford both built 66% of their vehicles in North America. By
2013, Toyota built 41% of its vehicles in Japan; Ford built 51% of its vehicles in North America;
GM’s North American production volumes had fallen to 34% of its global total (in contrast, GM’s
production in China alone accounts for 33% of its global production by volume). While Ford built
4.4 million vehicles in North America in 1998, by 2013 it produced only 3.1 million (still a sizable
figure in absolute terms). GM experienced a similar reduction in North American vehicle
production between 1998-2013.
The case of semiconductors has both similarities and differences from the pattern of global
expansion found in autos. There has been a modest decline in the global share of US production
(from approximately 30% in 1985 to approximately 25% today), but since the overall market is
0%5%10%15%20%25%30%35%40%45%
1970 1980 1990 2000 2010
PercentageofTotalWorldProduction:AllVehicles
UnitedStates Japan WesternEurope SouthKorea China India
Source:WardsAutomotive Yearbook

much bigger, the absolute value of semiconductor production in the US is significantly higher
today than it was in 1985.4 Like the auto industry, US companies have broadened their global
footprints (Intel, for instance, has plants in the US, Ireland, Israel, and China). However, a
significant chunk of the increasing share of Korea, Taiwan, and China as semiconductor
producers was driven by the emergence of “home-grown” companies (like TSMC and UMC in
Taiwan and Samsung in Korea) rather than by foreign direct investment of US or Japanese
companies.
The aggregate data presented above and the specific examples of autos and semiconductors
paint a more complex picture of the global manufacturing landscape that is often portrayed in
popular discussions of globalization. The oft-decried de-industrialization of America is a more
nuanced phenomenon. There is absolute and deep decline in some sectors (e.g. apparel, textiles,
shoes); stagnation in others; and modest growth in some (e.g. automobiles) and explosion growth
in at least one (computers and electronics). And in sectors like autos and semiconductors, we see
both domestic growth in absolute terms and a decline in relative global share terms. The decline
in relative global shares suggests that manufacturing capabilities are mobile. They diffuse to and
take root in new geographies over time. Yet, the persistence of many types of manufacturing in
places of origin (like Detroit for automobile) suggests, at the same time, a certain degree of
“stickiness”. Once a manufacturing capability takes hold somewhere, it tends not to leave (and
once it leaves completely, it likely does not come back).
How can this paradox be explained? There are two general perspectives to explain the location
of economic activities (including, of course, manufacturing). The first is rooted in traditional trade
theory and emphasizes the role of factor prices and technology ‘endowments’ of different
locations. Such a perspective helps to explain why certain types of manufacturing have moved
from high-wage developed countries to the US to low wage developing economies. It is also
being used more recently to predict a large-scale return of manufacturing to the US. In a recent
4Authors’estimatebasedonannualpercentageofrevenuefromNorthAmericaofleadingsemiconductorequipmentprovider(AppliedMaterials).Source:AppliedMaterials10‐Kreport,2014.

report on US manufacturing, for instance, the Boston Consulting Group (BCG) (2011)
optimistically forecasts that due to a combination of rising wages in China and falling (real) wages
and energy costs in the US, America is likely to experience of surge of “re-shoring”. Traditional
factor cost analysis, however, assumes that the relevant technological and human resource
capabilities required for production are geographically mobile. That is, it assumes away stickiness.
Moreover, traditional analyses ignore the fact that any given manufacturing industry is never an
island, but is instead part of supply chains featuring other distinct industries. The location choices
of any specific (say auto parts) industry depend partly on the choices of complementary upstream
(e.g. metal castings, machinery) and downstream industries (auto producers). This suggests that
the relevant unit of analysis for considering manufacturing location issues is not the isolated
industry, but the supply chain.
A contrasting perspective to traditional trade theory is provided by theories of economic
geography. Whereas trade theory is “distance free”, economic geography is all about how
distance matters. The first theory of geography and location in economics dates back to Alfred
Marshall (1890). One of his (many) interests lied in explaining the tendency of firms from the
same industry to cluster in the same location (e.g. textile firms clustering in Lancaster, England in
the late 19th century). Marshall theorized three reasons why firms from the same industry would
tend to locate close to one another: 1) Labor market pooling (e.g. a textile firm has an easier time
finding workers with relevant skills in places where other textile firms operate); 2) Common
infrastructure (firms in the same industry tend to require similar specialized infrastructure like
access to water, rail networks, universities, etc.); 3) Spillovers (cross-firm learning is higher
across firms from the same industry). More recent work in the field of economic geography has
extended the notion of “agglomerating forces” to include increasing returns, transportation costs,
and demand (Krugman 1991). Theories of agglomeration have been used to explain the
presence of a wide range of industrial clusters, from Italian industrial districts and Dutch flower
industry to Silicon Valley and the Boston’s biotechnology sector (e.g. Sabel and Piore 1984,

Porter 1990 to mention but a few).
Agglomeration economies are driven by the costs of distance. In today’s economy, the relevant
costs increasingly have to do with knowledge flows and coordination. That is, suppliers and
buyers cluster geographically because they need to exchange knowledge or coordinate their
activities. The impact of distance on the costs of transmitting knowledge and coordination
depend on the nature of knowledge and information. The advantage of co-location (in terms of
faster, more efficient knowledge exchange and coordination) increases as know-how becomes
more tacit and as the interfaces between adjacent activities become less modular (Teece 1976,
Pisano 1996, Pisano and Shih 2011). This suggests that geographical clustering will tend to
occur in industries characterized by less mature, more tacit knowledge bases. Technology is
often taken as a given in both traditional trade theory and agglomeration theory, but recent
evidence that distance can also influence technology choices of firms. Fuchs and Kirchain (2010),
for instance, find evidence in the opto-electronics industry that U.S. firms that off-shored
production were forced to use less advanced product designs than those which kept production in
the US. This was caused by the different underlying capabilities of suppliers in each location.
This finding implies that firms do not necessarily choose the optimal technology first and then
adapt their sourcing location strategies, but in fact, may be doing the reverse: they are choosing
sourcing locations and then adapting their technology to fit those constraints.
There is nothing inconsistent with theories of location based on factor costs and those based on
agglomeration. They represent forces pushing and pulling in the opposite direction. Factor price
differentials in a global economy are a centrifugal force, pushing manufacturing from one location
to another. Agglomerating forces are centripetal, pulling manufacturing back to existing clusters.
Geographic stickiness of manufacturing depends on the relative strength of agglomerating forces
relative to factor cost differentials. A big enough difference in costs may well lead companies to
forgo the value of being inside an existing cluster. A firm may break away from the cluster, and in
so doing, the lay the seeds for a competitive cluster to form in a new location. As Krugman (1991)

points out, once a cluster begins to erode, it can collapse relatively quickly due to the (negative)
consequences of increasing returns.
Most discussions of agglomeration and trade take place at the “industry” level (in varying degrees
of disaggregation, 2 digit, 3 digit, 4 digit, NAICS). This is a helpful assumption. However, in reality,
production in any given industry typically takes place in multiple linked stages, not all of which are
from the same industry classification. Take for instance the production of automobiles.
Automobiles are assembled from a diverse array of parts, including fabricated metal products (e.g.
the bodies, understructure, etc.), precision-machined parts (e.g. engines, etc.), molded plastics
(bumpers, trim), semiconductors, electronics, fabrics (interior), chemicals (adhesives, paints, etc.),
glass, and advanced materials (to name just a few). Moreover, a broad range of equipment is
used to not only assemble the final vehicle, but also to make the various kinds of parts. To
complicate matters furthers, many of the capabilities and processes required to make any given
component are shared with other industries. Precision machining used to make engine partsis
also a capability required for the production of aircraft, medical devices, scientific instruments,
industrial equipment, and many other products. Clustering is much more complicated than, say,
automobile companies locating near each other. Supply chains cross industry lines. Pisano and
Shih (2012) referred to such shared supply chains and knowledge bases as “industrial commons”
and cite several examples. Firms may choose to locate near others who are not necessarily in the
same “industry”, but draw from common knowledge bases and capabilities. Advanced display
producers (like the type used in high definition TV or smart phones) and semiconductor producers
tend to cluster in the same regions in Asia because both utilize similar underlying process
technologies and the same capital equipment suppliers.5 This suggests that agglomeration forces
may operate at the capability level, rather than at the industry level.
The multi-stage, multi-sectorial character of supply chains suggests that specific industry “clusters”
may get divided geographically. For instance, it is possible to have some stages of production
5 Pisano and Shih, 2012, page 50

clustered in one place (say, close to raw materials), with other stages clustered elsewhere (say,
close to end markets). An industry can thus be both locally clustered and globalized at the same
time. Posed differently, a ‘global supply chain’ can be consistent with local clustering. We explore
this issue in greater detail in the next section.
III. The Structure of Global Supply Chains The mantra that supply chains have become “globalized” has pervaded both popular and
academic writings on competition and operations. Implicitly, this often meant to convey that
distance has become irrelevant. Companies are putting their own manufacturing operations and
choosing suppliers in locations that offer the best total cost of production and enable them to
serve a broad patch of growing markets. A stereotypical picture of today’s ‘global’ supply chain is
provided in the opening lines of a Deloite Touche & Tohmato (2003) report on global supply
chains: “Imagine trying to design, source, manufacturing, sell, and deliver a new product rapidly
for a new potentially lucrative market given today’s realities: your suppliers are located in North
America, Europe, and China; your customers are in the US, Europe and Japan; your factories are
in Brazil, Europe, and North America; and your development engineers are in Europe, India, and
North America.”6 The report then goes on to point out that this predicament is not unusual.
Unfortunately, such sweeping generalizations that “supply chains are global” obfuscate more than
they clarify because, in reality, there are various ways in which a supply chain can be global (or
local). Here are two salient dimensions along which supply chain “structure” can be
characterized:
1.Geographic concentration: The degree to which the various production steps constituting the supply chain are geographically proximate to each other (concentrated) or are geographically dispersed. 2.Location Relative to Market: The second dimension is the degree to which the supply chain is geographically proximate to the end market.
6 Deloitte, Touche & Tohmato (2003) “The Challenge of Complexity in Global Manufacturing.” Page 1. https://www.deloitte.com/assets/Dcom-Shared%20Assets/Documents/SupplyChainSurvey(1).pdf

Geographic Concentration In some supply chains, there are benefits of having these various stages and activities
geographically close to one another. Consider the production of wine. There are four basic stages
of production: growing grapes, producing the wine (fermentation), aging, and bottling. Typically,
these are all performed in very close proximity. Strong agglomerating forces drive geographic
concentration of the supply chain. Now consider the semiconductor supply chain: the design of
chip may be done in the US; the production of the “chip” wafer may be done in, say, Taiwan, then
sent to Malaysia for cutting and packaging. (That same chip may then be sent to Europe where it
will be used as a component in automobile production). This would be an example of a
geographically diffused supply chain where agglomeration economies are low across stages of
production (but, each stages of production—chip design, wafer production, packaging, etc. tends
to be located relatively close to other companies carrying out similar production).
Location Relative to Market
This dimension refers the benefits of having production activities geographically close to end
markets for the product. A simple way to think about this construct is the desired distance
between the final production stage (e.g. assembly) and the location of end market demand
(weighted by market size). For instance, the Apple iPhone is assembled in China, but sold
throughout the world, suggesting a relatively low degree of desired production-market co-location.
In contrast, bulky products (like heavy construction equipment), cement, and beer are often
produced relatively close to final markets due to the high costs (and time) involved in transporting
the product.
We can put these two dimensions together to create a simple 2x2 matrix delineating 4 archetypal
supply chain structures. See Figure 5.
Figure 5: Configuration Options of Supply Chains

Note, the examples are designed to suggest tendencies rather to than to be illustrative of ‘pure
types.’ For instance, automobiles are categorized as “fully localized” not because all production
occurs close to markets, but because in the past decades, auto manufacturers have moved to
putting assembly plants closer to markets and to locating suppliers close to their factors (but
obviously, not all their suppliers are local). Similarly, craft beer is certainly not all distributed
locally; but in reality, most craft beers achieve a significant share of their market share within a
few hundred miles of their brewery (some even closer). And, many locate their brewers close to
the key raw material: high quality water (while buying hops from distant places). Another caveat is
that we may expect to see differences across companies within the same industry. For instance,
in the apparel industry, companies like VF Brands pursue fully globalized strategies, while Zara
has generally tried to cluster suppliers and final apparel production geographically to facilitate
quick response (Pisano and Adams 2009).
In general, ‘fully globalized’ supply chains tend to appear in industries producing complex
products with a highly diverse array of underlying components—such diversity diminishes the

likelihood that all those components are optimally produced in a specific region. Supply chain
diffusion also requires a fair degree of modularity between component designs, which lessens the
need for suppliers to engage in face-to-face communication for coordination. Finally, global
supply chains tend to thrive when there are high scale economies of final production and the final
product can be relatively cheaply (quickly) transported to end markets around the world. An
iPhone is excellent example of a product produced through a fully globalized supply chain. The
iPhone is composed of a highly divese array of components (memory chips, logic chips, power
supplies, displays, casing materials, etc.). These originate from the US, Korea, Taiwan, Italy,
France, Inner Mongolia, and China. Since iPhone has a high value to weight ratio, transporation
costs to end markets are insignificant in final assembly location and thus Apple centralizes
production in China (where it has access to a massive labor force).
Market anchored supply chains geographically separate final production from component
production (like global supply chains), but put final production close to end markets. This occurs
where there is a low value to weight ratio of final products (thus making proximity to geographic
markets efficient), where scale economies of final production are small (relative to market size),
and where different end markets require different products (or require high levels of
customization).
Full localized supply chains contain both final assembly and a significant share of the supply
chain in the same region as end markets. Localized supply chains are surprisingly resilient today.
Localized supply chains tend to arise where there are strong economies of co-location of supply
chain activities due to perishability of intermediates (as one finds in food) or due to company
strategies emphasizing quick response (e.g. JIT suppy chains in the auto industry). Localized
supply chains require either production processes with very low scale economies (e.g. craft beer)
or massively large markets to overcome the fixed costs of establishing an entire supply chain and
final assembly in a given market (e.g. automobiles).

Finally, cluster anchored supply chains tend to arise for products where specific regions have
strong competitive advantage in multipe stages of production (or where there are agglomeration
economies across stages of production), but where there is global demand for the product. This
advantage may be due to natural resources (e.g. shale gas in the Dakotas), climate (e.g. wines),
historically embedded skills and infrastructure, or a strong national brand asscociation with
certain products (“Made in Italy” for fashion and luxury goods, “Made in Germany” for
automobiles, “Made in France” for perfumes, “Swiss Made” for timepieces, etc.). Beyond national
brand reputation effects, close coordination between all diverse elements of the supply chain are
important for driving desired quality characteristics. Such supply chains have global reach in that
end producs are shipped around the world, but the production is heavily rooted in local networks
of suppliers.
This framework provides a lens through which to understand the decline (or rise) of specific
clusters. Clusters can decline for two basic reasons. First, other competing clusters can gain an
advantage in terms of cost, quality, responsiveness to the customer needs, etc. Thus, for
instance, a big reason for the decline of the textile-apparel cluster in Massachusetts during the
20th century was the rise of lower cost textile-apparel cluster in the Southeastern US. Such
cluster-versus-cluster competition can be scene in today’s auto industry (e.g. the Michigan auto
cluster competes with auto clusters from around the world, including one in the southeastern US).
A second reason clusters may decline, though, is that agglomeration economies can dissipate
due to changes in technology, competitive dynamics, or institutional changes. For instance, until
the mid-1990s, the textile-apparel supply chain in the US was heavily localized (cotton from US
fields was woven into cotton fabric in American mills and then cut and sewn into garments in US
factories). After implementation of the WTO agreement reducing barriers to trade in this sector,
textile-apparel supply chains rapidly globalized. Toyota, like other auto companies, has evolved
from a heavily cluster based producer (with operations heavily concentrated around Toyota City
Japan) to a market anchored producer (as it moved final assembly operations to major markets
like the US) and then finally to a fully localized producer (as it created local supplier bases to
serve its assembly operations). Mass production furniture evolved from fully localized structures

to fully globalized structures (e.g. IKEA).
This raises the question why some clusters are able to survive “inter-cluster” competition and why
some clusters also resist changes to supply chain restructuring. In the next section of this paper,
we examine these issues with detailed case histories of four clusters located in northeastern Italy.
IV. Why Some Clusters Thrive in the Face of Globalization
In this section, we compare the recent histories of two pairs of clusters all located within a 50km
radius of northeastern Italy: 1) sport shoes (Montebelluna) and women’s fashion shoes (Brenta
Riviera) 2) chairs (Manzano) and furniture (Livenza). Italy is well known as an economy organized
around industrial districts (clusters). It is thus an ideal laboratory in which to investigate the
competitive dynamics driving cluster survival or decline. We chose this particular region because
it is one of Europe’s most industrialized regions (Eurostat 2014) and home to numerous Italian
industrial districts that have been heavily impacted by global competition. These four clusters—
sports shoes, women’s fashion shoes, chairs, and furniture—offer four very different patterns of
response and performance, despite being from the same region (this allows us to hold constant o
‘region-specific’ factors—such as wage changes, workforce shifts, taxation, etc.—that might
influence cluster performance).
A Tale of Two Boots
Separated by just 50 kilometers, the Montebelluna and Riviera del Brenta have long represented
Italy’s most prominent loci for the development and manufacture of two specific types of shoes:
professional sport shoes, including ski boots and hiking boots (Montebelluna) and women’s luxury
leather shoes (Riviera del Brenta). The production pole of Montebelluna developed thanks in part
to its proximity to the Dolomites; in the late 1800s, local artisans began producing hiking shoes for
mountain enthusiasts. During the 1900s, production expanded to other athletic shoes, including
sneakers and ski boots. During the 1980s, Montebelluna gave birth to numerous globally

renowned sport brands, like Tecnica, Nordica, Lotto, Diadora, and started drawing investments
from major international brands like Nike and The North Face.
Like Montebelluna, the beginning of the leather shoe production in Riviera del Brenta dates back
to the late 1800s, when a handful of artisanal laboratory settled down in the town of Stra (just
south of Venice). Similar to the majority of the Italian industrial districts, the Riviera del Brenta
flourished in the second half of the 1900s thanks to the growing domestic demand for consumer
goods items and strong exports to Germany, France, and the US.
While the origins and development of these two production hubs share significant similarities, the
way they adapted to the global economy over the past decade followed divergent trajectories. On
the one hand, lead firms in Montebelluna started offshoring production to lower cost economies
(first in Romania, later in China) while focusing on R&D, marketing and distribution; R&D became
decoupled from production. In the Riviera del Brenta, not only did production of leather shoes
remain stable, the region became a magnet for investments from several global fashion brands
like Armani, Prada, Dior, Louis Vuitton. It is estimated that 90% of women’s luxury shoes (priced
approximately $500 and above) are produced in the Riviera del Brenta. Not only does the region
manufacture shoes, but producers typically undertake a significant amount of R&D and
engineering there as well.
The distinct global supply chain strategies pursued by these two sets of lead firms had different
effects on both the competitiveness and the size of the local production systems. This divergence
is corroborated by data on the number of establishments and jobs from 2006 to 2012 in
Montebelluna and Riviera del Brenta that we analyzed from the ISTAT. In order to gather detailed
and accurate statistics of two very specific production hubs, we examined data from single
municipalities7 for a number of selected ATECO codes – the Italian equivalent of the U.S. NAICS
7 For each of the four production hubs, we created a list of municipalities that we deemed relevant in terms of their economic contribution to the specific regional industry we took into account. Single municipalities were selected thanks to historical data on employment and production activity that we obtained from several institutional sources, including Confindustria (the Italian association of manufacturing firms) and different labor unions.

code. The ATECO codes we considered in the analysis are ATECO 152 (shoes production –
which we used for both the Montebelluna and Riviera del Brenta productions) and ATECO 3230
(fabrication of sport equipment – which we only used for the Montebelluna cluster). The decision
to focus on the 2006-2012 period was dictated by the availability of data from the ISTAT.
However, this time frame allowed us to include in the analysis data from before the 2007 crisis
(i.e. 2006-2007), whose effects were not visible in Italy until 2008, as well as data for the years
after the deepest part of the crisis.
Data for the ATECO 152 shows a substantial decline in the number of jobs in the Montebelluna
area between 2006 and 2012. The size of the local workforce fell by 15% percent over this time
frame (from 5283 to 4508 employees). This downsizing was particularly sharp between 2008 and
2009 in coincidence with the financial crisis break out. During these two years almost 1000 jobs
were laid off. The effects of the economic crisis on the size of the local workforce are also visible
in Riviera del Brenta: a total of 472 workers were laid off between 2006 and 2008, accounting for
7% percent of the total workforce. However, in the Riviera del Brenta, employment growth
accelerated over the three-year period 2010-2012 (an increase of 200 jobs or 10% growth of the
overall Riviera del Brenta workforce). In contrast to sport shoe firms, shoe firms in the Riviera del
Brenta continued to produce locally and seldom switched to foreign suppliers.
The divergence of the two production hubs is even more evident if we focus on the fabrication of
sport equipment (ATECO 3230), Montebelluna’s most distinctive activity. Between 2007 and 2012,
the number of workers employed by local manufacturing firms decreased by 52% percent,
moving from 910 to 432 employees. The sharpest downsizing occurred between 2009 and 2011
(during which time, employment in the Brenta area increased by 10%).
The decline of production in Montebelluna is relatively easy to explain in the terms of our
framework above. The structure of the supply chain shifted from cluster-based to fully global. This
shift was enabled by characteristics of the production process and market. Athletic shoe

production and ski boots are high volume processes utilizing relatively unskilled labor.
Component production—like soles or the outer casing of the boot—utilize molds, which once
produced can be shipped anywhere. The modularity of shoe technology and the high degree of
process codification enables lead firms to outsource production to lower cost regions like Slovakia,
Romania, and China.
However, what seems to be harder to explain is why leather shoes manufacturing remains so
much anchored to the Riviera del Brenta region. While true that such shoes are produced in
smaller volumes using relatively highly skilled workers, such characteristics are by no means a
guarantee against cluster decline. Italy has witnessed the decline of other similar districts in the
face of global competition, including fine glass (Murano), upscale fashion clothing (Biella), design
leather sofas (Puglia-Basilicata), and professional bicycles (Veneto). Accordingly, our question is
not why production in Montebelluna has gone or whether it would ever come back, but rather why
Riviera del Brenta has managed to retain the bulk of manufacturing locally and has even
increased its competitive advantage compared to other footwear industrial regions in developed
economies, like the U.K., Portugal, and Spain.
To effectively tackle such a challenging question, we focused on the global supply chains of
upscale leather shoes and addressed the strategies of the lead firms operating in the Riviera del
Brenta. By doing so, we narrowed the focus of our analysis from an industry to a firm-level
perspective. In addition to providing us a finer grained spectrum of the actual dynamics
underlying the evolution of the Riviera del Brenta region, focusing on lead firms’ supply chain
strategies allowed us to include in the analysis factors from both the local and global
environments.
Our tentative hypothesis from our field research highlights the importance of what we will call a
“knowledge integrator” (KI). A KI represents a type of firm that connects different forms of
knowledge from distinct geographical contexts in an integrated supply chain. By exerting a direct

control over the entire supply chains, a KI is able to coordinate and integrate distinct forms of
knowledge that are essentials in sustaining the firm competitive advantage, as well as the
competiveness of its supply chain partners.
In the case of the Riviera del Brenta, the two main types of knowledge at stake are the production
know-how of skilled workers and suppliers and the design ideas conceived by global designers.
While these two categories are today tightly connected, and they indeed thrive on a continuous
exchange of knowledge. The KI integrates these two bodies of knowledge by having access to
both the designers and the skilled work force and suppliers. This clearly emerges in the case of
Alpha (a pseudonym), a globally renowned fashion brand which has been developing and
manufacturing its upscale female leather shoes in Riviera del Brenta since the late 1990s.
Headquartered in Milan, Alpha set up a production branch in Riviera del Brenta in order to take
advantage of the local availability of skilled labor force. In addition to improving its production
capabilities, the establishment of the Riviera del Brenta production branch allowed Alpha to foster
its innovation capabilities. Local skilled workers play a crucial role in “translating” the design
sketches conceived by global designers in actual prototypes, which represents the basis for any
product innovation. While this sustains the competitive advantage of Alpha, it permits local
suppliers to constantly advance the state of the art of their production know-how, hence
remaining ahead from foreign competitors catch up. As much as global designers need skilled
workers to translate their drawing into real artifacts, the Riviera del Brenta production system
needs to continuously improve its production capabilities by dealing with challenging and
heterogeneous requests from global designers. The KI keeps the local ecosystem dynamic,
constantly challenging it to develop new capabilities. Fundamental in this process is the role of
Alpha, since it works as a connecting platform for the different agents that participate in its global
process of value creation. Without Alpha’s knowledge-integrating function, producers from the
Riviera del Brenta would struggle to keep pace with the ever-changing fashion trends and would
miss the opportunity to challenge and stimulate their distinctive production capabilities.

Knowledge integrators currently operating in Riviera del Brenta are typically global brand-name
firms, a category which comprises both Italian and foreign companies. Some of these companies
were founded in Riviera del Brenta, some others joined the district over the past decade. External
firms settling down in Riviera del Brenta brought investments and created new jobs, above all in
the prototyping and manufacturing functions. Furthermore, and perhaps more importantly, their
presence allows local players to be inserted into global processes of value creation, thus
improving their production knowledge and advancing the edge of their competitive advantage.
Going Global to Stay Local—The Cases of Seats and Furniture
Like the Montebelluna and Riviera del Brenta manufacturing areas, the origins of the Livenza
(furniture) and Manzano (chairs) hubs date back to the late 1800 when the first shops were
established by local artisans. The early development of both areas was sustained by the
proximity to strategic sources of raw materials: woods from the Alps (Livenza8) and wild canes
from the Northern Adriatic lagoon (Manzano), which were used to manufacture woven seats. The
two industrial areas grew remarkably between the 1960s and the 1990s, thanks to the boom of
the domestic construction industry and the growth of foreign markets. Sustained by the
devaluation of the domestic currency (the Italian Lira) and the production flexibility of regional
production systems, exports to Germany, the U.K. and the U.S.A. during the 1980s marked the
beginning of the internationalization of the furniture industry in Northeast Italy. As of the mid
1990s, one third of the chairs sold in the world were manufactured in the Manzano industrial
region (Lombardi, 2013). Twenty years later, the production of chairs in Manzano has essentially
almost disappeared.
The industrial data we gathered from the ISTAT indicates that the number of workers employed
by Manzano chair producers decreased by 44% between 2006 and 2012, moving from 7744 to
4372 employees. Data for the most important ATECO code for furniture production (ATECO 310 -
- fabrication of furniture, including case goods, chairs, and upholstered items) reveal how the
8 Livenza is actually the name of the river through which local woodworkers sourced woods from the neighboring mountains.

downsizing of the local employment base primarily occurred in manufacturing-related activities. In
this precise ATECO code, the size of the local workforce decreased by 43% with a total of 2764
jobs laid off in only seven years.
The downsizing of the Manzano cluster is even more evident when we compare the evolution of
this production hub to the other major regional pole for furniture production: the Livenza cluster.
Located just sixty kilometers away, the production of case goods in the Livenza area remains one
of the key activities for the local economy and is home to numerous innovative firms, including
IKEAs largest European supplier. While severely confronted by the effects of the economic crisis,
which is still affecting Italian furniture producers, the size of the Livenza furniture hub measured
by employment remained stable between 2006 and 2012. The number of local workers involved
in the ATECO 310 moved from 17553 to 17257. With approximately 300 layoffs registered in
seven years, furniture production in the Livenza region proved to be resilient to both the drastic
downsize of the domestic demand and the increased global competition.
How can the production of two similar items within the same geographical region follow such
different trajectories? And what allowed the Livenza area to maintain local manufacturing
activities alive while the neighboring chair production in Manzano was loosing ground to foreign
competitors?
We found answers to these questions in the analysis of the global supply chains of local lead
firms. As in the Riviera del Brenta, our field research suggests that the competitiveness of the
Livenza industrial hub has been sustained by the presence of a firm playing the role KI who form
a bridge between local manufacturing knowledge and global knowledge from demanding buyers
and designers and heterogeneous customers. This process is best depicted by the case of Beta
(a pseudonym), IKEA’s European largest supplier and a strategic partner of the Swedish
company. Beta is a manufacturing company located in the heart of the Livenza area that has
been producing wooden furniture components (e.g. panels) for forty years. Before 1998, Beta

was a small company (approximately 20 million euros in sales). In 1998, Beta first began
supplying IKEA based on an innovation production process for making high quality laminated
woods. Beta’s sales increased twentyfold over the next 15 years (Beta is now the second largest
furniture company in Italy).
The tight cooperation established with Ikea encouraged the company to improve the efficiency of
its production system and enhance its prototyping and innovation competencies. In addition to
fueling the company’s learning process, Beta’s internationalization remarkably impacted on the
competitiveness of the entire Livenza industrial region. In fact, Beta is still tightly linked to the
local environment as it relies on some twenty specialized local suppliers and constantly hires
workers from declining companies or from the local “Scuola del Mobile”, Italy’s oldest professional
school for furniture makers. Beta sits at the intersection between global and local supply chains –
namely between IKEA and small specialized suppliers operating in the Livenza area. As in the
case of Alpha, Beta is responsible for connecting global sources of design knowledge to local
sources of manufacturing and technical know how, which are often difficult to codifiy and
therefore not accessible for global players like IKEA.
While being recognized as the Livenza’s largest furniture company, Beta doesn’t represent the
only knowledge integrator in the region. IKEA works with two other major companies in the
Livenza, who pursue a similar knowledge integration function. The Livenza furniture hub is also
home to many other smaller brand-name firms that compete in the global marketplace – mainly
by exporting their products to foreign markets. While marked by different business models –
these companies manufacture and sell final goods under their brand name – the role played by
these firms in the Livenza resembles that of Beta. On the one hand, they establish and manage
complex relationships with global designers and interior decorators – which are both their
customers and their first source of design inputs – while, on the other hand, they coordinate and
marshal a local network of highly specialized suppliers. In addition to feeding the whole local

supply chain, knowledge integrators constantly stimulate regional suppliers to enhance their
production know how in order to meet the heterogeneous requirements from global customers.
As much as knowledge integrators contribute to foster the performance of the Livenza region, the
almost complete absence of this type of firms has undermined the competitiveness of the
Manzano industrial hub. Despite being celebrated by local policy makers and entrepreneurs as
the chair capital of the World as late as the mid-1990s, the failure of this local industry reflects its
incapacity to produce knowledge integrators. Born as OEMs, local chair producers never updated
their business models and failed to move from being mere chair manufacturers to becoming
knowledge integrators. While Beta remarkably invested in new production technology to meet and
even anticipate the challenging requirements from IKEA, or other Livenza’s brand-name
producers invested in developing relationships with global designers, chair producers in Manzano
kept working as OEMs for larger global buyers. Once wooden chairs went out of fashion and
other materials – above all plastic – entered the market, global buyers turned to suppliers
specializing in different production process. The absence of knowledge integrators prevented the
Manzano chair hub to understand the emergence of new trends in the final market and therefore
to adapt existing production logics to new manufacturing paradigms. The importance of
knowledge integrators is confirmed by the fact that the largest and most successful company in
the Manzano area is a company that managed to complete this transition. Charlie (a pseudonym)
is a manufacturing firms specialized in the production and sale of contemporary furniture,
including chairs and tables. Unlike the vast majority of local firms, Charlie has been significantly
investing in distribution and retail over the past three decades. This strategy allowed the company
to develop a global network of retail stores, which ultimately connect the company to interior
designers and customers in general. While moving “downstream”, and therefore establishing a
permanent dialogue with the final market, Charlie maintained a stable presence in the Manzano
area where it develops and produces customized products either in-house or through specialized
suppliers. As in the Alpha and Beta cases, it is the company’s ability to integrate and manage
different forms of knowledge that ultimately sustains its competitive advantage in the global

marketplace and the overall capacity of a mature industrial region to adapt itself to the ever-
changing nature of international competition.
Other research on other Italian industrial districts has echoed similar themes. Lorenzoni and
Ornati (1989) were among the first to highlight the key role of “leading-firms” in orchestrating the
technical and operations of smaller sub-contractors inside Italy’s industrial districts. In a later
study of Italian districts producing shoes, leather goods, clothing, and furniture, Lazerson and
Lorenzoni (2008) found that the most successful lead firms in the district were generally focusing
on building distribution and marketing capabilities in global markets, even while shifting a growing
share of production outside the local districts. They were, in the words of Lazerson and Lorenzoni,
‘escaping the manufacturing cage.” Lazerson’s and Lorenzoni’s “leading firms” share in common
with our knowledge integrators a connection to the market. However, as the case of Beta
(furniture) shows, access to the market does not necessarily have to occur through direct
integration, but may well be achieve via partnerships with existing multi-nationals (such a strategy
comes with obvious transaction cost hazards). And unlike Lazerzon’s and Lorenzoni’s “leading
firms”, our knowledge integrators are deeply focused on building local manufacturing capabilities
through collaboration with and investment in local suppliers.
The contrast between “leading firms” (who focus on accessing markets) and “knowledge
integrators” (who attempt to connect global markets with local clusters) is also illustrative of how
different supply chain strategies may impact cluster performance. The strategies of sport shoe
firms in Montebelluna followed closely the “leading firms” model presented by Lazerson and
Lorenzoni (1999). They focused on design and marketing, while outsourcing production to low
cost locations; the manufacturing cluster atrophied not because another cluster became more
competitive, but because the supply chain shifted from cluster-anchored to global (through the
actions of firms). In contrast, in both Riviera del Brenta and Livenza, knowledge integrators have
thus far played a key role in both accessing global markets and deepening capabilities inside the
local manufacturing cluster. Whether manufacturing is geographically sticky depends, at least in
part, on whether firms make it that way.

VI. CONCLUSIONS
Can clusters survive globalization? The analysis contained in this paper suggests if
agglomeration forces are strong enough, we should still expect to see supply chains that cluster
geographically. Tacit knowledge, complex coordination requiring fast adaptation between
suppliers-buyers along the supply chain (such as one see with JIT systems), and the need for
frequent face-to-face problem solving, all create a cost of distance. These forces protect existing
clusters, but they by no means guarantee the survival of a specific cluster. Agglomerating forces,
like factor costs, are dynamic. As technologies and processes mature, knowledge may become
more standardized and codified, reducing the advantage of close proximity between players
along the supply chain. In some instances, firms pursue strategies specifically to reduce
agglomerating forces to enable a more competitive, global sourcing strategy. This was the case in
the Montebelluna sports shoe district in Italy. Lead firms focused on designs and processes that
enabled the supply chain to be disaggregated.
But even where agglomerating forces persist, an existing cluster can still be destroyed by the
emergence of a new, competitive cluster elsewhere in the world. This is not a new phenomenon.
Perhaps the most recent example occurred in the consumer electronic industry. The US and
Europe in the post-war period fostered strong consumer electronics clusters (specifically
television, radio, and stereo equipment). As the technology matured, and market growth
stagnated in the 1960s, US firms began to outsource some component production to Japan (at
first) and other parts of Asia (later). Eventually, Japan, Korea, and China developed their own
strong consumer electronics clusters that achieved a competitive advantage over the American
and European clusters. The US and European clusters declined not because co-location became
unimportant, but because new stronger clusters beat them.

Our study is highly preliminary and clearly more works needs to be done to understand the
dynamics of cluster rise and decline, and cluster-cluster competition. Our case studies offer some
illustrations of how clusters in one specific region have risen and declined, but more cross-
sectional, longitudinal analysis of large data sets are needed. Creating such a data set would be
a big step forward, and we hope in our future work to tackle this challenge.
Our implications for policy and management at this stage can only be very tentative given the
preliminary nature of the work. While offering all the usual caveats, we believe our analysis
highlights a number of issues for policymaker and managers to consider. The first is that cluster
decline is not an inevitable consequence of globalization. Manufacturing can be sticky
geographically. However, given global competition, manufacturing capabilities cannot be static.
Investment in process know-how, infrastructure, worker skills, and other critical elements of the
local ‘industrial commons’ (Pisano and Shih 2012) are essential for any cluster to remain vibrant.
Access to a strong cluster can be a source of advantage for firms with global market access.
Preserving the industrial commons supporting the cluster may not only be good for the local
economy, but can be a competitive advantage for the firm as well.
Second, once an industrial commons has eroded and a supply chain has disaggregated, it is very
difficult to rebuild. Currently, there is discussion in US policy circles and in some US companies
about the importance of “rebuilding” American manufacturing. Various cities and regions
(including Detroit) have launched local manufacturing initiatives. Detroit is now home to several
social entrepreneurs who are trying to rebuild the manufacturing base there through
manufacturing start-ups (e.g. Shinola Watch Manufacturing). Our analysis suggests that such
initiative require two things to be successful. The first is access to a large market (fortunately, for
US based firms, the US market is often large enough to achieve the necessary threshold). The
second though is a local base of suppliers and skilled workers who together provide a unique set
of capabilities. The power of the cluster is in the integration, not in the separate pieces.
Government policies should be careful not to focus on “local” manufacturing in contexts in which

the required capabilities are not local. A good example is the US Federal Government’s current
National Institutes of Manufacturing Initiative, which seeks to establish focused manufacturing
“hubs” in a variety of regions, each focused on a specific type of manufacturing process (e.g. 3D
printing in Youngstown, Ohio). Considering that that the capabilities in many new manufacturing
technologies are highly diffused geographically, it is a mistake to use these institutes to build local
manufacturing networks. Local only has an advantage in the face of deeply embedded knowledge
and high agglomeration forces.
As we saw from our case studies, the preservation of a cluster is not completely exogenously
determined by changes in factor prices or by changes in technology. Firm strategies make a
difference. In particular, knowledge integrators are needed to build a bridge between global
market access and local embedded knowledge. Early writings on clusters (e.g. Sabel and Piore
1984) focused on the internal cohesion and deeply embedded social ties. But our case studies
along with those of Lazerson and Lorenzoni (1999) suggest the opposite: to survive, clusters
cannot be insular. They need to be externally focused on global markets and be open to
technology and innovation from elsewhere. Bringing this global focus to the local cluster is the
critical job of the knowledge integrator.

REFERENCES Breznitz, D. and Buciuni, G. (Forthcoming), “Alfred Marshall Alive and Well? The Rise and
Evolution of Innovative Manufacturing Districts in a Globalizing Economy,” in D.
Audretsch, A. Link, and M. Walshok (eds). The Oxford Handbook of Local
Competitiveness, Oxford University Press: Oxford, UK.
Buciuni, G. Coro’, G. and Micelli, S. (2014), “Rethinking Manufacturing in Global Value Chains.
An International Comparative Study in the Furniture Industry.” Industrial and Corporate
Change, 23(4), 967-996.
De Marchi, V. and R. Grandinetti (2014), “Industrial Districts and the Collapse of the Marshallian
Model: Looking at the Italian experience.” Competition and Change 18(1), 70-87.
Deloitte Touche Tohmatsu (2003), “The challenge of complexity in global manufacturing. Critical
trends in supply chain management”. Deloitte Touche Tohmatsu: London, UK.
Eurostat (2014). “Eurostat Regional Yearbook”. European Commission.
Federal Reserve Statistical Release (2015), “Industrial Production and Capacity Utilization - G.17.”
March 16th, 2015.
Fuchs, E., and Randolph K. (2010), "Design for location? The Impact of Manufacturing Offshore
on Technology Competitiveness in the Optoelectronics Industry." Management Science
56 (12), 2323-2349.
Gereffi, G., J. Humphrey and T. Sturgeon (2005), “The Governance of Global Value Chains.”
Review of International Political Economy, 12(1), 78–104.
Goldthwaite R. (2009), The Economy of Renaissance Florence, The Johns Hopkins University
Press: Baltimore.
Krugman, P. (1991), Geography and Trade. MIT Press. Cambridge, MA.
Lazerson, M. and G. Lorenzoni. (1999), "Resisting Organizational Inertia: The Evolution of
Industrial Districts." Journal of Management and Governance 3, 361-377.
M. Lazerson and G. Lorenzoni (2008) “Transforming Industrial Districts: How Leading Firms Are
Escaping the Manufacturing Cage” in S. Cropper, M. Ebers, C. Huxham, and P. Smith
Ring (eds.) The Oxford Handbook of Inter-Organizational Relations
Lorenzoni, G. and O. A. Ornati (1989), "Constellations of Firms and New Ventures." Journal of
Business Venturing 3(1) 41-57.
Liveris, A.N. (2011), Making it in America. The Case for Reinventing the Economy. John Wiley &
Sons: Hoboken, NJ.
Macher, J., Mowery, D. and T. Simcoe (2002), “E-business and the Semiconductor Industry
Value Chain: Implications for Vertical Specialization and Integrated Semiconductor
Manufacturers”. Industry and Innovation, 9, 155-181.

Markusen, A. (1996), "Sticky Places in Slippery Space: A Typology of Industrial Districts."
Economic Geography, 72 (3), 293-313.
Marshall, A. (1890), Principles of Economics. Macmillan: London, UK.
McCormack, R. (2010), “U.S. Becomes a Bit Player in Global Semiconductor Industry”.
Manufacturing and Technology News, 17 (3).
Porter, M. E. (1990), The Competitive Advantage of Nations. Free Press: New York.
Piore, M. J. and C. F. Sabel (1984). The Second Industrial Divide: Possibilities for Prosperity.
Basic Books: New York.
Pisano, G. P. (1996), "Learning-before-doing in the Development of New Process Technology."
Research Policy 25 (7), 1097-1119.
Pisano, G. P. and P. Adams (2009), “VF Brands: Global Supply Chain Strategy.” Harvard
Business School Case, no. 9-610-022. Harvard Business School Publishing, Boston, MA.
Pisano, G.P. and W. C. Shih (2012), Producing Prosperity. Why America Needs a Manufacturing
Renaissance. Harvard Business Review Press: Boston, MA.
Sirkin, H., Zinser, M. and D. Hohner (2011), “Made in America, Again. Why Manufacturing Will
Return to the U.S.” The Boston Consulting Group, Boston, MA.
Teece, D. J (1976), The Multinational Corporation and the Resource Costs of Technology Transfer, New York: Ballinger Publishing Company.