Embed Size (px)
Citation preview

THE JOURNAL OF FINANCE • VOL. , NO. 0 • XXXX 2018
Can Innovation Help U.S. Manufacturing FirmsEscape Import Competition from China?
JOHAN HOMBERT and ADRIEN MATRAY∗
ABSTRACT
We study whether R&D-intensive firms are more resilient to trade shocks. We correctfor the endogeneity of R&D using tax-induced changes to R&D costs. While risingimports from China lead to slower sales growth and lower profitability, these effectsare significantly smaller for firms with a larger stock of R&D (about half when movingfrom the bottom quartile to the top quartile of R&D). We provide evidence that thiseffect is explained by R&D allowing firms to increase product differentiation. Asa result, while firms in import-competing industries cut capital expenditures andemployment, R&D-intensive firms downsize considerably less.
THE RISE OF CHINA, TRIGGERED BY ITS transition to a market-oriented economyand rapid integration into world trade, has been identified as a major sourceof disruption for high-income economies, igniting the long-standing debate re-garding the effect of trade with low-wage countries on firms and workers in theUnited States and Europe and regarding which firms are better able to absorbthese stocks. In this context, innovation is often viewed as an effective shieldagainst low-cost foreign competition by allowing firms to climb the quality lad-der and differentiate their products from low-wage countries’ exports. Becausewage differences are so large, so the argument goes, competing on costs is boundto fail. Only firms that have invested in R&D and upgraded product qualityare able to compete successfully against low-cost imports (e.g., Leamer (2007)).
∗Johan Hombert is with HEC Paris and CEPR. Adrien Matray is with Princeton University. Wethank Nick Bloom; Gerard Hoberg; Rich Mathews; Stephen Redding; Amit Seru; Stefan Zeume;Michael Roberts; and two anonymous referees as well as seminar participants at INSEAD, Copen-hagen Business School, Stanford University, CSEF–University of Naples, Imperial College, Mon-treal University, Erasmus University, Ghent University, the Harvard Business School; and con-ference participants at the Labex Ecodec Workshop at HEC Paris, the London Business School2015 Summer Finance Symposium, the 2015 Western Finance Association meeting, the 2015Workshop on Entrepreneurial Finance and Innovation Around the World, the 2015 Workshop onthe Economics of Corporate Ownership, the European Summer Symposium in Financial Markets(Gerzensee) 2015, the 2015 Econometric Society World Meeting, and the 2016 NBER Productivity,Innovation, and Entrepreneurship. Zhen Ye provided excellent research assistance. Hombert ac-knowledges financial support from the Investissements d’Avenir Labex (ANR-11-IDEX-0003/LabexEcodec/ANR-11-LABX-0047). Matray acknowledges financial support from the Julis-RabinowitzCenter for Public Policy and Finance. All of the authors have read the Journal of Finance’s disclo-sure policy and have no conflict of interest to disclose.
DOI: 10.1111/jofi.12691
1

2 The Journal of Finance R©
This view has had a large influence on public policies. In particular, it hasprovided further justification for R&D subsidies.1
There is surprisingly little evidence, however, about whether firms that haveinvested in R&D are indeed shielded from trade shocks. In this paper, weprovide direct evidence of this relation. In particular, we show that firm perfor-mance (sales growth and profitability) is less adversely affected by an increasein import competition when the firm has ex ante invested more in R&D. Themagnitude is economically large. Moreover, we also show that the effect oper-ates through product differentiation.
The innovation literature analyzes a related but different question, namely,how firms endogenously adjust their R&D investment ex post, that is, afteran increase in import competition. This approach can be interpreted throughthe lens of a revealed preference argument, whereby firms’ innovation choiceafter trade shocks “reveals” their expectations as to whether R&D is an effec-tive shield against import competition. Recent evidence using this approach ismixed. Bloom, Draca, and Van Reenen (2016) find a positive relation betweenimport competition and innovation in Europe, whereas Autor et al. (2016) finda negative relation in the United States.
The revealed preference argument has two important limitations, however.First, the sensitivity of R&D investment to import competition may be infor-mative about the sign of the relationship between returns to R&D and importcompetition but not about its magnitude, as the elasticity also depends on theR&D cost structure. Second, even the estimated sign of this relationship maybe wrong even if trade shocks are instrumented because the decision to inno-vate in reaction to a shock depends on factors over and above the mere returnsto R&D, such as credit constraints, managers’ expectations regarding both theeffect of the shock and the gain from innovating, and agency issues that may in-duce manager short-termism.2 Because import penetration shocks affect cashflows, studying firms’ endogenous R&D response to these shocks may yield anincorrect answer to the question of whether R&D mitigates the negative effectof trade shocks. For instance, it may be the case that R&D is an effective shieldagainst import competition but firms suboptimally cut R&D expenditures aftertrade shocks due to financing or agency frictions. This would explain why theevidence of the effect of import competition on ex post R&D choices is mixed.
In this paper, we adopt a direct approach to estimating the effect of R&Don firms’ resilience to import competition. We test whether firm performance
1 In 2013, 27 of the 34 OECD countries and a number of non-OECD economies provided fiscalincentives for R&D (OECD (2014)). The European Union’s Lisbon Strategy envisioned makingEurope “the most competitive and dynamic knowledge-based economy in the world (...) to increaseits productivity and competitiveness in the face of ever fiercer global competition” (EuropeanCommission (2010)).
2 These frictions are particularly relevant for R&D expenditures because they are typically cutin priority upon negative cash flow shocks. For instance, Aghion et al. (2012) show that creditconstraints force firms to cut R&D more than other expenditures during downturns, loweringproductivity growth. Bhojraj et al. (2009) show that R&D is a key strategic variable used bymanagers to manipulate short-term earnings to the detriment of long-term profitability.

Can U.S. Manufacturing Firms Escape Import Competition from China 3
as measured by sales growth or profitability is less adversely affected by anincrease in import competition when the firm has invested more in R&D beforethe increase in import penetration. We conduct this test in the context of China’sexport boom and its effect on U.S. manufacturing firms. This allows us toestimate the effect of R&D as an ex ante moderating variable on the disruptiveeffects of trade with China.
To inform the identification strategy, we first develop a model of the interplaybetween R&D and product market competition. The model shows that whenwe make rigorous the two limitations of the revealed preference argumentdiscussed above and shows that regressing R&D on import penetration doesnot identify the effect of R&D on firm resilience to import competition (even ifimport penetration is correctly instrumented). The model further shows thatregressing firm performance on import penetration interacted with R&D yieldsan unbiased estimate of this effect only if both import penetration and R&Dare instrumented.
First, China’s import penetration in the United States may be endogenousto the performance of U.S. firms as lower productivity in the United Statesmay lead to higher imports to the United States. To isolate the component ofChina’s rising exports that stems from internal supply shocks in China, weborrow a classic identification strategy from international trade economics.Specifically, we instrument China’s import penetration in the United Statesat the industry level using China’s import penetration in other high-incomecountries (e.g., Autor, Dorn, and Hanson (2013), Hummels et al. (2014)). Therehas been tremendous import growth from China in some industries (e.g., tex-tiles, electronics, furniture, and industrial equipment) but not in others (e.g.,tobacco, printing, food, and petroleum). This cross-industry heterogeneity issimilar in the United States and in the other high-income economies, whichsuggests that it is driven by supply shocks in China.
Second, the accumulation of R&D capital is potentially endogenous to firms’productivity, management quality, and product demand. We thus instrumentfor R&D at the firm level using tax-induced changes to the user cost of R&Dcapital. After the introduction of the U.S. federal R&D tax credit in 1981,U.S. states started to introduce R&D tax credits as well. In 2006, 32 statesoffered tax credits, in some cases considerably more generous than the federalcredit (Wilson (2009)). The staggered implementation of these R&D policiesgenerates variations across states and over time of the price of R&D, which inturn generates exogenous variation in firms’ R&D stock.
With these two instruments in hand, we estimate how firms are affected by(exogenous) import competition, conditional on their (exogenous) R&D stockbefore the competition shock. Our preferred specification includes firm fixedeffects to absorb time-invariant firm characteristics and industry-by-year fixedeffects to account for industry-specific productivity shocks and changes in con-sumer demand.
We show that China’s import penetration has a sizable adverse effect onthe unconditional (i.e., independent from the R&D level) performance ofU.S. manufacturing firms. On average across U.S. manufacturing firms, a

4 The Journal of Finance R©
one-standard-deviation increase in import penetration reduces annual salesgrowth by 1.8 percentage points. This negative shock to sales triggered by in-creased import competition leads in turn to lower profitability. On average,a one-standard-deviation increase in import penetration reduces return onasset (ROA) by 1.1 percentage points. These preliminary results are consis-tent with the literature showing that U.S. manufacturing industries exposedto low-wage-country imports experience slower growth (Bernard, Jensen, andSchott (2006)), and validate the use of the Chinese export boom as a competitionshock negatively impacting U.S. industries.
Next, we study how the effect of import competition on firm performancevaries with firms’ stock of R&D capital. We show that firms that have ac-cumulated a higher stock of R&D capital are significantly less affected byimport competition. Going from the 25th percentile to the 75th percentile ofthe distribution of R&D stock reduces the decline in annual sales growth by0.9 percentage points (i.e., half the average effect) and reduces the decreasein ROA by 1 percentage point (i.e., about the same magnitude as the averageeffect).
We also open the black box of the mechanism through which a higherstock of R&D mitigates trade shocks. R&D can lead to higher product marketperformance for two reasons: vertical differentiation (Sutton (1991)) or higherproductivity (Grossman and Helpman (1991) and Aghion and Howitt (1992)).To shed light on the mechanism, we employ a model of competition withvertical differentiation that allows us to contrast the effect of R&D on firmperformance through higher vertical differentiation versus lower cost. Themain insight of the model is that the marginal benefit of higher verticaldifferentiation increases when low-cost competition increases, while themarginal benefit of higher productivity decreases when low-cost competitionincreases. Accordingly, we hypothesize that the mechanism through whichthe stock of R&D makes firms more resilient to trade shocks works throughproduct differentiation. The model suggests two potential channels related toproduct differentiation.
The first channel is that the benefit of differentiation increases when importcompetition increases. This channel hinges on two ingredients: (i) firms thathave invested more in R&D in the past have more differentiated products in-dependent of the intensity of import competition, and (ii) the marginal benefitof product differentiation increases when import competition increases. Takentogether, (i) and (ii) imply that the marginal benefit of a higher stock of R&D in-creases when import competition increases. Using Hoberg and Phillips (2016)text-based measure of product similarity vis-a-vis peer firms to proxy for dif-ferentiation, we provide evidence for (i) and (ii).
The second channel is that the incentive to differentiate increases whenimport competition increases. If past R&D makes firms more responsive andimproves their ability to differentiate in the case of increased competition,then firms that have invested more in R&D in the past should have greaterdifferentiation in response to a competition shock, mitigating the effect of theshock. We find support for this channel by showing that firms with a larger stock

Can U.S. Manufacturing Firms Escape Import Competition from China 5
of R&D capital increases product differentiation when import penetration fromChina increases.
An ancillary prediction of these product differentiation mechanisms is thatthe effect of R&D on firms’ resilience to trade shocks should be stronger inindustries in which product differentiation is more prevalent. To test this pre-diction, we proxy for the extent of differentiation at the industry level using theindustry average of firm-level differentiation. We find that the effect of R&D isstronger in industries in which differentiation is more important. This resultlends further support to the Sutton’s (1991) argument that vertical differentia-tion is instrumental to absorb and escape competition shocks. Taken together,these results are consistent with the view that R&D makes firms more re-silient to trade shocks because it allows them to climb the quality ladder anddifferentiate (ex ante and ex post) their products.
Finally, having shown that R&D has an economically meaningful effect onthe resilience of firm performance to trade shocks, we explore the real effects oncapital expenditures and employment. We find that, on average across firms, aone-standard-deviation increase in China’s import penetration reduces growthin fixed capital by 1.6 percentage points. However, firms with a larger stock ofR&D are significantly less affected. Moving from the 25th percentile to the 75th
percentile of R&D capital offsets the reduction in capital expenditures by 1.4percentage points of fixed assets (i.e., almost the same as the average effect).We find a similar pattern for employment. Firms at the 25th percentile of theR&D distribution experience a significant 1.3 percentage point reduction inannual employment growth in response to a one-standard-deviation increasein import competition. In contrast, firms at the 75th percentile of the R&Ddistribution experience only a modest and statistically insignificant reductionin employment growth.
Our paper adds to the literature (surveyed by Bernard et al. (2012)) on theimpact of import competition on firms in high-income economies. Most papersin this literature analyze the unconditional effect of trade shocks on variousdimensions of firm performance such as output and survival (Bernard, Jensen,and Schott (2006)), cost of debt (Valta (2012)), leverage (Xu (2012)), capital ex-penditure (Fresard and Valta (2016)), and employment and outsourcing (Pierceand Schott (2016)). There is little evidence, however, as to which firms are bet-ter able to cope with trade shocks. A notable exception is Bernard, Jensen, andSchott (2006), who show that capital-intensive plants are more likely to surviveand grow in the wake of import competition.3 We complement this literatureby showing that R&D-intensive firms are better able to cope with trade shocks.Furthermore, our results highlight a complementarity between R&D capitaland fixed capital in the face of import competition. In import-exposed indus-tries, firms with an exogenously larger stock of R&D find it optimal to increasetheir stock of fixed capital as well.
3 Using aggregate data, Khandelwal (2010) also shows that the negative effect of low-income-country imports is stronger in industries characterized by a short-quality ladder (i.e., products areof similar quality).

6 The Journal of Finance R©
We also contribute to the literature on the interaction between innovationand product market competition. In early contributions, Schumpeter (1943)argues that competition erodes private returns to innovation, whereas Ar-row (1962) views innovation as allowing firms to escape competition. Sub-sequent empirical literature (discussed above) has mostly analyzed how firms’endogenous decision to invest in innovation relates to the intensity of competi-tion. We contribute to this literature by providing direct evidence as to how thereturn to R&D investment relates to import competition, rather than inferringthis relation indirectly from a revealed preference argument that can be biasedby financing or agency frictions.
The rest of the paper is organized as follows. Section I outlines the theoreticalframework. Section II describes the empirical strategy and data. Section IIIpresents the results on resilience to trade shocks, Section IV presents theresults on product differentiation, and Section V presents the results on the realeffects on capital expenditures and employment. Section VI provides robustnesschecks. Section VII concludes. Additional material can be found in the InternetAppendix.4
I. Theoretical Framework
This section outlines a stylized model of the interplay between innovation andimport competition. We use this framework to guide the empirical identificationof the effect of R&D on firms’ resilience to import competition.
A. Setup
There is a large number of risk-neutral firms. Each firm chooses a level ofinnovation effort R ≥ 0 ,where R stands for R&D, at cost c(R) = R + θ R + ρ
2 R2.The parameter θ varies across firms and reflects the idea that some firms mayhave a lower opportunity cost of R&D because they are better managed, are lessfinancially constrained, or benefit from innovation subsidies. The parameterρ > 0 also varies across firms and captures the extent of decreasing returns toR&D investment.
A firm exerting higher innovation effort has a higher probability of innovat-ing. Let I ∈ {0, 1} be a dummy variable equal to one if the firm’s innovationeffort is successful. We assume that P[I = 1|R] = R and I conditional on R isindependent of all other exogenous variables.5
Firms face import competition. We make two natural assumptions regardingthe effect of import competition and innovation on firm performance.6 First,higher import competition leads to lower performance whether the firm in-novates or not. Denoting by T the intensity of import competition, where T
4 The Internet Appendix may be found in the online version of this article.5 It is straightforward to impose additional parameter restrictions to ensure R ∈ [0, 1] without
affecting the rest of the analysis. Alternatively (and equivalently), I could be a continuous variablemeasuring innovation intensity such that E[I|R] = R.
6 Firm performance can be any measure of product market success, such as sales or profits.

Can U.S. Manufacturing Firms Escape Import Competition from China 7
stands for Trade, firm performance when the outcome of the firm’s innovationeffort is I ∈ {0, 1} is equal to7
πI = aI − bIT , with b0 > 0, b1 > 0. (1)
Second, successful innovation increases performance at any level of importcompetition: π1 > π0 for all T .
Firm performance (1) can be rewritten as
π = a0 + (a1 − a0)I + [−b0 + (b0 − b1)I]T . (2)
The term in brackets in equation (2) measures the sensitivity of performanceto import competition, which depends on the outcome of the firm’s innovationeffort. The sign of (b0 − b1) determines whether this sensitivity is higher for in-novators or noninnovators. When b0 is high, import competition weighs heavilyon the performance of noninnovators. This effect, identified by Arrow (1962)and referred to by Aghion et al. (2005) as the escape competition effect, impliesthat innovative firms are better able to escape competition than noninnovativefirms and thus are more resilient to competition shocks. Conversely, when b1 ishigh, import competition erodes the competitive edge of innovative firms as inSchumpeter (1943). In this case, innovative firms are relatively more sensitiveto competition shocks.
Let α = a0, β = −b0, γ = a1 − a0, and δ = b0 − b1. Then, we can rewrite equa-tion (2) as
π = α + β T + γ I + δ T I. (3)
The goal of this paper is to estimate δ, which tells us the effect of importcompetition on firm performance varies with the firm’s level of innovation.In particular, we want to determine whether δ is positive (the Arrow effectdominates) or negative (the Schumpeterian effect dominates) as well as theeconomic magnitude of the net effect, that is, the degree to which R&D can (orcannot) mitigate the adverse effect of import competition.
B. Import Penetration Scaled by 10-Year Lagged Employment
In Internet Appendix I, we develop a simple model of product market com-petition with vertical differentiation to identify conditions under which δ maybe positive or negative. The main insight is that δ depends on the relationbetween innovation and product differentiation. When innovation leads to in-creased product quality and enhanced product differentiation, it allows firmsto preserve market shares and hence the Arrow effect dominates (δ > 0). When
7 In keeping with our focus on import competition, we assume that performance does not dependon the innovation outcome of other domestic firms. Allowing firm performance to depend on theaverage innovation of other domestic firms in the same industry would add an industry-specificconstant term in equation (1) as well as equations (2), (3), and (5). In our empirical setting in paneldata, this term would be absorbed by industry-year fixed effects, which we include in our preferredspecification.

8 The Journal of Finance R©
innovation increases productivity but does not enhance product differentia-tion, its positive effect on performance is eroded by competition and hencethe Schumpeterian effect dominates (δ < 0). We study empirically the role ofproduct differentiation in Section IV.
C. Identification
C.1. Previous Literature
Previous studies address these questions by studying firms’ endogenouschoice of innovation in response to an exogenous competition shock (e.g.,Scherer and Huh (1992), Aghion et al. (2005), Autor et al. (2016), and Bloom,Draca, and Van Reenen (2016), among many others).8
This approach has two main limitations to identifying δ. To see why, notethat firms’ choice of innovation effort is given by
R = arg maxR
E[π |R] −((1 + θ )R + ρ
2R2
)= 1
ρ(γ + δT − (1 + θ )). (4)
As can be seen, firms conduct more R&D when the unconditional return toinnovation is large (high γ ), when the cost of R&D is low (low θ ), when tradeshocks are large and the Arrow effect dominates (high T and δ > 0), or whentrade shocks are small and the Schumpeterian effect dominates (low T andδ < 0). Prior studies regress innovation choice (R) on instrumented competition(T ). Equation (4) suggests that doing so provides only indirect, or even biased,information about δ.
First, even absent an endogeneity problem, regressing R on T can only iden-tify δ/ρ. Since ρ > 0, the sign of δ can be determined. However, the value of δ
cannot be pinned down because the cost parameter ρ is unknown to the econo-metrician. The economic intuition is that the sensitivity of R&D to competitiondepends on both the Arrow versus Schumpeterian effect trade-off (δ) and on thecost structure of R&D investment (ρ). Thus, the economic magnitude of the Ar-row versus Schumpeterian effect trade-off cannot be identified from sensitivityof the R&D to competition alone.
Second, even if import competition is correctly instrumented, firms’ endoge-nous innovation choices depend not only on returns to innovation (γ + δT ) butalso on various costs and frictions such as credit constraints and agency issues(captured by parameter θ in the model). For instance, if an increase in compe-tition reduces firms’ cash flows and tightens financing constraints, firms mayrespond to competition shocks by cutting investment in innovation not becauseinnovation has negative net present value (NPV), but because the firms areconstrained. Formally, the estimate of γ /ρ would be biased in this case because
8 Aghion et al. (2005) instrument for import competition using the introduction of the EuropeanSingle Market; Bloom, Draca, and Van Reenen (2016) use the removal of product-specific quotasfollowing China’s entry into the WTO; and Autor et al. (2016) use imports in other high-incomecountries.

Can U.S. Manufacturing Firms Escape Import Competition from China 9
θ is correlated with T . Crucially, the estimate would be biased even if T isinstrumented because the correlation between T and θ comes from T causingθ , and thus this correlation would not be removed by instrumenting for T .
In sum, regressing R on T cannot identify δ, and may even lead to incorrectinference regarding the sign of δ. This may explain why papers that followthis approach generate conflicting results (e.g., Bloom, Draca, and Van Reenen(2016) find a positive effect while Autor et al. (2016) find a negative effect). Adifferent approach is thus needed to estimate δ.
C.2. Our Approach
Our approach is to study directly how firm performance is affected by R&D,import competition, and the interaction between R&D and import competition.Specifically, we estimate
π = α + β T + γ R + δ T R + ε, (5)
where firm performance, π , and R&D, R, are measured at the firm level andtrade flows, T , are measured at the industry level.
Estimating (5) with OLS may lead to biased estimates because both R&D andtrade flows are endogenous. In Internet Appendix II.A, we study both sourcesof bias and show how to correct for them. Here, we summarize the main resultsof this analysis (Propositions IA1 to IA4):
(i) Endogeneity of R&D creates two biases in the OLS estimator of δ. Thefirst is a bias away from zero. It arises because firms with higher ex-pected returns to R&D endogenously choose a higher level of R&D. Thesecond bias may go in either direction. It comes from the correlation be-tween R&D opportunities and resilience to trade shocks, which may bedriven, for instance, by unobserved heterogeneity in the quality of firmmanagement.
(ii) Instrumenting for R&D using an exogenous cost shifter corrects thesetwo biases. In the empirical analysis, the instrument that we use is theR&D tax credit.
(iii) Endogeneity of trade flows creates a negative bias in the OLS estimatorof δ. The bias arises because of random shocks to industry innovation.When firms in a domestic industry successfully innovate, that is, whenthe realized returns to R&D are above average, R&D reduces importpenetration in the industry because domestic firms have high realizedproductivity relative to foreign producers. This mechanism creates a spu-rious negative correlation between realized returns to R&D and importpenetration, creating a downward bias in the OLS estimate of δ.
(iv) Instrumenting for import penetration in the domestic country using im-port penetration in comparable countries (other high-income countriesin our empirical analysis) corrects this bias.

10 The Journal of Finance R©
II. Empirical Strategy and Data
To examine whether U.S. firms that are more innovative perform better in thewake of import competition from China, we follow the difference-in-differenceapproach analyzed in Section I.C.2. Specifically, we compare the performanceof high-R&D firms to low-R&D firms operating in industries that are highlyexposed to import competition from China versus industries that are less ex-posed to import competition from China. This approach is valid if the amountinvested in R&D at the firm level is instrumented by an exogenous cost shifterand China’s import competition in the United States is instrumented usingChina’s import penetration in countries comparable to the United States. Wediscuss the instrument for import penetration in Section II.A, the instrumentfor R&D in Section II.B, and the econometric specification in Section II.C.
A. Instrument for Import Penetration
To isolate the component of Chinese import penetration in the United Statescoming from Chinese productivity and trade cost shocks, we follow the approachof Autor, Dorn, and Hanson (2013) analyzed formally in Propositions IA3 andIA4 and we instrument imports from China to the United States using importsfrom China to other high-income markets. This strategy is valid if the commonwithin-industry component of increasing Chinese imports to the United Statesand other high-income countries stems from rising productivity and fallingtrade costs in these sectors in China. One possible threat to identification isthat productivity shocks may be correlated across high-income economies andthis correlation may drive the common component of import growth in theUnited States and other high-income countries. While we cannot categoricallyreject this possibility, evidence suggests that the surge in Chinese exports isstrongly related to internal changes in China, which have involved massiveinternal migration to the cities; Chinese industries gaining access to foreigntechnologies, capital goods, and intermediate inputs; multinational companiesbeing permitted to operate in the country; and the country’s admission to theWorld Trade Organization (WTO) in 2001. This transition to a market economyhas led to rapid productivity growth and a massive increase in the country’smanufacturing capacity. Between 1991 and 2007, China’s share of manufac-turing imports grew sharply, from 6.7% to 25.0% in the United States andfrom 3.7% to 16.1% in other high-income countries. This is fast even comparedto Mexico and Central America, which signed free trade agreements with theUnited States during that period and whose share grew from 9.8% to 13.8%over the same period.
Data on bilateral trade flows come from UN Comtrade. We use manu-facturing imports from China both to the United States and to a group ofeight high-income countries (Australia, Denmark, Finland, Germany, Japan,New Zealand, Spain, and Switzerland) aggregated at the four-digit SIC levelover the period 1991 to 2007.9 Figure 1, Panel A, plots total manufacturing
9 The data are available on David Dorn’s website.

Can U.S. Manufacturing Firms Escape Import Competition from China 11
(a)
(c)
(b)
Figure 1. Manufacturing imports from China to the United States and to other high-income countries. Panel A plots total manufacturing imports (in 2007 billion USD) from Chinato the United States (blue line) and to a group of eight other high-income countries (red line:Australia, Denmark, Finland, Germany, Japan, New Zealand, Spain, and Switzerland). Panel Bplots China’s import penetration in the United States (blue line) and in a group of eight other high-income countries (red line; Australia, Denmark, Finland, Germany, Japan, New Zealand, Spain,and Switzerland) by broad manufacturing industry. For each broad industry, import penetrationis measured as imports (in 2007 k$) from China in the industry divided by industry employmentin 1990. Panel C plots the 1991 to 2007 change in China’s import penetration in the United Stateson the y-axis against China’s import penetration in a group of eight other high-income countries(Australia, Denmark, Finland, Germany, Japan, New Zealand, Spain, and Switzerland) on the x-axis. Each dot represents a four-digit manufacturing industry. For each industry, change in importpenetration is measured as the change in imports (in 2007 k$) from China in the industry from1991 to 2007 divided by industry employment in 1990.

12 The Journal of Finance R©
Table IChange in China’s Import Penetration by Broad Industry
The table ranks two-digit manufacturing industries in descending order of the change in China’simport penetration in the United States. For each industry, the change in import penetration ismeasured as the change in imports (in 2007 k$) from China in the industry from 1991 to 2007divided by industry employment in 1990.
1991 to 2007 Change in China’sTwo-Digit SIC Industries Import Penetration (k$/worker)
31 Leather and leather products 103.539 Miscellaneous manufacturing industries 82.236 Electronic and other electronic equipment 50.425 Furniture and fixtures 34.035 Industrial machinery and equipment 33.023 Apparel and other textile products 28.033 Primary metal industries 13.830 Rubber and miscellaneous plastics products 13.432 Stone, clay, and glass products 10.934 Fabricated metal products 9.638 Instruments and related products 7.828 Chemicals and allied products 7.124 Lumber and wood products 5.626 Paper and allied products 5.337 Transportation equipment 3.922 Textile mill products 2.929 Petroleum and coal products 2.620 Food and kindred products 1.827 Printing and publishing 1.521 Tobacco products 0.2
imports from China to the United States and to the other high-income coun-tries. From 1991 to 2007, manufacturing imports from China increased 12-foldin the United States, suggesting an economically significant shock for Ameri-can manufacturing firms. During the same period, Chinese manufacturing im-ports to other developed economies followed a similar pattern with a ninefoldincrease. The parallel evolution in the United States and in other high-incomecountries is consistent with our assumption that the surge in Chinese exportsis due primarily to forces exogenous to the U.S. economy.
We define China’s import penetration in the United States at the industry-year level as imports from China in a given industry-year normalized by in-dustry employment. Since employment is endogenous to import shocks, wemeasure industry employment at the beginning of the period (in 1990) fromthe County Business Pattern data.10 Table I reports the 1991 to 2007 changein import penetration for each broad (two-digit SIC) manufacturing industry.Imports from China grew strongly in the textile, electronic, furniture, and in-dustrial equipment industries, while tobacco, printing, food, and petroleum didnot face increased Chinese competition.
10 In Internet Appendix III.A, we show that our results are robust to scaling import penetrationby employment 10 years before the beginning of the sample period (in 1980).

Can U.S. Manufacturing Firms Escape Import Competition from China 13
Table IIInstrument for Import Penetration: First-Stage Regression
The sample comprises four-digit industries over the 1991 to 2007 period. We estimate a linearregression model where the dependent variable is China’s import penetration in the United Statesat the industry-year level. The dependent variable is China’s import penetration in a group of eightother high-income countries (Australia, Denmark, Finland, Germany, Japan, New Zealand, Spain,and Switzerland). Import penetration is measured as imports (in 2007 k$) from China divided byindustry employment in 1990. The regression includes industry and year fixed effects. Standarderrors are clustered by industry and year. *** indicates statistically different from zero at the 1%level of significance.
Import Penetration in the United States
Import penetration in other high-income countries 1.36***(0.12)
Industry FE YesYear FE YesObservations 2,885Adjusted-R2 0.94
We similarly define China’s import penetration in the other high-incomecountries. Figure 1, Panel B, plots the evolution of import penetration in theUnited States and in the other high-income countries between 1991 and 2007by broad industry. The figure shows that the increase in Chinese import pene-tration in the United States is concentrated in the same set of industries as inthe other high-income countries.
Figure 1, Panel C, goes at a more granular level by plotting the changein import penetration from 1991 to 2007 in the United States against importpenetration in the other high-income countries for each four-digit industry. Thefigure confirms that import penetration across industries is highly correlatedbetween high-income economies. These patterns are consistent with the viewthat the surge in Chinese exports is due to rising productivity in China.
To construct the predicted value for import penetration in the United States,we regress China’s import penetration in the United States at the four-digitindustry-year level on China’s import penetration in the eight other high-income countries and a full set of industry and year fixed effects. The first-stage regression results are reported in Table II. We obtain a positive andstatistically significant coefficient of 1.36 on import penetration in other high-income countries (standard error 0.12 clustered by industry and year). TheF-statistic is equal to 127, indicating that our instrument is a strong predictorof imports in the United States. We thus use the predicted coefficient from thisregression to construct the value of China’s import penetration in the UnitedStates that we will use in the second stage. We denote this predicted variableImportPenetration.
Importantly, our empirical strategy does not exclude the role of global pro-duction chains. During the sample period, about half of China’s manufacturingexports are produced in export processing plants that import intermediate in-puts from abroad and assemble them into the final goods that are exported

14 The Journal of Finance R©
Figure 2. Number and average value of state R&D tax credits in the United States. Bluebars represent the number of U.S. states with R&D tax credits (left scale). Red dots plot the averageeffective R&D tax credit rate across the 50 states (right scale).
(Feenstra and Hanson (2005)). Our empirical strategy does not require thatChina contribute 100% to the value added of the goods that it ships abroad.Instead, we require that China’s export growth be driven by internal shocksin China. These shocks may increase the supply of exported goods that areproduced entirely in China. They may also improve China’s integration intoglobal production chains and increase the supply of exported goods whose laststage of production occurs in China. Both situations represent exogenous im-port competition shocks from the point of view of U.S. producers.
B. Instrument for R&D Capital Stock
To generate exogenous variation in R&D at the firm level, we exploit tax-induced changes to the user cost of R&D capital. After the introduction of theU.S. federal R&D tax credit in 1981, U.S. states progressively started to pro-vide R&D tax credits to corporations. Figure 2 illustrates the staggered timingof changes in tax credit rates across U.S. states. The process began with Min-nesota in 1982; as of 2006, 32 states provided tax credit. The average effectivecredit rate increased approximately fourfold over this period to equal roughlyhalf of the value of the federal effective credit rate, and in some states the taxcredit is considerably more generous than the federal credit (Wilson (2009)).These state-level R&D policies generate variation in the user cost of R&D cap-ital across states and over time. A possible concern is that these tax policychanges may be endogenous to shocks to economic environment. While thispossibility cannot be ruled out, existing literature suggests a large degree ofrandomness regarding the introduction and level of R&D tax credits (see thediscussion in Bloom, Schankerman, and Van Reenen (2013b)). We investigate

Can U.S. Manufacturing Firms Escape Import Competition from China 15
this issue in Internet Appendix III.B, where we examine whether changes ineconomic conditions predict R&D policies. We find no support for this effect.
We use the state-by-year tax-induced changes in user cost of R&D capital(zst) for the years 1982 to 2006 from Wilson (2009).11 R&D expenses are eli-gible for a tax credit in the state where it is conducted. Thus, firms benefitdifferentially from these tax credits depending on the cross-state distributionof their R&D activity. We capture the location of a firm’s R&D activity usingthe location of its inventors.12 We obtain patent information using the NBERpatent file (see Hall, Jaffe, and Trajtenberg (2001)) and inventor informationusing the Harvard Business School patent database (see Lai, D’Amour, andFleming (2009)). These data provide us with a list of all patents filed by a firmand include the year of application and the address of the inventors. We mea-sure the geographical distribution of firm i’s R&D activity in year t based on the10-year moving average share, wist, of its inventors located in each state s. Theweighted-average user cost of R&D for firm i in year t is thus zit = ∑
s wistzst.The advantage of computing the weighted-average user cost of R&D based onthe firm’s “average location” over the past 10 years is that it alleviates concernsthat firms might be moving to states offering more generous tax credits. To fur-ther ensure that our results are not polluted by endogenous firm location, wererun all of our tests using firms’ initial locations instead of the 10-year movingaverage and obtain similar results.
Firm data come from Compustat. We consider U.S. firms operating in themanufacturing sector (SIC codes 2000 to 3999). We require that firms havenonmissing total assets and sales and that they have at least three consecutiveyears of data. Our instrument for R&D also imposes that we exclude firm-yearobservations for which a firm has not filed a single patent over the previous10 years because in this case we cannot compute the firm-specific user cost ofR&D, which depends on the locations of the firm’s inventors. This leaves uswith a sample of 3,334 firms and 41,860 firm-year observations over the 1982to 2006 period.
We predict R&D expenditures normalized by total assets using the firm-specific user cost of R&D (zit) and controlling for firm and year fixed ef-fects. Results of the first-stage regression are reported in Table III. The co-efficient on ρit is equal to −0.11 with an F-statistic of 12.4 (standard errors
11 The year t user cost of R&D capital in state s is given by the Hall-Jorgenson formula1−(kst+k f
t )−(τst+τf
t )
1−(τst+τf
t )[rt + δ], where kst and kf
t are the state and federal R&D tax credit rates, τst and
τf
t are the state and federal corporation income tax rates, rt is the real interest rate, and δ is thedepreciation rate of R&D capital.
12 R&D expenses can be offset against state-level corporation tax liabilities. State-level corpo-ration tax liabilities are calculated by allocating total firm profits across states according to aweighted combination of the location of firm sales, employment, and property. Hence, any firmwith an R&D lab within a state is likely to be both liable for the state’s corporation tax (due to itsemployees and property in the state) and eligible for an offsetting R&D tax credit. Inventor locationthus provides a good proxy for state-level R&D tax credits eligibility. In Internet Appendix III.C,we show that our results are robust to measuring firms’ exposure to state tax credits based on thelocation of their headquarters.

16 The Journal of Finance R©
Table IIIInstrument for R&D: First-Stage Regression
The sample comprises U.S. manufacturing firms over the 1973 to 2006 period from Compustat.We estimate a linear regression model on a firm-year panel where the dependent variable is R&Dexpenses over total assets. User cost of R&D at the firm-year level is calculated as the weightedaverage of state-year-specific user of cost of R&D to which the firm is eligible, where weights arebased on the 10-year moving average of the share of the firm’s inventors located in each state andthe user cost of R&D at the state-year level comes from Wilson (2009) and is calculated using theHall-Jorgenson formula as explained in Footnote 11. The regression includes firm and year fixedeffects. Standard errors are clustered by industry. *** indicates statistically different from zero atthe 1% level of significance.
R&D
User cost of R&D −0.11***(0.03)
Firm FE YesYear FE YesObservations 55,541Adjusted-R2 0.75
clustered at the industry level). Thus, a one-percentage-point decrease in theuser cost of R&D capital increases R&D expenditures by 0.11% of total assets.Given that R&D expenditures over total assets are on average 8.4%, our es-timate implies a price-elasticity of R&D of 1.3. This elasticity is in line withthe estimates of Wilson (2009) and Bloom, Schankerman, and Van Reenen(2013a).
The innovation of a firm depends on its current and past R&D expendi-tures. To account for this, we use the predicted value of R&D expendituresto create a predicted value of R&D capital stock (R&DStock) using the per-petual inventory method. We use a depreciation rate of R&D capital of 15%as suggested by Hall, Jaffe, and Trajtenberg (2005). We initialize the R&Dcapital stock at zero in the first year the firm appears in Compustat or in1982, whichever comes last.13 One possible concern is that, even if the pre-dicted value of R&D flow is exogenous, the predicted value of R&D stock isrelated to firm age. This could threaten our identification strategy if firmsof different ages react differently to import competition. For instance, olderfirms may have better access to credit, which would allow them to better ab-sorb negative shocks (Fort et al. (2013)). Alternatively, young firms may havehigher productivity (Foster, Haltiwanger, and Syverson (2008)) or hold morecash, which would provide them an advantage when facing import competi-tion shocks (Fresard (2010)). To account for such potential confounding effects,we control for firm age interacted with import penetration in the second-stageregression.
13 Since states started to offer R&D tax credits in 1982, we can construct the instrumented R&Dflow starting in 1982 even for firms that were in Compustat prior to 1982.
Can U.S. Manufacturing Firms Escape Import Competition from China 17
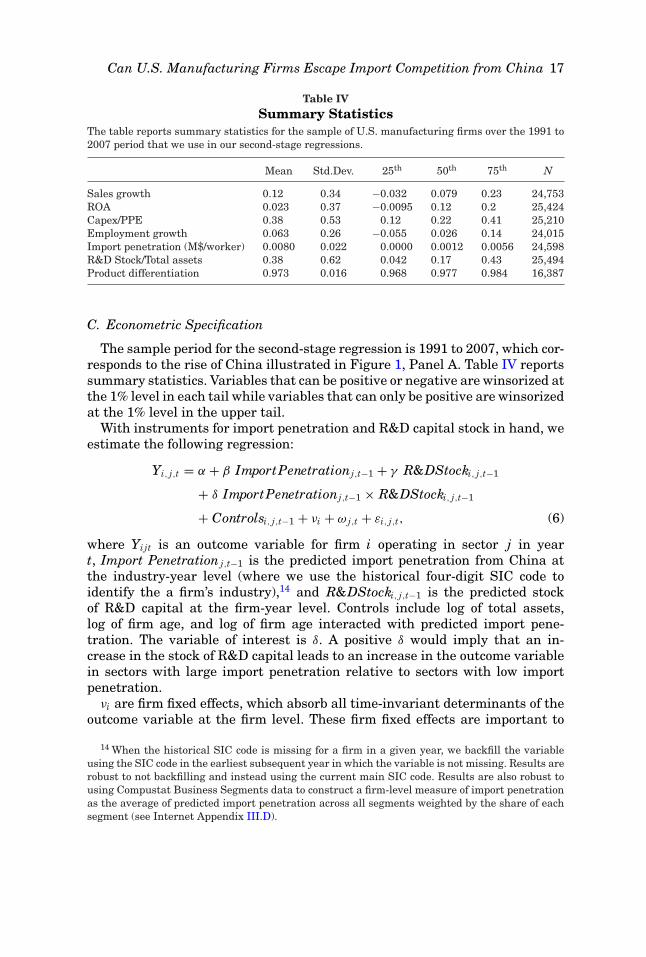
Table IVSummary Statistics
The table reports summary statistics for the sample of U.S. manufacturing firms over the 1991 to2007 period that we use in our second-stage regressions.
Mean Std.Dev. 25th 50th 75th N
Sales growth 0.12 0.34 −0.032 0.079 0.23 24,753ROA 0.023 0.37 −0.0095 0.12 0.2 25,424Capex/PPE 0.38 0.53 0.12 0.22 0.41 25,210Employment growth 0.063 0.26 −0.055 0.026 0.14 24,015Import penetration (M$/worker) 0.0080 0.022 0.0000 0.0012 0.0056 24,598R&D Stock/Total assets 0.38 0.62 0.042 0.17 0.43 25,494Product differentiation 0.973 0.016 0.968 0.977 0.984 16,387
C. Econometric Specification
The sample period for the second-stage regression is 1991 to 2007, which cor-responds to the rise of China illustrated in Figure 1, Panel A. Table IV reportssummary statistics. Variables that can be positive or negative are winsorized atthe 1% level in each tail while variables that can only be positive are winsorizedat the 1% level in the upper tail.
With instruments for import penetration and R&D capital stock in hand, weestimate the following regression:
Yi, j,t = α + β ImportPenetrationj,t−1 + γ R&DStocki, j,t−1
+ δ ImportPenetrationj,t−1 × R&DStocki, j,t−1
+ Controlsi, j,t−1 + νi + ω j,t + εi, j,t, (6)
where Yijt is an outcome variable for firm i operating in sector j in yeart, Import Penetration j,t−1 is the predicted import penetration from China atthe industry-year level (where we use the historical four-digit SIC code toidentify the a firm’s industry),14 and R&DStocki, j,t−1 is the predicted stockof R&D capital at the firm-year level. Controls include log of total assets,log of firm age, and log of firm age interacted with predicted import pene-tration. The variable of interest is δ. A positive δ would imply that an in-crease in the stock of R&D capital leads to an increase in the outcome variablein sectors with large import penetration relative to sectors with low importpenetration.
νi are firm fixed effects, which absorb all time-invariant determinants of theoutcome variable at the firm level. These firm fixed effects are important to
14 When the historical SIC code is missing for a firm in a given year, we backfill the variableusing the SIC code in the earliest subsequent year in which the variable is not missing. Results arerobust to not backfilling and instead using the current main SIC code. Results are also robust tousing Compustat Business Segments data to construct a firm-level measure of import penetrationas the average of predicted import penetration across all segments weighted by the share of eachsegment (see Internet Appendix III.D).

18 The Journal of Finance R©
remove potential endogeneity coming from the unbalanced nature of the panel.For instance, if firms that are more resilient to import competition enter thesample period in states that offer generous R&D tax credits, then the estimateof δ would be biased by this change in the composition of the firm population.Firm fixed effects allow us to control for such selection effects. Alternatively, ifstates populated by more productive firms in import-competing industries offermore generous R&D tax credits, then firms in import-competing industrieswith a high predicted stock of R&D will appear to have greater performance.In this case, there would be a positive correlation between firm performanceand import competition interacted with predicted R&D in the cross section offirms, but this correlation would be spurious. Firm fixed effects absorb anysuch cross-firm spurious correlation.
ω j,t are industry-by-year fixed effects. They ensure that δ is identified bycomparing firms with different stocks of R&D capital within the same industry-year. If, for instance, there is cross-industry heterogeneity in the resilience totrade shocks, and if states with a large number of resilient industries offer moregenerous R&D tax credits, then there will be a spurious positive correlationbetween firm performance and import competition interacted with predictedR&D. Such spurious correlation is absorbed by industry-year fixed effects. Notethat including industry-year fixed effects implies that the identification comesfrom variations in firms’ R&D tax credit rate within industry-years. Sincea firm’s R&D tax credit rate depends on its location, the specification withindustry-year fixed effects requires that there be at least some geographicdispersion of firms within industry-years. This condition may not be satisfiedfor industries that are highly clustered geographically. To investigate whetherthis is the case, for each industry we rank states based on the share of R&Dactivity conducted in each state.15 We then compute the average, across allindustries, of the share of R&D conducted in the top state (which is not thesame state for all industries), in the second state, and so on. Summary statisticsare reported in Table V. The average industry has 33% of its R&D activityin the top state, 17% in the second state, 11% in the third state, 8% in thefourth state, 6% in the fifth state, and 25% in the remaining states. Thesestatistics suggest that while there is some clustering by industry, there is stillsignificant geographic dispersion and hence we can implement the specificationwith industry-year fixed effects.16
Finally, because we use predicted imports and predicted R&D capital as ex-planatory variables, we need to adjust the standard errors to account for these
15 This share is computed using the weights we construct in Section II.B to locate firms’ inven-tors. Specifically, for a given industry, we compute the share of R&D activity in each state as theaverage share of the firm’s inventors located in the state across all firm-years in the industry.
16 A related concern is that California is the top state for 28% of industries. To check that theresults are not driven by Californian firms, in Internet Appendix III.E we rerun the regressionsafter excluding firms that have more than 50% of their R&D activity in California. We obtainsimilar results.

Can U.S. Manufacturing Firms Escape Import Competition from China 19
Table VGeographic Distribution of R&D by Industry
For each industry, we rank states based on the share of R&D conducted in the state. The tablereports the average share for each rank across all industries. Reading: The average industry has32.9% of its R&D activity in the top state, 17.2% in the second state, and so on.
Industry-by-Industry Ranking of States Share of Industry R&D in the State
Top state 32.9%Second state 17.2%Third state 11.3%Fourth state 8.2%Fifth state 6.1%Sixth state 4.7%Seventh state 3.6%Eighth state 2.9%Ninth state 2.4%10th state 2.0%
predicted regressors. In all of our regressions, therefore, we report bootstrappedstandard errors clustered by industry and year.17
III. Resilience to Import Competition
We first estimate equation (6) using sales growth as the dependent variable.Table VI reports the results. To begin, we only include predicted import pen-etration from China (not interacted with R&D capital stock). The coefficienton imports is negative and significant at the 1% level (column (1)). The pointestimate implies that a one-standard-deviation increase in import penetrationfrom China (22 k$/worker) leads on average to a 1.8-percentage-point decline inannual sales growth.18 This result is consistent with previous literature show-ing that U.S. manufacturing industries exposed to low-wage-country importsgrow more slowly (Bernard, Jensen, and Schott (2006)).
To assess whether a larger stock of R&D capital mitigates the negative effectof import competition on sales growth, we interact import penetration with the
17 The bootstrap is conducted as follows. We first draw a random sample with replacement fromthe sample of industry-years used to predict imports, we run the first-stage regression for imports,and we generate the predicted imports in the United States. We then draw a random sample withreplacement from the sample of firm-years used to predict R&D, we run the first-stage regressionfor R&D, and we generate predicted R&D expenditures that we use to construct predicted R&Dcapital stock. We then draw a random sample with replacement from the sample of firm-yearsused to estimate the second-stage regression (6); to correct for the correlation structure of thissample at the industry-year level, this random draw is made at the industry-year level and notat the firm-year level (i.e., we randomly draw with replacement an industry-year and then selectall of the firms from this industry-year), and we finally run our second-stage regression (6) on thissample. We repeat this procedure 500 times. The standard errors that we report correspond to theempirical distribution of the coefficients estimated.
18 Imports are in million USD per worker in Table VI. The effect of a one-standard-deviationincrease in import penetration is thus a 0.022 × (−0.84) = −0.018 change in sales growth.

20 The Journal of Finance R©
Table VIR&D Capital in Import-Competing Industries: Effect on Sales GrowthThe sample comprises U.S. manufacturing firms over the 1991 to 2007 period from Compustat.We estimate a linear regression model on a firm-year panel where the dependent variable issales growth. All specifications include firm fixed effects, year fixed effects in columns (1) and(2), industry-by-year fixed effects in columns (3) and (4), log of total assets, and log of firm ageas controls. ImportPenetration is the industry-year-level import penetration from China in theUnited States instrumented using China’s import penetration in eight other high-income markets.R&DStock is the firm-year-level predicted stock of R&D capital instrumented using firm-specifictax-induced user cost of R&D capital. Standard errors are bootstrapped within industry-yearclusters and reported in parentheses. *, **, and *** indicate statistically different from zero at the10%, 5%, and 1% level of significance, respectively.
Sales Growth
(1) (2) (3) (4)
Import penetration −0.84*** −1.30***(0.21) (0.24)
Import penetration × R&D Stock 0.83** 1.07*** 1.11***(0.33) (0.40) (0.39)
Assets 0.01 0.03*** 0.03*** 0.03***(0.01) (0.01) (0.01) (0.01)
Age −0.20*** −0.23*** −0.23*** −0.23***(0.01) (0.01) (0.02) (0.02)
R&D Stock 0.07*** 0.07*** 0.07***(0.02) (0.03) (0.03)
Import penetration × Age −0.67(0.46)
Firm FE Yes Yes Yes YesYear FE Yes Yes – –Industry-Year FE No No Yes YesObservations 23,907 23,907 23,907 23,907R2 0.24 0.24 0.34 0.34
predicted stock of R&D. The interaction term is positive and significant at the5% level (column (2)), which implies that more innovative firms are hurt less byimport competition shocks. The point estimate implies that going from the 25th
percentile to the 75th percentile of the sample distribution of R&D stock (i.e.,from 4% to 43% of total assets) reduces the negative effect of a one-standard-deviation increase in import competition on sales growth by 0.7 percentagepoints. When we include industry-year fixed effects, the effect becomes slightlylarger and significant at the 1% level (column (3)). In this case, moving from the25th percentile to the 75th percentile of R&D stock reduces the effect of importcompetition by 0.9 percentage points, that is, by half the average effect.
One possible concern is that, even if the predicted value of R&D flow isexogenous, the predicted value of R&D stock is related to firm age. This isa problem if firms of different ages react differently to import competition.To account for this potential effect, we control for firm age interacted withimport penetration. The coefficient on this interaction term is not significantly

Can U.S. Manufacturing Firms Escape Import Competition from China 21
Table VIIR&D Capital in Import-Competing Industries: Effect on Profitability
The sample comprises U.S. manufacturing firms over the 1991 to 2007 period from Compustat.We estimate a linear regression model on a firm-year panel where the dependent variable is ROA.All specifications include firm fixed effects, year fixed effects in columns (1) and (2), industry-by-year fixed effects in columns (3) and (4) and log of total assets, and log of firm age as controls.ImportPenetration is the industry-year-level import penetration from China in the United Statesinstrumented using China’s import penetration in eight other high-income markets. R&DStockis the firm-year-level predicted stock of R&D capital instrumented using firm-specific tax-induceduser cost of R&D capital. Standard errors are bootstrapped within industry-year clusters andreported in parentheses. *, **, and *** indicate statistically different from zero at the 10%, 5%,and 1% level of significance, respectively.
ROA
(1) (2) (3) (4)
Import penetration −0.49** −1.06***(0.20) (0.22)
Import penetration × R&D Stock 1.13** 1.41*** 1.42***(0.47) (0.54) (0.54)
Assets 0.06*** 0.01 0.01 0.01(0.01) (0.01) (0.01) (0.01)
Age 0.06*** 0.13*** 0.15*** 0.15***(0.01) (0.02) (0.02) (0.02)
R&D Stock −0.19*** −0.21*** −0.21***(0.02) (0.03) (0.03)
Import penetration × Age −0.20(0.34)
Firm FE Yes Yes Yes YesYear FE Yes Yes – –Industry-Year FE No No Yes YesObservations 24,533 24,533 24,533 24,533R2 0.68 0.68 0.72 0.72
different from zero (column (4)), suggesting that there is no systematic patternbetween exposure to trade shocks and firm age. Accordingly, the coefficient onthe interaction term between import penetration and R&D does not changewhen we control for the interaction between import penetration and firm age.
Aghion et al. (2005) suggest that the effect of import competition can benonmonotonic. In Internet Appendix III.F, we test for nonmonotonicity by al-lowing for a quadratic effect of import penetration on the returns to R&D. Wefind that the relation is increasing at all levels of import penetration in thesample distribution.
We turn to the effect on profitability in Table VII. We expect that the negativeshock on sales triggered by increased import competition will also reduce prof-itability. When we only include import penetration from China (not interactedwith R&D stock), we find that the unconditional effect of import competitionon profitability is negative and statistically significant at the 5% level (col-umn (1)). The point estimate implies that a one-standard-deviation increase

22 The Journal of Finance R©
in import penetration from China leads on average to a 1.1-percentage-pointdrop in ROA. This average decline in profitability following trade shocks isconsistent with Xu (2012).
When we interact import penetration with the stock of R&D, the interactionterm is positive and significant at the 5% level (column (2)). Moving from the25th percentile to the 75th percentile of R&D stock reduces the negative effecton ROA by 1 percentage point, that is, by the same magnitude as the aver-age effect. The effect is slightly larger and significant at the 1% level whenwe include industry-year fixed effects (column (3)) and is unchanged when wecontrol for firm age interacted with import penetration (column (4)). Overall,the results in this section suggest that R&D allows firms to cushion the nega-tive effects of trade shocks on firm performance, in terms of both growth andprofitability.
IV. Product Differentiation
Through what mechanism does R&D moderate the effect of trade shocks onfirm performance? Generally speaking, R&D can improve firm performancein two ways: by increasing product differentiation as in Sutton (1991), or byincreasing productivity as in Grossman and Helpman (1991) and Aghion andHowitt (1992). A priori, however, it is unclear which channel is more importantas import competition increases.
To shed light on this question, in Internet Appendix I we develop a model ofcompetition with vertical differentiation that allows us to contrast the effect ofR&D on firm performance through higher vertical differentiation versus higherproductivity. The main insight is that while both types of innovation lead to anunconditional increase in firm profit, they have opposite effects conditional onthe intensity of competition. When low-cost competition increases, the marginalbenefit of higher vertical differentiation increases while the marginal benefitof higher productivity decreases. The model, therefore, predicts that the mech-anism through which R&D capital makes firms more resilient to trade shocksis product differentiation.
More specifically, the model identifies two potential channels. Under thefirst channel, the benefits of differentiation increase when import competitionincreases. The model prediction is that firms with ex ante more differenti-ated products are better shielded from import competition. Combined withthe hypothesis that firms with a higher stock of R&D capital have more dif-ferentiated products independent of the intensity of import competition, thischannel can explain why the benefits of R&D increase when import competitionincreases.
Under the second channel, the incentives to differentiate increase when im-port competition increases. If past R&D makes firms more responsive andimproves their ex post ability to differentiate once competition materializes,then the model prediction is that firms with a higher stock of R&D capital in-crease product differentiation as import competition increases, thus mitigatingthe effect of the shock.

Can U.S. Manufacturing Firms Escape Import Competition from China 23
An ancillary prediction of the model is that the effect of R&D on firms’resilience to trade shocks is stronger in industries in which product differenti-ation is more important.
In this section, we leverage our model design, which allows us to use proxiesfor product differentiation as a right-hand-side variable or a left-hand-side vari-able, to test these three predictions. We provide evidence for the first channel inSection IV.A, for the second channel in Section IV.B, and for the cross-industryprediction in Section IV.C.
A. Channel 1: Higher Sensitivity of Performance to Differentiation
To study whether R&D makes firms more different and such differenti-ation becomes more important as import competition increases, we exploitthe Text-based Network Industry Classification developed by Hoberg andPhillips (2016). Using the product description in firms’ 10-Ks, Hoberg andPhillips (2016) compute pairwise word similarity scores for each pair of U.S.public firms. The similarity score ranges from zero to one and indicates the rel-ative number of words that two firms share in their product description. Twofirms are deemed to be closer in the product market space when their productsimilarity score is closer to one and more differentiated when their score iscloser to zero. To ease exposition, we use one minus the similarity score andrefer to this variable as product differentiation. For each firm-year, we com-pute the average product differentiation among the firm’s U.S. peers. Averagedifferentiation measures whether the firm sells more unique products that areless exposed to the competitive pressure. Because Hoberg and Phillips (2016)product similarity data start in 1996, the sample period in this analysis is from1996 to 2007.
The first channel relies on a combination of two ingredients: (i) higher R&Dleads to greater product differentiation independent of the intensity of importcompetition and (ii) the impact of differentiation on firm performance increasesas import competition intensifies.
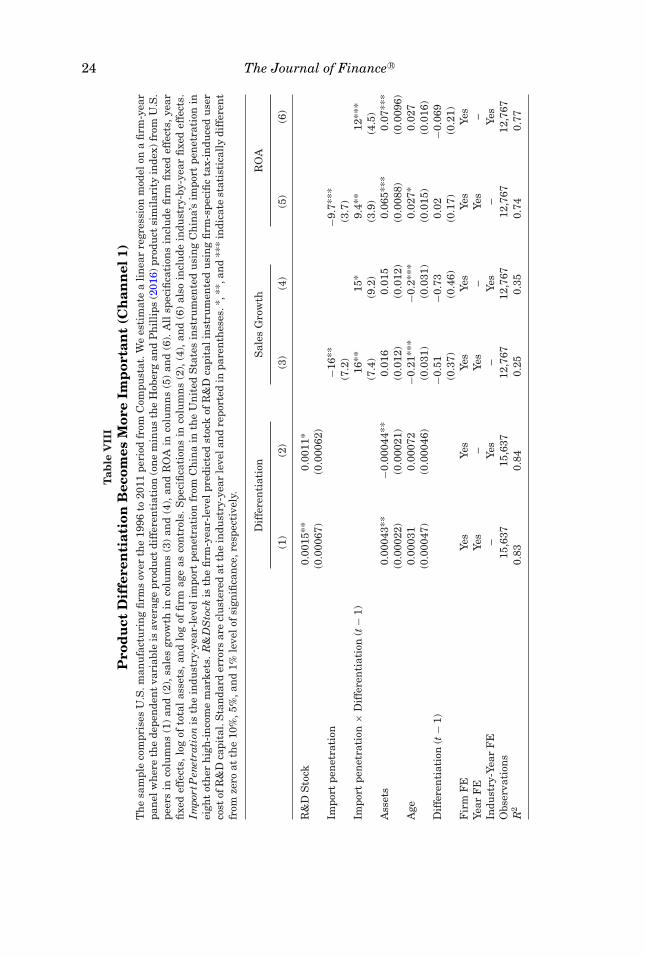
To test for (i), we regress product differentiation on instrumented R&D stockand the same set of controls and fixed effects as before. The results are re-ported in Table VIII. In column (1), the positive and statistically significantcoefficient on R&D stock indicates that a higher level of R&D leads to moredifferentiated products. In column (2), the effect is robust to controlling forindustry-year fixed effects. These results are consistent with the finding ofHoberg and Phillips (2016) that firms with higher (endogenous) R&D havemore differentiated products.
To test for (ii), we regress firm performance on instrumented import pen-etration interacted with product differentiation as well as the noninteractedvariables and the same controls and fixed effects as before. Note that we donot have an instrument for product differentiation.19 In interpreting the results
19 Instrumenting differentiation using our instrument for R&D would boil down to running ourbaseline regression of firm performance on instrumented imports interacted with instrumented
24 The Journal of Finance R©
Tab
leV
III
Pro
du
ctD
iffe
ren
tiat
ion
Bec
omes
Mor
eIm
por
tan
t(C
han
nel
1)T
he
sam
ple
com
pris
esU
.S.m
anu
fact
uri
ng
firm
sov
erth
e19
96to
2011
peri
odfr
omC
ompu
stat
.We
esti
mat
ea
lin
ear
regr
essi
onm
odel
ona
firm
-yea
rpa
nel
wh
ere
the
depe
nde
nt
vari
able
isav
erag
epr
odu
ctdi
ffer
enti
atio
n(o
ne
min
us
the
Hob
erg
and
Ph
illi
ps(2
016)
prod
uct
sim
ilar
ity
inde
x)fr
omU
.S.
peer
sin
colu
mn
s(1
)an
d(2
),sa
les
grow
thin
colu
mn
s(3
)an
d(4
),an
dR
OA
inco
lum
ns
(5)
and
(6).
All
spec
ifica
tion
sin
clu
defi
rmfi
xed
effe
cts,
year
fixe
def
fect
s,lo
gof
tota
las
sets
,an
dlo
gof
firm
age
asco
ntr
ols.
Spe
cifi
cati
ons
inco
lum
ns
(2),
(4),
and
(6)
also
incl
ude
indu
stry
-by-
year
fixe
def
fect
s.Im
port
Pen
etra
tion
isth
ein
dust
ry-y
ear-
leve
lim
port
pen
etra
tion
from
Ch
ina
inth
eU
nit
edS
tate
sin
stru
men
ted
usi
ng
Ch
ina’
sim
port
pen
etra
tion
inei
ght
oth
erh
igh
-in
com
em
arke
ts.
R&
DS
tock
isth
efi
rm-y
ear-
leve
lpre
dict
edst
ock
ofR
&D
capi
tali
nst
rum
ente
du
sin
gfi
rm-s
peci
fic
tax-
indu
ced
use
rco
stof
R&
Dca
pita
l.S
tan
dard
erro
rsar
ecl
ust
ered
atth
ein
dust
ry-y
ear
leve
lan
dre
port
edin
pare
nth
eses
.*,*
*,an
d**
*in
dica
test
atis
tica
lly
diff
eren
tfr
omze
roat
the
10%
,5%
,an
d1%
leve
lof
sign
ifica
nce
,res
pect
ivel
y.
Dif
fere
nti
atio
nS
ales
Gro
wth
RO
A
(1)
(2)
(3)
(4)
(5)
(6)
R&
DS
tock
0.00
15**
0.00
11*
(0.0
0067
)(0
.000
62)
Impo
rtpe
net
rati
on−1
6**
−9.7
***
(7.2
)(3
.7)
Impo
rtpe
net
rati
on×
Dif
fere
nti
atio
n(t
−1)
16**
15*
9.4*
*12
***
(7.4
)(9
.2)
(3.9
)(4
.5)
Ass
ets
0.00
043*
*−0
.000
44**
0.01
60.
015
0.06
5***
0.07
***
(0.0
0022
)(0
.000
21)
(0.0
12)
(0.0
12)
(0.0
088)
(0.0
096)
Age
0.00
031
0.00
072
−0.2
1***
−0.2
***
0.02
7*0.
027
(0.0
0047
)(0
.000
46)
(0.0
31)
(0.0
31)
(0.0
15)
(0.0
16)
Dif
fere
nti
atio
n(t
−1)
−0.5
1−0
.73
0.02
−0.0
69(0
.37)
(0.4
6)(0
.17)
(0.2
1)F
irm
FE
Yes
Yes
Yes
Yes
Yes
Yes
Year
FE
Yes
–Ye
s–
Yes
–In
dust
ry-Y
ear
FE
–Ye
s–
Yes
–Ye
sO
bser
vati
ons
15,6
3715
,637
12,7
6712
,767
12,7
6712
,767
R2
0.83
0.84
0.25
0.35
0.74
0.77

Can U.S. Manufacturing Firms Escape Import Competition from China 25
one should keep in mind that variation in differentiation on the right-hand sidemight be endogenous if, for instance, firms more exposed to trade shocks tryharder to increase differentiation. To alleviate such reverse causality concerns,we lag differentiation by one year while acknowledging that this adjustment isimperfect.
We focus on sales growth in columns (3) and (4). The coefficient on importpenetration interacted with product differentiation is positive and statisti-cally significant. Thus, differentiation becomes more important as importcompetition rises. Columns (5) and (6) report a similar pattern when we useROA to capture firm performance. These results are in line with the modelin Internet Appendix I, which predicts that returns to differentiation increasewith competition.
Taken together, the evidence for (i) and (ii) indicates that R&D helps firmsescape import competition by allowing them to differentiate their products,and that this mechanism becomes more important as competitive pressurefrom China increases.
B. Channel 2: Differentiation Increases
We now test whether firms that have invested more in R&D in the pastdifferentiate more following an increase in import competition. To do so, weestimate equation (6) using product differentiation as the dependent variable.
The results are reported in Table IX. In column (1), we only include importpenetration (i.e., not interacted with R&D). We obtain a positive and statisti-cally significant coefficient. Thus, an increase in import competition leads firmsto become more differentiated. The point estimate implies that a one-standard-deviation increase in import competition leads to an increase in product differ-entiation of 0.05 standard deviations. In line with the prediction of the modelin Internet Appendix I, firms have more incentives to increase differentiationwhen competition increases.
When we interact import penetration with the stock of R&D, we obtain apositive coefficient on the interaction term. Depending on the specification,the p-value is between 0.03 (when industry-year fixed effects are included,columns (3) and (4)) and 0.12 (when industry-year fixed effects are not included,column (2)). Moving from the 25th percentile to the 75th percentile of R&Dstock increases the effect of import penetration on differentiation by 25% of theunconditional effect. Thus, firms that invest more in R&D for reasons unrelatedto competition are better able to increase differentiation when the competitivepressure intensifies and the benefits of differentiation increase.
Note that, ideally, we would measure differentiation from Chinese products.We cannot do this directly because the product similarity score is defined onlyfor pairs of U.S. firms. Thus, our approach of looking at differentiation from
R&D. This approach would not allow us to identify whether the effect of R&D on resilience to tradeshocks operates through higher sensitivity of performance to differentiation after trade shocks(channel 1) or through higher differentiation after trade shocks (channel 2).

26 The Journal of Finance R©
Table IXProduct Differentiation Increases (Channel 2)
The sample comprises U.S. manufacturing firms over the 1996 to 2011 period from Compustat.We estimate a linear regression model on a firm-year panel where the dependent variable isaverage product differentiation (one minus the Hoberg and Phillips (2016) product similarityindex) from U.S. peers. All specifications include firm fixed effects, year fixed effects in columns(1) and (2), industry-by-year fixed effects in columns (3) and (4), log of total assets, and log of firmage as controls. ImportPenetration is the industry-year-level import penetration from China in theUnited States instrumented using China’s import penetration in eight other high-income markets.R&DStock is firm-year-level predicted stock of R&D capital instrumented using firm-specific tax-induced user cost of R&D capital. Standard errors are clustered at the industry-year level andreported in parentheses. *, **, and *** indicate statistically different from zero at the 10%, 5%,and 1% level of significance, respectively.
Product Differentiation
(1) (2) (3) (4)
Import penetration 0.035* 0.024(0.02) (0.018)
Import penetration × R&D Stock 0.026 0.023** 0.023**(0.017) (0.011) (0.011)
Assets −0.00082*** −0.00021 −0.00029 −0.00029(0.00026) (0.00034) (0.00034) (0.00034)
Age 0.001** 0.00034 0.00058 0.0004(0.00052) (0.00058) (0.00059) (0.00059)
R&D Stock 0.0018** 0.00087 0.00086(0.00088) (0.00073) (0.00073)
Import penetration × Age −0.019(0.022)
Firm FE Yes Yes Yes YesYear FE Yes Yes – –Industry-Year FE No No Yes YesObservations 15,896 15,896 15,896 15,896R2 0.78 0.78 0.83 0.83
U.S. competitors should be understood as using this variable as a proxy fordifferentiation from Chinese competitors, by capturing firms’ ability to bringto market more unique products that are less subject to competition from (U.S.and Chinese) rivals. In Internet Appendix III.G, we follow a complementaryapproach and test whether a firm’s products become more similar to the prod-ucts of other U.S. firms less exposed to Chinese competition when the firm hasa higher stock of R&D. The results are in line with those reported here. Overall,the evidence supports the view that R&D helps firms withstand import compe-tition by improving their ability to differentiate when competition materializes.
C. Product Differentiation Across Industries
Another implication of the prediction that R&D helps firms overcome importcompetition through differentiation is that the effect of R&D on resilience totrade shocks should be stronger in industries in which product differentiationis more prevalent. To test this ancillary prediction, we proxy for the extent of

Can U.S. Manufacturing Firms Escape Import Competition from China 27
Table XR&D Matters More in Industries with High Differentiation
The sample comprises U.S. manufacturing firms over the 1996 to 2011 period from Compustat.We estimate a linear regression model on a firm-year panel where the dependent variable is salesgrowth in columns (1) and (2) and ROA in columns (3) and (4). All specifications include firm fixedeffects, year fixed effects, log of total assets, and log of firm age as controls. Specifications in columns(2) and (4) also include industry-by-year fixed effects. ImportPenetration is the industry-year-levelimport penetration from China in the United States instrumented using China’s import penetrationin eight other high-income markets. R&DStock is the firm-year-level predicted stock of R&D capitalinstrumented using firm-specific tax-induced user cost of R&D capital. IndustryDi f f erentiationis a dummy variable equal to one if the average product differentiation (one minus the Hobergand Phillips (2016) product similarity index) of the industry is above the median of the sampledistribution. All specifications include all the double and triple interactions between these threevariables; noninteracted terms are also included but not reported. Standard errors are clustered atthe industry-year level and reported in parentheses. *, **, and *** indicate statistically differentfrom zero at the 10%, 5%, and 1% level of significance, respectively.
Sales Growth ROA
(1) (2) (3) (4)
Import penetration × R&D Stock 0.25 0.48 0.01 0.21(0.35) (0.40) (0.62) (0.64)
Import penetration × R&D Stock 1.55* 1.88** 2.43*** 3.13***× Industry differentiation (0.90) (0.97) (0.92) (1.00)
Firm FE Yes Yes Yes YesYear FE Yes – Yes –Industry-Year FE – Yes – YesObservations 23,074 23,074 23,710 23,710R2 0.25 0.33 0.69 0.73
differentiation between firms at the industry level using the industry averageof the firm-level differentiation measure used above and create the dummyIndustryDifferentiation, which we set equal to one if the average score of theindustry is above the sample median. To test whether the effect of R&D onresilience to trade shocks is stronger in industries in which differentiation ismore important, we regress firm performance on the triple interaction betweenR&D stock, import penetration, and industry-level importance of differentia-tion, as well as on the simple interaction and noninteracted terms and the samecontrols and fixed effects as before.
Table X reports the results. Columns (1) and (2) focus on the effect on salesgrowth. The coefficient on the triple interaction term is positive and significantwhether industry-year fixed effects are included or not. Therefore, the effect ofR&D on firms’ ability to escape foreign competition is stronger in industries inwhich product differentiation is more important. We obtain similar findings incolumns (3) and (4), where we use ROA to capture firm performance.
V. Capital Expenditures and Employment
Having shown in Section III that R&D mitigates the disruptive effects oftrade with China on firm performance, here we explore the real effects on

28 The Journal of Finance R©
capital expenditures and employment. Given that more innovative firms main-tain their market share and profitability, are they also able to continue invest-ing and hiring, or do they downsize?
It should be noted that while the model developed in Section I has fixedproduction factors, it is straightforward to extend it to the case of endogenousproduction factors. For instance, if we reinterpret π as total factor productivityand assume a Cobb-Douglas production function with two factors, capital Kand labor L, and decreasing returns to scale, Y = π Kα Lβ , with α > 0, β > 0,and α + β < 1, then the optimal quantities of factors K∗ and L∗ are increasingfunctions of π .20 In this case, the model predicts that capital and labor decreaseunconditionally when import competition increases, but less so for firms witha higher stock of R&D.
In Table XI, we estimate equation (6) with capital expenditures normalizedby lagged fixed assets as the dependent variable. First, we only include importpenetration from China. We obtain a negative coefficient statistically signif-icant at the 1% level (column (1)). The point estimate implies that followinga one-standard-deviation increase in import competition, firms reduce theircapital expenditures on average by 1.6% of fixed assets. Given that the aver-age ratio of capital expenditures to fixed assets is 38%, this effect amountsto a 4.2% decline in capital expenditures. This unconditional negative effectof import competition on capital expenditures is consistent with the results ofFresard and Valta (2016).
We next investigate whether this effect is mitigated for more innovativefirms. Since innovative firms do not experience as much of a negative shock tosales and profits (see Tables VI and VII), we expect their investment opportu-nities will also shrink less. To test this prediction, we add the interaction termbetween import competition and R&D stock. We find that the interaction termis positive and significant at the 1% level (column (2)), which means that moreinnovative firms cut their capital expenditures less when import competitionincreases. The point estimate implies that moving from the 25th percentile tothe 75th of R&D stock reduces the negative effect of a one-standard-deviationincrease in import competition on capital expenditures by 1.4% of fixed assets,that is, by almost as much as the unconditional effect. The effect is slightlymore pronounced when we include industry-year fixed effects (column (3)) andis unchanged when we control for firm age interacted with import penetration(column (4)). Overall, while the average firms in industries exposed to Chi-nese competition cut capital expenditures, more innovative firms are able tocontinue investing in fixed capital. This result implies that the complemen-tarity between R&D capital and fixed capital is amplified when competitionintensifies.
In Table XII, we estimate equation (6) with employment growth as the de-pendent variable. When we only include import penetration from China (i.e.,not interacted with R&D), we find that the unconditional effect of import
20 Denoting by r the interest rate and by w the wage, it follows from the first-order conditions
with respect to K and L that K∗ = ( αr )
1−β1−α−β ( β
w)
β1−α−β π
11−α−β and L∗ = ( α
r )α
1−α−β ( βw
)1−α
1−α−β π1
1−α−β .

Can U.S. Manufacturing Firms Escape Import Competition from China 29
Table XIR&D Capital in Import-Competing Industries: Effect on Capital
ExpendituresThe sample comprises U.S. manufacturing firms over the 1991 to 2007 period from Compustat. Weestimate a linear regression model on a firm-year panel where the dependent variable is capitalexpenditures divided by lagged property, plant, and equipment. All specifications include firmfixed effects, year fixed effects in columns (1) and (2), industry-by-year fixed effects in columns(3) and (4), log of total assets, and log of firm age as controls. ImportPenetration is the industry-year-level import penetration from China in the United States instrumented using China’s importpenetration in eight other high-income markets. R&DStock is the firm-year-level predicted stockof R&D capital instrumented using firm-specific tax-induced user cost of R&D capital. Standarderrors are clustered at the industry-year level and reported in parentheses. *, **, and *** indicatestatistically different from zero at the 10%, 5%, and 1% level of significance, respectively.
Capital Expenditures
(1) (2) (3) (4)
Import penetration −0.74* −1.65***(0.39) (0.45)
Import penetration × R&D Stock 1.67*** 1.77*** 1.79***(0.60) (0.68) (0.67)
Assets 0.03*** 0.04*** 0.05*** 0.05***(0.01) (0.02) (0.02) (0.02)
Age −0.41*** −0.42*** −0.44*** −0.44***(0.02) (0.03) (0.03) (0.03)
R&D Stock 0.01 0.02 0.02(0.04) (0.04) (0.04)
Import penetration × Age –0.33(0.82)
Firm FE Yes Yes Yes YesYear FE Yes Yes – –Industry-Year FE No No Yes YesObservations 24,321 24,321 24,321 24,321R2 0.34 0.34 0.41 0.41
penetration on employment is negative and not statistically significant (col-umn (1)). The result that the average effect on employment is weaker (botheconomically and statistically) than that on sales has two nonexclusive expla-nations. First, since sales are measured in dollars, the decline in sales can comefrom a reduction in quantity, a reduction in price, or both. Employment shoulddecline only because of a drop in sales due to a drop in quantity. Second, laboradjustment costs can make employment more sticky than sales.
When we add the interaction term between import competition and R&D, wefind that the effect on employment depends significantly on the stock of R&D(column (2)). Employment in firms at the 25th of the R&D stock distribution re-duces employment growth 0.7 percentage points (statistically significant at the5% level) more than employment in firms at the 75th percentile of the R&D stockdistribution when hit by a one-standard-deviation increase in import penetra-tion. The coefficient estimates imply that firms at the bottom quartile of R&D

30 The Journal of Finance R©
Table XIIR&D Capital in Import-Competing Industries: Effect on EmploymentThe sample comprises U.S. manufacturing firms over the 1991 to 2007 period from Compustat.We estimate a linear regression model on a firm-year panel where the dependent variable isemployment growth. All specifications include firm fixed effects, year fixed effects in columns (1)and (2), industry-by-year fixed effects in columns (3) and (4), log of total assets, and log of firmage as controls. ImportPenetration is the industry-year-level import penetration from China in theUnited States instrumented using China’s import penetration in eight other high-income markets.R&DStock is the firm-year-level predicted stock of R&D capital instrumented using firm-specifictax-induced user cost of R&D capital. Standard errors are clustered at the industry-year level andreported in parentheses. *, **, and *** indicate statistically different from zero at the 10%, 5%,and 1% level of significance, respectively.
Employment Growth
(1) (2) (3) (4)
Import penetration −0.18 −0.63**(0.21) (0.28)
Import penetration × R&D Stock 0.77** 0.88** 0.92**(0.32) (0.39) (0.37)
Assets 0.02*** 0.06*** 0.07*** 0.07***(0.01) (0.01) (0.01) (0.01)
Age −0.20*** −0.25*** −0.24*** −0.25***(0.01) (0.01) (0.02) (0.02)
R&D Stock 0.13*** 0.13*** 0.13***(0.02) (0.02) (0.02)
Import penetration × Age −0.81*(0.47)
Firm FE Yes Yes Yes YesYear FE Yes Yes – –Industry-Year FE No No Yes YesObservations 23,197 23,197 23,197 23,197R2 0.24 0.25 0.36 0.36
reduce employment growth by 1.3 percentage points (statistically significant atthe 5% level). In contrast, firms at the top quartile reduce employment growthby a statistically insignificant 0.6 percentage points. The difference betweenfirms with a high level and a low level of R&D is slightly larger when we in-clude industry-year fixed effects (column (3)) and is unchanged when we controlfor firm age interacted with import penetration (column (4)). More innovativefirms are therefore less likely to shrink their labor force in import-competingindustries.
VI. Robustness
A. Alternative Instrument for Trade Shock
In this section, we show that our results are robust to using an alternativesource of variation in China’s import penetration in the United States thatcomes from changes in barriers to trade between China and the United States.

Can U.S. Manufacturing Firms Escape Import Competition from China 31
Following Pierce and Schott (2016), we exploit the fact that the United Stateschanged its tariff agreement with China in 2000. Since the Smoot-Hawley Tariffof 1930, imports to the United States from nonmarket economies such as Chinahave been subject to relatively high tariff rates, known as the non-NormalTrade Relations tariff (non-NTR). Starting in 1980, each year the Presidentof the United States granted an annual waiver to China that needed to beapproved by Congress. Following the agreement between China and the UnitedStates in 1999 governing China’s eventual entry into the WTO, the UnitedStates granted China Permanent Normal Trade Relations (PNTR) status.21
This agreement has increased Chinese imports in the United States by re-ducing expected tariff rates and removing uncertainty about the U.S. tradepolicy vis-a-vis China. One key element of this agreement is that not all in-dustries are affected in the same way, as the NTR tariff rate varies acrossindustries. As such, the adoption of PNTR has led to a larger decline in the ex-pected tariff rate in industries that have a high NTR tariff. We define the NTRgap for industry j as the difference between the non-NTR rate to which tariffswould have risen if annual renewal had failed and the NTR tariff rate thatis for industry j by PNTR: NTR Gapj = Non-NTR Rate j − NTR Rate j . Pierceand Schott (2016) show that industries facing a larger drop in expected tariffsexperience a larger increase in Chinese imports.22
We first study the unconditional effect of the PNTR agreement on firm per-formance and investment decisions. Specifically, we regress each firm outcomevariable on NTR Gap interacted with the dummy variable Post, which is equalto one after 2000, and the same controls and fixed effects as in the base-line regressions. The results are reported in the odd-numbered columns ofTable XIII. Firms in industries with a higher NTR gap experience lower salegrowth, lower profitability, lower capital expenditures, and lower employmentgrowth. Moving from the 25th percentile (0.19) to the 75th percentile (0.38) ofthe NTR gap leads on average to a 2.2-percentage-point decline in annual salesgrowth (−0.12 × (0.38 − 0.19), significant at the 5% level, column (1)) and a1.9-percentage-point decline in ROA (significant at the 1% level, column (3)).23
We next analyze how the effect depends on firms’ R&D capital stock. Todo so, we interact NTR Gap × Post with instrumented R&D stock and useour preferred specification with industry-year fixed effects.24 The results arereported in the odd-numbered columns of Table XIII. For all four dependentvariables, the interaction term is positive and statistically significant. The pointestimates imply that going from the 25th to the 75th percentile of the sampledistribution of R&D stock reduces the negative effect of the interquartile NTRgap by 1.3 percentage points (significant at the 1% level, column (2)), that is,
21 See Pierce and Schott (2016) for more details about this policy.22 We have replicated this result in our sample. The result is the same as the one in Pierce and
Schott (2016) and is omitted for the sake of space.23 The effect on the production factors is to decrease capital expenditures by 2.7% of fixed assets
(significant at the 5% level, column (5)) and employment growth by 1 percentage point (column (7),p-value of 0.15).
24 Results are similar using the specification without industry-year fixed effects.

32 The Journal of Finance R©
Tab
leX
III
Alt
ern
ativ
eIn
stru
men
tfo
rIm
por
tC
omp
etit
ion
Th
esa
mpl
eco
mpr
ises
U.S
.man
ufa
ctu
rin
gfi
rms
over
the
1991
to20
07pe
riod
from
Com
pust
at.W
ees
tim
ate
ali
nea
rre
gres
sion
mod
elon
afi
rm-y
ear
pan
el.A
llsp
ecifi
cati
ons
incl
ude
firm
fixe
def
fect
s,ye
arfi
xed
effe
cts,
log
ofto
tala
sset
s,an
dlo
gof
firm
age
asco
ntr
ols.
Spe
cifi
cati
ons
inev
en-n
um
bere
dco
lum
ns
also
incl
ude
indu
stry
-by-
year
fixe
def
fect
s.N
TR
Gap
isth
edi
ffer
ence
betw
een
NT
Rta
riff
and
non
-NT
Rta
riff
atth
ein
dust
ryle
vel.
Pos
tis
adu
mm
yeq
ual
toon
efr
omye
ar20
00on
war
d.R
&D
Sto
ckis
the
firm
-yea
r-le
vel
pred
icte
dst
ock
ofR
&D
capi
tal
inst
rum
ente
du
sin
gfi
rm-s
peci
fic
tax-
indu
ced
use
rco
stof
R&
Dca
pita
l.S
tan
dard
erro
rsar
ecl
ust
ered
atth
ein
dust
ry-y
ear
leve
lan
dre
port
edin
pare
nth
eses
.*,
**,
and
***
indi
cate
stat
isti
call
ydi
ffer
ent
from
zero
atth
e10
%,5
%,a
nd
1%le
velo
fsi
gnifi
can
ce,r
espe
ctiv
ely.
Sal
esG
row
thR
OA
Cap
ital
Exp
endi
ture
sE
mpl
oym
ent
Gro
wth
(1)
(2)
(3)
(4)
(5)
(6)
(7)
(8)
NT
RG
ap×
Pos
t−0
.12*
*−0
.10*
**−0
.14*
*−0
.05
(0.0
6)(0
.03)
(0.0
6)(0
.04)
NT
RG
ap×
Pos
t0.
17**
*0.
09**
0.31
***
0.15
***
×R
&D
Sto
ck(0
.05)
(0.0
4)(0
.06)
(0.0
4)A
sset
s0.
03**
*0.
03**
*0.
010.
000.
04**
*0.
04**
*0.
06**
*0.
07**
*(0
.01)
(0.0
1)(0
.01)
(0.0
1)(0
.01)
(0.0
1)(0
.01)
(0.0
1)A
ge−0
.24*
**−0
.23*
**0.
06**
*0.
08**
*−0
.33*
**−0
.32*
**−0
.24*
**−0
.22*
**(0
.01)
(0.0
2)(0
.01)
(0.0
1)(0
.02)
(0.0
2)(0
.01)
(0.0
1)R
&D
Sto
ck0.
08**
*0.
05*
−0.1
4***
−0.1
8***
0.03
−0.0
30.
15**
*0.
12**
*(0
.02)
(0.0
3)(0
.02)
(0.0
2)(0
.03)
(0.0
3)(0
.02)
(0.0
2)F
irm
FE
Yes
Yes
Yes
Yes
Yes
Yes
Yes
Yes
Year
FE
Yes
–Ye
s–
Yes
–Ye
s–
Indu
stry
-Yea
rF
E–
Yes
–Ye
s–
Yes
–Ye
sO
bser
vati
ons
23,4
7123
,471
23,4
7123
,471
23,4
7123
,471
22,2
3422
,234
R2
0.24
0.33
0.71
0.75
0.35
0.42
0.24
0.34

Can U.S. Manufacturing Firms Escape Import Competition from China 33
by half of the unconditional effect, which is the same order of magnitude aswhat we obtain using the other instrument in Section III.25
B. Intermediate Inputs
Export growth from China leads not only to greater competition for U.S. pro-ducers but also to greater supply of intermediate inputs, which may offset theadverse effect of import competition in the final goods market. To account forthis effect, we define a measure of input-adjusted import penetration by net-ting import penetration in input markets from our baseline measure of importpenetration in the final goods market. We calculate import penetration in inputmarkets as the average import penetration across all input markets weightedby the share of each input from the 1992 U.S. input-output table. For inputscoming from the manufacturing sector, import penetration is measured as im-ports per worker as above. For nonmanufacturing inputs, import penetrationis taken to be zero. As before, input import penetration in the United States isinstrumented by input import penetration in other high-income economies.
In columns (1) and (4) of Table XIV, we use input-adjusted import penetrationas the measure of trade exposure and study the impact on firm performance.We report the results using our preferred specification with the full set of fixedeffects and controls. The coefficient on input-adjusted import competition in-teracted with R&D stock is positive and significant for both sales growth andROA. The economic magnitudes are similar to those obtained in Tables VI andVII, where we do not adjust for imports of intermediate inputs. Therefore, ac-counting for import competition in input markets does not affect our conclusionthat a higher level of R&D allows U.S. producers to cushion trade shocks.
Next, we try to isolate the effect of input import competition by separatelyestimating the effects of import penetration in the final goods and intermediateinput markets. Instead of netting the latter from the former, we now includethe two variables in the regression. In column (2), we start by estimating theunconditional effect on sales growth of import competition in the final goodsmarket and of import competition in input markets without interacting thesevariables with the R&D stock. We find as before that trade shocks in the finalgoods market have a negative effect on sales growth. The coefficient on tradeshocks in input markets is positive, suggesting a positive effect of positivesupply shocks in input markets, but statistically insignificant. This result isconsistent with Acemoglu et al. (2016), who estimate the effect of trade shocksin input markets measured in a similar way as our measure of employmentgrowth based on the County Business Patterns data and find that the effectis imprecisely estimated and unstable in sign. In column (5), we study theunconditional effect on profitability. The effect of import competition continues
25 The reduction in the negative effect on ROA is 0.7 percentage points (significant at the 5%level, column (4), about one-third of the unconditional effect), on capital expenditures it is 2.3% offixed assets (significant at the 1% level, column (6), about the same as the unconditional effect),and for employment growth it is 1.1 percentage points (significant at the 1% level, column (8),about the same as the unconditional effect).

34 The Journal of Finance R©
Table XIVControlling for Import Competition in Input Markets
The sample comprises U.S. manufacturing firms over the 1991 to 2007 period from Compustat.In columns (1) and (4), we estimate the same regression as in column (4) of Tables VI and VIIexcept that we now use input-adjusted import competition defined as import competition in thefinal market minus import competition in intermediate input markets. In columns (2) and (5), weestimate the same regression as in column (1) of Tables VI and VII except that we now use bothimport competition in the final market and import competition in intermediate input markets.In columns (3) and (6), we estimate the same regression as in column (4) of Tables VI and VIIexcept that we now use both import competition in the final markets and import competition inintermediate input markets. Standard errors are bootstrapped within industry-year clusters andreported in parentheses. *, **, and *** indicate statistically different from zero at the 10%, 5%,and 1% level of significance, respectively.
Sales Growth ROA
(1) (2) (3) (4) (5) (6)
Net import penetration × R&D Stock 1.31*** 1.74***(0.47) (0.62)
Final market import penetration −0.84*** −0.71***(0.24) (0.27)
Input market import penetration 0.24 1.65*(0.93) (1.02)
Final good import penetration 1.20** 1.67**× R&D Stock (0.53) (0.69)
Input market import penetration −0.24 −1.23× R&D Stock (2.14) (2.69)
Assets 0.03*** 0.01 0.03*** 0.01 0.06*** 0.01(0.01) (0.01) (0.01) (0.01) (0.01) (0.01)
Age −0.23*** −0.20*** −0.23*** 0.15*** 0.06*** 0.15***(0.02) (0.01) (0.02) (0.02) (0.01) (0.02)
R&D Stock 0.08*** 0.07*** −0.21*** −0.21***(0.03) (0.03) (0.03) (0.03)
Firm FE Yes Yes Yes Yes Yes YesYear FE – Yes – – Yes –Industry-Year FE Yes No Yes Yes No YesObservations 23,843 23,843 23,843 24,461 24,461 24,461R2 0.33 0.24 0.33 0.72 0.68 0.72
to be negative and strongly significant, while the effect of import competitionin input markets is now positive and significant at the 10% level. These resultsare consistent with the view that positive supply shocks in input markets leadto cheaper inputs and higher profits, but we cannot detect significant effectsof firms responding to cheaper inputs by expanding production, at least onaverage.
Finally, we study whether firms’ response to these supply shocks in inputmarkets depends on their level of R&D capital. Theory makes no clear pre-diction on whether innovation and intermediate inputs are complements orsubstitutes. The model in Internet Appendix I predicts that cost is a moreimportant factor for less innovative firms that compete head-to-head with Chi-nese producers. However, it may be the case that innovative firms are better

Can U.S. Manufacturing Firms Escape Import Competition from China 35
able to integrate into global production chains. In columns (3) and (6), we in-teract import competition in the final goods market and in input markets withR&D stock. As in the baseline specification, we find that the interaction termbetween import competition in the final goods market and R&D stock is positiveand significant. In contrast, the interaction term between import competitionin intermediate input markets and R&D stock is insignificant and close to zero.Therefore, it does not appear that more innovative firms benefit more or lessfrom import competition shocks in their input markets.
VII. Concluding Remarks
We exploit the staggered changes in R&D tax credits across U.S. states andover time as a quasi-natural experiment to examine whether more innovativefirms are better shielded from import competition from China. We furtherinstrument for China’s import penetration in the United States using Chineseimports by other high-income countries. We show that while rising imports leadto slower sales growth and lower profitability for firms in import-competingindustries, this effect is significantly smaller for firms that have invested largeamounts in R&D thanks to generous R&D tax credit policies. We also show thatthe effect of R&D on firm performance arises mostly through higher productdifferentiation, as in Sutton’s (1991) theory of R&D, rather than through lowercosts, as in Grossman and Helpman (1991) and Aghion and Howitt’s (1992)models of innovation. As a result of higher performance, R&D-intensive firmscan avoid downsizing and continue to invest in capital and labor despite beingexposed to trade shocks.
Our results have policy implications when viewed alongside previous work onhow firms endogenously adjust R&D investment after trade shocks. The mixedevidence on this question (see Bloom, Draca, and Van Reenen (2016) vs. Autoret al. (2016)) suggests that firms may cut R&D investment not because its NPVbecomes negative, but because trade shocks increase frictions such as creditconstraints. In this case, public policies that aim to relax credit constraints maybe better than R&D tax credits, which can distort firm investment choices, ifnot all firms have positive NPV R&D investment to undertake.
While we are cautious about generalizing the results, our findings may berelevant in other contexts. First, the Chinese export boom starting in the late1990s has represented a considerable shock to competition for most developedeconomies, not just the United States. More broadly, it is neither the first northe last time that profitability and employment in the manufacturing sectorin high-income countries face rising competition from low- and middle-incomecountries (Bernard, Jensen, and Schott (2006)). Second, the effect of the in-teraction between impact of import competition and R&D tax credit on firmperformance is also relevant outside the United States as most high-incomecountries have introduced such tax credits to promote innovation.
An open question left for future research pertains to general equilibrium ef-fects. What would happen if all U.S. firms had invested large amounts in R&D?Would they all preserve their market shares or would they start crowding each

36 The Journal of Finance R©
other out? Our research design cannot, by construction, answer this questionbecause it relies on a difference-in-difference approach. While we show thatinnovative firms preserve their market share following increased competitionfrom China, we cannot claim whether this is because these firms are able to notlose market shares to Chinese competitors or because they gain market sharesat the expense of other less innovative U.S. firms. In the first case, innovationwould imply a positive effect for the U.S. economy as a whole. In contrast, thesecond scenario would imply a reallocation of market shares among U.S. firmsbut the overall impact on the U.S. economy might not be positive. Understand-ing how our microestimates add up at the macro level represents a fruitfulavenue for future work.
Initial submission: November 24, 2015; Accepted: September 23, 2017Editors: Bruno Biais, Michael R. Roberts, and Kenneth J. Singleton
REFERENCES
Acemoglu, Daron, David H. Autor, David Dorn, Gordon H. Hanson, and Brendan Price, 2016, Im-port competition and the great U.S. employment sag of the 2000s, Journal of Labor Economics34, 141–198.
Aghion, Philippe, Philippe Askenazy, Nicolas Berman, Gilbert Cette, and Laurent Eymard, 2012,Credit constraints and the cyclicality of R&D investment: Evidence from France, Journal ofthe European Economic Association 10, 1001–1024.
Aghion, Philippe, Nick Bloom, Richard Blundell, Rachel Griffith, and Peter Howitt, 2005, Com-petition and innovation: An inverted-U relationship, Quarterly Journal of Economics 120,701–728.
Aghion, Philippe, and Peter Howitt, 1992, A model of growth through creative destruction, Econo-metrica 60, 323–354.
Arrow, Kenneth, 1962, Economic welfare and the allocation of resources for invention, in R. Nelson,ed.: The Rate and Direction of Inventive Activity (Princeton University Press, Princeton).
Autor, David H., David Dorn, and Gordon H. Hanson, 2013, The China Syndrome: Local labormarket effects of import competition in the United States, American Economic Review 103,2121–2168.
Autor, David H., David Dorn, Gordon H. Hanson, Gary Pisano, and Pian Shu, 2016, Foreigncompetition and domestic innovation: Evidence from U.S. patents, NBER Working Paper22879.
Bernard, Andrew B., J. Bradford Jensen, Stephen J. Redding, and Peter K. Schott, 2012, Theempirics of firm heterogeneity and international trade, Annual Review of Economics 4, 283–313.
Bernard, Andrew B., J. Bradford Jensen, and Peter K. Schott, 2006, Survival of the best fit: Expo-sure to low-wage countries and the (uneven) growth of U.S. manufacturing plants, Journal ofInternational Economics 68, 219–237.
Bhojraj, Sanjeev, Paul Hribar, Marc Picconi, and John McInnis, 2009, Making sense of cents: Anexamination of firms that marginally miss or beat analyst forecasts, Journal of Finance 64,2361–2388.
Bloom, Nicholas, Mirko Draca, and John Van Reenen, 2016, Trade induced technical change? Theimpact of Chinese imports on innovation, IT and productivity, Review of Economic Studies 83,87–117.
Bloom, Nicholas, Mark Schankerman, and John Van Reenen, 2013a, Identifying technologyspillovers and product market rivalry, Econometrica 81, 1347–1393.
Bloom, Nicholas, Mark Schankerman, and John Van Reenen, 2013b, Supplement to “Identify-ing technology spillovers and product market rivalry,” Econometrica 81, 1–33, EconometricaSupplementary Material.

Can U.S. Manufacturing Firms Escape Import Competition from China 37
European Commission, 2010, Lisbon Strategy Evaluation Document, Commission Staff Work-ing Document. Available at http://ec.europa.eu/transparency/regdoc/rep/2/2010/EN/SEC-2010-114-F1-EN-MAIN-PART-1.PDF.
Feenstra, Robert C., and Gordon H. Hanson, 2005, Ownership and control in outsourcing to China:Estimating the property-rights theory of the firm, Quarterly Journal of Economics 120, 729–761.
Fort, Teresa C., John Haltiwanger, Ron S. Jarmin, and Javier Miranda, 2013, How firms respondto business cycles: The role of firm age and firm size, NBER Working Paper 19134.
Foster, Lucia, John Haltiwanger, and Chad Syverson, 2008, Reallocation, firm turnover, and effi-ciency: Selection on productivity or profitability? American Economic Review 98, 394–425.
Fresard, Laurent, 2010, Financial strength and product market behavior: The real effects of cor-porate cash holdings, Journal of Finance 65, 1097–1122.
Fresard, Laurent, and Philip Valta, 2016, How does corporate investment respond to increasedentry threats? Review of Corporate Finance Studies 5, 1–35.
Grossman, Gene, and Elhanan Helpman, 1991, Quality ladders in the theory of growth, Review ofEconomic Studies 58, 43–61.
Hall, Bronwyn H., Adam B. Jaffe, and Manuel Trajtenberg, 2001, The NBER Patent CitationsData file: Lessons, insights and methodological tools, NBER Working Paper.
Hall, Bronwyn H., Adam Jaffe, and Manuel Trajtenberg, 2005, Market value and patent citations,RAND Journal of Economics 36, 16–38.
Hoberg, Gerard, and Gordon Phillips, 2016, Text-based network industries and endogenous productdifferentiation, Journal of Political Economy 124, 1423–1465.
Hummels, David, Rasmus Jørgensen, Jakob Munch, and Chong Xiang, 2014, The wage effects ofoffshoring: Evidence from Danish matched worker-firm data, American Economic Review 104,1597–1629.
Khandelwal, Amit, 2010, The long and short (of) quality ladders, Review of Economic Studies 77,1450–1476.
Lai, Ronald, Alexander D’Amour, and Lee Fleming, 2009, The Careers and Co-Authorship Networksof U.S. Patent-Holders, Since 1975 (Harvard Institute for Quantitative Social Science, HarvardUniversity, Cambridge, MA).
Leamer, Edward E., 2007, A flat world, a level playing field, a small world after all, or none of theabove? Journal of Economic Literature 45, 83–126.
Organization for Economic Cooperation and Development (OECD), 2014, OECD Science, Technol-ogy and Industry Scoreboard, annual report (OECD Publishing, Paris).
Pierce, Justin R., and Peter K. Schott, 2016, The surprisingly swift decline of U.S. manufacturingemployment, American Economic Review 106, 1632–1662.
Scherer, Frederic M., and Keun Huh, 1992, R&D reactions to high-technology import competition,Review of Economics and Statistics 74, 202–212.
Schumpeter, Joseph A., 1943, Capitalism, Socialism and Democracy (Allen & Unwin, London).Sutton, John, 1991, Sunk Costs and Market Structure (MIT Press, Cambridge, MA).Valta, Philip, 2012, Competition and the cost of debt, Journal of Financial Economics 105, 661–682.Wilson, Daniel J., 2009, Beggar thy neighbor? The in-state, out-of-state and aggregate effects of
R&D tax credits, Review of Economics and Statistics 91, 431–436.Xu, Jin, 2012, Profitability and capital structure: Evidence from import penetration, Journal of
Financial Economics 106, 427–446.
Supporting Information
Additional Supporting Information may be found in the online version of thisarticle at the publisher’s website:
Appendix S1: Internet Appendix.