Embed Size (px)
Citation preview

Accepted Manuscript
Can information and counseling help students from poor rural areas go to high
school? evidence from china
Prashant Loyalka, Chengfang Liu, Yingquan Song, Hongmei Yi, Xiaoting
Huang, Jianguo Wei, Linxiu Zhang, Yaojiang Shi, James Chu, Scott Rozelle
PII: S0147-5967(13)00090-5
DOI: http://dx.doi.org/10.1016/j.jce.2013.06.004
Reference: YJCEC 2343
To appear in: Journal of Comparative Economics
Received Date: 22 August 2012
Revised Date: 10 June 2013
Please cite this article as: Loyalka, P., Liu, C., Song, Y., Yi, H., Huang, X., Wei, J., Zhang, L., Shi, Y., Chu, J.,
Rozelle, S., Can information and counseling help students from poor rural areas go to high school? evidence from
china, Journal of Comparative Economics (2013), doi: http://dx.doi.org/10.1016/j.jce.2013.06.004
This is a PDF file of an unedited manuscript that has been accepted for publication. As a service to our customers
we are providing this early version of the manuscript. The manuscript will undergo copyediting, typesetting, and
review of the resulting proof before it is published in its final form. Please note that during the production process
errors may be discovered which could affect the content, and all legal disclaimers that apply to the journal pertain.

CAN INFORMATION AND COUNSELING HELP STUDENTS FROM POOR RURAL
AREAS GO TO HIGH SCHOOL? EVIDENCE FROM CHINA
Prashant Loyalkaa,d
Chengfang Liub ([email protected])
Yingquan Songa ([email protected])
Hongmei Yib ([email protected])
Xiaoting Huanga ([email protected])
Jianguo Weia ([email protected])
Linxiu Zhangb ([email protected])
Yaojiang Shic ([email protected])
James Chud ([email protected])
Scott Rozelled ([email protected])
a China Institute for Educational Finance Research (CIEFR), Peking University
b Center for Chinese Agricultural Policy, Institute for Geographical Sciences and Natural
Resources Research, Chinese Academy of Sciences c School of Economic Management, Xibei University
d Center for Food Security and the Environment, Freeman Spogli Institute,
Stanford University
June 2013
Corresponding Author:
Yi Hongmei
Center for Chinese Agricultural Policy
Institute for Geographical Sciences and Natural Resources Research
Chinese Academy of Sciences
Phone: + 86-10-64889440

CAN INFORMATION AND COUNSELING HELP STUDENTS FROM POOR RURAL
AREAS GO TO HIGH SCHOOL? EVIDENCE FROM CHINA
Abstract:
Recent studies have shown that only about two-thirds of the students from poor, rural areas in
China finish junior high school and enter high school. One factor that may be behind the low
rates of high school attendance is that students may be misinformed about the returns to
schooling or lack career planning skills. We therefore conduct a cluster-randomized
controlled trial (RCT) using a sample of 131 junior high schools and more than 12,000
students to test the effects of providing information on returns or career planning skills on
student dropout, academic achievement and plans to go to high school. Contrary to previous
studies, we find that information does not have significant effects on student outcomes.
Unlike information, counseling does have an effect. However, the effect is somewhat
surprising. Our findings suggest that counseling increases dropouts and seems to lower
academic achievement. In our analysis of the causal chain, we conclude that financial
constraints and the poor quality of education in junior high schools in poor, rural areas (the
venue of the study) may be contributing to the absence of positive impacts on student
outcomes from information and counseling. The negative effects of counseling on dropout
may also be due to the high and growing wages for unskilled labor (high opportunity costs) in
China’s transitioning economy. It is possible that when our counseling curriculum informed
the students about the reality of how difficult were the requirements for entering academic
high school, it may have induced them to revise their benefit-cost calculations and come to
the realization that they are better off dropping out and/or working less hard in school.
JEL: I20, 015
Keywords: junior high school students, randomized controlled trial, information, counseling,
dropout, educational attainment, high school, rural China

CAN INFORMATION AND COUNSELING HELP STUDENTS FROM POOR
RURAL AREAS GO TO HIGH SCHOOL? EVIDENCE FROM CHINA
1. Introduction
As China’s economy gradually shifts from one based on low-wage industries
towards one based on higher-valued services, the demand for skilled labor will outpace that
for unskilled labor (Zhang et al., 2011). If an individual wants to hold a stable, high wage
job in the coming years, he/she will need to acquire skills (Zhang et al., 2011). To meet the
challenge, individuals will need to be equipped with higher levels of schooling.
Unfortunately, when children in poor, rural areas today grow up, they may not be
able to enjoy China’s future economic prosperity because of their low levels of education.
Recent studies have shown that only about two-thirds of the students from poor, rural areas
in China enter high school (Yi et al., 2012a). Instead of continuing their education, most of
these children enter the labor market and take unskilled jobs.
There are a number of reasons why poor, rural students from developing countries
attain such low levels of education. Credit constraints combined with the high cost of
attending school can induce poor, rural students to prematurely leave school (Banerjee et
al., 2000). Even when schooling is free, there may be high opportunity costs of going to
school (Angrist and Lavy, 2009). The competitive nature of education systems in many
developing countries can also discourage poor, rural students from continuing their
education (Glewwe and Kremer, 2006; Clarke et al., 2000).
Misinformation about the returns to schooling is another important, but less
researched, factor that may keep students from continuing their education. Economists
argue that individuals make educational choices based on perceived, rather than actual,

2
economic returns to schooling (Manski, 1993). However, perceived returns may differ from
actual returns if individuals have limited or imperfect information. With imperfect
information about the returns to schooling, students may choose not to enroll in high school
even though it will better prepare them to participate in the future economy.
Individuals living in poor, rural areas often are thought to have imperfect
information about the returns to schooling because locating reliable information can be
costly (Jensen, 2010; Nguyen, 2008). In such circumstances students obtain information
about the returns to schooling by observing their parents and other community members
(Jensen, 2010). However, in poor, rural areas parents and community members tend to have
relatively low levels of education and work in low-skilled industries. As a consequence,
students tend to underestimate actual returns to schooling, ultimately leading them to leave
school (Jensen, 2010; Nguyen, 2008).
Imperfect information about the returns to schooling, however, may only be part of
the problem. There may be a number of other constraints. Even if students understand that
there are high returns to high school, they may not know how to prepare for high school.
For example, students may not know the entrance requirements for attending different
types of high school. Beyond economic returns, students may not see the links among their
own interests and aptitudes, going to high school and their career options. We use the term
career planning skills to refer to the knowledge about how to attend high school
(requirements, options, planning, etc.) and the awareness of the links among one’s own
interests and aptitudes, high school and career options.

3
Unfortunately, students in developing countries rarely have been taught career
planning skills. They may, therefore, lack an understanding of their own interests and
aptitudes, education and employment options and how to plan for their future (Whiston,
2003; Savickas, 1999; Parsons, 1909). They may be unsure how to navigate transitions
from one level of education to another (Valentine et al., 2009; Vargas, 2004). Students
from low-income backgrounds, especially, may not understand how to make the most out
of their education and career opportunities (McSwain and Davis, 2007; McDonough, 2004).
For these reasons, the lack of career planning skills may lead students to discontinue their
schooling even if they know the returns to school are relatively high.
Studies from several countries show that providing information about the returns to
schooling or teaching career planning skills can improve the educational outcomes of
students. In the Dominican Republic students that received information about the returns to
schooling went to school longer (Jensen, 2010). Students in Madagascar that received
information on the returns to schooling scored higher on achievement tests (Nguyen, 2008).
Career counseling interventions in the United States increased school enrollment rates
among low-income students, improved their ability to secure financial aid and encouraged
them to attend more selective colleges (Castlemana et al., 2011; Koivisto et al., 2010;
Whiston et al., 1998). However, no study has discussed the impact of offering information
on the returns to schooling or teaching career planning skills on dropout rates, academic
achievement and plans to go to high school among junior high students in China (for more
on China’s situation, see Appendix A).

4
The main purpose of this study is to measure the impact of providing information or
career planning skills on dropout rates, academic achievement and plans to go to high
school among grade 7 students in poor, rural areas in China. To meet this overall goal, we
have three specific objectives. First, we determine the extent to which students are
misinformed and lack career planning skills. Second, we analyze the impact of information
about returns to schooling and career planning skills on dropout rates, academic
achievement and plans of students to go to high school. We also look at the heterogeneous
effects of the interventions on low-achieving, male, or poor students. Third, we explore
why the interventions may or may not be affecting student outcomes in the context of
junior high schools in poor, rural counties in China.
2. Research Design, Interventions, Data and Statistical Approach
We conducted a cluster-randomized controlled trial (RCT) to estimate the impact of
information and counseling interventions among 12,786 first-year students in 131 rural,
public junior high schools located in 15 poor counties in Hebei and Shaanxi provinces. In
Hebei our sample covered 10 poor counties, 60 junior high schools, 153 grade 7 classes and
6,491 students. In Shaanxi the sample covered 5 poor counties, 71 junior high schools, 153
grade 7 classes and 6,305 students. We chose Hebei and Shaanxi because they differ in
terms of location and geography, allowing broader inferences from our data.
Using official records, we first created a sampling frame of all rural, public junior
high schools in the sample counties. A total of 150 schools were identified (71 in Shaanxi
and 79 in Hebei). We sampled all 71 schools in Shaanxi. In Hebei, we sampled 60 schools.
We excluded 19 schools in Hebei because the number of grade 7 students in the schools

5
was under 50. These schools were excluded on the basis of enrollment because smaller
schools were likely to be closed as a part of a government school merger program. On
average, there were 42 grade 7 students in each class. In the baseline, we surveyed all
students in all 306 grade 7 classes in all 131 schools. Our sample is roughly representative
of rural, pubic junior high schools in poor counties in provinces like Shaanxi and Hebei.
The next step of our study was to conduct a baseline survey at the beginning of the
school year in October 2010. In the survey we collected data from all grade 7 students,
grade 7 homeroom teachers and school principals. We asked each student to take a
standardized mathematics examination (see ―Data Collection‖ below).
After the baseline examination, we stratified the 131 sample schools into roughly
22 equal size blocks of six schools to increase the statistical power of our analyses (see
Imai et al., 2009). The blocks were created by first ranking schools by grade 7 enrollments
within each province (from lowest to highest), then choosing the first six schools for the
first block, the next six schools for the second block, and so on.1
After blocking, our research team randomly assigned two schools in each block to
one of two experimental arms and a control arm. In total, 44 schools were assigned to the
information intervention, 43 schools to the counseling intervention and 44 schools to the
control arm. Thereafter, we randomly selected half of the grade 7 homeroom teachers (and
their respective classes) from the sample schools in the information and counseling
intervention arms to attend training programs that were taught by professional counselors
in November 2010. These teachers then went back to their schools and, depending on their
respective treatment arm, implemented either the information or counseling interventions
6
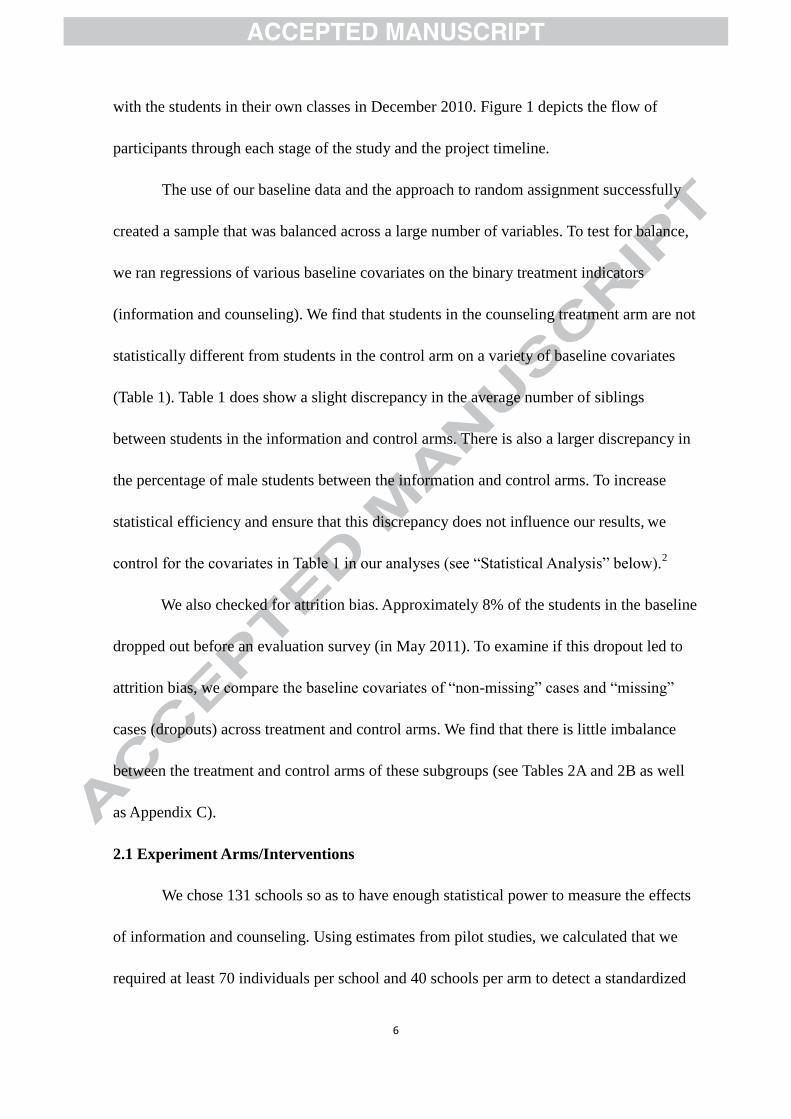
with the students in their own classes in December 2010. Figure 1 depicts the flow of
participants through each stage of the study and the project timeline.
The use of our baseline data and the approach to random assignment successfully
created a sample that was balanced across a large number of variables. To test for balance,
we ran regressions of various baseline covariates on the binary treatment indicators
(information and counseling). We find that students in the counseling treatment arm are not
statistically different from students in the control arm on a variety of baseline covariates
(Table 1). Table 1 does show a slight discrepancy in the average number of siblings
between students in the information and control arms. There is also a larger discrepancy in
the percentage of male students between the information and control arms. To increase
statistical efficiency and ensure that this discrepancy does not influence our results, we
control for the covariates in Table 1 in our analyses (see ―Statistical Analysis‖ below).2
We also checked for attrition bias. Approximately 8% of the students in the baseline
dropped out before an evaluation survey (in May 2011). To examine if this dropout led to
attrition bias, we compare the baseline covariates of ―non-missing‖ cases and ―missing‖
cases (dropouts) across treatment and control arms. We find that there is little imbalance
between the treatment and control arms of these subgroups (see Tables 2A and 2B as well
as Appendix C).
2.1 Experiment Arms/Interventions
We chose 131 schools so as to have enough statistical power to measure the effects
of information and counseling. Using estimates from pilot studies, we calculated that we
required at least 70 individuals per school and 40 schools per arm to detect a standardized

7
effect size for the academic achievement outcome of .25 with 80 percent power at a five
percent significance level. We conservatively assumed an intra-cluster correlation of 0.20, a
pre- and post-intervention correlation of 0.6 and a ten percent loss to follow-up. The
following section details the three experiment arms.
2.1.1 The information intervention arm
In schools that received the information intervention, grade 7 homeroom teachers
and their principals came to a central training location (in either province). At each location
a professional counselor conducted a scripted, half-day training for the teachers and
principals. The participants, in turn, learned how to give a scripted 45-minute lesson to
their grade 7 students. At the end of the training, each teacher received a teacher’s manual,
a DVD of the lesson and workbooks for their students. Teachers agreed to conduct the
information intervention lesson during the week of December 20-24, 2010.
The information intervention presented statistics on the net returns (wages minus
costs) associated with different levels of schooling in simple graphical and tabular forms.
First, the lesson shared information on the average wage levels of graduates from different
levels of schooling (junior high schools, high schools, three-year vocational colleges,
four-year universities and graduate schools). Second, students were taught about the wage
differences between high school and junior high school graduates in percentage terms.3
Students were provided with national and provincial-level statistics on the average wage
levels and wage differences associated with different levels of education. Finally, students
were taught the levels of tuition (the costs) that students from Hebei or Shaanxi would pay
for attending different levels of schooling and different types of schools available.4

8
2.1.2 The counseling intervention arm
In schools that received the counseling intervention, grade 7 homeroom teachers
and their principals came to a central training location in each province. At each location a
professional counselor gave them a scripted training for a day and a half.
During the counseling training, participants learned how to give four scripted
45-minute lessons to grade 7 students on career planning skills. The first lesson discussed
the importance of acquiring skills in China's growing economy; the second lesson focused
on helping students identify their career interests; the third lesson was identical to the
information intervention (discussed in the subsection above); and the fourth lesson helped
students understand how to navigate China's education system after junior high (details of
the lessons can be found in Appendix B). Each teacher received a teacher’s manual, a DVD
of the scripted lessons, and student workbooks. Teachers agreed to conduct one lesson each
week for four consecutive weeks in December 2010.5
2.1.3 Targeting and Delivery
We targeted the information and counseling interventions to grade 7 students as
opposed to older students.6 Although grade 7 students (typically 13 to 14 year olds) may
find it difficult to process information about future opportunities, the literature suggests the
contrary (Whiston, Sexton and Lasoff, 1998). Two major studies from developing countries
find positive results from targeting wage information at primary and secondary school
students (Nguyen, 2008; Jensen, 2010). Given that 8% of the students in our survey
dropped out before even completing grade 7 and that the three-year cumulative dropout rate
9
in poor, rural counties is around 25% (Yi et al., 2012a), targeting information and
counseling at students in grade 7 seems critical.
Furthermore, we adapted all materials so that they were appropriate for grade 7
students in China. We piloted the materials multiple times with different sets of grade 7
students in Hebei and Shaanxi. We modified the materials based on the feedback we
received from principals, teachers and students in pilot schools. In feedback forms, students
said that the program was helpful and effective (Table 3).
2.2 Data Collection
We collected student information on the three primary outcome variables in our
evaluation survey in May 2011: (a) student dropout (a binary variable); (b) academic (math)
achievement; and (c) plans to go to high school at the end of grade 7 (three binary variables
for plans to attend academic, vocational or any high school).
Academic achievement was measured using a standardized math exam that was
administered during the evaluation (May 2011) and baseline (October 2010) surveys. We
used item-response theory (IRT) to calibrate the scores from the math exams. To do so, we
piloted math exam items that would be used to construct the baseline and evaluation math
exams with over 300 students. We then aligned the two exams on the same difficulty scale
using a procedure suggested by Kolen and Brennan (2004). This procedure allows us to
directly compare student baseline and evaluation scores (and thus look at student learning
gains). Finally, the IRT-scaled scores were scaled into z-scores by subtracting the mean and
dividing by the standard deviation (SD) of the IRT-scaled score distribution.

10
Plans to go to high school were measured in both the evaluation and baseline
surveys. In particular, we asked students which educational track they planned to choose
after junior high: academic high school, vocational high school, the labor market or
―undecided.‖ We also asked students to identify factors (such as family financial
constraints) influencing their decisions. Finally, we asked each student to predict the
monthly wage that he/she expected to earn after graduating from academic high school,
vocational high school or entering the labor market directly after junior high.
We used other information from our baseline survey to generate a set of control
variables that are used in the analysis. One part of the baseline survey collected data about
student background characteristics, such as gender, age and contact information. We also
collected information about each student’s family characteristics, such as number of
siblings, the health status of parents, whether parents had completed primary school and
whether parents had ever migrated. We also asked students to fill out a checklist of
household assets to help identify whether they were poor. A monetary value was assigned
to each asset based on the National Household Income and Expenditure Survey (NBS,
2007) and the household’s wealth was estimated by summing the individual asset values.
2.3 Statistical Approach
We use unadjusted and adjusted ordinary least squares (OLS) regression analysis to
estimate how dropout, academic achievement and plans to go to high school changed for
students in the information and counseling intervention arms relative to students in the
control arm. The basic specification of the unadjusted model is:
(1)
11
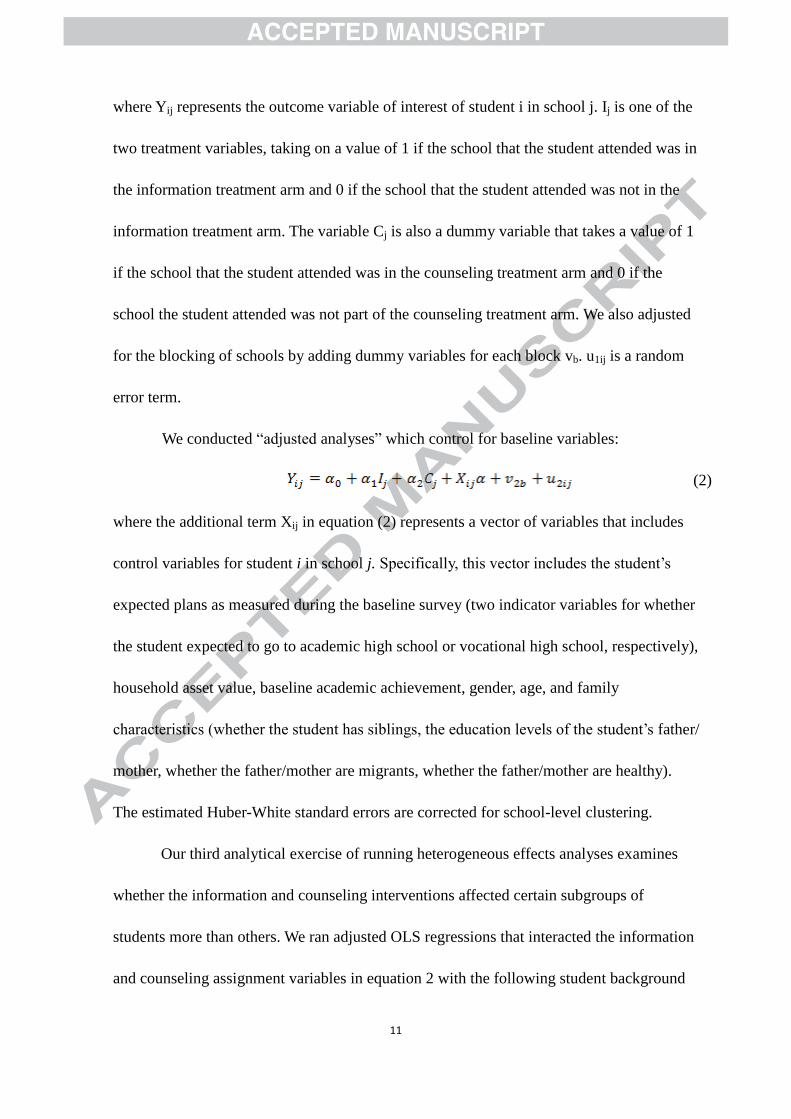
where Yij represents the outcome variable of interest of student i in school j. Ij is one of the
two treatment variables, taking on a value of 1 if the school that the student attended was in
the information treatment arm and 0 if the school that the student attended was not in the
information treatment arm. The variable Cj is also a dummy variable that takes a value of 1
if the school that the student attended was in the counseling treatment arm and 0 if the
school the student attended was not part of the counseling treatment arm. We also adjusted
for the blocking of schools by adding dummy variables for each block vb. u1ij is a random
error term.
We conducted ―adjusted analyses‖ which control for baseline variables:
(2)
where the additional term Xij in equation (2) represents a vector of variables that includes
control variables for student i in school j. Specifically, this vector includes the student’s
expected plans as measured during the baseline survey (two indicator variables for whether
the student expected to go to academic high school or vocational high school, respectively),
household asset value, baseline academic achievement, gender, age, and family
characteristics (whether the student has siblings, the education levels of the student’s father/
mother, whether the father/mother are migrants, whether the father/mother are healthy).
The estimated Huber-White standard errors are corrected for school-level clustering.
Our third analytical exercise of running heterogeneous effects analyses examines
whether the information and counseling interventions affected certain subgroups of
students more than others. We ran adjusted OLS regressions that interacted the information
and counseling assignment variables in equation 2 with the following student background

12
indicators: whether the student was in the lowest one-third of the achievement distribution,
whether the student was female and whether the student was in the bottom one-third of the
household asset value distribution.
3. Results
3.1 Descriptive Results
According to our descriptive analysis, students seem to have imperfect information
about the returns to schooling. First, students have incorrect estimates about the wages
associated with different levels of schooling. Although students do perceive that higher
levels of schooling lead to higher wages, there is substantial variation among students in
perceived wages for each level of education (Table 4). For example, student estimates for
wages earned by university graduates range from 1300 to 13000 yuan per month. While it
is true that part of this variation indicates students, in fact, will earn wages that will differ
from individual to individual, the considerable variation is likely not explained by this fact
alone. The wide range of estimates is suggestive that students do not have complete
information about returns to schooling (Nguyen, 2008).
Second, students revealed their lack of understanding about the returns to high
school by overestimating the costs of attending vocational school. In our baseline survey
students expected that vocational high school would cost 5,000 yuan/year (at the
median—Figure 2). The median expectation is 2,000 yuan higher than the actual net cost,
3,000 yuan/year.7 Furthermore, more than 25 percent of students believed that attending
vocational high school would cost 10,000 yuan/year or more. This is 7,000 yuan (or more
than two times higher) than the actual net cost. In nationally designated poor counties

13
where the average annual per capita income for rural households in 2008 was
approximately 2,600 yuan (State Council, 2010), these substantial overestimates of
schooling costs might discourage students from attending high school.
In addition to having imperfect information about the returns and costs of high
school, students also demonstrated poor career planning skills. Students entering grade 7
demonstrated unrealistic expectations about their plans to go to high school. In the baseline
survey 52% of grade 7 students believed they would attend academic high school; only
14% of the students said that they planned to attend vocational high school. In actuality, the
numbers of enrollments in both types of high schools are approximately equal (Yi et al.,
2012a). Students may be overestimating the likelihood of going to academic high school if
they are not aware of the requirements and realities associated with attending academic
high school. The low share of students planning to attend vocational high schools also may
suggest that students do not realize the benefits of attending vocational school.
Students also displayed unrealistic expectations regarding their time of entry into
the labor force. According to our baseline data, only 5% of students planned to forgo high
school and enter the labor market (Table 5, last column). However, in recent years only
about two-thirds of poor, rural students entering grade 7 ultimately continued their
schooling after grade 9 (Yi et al., 2012a). Hence, if students in our sample are similar to
those in the recent cohorts, their expectations at the beginning of grade 7 are not consistent
with the paths that they most likely will follow during or immediately after junior high.
Taken together, the evidence suggests that grade 7 students in poor, rural areas of
China are misinformed and lack career-planning skills. Students lack information on the

14
wages and costs associated with different levels of schooling. Students have unrealistic
expectations about their future schooling plans. Perhaps most disconcerting, although at the
beginning of grade 7 only a small share (5%) of students believe they will be entering the
labor market at some time during their grade 7 year of school, by the end of the year, nearly
three times as many (14%) plan to drop out of school and enter the labor market.
3.2 Impacts of Information and Counseling on Student Outcomes
Although students in China’s poor rural junior high schools have imperfect
information about the returns to schooling, students receiving the information intervention
demonstrated no discernible differences in dropout rates, academic achievement or plans to
go to high school at the end of grade 7 compared with students in the control schools.
Looking at the unadjusted statistics (Table 6, columns 3, 4, and 6), we see that the average
outcomes measured in the evaluation survey are not statistically different between the
information intervention and control arms. Similarly, the multivariate results from the
adjusted model in Table 7 show that the coefficients of the information treatment variable
are small in magnitude and not statistically significant at the 5% level (columns 2, 4, 6, 8,
10, row 1). Thus, there appears to be no statistically significant effect of the information
treatment on student dropout, academic achievement or plans to go to high school.
The results of the descriptive/multivariate analysis of the impact of the counseling
treatment on the study’s outcome variables are similar to those for the information
treatment: there is no positive effect. According to the descriptive statistics, we, in fact, see
that the dropout rate is 2 percentage points higher and academic achievement is 0.14 SDs
lower in the counseling arm compared to the control arm (Table 6, columns 2, 4, and 5).

15
The percentage of students with plans to go to any high school is roughly the same between
the counseling and control arms (Table 6, columns 2, 4, and 5). The coefficients of the
counseling treatment variable in the adjusted model are similar with the exception that the
impact of counseling on academic achievement is not statistically significant (Table 7,
columns 2, 4, 6, 8, 10, row 2). The estimates therefore suggest that the counseling treatment
may have had a small negative effect on academic achievement (significant at the 10%
level) and no effects on plans to go to high school.
Both the unadjusted and adjusted estimates from Table 7 indicate that the
counseling intervention increased dropout. The adjusted estimates show that students in
schools with the counseling intervention were 1.7 percentage points (about 25%) more
likely to dropout (Table 7, Row 2, Column 4). This was significant at the 5% level.
Why did the counseling intervention increase dropout? One explanation may be that
some of the students that attended the counseling lessons concluded that the requirements
to enter academic high school and college were too difficult. If these students also did not
perceive the returns to vocational school as being particularly high (or if they were not
interested in attending a vocational school) they may have felt it more prudent to enter the
labor market early on. The relatively high starting wages for unskilled labor (as compared
to starting wages for skilled labor) in China’s current economy may have also been an
important factor in this decision (Cai, 2009).
3.3 Heterogeneous Effects Analysis
Although, on average, the results were negligible or negative for our entire sample,
certain subgroups of students could have benefitted. As such, we sought to understand
16
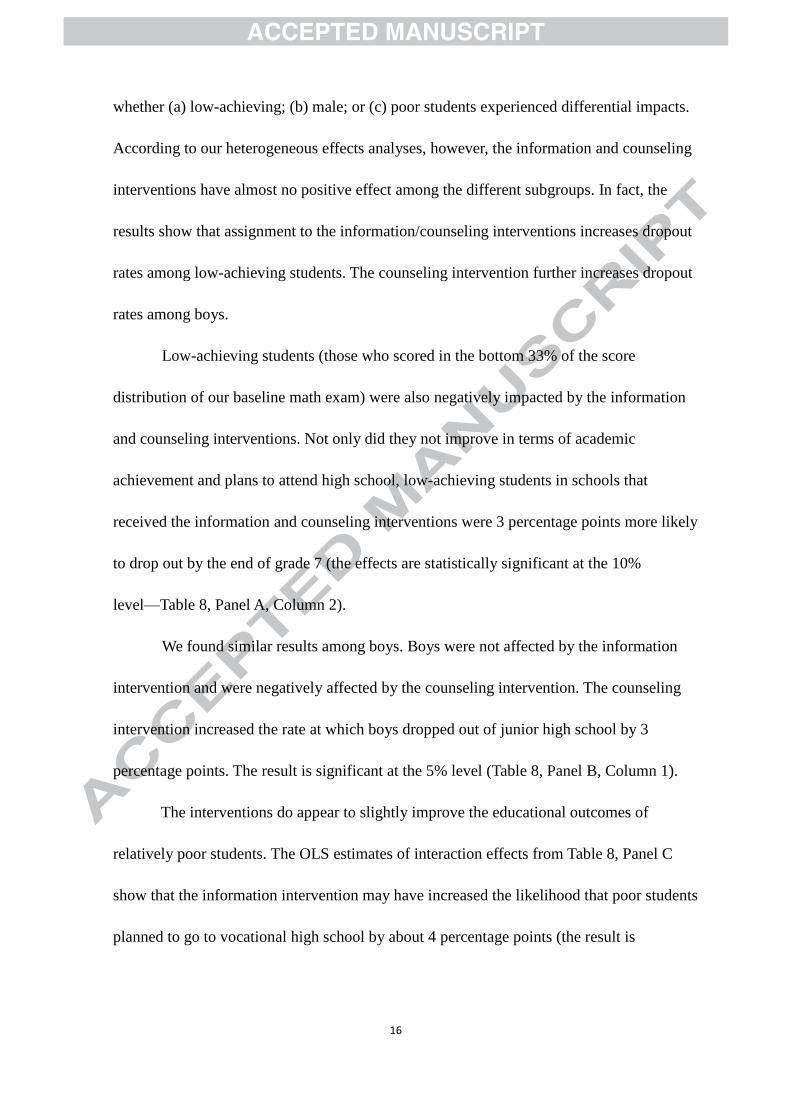
whether (a) low-achieving; (b) male; or (c) poor students experienced differential impacts.
According to our heterogeneous effects analyses, however, the information and counseling
interventions have almost no positive effect among the different subgroups. In fact, the
results show that assignment to the information/counseling interventions increases dropout
rates among low-achieving students. The counseling intervention further increases dropout
rates among boys.
Low-achieving students (those who scored in the bottom 33% of the score
distribution of our baseline math exam) were also negatively impacted by the information
and counseling interventions. Not only did they not improve in terms of academic
achievement and plans to attend high school, low-achieving students in schools that
received the information and counseling interventions were 3 percentage points more likely
to drop out by the end of grade 7 (the effects are statistically significant at the 10%
level—Table 8, Panel A, Column 2).
We found similar results among boys. Boys were not affected by the information
intervention and were negatively affected by the counseling intervention. The counseling
intervention increased the rate at which boys dropped out of junior high school by 3
percentage points. The result is significant at the 5% level (Table 8, Panel B, Column 1).
The interventions do appear to slightly improve the educational outcomes of
relatively poor students. The OLS estimates of interaction effects from Table 8, Panel C
show that the information intervention may have increased the likelihood that poor students
planned to go to vocational high school by about 4 percentage points (the result is

17
statistically significant at the 10% level).8 From among all the results in this study, this
result is the only one that produced a positive effect.
When assessing the results of the impact of the information and counseling
interventions, there are two general conclusions. First, information had no significant,
positive impacts on any of the outcomes, even for subgroups of low-achieving, male and
poor students. Second, counseling increased dropouts, especially among male and
low-achieving students, and may have decreased academic achievement.
4. Exploring the Causal Chain
In this section, we look at two factors that may help explain why the information
and counseling interventions, as implemented, have negligible or even negative effects on
dropout rates, academic achievement, or plans to go to high school.
4.1 Are Students Learning Anything at School?
The first probable explanation for why students in poor, rural junior high schools do
not respond positively to information and counseling is that their gains in academic
achievement are too low. Low gains in academic achievement signal to students that the
quality of the school is low (Hanushek, 2008). If students believe the quality of schooling is
low, they are less likely to believe that more schooling will contribute to future income.
Taken together, students that experience low gains may believe that the quality of
schooling is low and may disregard interventions which tell them about the importance of
further schooling.
Low gains in academic achievement also depress student perceptions that they can
tackle future academic challenges and tasks (otherwise known as self-efficacy—Williams

18
and Williams, 2010; Hailikari et al., 2007). Students with low gains in academic
achievement may thus believe they lack the ability to learn well in the future (as opposed to
being in a school system that is of low quality). If students feel they are unable to reap
gains from additional schooling, they will not be persuaded by the information and
counseling interventions (which tell them that more schooling will increase their
income—Koivisto et al., 2011; Creager, 2011).
In fact, our data reveal that many students had zero or negative gains in academic
(math) achievement from the start to the end of grade 7 (regardless of whether they were in
treatment or control arms—Figure 3, Panel A). The average gain in academic achievement
among the 92% of students that had not dropped out was only .02 standard
deviations—surprisingly close to zero (table not shown for the sake of brevity). Students
who planned to go to the labor market, vocational school or who were undecided at the
start of grade 7 all had negative average achievement gains (Figure 3, Panel B).
Bringing these points together, one probable explanation for the lack of impact in
providing information and counseling was student disbelief: students did not believe that
additional poor quality schooling would yield increased future income.
4.2 Financial constraints
A second reason that we may not see an impact of information and counseling is
that the families of students are financially constrained. For example, about 40% of
students that stated that they planned to enter the labor market or that were undecided about
their future plans in our baseline and evaluation surveys said they made this decision
because of financial difficulties. In contrast, about 10% of the students stated that they
19
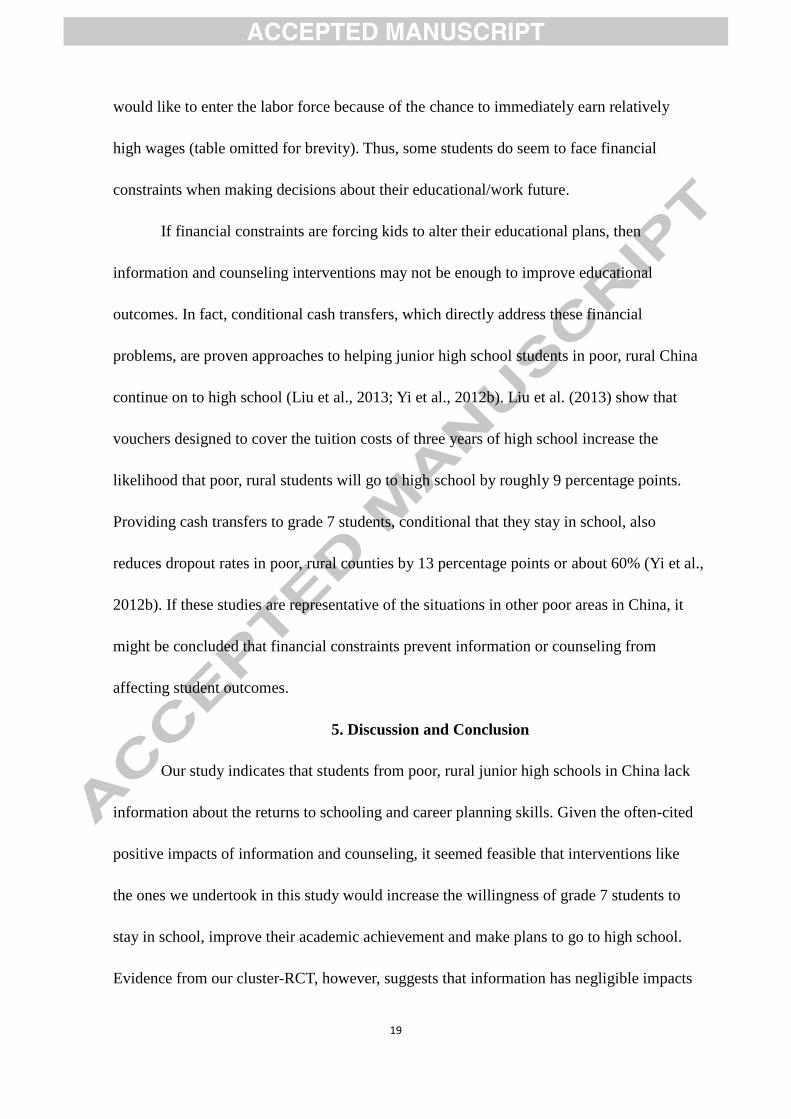
would like to enter the labor force because of the chance to immediately earn relatively
high wages (table omitted for brevity). Thus, some students do seem to face financial
constraints when making decisions about their educational/work future.
If financial constraints are forcing kids to alter their educational plans, then
information and counseling interventions may not be enough to improve educational
outcomes. In fact, conditional cash transfers, which directly address these financial
problems, are proven approaches to helping junior high school students in poor, rural China
continue on to high school (Liu et al., 2013; Yi et al., 2012b). Liu et al. (2013) show that
vouchers designed to cover the tuition costs of three years of high school increase the
likelihood that poor, rural students will go to high school by roughly 9 percentage points.
Providing cash transfers to grade 7 students, conditional that they stay in school, also
reduces dropout rates in poor, rural counties by 13 percentage points or about 60% (Yi et al.,
2012b). If these studies are representative of the situations in other poor areas in China, it
might be concluded that financial constraints prevent information or counseling from
affecting student outcomes.
5. Discussion and Conclusion
Our study indicates that students from poor, rural junior high schools in China lack
information about the returns to schooling and career planning skills. Given the often-cited
positive impacts of information and counseling, it seemed feasible that interventions like
the ones we undertook in this study would increase the willingness of grade 7 students to
stay in school, improve their academic achievement and make plans to go to high school.
Evidence from our cluster-RCT, however, suggests that information has negligible impacts

20
on student outcomes and that counseling increases dropout and may lead to lower
achievement.
There are several possible reasons why we get these results. Changing economic
conditions in China—in particular, the recent shortage of unskilled labor which has led to
higher unskilled wages—may make the provision of information and counseling less
effective than in countries not undergoing similar transitions. During an economic
transition, students may instead receive contradictory information about the differences in
wages between skilled and unskilled workers. They may thus be less likely to believe that
going to higher levels of schooling will substantially impact their long-term economic
returns, even with an information or counseling intervention.
Providing information and counseling also seems to be less important than
improving education quality. Our results indicate that students in our sample received a
relatively low-quality education during grade 7. If indeed students are really not learning
very much in their first year of junior high school, they will gradually lose their confidence
in the school system and their willingness to stay in school.
Finally, credit constraints also likely explain why poor, rural students are not
affected by the interventions. High tuition fees may have discouraged students from
attending high school, as attested by other studies that have found conditional cash
transfers increased the likelihood that students would go to high school.
Although more research is needed, our main finding suggests policymakers may
initially focus on addressing the problem of low high school attendance in poor, rural areas
by increasing the quality of education and decreasing the cost. Once sufficiently affordable

21
and quality schooling are available, it is possible that information and counseling may then
have the potential to improve student outcomes.
22
Appendix A: The Lack of Information and Career Planning Skills in China
The lack of access to good information about the returns to schooling and the
absence of career planning skills are policy-relevant concerns in China. Policymakers in
China are aiming to improve high school matriculation. Yet, youth in poor, rural areas of
China are dropping out before they even reach the stage of applying for high school (Yi
et al., 2012a).
Indeed, in poor, rural areas of China, there are at least three reasons why
misinformation and poor career planning skills must be tackled as early as grade 7 (the
first year of junior high). First, students may not apply to high schools because of
imperfect information about the net returns (the wages minus the costs) associated with
going to higher levels of schooling (Liu et al., 2009). For example, tempted by rising
wages for unskilled labor in the short-term, junior high students may decide not to
continue to high school. Unfortunately, students are not aware that the wages of
individuals with lower levels of education will on average rise more slowly over the
course of a lifetime compared to the wages of individuals with higher levels of
education (Cai, 2009). This problem is exacerbated by the fact that some companies,
short on unskilled labor, aggressively recruit junior high school students and graduates
(Yi et al., 2012a). Students might also be less likely to apply for high school if they
overestimate the cost of going to school, including the level of net tuition (the level of
tuition minus financial aid) associated with going to high school.
Second, the competitiveness of China’s education system requires students to
have career planning skills relatively early in their academic life—as early as grade 7.
Students must take a high-stakes high school entrance exam at the end of junior high
school (at the end of grade 9) to qualify for entrance into academic high school. If
students do not recognize the importance of the high school entrance exam in grade 7,
they may not be fully motivated to prepare for this exam. Similarly, students may not be
aware of additional entrance requirements for academic or vocational high schools.
However, if students make the decision to attend high school in grade 9, they may not
have enough time to make the necessary preparations.
Third, students need to have clear plans as early as grade 7 to effectively choose
among their future options, as compulsory education ends after junior high school.
Upon graduating from junior high school, students have to make a decision to follow
one of three tracks: a) pay to enter academic high school (the primary gateway to
college); b) pay to enter various types of vocational high schools (albeit at lower rates
than those for academic high schoo1 and without the need to pass an entrance exam); or
c) enter the labor market. In addition to keeping their grades sufficiently high, students
who wish to continue their education beyond junior high must plan ahead to apply for
the right type of academic or vocational school or risk attending a subpar school.
Unfortunately, poor information about returns to schooling and poor career planning
skills can impair the ability of grade 7 students to make and act on their plans. Without
sufficient planning or an adequate understanding of how to choose and matriculate a
particular high school, students in poor rural areas may ultimately opt for the most
readily available option: entering the labor market.
23
Appendix B: Lesson content in the counseling intervention
As mentioned in Section 2 (under ―Interventions‖), the counseling intervention
consisted of four 45-minute lessons. The first lesson invited students to learn about (a.)
the general meaning of work, (b.) how occupations and wages would change and grow
in China’s rapidly transitioning economy, (c.) how higher wage occupations would
require relatively higher skills and corresponding levels of education, (d.) the factors
behind successful careers, (e.) the importance of finding relevant information when
making career choices, as well as (f.) the social values that students might pay attention
to when choosing a career.
The second lesson focused on identifying students’ career interests by asking
them to first participate in and discuss the results of the Holland Interest Inventory
self-assessment exercise. This is a widely used self-assessment tool in career counseling
which helps individuals think about their interests, personalities, and skills and how
these fit with certain occupational themes or categories (see Holland, 1985). We thank
Professor Junqi Shi at the Psychology Department in Peking University for providing us
with the Chinese version of the Holland Interest Inventory. The second lesson then
further discussed (a.) the importance of being conscious of one’s interests and abilities
when choosing occupations and planning a career, (b.) basic information about
industries and occupations in China and the relative wages across industries, (c.) the
types of information that one should inquire about when choosing a job, and (d.)
avenues students could use to find more information about occupations and careers.
Finally, the lesson also asked students to think about and discuss the educational and
skill requirements of their ideal occupation.
The third lesson was identical to the information intervention described in
Section 2 (under ―Interventions‖) above.
The fourth lesson covered the types of choices that students could make after
junior high, how to transition from junior high to vocational or academic high school,
the financial aid options available in vocational and academic high school, the financial
aid options available in college, and how to make personal plans to attend higher levels
of schooling given the above information.

24
Appendix C: Sensitivity to Missing Data
How sensitive were the results in Section 3 to missing data? Table 2, Panel A
first shows that the balance in baseline covariates is maintained fairly well between each
treatment arm and the control arm for the 8% of students who dropped out of school by
the time of the evaluation survey. Looking at the baseline covariates of these ―missing
cases‖ only (row 1), we see that there is no obvious imbalance between the counseling
and control arms. We do find some imbalance between the information and control arms
in that students in the information arm are more likely to have mothers and fathers who
are migrating (row 3, column 9 and 10) as well as mothers and fathers who are in better
health (row 3, columns 11 and 12). Again the average difference between the
information and control arms is rather small in these four variables.
Table 2, Panel B shows that the balance in baseline covariates is maintained
fairly well between each treatment arm and the control arm for the 92% of students who
remained in school at the time of the evaluation survey. We do find some imbalance (at
the 5% statistical significance level) between the information and control arms in the
female and father's education level covariates, but again the difference is quite small.
The impact evaluation analyses in Section 4 were conducted without making any
missing data adjustments. This was a ―listwise deletion‖ approach which is only viable
under the missing completely at random assumption (Schafer and Graham, 2002). It is
possible, however, that the students we could not find are missing non-randomly
because of certain factors that simultaneously affect the treatment assignments and the
student outcomes. We therefore test the robustness of our results after imputing the
missing data using multiple imputation (see Schafer and Graham, 2002). In the end, we
find that our results our substantively the same even after conducting analyses using
multiple imputation (results not shown).

25
References
Angrist, J. D. and V. Lavy. 2009. ―The Effect of High-Stakes High School Achievement
Awards: Evidence from a Group-Randomized Trial." American Economic Review 99 (4):
1384–1414.
Bandura, A. 1977. ―Self-efficacy: Toward a unifying theory of behavioral change.‖
Psychological Review (84): 191–215.
Banerjee, A., S. Jacob, M. Kremer, J. Lanjouw and P. Lanjouw. 2000. ―Promoting
School Participation in Rural Rajasthan: Results from Some Prospective Trials.‖ mimeo,
MIT.
Cai, F. 2009. Wage gap between Chinese college grads, migrants dropping.
http://english.peopledaily.com.cn/90001/90776/90882/7207145.html
Castleman, B.L., Arnold, K. and K.L. Wartman. 2012. ―Stemming the Tide of Summer
Melt: An Experimental Study of the Effects of Post-High School Summer Intervention
on Low-Income Students’ College Enrollment.‖ Journal of Research on Educational
Effectiveness 5 (1): 1-17.
Clarke, M., W. Haney, and G. Madaus. 2000. ―High Stakes Testing and High School
Completion.‖ National Board on Educational Testing and Public Policy 1 (3).
Creager, M.. ―Practice and Research in Career Counseling and Development-2010.‖ The
Career Development Quarterly 59 (6): 482-527
Ge, S.Q. and D.T. Yang. 2012. Changes in China’s Wage Structure. Mimeo.
Glewwe, P. and M. Kremer. 2006. ―Schools, Teachers, and Education Outcomes in
Developing Countries.‖ In E.A. Hanushek and F. Welch, eds. Handbook of the
Economics of Education. Amsterdam: North Holland, 943-1017.
Hackett, G., and N.E. Betz. 1989. ―An exploration of the mathematics
self-efficacy/mathematics performance correspondence.‖ Journal for Research in
Mathematics Education 20: 261–273.
Hailikari, T., Nevgi, A., and E. Komulainen. 2007. ―Academic self-beliefs and prior
knowledge as predictors of student achievement in mathematics: A structural model.‖
Educational Psychology 28: 59–71.
Holland, J. L. 1985. Making vocational choices: A theory of vocational personalities
and work environments (2nd ed.). Englewood Cliff, NJ: Prentice-Hall.
26
Imai, K., King, G. and C. Nall. 2009. ―The essential role of pair matching in
cluster-randomized experiments, with application to the Mexican universal health
insurance evaluation.‖ Statistical Science 24: 29–53.
Jensen, R. 2010. ―The perceived returns to education and the demand for schooling.‖
Quarterly Journal of Economics, 125 (2): 515-548.
Koivisto, P., Vinokur, A.D. and J. Vuori. 2011. ―Effects of career choice intervention on
components of career preparation.‖ Career Development Quarterly 59(4).
Kolen, M. J., and R. L. Brennan. 2004. Test equating, scaling, and linking: Methods and
practices (2nd ed.). New York, NY: Springer.
Liu, C.F., Zhang, L.X., Luo, R.F., Rozelle, S., Sharbono, B. 2009. Development
Challenges, Tuition Barriers and High School Education in China. REAP Working
Paper.
Liu, C.F., Yi, H.M., Luo, R.F., Bai, Y.L., Zhang, L.X., Shi, Y.J., Wang, H., Chu, J.,
Rozelle, S. 2013. The Effect of Early Commitment of Financial Aid on Matriculation to
Senior High School among Poor Junior High Students in Rural China. REAP Working
Paper #254.
Manski, C.F., ―Adolescent Econometricians: How Do Youth Infer the Returns to
Education?‖ in Studies of Supply and Demand in Higher Education, Charles T.
Clotfelter and Michael Rothschild, eds. (Chicago: University of Chicago Press, 1993).
McDonough, P. M. 2004. The school to college transition: Challenges and prospects.
Washington, DC: American Council on Education.
McSwain, C., and Davis, R. 2007. College access for the working poor: Overcoming
burdens to succeed in higher education. Washington, DC: Institute for Higher Education
Policy.
National Bureau of Statistics. 2007. Household Income and Expenditure Survey. Beijing:
China National Bureau of Statistics.
Nguyen, T. 2008. ―Information, Role Models and Perceived Returns to Education:
Experimental Evidence from Madagascar,‖ MIT Working Paper.
Parsons, F. 1909. Choosing a vocation. Boston, MA: Houghton-Mifflin.
Perkins, D.H., and T.G. Rawski. 2008. "Forecasting China's Economic Growth to 2025,"
in Loren Brandt and Thomas G. Rawski, eds., China’s Great Economic Transformation.
Cambridge and New York: Cambridge University Press.

27
Savickas, M. L. 1999. ―The psychology of interests.‖ In M. L. Savickas and A. R.
Spokane (Eds.), Meaning, measurement, and counseling use of vocational interests (pp.
19–56). Palo Alto, CA: Consulting Psychologist Press.
Schafer, J.L. & Graham, J.W. 2002. ―Missing data: Our view of the state of the art.‖
Psychological Methods 7(2), 147–177.
Slate, J. R., and C. H. Jones. 2005. ―Effects of school size: A review of the literature
with recommendations.‖ Essays in Education.
The State Council Leading Group Office of Poverty Alleviation and Development
(China). 2010. Presentation on Rural Poverty Reduction in China, 2010.09.16.
Turner, S., and R.T. Lapan. 2002. ―Career self-efficacy and perceptions of parent
support in adolescent career development.‖ The Career Development Quarterly 51:
44-55.
Valentine, J., Hirschy, A.S., Bremer, C.D., Novillo, W., Castellano, M., and A. Banister.
2009. ―Systematic Reviews of Research: Postsecondary Transitions - Identifying
Effective Models and Practices.‖ National Research Center for Career and Technical
Education.
Vargas, J. H. 2004. College knowledge: Addressing information barriers to college:
Retrieved on February 29, 2008, from http://www.teri.org/pdf/researchstudies/
CollegeKnowledge.pdf.
Whiston, S. C., Sexton, T. L., and D. L. Lasoff. 1998. ―Career intervention outcome: A
replication and extension of Oliver and Spokane (1988).‖ Journal of Counseling
Psychology 45: 150-165,
Whiston, S. C. 2003. ―Career counselling: 90 years old yet still healthy and vital.‖ The
Career Development Quarterly 52: 35-42.
Williams, T. and K. Williams. 2010. ―Self-Efficacy and Performance in Mathematics:
Reciprocal Determinism in 33 Nations.‖ Journal of Educational Psychology 102 (2):
453–466.
Xu, B. and Wei L. 2008. ―Trade, Technology, and China’s Rising Skill Demand.‖
Economics of Transition 16 (1): 59-84.
Yi, H., Zhang, L., Luo, R., Shi, Y., Mo, D., Chen, X., Brinton, C., Rozelle, S. 2012a.
Dropping out: Why are students leaving junior high in China's poor rural areas?.
International Journal of Educational Development 32 (4): 555-563.

28
Yi, H.M., Song Y.Q., Liu, C.F., Huang, X.T., Zhang, L.X., Bai, Y.L., Shi, Y.J., Yang C.,
Wang, H., Loyalka, P., Chu, J., Rozelle, S. 2012b. Giving kids a head start: The impact
of early commitment of financial aid on poor seventh grade students in rural China.
REAP Working Paper #247.
Zhang X.B., Yang J., and S.L. Wang. 2011. China has reached the Lewis turning point.
China Economic Review 22 (4): 542-554.
Zimmerman, B. J., Bandura, A., and M. Martinez-Pons. 1992. ―Self-motivation for
academic attainment: The role of self-efficacy beliefs and personal goal setting.‖
American Educational Research Journal 29: 663–676.

29
Acknowledgements:
The authors wish to provide special thanks to the International Initiative for Impact
Evaluation (3ie) for the financial support for this study (grant number OW2.208).
Endnotes: 1 We chose to rank and block schools by the number of students in grade 7 as school size has frequently
been found to be associated with our outcomes of interest (student dropout, academic achievement, and
plans to go to high school at the end of grade 7) (Slate and Jones, 2005). One of the 22 blocks had 5
(instead of 6) schools. 2 The higher percentage of male students in the information arm in Table 1 may slightly bias our later
experimental estimates. For example, male students are more likely than female students to dropout. It
could be that the information intervention prevented the average student from dropping out, but because
of the imbalance in the proportion of male students between information and control arms, the
experimental estimates would show that there is no effect. Similarly, female students are more likely (in
the absence of any intervention) to plan to go to high school and academic high school. The estimates
from our analyses may show that the information intervention does not affect plans to go to high school or
academic high school (because of the larger percentage of male students compared to the percentage of
male students in the control arm), when in fact the information intervention does affect these plans. 3 Average wages were estimated using the 2005 1% sample census. We provided students with
information on the combined (average) wage levels of academic and vocational high school graduates. 4 Specifically, the lesson included costs for tuition and room and board for different types of high schools
(provincial-level academic high school; city-level academic high school; regular high school; and
vocational high school). The lessons also included information on the cost of tuition and room and board
for various types of colleges (three year vocational colleges and four-year universities) and for different
major categories (―popular‖, ―regular‖ and ―arts‖ majors) which tend to vary substantially in tuition. 5 Our training and lesson logs show that trainers and teachers did, in fact, give the program interventions
(both information and counseling) according to our schedule. 6 We also could have targeted the intervention at parents, However, students in our sample report that
parents play less of a role in making the decision to go to high school. Specifically, among students who
planned to enter either academic or vocational high school, roughly 60% indicated they would make the
decision on their own. Only 35% said their parents would make the decision. Among the students who
planned to go into the labor market, almost three quarters (74%) said they would make this decision
themselves. Less than 25% of the students said that their parents would make the decision. Interestingly,
teachers (and others—e.g., friends or relatives), at least in the minds of students, have little impact on the
decision to continue with schooling after grade 9. If, as these results indicate, most students in poor, rural
areas are indeed the primary decision-makers when it comes to future schooling, targeting information
and counseling at them is indeed appropriate. We also looked at whether there were heterogeneous effects
on students who reported that they made the plan themselves versus students who listened to their parents
or others. However, we did not find any heterogeneous impacts of information or counseling on students
who claimed to make the plans themselves (results not shown). 7 The tuition cost for vocational high schools in Hebei is 3,300 yuan/year (maximum). Dorm fees are at
most 1,200 yuan/year. Furthermore, most vocational high school students receive 1,500 yuan/year in
financial aid for the first two years. Students from poor, rural areas may receive even higher amounts. 8 For the sake of completeness, we also examined whether the interventions impacted outcomes for
students who (1) underestimate the wages to attending vocational high school versus directly entering the
labor market and (2) overestimate tuition prices for vocational high school. In both cases, the
heterogeneous effect estimates were both small in magnitude and not statistically significant at the 5%
level (table omitted for the sake of brevity).
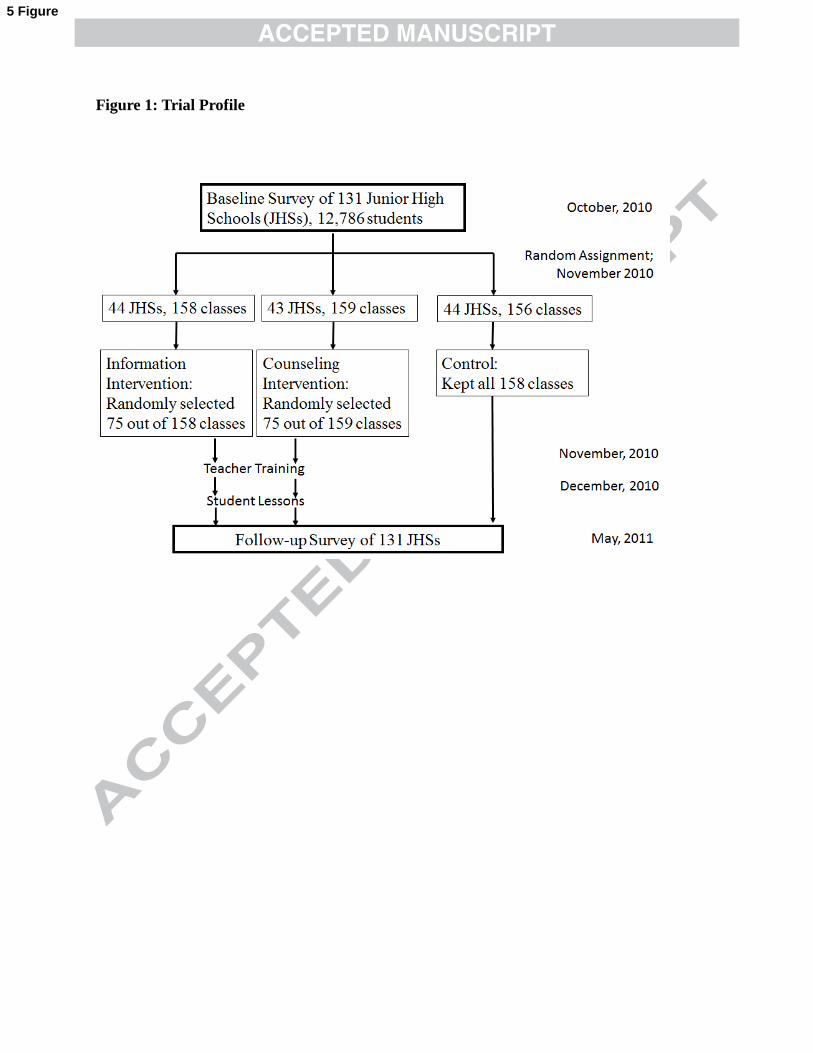
Figure 1: Trial Profile
5 Figure

Figure 2: Student perceptions of how much it costs to attend vocational high school
0
5,000
10,000
15,000
20,000
25,000
30,000
yu
an
/mo
nth
Control Group Information Counseling
By Treatment Arm, Using Baseline Data
Perceived Cost to Vocational HS
5 Figure
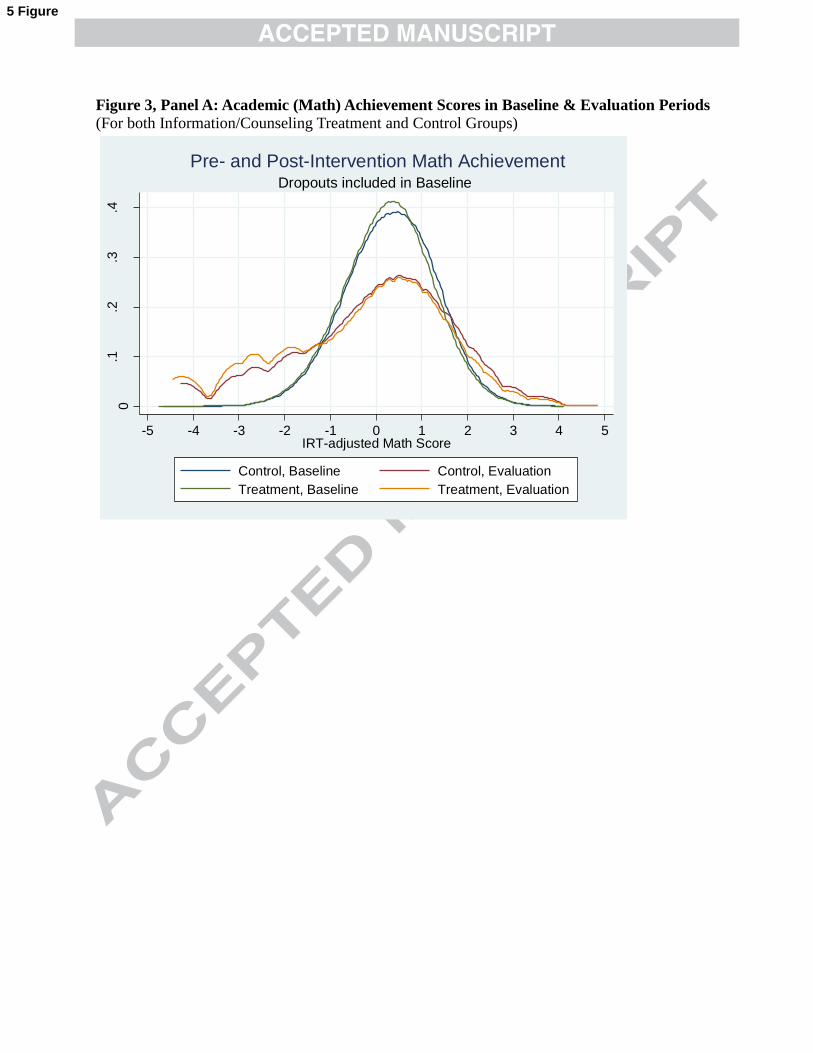
Figure 3, Panel A: Academic (Math) Achievement Scores in Baseline & Evaluation Periods
(For both Information/Counseling Treatment and Control Groups)
0.1
.2.3
.4
-5 -4 -3 -2 -1 0 1 2 3 4 5IRT-adjusted Math Score
Control, Baseline Control, Evaluation
Treatment, Baseline Treatment, Evaluation
Dropouts included in Baseline
Pre- and Post-Intervention Math Achievement
5 Figure

Figure 3, Panel B: Academic (Math) Achievement Gains in Grade 7 for Students with
Different Expected Plans in the Baseline Survey
-.12
-.09
.04
-.03
-.15
-.1
-.05
0
.05
labor market voc. HS acad. HS undecided
(IRT-scaled z-scores)
By Students' Expected Plans at the Start of Grade 7
Mean Math Achievement Gains
5 Figure

Table 1: Covariate Pre-Balance Test between Experimental Arms (1) (2) (3) (4) (5) (6) (7) (8) (9) (10) (11) (12)
female age math
2010
go acad. HS go voc.
HS
mom's edu dad's edu #sibs mom
migrated
dad
migrated
mom's
health
dad's
health
Counseling -0.01 0.04 -0.10 -0.03 0.02 -0.06 -0.06 0.06 0.02 0.02 0.01 0.00
(0.01) (0.07) (0.08) (0.03) (0.01) (0.21) (0.13) (0.05) (0.02) (0.02) (0.03) (0.03)
Information -0.04*** -0.04 -0.02 0.01 -0.02 0.04 0.22 0.07* 0.01 0.02 0.03 0.04
(0.01) (0.07) (0.07) (0.03) (0.01) (0.18) (0.14) (0.04) (0.02) (0.02) (0.03) (0.03)
Constant 0.53*** 13.30*** -0.14 0.57*** 0.08*** 4.96*** 7.40*** 1.11*** 0.69*** 0.91*** 0.36*** 0.47***
(0.05) (0.19) (0.19) (0.06) (0.02) (0.42) (0.20) (0.07) (0.05) (0.02) (0.02) (0.05)
Observations 12,704 12,714 12,790 12,769 12,769 12,382 12,080 12,794 12,493 12,637 12,512 12,653
R-squared 0.003 0.026 0.036 0.022 0.015 0.059 0.013 0.023 0.133 0.063 0.027 0.016
Cluster-robust standard errors in parentheses
*** p<0.01, ** p<0.05, * p<0.1
4 Table

Table 2, Panel A: Balance between Treatment and Control Arms for the Missing Cases (1) (2) (3) (4) (5) (6) (7) (8) (9) (10) (11) (12)
female age math 2010 go acad. HS go voc. HS mom's edu dad's edu # sibs mom
migrated
dad
migrated
mom's
health
dad's
health
Counseling -0.05 0.04 -0.03 -0.04 0.04 0.21 -0.04 0.10 0.01 0.04 0.04 -0.01
(0.04) (0.09) (0.09) (0.04) (0.03) (0.21) (0.20) (0.07) (0.03) (0.03) (0.04) (0.04)
Information -0.05 -0.02 -0.03 0.04 -0.03 -0.01 0.26 0.08 0.07** 0.06** 0.12*** 0.08*
(0.05) (0.10) (0.10) (0.04) (0.04) (0.25) (0.28) (0.07) (0.03) (0.03) (0.05) (0.04)
Observations 1,353 1,358 1,364 1,365 1,365 1,288 1,276 1,369 1,305 1,341 1,310 1,344
R-squared 0.023 0.089 0.044 0.040 0.031 0.094 0.022 0.027 0.162 0.074 0.059 0.032
Cluster-robust standard errors in parentheses
***p<0.01, ** p<0.05, * p<0.1
Table 2, Panel B: Balance between Treatment and Control Arms for the Non-Missing Cases (1) (2) (3) (4) (5) (6) (7) (8) (9) (10) (11) (12)
female age math 2010 go acad. HS go voc. HS mom's edu dad's edu # sibs mom
migrated
dad
migrated
mom's
health
dad's
health
Counseling 0.00 0.02 -0.10 -0.02 0.01 -0.09 -0.06 0.06 0.02 0.01 0.01 0.00
(0.01) (0.07) (0.08) (0.03) (0.01) (0.22) (0.14) (0.05) (0.02) (0.02) (0.03) (0.03)
Information -0.04*** -0.04 -0.02 0.01 -0.02 0.05 0.21 0.07* 0.01 0.02 0.02 0.03
(0.01) (0.07) (0.07) (0.03) (0.01) (0.19) (0.14) (0.04) (0.02) (0.02) (0.03) (0.03)
Observations 11,351 11,356 11,426 11,404 11,404 11,094 10,804 11,425 11,188 11,296 11,202 11,309
R-squared 0.004 0.024 0.036 0.019 0.016 0.057 0.014 0.024 0.132 0.063 0.025 0.016
Cluster-robust standard errors in parentheses
***p<0.01, ** p<0.05, * p<0.1
4 Table

Table 3: Feedback from Students that Participated in the Information and Counseling Lessons (% yes)
Feedback Form Item Information,
Single Lesson
Counseling,
Lesson 1
Counseling,
Lesson 2
Counseling,
Lesson 3
Counseling,
Lesson 4
The lesson was very useful. 80% 82% 81% 82% 81%
I will study harder and stay in school as a result of the lesson 88% 87% 86% 86% 86%
I will share the content of the lesson with my parents. 75% 67% 65% 66% 67%
My parents will find the contents of the lesson useful. 74% 63% 62% 66% 66%
The lesson was presented clearly. 80% 75% 76% 78% 78%
The class discussion about the lesson was helpful. 82% 87% 82% 83% 83%
The duration of the lesson was appropriate. 92% 89% 90% 92% 90%
4 Table

Table 4: Monthly wages that entering grade 7 students perceive they would earn from
graduating from different levels of schooling (at different percentiles of the reported wage
distributions)
percentile Junior
HS
vocational HS academic HS university
10% 500 800 1000 1300
25% 800 1000 1200 2000
50% 1000 1500 2000 3000
75% 1500 2000 3000 5000
90% 2000 3000 5000 10000
95% 3000 4000 6000 13000
4 Table

Table 5: Changes in the % of students planning to go to high school or not
Plans (or dropped out) at the end of grade 7
work voc. HS acad.
HS
undecided dropped
out
% of total
(start of
grade 7)
Plans
at the
start of
grade 7
work 27% 15% 10% 21% 26% 5%
voc. HS 6% 41% 20% 20% 13% 14%
acad. HS 3% 8% 73% 13% 3% 52%
undecided 7% 15% 25% 41% 11% 29%
% of total (end
of grade 7)
6% 15% 49% 23% 8% 100%
4 Table
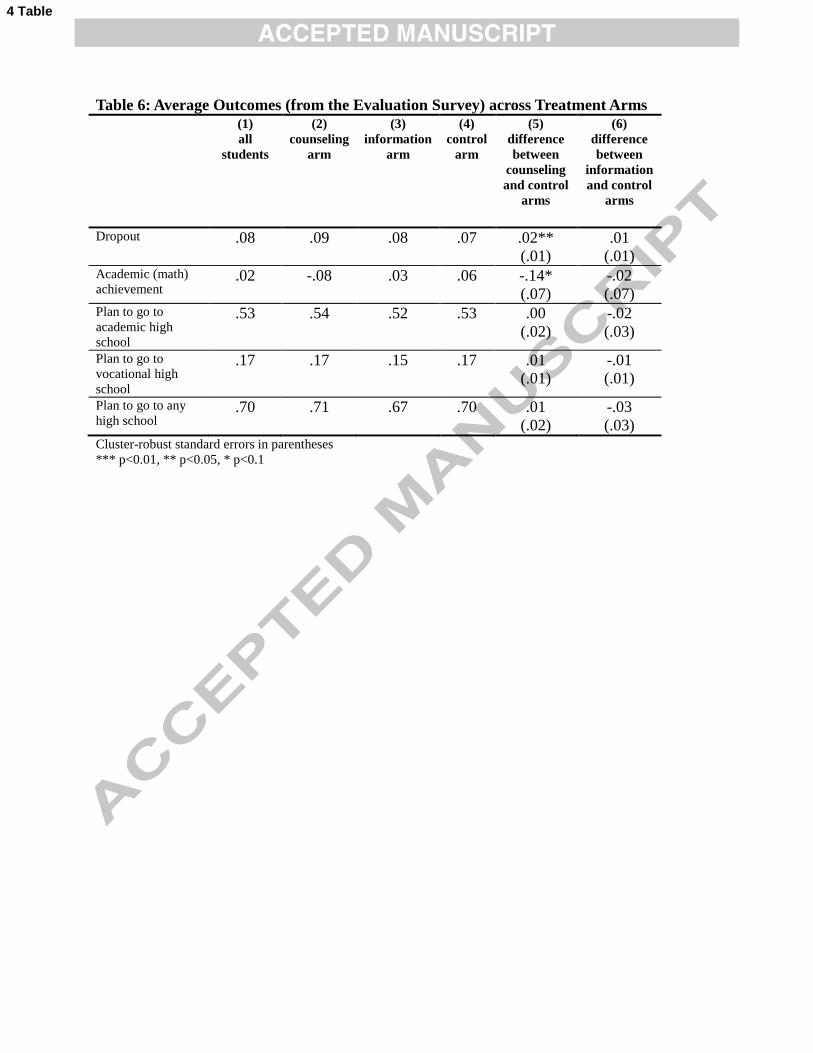
Table 6: Average Outcomes (from the Evaluation Survey) across Treatment Arms
(1)
all
students
(2)
counseling
arm
(3)
information
arm
(4)
control
arm
(5)
difference
between
counseling
and control
arms
(6)
difference
between
information
and control
arms
Dropout .08
.09
.08
.07
.02**
(.01)
.01
(.01) Academic (math)
achievement .02
-.08
.03
.06
-.14*
(.07)
-.02
(.07) Plan to go to
academic high
school
.53
.54
.52
.53
.00
(.02)
-.02
(.03)
Plan to go to
vocational high
school
.17
.17
.15
.17
.01
(.01)
-.01
(.01)
Plan to go to any
high school .70
.71
.67
.70
.01
(.02)
-.03
(.03) Cluster-robust standard errors in parentheses
*** p<0.01, ** p<0.05, * p<0.1
4 Table

Table 7: Effects of Information and Counseling on Main Student Outcomes
(Dropout (y/n), Math Scores, Will Attend Academic, Vocational, or Any High School (y/n)) dropout math 2011 go to acad. HS go to voc. HS go to any HS
(1) (2) (3) (4) (5) (6) (7) (8) (9) (10)
unadj adj unadj adj unadj adj unadj adj unadj adj
Counseling .019** .017** -.137* -.073 .003 .020 .007 .001 .010 .021
26.8% 25.8% -- -- 0.6% 3.8% 4.1% 0.4% 1.4% 3.0%
(.011) (.007) (.073) (.046) (.025) (.017) (.014) (.012) (.022) (.017)
Information .011 .011 -.014 -.005 -.016 -.014 -.014 -.011 -.031 -.025
15.4% 16.2% -- -- -3.1% -2.6% -8.6% -6.5% -4.4% -3.5%
(.011) (.009) (.057) (.046) (.028) (.021) (.012) (.011) (.027) (.022)
Observations 12,786 11,633 11,426 10,451 11,414 10,439 11,414 10,439 11,414 10,439
R-squared .012 .083 .043 .354 .024 .292 .014 .140 .015 .167
Cluster robust standard errors in parentheses
*** p<0.01, ** p<0.05, * p<0.1
Notes:
1) First row estimates are marginal effects estimates; second row estimates are relative effects estimates (for the dichotomous
outcomes); third row (in parentheses) are standard errors of the marginal effects estimates.
2) Columns 2, 4, 6, 8, and 10 are adjusted for the following controls: female, age, baseline math score, baseline plans to go to
high school, asset value, mother and father’s education levels, number of siblings, mother and father migrated (yes/no), mother
and father’s health (poor or not). The coefficient estimates for the controls are not presented for the sake of brevity and are
available from the authors upon request.
3) All estimates include “block” fixed effects.
4 Table

Table 8, Panel A: Heterogeneous Effects of Info and Counseling (By Baseline Math Scores)
(math33 = 33% of the lowest scoring students on the baseline math exam)
(1) (2) (3) (4) (5)
dropout math 2011 go any HS go acad. HS go voc. HS
Counseling .010 -.119* .013 .012 .001
(.007) (.064) (.017) (.019) (.011)
Math33 .020** -.854*** -.104*** -.152*** .047***
(.010) (.045) (.014) (.017) (.016)
Counseling*math33 .027* .061 .017 .013 .004
(.015) (.081) (.023) (.027) (.022)
Information .001 -.047 -.030 -.017 -.012
(.007) (.057) (.024) (.024) (.011)
Information*math33 .033* .083 .011 .002 .009
(.018) (.071) (.027) (.027) (.023)
Observations 11,641 10,451 10,441 10,441 10,441
R-squared .081 .264 .165 .285 .137
Cluster robust standard errors in parentheses
*** p<0.01, ** p<0.05, * p<0.1
Analyses adjusted for covariates (same covariates as Table 7)
4 Table
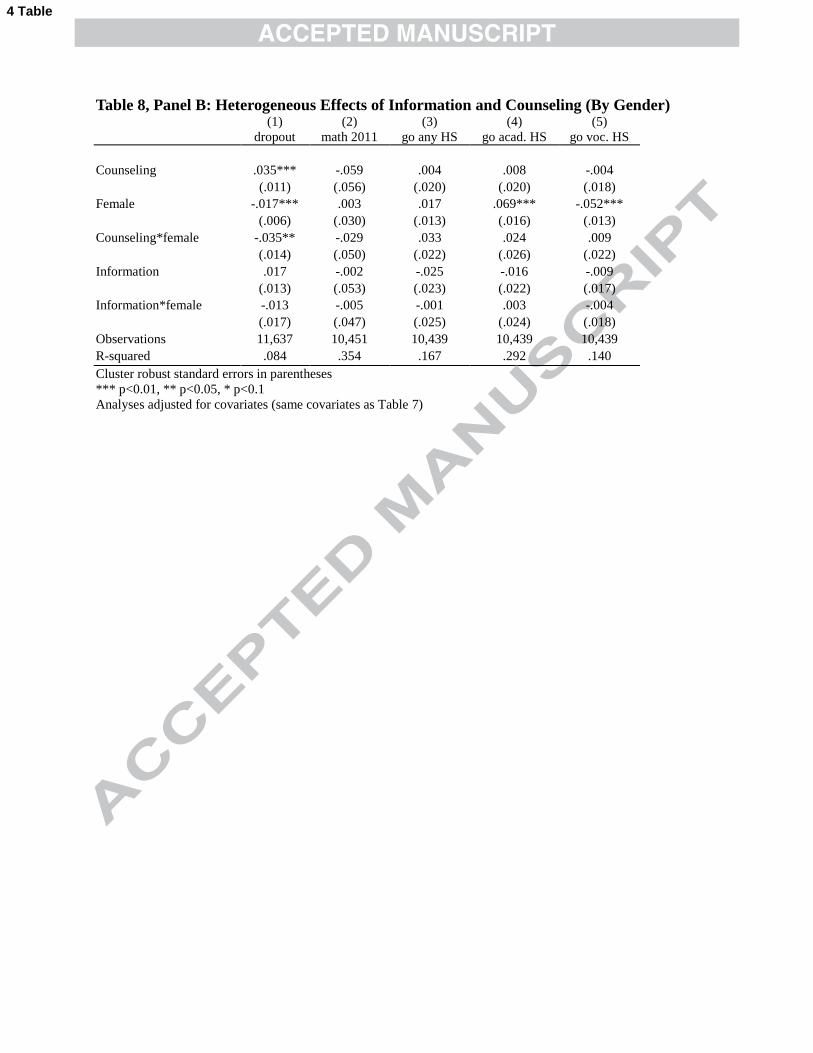
Table 8, Panel B: Heterogeneous Effects of Information and Counseling (By Gender) (1) (2) (3) (4) (5)
dropout math 2011 go any HS go acad. HS go voc. HS
Counseling .035*** -.059 .004 .008 -.004
(.011) (.056) (.020) (.020) (.018)
Female -.017*** .003 .017 .069*** -.052***
(.006) (.030) (.013) (.016) (.013)
Counseling*female -.035** -.029 .033 .024 .009
(.014) (.050) (.022) (.026) (.022)
Information .017 -.002 -.025 -.016 -.009
(.013) (.053) (.023) (.022) (.017)
Information*female -.013 -.005 -.001 .003 -.004
(.017) (.047) (.025) (.024) (.018)
Observations 11,637 10,451 10,439 10,439 10,439
R-squared .084 .354 .167 .292 .140
Cluster robust standard errors in parentheses
*** p<0.01, ** p<0.05, * p<0.1
Analyses adjusted for covariates (same covariates as Table 7)
4 Table

Table 8, Panel C: Heterogeneous Effects of Info and Counseling (by Poverty Level)
(According to our Household Assets Poverty Indicator, Poor33 = Poorest 33% Students in the
Sample) (1) (2) (3) (4) (5)
dropout math 2011 go any HS go acad. HS go voc. HS
Counseling .022*** -.100** .016 .024 -.008
(.008) (.049) (.017) (.017) (.014)
Poor33 -.011 .041 -.003 .018 -.021*
(.008) (.028) (.018) (.019) (.012)
Counseling*poor33 -.018 .011 .019 -.015 .034
(.012) (.054) (.026) (.030) (.023)
Information .008 -.034 -.033 -.013 -.020
(.009) (.049) (.022) (.021) (.012)
Information*poor33 .010 -.009 .034 -.003 .038*
(.016) (.055) (.028) (.029) (.019)
Observations 11,637 10,451 10,439 10,439 10,439
R-squared .084 .354 .167 .292 .140
Cluster-robust standard errors in parentheses
*** p<0.01, ** p<0.05, * p<0.1
Analyses adjusted for covariates (same covariates as Table 7)
4 Table
Highlights
•Grade 7 students in poor areas in China lack information and career planning skills.
• We conduct an RCT to see the impact of information and counseling on student outcomes.
•Providing information does not increase educational attainment or achievement.
•Counseling increases dropouts and perhaps reduces achievement.
•Poor school quality and financial constraints may be responsible for no positive impacts.