Embed Size (px)
Citation preview

Can Higher Prices Stimulate Product Use?Evidence from a Field Experiment in Zambia
Nava AshrafHarvard Business School
James BerryMassachusetts Institute of Technology
Jesse M. Shapiro∗
University of Chicago and NBER
October 30, 2006
Abstract
The pricing of health products in the developing world has become a center of controversy amongpolicymakers, with important implications for the efficient targeting of social programs moregenerally. A key issue in this debate is whether higher purchase prices lead to more intensiveproduct use and, therefore, greater health benefits. We present results from an experiment inLusaka, Zambia, designed to test whether charging more for a home water purification solutionresults in more use of the product. Our methodology separates the screening effect of prices(charging more changes the mix of buyers) from the causal effect of prices (charging morestimulates greater use for a given buyer). We find that higher prices screen out less intensiveusers of the product. High prices do not cause greater product use than low prices for a givenbuyer, but there is some evidence that the act of paying increases use. Our estimates imply thatpositive prices may be optimal even if maximizing use is the sole objective.
JEL classification: C93, D12, L11, L31
Keywords: chlorination, water-borne diseases, sunk cost effect, non-profit strategy, social marketing
∗We are grateful to Gary Becker, Erik Eyster, Matthew Gentzkow, Emir Kamenica, Larry Katz, Michael Kremer,Steve Levitt, John List, Kevin M. Murphy, Sharon Oster, Andrei Shleifer, Richard Thaler, and seminar participantsat the Harvard Business School and the University of Chicago for helpful comments and Rob Quick at the Centersfor Disease Control for his guidance on the technical aspects of water testing and treatment. We wish to thankSteve Chapman, Research Director of Population Services International D.C., for his support, and the Society forFamily Health in Zambia for coordinating the fieldwork, particularly Richard Harrison and T. Kusanthan, as well asCynde Robinson, Esnea Mlewa, Muza Mupotola, Nicholas Shiliya, Brian McKenna, and Sheena Carey de Beauvoir.We gratefully acknowledge financial support from the Division of Faculty Research and Development at HarvardBusiness School. E-mail: [email protected], [email protected], [email protected].
1

1 Introduction
Economic approaches to the targeting of social programs emphasize schemes that make participation
attractive to those with genuine need, and costly to others, so that individual choices endogenously
generate an efficient allocation of social goods and services (Diamond and Mirrlees, 1978). Policy
tools for achieving such favorable selection include eligibility criteria (Diamond and Mirrlees, 1978;
Parsons, 1991), in-kind transfers (Nichols and Zeckhauser, 1982; Dye and Antle, 1986; Blackorby
and Donaldson, 1988), and explicit pricing of public services (Vickrey, 1963; Oster, Gray, and
Weinberg, 2003). In all of these cases, the optimal policy balances the value of the program to
deserving individuals against the waste associated with distribution to those not genuinely in need.
This tension has become central to a controversy over the practice of charging money for the
purchase of life-saving health products in the developing world. Critics of pricing argue that
“charging people for basic health care...[is] unfair” (Benn, 2006), and that fees ensure that goods
only reach “the richest of the poor” (McNeil, 2005). Advocates of pricing counter that “when
products are given away free, the recipient often does not value them or even use them” (PSI,
2006).
Indeed, it is possible that charging more for a product will lead to greater or more intensive use.
Such a pattern could arise for two reasons. First, consistent with the economic theory of program
targeting, higher prices could screen out those who do not plan to use the product intensively,
resulting in greater use per buyer (Oster, 1995). Second, following psychological evidence on the
sunk cost effect (Thaler, 1980), paying more for something may actually encourage subsequent
use, which could, in principle, increase total use in the population. Since use is an essential
prerequisite to reaping the benefits of most health-promoting products, these hypotheses have
important implications for health policy, and for understanding the role of pricing in the nonprofit
and public sectors more generally.
Despite the importance of pricing strategy in these contexts, there has been surprisingly little
systematic evidence on the role of prices in encouraging or discouraging product use. In this paper,
we report the results of a field experiment in Lusaka, Zambia designed to test for the effect of
pricing on the use of Clorin, an inexpensive, socially marketed disinfectant. Clorin is used to kill
pathogens in household drinking water, and thus reduce the incidence of water-borne illnesses that
2

can be especially dangerous to young children (Quick et al, 2002). We conducted door-to-door sales
of Clorin, offering one bottle for a one-time-only, randomly chosen offer price to 1, 004 households.
Households that agreed to purchase at the offer price received a randomly chosen discount, thus
allowing us to vary the transaction price separately from the offer price. After the marketing
intervention, we conducted a follow-up survey, in which we asked about Clorin use, and measured
the chemical presence of Clorin in the household’s stored water.
This two-stage pricing design allows us to separately estimate the different effects of prices on
the intensity of product use. By varying the offer price for a given transaction price, we can estimate
the effect of changes in the offer price on the mix of buyers for the product, or what we will call the
screening effect of prices. By varying the transaction price for a given offer price, we are able to
identify the effect of changes in the transaction price on a given household’s propensity to use the
product, or what we will call the causal effect of prices. Because we included in our randomization
design a significant number of households that did not pay anything, our data allow us to further
separate this causal effect into an effect of the amount paid, and an effect of the act of paying.
We find strong evidence that higher prices screen out less intensive users of the product. For a
given transaction price, increasing the offer price by 10 percent results in a 3.6 percent increase in
reported use among buyers in a follow-up survey. Similar patterns are present when we measure
use by testing chemically for the presence of the product in the household’s drinking water. These
screening effects are present even when we condition on baseline demographics and Clorin use,
indicating that the ability to target delivery based on observables would not eliminate the usefulness
of prices as a screening tool. Moreover, raising the offer price does not increase the wealth of the
average buyer, indicating that, in this context, higher prices do not deliver the product only to the
“richest of the poor.” However, we also find that higher prices do not help target delivery of Clorin
to families with small children, who derive the greatest health benefits from clean water.
Turning to the causal effect of prices, we find no evidence that paying more for Clorin results in
greater use of the product. This finding contrasts with previous evidence on the sunk cost effect, and
arises despite the fact that the households in our sample display sunk cost effects in hypothetical
choices. Our estimates are precise enough to rule out interesting magnitudes, indicating that this
finding does not merely result from a lack of statistical power.
3
We do, however, find some evidence that the act of paying itself induces households to use Clorin
more. While this effect is not robust statistically, it is stronger among households that report that
they value something more if they pay for it, and among households displaying the sunk-cost effect
in hypothetical choices.1 Our findings are therefore consistent with a psychological link between
household’s use of a product and the act of paying, but show no evidence of such a link with the
amount paid.
Evidence from a second, longer-term follow-up survey confirms that charging a positive trans-
action price may affect product use, although greater survey attrition than in the initial follow-up
(and some evidence of selective attrition) means that this finding must be taken with caution. We
find no evidence of screening effects in the longer-term follow-up data, which may imply that prices
are especially effective at identifying households with an immediate need for the product.
We combine our estimates of the screening and causal effects of prices into a simple model that
predicts product use as a function of price. The model indicates that an organization interested
in maximizing product use would charge a positive price, even if revenues were not a concern.
Because we find evidence of a causal effect of the act of paying, but not of the amount paid,
the use-maximizing price is small. However, the model implies that higher prices (close to the
prevailing retail price of Clorin) could be charged with little or no reduction in use relative to free
distribution. These model-based implications suggest that understanding the screening and causal
effects of prices is a critical input to resolving public policy debates over the appropriateness of
user fees for access to social products and services.
Methodologically, our paper is most closely related to Karlan and Zinman’s (2006) experimental
study, which uses a two-stage pricing design to estimate the importance of adverse selection and
moral hazard in loan demand and default in South Africa.2 We use the two-stage pricing approach
to answer a different set of policy questions, in a product market (rather than financial market)
context. Moreover, because our discount offers were for one time only, they did not affect the
marginal incentives of the households with respect to product use, so there is no analogue of the
1The effect is also stronger for married women than single women, which may suggest some role for an agency-basedexplanation (Prendergast and Stole, 1996; Ashraf, 2005).
2More broadly, our approach relates to recent research investigating the effectiveness of alternative marketingapproaches in developing countries (Bertrand et al, 2005), and to field experiments more generally (Harrison andList, 2004).
4

moral hazard effect in our context. Arkes and Blumer’s (1985) study of the sunk cost effect in the
use of theater tickets is also related methodologically, but does not investigate the screening effects
of prices, does not examine the effects of a zero transaction price, and deals with a market context
fairly different from the distribution of health products in developing countries.
Topically, our paper relates to the economics of pricing in non-profit industries in general (New-
house, 1970; Casper, 1979; Oster, 1995; Steinberg and Weisbrod, 1998; Oster, Gray, and Weinberg,
2003), and in social marketing organizations in particular (Kotler and Roberto, 1989; Behrman,
1989). Because many individual health outcomes depend on household behavior as well as on inputs
from the health care sector (Grossman, 1972), our findings may have important implications for the
role of prices even in areas with significant health externalities (Kremer and Miguel, forthcoming).
Though there have been some studies of the effectiveness of prices in encouraging product use in
social marketing contexts, existing research takes a largely non-experimental approach (Meekers,
1997).3
Our study also relates to the literature on the psychology of product pricing (Gourville and
Soman, 2002; Shiv, Carmon and Ariely, 2005), and especially to research on the sunk cost effect.
With the exception of Arkes and Blumer’s (1985) study, all existing evidence on the sunk cost effect
comes from hypothetical choices or laboratory experiments (Eyster, 2002; Friedman et al, 2004).
Ours is only the second field experiment on the sunk cost effect that we are aware of, and it is the
first to include a treatment in which participants paid nothing for the product.4 Our finding that
use does not vary with the amount paid is inconsistent with previous evidence on sunk-cost effects.
However, our finding that the act of paying may itself impact use accords with the basic premise
that sunk costs affect behavior. This contrast may suggest a need to revisit the psychology of sunk
costs, with an emphasis on the distinction between the amount paid, and the act of paying.5
Lastly, the water disinfectant product that we use in our study is of intrinsic interest in light of
3An exception is Litvack and Bodart (1993), who study a natural experiment in which public health facilities inCameroon adopted both user fees and improved quality of care. Because of the simultaneous adoption of these twopolicies, Litvack and Bodart’s (1993) research design does not permit separate identification of the effect of fees onutilization.
4A number of existing papers explore the special role of zero prices, but none focuses on the effects on post-purchaseuse. See, for example, Ariely and Shampan’er (2004), Thornton (2006), and Karlan and List (2006).
5By providing the first experiment linking market behaviors to hypothetical-choice elicitations of sunk-cost effects,our study also contributes to a growing literature connecting laboratory and survey responses to incentivized choicesin markets (Goette, Huffman, and Fehr, 2003; Karlan, 2005; Ashraf, Karlan, and Yin, 2006).
5
growing concerns about access to clean water among the world’s poor. Almost 1.2 billion people
worldwide lack access to clean water, and water-borne diseases kill some 3.1 million people each year
(USAID, 2006). Because they do not require the construction of new infrastructure or pipelines,
household products like Clorin are a promising tool for addressing this problem. Our research
contributes to ongoing research on the adoption and usage of Clorin and similar products (Thevos
et al, 2002; Kremer et al, 2006) by showing that pricing can form part of an effective strategy for
encouraging product use.
The remainder of the paper is organized as follows. Section 2 describes the design of our
surveys and door-to-door marketing experiment. Section 3 presents our findings on the effect of
price changes on product purchase and use. Section 4 presents our findings on the longer-term
effects of pricing on use. Section 5 develops the implications of our estimates for optimal pricing
policy. Section 6 concludes.
2 Experimental and Survey Design
Our study consisted of a baseline survey, a randomized door-to-door marketing intervention approx-
imately two weeks later, and a follow-up survey approximately two weeks after the intervention.
(We also conducted a second, longer-term follow-up survey, which we discuss in section 4 below.)
In the baseline survey, we asked questions about basic demographics, health attitudes, and
water treatment. We also tested participants’ water for the presence of chlorine. In the marketing
intervention, we offered to sell a single bottle of Clorin to each household at a randomly chosen offer
price. Households that agreed to buy were then given a randomly chosen discount, thus allowing
us to vary the transaction price separately from the offer price. In the follow-up survey, we again
asked questions about water treatment and tested household water supplies. At the end of the
survey, we asked several questions relating to potential psychological mechanisms for a causal effect
of prices.
6

2.1 Background on Clorin
Clorin is a water purification solution that is marketed in Zambia by the Society for Family Health
(SFH), a local affiliate of PSI, an international non-profit organization.6 Chemically, Clorin is
sodium hypochlorite bleach, which can be mixed with water stored in the household in order to kill
water-borne pathogens, and thus prevent the contraction of water-borne illnesses that are especially
dangerous to young children. Because many households in Zambia obtain their water from sources
that are not properly chlorinated, and because Clorin is less expensive than boiling water or other
alternative methods of disinfection, it has been a popular product since its launch in 1998 (Olembo
et al, 2004).
Clorin is marketed by the bottle (see figure 1), and a single bottle is sufficient to disinfect up to
1,000 liters of water (about one month’s water supply for a family of six). Clorin is sold widely in
both retail outlets (for about 800-1,000 Kw) and health clinics (for about 500 Kw).7 These prices
are modest by Zambian standards; for comparison, in Lusaka, a bottle of Coca-Cola costs about
2000 Kw.8 The fact that Clorin is a relatively inexpensive product limits the possibility that wealth
effects contaminated our study of the effects of offer and transaction prices on Clorin use.9
In addition to the inherent importance of clean water for health in the developing world, we
chose to use Clorin in our study for two practical reasons. First, Clorin use can be measured not
only by household self-reports, but by chemical tests for the presence of chlorine in stored drinking
water. These tests are themselves imperfect, because households’ source water (i.e., water from
taps) sometimes contain chlorine, and the levels of chlorination in source water vary considerably
across space and over time. Despite these drawbacks, the objectivity of chemical tests creates the
possibility of cross-validating households’ subjective reports, an option that is not available with
many health products (e.g., condoms).
Second, because Clorin has been widely marketed for several years, most households are familiar
with the product and with its prevailing retail price. In our baseline survey (described below), nearly
80 percent of respondents report having used Clorin at some point, with over 99 percent mentioning
6See <http://www.psi.org/resources/pubs/clorin.html> for additional information.7The recommended retail price of Clorin is 800 Kw.8As of June 1, 2006, 800 Kw was equivalent to about $0.25 US. Average monthly urban income in Zambia in
2002-2003 was 790,652 Kw (UNECA, 2006).9See subsection 3.4 of the analysis for additional checks on the possibility of contamination from wealth effects.
7

Clorin when asked which water purification solutions they have heard of. Our experience further
suggests high levels of awareness of Clorin prices. We also took steps (detailed below) in our
experiment to ensure that the households in our study had uniform, accurate information about
prices in the existing market for Clorin. These facts, combined with additional precautions we
describe below, serve to minimize the information participants could have gleaned from the prices
we charged in our experiment. While informational effects of prices are relevant for policy, limiting
their role allows us to more cleanly test for the screening and causal effects that are the focus of
our study.10
2.2 Baseline Survey
We fielded our baseline survey to 1, 260 households in Lusaka, Zambia in May, 2006. To select
households, we first selected five peri-urban areas (“compounds”). Because we wanted to sample a
population whose water source had limited chlorination (so that use of Clorin was likely to make a
significant difference in pathogen levels in the drinking water), we avoided compounds close to the
main water line in Lusaka. We also avoided compounds where we knew that NGOs were (or had
recently been) distributing Clorin for free from door to door.11 Our interviews focused on female
heads of household, because prior experience (later confirmed by our baseline data) suggested
that they play a central role in decision-making about purchases of Clorin, and are typically the
household members responsible for putting Clorin in the water.12
The households we sampled seem to be fairly representative of the Lusaka population, despite
the requirements we imposed in selecting compounds. Table 1 compares average demographic
characteristics of the households in our baseline sample to Lusaka residents sampled in the 2001
10 In subsection 3.4 of the analysis, we show directly that participants’ attitudes toward Clorin and beliefs aboutClorin’s market price did not change in response to the prices we charged.11Within the five compounds we chose, we sampled 10 randomly chosen standard enumeration areas (SEAs) for
surveying. Within each SEA, we sampled one out of every five households until the target of 252 households wasreached for the compound.12Our surveyors worked in teams of four, each with a supervisor who organized the “one out of five” sampling
within the SEA. Each day, during the baseline survey, the teams traveled to the compounds on their schedule. Ateach household, the surveyor asked to speak with the female head of household, and if there was no one home orthe female head was unavailable, the surveyor returned later that day to complete the survey. If the female head ofhousehold could not be reached on that day, the house was skipped. After identifying the female head of household,the surveyor read a consent form and asked for permission to conduct a 30 minute interview regarding her healthchoices.
8

Demographic and Health Survey (DHS) of Zambia.13 Though the DHS questionnaire does not
allow us to restrict to female heads of household, in other respects the samples should be fairly
comparable. In column (1) of the table, we present means of a set of demographic characteristics
available in both our data and the DHS. In column (2), we restrict attention to households in which
the female head is between ages 15 and 49, since these are the ages present in the DHS sample.
In column (3), we report comparable means for the DHS data. Comparing columns (2) and (3)
suggests that our sample is reasonably similar to the DHS sample. Our respondents tend to be
slightly older and more likely to be married than the DHS respondents, most likely due to our
insistence on speaking to the female head of household. The households in our baseline sample
also have slightly lower levels of durables ownership than those in the DHS data. On the whole,
however, the demographics line up fairly closely, suggesting that our findings may have applicability
beyond the compounds we sampled.
The survey interview was divided into several sections. First, we asked for a variety of basic
demographic information, such as age, marital status, schooling levels, fertility history, household
composition, and ownership of various durable goods (as a proxy for wealth or income). We
then asked a range of questions about media exposure, malaria knowledge and behaviors related
to malaria prevention. In addition to serving as possible proxies for general health knowledge
and attitudes, these questions served to make the purpose of our study less transparent to the
interviewee. Finally, we asked several sets of questions related to water use practices, diarrhea,
soap use, attitudes toward and use of water purification techniques, access to water sources, and
detailed questions on the use of Clorin.
In the last section of the interview, the surveyor tested the household’s drinking water for the
presence of chlorine. Most households store their water in a large plastic jug. The surveyor put a
small amount of stored water into a Styrofoam cup, and inserted a chemical test strip into the cup.
After exposure to water, areas of the test strip change color based on chlorine concentrations in the
water. We used the Sensafe Waterworks 2 test strip,14 which tests for both free chlorine radicals
13We are grateful to Emily Oster for providing tabulations of demographic characteristics from the DHS. See<http://www.measuredhs.com/> for further details on the survey.14The Sensafe Waterworks 2 test strip is Industrial Test Systems part number 480655. See
<http://www.sensafe.com/> for corporate information and <http://www.sensafe.com/480655.php> for additionalinformation about the test strip.
9

(chlorine available to kill pathogens) as well as total chlorine (free chlorine plus chloramines, a by-
product of chlorine combining with organic compounds).15 The test strip identifies seven possible
concentrations of both free and total chlorine: 0, 0.1, 0.2, 0.5, 1, 2.5, and 5 parts per million.
Our own experimentation, as well as conversations with the manufacturer, suggested that the free
chlorine measurement was more reliable and less sensitive to variation in test conditions (such as
light and heat). Moreover, the presence of free chlorine radicals is the more relevant metric of the
safety of drinking water, because it measures the presence of chemical sanitizer that is available to
kill pathogens.16 We will therefore focus our attention on the measurement of free chlorine.
Measured chlorination is highly related to self-reported use of Clorin. Among the 21 percent of
households that report that their water is currently treated with Clorin, more than 60 percent have
at least some free chlorine, whereas this figure is below 40 percent for the households that report
that their water is not currently treated with Clorin.17 A Pearson χ2 test definitively rejects the
equality of the two distributions (p − value < 0.0001). Indeed, levels of free chlorine of 2.5 and 5
parts per million are only found in households who report that their water is treated with Clorin.
In order to limit sensitivity to these rare outliers, we will use a binary measure of the presence of
free chlorine (free chlorine levels of 0.1 parts per million or greater) in our analysis. In the baseline
survey, 41 percent of the households have at least 0.1 parts per million of free chlorine in their
water.18
Although the strong correspondence between self-reported water treatment and measured chlo-
rination suggests that both measures capture meaningful variation in use of Clorin, neither measure
is likely to be perfect. Self-reported water treatment may be subject to various recall biases, some
of which could be affected by our experimental treatment. Measured chlorination avoids these
pitfalls, but is affected by variation in ambient chlorination in water taps, and perhaps by variation
in testing conditions and surveyor care. We will therefore use both self-reported and chemical mea-
15See chapters 13 and 14 of Hauser (2002) for more information on chlorine chemistry and chlorine testing.16U.S. drinking water guidelines typically call for a minimum free chlorine residual of 0.2 parts per million and
a maximum total chlorine concentration of 4 parts per million. (See <http://www.epa.gov/safewater/mcl.html>,<http://www.nps.gov/public_health/inter/faqs/faq_dw.htm#3>.) Note, however, that smaller amounts of freechlorine residual still afford some protection against contamination by pathogens.17 It is not surprising that a large fraction of households who report not using Clorin have some chlorine in their
water. Many household water sources (i.e., taps) have some chlorination, with levels that vary across locations andover time.18By contrast, fewer than 10 percent of sampled households have free chlorine concentrations of 0.2 parts per million
or greater. Our cutoff therefore captures the richest degree of variation in the dependent measure.
10

sures in our analysis of the experimental results, with the goal of obtaining convergent evidence for
the effects we report.
2.3 Door-to-Door Marketing Experiment
For our marketing experiment, we sent a team of six marketers out in May and June of 2006 to
the 1, 260 households from the baseline survey.19 The marketing was designed to occur about two
weeks after the household was surveyed for the baseline, but actual lag times varied due to variation
in logistical factors such as the difficulty of contacting the original survey respondents.
The marketers were not the same people as the surveyors, and did not mention any connection
with the surveyors. Specifically, whereas surveyors introduced themselves as carrying out a health
survey for a researcher at Harvard University, the marketers introduced themselves as representa-
tives of SFH, which produces, distributes, and markets Clorin throughout Zambia. This contrast
serves two purposes. First, it provides greater confidence that behavior in response to the market-
ing intervention is not driven by the belief that the experimental participants are “being watched.”
Second, the SFH name carries significant credibility, which is useful in minimizing the risk that
participants thought the discounted Clorin bottles must be somehow sub-par.
After making contact with the female head of household, the marketers followed a written script,
which was personalized for the household. The marketer offered to sell a single bottle of Clorin for
a one-time-only price. This initial offer price was chosen randomly, with 10 percent of households
receiving an offer price of 800 Zambian Kwacha (Kw), and the remaining 90 percent split as evenly
as possible among offer prices of 300, 400, 500, 600, and 700 Kw. (See table 2 for exact proportions.)
The typical retail price of Clorin is between 800 and 1,000, so most households were receiving some
price discount in addition to the added convenience of door-to-door purchasing. The marketing
script for each household specified the initial offer price to be charged, allowing us to control the
randomization directly, and ensuring that the marketers had no discretion in setting this price.
19The six marketers worked with one supervisor who coordinated the visits in the compound. They used hand-drawn maps prepared by the teams that conducted the baseline survey in order to find the households from thebaseline. They also used information, collected in the baseline survey, about when the female head of household wasmost likely to be at home. If the marketers found a house but there was no one home, they returned at least threetimes on two different days to try to contact the original respondent. If someone was home but it was not the femalehead of household named in the baseline survey, they made an appointment to return when the female head wouldbe home.
11

The marketing script explicitly told respondents that Clorin was available in retail outlets for
around 800 Kw. Although early pilot interviews suggested that most people in Lusaka are well
aware of these prices, we included this information in the script to guard against the possibility
that households would infer something about the market price (or quality) of Clorin from the prices
we offered in our experiment.
If the respondent agreed to buy at the initial offer price, the marketer informed her that she
might be eligible for an additional discount.20 The respondent was given a sealed envelope, which
contained a coupon offering a one-time discount on the bottle of Clorin. Using a sealed envelope
allowed us to control the amount of the discount, and to prevent the marketer from signaling
the discount using body language or other cues. After the respondent opened the envelope, the
respondent paid for the bottle of Clorin and the marketing session ended.21
When asked why they were offering Clorin at lower-than-normal prices, marketers explained
that the price was part of a special promotion. They used the same explanation to account for
the additional discount after the asking price was agreed upon. Door-to-door sales (and occa-
sional giveaways) are not unheard of for products like Clorin, and participants seemed to accept
this explanation. Indeed, after we explained that the initial offer price was a promotional price,
participants rarely questioned the reason for the discounted transaction price.
Because we wanted variation in the transaction price (and not variation in the offer price)
to identify any psychological effects of price on product use, we designed several features of the
marketing procedure to make the transaction price salient. First, marketers were trained to offer
the discount before the respondents went to retrieve the cash payment, so that the respondents
would count out only the amount of money needed to pay the transaction price. Second, the
coupon stated the final transaction price, rather than the amount of the discount (see figure 2).
Finally, respondents were asked to write the final transaction price on a receipt and sign it.
20 If the respondent agreed to buy at the initial offer price, but did not have the necessary cash on hand, themarketer offered to reschedule, and returned to complete the script at the arranged date and time.21None of the respondents decided not to buy the bottle of Clorin after the discount was offered. In order to
guarantee that the transaction took place at the specified price, the marketer asked each respondent to fill out areceipt, and included that along with the payment in the discount envelope marked with the household’s uniquesurvey identification number. This allowed us to check that the marketers had complied with the instructions. Infour cases, the marketer transacted at a price other than the one we specified due to human error. In these cases, wewill use the intended transaction price rather than the actual transaction price for the purposes of our analysis, toensure that these errors do not contaminate our findings.
12

The size of the discount was chosen randomly, but every household received a discount of at
least 100 Kw. We offered a discount to every household to avoid disappointing the respondents,
and to ensure that every household was exposed to the coupon (in case of any advertising effects
of the coupon itself). Because we hypothesized that paying even a small amount might be very
different psychologically than paying nothing, we randomized the discounts so that, regardless of
the offer price, 40 percent of households received a 100% discount, and thus had a transaction price
of zero. For each offer price, we split the remaining 60 percent of households evenly among the set
of transaction prices that were above zero but at least 100 Kw below the offer price. (See table 2
for details.) So, for example, among households that were offered Clorin for 700 Kw, 40 percent
were assigned a transaction price of 0 (a discount of 700 Kw), and 10 percent were assigned to a
transaction price of 100, 200, 300, 400, 500, and 600 Kw (discounts of 600, 500, 400, 300, 200, and
100 Kw, respectively).
We assigned the offer and transaction prices randomly prior to the marketing outings, so that
every household was assigned an offer price and a transaction price, even if we were unable to
reach the household during marketing. The randomization was fully stratified by compound, with
every compound receiving (up to integer constraints) the exact same mix of offer and transaction
prices. At the time of randomization we verified that observable characteristics were balanced
across treatments, and, in a few cases, re-randomized when this was not the case.
Table 3 presents a test of the relationship between our treatment conditions and a range of
household characteristics measured in the baseline survey. Column (1) shows a regression of the
offer price (in units of 100 Kw) on measures of Clorin use and chlorination, health behaviors and
health attitudes, and a range of household demographic characteristics. To separate the screening
and causal effects of prices, our analysis of offer prices in section 3 will study the effect of variation
in offer price that is not related to transaction price. To parallel this analysis, the specification
in column (1) includes fixed effects for the transaction price. The regression shows no evidence
of any contamination of the treatment: the regression coefficients are all individually insignificant,
and an F -test of the null hypothesis that all coefficients are zero fails to reject at any conventional
significance level.
The analysis in column (1) refers to the entire baseline sample (excluding households that
13

refused to answer one or more demographic question). However, only 1, 004 households, or 80
percent of the sample, were successfully reached during the marketing intervention, and we will
not use data from the unreached households in our experimental analysis. Column (2) of table
3 therefore repeats the analysis of column (1), restricting attention to the sample of households
reached by our door-to-door marketing. Again, the analysis shows good balance of observables with
respect to the treatment. Baseline self-reported use is marginally statistically significantly related
to the offer price, but none of the other covariates is significantly related to the treatment, and
again the F -test fails to reject the null of no relationship between household characteristics and the
offer price.
In column (3) of table 3, we conduct a parallel analysis of the covariates of the transaction
price, conditional on the offer price. Because the transaction price was only relevant for those
households who purchased Clorin, we restrict attention to that sample in this specification. There
is a statistically significant relationship between the chemical presence of free chlorine in the baseline
survey and the transaction price in this sample, but the relationship with self-reported use has the
opposite sign, and no other covariate is statistically related to the treatment. The F -test of the
restriction that all covariates enter with a coefficient of zero fails to reject the null. Overall, then,
this table confirms the exogeneity of the treatment. However, because of the lack of balance with
respect to pre-existing chlorination levels, we will pay special attention in our analysis to the effects
of controls for baseline chlorination levels and Clorin use.
Some of our analysis will focus on the contrast between households that paid a positive trans-
action price for their bottle of Clorin and those who received the bottle for free. In column (4) of
table 3, we use as the dependent variable an indicator for whether the household paid a positive
price, again restricting attention to those who bought Clorin, and controlling for offer price. The
statistically significant relationship with baseline chlorination levels is not present in this case, al-
though both self-reported Clorin use and measured chlorination are positively (but not statistically
significantly) related to the positive price condition. An indicator for the female head of household
having attended school is marginally statistically significantly positively related to the positive price
condition, but our measure of years of schooling is marginally significantly negatively related to the
positive price condition, suggesting no systematic relationship to schooling levels. Overall, there
14

is little evidence of a systematic bias, and the F -test again confirms that the set of covariates are
jointly not significantly related to the treatment condition.
2.4 Follow-up Survey
For our follow-up survey, we sent the original survey teams (three teams of four, each with one
supervisor) to find and re-interview the households that we successfully reached for the market-
ing intervention.22 We re-interviewed households approximately two weeks after the marketing
intervention, but actual lags varied due to logistical factors.23
The follow-up interview consisted of several sections. First, we repeated a handful of demo-
graphic questions from the baseline survey, as a check on the identity of the respondents.24 Next,
we asked a variety of questions about health knowledge and attitudes, and hygiene practices. We
then asked a detailed set of questions about the household’s use of Clorin, followed by questions
about whether the household had been visited by marketers at any point in the past. This question
served as an additional check on whether we had reached the correct household.25 After concluding
the questions on Clorin use, we tested the household’s water, following the same procedure as in
the baseline survey. Finally, once we had concluded measurement of Clorin use and chlorination,
we asked several questions relating to the sunk cost effect and the idea that paying for something
may lead one to value it more. We asked these questions at the end of the survey because we did
not want households’ answers to these questions to affect their responses about Clorin use.
We reached 890 households in the follow-up survey, representing about 89 percent of the 1, 004
households who were successfully reached during the marketing phase. Table 4 presents some
22Because they were not exposed to our marketing experiment, we did not attempt to interview the householdsthat we did not reach during the door-to-door marketing.23 If the surveyors found a house but there was no one home, they returned at least three times to contact the
original respondent. If someone was home but it was not the female head of household named in the baseline survey,they made an appointment to return when the female head would be home. In cases where it proved exceedinglydifficult to reach the female head of household, the surveyor accepted another female adult household member as aninterviewee, and noted this adjustment in the questionnaire.24Among the 832 cases in which our records indicate that we successfully reinterviewed the original respondent,
these demographic characteristics are strongly correlated between the baseline and follow-up surveys, with (highlystatistically significant) correlation coefficients of 0.9 or more. (The demographic characteristics are inconsistentbetween the baseline and follow-up surveys in less than 9 percent of cases.) Our findings are not substantivelydifferent when we restrict attention to the cases in which we successfully reinterviewed the original respondent.25We also asked our surveyors to identify the bottles of Clorin we had sold, which we had marked on the bottom
with an “X.” In nearly 80 percent of cases in which our records indicate that the household purchased Clorin, thesurveyors were able to identify the marked bottle among the household’s inventory of Clorin bottles.
15

evidence on the determinants of attrition. Because the experimental intervention did not begin
until the marketing phase, attrition is more of a concern for the follow-up than for the marketing
phase, but for completeness the table presents evidence on attrition at both stages.
Column (1) of table 4 shows estimates of a linear model of the probability that a household
in the baseline survey was reached during the marketing phase. The two treatment conditions are
statistically unrelated to attrition at this stage, which is unsurprising given that the experiment
did not begin until the marketing stage. Some household characteristics do seem to play a role in
attrition. For example, households that own a larger share of the set of durable goods (car, radio,
television) that we asked about were statistically significantly more likely to be successfully reached
during the door-to-door marketing. This most likely occurred because wealthier households tended
to be in more developed sections of the compounds and were therefore easier to locate.26 Households
in the fifth locality we surveyed were also significantly more likely to be reached, probably because
that compound had a more organized system of household addresses than the other compounds.
An F -test indicates that the variables in the model are jointly statistically significantly related to
the likelihood that the household was reached during the marketing phase, suggesting that attrition
was not random.
In column (2) of table 4, we examine the relationship between contact in the follow-up survey and
the initial offer price among households that were successfully reached for door-to-door marketing.
To isolate variation in the offer price from variation in the transaction price, and to better parallel
the analysis of the experimental findings, we include fixed effects for the transaction price in the
model. As in column (1), we find no evidence that the offer price received by the household affects
its likelihood of being reached in the follow-up survey, although we do find that demographic
characteristics are somewhat predictive of attrition.
In column (3) of table 4, we conduct a parallel investigation of the relationship between attrition
and the transaction price, controlling for the offer price. Here we restrict attention to households
that purchased Clorin during the door-to-door marketing, because these are the households for
whom the transaction price constitutes an experimental intervention. There is no statistical re-
lationship between transaction price and the likelihood of contact in the follow-up. Moreover, in
26Wealthier households were also more likely to have address plates on their homes (rather than having theiraddress written on the door or outside walls), which helped the survey team to locate the address.
16

this sample the F -test indicates that household characteristics are only marginally statistically
significantly related to the probability of attrition.
Finally, in column (4) of table 4, we repeat the specification of column (3), replacing the contin-
uous transaction price variable with an indicator for whether the transaction price was positive. As
in column (3), we find that the probability of contact is unrelated to the treatment condition, and
is only marginally statistically significantly related to the household’s demographic characteristics.
The evidence in table 4 shows that, while the attrition process was not random, it does not
appear to have been affected by the experimental intervention. This provides some reason to believe
that our experimental results are not confounded by differential sample selection across treatment
conditions.
3 Effects of Price on Purchase and Use of Clorin
We present the results of our experiment in three parts. First, we report our findings on the
relationship between offer price and the probability of a household purchasing Clorin during the
door-to-door marketing intervention. Next, we study the screening effect of offer prices on the
composition of households that buy Clorin, with special emphasis on their propensity to use Clorin
in their water. Finally, we examine the causal effect of transaction prices on a household’s intensity
of Clorin use.
The effect of an increase in the price of Clorin on use of the product depends on all three of these
effects. A higher price reduces the number of households purchasing Clorin (the effect measured
in subsection 3.1), which may depress Clorin use. However, this effect may be mitigated if some of
the households excluded by the higher price would not use the product even if they bought it (the
screening effect estimated in section 3.2). Finally, some households who continue to buy despite
the higher price may use the product more intensively as a result of the price increase, say because
of a sunk cost effect (the causal effect explored in section 3.3).
In section 5, we incorporate these three effects into a formal model of Clorin use, and develop
implications for optimal pricing when the objective is maximizing use.
17

3.1 Effects of Price on Purchase of Clorin
In this subsection, we explore the effect of offer price on a household’s propensity to purchase
Clorin during the door-to-door marketing phase of our study. Though the finding that higher
prices result in fewer purchases is not novel, it is an important “first stage” for the analysis of
screening in subsection 3.2. In addition, as noted above, knowing how many potential purchasers
are discouraged from buying by a price increase is a critical input to a complete understanding of
how prices impact usage.
Figure 3 shows the effect of offer price on the propensity to buy Clorin during our door-to-door
intervention. For each offer price, the figure reports the share of respondents purchasing Clorin at
each offer price level, along with the number of observations in each cell.27 The figure shows a clear,
downward-sloping relationship between offer price and the share purchasing Clorin. The relation-
ship is nearly monotonic, and suggests a strong price effect, with nearly 80 percent of respondents
buying Clorin at 300 Kw, and only about 50 percent buying at 800 Kw.28 The relationship is
also highly statistically significant: a Pearson χ2 test strongly rejects the null hypothesis of no
relationship between offer price and purchase frequency (p < 0.001).
For a more parametric evaluation of the relationship between price and demand, we will consider
the following simple model of demand for Clorin in our door-to-door marketing. LetWTPi represent
household i’s willingness to pay for Clorin in our door-to-door marketing. It is natural to assume
that WTPi ≥ 0 for all households i, i.e., that all households would have accepted the Clorin had
we given it away for free. Moreover, because Clorin is available in retail stores, there is likely to be
some upper bound v to households’ willingness to pay, most likely equal to the highest prevailing
retail price, possibly with some premium for the convenience of a door-to-door sale.
For simplicity, we will assume thatWTPi is distributed uniformly on the range [0, v]. Letting pi
be the offer price, we will suppose that a household purchases Clorin if and only ifWTPi ≥ pi; that
is, if its willingness to pay exceeds the offer price. Letting bi be an indicator for whether household
27Because we did not reach every baseline respondent during the marketing intervention, the distribution of obser-vations differs somewhat from the randomization scheme in table 2. However, the distributions are quite close, withrespondents allocated more or less evenly across prices from 300 to 700 Kw, and a smaller number at 800 Kw.28The two price levels that violate monotonicity–500 Kw and 800 Kw–are, respectively, the health clinic price
and current suggested retail price of Clorin. One explanation of the “spikes” in demand at these points is that theseare salient prices that have special resonance with consumers (Anderson and Simester, 2003).
18

i purchased Clorin, we can then write
Pr (bi = 1) = Pr (WTPi ≥ pi) (1)
= 1−piv.
This model is straightforward to estimate using ordinary least squares (OLS), regressing an indicator
for Clorin purchase on the offer price.
Column (1) of table 5 presents an estimate of equation (1). The model implies that an increase
of 100 Kw in the offer price would result in about a 7 percentage point reduction in the probabil-
ity of purchase. This coefficient is highly statistically significant, and is economically nontrivial,
corresponding to a price elasticity (evaluated at the mean offer price and purchase probability) of
about −0.6.
The regression has a constant of about 0.96, indicating that the model predicts that 96 percent of
households would accept a free Clorin giveaway delivered to their door. This estimate is statistically
indistinguishable from unity, which is consistent with our a priori intuition that few households
would turn down such a valuable gift.29 Note that, because we did not offer Clorin for free as
part of our study, this is a successful out-of-sample prediction of the model. The quality of this
prediction serves to lessen concerns that the behavior of the households in our study was unusual
or unrepresentative due to the prior surveying or other aspects of the experimental design (Levitt
and List, 2006), and to increase confidence in our ability to make policy judgments about a range
of prices not included in our study.30
The model also predicts that the maximum willingness to pay in the population is approximately
1, 450 Kw, with a standard error of about 130 Kw. Our estimate of the maximum willingness to
29We have also estimated a specification that restricts the constant term to be unity. In this restricted model,we again find that an increase in offer price of 100 Kw reduces the purchase probability by a highly statisticallysignificant 7 percentage points.30Additional specification checks support the use of a simple linear demand model. First, we find that adding a
quadratic term in offer price does not improve the model’s fit, suggesting that, within the range of experimentalvariation, there are no detectable nonlinearities in demand. Second, the marginal effect of offer price on demandestimates from logit and probit demand models is virtually identical to those reported in table 5, and the in-samplepredictions of the three models are essentially indistinguishable from one another. However, because logit and probitmodels assume that willingness to pay varies over the entire real line, they tend to predict that a significant numberof households would turn Clorin down even if it were free. These findings suggest that, because of the restricted rangeof willingness to pay in our context, linear probability models may outperform logit and probit models in predictingdemand out of sample.
19

pay is thus statistically indistinguishable from 1, 200 Kw, which is close to the 99th percentile of
the retail price distribution. The model therefore appears to be making plausible, though perhaps
optimistic, forecasts about the persistence of demand at high, out-of-sample offer prices.
Columns (2) through (4) of table 5 report various checks on the robustness of the results in
column (1). In column (2), we re-estimate the model of column (1), but include a wide range of
baseline variables as controls. Given the evidence in table 3 that the offer price is orthogonal to
households’ baseline characteristics, we would not expect the inclusion of these controls to affect
our estimates, and indeed the coefficient on offer price in column (2) is nearly identical to that
reported in column (1). In column (3), we include an alternative set of controls; namely, fixed
effects for the particular individual who attempted to market Clorin to the household. Although
we tried to maintain uniformity of procedures across marketers, some marketers may have been
more effective than others. However, because the choice of marketer was independent of the offer
price, these controls should improve the fit of the model without much change in the estimated
price coefficient, which is indeed what we find. In column (4), we re-estimate the specification in
column (1) on the sample of households that we reached in our follow-up survey, to check whether
the demand curve we estimate is significantly different for this subsample. We again find a constant
term close to unity and a coefficient of around 7 percentage points per 100 Kw, suggesting that the
underlying distribution of willingness to pay is not very different for the group of households we
successfully contacted for our follow-up survey.
It is crucial to our experimental design that households were not aware of their final transaction
price when deciding whether to purchase Clorin from us. Because we put the coupons in sealed
envelopes and did not tell the marketers what value was on each household’s coupon, only a lapse
in procedures could have allowed marketers to signal directly or indirectly to households what their
transaction price would be. While we made every effort to design our study to guard against such
a lapse, we can test for whether one occurred directly in our data by asking whether transaction
prices affected demand, after controlling for the offer price. In column (5) of table 5, we estimate
a model of demand that includes both offer and transaction prices. Consistent with our protocols,
we find that, after controlling for offer price, a household’s final transaction price had no statistical
effect on its propensity to purchase Clorin. This lack of statistical significance is not due to a lack
20

of power: an F -test definitively rejects the null hypothesis of equal effects of offer and transaction
prices (p < 0.001). Our data therefore support the view that households had no information about
the transaction price, so that, conditional on offer prices, transaction prices could not have affected
the composition of the households purchasing Clorin.
The findings in this subsection indicate that raising the offer price by 100 Kw reduced demand
by about 7 percentage points. In the next subsection, we analyze which households persisted in
purchasing Clorin as we raised the offer price. In particular, we study whether higher offer prices
were differentially attractive to households with a strong intention to use Clorin in the near future.
3.2 Estimates of the Screening Effect of Prices
In the previous subsection we showed that higher offer prices reduced demand for Clorin in our
door-to-door marketing. In this subsection, we ask how the households who were willing to buy at
high prices differ from those who were only willing to buy at low prices.
We first ask whether prices are a useful tool for targeting Clorin distribution to those households
that are most likely to use the product. We find consistent evidence that households that agree to
buy Clorin at higher prices are more likely to use the product than those who only agreed to buy at
lower prices. Next, we examine whether prices allow targeting based on characteristics not otherwise
observable to the distributor. We find that the pattern of more intensive use among households
buying at higher prices holds even after we control for households’ observable characteristics. In
other words, we find that prices are a useful screening device even when it is possible to target
distribution based on a wide range of household characteristics. Finally, we study some additional
costs and benefits of pricing-based targeting. We show that higher prices do not crowd out the
poorest households. However, we also find that higher prices do not help to target distribution to
the households with the greatest possible health benefits from Clorin.
We turn first to the basic question of whether higher prices help to target distribution of Clorin
to the households most likely to use it. Our primary measure of Clorin use will be a dummy for
whether the respondent reports that her household’s stored drinking water is currently treated with
Clorin, as of the time of the follow-up survey. Denote this variable by ui. As a simple discrete-
choice model, we can suppose that each household has an average utility for using Clorin in the
21

weeks following our marketing intervention. This utility is likely to be related to the household’s
willingness to pay WTPi, and may also be affected by the transaction price τ i. On each day, the
household receives a shock to its utility for using Clorin, and it chooses to use Clorin on days
when the overall utility (average utility plus day-specific shock) is positive. If utility is linear in
willingness to pay and transaction price dummies, and if utility shocks are uniform, then we can
write that
Pr (ui = 1 | WTPi, τ i, bi = 1) = βWTPi +7Xj=0
ρj (τ i = j) (2)
where ρj is a fixed effect for a transaction price of 100j Kw. (Note that this expression is conditional
on bi = 1; in other words, our analysis of use will focus on those households that purchased Clorin.)
Equation (2) is conditional on the household’s willingness to pay, which we do not directly
observe. However, we do observe the price at which the household agreed to purchase Clorin, which
tells us the range on which its willingness to pay must lie. Given the distributional assumptions in
the previous subsection, the expected willingness to pay given an offer price of pi is linear in pi, so
that
Pr (ui = 1 | pi, τ i, bi = 1) = β̃pi +8Xj=0
ρ̃j (τ i = j) . (3)
Here, β̃ and ρ̃j are just transformations of the parameters in equation (2).31
All else equal, we would expect that the households planning to use Clorin regularly after the
marketing intervention would be those most willing to pay for it, i.e. that β̃ > 0. Note that it may
also be the case that households with greater ex ante use (use prior to the marketing intervention)
will have higher willingness to pay. However, if households’ desire to use Clorin fluctuates over
time, willingness to pay may be more related to Clorin use after the marketing intervention than
before it. In the analysis that follows, we first test the hypothesis that greater willingness to pay is
associated with more use in our follow-up survey. We then turn to an analysis of whether ex ante
use (as measured in our baseline survey) is related to the offer price at which the household agreed
to buy Clorin.
31Equation (3) allows for a fairly flexible relationship between transaction prices and usage, but it does not allowthe screening effect β̃ to be different for households paying different transaction prices. As a robustness check, wehave estimated model (3) separately by transaction price. The average effect of offer price across these groups issimilar in size and statistical significance to the coefficients we report in table 6. Moreover, we cannot reject therestriction that the screening effect is identical across groups paying different transaction prices.
22

Specification (1A) of table 6 presents estimates of equation (3) using data on self-reported Clorin
use from our follow-up survey. We find that, conditional on transaction price, an increase of 100
Kw in the offer price leads to a 3.7 percentage point increase in reported Clorin use among buyers.
This coefficient is statistically significant (p = 0.012) and economically nontrivial, corresponding to
a usage elasticity (at the mean price and usage) of about 0.36.32 Put differently, our model implies
that moving from a free giveaway to a sale at the common retail price of 800 Kw would increase the
proportion of usage among purchasers by almost 30 percentage points. Provided that any causal
effect of prices acts through the transaction price rather than the offer price, this increased usage
comes entirely from the screening effect of prices on the composition of buyers.
Figure 4 presents these findings graphically. The figure shows coefficients from a regression of
usage on dummies for offer price, controlling for transaction price fixed effects. We have normalized
the y-intercept so that the average usage predicted by the fixed-effects model is equal to the ob-
served average usage. The figure shows a clear, upward-sloping relationship between offer price and
intensity of use among buyers, and suggests that the findings in table 6 occur robustly throughout
the distribution of offer prices. The figure also does not reveal any striking nonlinearities, suggesting
that our linear model may be a good approximation to the behavior of interest.
Because specification (1A) is based on respondents’ self-reported use of Clorin, it is possible that
our findings are driven partly by reporting bias, if those who bought at higher prices are merely
those who like to appear as if they are using Clorin regularly. In specification (2A), we check for
this possibility by using as a dependent measure an indicator for whether our chemical test strip
showed evidence of free chlorine in the household’s drinking water. Using the test strip measure,
we find a comparable, though slightly lower, coefficient, indicating that an increase in price of 100
Kw increases by about 3.2 percentage points the share of buyers whose water is chlorinated. This
coefficient is statistically significant (p = 0.033) and economically meaningful, corresponding to an
elasticity of chlorination with respect to price of about 0.30.
Although we find that price is an effective screening mechanism for identifying households
that will use Clorin intensively, it might be possible to achieve similar results by targeting using
observable household characteristics, such as marital status, education, or household composition.
32Logit and probit models of use produced almost identical estimates of the marginal effect of higher prices onusage among buyers.
23

In other words, a targeted distribution system that uses information about household characteristics
might be able to achieve the same composition of buyers as a price mechanism.
To test for this possibility, in panel B of table 6 we re-estimate model (3), but include a
vector of household demographic characteristics. Note that these variables are not “controls” in
the traditional sense, since we are interested in selection, rather than treatment, effects of prices.
Rather, the inclusion of these variables allows us to ask whether higher prices select buyers that are
more intensive users given their demographic characteristics. In other words, panel B asks whether
high prices are a useful screening device even when rich information on household demographics
is available. The coefficients in panel B are only slightly smaller than those in panel A, indicating
that much of the sorting that we observe in the data is on characteristics that are not available in
standard demographic surveys.
The results in panel C of table 6 provide some explanation as to why sorting on demographics
does not account for much of the screening effect we estimate. In the models in this panel, we include
self-reported Clorin use and estimated water chlorination, measured as of the baseline survey.
Including these variables reduces the screening on self-reported usage somewhat, and increases very
slightly the estimated screening on chlorination, but both coefficients remain large and statistically
significant. In other words, even if we hold constant past usage of Clorin, higher prices select
buyers who will use Clorin intensively in the future. Given this finding, it is not surprising that
demographic characteristics do not account for much of the screening effect of prices.
There are various reasons why prices might have been an effective screening tool even conditional
on information on baseline usage. For example, it could be that households maintain an average
stock of Clorin sufficient for their needs, in which case door-to-door marketing may have been most
likely to attract households that were anticipating a spike in their needs, rather than households
that routinely use a lot of Clorin. Alternatively, it could be that our baseline measures of usage
include some noise, and are therefore only imperfect proxies for a household’s true usage frequency.
In either case, our findings suggest that prices may be an effective screening mechanism even when
information on prior use is available to the distributor.
In order to study the sorting underlying the results in table 6 more directly, in table 7 we study
how the characteristics of buyers of Clorin change as the offer price increases. Panel A of the table
24

presents estimates of models similar to equation (3), but with various measures of baseline usage
as dependent variables. In specification (1), we find some evidence that buyers at higher prices
were more likely to report Clorin use in the baseline, but the estimate is much smaller than the
comparable estimates from follow-up data in table 6, and is statistically insignificant. Results are
similar when we use measured chlorination, in specification (2) of table 7.
The lack of statistical precision in specifications (1) and (2) could mean that there was no sorting
on pre-existing Clorin usage, or simply that the sorting on baseline usage was smaller than that
on follow-up usage, and therefore more difficult to pick up statistically. To improve our precision,
we attempt in specification (3) to aggregate information across several measures of Clorin use as of
the baseline. In particular, we estimate a regression model that predicts self-reported Clorin use in
the follow-up survey from self-reported Clorin use, measured chlorination, an index of the recency
of the last Clorin use, and a measure of the number of bottles of Clorin found in the household,
all measured as of the baseline survey. We then regress the fitted values from this model on the
offer price, to see if higher offer prices are associated with greater predicted follow-up use. We
find that raising the offer price by 100 Kw increases predicted usage among buyers by about 0.6
percentage points, which is statistically significant (p = 0.037) but economically much smaller than
the screening on follow-up use that we report in table 6. Thus, while we do find some evidence
of screening on baseline usage, this sorting is not quantitatively sufficient to explain most of the
sorting on follow-up use that we estimate in table 6. This finding suggests that some of the screening
value of prices may accrue from identifying households with a high immediate need for Clorin, as
opposed to identifying households that consistently use the product intensively.
Although we find that prices are an effective means of targeting households that will use Clorin
intensively, some of this screening could come at the cost of excluding the poorest households, or
those with the least education. Since these are the households that may be most in need of the
products that non-profit organizations distribute, excluding the very poor could be a significant
disadvantage of higher prices. In panel B of table 7, we examine the effect of higher prices on the
wealth and education of the purchasing households. In specification (6), we find that higher prices
do not significantly increase the average wealth of the buying population, as proxied by a measure
25

of the share of consumer durables owned by the household.33 The coefficient is small, implying that
an increase of 100 Kw in the offer price increases the average share of durables owned by purchasing
households by 0.16 percentage points, or about one percent of a standard deviation. Moreover, our
estimate is reasonably precise, with a confidence interval that rules out effects greater than six
percent of a standard deviation per 100 Kw.34
Specification (7) of table 7 examines whether higher prices result in higher levels of education
among the buying population. Again, we find little evidence that higher prices exclude those with
lower human capital: an increase of 100 Kw increases the probability that a purchasing household’s
female head attended school by about 0.07 percentage points, which is both statistically insignificant
and economically tiny. In specification (8), we report that an increase of 100 Kw in the offer price
increases the female head of household’s average years of schooling among buyers by a statistically
insignificant 0.07 years, or about two percent of a standard deviation.
One potential benefit of pricing is that it may help to target distribution toward those households
that stand to receive the greatest health improvements from use of Clorin. This especially relates
to households with young children, who are the most likely to be severely harmed by diarrhea
and other water-borne illnesses (Murray and Lopez, 1996). In panel C of table 7, we assess the
effects of higher offer prices on the potential for health gains among the purchasing population.
In specification (9), we estimate that raising the offer price has only a small and statistically
insignificant effect on the average number of children below age 5 in purchasing households. The
coefficient is fairly precisely estimated, with a confidence interval that rules out positive effects
larger than about six percent of a standard deviation. In specifications (10) and (11), we report
that two other markers of the potential for health benefits–a recent incident of child diarrhea or
a pregnant female head of household–are not more prevalent among the buying population when
the offer price is higher. The findings in panel C therefore suggest that price screening is not an
especially good tool for identifying the households with large potential health benefits from Clorin.
Of course, by the same logic these estimates also imply that low prices do not disproportionately
33See Morris et al (2000) for evidence that such assset-based measures can provide a good approximation to moresophisticated measures of household wealth in sub-Saharan Africa.34This finding is not limited to the mean of the distribution: we find no evidence (results not reported) that higher
prices reduce the share of the purchasing population with durables ownership in the bottom quartile of our sample,suggesting that even the very poor are not driven out by higher prices within the range of our price variation.
26

help to target households with small children.
Taken together, the findings in this subsection suggest that prices are an effective tool for
targeting distribution towards intensive product users. The sorting induced by higher prices occurs
along dimensions not related to observable demographics, and only partly related to pre-existing
usage levels. Higher prices do not exclude the least well off, although they also do not help to target
those with the greatest potential health benefits from Clorin.
3.3 Estimates of the Causal Effect of Prices
In the previous subsection, we used variation in the offer price to show that charging higher prices
can help to identify the households most likely to use the product intensively. Another possible
effect of higher prices is to induce greater use among purchasers, through a causal mechanism such
as the sunk cost effect (Thaler, 1980). In this section, we use variation in the transaction price to
estimate this causal effect of prices.
We begin, following the existing literature, by examining whether purchasers paying higher
prices are more likely to use Clorin than those paying lower prices. In contrast to previous field
experimental evidence on the sunk cost effect (Arkes and Blumer, 1985), we find no evidence of
such a pattern. We then move beyond existing field evidence to consider whether the act of paying
itself impacts usage. We do find some evidence of such an effect, though it is statistically somewhat
weak. However, we find that the effect of the act of paying is greatest among households whose
hypothetical choices exhibit a sunk cost effect, and those who report valuing something more if
they pay for it, suggesting the possibility of a robust psychological mechanism. (We also consider,
and find evidence consistent with, agency-based explanations for this effect.)
Effect of the amount paid. We turn first to the question of whether paying more for Clorin
causes greater or more frequent use of the product. We will estimate a model of the following form:
Pr (ui = 1 | pi, τ i, bi = 1) = ρ̃τ i +8Xj=3
β̃j (pi = j) . (4)
Recall that ui is an indicator for whether the household was using Clorin as of the follow-up survey,
and that pi and τ i index the offer and transaction prices for household i, respectively. Each β̃j is
27

a fixed effect for an offer price of 100j Kw, allowing us to control nonparametrically for the offer
price.35 Conditioning on bi = 1 means that we only consider households that purchased Clorin
during the door-to-door marketing; for other households, it does not make sense to estimate a
causal effect of the transaction price.
In specification (1A) of table 8, we present estimates of model (4). We find that increasing
the transaction price by 100 Kw increases the probability that the household reports using Clorin
by less than two percentage points, which is statistically insignificant and economically smaller
than the screening effects we identified in subsection 3.2. Specification (1B) adds our full set
of baseline controls to the model, and finds a somewhat smaller coefficient on transaction price.
Specifications (3A) and (3B), which use measured chlorination rather than self-reported use as a
dependent variable, find a zero or even slightly negative effect of higher prices on the use of Clorin
in the household’s drinking water.
Our estimates of model (4) reveal no evidence of a causal effect of the amount on product
usage, and these estimates are precise enough to rule out interesting magnitudes. For example,
in specification (1B), the confidence interval rules out magnitudes above 3.6 percentage points per
100 Kw, about the size of the screening effects we presented in the previous subsection.
To further check whether our estimates are precise enough to rule out interesting magnitudes, we
can ask whether our confidence intervals exclude the point estimates in Arkes and Blumer’s (1985)
study of the effect of discounts on the use of theater tickets, which constitutes the only other
field experimental evidence on the sunk cost effect that we are aware of. Some simple calculations
indicate that Arkes and Blumer’s estimates translate into an elasticity of ticket use with respect to
price of about 0.6.36 Our estimates in specification (1B) of table 8 imply an elasticity of Clorin use
with respect to transaction price of about 0.03, with a confidence interval that rules out elasticities
35Equation (4) allows for a fairly flexible relationship between offer prices and usage, but it does not allow the causaleffect ρ̃ to be different for households agreeing to different offer prices. As a robustness check, we have estimatedmodel (4) separately for households paying different offer prices. The average treatment effect across these groupsis similar in size and statistical significance to the coefficients we report in table 8. We cannot reject the hypothesisthat the effect of the transaction price is independent of the offer price.36Arkes and Blumer (1985) randomly assigned discounts to individuals purchasing season tickets to the Ohio
University Theater. Their study included three (approximately equally-weighted) treatments: those receiving nodiscount (and paying the full price of $15), those receiving a $2 discount (and paying $13), and those receiving a $7discount (and paying $8). The average number of tickets used by these three groups was, respectively, 4.11, 3.32, and3.29. Relative to the average price paid of about $12, the average discount involves a 36 percent reduction in price.And, relative to average utilization, the groups receiving a discount use an average of about 23 percent less. Thesevalues correspond to an elasticity of utilization with respect to price of about 0.6.
28

of about 0.11. We can therefore definitively reject the hypothesis that our participants exhibited
an elasticity comparable to that in Arkes and Blumer’s (1985) study (p < 0.001).
While a lack of power does not seem to explain our failure to find a sunk cost effect, it could be
that the households in our study are simply psychologically different from the populations used in
prior studies of the psychology of sunk cost. To test for this explanation, we included, at the end
of our follow-up survey, a series of hypothetical choices designed to mirror the types of questions
frequently used to elicit sunk cost effects in the existing literature. (We placed these questions at
the end of the survey in case these questions revealed anything about the study’s hypotheses.) In
particular, we asked the following question:
Suppose you bought a bottle of juice for 1,000 Kw. When you start to drink it, you
realize you don’t really like the taste. Would you finish drinking it?
Participants were able to answer yes or no, and could provide additional comments if they liked.
After this question, we asked two similar follow-up questions of all participants, one for the case of
a 5,000 Kw bottle of juice, and one for the case of a 500 Kw bottle.37
Consistent with existing evidence, we find that participants report that they would be more
likely to finish a bottle if it cost more to purchase. Twelve percent of respondents reported that
they would finish drinking the juice if it cost 500 Kw, as against 14 percent who said they would
finish it had it cost 1,000 Kw. This difference, though economically small, is highly statistically
significant (paired t = −2.78, p = 0.006). Nearly 33 percent of respondents said they would finish
drinking the juice if it cost 5,000 Kw, which is both economically and statistically very different
from the distribution of responses at 1,000 Kw (paired t = −13.45, p < 0.001). Indeed, we find
that over 20 percent of respondents display the sunk cost effect, in the sense of reporting that they
would finish the juice at 5,000 Kw but not at 1,000 Kw, or that they would finish it at 1,000 Kw
but not 500 Kw. Moreover, as we report below, there is no effect of the amount paid on Clorin use
even for this subsample of the population. Our evidence therefore suggests that our failure to find
37To isolate sunk cost effects from informational effects of prices, the follow-up questions emphasized that thejuice in question was the same bottle of juice regardless of the price we specified. For example, the second questionasked “Now suppose you actually had paid 5,000 Kw for that bottle of juice...Would you finish drinking the bottle?”Surveyors were instructed to emphasize the word that, thus stressing the fact that this question refers to the samebottle as in the question about 1,000 Kw.
29
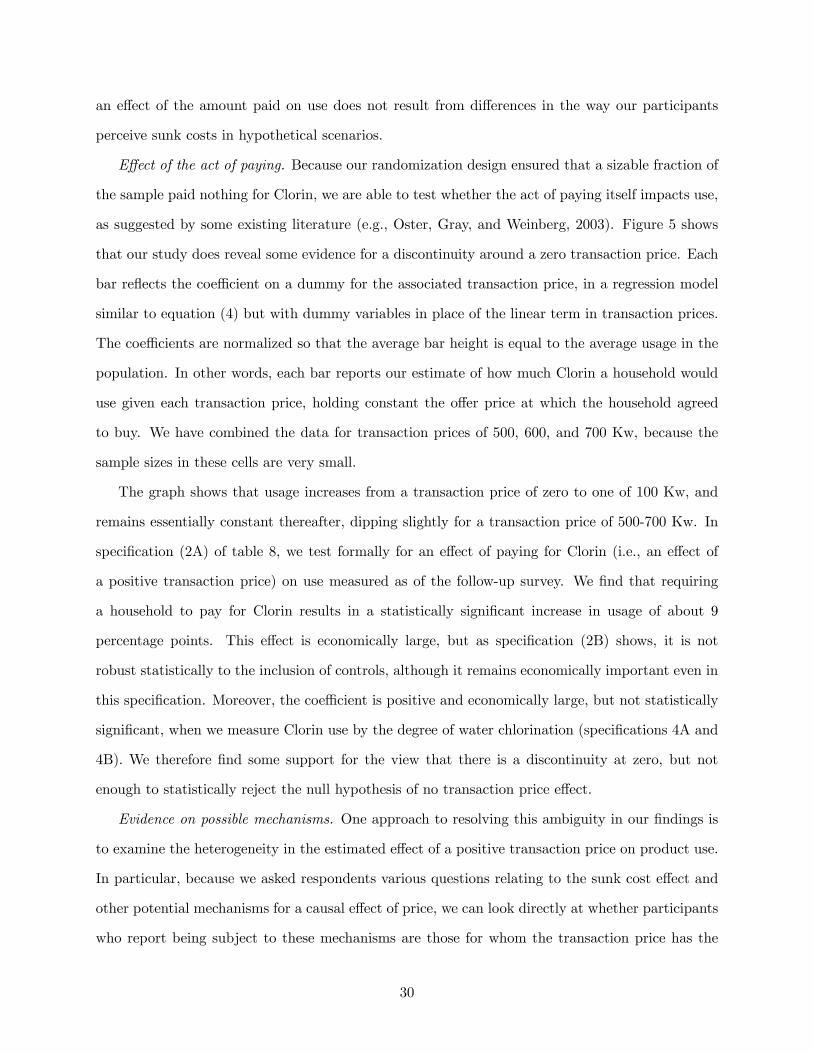
an effect of the amount paid on use does not result from differences in the way our participants
perceive sunk costs in hypothetical scenarios.
Effect of the act of paying. Because our randomization design ensured that a sizable fraction of
the sample paid nothing for Clorin, we are able to test whether the act of paying itself impacts use,
as suggested by some existing literature (e.g., Oster, Gray, and Weinberg, 2003). Figure 5 shows
that our study does reveal some evidence for a discontinuity around a zero transaction price. Each
bar reflects the coefficient on a dummy for the associated transaction price, in a regression model
similar to equation (4) but with dummy variables in place of the linear term in transaction prices.
The coefficients are normalized so that the average bar height is equal to the average usage in the
population. In other words, each bar reports our estimate of how much Clorin a household would
use given each transaction price, holding constant the offer price at which the household agreed
to buy. We have combined the data for transaction prices of 500, 600, and 700 Kw, because the
sample sizes in these cells are very small.
The graph shows that usage increases from a transaction price of zero to one of 100 Kw, and
remains essentially constant thereafter, dipping slightly for a transaction price of 500-700 Kw. In
specification (2A) of table 8, we test formally for an effect of paying for Clorin (i.e., an effect of
a positive transaction price) on use measured as of the follow-up survey. We find that requiring
a household to pay for Clorin results in a statistically significant increase in usage of about 9
percentage points. This effect is economically large, but as specification (2B) shows, it is not
robust statistically to the inclusion of controls, although it remains economically important even in
this specification. Moreover, the coefficient is positive and economically large, but not statistically
significant, when we measure Clorin use by the degree of water chlorination (specifications 4A and
4B). We therefore find some support for the view that there is a discontinuity at zero, but not
enough to statistically reject the null hypothesis of no transaction price effect.
Evidence on possible mechanisms. One approach to resolving this ambiguity in our findings is
to examine the heterogeneity in the estimated effect of a positive transaction price on product use.
In particular, because we asked respondents various questions relating to the sunk cost effect and
other potential mechanisms for a causal effect of price, we can look directly at whether participants
who report being subject to these mechanisms are those for whom the transaction price has the
30

greatest effect on usage.
Specifications (1) and (2) of table 9 present estimates of the effect of a positive transaction price
on Clorin usage, with the sample split according to whether the survey respondent displayed the
sunk cost effect in the hypothetical choices described above. All specifications include our full set
of baseline controls, as well as fixed effects for the offer price. Consistent with the hypothesis that
the sunk cost effect plays some role in the effect of the act of paying, we do find that the effect is
larger among those respondents (about one-fifth of the sample) who display the sunk cost effect.
This is true when we measure usage either through self-reports or through our measurement of
the chlorination of the household’s drinking water. In both cases, however, our estimates are not
precise enough to permit us to statistically distinguish the coefficients for the two subsamples.
The practitioner literature on pricing by nonprofits speaks of “buy-in” or “commitment” effects
of prices, a concept that seems slightly different from the sunk cost effect and relates to the effect
of a payment on the extent to which a household “values” a product. Because we did not know
of a standard set of questions that we could use to measure a household’s susceptibility to such
an effect, we asked about it directly, querying households to strongly disagree, disagree somewhat,
agree somewhat, or strongly agree with the statement that “I value something more if I paid for it.”
About half of the participants said that they strongly agree with this statement, and answers to this
question were not strongly related to our measure of the sunk cost effect, suggesting a potentially
different psychological phenomenon. As specification (3) of table 9 shows, among households who
strongly agreed with this statement, there is a statistically significant and economically large effect
of a positive transaction price on the propensity to report using Clorin. Among households that do
not strongly agree with the statement, the effect of a positive transaction price is essentially zero.
This contrast provides some support for a “valuation” mechanism. Note, however, that we cannot
distinguish the two coefficients statistically, and that the difference in coefficients is much smaller
when we measure usage with our chemical test for chlorination.
A final potential mechanism for an effect of transaction prices on product usage is an agency-
type explanation in the spirit of Prendergast and Stole (1996) or Ashraf (2005). In particular, it
may be that participants need to convince other members of the household that their purchases
were justified, so as to maintain their credibility in future purchasing decisions. Such a dynamic
31

could make it optimal to use a product more intensively if it was costly than if it was freely
given. Although we do not have a perfect test of this mechanism, a simple approach is to compare
respondents who make choices in the presence of other adults to those who do not. To implement
this comparison, in specifications (5) and (6) of table 9, we split the sample according to whether the
respondent is married. Consistent with the agency mechanism, the effect of a positive transaction
price on self-reported usage for married respondents (about four-fifths of the sample) is a large and
statistically significant 10 percentage points. By contrast, for unmarried respondents the effect is
strongly negative, and statistically distinguishable from the coefficient for married respondents. A
similar, though more muted, contrast is present when we measure usage with the chemical presence
of free chlorine. Though this finding by no means conclusively demonstrates that the effect of the
act of paying has an agency component, it is at least consistent with this hypothesis.
Though the estimates in table 9 refer to the effect of the act of paying on Clorin use, it is possible
to conduct similar tests for the role of alternative psychological mechanisms in mediating the effect
of the amount paid. Consistent with our earlier finding that the amount paid does not impact
use, we do not find consistent evidence that the effect of the amount paid is greater in subsamples
displaying the proposed psychological mechanisms (results not shown). For example, while we
do find that the effect of amount paid on self-reported use is slightly larger (though still small
and statistically insignificant) among households displaying the sunk-cost fallacy in hypothetical
choices, this difference reverses in direction when we used measured chlorination as our dependent
variable. Moreover, even for those who strongly agree that they value something more if they pay
for it, increasing the payment amount has a statistically insignificant negative effect on subsequent
use. Similar inconsistencies arise for the contrasts between married and unmarried respondents.
Taken together, these estimates reinforce the finding that, conditional on paying, the amount paid
does not influence the decision to use Clorin.
The evidence reported in this subsection shows that the act of paying for a product may have
an influence on a household’s decision to use it, especially among households that display the sunk
cost effect in hypothetical choices, and among households that report valuing something more if
they pay for it. By contrast, we find no evidence that, conditional on paying, the amount paid
influences use. Thus, while our findings are consistent with the basic psychological premise that
32

sunk costs can influence behavior, they contrast with previous evidence suggesting that larger sunk
payments induce greater product use.38 That this is so despite our finding that participants display
sunk-cost effects in hypothetical choices is consistent with Friedman et al’s (2004) finding that sunk
cost effects are small in laboratory experiments with real financial incentives. Overall, our results
may suggest a need to revisit the role of prices in the psychology of product use, with special
emphasis on the act of paying, rather than the amount paid.
3.4 Robustness and Interpretation
As section 2 outlines, we took steps in designing our experiment to rule out effects of prices other
than through the screening and causal mechanisms that we estimate above. It is possible, however,
that the experimental variation in prices induced changes in Clorin use through mechanisms we
have not modeled. In this subsection, we use several pieces of evidence from our study to test for
the presence of alternative effects of prices, namely informational and income effects, as well as to
test whether offer prices might have had psychological effects on use. In all cases, the tests reveal
no evidence of these effects. Though not fully conclusive, these findings, together with the details of
the experimental design, provide some reason to believe that our analysis identifies the parameters
of interest.
Effects of treatment on beliefs about Clorin quality. By basing our study on Clorin, a well-known
product with an established market, we sought to minimize the role of price-based inference. If,
despite our design, higher offer or transaction prices were taken to be evidence that Clorin is a
better product, and favorable beliefs induce more product use, this could have exacerbated either
the screening effects or the causal effects we estimate. This would not affect our conclusion that
there is no overall causal effect of prices, but it could mean that the screening effect or effect of
positive prices is overstated. For a crude test for such an effect, we can take advantage of the
presence in our follow-up survey of several measures of respondent attitudes toward Clorin. In
particular, the survey asks the respondent (on an agree/disagree scale) whether water purification
38While our results are inconsistent with Arkes and Blumer’s (1985) conclusions, the two sets of findings havecommon ground, in the sense that Arkes and Blumer find that, conditional on receiving a discount, the amount of thediscount does not affect use of theater tickets. It is therefore possible that the effects they estimate result from thepresence of a discount per se, rather than the dollar amount of the discount or sunk cost. This would be consistentin spirit with the sunk cost effect but, as with our results, would suggest a different set of hypotheses regarding itsunderlying psychological causes.
33

solution is easily available, whether it makes the water taste bad, and whether it is an effective
way to prevent diarrhea. None of these scales is statistically significantly affected by either the
offer or transaction price, and an aggregate index that includes all three is also unaffected by our
treatments.
Effects of treatment on beliefs about market prices. We told participants the prevailing retail
price of Clorin, and stressed to them that our offer to sell Clorin was for one-time only. These steps
were intended to limit the possibility that participants would believe that lower offer or transaction
prices reflected a decrease in the future marginal cost of acquiring Clorin, and change their usage in
response. If such an effect occurred, it would tend to attenuate the screening and causal effects we
estimate. To test for this confound, we asked Clorin buyers in the follow-up how much they usually
pay for a bottle of Clorin, and we asked those who reported not buying Clorin how much they
would expect to pay for a bottle. We find no effect of offer or transaction prices on participants’
responses to these questions.39
Income effects. Because the amounts of money involved in our study were modest by Zambian
standards, we would not expect income effects to be a major confound. However, if paying more
for Clorin reduced household wealth, this could in principle attenuate the causal effect (though
not the screening effect). As a simple test for this possibility, we have tested for an effect of
transaction price on usage among those in our sample with above-median wealth (as proxied by
durables ownership). Even among this group, there is no causal effect of prices, suggesting that
attenuation due to income effects is unlikely to be a major confound.
Psychological effects of offer prices. By identifying the transaction price before participants
counted their money, by printing the transaction price on the coupon, and by asking participants
to write the transaction price on a receipt and sign it, we endeavored to make the transaction price
salient to the households in our study. Some evidence indicates that we succeeded at least in making
part of the transaction price memorable. In the follow-up survey, respondents were asked whether
anyone had offered them Clorin for free in the last month. Among households that, according to
39Because not all respondents were asked how much they would expect to pay for Clorin in the future, it is possiblethat this measure understates the true effect of transaction prices on expectations. To address this concern, in thesecond follow-up survey (described in section 4 below), we asked all respondents how much they would expect to payfor a bottle of Clorin in the future. We again find no statistically significant relationship between responses to thisquestion and the transaction price at which the household purchased Clorin.
34

our records, received a free bottle (zero transaction price), some 60 percent report having received a
bottle for free, as against only 16 percent among those who did not receive a free bottle (transaction
price above 0). The difference between these two groups is highly statistically significant, and the
presence of some positive responses among those paying for Clorin seems plausibly attributable to
survey noise.
If, despite our efforts to guard against this, participants still felt psychologically “committed”
to the offer price, some of what we identify as a screening effect could come from sunk-cost type
effects. Recall, however, that the evidence in table 7 indicates that some of the screening is on
baseline characteristics, which cannot have been caused by sunk cost effects. As an additional
check on whether some of the remaining screening effects could be due to psychological effects of
prices, we have estimated the specifications in table 9, but contrasting the screening effect rather
than the causal effect across different groups of participants. On the whole, we find no evidence
that screening effects are larger in the households for which we would expect larger causal effects of
prices. The coefficients are statistically indistinguishable and economically similar across groups,
and the contrasts across groups have no consistent direction. Indeed, when we measure use with
respondents’ self reports, we find that if anything the screening effects are slightly smaller among
households that display the sunk cost fallacy in a hypothetical choice scenario. If our hypothetical
choices proxy well for psychological propensities, then these tests provide evidence against the view
that psychological effects contaminate our estimates of the screening effect.
4 Longer-Term Effects of Prices on Clorin Use
The preceding estimates relate offer and transaction prices to Clorin use measured approximately
two-weeks after our door-to-door marketing intervention. For some purposes, longer-term usage
measures may also be of interest. For example, if those who agree to buy Clorin at high offer prices
use more Clorin soon after their purchase, but not in the long run, this would suggest that prices
are effective in identifying buyers with an immediate desire to use Clorin, as opposed to those with
a persistently high propensity to use it. By contrast, if screening effects arise in both short-run
and long-run follow-up data, this could indicate that high prices identify those with a constant,
35

high-intensity need for Clorin.
Longer-term data may also be informative about the causal effect of transaction prices on Clorin
usage. If higher transaction prices induce greater Clorin use in the long-term, this could indicate a
fundamental shift in the household’s attitude toward Clorin, rather than a temporary elevation in
use due to the high cost associated with a particular bottle.
To shed some light on these issues, we conducted a second follow-up survey, with interviews
occurring approximately six weeks after the marketing intervention. As in the first follow-up,
we attempted to contact only those households who had been successfully contacted during the
marketing intervention. We used a survey instrument similar to that from the first follow-up,
with a few additional questions about willingness to pay for Clorin. In addition to testing each
household’s stored drinking water for chlorine, we were able in this survey wave to test the source
(public or private tap connected to the main water line) from which each household obtained its
water. This source water testing allows us to control for variation in chlorination due to factors
other than a household’s use of Clorin.
We successfully contacted approximately 80 percent of households for the second follow-up,
significantly lower than the 89 percent recontact rate from the first follow-up. Moreover, an analy-
sis of survey attrition reveals some (marginally statistically significant) evidence that households
receiving higher offer prices were less likely to be interviewed in the second follow-up survey. We
also find some (weaker) evidence of a relationship between transaction prices and attrition. These
results suggest a need for caution in interpreting the findings from the second follow-up survey, as
selective attrition could induce a bias in our estimates of experimental effects.
With that caveat in mind, we turn in table 10 to an analysis of the results from our second
follow-up survey. Columns (1) through (3) of the table present results using self-reported Clorin
use as the dependent measure; columns (4) through (6) repeats all specifications using the chemical
presence of free chlorine as the dependent variable.
An important methodological difference between the first and second follow-up surveys is that
in the second survey, we were able to measure the chlorination of the household’s water source,
in addition to the stored water within the home. In other words, our surveyors measured the
chlorination of the public or private tap from which each household obtained its water, allowing
36

us to adjust our estimates for variation in ambient chlorine levels. As a result, our estimates in
columns (4) through (6) will use as a dependent measure a dummy for whether the household’s
stored water contained a greater amount of free chlorine than water from the household’s water
source. Using this augmented variable should improve the precision of our estimates of effects of
price on chlorination levels.
In column (1) of table 10, we present evidence on the screening effect of prices, examining
whether households that agree to buy at a higher offer price also report using more Clorin in the
second follow-up survey. We find no evidence of such a relationship; if anything, it is slightly
negative, though statistically indistinguishable from zero. Results are similar when we examine
measured chlorination in column (4). Taken together, these findings suggest that higher offer prices
did not screen out households with a low long-term propensity to use Clorin. This is consistent
with our earlier finding that offer prices only screen slightly on baseline usage, and suggests that
high offer prices were especially effective at selecting households with a high short-term need for
Clorin.
In columns (2) and (5), we turn to an analysis of the causal effect of transaction prices. As
before, we estimate a precise, small, and statistically insignificant effect of greater transaction prices
on subsequent propensity to use Clorin. This finding stands in contrast to earlier evidence on the
sunk cost effect (Arkes and Blumer, 1985).
In columns (3) and (6), we focus on the contrast between households that paid something for
Clorin and those who paid nothing. Our point estimates are nontrivial, implying an effect of pos-
itive transaction prices on self-reported usage of around six percentage points and on measured
chlorination of around 9 percentage points. Indeed, the effect on measured chlorination is statis-
tically significant (in contrast to the results from the first follow-up), which may reflect the gain
in statistical precision from the ability to correct for source chlorination. These results therefore
support the possibility of longer-term effects of positive prices on intensity of use.
37

5 Implications for Optimal Pricing Policy
In section 3, we establish that charging higher prices for Clorin reduces demand for it, but helps to
target distribution to those households that are most likely to use it. We also show that, conditional
on this sorting, charging a positive price may induce greater use than giving Clorin away for free.
Finally, we show that higher positive prices do not induce greater use than lower positive prices.
In this section, we combine these elements into a simple model of Clorin use that allows us to
develop implications for pricing policy. This will allow us to use our estimates to simulate events
that did not occur in our sample. While such an extrapolation should necessarily be taken with
caution, the simulations in this section serve to highlight the potential value of our estimates for
policymaking. They also allow us to evaluate whether the screening and causal effects of prices are
large, relative to the negative effect of higher prices on the propensity to buy Clorin.
Formally, we will adopt a simple model of Clorin purchase and use that parallels the models
we used for our empirical analysis. Specifically, we will assume that the probability of purchasing
Clorin is given by
Pr (bi = 1) = 1−piv
(5)
where the slope parameter 1v is estimated from our demand data in table 5.40 We will assume that
Clorin use among buyers of Clorin is determined by the following equation:
Pr (ui = 1 | bi = 1) = α+ βpi + γ (pi > 0) . (6)
Here, β captures the screening effect of offer prices on self-reported use, estimated in column (1A)
of table 6. The parameter γ captures the causal effect of positive transaction prices on subsequent
use, and is estimated in column (2B) of table 8. Consistent with our empirical evidence, we will
assume no causal effect of prices beyond the contrast between positive prices and free distribution.
Finally, we will fit the intercept α to equalize average use in our sample with average predicted use
according to model (6).
Note that, although we estimate β and γ using variation in offer and transaction prices, respec-
40For greater consistency with the model, we use estimates from a specification in which we restrict the constantterm to be unity, but this assumption is immaterial to the findings in this section.
38

tively, for the purposes of our policy analysis we will assume that the Clorin distributor charges a
single price pi that serves as both the offer and transaction price. This is the first way in which
our policy simulation makes inferences out-of-sample, in the sense of predicting behavior in cases
not directly observed in our experiment.
The model in equations (5) and (6) also implicitly assumes that the parameters from our study
can be used to estimate behavior at offer prices above 800 Kw and below 300 Kw, although our
study did not include such prices. Despite the fact that the linear models we estimate provide a good
in-sample fit to the behaviors we measure, caution must necessarily be taken in assuming that the
same functional relationships hold outside the range of experimental variation. This caveat holds
especially for the impact of offer prices below 300 Kw, because households that refused to purchase
Clorin from us at 300 Kw were, by definition, excluded from our transaction price randomization.
We therefore cannot be sure that these households would respond to variation in the transaction
price in the same fashion as the households that are willing to pay 300 Kw or more for Clorin, for
whom we have in-sample evidence of the effect of the act of paying and the amount paid on the
propensity to use Clorin.
We will further assume for the purposes of our simulation that non-buyers of Clorin do not
use the product. Because Clorin is widely available in retail stores in Lusaka, this assumption is
counterfactual. However, it allows us to more nearly approximate what would happen if the market
price of Clorin itself, rather than the price of Clorin through a door-to-door delivery, were to vary.
Using our estimates to predict the effects of a permanent change in the market price of Clorin
requires two further caveats. First, our experiment varied the door-to-door price of Clorin without
changing either the retail price or the future price of the product. This means that part of the
effect of raising the price of Clorin on the probability of purchase comes from substitution away
from purchases from retail outlets, or from future purchases. By contrast, a permanent, market-
wide change in the price of Clorin would vary all prices simultaneously, which means that the
only substitution effect in such a case would be from buying Clorin to not buying Clorin at all.
Qualitatively, this means that the demand parameter we estimate in equation (5) is likely to
overstate the effects of an increase in the market price of Clorin on Clorin sales, a bias that would
lead us to understate the case for high prices.
39

The second, related, caveat is that a permanent change in the price of Clorin would lead to a
reduction of current use, because the shadow price of replacing Clorin would rise as a result of the
increase in future prices. Because we took care to offer a one-time purchase only, our experiment
does not include such effects. This fact is useful for isolating screening and causal effects of prices,
but also means that our results may omit a negative effect of future prices on current use that
would be present in the case of an economy-wide price change. This could lead us to overstate the
case for high prices, and would therefore tend to work against our overestimation of the effect of
price on purchases.
Taken together, then, the likely effect of ignoring the permanence and breadth of an economy-
wide price change on our estimates is ambiguous, because the two potential biases we outline above
work in opposite directions. This suggests that caution is needed in extrapolating our results to
counterfactual effects of policy changes. However, our estimates provide important information on
the underlying economic principles at work in the market for Clorin, and aggregating them through
a policy simulation allows us to demonstrate the economic significance of the screening and causal
effects of prices, relative to the negative effect of higher prices on the propensity to buy Clorin.
Figure 6 presents the results of our simulation. The top line presents the results of the fully
specified model. Consistent with our findings on the causal effect of prices, the model predicts
that moving from free distribution to a price of 100 Kw induces an increase in usage of around 6.5
percentage points. Thereafter, use tends to decline with price, but this decline is relatively gradual
because of the screening effects we estimate. In other words, although our demand estimates suggest
that an increase in price of 100 Kw reduces purchases by 7 percentage points, our screening evidence
indicates that many of those who do not purchase as a result of higher prices would not have used
the product anyway. As a result of the screening effect, then, we find that usage with positive
prices does not decline below the level of usage with free distribution until the price exceeds 700
Kw per bottle of Clorin.
Our model shows that the use-maximizing price of Clorin is around 100 or 200 Kw.41 However,
it also shows that use at 700 Kw is similar to use given free distribution. This implies that a
41To be more precise, the model implies that the use-maximizing price is 220 Kw, but predicted use at this priceis essentially identical to predicted use at 100 Kw. The slight difference between the two results from the quadraticcurvature implied by multiplying the linear models for demand and use in equations (5) and (6), respectively.
40

distributor with even an arbitrarily small concern for revenue (or ability to translate revenue into
additional usage through advertising and other methods) would prefer to charge 700 Kw rather
than distributing the product for free, a striking result given the prevailing retail price of around
800 Kw.
The second line in figure 6 highlights the role of screening by setting β = 0 while leaving all
other parameters unchanged. In this case, only the causal effect of prices works against the effect of
price on purchases. We therefore find that only prices between 100 and 200 Kw achieve use greater
than or equal to use under free distribution; to justify higher prices rather than free distribution,
a nontrivial concern for revenue would be necessary. The sharp differences between this case and
our baseline case with screening highlight the quantitative importance of our screening results.
The final line in figure 6 “turns off” the causal effect of prices by setting γ = 0. In this case, the
effect of price on use comes solely through the demand curve (5), and therefore shows a fairly steep,
linear decline in use as prices are increased. Contrasting this case with our baseline case shows that
the screening and causal effects of prices interact to generate important policy advice. In particular,
when both screening and causal effects are operating, even prices close to the prevailing retail price
can be charged with little or no loss in usage relative to free distribution. By contrast, charging
such prices in the absence of the price effects we estimate would lead to 50 percent lower use than
free distribution. This contrast suggests that understanding the screening and causal effects of
prices on product use is a critical step in resolving the ongoing debate over the pricing of health
products in the developing world.
6 Conclusions
Efficient social programs must target their benefits to the most needy recipients in order to maximize
their impact. With benefits that come in-kind–in the form of products or services–a critical
targeting issue is identifying households that will actually use the benefit in question. Our research
shows that pricing can be an effective tool for identifying those households. In a field experiment
in Lusaka, Zambia, we find that households agreeing to buy a water purification solution at higher
prices are much more likely to use the product after purchasing it. We also find some evidence that
41

the act of paying influences, over and above the selection effects on the composition of households
receiving the product. However, we find that, conditional on paying, increases in the amount paid
do not increase product usage. These findings have important implications for economics and
psychology, and for both private- and public-sector industries in which product use is an important
input to firms’ objectives.
Simulations from a simple model suggest that our findings are quantitatively important for
optimal pricing policy. Our model implies that prices close to the prevailing retail price can be
charged with little or no reduction in usage relative to free distribution. While lower prices would
lead to higher use, these findings imply that even an arbitrarily small concern for revenue generation
(or an ability to translate greater revenues into greater product usage) would be sufficient to make
free distribution suboptimal from the perspective of maximizing product usage. These policy
simulations suggest that understanding the screening and causal effects of prices on product use is
a crucial input to resolving the ongoing debate over the pricing of social programs, especially in
the developing world.
Our findings also have broader implications about the psychological effects of prices on product
use. Contrary to previous studies on the sunk cost effect, we find no evidence that higher prices lead
to greater use. However, we do find some evidence that charging a positive price results in greater
use than giving away the product for free, an effect that is especially strong for households that
seem susceptible to the sunk cost effect and psychologically related mechanisms, as measured by
attitudinal surveys. The finding that survey instruments can help to account for the heterogeneity
in the effects of prices on product use may have strategic implications for organizations wishing to
predict the effect of prices on usage among a population of consumers.
42

References
[1] Eric T. Anderson and Duncan I. Simester. Effects of $9 dollar price endings on retail sales:Evidence from field experiments. Quantitative Marketing and Economics, 1:93—110, 2003.
[2] Dan Ariely and Kristina Shampan’er. Tradeoffs between costs and benefits: lessons from the"price of zero". MIT Mimeograph, 2004.
[3] Hal R. Arkes and Catherine Blumer. The psychology of sunk cost. Organizational behaviorand human decision processes, 35:124—140, 1985.
[4] Nava Ashraf. Spousal control and intra-household decision making: An experimental study inthe Philippines. Harvard Business School Mimeograph, 2005.
[5] Nava Ashraf, Dean Karlan, and Wesley Yin. Tying Odysseus to the mast: Evidence from acommitment savings product in the Philippines. Quarterly Journal of Economics, 121(2):635—672, May 2006.
[6] Jere R. Behrman. The simple analytics of contraceptive social marketing. World Development,17(10):1499—1521, 1989.
[7] Hilary Benn. Meeting our promises in poor countries. Speech to the London School of Hygieneand Tropical Medicine, June 15 2006.
[8] Marianne Bertrand, Dean Karlan, Sendhil Mullainathan, Eldar Shafir, and Jonathan Zinman.What’s psychology worth? a field experiment in the consumer credit market. NBER WorkingPaper No. 11892, December 2005.
[9] Charles Blackorby and David Donaldson. Cash versus kind, self-selection, and efficient trans-fers. American Economic Review, 78(4):691—700, September 1988.
[10] Cheryl A. Casper. Pricing policy for library services. Journal of the American Society forInformation Science, 30(5):304—309, September 1979.
[11] P. A. Diamond and J. A. Mirrlees. A model of social insurance with variable retirement.Journal of Public Economics, 10:295—336, 1978.
[12] Ronald A. Dye and Rick Antle. Cost-minimizing welfare programs. Journal of Public Eco-nomics, 30:259—265, 1986.
[13] Erik Eyster. Rationalizing the past: A taste for consistency. Nuffield College Mimeograph,November 2002.
[14] United Nations Economic Commission for Africa. The statistical estima-tion of poverty duration and transitions in zambia. Mimeograph, 2006.http://www.uneca.org/eca_programmes/srdc/sa/publications/Statistical-Estimation.pdf.
[15] Daniel Friedman, Kai Pommerenke, Rajan Lukose, Garrett Milam, and Bernardo Huberman.Searching for the sunk cost fallacy. University of California, Santa Cruz Mimeograph, 2004.
[16] Lorenz F. Goette, David Huffman, and Ernst Fehr. Loss aversion and labor supply. IZADiscussion Paper No. 927, November 2003.
43

[17] John Gourville and Dilip Soman. Pricing and the psychology of consumption. Harvard BusinessReview, pages 90—96, September 2002.
[18] Michael Grossman. On the concept of health capital and the demand for health. Journal ofPolitical Economy, 80(2):223—255, 1972.
[19] Glenn W. Harrison and John A. List. Field experiments. Journal of Economic Literature,42:1009—1055, December 2004.
[20] Barbara A. Hauser. Drinking Water Chemistry: A Laboratory Manual. Lewis Publishers, BocaRaton, FL, 2002.
[21] Dean Karlan. Using experimental economics to measure social capital and predict financialdecisions. American Economic Review, 95(5):1688—1699, December 2005.
[22] Dean Karlan and John List. Does price matter in charitable giving? evidence from a large-scalenatural field experiment. Yale University Mimeograph, 2006.
[23] Dean Karlan and Jonathan Zinman. Observing unobservables: Identifying information asym-metries with a consumer credit field experiment. Yale University Working Paper, June 2006.
[24] Philip Kotler and Eduardo L. Roberto. Social marketing: Strategies for changing public be-havior. The Free Press, New York, 1989.
[25] Michael Kremer, Jessica Leino, Edward Miguel, and Alix Peterson Zwane. Spring cleaning:Results from a randomized evaluation of source water quality improvement. Harvard UniversityMimeograph, 2006.
[26] Michael Kremer and Edward Miguel. The illusion of sustainability. Quarterly Journal ofEconomics, 2006. Forthcoming.
[27] Steven D. Levitt and John A. List. What do laboratory experiments tell us about the realworld? University of Chicago mimeograph, June 2006.
[28] Jennie I. Litvack and Claude Bodart. User fee plus quality equals improved access to healthcare: Results of a field experiment in cameroon. Social Science and Medicine, 37(3):369—383,1993.
[29] Donald G. McNeil Jr. A program to fight malaria in Africa draws questions. New York Times,June 11 2005.
[30] Dominique Meekers. The implications of free and commercial distribution for condom use:Evidence from cameroon. PSI Research Division Working Paper No. 9, 1997.
[31] Saul S. Morris, Calogero Carletto, John Hoddinott, and Luc J M Christiaensen. Validity ofrapid estimates of household wealth and income for health surveys in rural Africa. Journal ofepidemiology and community health, 54(5):381—387, 2000.
[32] Christopher J. L. Murray and Alan D. Lopez. Global Burden of Disease: A comprehensiveassessment of mortality and disability from diseases, injuries, and risk factors in 1990 andprojected to 2020. Harvard University Press, Cambridge, MA, August 1996.
[33] Joseph P. Newhouse. Toward a theory of nonprofit institutions: An economic model of ahospital. American Economic Review, 60(1):64—74, 1970.
44

[34] Albert L. Nichols and Richard J. Zeckhauser. Targeting transfers through restrictions onrecipients. American Economic Review, 72(2):372—377, May 1982.
[35] Lynnette Olembo, FAD Kaona, Mary Tuba, and Gilbert Burnham. Safe water systems: Anevaluation of the Zambia Clorin program. Johns Hopkins University Mimeograph, September2004.
[36] Sharon M. Oster. Strategic management for nonprofit organizations: Theory and cases. OxfordUniversity Press, Oxford, 1995.
[37] Sharon M. Oster, Charles M. Gray, and Charles Weinberg. Pricing in the nonprofit sector.In Dennis R. Young, editor, Effective economic decision-making for nonprofit organizations,chapter 2, pages 27—46. Foundation Center, New York, December 2003.
[38] Donald O. Parsons. Self-screening in targeted public transfer programs. Journal of PoliticalEconomy, 99(4):859—876, August 1991.
[39] Canice Prendergast and Lars Stole. Impetuous youngsters and jaded old-timers: Acquiring areputation for learning. Journal of Political Economy, 104(6):1105—1134, December 1996.
[40] PSI. What is social marketing? http://www.psi.org/resources/pubs/what_is_SM.html, 2006.
[41] Robert E. Quick, Akiko Kimura, Angelica Thevos, Mathias Tembo, Isidore Shamputa, LoriHutwagner, and Eric Mintz. Diarrhea prevention through household-level water disinfectionand safe storage in Zambia. American Journal of Tropical Medicine and Hygiene, 66(5):584—589, 2002.
[42] Baba Shiv, Ziv Carmon, and Dan Ariely. Consumers may get what they pay for: Placeboeffects of marketing actions. Journal of Marketing Research, 62:383—393, November 2005.
[43] Richard Steinberg and Burton A. Weisbrod. Pricing and rationing by nonprofit organizationswith distributional objectives. In Burton A. Weisbrod, editor, To Profit or Not to Profit:The commercial transformation of the nonprofit sector, chapter 4, pages 64—82. CambridgeUniversity Press, Cambridge, UK, September 1998.
[44] Richard Thaler. Toward a positive theory of consumer choice. Journal of Economic Behaviorand Organization, 1(1):39—60, March 1980.
[45] Angelica K. Thevos, Sonja J. Olsen, Josefa M. Rangel, Fred A. D. Kaona, Mathias Tembo, andRobert E. Quick. Social marketing and motivational interviewing as community interventionsfor safe water behaviors: Follow-up surveys in Zambia. International Quarterly of CommunityHealth Education, 21(1):51—65, 2002-2003.
[46] Rebecca Thornton. The demand for and impact of learning HIV status: Evidence from a fieldexperiment. University of Michigan Mimeograph, 2006.
[47] USAID. Lack of access to clean drinking water and proper sanitation is a growing challenge.http://www.usaid.gov/locations/sub-saharan_africa/features/worldwaterday06.html, 2006.
[48] William S. Vickrey. Pricing in urban and suburban transport. American Economic Review,53(2):452—465, May 1963.
45

Figure 1 A bottle of Clorin
46

Figure 2 Sample coupon from door-to-door marketing
600
Notes: Figure shows a sample discount coupon from door-to-door marketing experiment. Coupon shows thefinal price at which the bottle transacted.
47

Figure 3 The effect of offer price on purchase of Clorin
N=104
N=177
N=178
N=189
N=177
N=179
0
0.1
0.2
0.3
0.4
0.5
0.6
0.7
0.8
0.9
300 400 500 600 700 800
Offer price (Kw)
Shar
e pu
rcha
sing
Clo
rin
Notes: Figure shows share of households purchasing Clorin in door-to-door marketing intervention, at dif-ferent offer prices (in Zambian Kwacha). Reported N indicates total number of households facing each offerprice.
48

Figure 4 Usage rates of Clorin by offer price
0
0.1
0.2
0.3
0.4
0.5
0.6
0.7
300 400 500 600 700 800
Offer price (Kw)
Shar
e of
buy
ers
usin
g C
lorin
at f
ollo
w-u
p
Notes: Figure shows coefficients from a regression of self-reported Clorin use at follow-up on dummies foroffer price, with fixed effects for transaction price, for those households who purchased Clorin in our door-to-door marketing exercise. Coefficient on omitted category (offer price = 300 Kw) is normalized so thatpredicted share at mean offer price is equal to the overall share using Clorin.
49

Figure 5 Usage rates of Clorin by transaction price
0.45
0.47
0.49
0.51
0.53
0.55
0.57
0 100 200 300 400 500-700
Transaction Price (Kw)
Shar
e of
buy
ers
usin
g C
lorin
at f
ollo
w-u
p
Notes: Figure shows coefficients from a regression of self-reported Clorin use at follow-up on dummies fortransaction price, with fixed effects for offer price, for those households who purchased Clorin in our door-to-door marketing exercise. Coefficient on omitted category (transaction price = 0 Kw) is normalized so thatpredicted share at mean transaction price is equal to the overall share using Clorin. Cells with transactionprice of 500, 600, and 700 Kw have been aggregated to improve precision.
50

Figure 6 Simulated effects of alternative pricing strategies
0
0.1
0.2
0.3
0.4
0 200 400 600 800 1000 1200 1400
Price (Kw)
Shar
e of
hou
seho
lds
usin
g C
lorin
Baseline No screening effect No screening or causal effect
Notes: Figure shows predictions based on estimated demand and usage models as described in section 5.“Baseline” model assumes that non-buyers do not use Clorin. “No screening effect” model assumes that usagerates are unaffected by offer price. “No screening or causal effect” model further assumes that transactionprices do not affect usage.
51

Table 1 Demographic characteristics of the baseline sample
(1) (2) (3)Source Baseline survey Baseline survey DHSSample All Ages 15-49 Ages 15-49Age 32.8257 30.1593 27.1425
(0.3130) (0.2254) (0.2948)
Years of completed schooling 6.6418 7.0285 7.2379(0.1013) (0.1013) (0.1209)
Married? 0.8000 0.8327 0.5642(0.0113) (0.0111) (0.0170)
Currently pregnant? 0.1143 0.1254 0.0754(0.0090) (0.0099) (0.0091)
Total number of living children 3.1867 2.9484 2.1932(0.0630) (0.0614) (0.0791)
Number of children in household under age 5 0.9619 0.9875 1.1767(0.0245) (0.0253) (0.0365)
Household owns a radio? 0.5540 0.5721 0.6266(0.0140) (0.0148) (0.0166)
Household owns a television? 0.4992 0.5151 0.5501(0.0141) (0.0149) (0.0171)
Household owns a refrigerator? 0.1905 0.1940 0.2686(0.0111) (0.0118) (0.0152)
Household owns a bicycle? 0.1000 0.1077 0.1213(0.0085) (0.0092) (0.0112)
Household owns a motorcycle? 0.0008 0.0009 0.0012(0.0008) (0.0009) (0.0012)
Household owns a car? 0.0230 0.0258 0.0836(0.0042) (0.0047) (0.0095)
Number of observations 1260 1124 849Notes: Table shows means of variables, with standard errors in parentheses. Columns (1) and (2) use datafrom our baseline survey. Column (3) uses data on Lusaka residents from the 2001 Demographic and HealthSurvey (DHS) of Zambia. Actual number of observations in columns (1) and (2) varies slightly acrossvariables due to questionnaire refusals.
52

Table 2 Distribution of offer and transaction prices
Offer Price (Kw)300 400 500 600 700 800 Total
Number of participants 226 227 227 227 227 126 1260(percent of all participants) (17.94) (18.02) (18.02) (18.02) (18.02) (10.00) (100)
Transaction Price (Kw):
0 90 90 90 90 90 50 500(39.82) (39.65) (39.65) (39.65) (39.65) (39.68) (39.68)
100 67 45 34 27 22 10 205(29.65) (19.82) (14.98) (11.89) (9.69) (7.94) (16.27)
200 69 46 34 27 23 11 210(30.53) (20.26) (14.98) (11.89) (10.13) (8.73) (16.67)
300 – 46 34 28 23 11 142(20.26) (14.98) (12.33) (10.13) (8.73) (11.27)
400 – – 35 27 23 11 96(15.42) (11.89) (10.13) (8.73) (7.62)
500 – – – 28 23 11 62(12.33) (10.13) (8.73) (4.92)
600 – – – – 23 11 34(10.13) (8.73) (2.7)
700 – – – – – 11 11(8.73) (0.87)
Notes: The first section of the table shows the distribution of participants across offer prices, with percent oftotal in parentheses. The remaining rows show the distribution of transaction prices conditional on a givenoffer price, with conditional percentages in parentheses. For example, the cell listed under an offer price of300 Kw and a transaction price of 200 Kw should be read to say that 69 households received an offer priceof 300 Kw and a transaction price of 200 Kw, and that these 69 households represent 30.53 percent of thehouseholds receiving an offer price of 300 Kw.
53
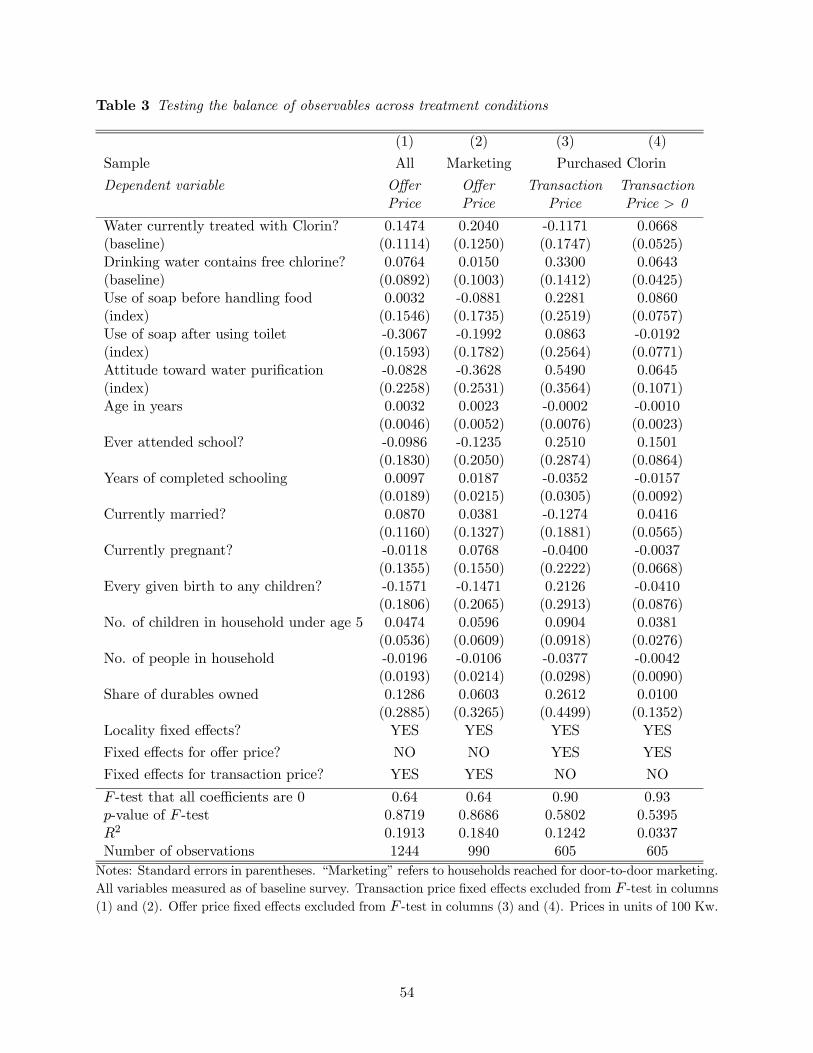
Table 3 Testing the balance of observables across treatment conditions
(1) (2) (3) (4)
Sample All Marketing Purchased Clorin
Dependent variable Offer Offer Transaction TransactionPrice Price Price Price > 0
Water currently treated with Clorin? 0.1474 0.2040 -0.1171 0.0668(baseline) (0.1114) (0.1250) (0.1747) (0.0525)Drinking water contains free chlorine? 0.0764 0.0150 0.3300 0.0643(baseline) (0.0892) (0.1003) (0.1412) (0.0425)Use of soap before handling food 0.0032 -0.0881 0.2281 0.0860(index) (0.1546) (0.1735) (0.2519) (0.0757)Use of soap after using toilet -0.3067 -0.1992 0.0863 -0.0192(index) (0.1593) (0.1782) (0.2564) (0.0771)Attitude toward water purification -0.0828 -0.3628 0.5490 0.0645(index) (0.2258) (0.2531) (0.3564) (0.1071)Age in years 0.0032 0.0023 -0.0002 -0.0010
(0.0046) (0.0052) (0.0076) (0.0023)Ever attended school? -0.0986 -0.1235 0.2510 0.1501
(0.1830) (0.2050) (0.2874) (0.0864)Years of completed schooling 0.0097 0.0187 -0.0352 -0.0157
(0.0189) (0.0215) (0.0305) (0.0092)Currently married? 0.0870 0.0381 -0.1274 0.0416
(0.1160) (0.1327) (0.1881) (0.0565)Currently pregnant? -0.0118 0.0768 -0.0400 -0.0037
(0.1355) (0.1550) (0.2222) (0.0668)Every given birth to any children? -0.1571 -0.1471 0.2126 -0.0410
(0.1806) (0.2065) (0.2913) (0.0876)No. of children in household under age 5 0.0474 0.0596 0.0904 0.0381
(0.0536) (0.0609) (0.0918) (0.0276)No. of people in household -0.0196 -0.0106 -0.0377 -0.0042
(0.0193) (0.0214) (0.0298) (0.0090)Share of durables owned 0.1286 0.0603 0.2612 0.0100
(0.2885) (0.3265) (0.4499) (0.1352)Locality fixed effects? YES YES YES YES
Fixed effects for offer price? NO NO YES YES
Fixed effects for transaction price? YES YES NO NO
F -test that all coefficients are 0 0.64 0.64 0.90 0.93p-value of F -test 0.8719 0.8686 0.5802 0.5395R2 0.1913 0.1840 0.1242 0.0337Number of observations 1244 990 605 605Notes: Standard errors in parentheses. “Marketing” refers to households reached for door-to-door marketing.All variables measured as of baseline survey. Transaction price fixed effects excluded from F -test in columns(1) and (2). Offer price fixed effects excluded from F -test in columns (3) and (4). Prices in units of 100 Kw.
54

Table 4 Determinants of sample attrition
(1) (2) (3) (4)Sample All Marketing Purchased ClorinDependent variable Marketing Follow-up Follow-up Follow-upOffer price (100 Kw) 0.0021 0.0022
(0.0073) (0.0069)Transaction price (100 Kw) -0.0031 0.0063
(0.0068) (0.0080)Transaction price > 0 0.0325
(0.0267)Water currently treated with Clorin? 0.0074 -0.0122 -0.0092 -0.0121(baseline) (0.0302) (0.0267) (0.0338) (0.0338)Drinking water contains free chlorine? 0.0269 0.0152 -0.0057 -0.0057(baseline) (0.0242) (0.0214) (0.0274) (0.0273)Use of soap before handling food 0.0355 -0.0131 0.0004 -0.0010(index) (0.0420) (0.0371) (0.0487) (0.0487)Use of soap after using toilet -0.0268 -0.0069 -0.0231 -0.0220(index) (0.0434) (0.0381) (0.0496) (0.0495)Attitude toward water purification 0.0508 0.0965 0.0838 0.0852(index) (0.0613) (0.0541) (0.0690) (0.0689)Age in years 0.0016 0.0022 0.0034 0.0035
(0.0013) (0.0011) (0.0015) (0.0015)Ever attended school? -0.0063 -0.0224 -0.0035 -0.0068
(0.0498) (0.0438) (0.0556) (0.0557)Years of completed schooling -0.0052 0.0028 0.0078 0.0081
(0.0051) (0.0046) (0.0059) (0.0059)Currently married? 0.0317 0.0214 0.0811 0.0789
(0.0314) (0.0283) (0.0364) (0.0364)Currently pregnant? -0.0085 0.0215 -0.0410 -0.0412
(0.0369) (0.0331) (0.0430) (0.0429)Every given birth to any children? -0.0447 -0.0033 -0.0242 -0.0215
(0.0490) (0.0441) (0.0563) (0.0563)No. of children in household under age 5 0.0133 0.0044 -0.0105 -0.0112
(0.0145) (0.0130) (0.0178) (0.0178)No. of people in household 0.0074 0.0109 0.0121 0.0120
(0.0053) (0.0046) (0.0058) (0.0058)Share of durables owned 0.1763 0.0638 0.0020 0.0033
(0.0784) (0.0697) (0.0870) (0.0869)Locality fixed effects? YES YES YES YESFixed effects for offer price? NO NO YES YESFixed effects for transaction price? NO YES NO NOF -test that all coefficients are 0 2.05 1.61 1.50 1.50p-value of F -test 0.0060 0.0512 0.0837 0.0833Number of observations 1244 990 605 605Notes: Standard errors in parentheses. “Marketing” refers to households reached for door-to-door marketing.“Purchased Clorin” refers to households that purchased Clorin during door-to-door marketing. All variablesmeasured as of baseline survey. Offer price and transaction price variables excluded from F -tests.
55

Table 5 Estimates of the demand for Clorin
Dependent variable: Household purchased Clorin (dummy)(1) (2) (3) (4) (5)
Sample All All All Follow-up All
Offer price -0.0664 -0.0653 -0.0656 -0.0708 -0.0704(100 Kw) (0.0093) (0.0094) (0.0091) (0.0099) (0.0097)
Transaction price 0.0128(100 Kw) (0.0089)
Constant 0.9640 – – 0.9892 0.9646(0.0516) (0.0547) (0.0516)
Baseline controls? NO YES NO NO NO
Fixed effects for marketer? NO NO YES NO NO
R2 0.0484 0.0733 0.0954 0.0548 0.0504Number of observations 1004 990 1004 890 1004Notes: Standard errors are in parentheses. Estimates are from linear probability models. “Baseline controls”includes baseline Clorin usage and water chlorination, general health behaviors and attitudes, householddemographics, and locality fixed effects, as in table 3.
56

Table 6 The effect of offer price on the usage rates of buyers
Panel A: Screening on subsequent use of Clorin(1A) (2A)
Dependent variable Water currently treated Drinking water containswith Clorin? free chlorine?
(follow-up; self-reported) (follow-up; measured)
Offer price 0.0373 0.0321(100 Kw) (0.0149) (0.0150)
Transaction price fixed effects? YES YES
R2 0.0254 0.0191Number of observations 546 542
Panel B: Screening conditional on baseline demographics(1B) (2B)
Dependent variable Water currently treated Drinking water containswith Clorin? free chlorine?
(follow-up; self-reported) (follow-up; measured)
Offer price 0.0327 0.0293(100 Kw) (0.0150) (0.0149)
Transaction price fixed effects? YES YES
Baseline demographics? YES YES
R2 0.0596 0.0827Number of observations 537 533
Panel C: Screening conditional on baseline usage(1C) (2C)
Dependent variable Water currently treated Drinking water containswith Clorin? free chlorine?
(follow-up; self-reported) (follow-up; measured)
Offer price 0.0342 0.0323(100 Kw) (0.0147) (0.0149)
Transaction price fixed effects? YES YES
Baseline usage? YES YES
R2 0.0534 0.0362Number of observations 546 542
Notes: Standard errors are in parentheses. Estimates are from linear probability models with fixed effects fortransaction price, estimated on the sample of households who purchased Clorin in the door-to-door marketingintervention and who were reached for the follow-up survey. “Baseline demographics” includes measures ofage, schooling, marital status, pregnancy, household composition, wealth, and locality fixed effects, as intable 3. “Baseline usage” includes baseline Clorin usage and water chlorination.
57

Table 7 The effect of offer price on the baseline characteristics of buyers
Dependent variable Effect of offer price (100Kw) N
Panel A: Screening on baseline use of Clorin
(1) Water currently treated with Clorin? 0.0137 614(self-reported) (0.0105)
(2) Drinking water contains free chlorine? 0.0095 614(measured) (0.0124)
(3) Predicted self-reported use in follow-up 0.0056 600(0.0027)
Panel B: Screening on household wealth and education
(6) Share of durables owned 0.0016 614(0.0043)
(7) Ever attended school? 0.0007 614(0.0088)
(8) Years of completed schooling 0.0701 613(index) (0.0926)
Panel C: Screening on health benefits of Clorin
(9) Number of children under age 5 0.0129 614(0.0203)
(10) Any child under 5 had diarrhea in 0.0001 480last two weeks? (0.0109)
(11) Respondent is pregnant? 0.0009 614(0.0078)
Notes: Standard errors in parentheses. Estimates are from OLS regressions with fixed effects for transactionprice, estimated on the sample of households who purchased Clorin in the door-to-door marketing interven-tion. All dependent variables measured as of the baseline survey. Predicted self-reported use in follow-upis predicted by regressing use in follow-up survey on dummies for self-reported Clorin use and measuredchlorination, as well as an index of the recency of the last use of Clorin and the number of bottles of Clorinin the household, all estimated as of the baseline survey.
58

Table 8 The effect of transaction price on the usage rate of buyers
Panel A: No controls(1A) (2A) (3A) (4A)
Dependent variable Water currently treated Drinking water containswith Clorin? free chlorine?
(follow-up; self-reported) (follow-up; measured)
Transaction price 0.0197 0.0024(100 Kw) (0.0134) (0.0135)
Transaction price > 0 0.0935 0.0587(0.0440) (0.0444)
Offer price fixed effects? YES YES YES YES
R2 0.0211 0.0253 0.0086 0.0118No. of observations 546 546 542 542
Panel B: Baseline controls(1B) (2B) (3B) (4B)
Dependent variable Water currently treated Drinking water containswith Clorin? free chlorine?
(follow-up; self-reported) (follow-up; measured)
Transaction price 0.0097 -0.0071(100 Kw) (0.0133) (0.0133)
Transaction price > 0 0.0565 0.0318(0.0442) (0.0440)
Offer price fixed effects? YES YES YES YES
Baseline controls? YES YES YES YESR2 0.1027 0.1046 0.1130 0.1134No. of observations 537 537 533 533
Notes: Standard errors are in parentheses. Estimates are from linear probability models with fixed effectsfor offer price, estimated on the sample of households who purchased Clorin in the door-to-door marketingintervention and who were reached for the follow-up survey. “Baseline controls” includes baseline Clorinusage and water chlorination, general health behaviors and attitudes, household demographics, and localityfixed effects, as in table 3.
59

Table 9 Mechanisms for the causal effect of prices
Independent variable: Transaction price > 0Sample Water currently treated N Drinking water contains N
with Clorin? free chlorine?(follow-up; self-reported) (follow-up; measured)
Does respondent display the sunk cost effect in hypothetical choices?
(1) Yes 0.1840 113 0.0816 112(0.1002) (0.1027)
(2) No 0.0372 424 0.0240 421(0.0499) (0.0492)
Difference 0.1468 0.0576(0.1144) (0.1133)
Does respondent strongly agree that "I value something more if I paid for it"?
(3) Yes 0.1263 286 0.0525 283(0.0625) (0.0636)
(4) No 0.0125 251 0.0003 250(0.0656) (0.0640)
Difference 0.1138 0.0522(0.0905) (0.0903)
Is respondent married?
(5) Yes 0.1020 444 0.0607 442(0.0484) (0.0487)
(6) No -0.1458 93 -0.1538 91(0.1152) (0.1111)
Difference 0.2479 0.2146(0.1254) (0.1252)
Notes: Standard errors are in parentheses. Estimates are from linear probability models with fixed effectsfor offer price, estimated on the sample of households who purchased Clorin in the door-to-door marketingintervention, who were reached for the follow-up survey, and who fall into the specified categories. Allspecifications include controls for baseline Clorin usage and water chlorination, general health behaviors andattitudes, household demographics, and locality fixed effects, as in table 3.
60

Table 10 Longer-term effects of prices on Clorin use
(1) (2) (3) (4) (5) (6)
Dependent variable Water currently treated Drinking water contains morewith Clorin? free chlorine than source water?
(2nd follow-up; self-reported) (2nd follow-up; measured)
Offer price -0.0105 -0.0135(100 Kw) (0.0145) (0.0140)
Transaction price -0.0007 0.0109(100 Kw) (0.0124) (0.0121)
Transaction price > 0 0.0582 0.0852(0.0420) (0.0409)
Transaction price fixed effects? YES NO NO YES NO NO
Offer price fixed effects? NO YES YES NO YES YES
Baseline controls? NO YES YES NO YES YES
R2 0.0146 0.1214 0.1249 0.0190 0.1136 0.1200Number of observations 513 506 506 513 506 506Notes: Standard errors are in parentheses. Estimates are from linear probability models estimated on thesample of households who purchased Clorin in the door-to-door marketing intervention and who were reachedfor the second follow-up survey. “Baseline controls” includes baseline Clorin usage and water chlorination,general health behaviors and attitudes, household demographics, and locality fixed effects, as in table 3.
61