Embed Size (px)
Citation preview
ww
w.w
orld
com
mer
cere
view
.com
Klaas Lenaerts, Simone Tagliapietra and Guntram B Wolff explore whether decarbonisation and economic
growth are compatible to reach net zero by 2050
Can climate change be tackled without ditching
economic growth?
ww
w.w
orld
com
mer
cere
view
.com
Higher levels of economic activity tend to go hand-in-hand with additional energy use and consumption of natural resources. As fossil fuels still account for 80 percent of the global energy mix, energy consumption remains closely related to greenhouse gas emissions and hence to climate forcing.
This paper explores whether decarbonisation and economic growth are compatible or whether the world economy needs to grow less to be able to reduce greenhouse gas emissions fast enough to reach net zero in 2050. The literature provides profoundly different answers to this question, with scholars positioning along a spectrum that extends from the most optimist version of ‘green growth’ theories to sceptical ‘degrowth’ theories.
While globally, CO2 emissions per unit of GDP are declining, the decoupling rate from 1995 to 2018 was only -1.8 percent annually. To achieve net zero by 2050, the rate would have to accelerate to -8.7 percent, assuming population and GDP growth projections as given, or by a factor of almost five.
To keep GDP growth and population at their projections and thus reject the proposition of degrowth, decoupling would have to accelerate massively. Two avenues are crucial: reducing the energy intensity of production and/or the emissions intensity of energy.
The huge fall in the price of renewable energy provides hope that decoupling can accelerate. Decoupling rates have accelerated in the last decade and decoupling is substantially faster in the European Union. In the EU, we estimate that decoupling only has to accelerate by a factor of 2.5.
We do not think degrowth propositions advanced in the literature will be pursued and therefore focus on the main challenges that must be tackled to achieve decoupling. Unprecedented efforts are required to achieve green growth. But hoping for humanity to sacrifice growth appears unrealistic.
ww
w.w
orld
com
mer
cere
view
.com
1 IntroductionClimate change is one of the most pressing issues of our time. The science is clear: human activities have already caused approximately 1°C of global warming and at current rates will likely cause 1.5°C of global warming above pre-industrial levels between 2030 and 2050 (IPCC, 2018).
With the Paris Agreement, governments have committed to limiting the temperature increase to well below 2°C above pre-industrial levels and to pursuing efforts to limit it to 1.5°C (UNFCCC, 2015). Keeping global warming below this limit will require global greenhouse gas (GHG) emissions to quickly decline by at least 45 percent from 2010 levels by 2030, and to reach net-zero by 2050, with negative emissions thereafter (IPCC, 2018).
Economic growth has historically been the main driver of rising environmental damage and GHG emissions. To achieve such deep emission cuts, the world would have to either decouple global GHG emissions from gross domestic product (GDP) or face deep cuts to GDP.
The numbers we present in sections 2 and 3 are sobering: current projections of global population size and GDP per capita imply that the world must reduce the rate of CO2 emissions per unit of real GDP by around 9 percent per year on average to reach the climate targets described above. Between 1990 and 2016, global emissions per unit of real GDP decreased only by 1.8 percent per year.
Confronted with these facts, scholars disagree about whether humanity can afford continued economic growth. The so-called ‘green growth’ literature is optimistic that suitable policies and technology will reduce emissions to sustainable levels while allowing for continued or even boosted economic growth.

ww
w.w
orld
com
mer
cere
view
.com
This thinking is shared by several governments and institutions. For instance, the European Commission defines its European Green Deal as ‘Europe’s new growth strategy’. Degrowth scholars on the other hand dismiss this and argue that the global economy must be scaled down, and that systemic change and redistribution is necessary to accomplish this and address the “fairy tales of eternal economic growth”, as campaigner Greta Thunberg told world leaders in 20191.
On some level, this academic debate on extreme positions is largely theoretical. Developing countries will want to grow and will implement policies to that effect. The idea of deeper cuts to GDP in rich countries is also theoretical: economic growth is of central importance for welfare and issues such as debt sustainability, pensions and social security.
A shrinking or ‘degrowing’ economy could potentially also exacerbate the distributional implications of decarbonisation that will arise regardless (see for example Markkanen and Anger-Kraavi, 2019).
Yet, the sharp contrast in the theoretical positions of scholars is a way to conceptualise the magnitude of the challenge. Striving for green growth is an imperative, but no one can be certain ex ante that such a path is possible. What is certain is that it cannot happen without some key prerequisites.
It will require massive investment in existing green technologies and in the advancement of new breakthrough technologies, including for negative emissions. It will also require changed behaviour from everyone, and our economies will have to be adapted to deal with the consequences of climate change that can no longer be avoided.
The paper is structured as follows. Section 2 presents the numbers that make clear how significant the problem of decoupling is. Section 3 reviews the literature on degrowth and explains why degrowth proposals are not viable.
ww
w.w
orld
com
mer
cere
view
.com
Section 4 summarises the literature on green growth. Section 5 discusses essential steps for the realisation of green growth. Section 6 concludes with recommendations for policymakers.
2 The challenge of decoupling: the hard numbersPursuing deep decarbonisation will be challenging. Annual global GHG emissions keep rising and show no sign of peaking. In 2019, they were 62 percent higher than in 1990, the year of the first Intergovernmental Panel on Climate Change report, and 4 percent higher than in 2015 when the Paris Agreement was signed (Friedlingstein et al 2020).
Even unprecedented circumstances such as the massive restrictions introduced to contain COVID-19 led only to a 6 percent drop in emissions in 2020, from which a quick rebound to pre-pandemic levels promptly followed (IEA, 2021a).
Historically, economic growth – by which we mean real GDP growth – has long been associated with increasing GHG emissions. Empirically, the causal chain is straightforward: higher levels of economic activity tend to go hand in hand with additional energy use and consumption of natural resources.
Fossil fuels still account for 80 percent of the global energy mix (IEA, 2020), and so energy consumption is closely related to GHG emissions and hence to climate forcing. Expansion of industrial processes, livestock rearing and other agriculture adds to emissions, while deforestation reduces carbon sinks.
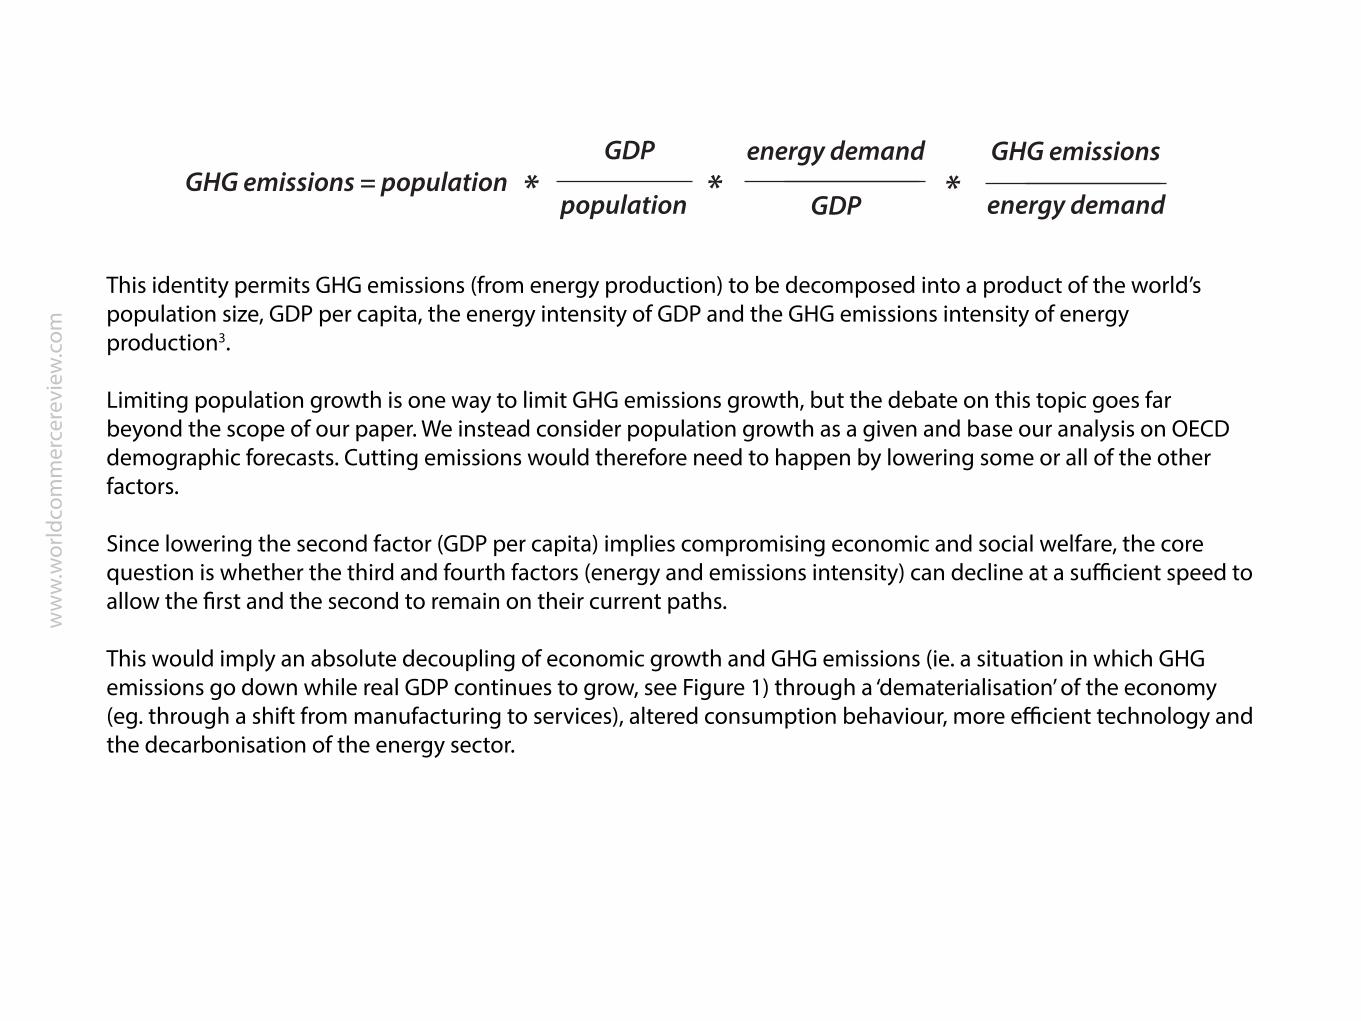
A far-reaching transformation of the global economy is needed to reduce emissions. As 73 percent of global GHG emissions come from energy production (mostly as CO2), most reductions will need to happen in that area2. An interesting way to look at this is by formulating the problem as a simple identity, as done by Kaya and Yokoburi (1998) on the basis of Holdren and Ehrlich (1974):
ww
w.w
orld
com
mer
cere
view
.com
This identity permits GHG emissions (from energy production) to be decomposed into a product of the world’s population size, GDP per capita, the energy intensity of GDP and the GHG emissions intensity of energy production3.
Limiting population growth is one way to limit GHG emissions growth, but the debate on this topic goes far beyond the scope of our paper. We instead consider population growth as a given and base our analysis on OECD demographic forecasts. Cutting emissions would therefore need to happen by lowering some or all of the other factors.
Since lowering the second factor (GDP per capita) implies compromising economic and social welfare, the core question is whether the third and fourth factors (energy and emissions intensity) can decline at a sufficient speed to allow the first and the second to remain on their current paths.
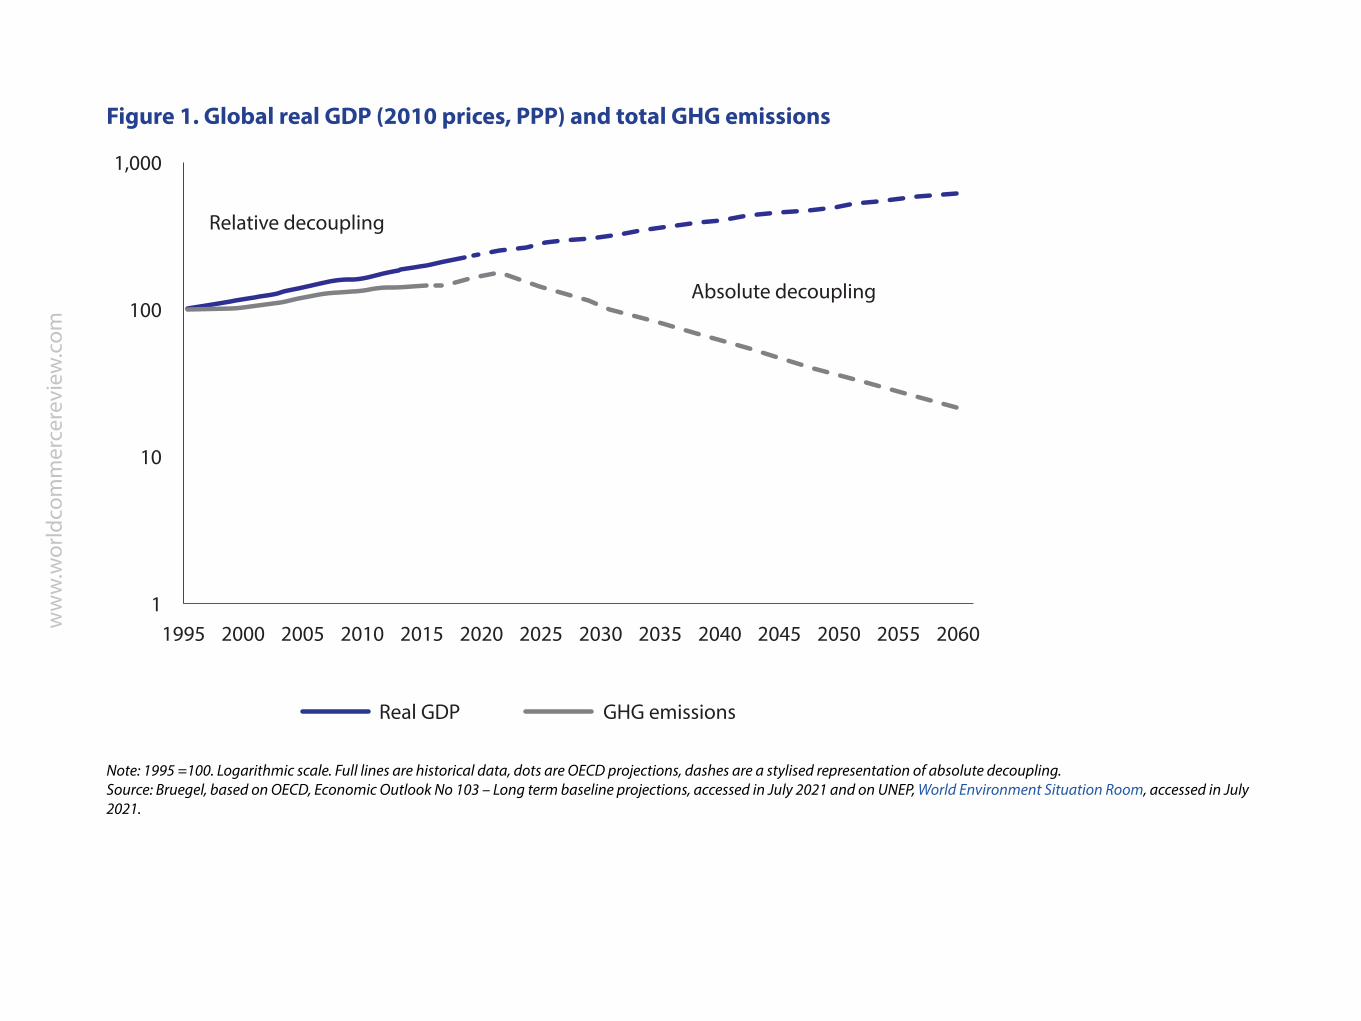
This would imply an absolute decoupling of economic growth and GHG emissions (ie. a situation in which GHG emissions go down while real GDP continues to grow, see Figure 1) through a ‘dematerialisation’ of the economy (eg. through a shift from manufacturing to services), altered consumption behaviour, more efficient technology and the decarbonisation of the energy sector.
GHG emissions = population * *population
GDP*GDP
energy demand GHG emissions
energy demand
ww
w.w
orld
com
mer
cere
view
.com
Figure 1. Global real GDP (2010 prices, PPP) and total GHG emissions
Note: 1995 =100. Logarithmic scale. Full lines are historical data, dots are OECD projections, dashes are a stylised representation of absolute decoupling.Source: Bruegel, based on OECD, Economic Outlook No 103 – Long term baseline projections, accessed in July 2021 and on UNEP, World Environment Situation Room, accessed in July 2021.
1,000
100
10
11995 2000 2005 2010 2015 2020 2025 2030 2035 2040 2045 2050 2055 2060
Relative decoupling
Absolute decoupling
Real GDP GHG emissions

ww
w.w
orld
com
mer
cere
view
.com
Globally, there is no sign of absolute decoupling, but only of relative decoupling (ie. a situation in which total GHG emissions grow less than proportionately to real GDP).
Explained in terms of the Kaya identity, while energy related GHG emissions per unit of GDP are falling (the third and fourth factors combined), the fall is slower than the increase in real GDP (the first and second factors) so that overall emissions continue to rise.
In order to avoid global warming in excess of 1.5°C above pre-industrial levels, global GHG emissions must be rapidly reduced. Doing this without losses in economic prosperity will not be easy...
ww
w.w
orld
com
mer
cere
view
.com
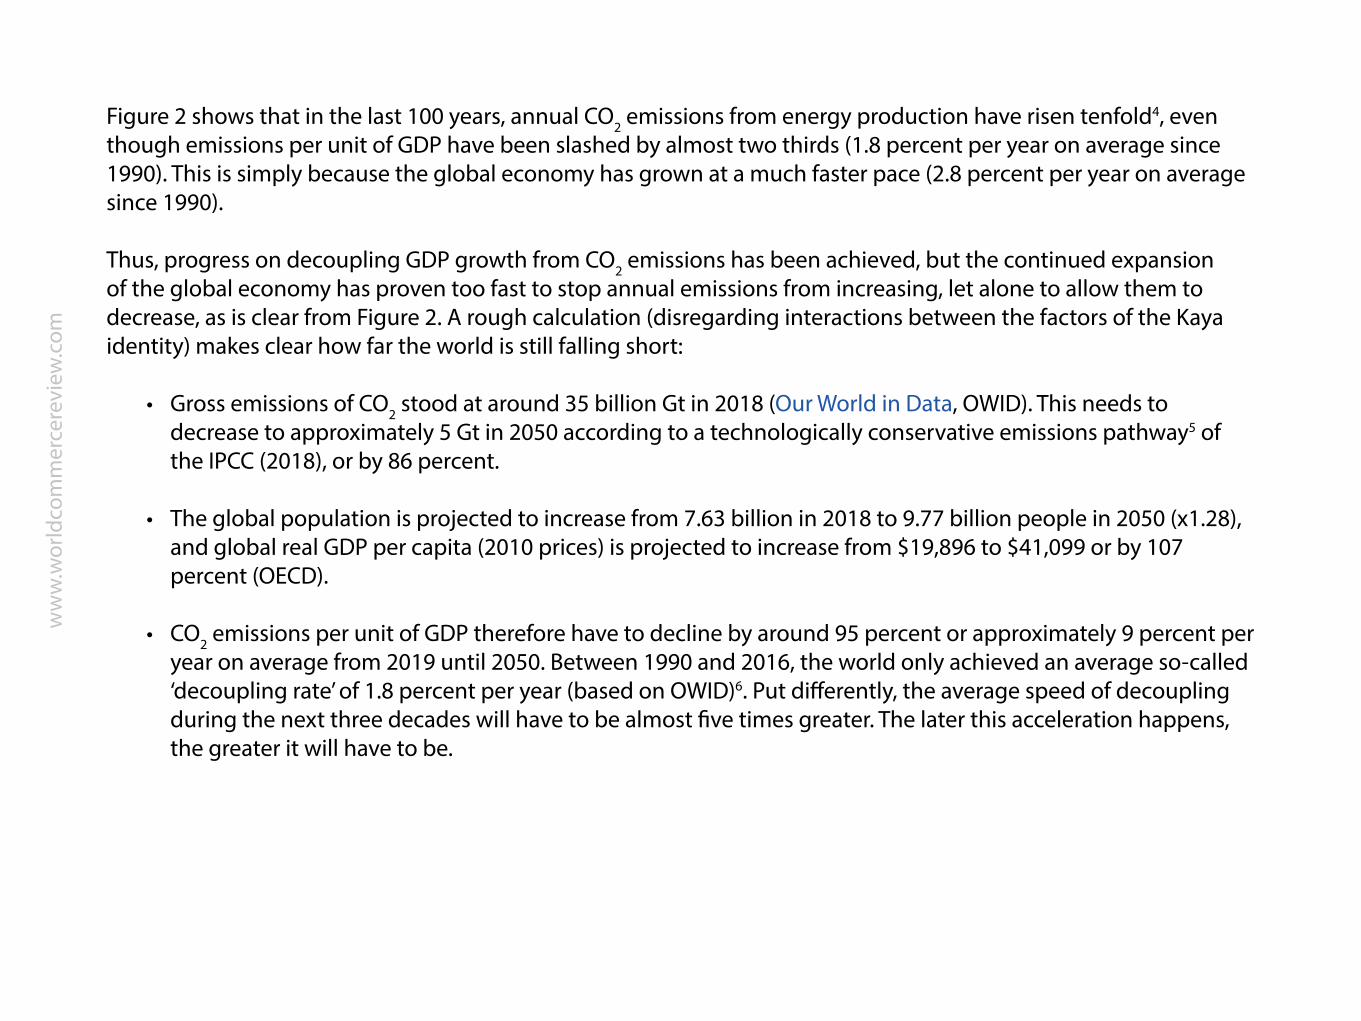
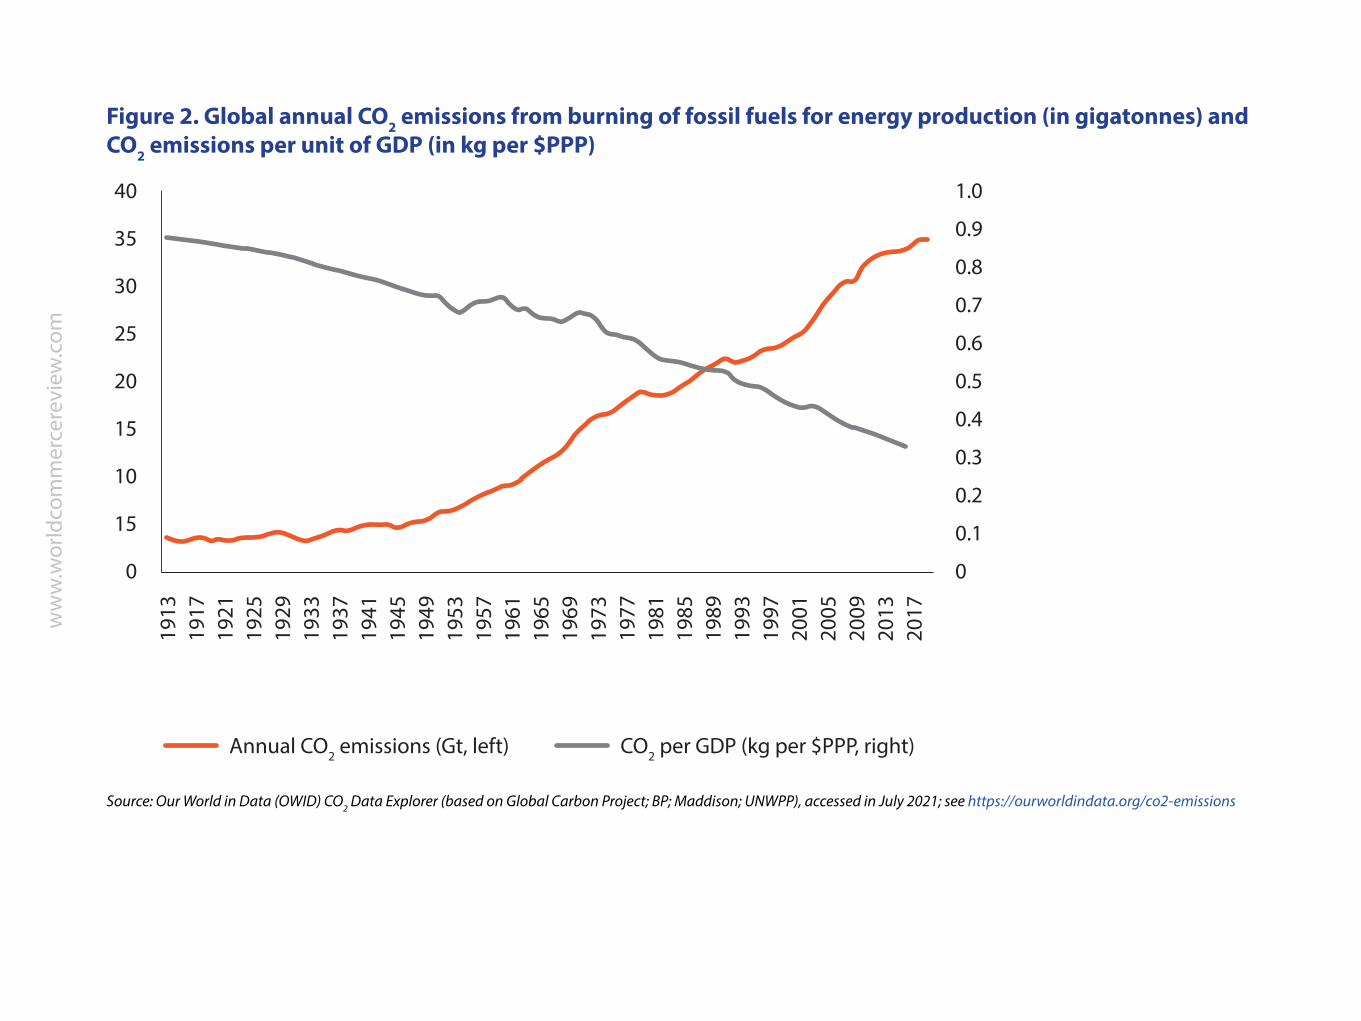
Figure 2 shows that in the last 100 years, annual CO2 emissions from energy production have risen tenfold4, even though emissions per unit of GDP have been slashed by almost two thirds (1.8 percent per year on average since 1990). This is simply because the global economy has grown at a much faster pace (2.8 percent per year on average since 1990).
Thus, progress on decoupling GDP growth from CO2 emissions has been achieved, but the continued expansion of the global economy has proven too fast to stop annual emissions from increasing, let alone to allow them to decrease, as is clear from Figure 2. A rough calculation (disregarding interactions between the factors of the Kaya identity) makes clear how far the world is still falling short:
• Gross emissions of CO2 stood at around 35 billion Gt in 2018 (Our World in Data, OWID). This needs to decrease to approximately 5 Gt in 2050 according to a technologically conservative emissions pathway5 of the IPCC (2018), or by 86 percent.
• The global population is projected to increase from 7.63 billion in 2018 to 9.77 billion people in 2050 (x1.28), and global real GDP per capita (2010 prices) is projected to increase from $19,896 to $41,099 or by 107 percent (OECD).
• CO2 emissions per unit of GDP therefore have to decline by around 95 percent or approximately 9 percent per year on average from 2019 until 2050. Between 1990 and 2016, the world only achieved an average so-called ‘decoupling rate’ of 1.8 percent per year (based on OWID)6. Put differently, the average speed of decoupling during the next three decades will have to be almost five times greater. The later this acceleration happens, the greater it will have to be.
ww
w.w
orld
com
mer
cere
view
.com
Figure 2. Global annual CO2 emissions from burning of fossil fuels for energy production (in gigatonnes) and CO2 emissions per unit of GDP (in kg per $PPP)
Source: Our World in Data (OWID) CO2 Data Explorer (based on Global Carbon Project; BP; Maddison; UNWPP), accessed in July 2021; see https://ourworldindata.org/co2-emissions
40
35
30
25
20
15
10
15
0
1.0
0.9
0.8
0.7
0.6
0.5
0.4
0.3
0.2
0.1
0
1913
1917
1921
1925
1929
1933
1937
1941
1945
1949
1953
1957
1961
1965
1969
1973
1977
1981
1985
1989
1993
1997
2001
2005
2009
2013
2017
Annual CO2 emissions (Gt, left) CO2 per GDP (kg per $PPP, right)
ww
w.w
orld
com
mer
cere
view
.com
Decoupling trends are not even fast enough in developed economies. Since 1990 the European Union’s (EU) gross CO2 emissions have decreased by 25 percent (OWID), while real GDP grew by 62 percent (European Commission, 2020a).
CO2 emissions in the United States also started to decline more recently. This suggests that absolute decoupling is possible. But it is happening too slowly to match the globally required decoupling rate: the average EU decoupling rate was 3.4 percent per year between 1990 and 2016, while in the US it was 2.2 percent (OWID).
However, this is not the whole story. Developed economies such as the EU and the US import a lot of goods that are produced elsewhere, and thus GHG emissions attributable to consumption are somewhat higher than territorial emissions.
Fortunately, these broader emissions are also declining for the EU (Friedlingstein et al 2020). Once consumption-based territorial emissions are taken into account, the average decoupling rate for the EU is 2.3 percent per year since 1990 and 2.0 percent per year for the US (based on Friedlingstein et al 2020 and World Bank data), both lower than the rates based on territorial emissions.
3 DegrowthGuided by past experience, the basic premise of degrowth theorists is that the world will not be able to sufficiently reduce GHG emissions while GDP grows.
In particular, they point to the fact that some of the technologies playing a relevant role in IPCC simulations, such as carbon capture and storage (CCS) applied to fossil power plants, or bioenergy with carbon capture and storage
ww
w.w
orld
com
mer
cere
view
.com
(BECCS), do not yet exist and should not be relied on; their economic viability is unproven and they could even create new environmental problems (Keysser and Lenzen, 2021).
Such pessimistic views about our planet’s capacity to sustain economic growth are not new. They have been around in some form at least since the Essay on the Principle of Population by Thomas Malthus (1789). He postulated that famines and economic collapse were inevitable unless birth rates decreased, based on the belief that population growth is exponential and growth of food production merely linear.
This argument was echoed throughout the twentieth century in environmentally inspired works by, for example, Osborn (1948) and Vogt (1948) and, most notably, in The Population Bomb by Paul Ehrlich (1968). Meadows et al (1972) predicted in The Limits to Growth (hereafter: LTG) that global population and economic activity would peak in the early twenty-first century, and advocated an economic and demographic ‘equilibrium state’ to avoid an uncontrolled collapse when humanity’s need for resources finally exceeds the earth’s capacity.
These authors all proved to be too pessimistic (at least so far) because they failed to predict the significant advances in agricultural yields, technological innovation and substitution, and declines in population growth rates.
Advances in resource efficiency have often been driven by market forces, such as for oil in the 1970s, when scarcity drove up prices, creating incentives for innovation.
However, technological progress is highly unpredictable, and since the atmosphere as a deposit for CO2 is a rival but non-excludable good, purely market-driven innovation and substitution will not solve the problem of climate change (Eastin et al 2010).
ww
w.w
orld
com
mer
cere
view
.com
Like LTG, modern degrowth theories subscribe to the idea that humanity must achieve a lower economic ‘steady state’ to avoid environmental catastrophe. The term ‘degrowth’ was probably first used in the writings of French philosopher André Gorz in 1972, and in the work of economist Georgescu-Roegen (1971, 1979), who wrote that economic activity in the long run is limited to a level supported by solar flows due to the laws of thermodynamics.
The term was popularised in the 1990s and 2000s by Serge Latouche (for example Latouche, 2009) who criticised economic development as a goal. In the early 2000s ‘degrowth’ was used as a slogan by social and environmental activists in France, Italy and Spain.
Finally, it emerged as an international research area in 2008 at the first Degrowth Conference in Paris (Demaria et al 2013; Kallis et al 2018), with many publications being produced, particularly in the first half of the 2010s, in the context of the global financial crisis and the sovereign debt crisis in Europe.
Authors including Giorgos Kallis (eg. Kallis, 2011), Jason Hickel (eg. Hickel, 2020), Tim Jackson (eg. Jackson, 2009) and Kate Raworth (eg. Raworth, 2017) are today at the forefront. Several variations of degrowth are advocated under different names, including ‘wellbeing economics’, ‘steady-state economics’, ‘post-growth economics’ and ‘doughnut economics’.
There is no exact definition of what ‘degrowth’ stands for. Authors are not always clear on exactly what should ‘degrow’. There are at least five different interpretations: degrowth of GDP, consumption, worktime, the economy’s physical size, or ‘radical’ degrowth, referring to a wholesale transformation of the economic system (van den Bergh, 2011).
ww
w.w
orld
com
mer
cere
view
.com
It is perhaps better to say that degrowth covers all these interpretations. Material and energy consumption and the economy’s physical size need to degrow, out of a concern for resource depletion and more recently climate change.
Worktime degrowth is one tool to do so, GDP degrowth is an inevitable consequence (not an aim per se), and radical degrowth a necessary condition to make a post-growth economy socially sustainable (Kallis, 2011).
In terms of GDP and GHG emissions, degrowth scholars do not see a credible scenario in which the rate of decoupling of GDP and GHG emissions could be sufficiently high to avoid dangerous climate change (Jackson, 2009), and as such they arrive at the conclusion that global GDP must inevitably decline.
Realising the negative social consequences commonly associated with recessions, degrowth scholars set out to define a path to actively ‘guide’ GDP downward, rather than to passively let the world slip into a depression. Demaria et al (2013, p.209) therefore defined degrowth as a call for “a democratically led redistributive downscaling of production and consumption in industrialised countries as a means to achieve environmental sustainability, social justice and well-being.”
As the definition suggests, the degrowth literature is not limited to the economy-environment nexus, but is also concerned with (international) redistribution, political participation, social fairness and ‘beyond GDP’ conceptions of welfare.
Antal and van den Bergh (2016) gathered a few economic arguments directed against the prospect of decoupling through green policies. The most common argument is the existence of a rebound effect from investment in efficiency and clean energy.
ww
w.w
orld
com
mer
cere
view
.com
This means that as societies invest to reduce emissions, the increased income or savings resulting from those investments will at least partially offset the intended beneficial effects through increased consumption of non-renewable energy elsewhere. In addition, there is a risk that more stringent policies could see lower compliance because of what the authors call an ‘environmental Laffer curve’, with economic actors preferring to cheat rather than to respect regulations as the expected cost is lower.
A final objection is the possibility of burden-shifting: while not an issue for climate change, other environmental risks could be exacerbated indirectly by emission reduction efforts, for example soil pollution from mining for minerals.
Degrowth proponents advance a myriad of policies as part of a systemic change to make sure that the challenge of economic downscaling necessitated by ecological boundaries does not cause widespread human suffering. We will only touch on them superficially.
Perhaps the most important and common proposal is to limit the supply of production factors, most notably labour. Reductions in working hours are seen as a way to reduce consumption while increasing social welfare through more free time and achieving high levels of employment.
The latter must also be supported by shifting employment towards labour-intensive sectors and steering innovation to increase resource productivity rather than labour productivity, using green taxes and ‘cap-and-share’ schemes (Kallis, 2011; Kallis et al 2018).
Another element is to reduce aggregate investment by firms to net zero, which does not exclude that some (clean) sectors grow at the expense of other (dirty) sectors (Kallis et al 2018).

ww
w.w
orld
com
mer
cere
view
.com
Other ideas found in the literature are the re-localisation of economies to shorten the distance between consumers and producers, and encouragement of the sharing economy (Paech, 2012), as well as new forms of (regional) money and limitations to property rights (Kallis et al 2012; van Griethuysen, 2012).
Some advocate for zero interest rates to avoid the growth imperative created by having to pay back interest (Binswanger, 2013), caps on savings to reduce wealth inequality and doing away with the logic of accumulation by firms and owners of capital. The aim is to arrive at a steady state in which the whole economy is consumed, which would end growth (Loehr, 2012).
Importantly, many of the proposed policies are considered by authors themselves to be incompatible with capitalism and unlikely to be implemented by liberal representative democracies.
Kallis et al (2018) therefore argued that in the absence of democratic degrowth policies a period of involuntary economic stagnation caused by climate change might usher in an authoritarian version of capitalism, unless more democratic alternatives are put forward.
Finally, it should be noted that degrowth proponents devote relatively little attention to limiting population growth, which would theoretically offer another – though contentious – way to reconcile GDP per capita growth and emission reductions.
Where it is discussed, most authors view it as undesirable, especially when non-voluntary, and point out that the large and growing populations of the Global South put relatively little stress on the environment (Cosme et al 2017).
ww
w.w
orld
com
mer
cere
view
.com
On the whole the proponents of degrowth do point out the size and magnitude of the challenge confronting the world. However, we do not see any likelihood that either advanced or developing economies would accept and implement the radical propositions embedded in the degrowth literature.
We also do not think that it is in any way possible to manage degrowth without massive negative welfare effects. Overall this therefore points to green growth and the need to confront its current limitations.
4 Green growthThe calculations in section 2 illustrate the scale of the challenge. However, it is also important to note that the low decoupling rate up to now has occurred in a context in which there hasn’t been a significant climate effort globally, and developed economies have put in place only modest policies. This pattern need not continue, and there are signs that it might not.
The EU has already managed to cut its territorial emissions of CO2. This is of course partly due to lower population and GDP per capita growth than the global average. But data also shows that the decoupling rate (decline in CO2/GDP) between 1990 and 2016 stood at -3.4 percent per year in the EU (based on OWID), more than the global average of -1.8 percent.
However, this is not at the required -9.4 percent for the EU’s net-zero goal. When we break CO2/GDP down into its two components from the Kaya identity, energy demand/real GDP and CO2/energy demand, we see that the higher decoupling rate is mostly due to a decline in the latter: the energy sector has been decarbonised more in the EU than elsewhere.

ww
w.w
orld
com
mer
cere
view
.com
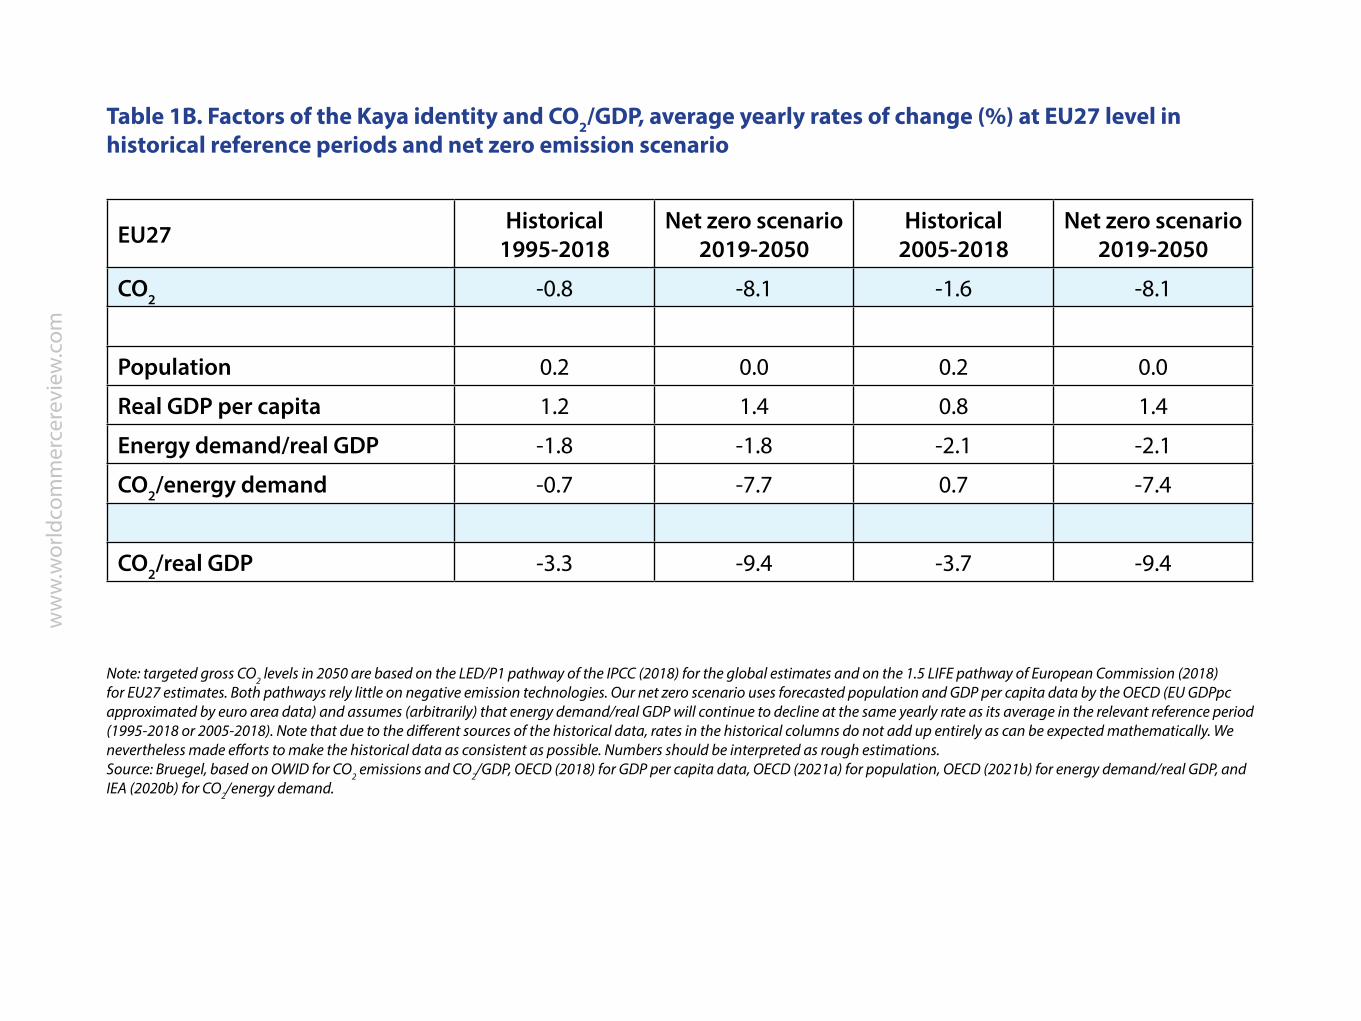
Tables 1A and 1B show broadly similar evolutions for energy demand/real GDP globally and in the EU (the EU does slightly better), but while the carbon intensity of energy has remained largely stable worldwide, in the EU it has decreased by a yearly average of 0.7 percent since 1995.
Table 1A. Factors of the Kaya identity and CO2/GDP, average yearly rates of change (%) at global level in historical reference periods and net-zero emission scenario
WORLD Historical1995-2018
Net zero scenario2019-2050
Historical2005-2018
Net zero scenario2019-2050
CO2 1.9 -5.9 1.6 -5.9
Population 1.2 0.8 1.2 0.8
Real GDP per capita 2.6 2.3 2.6 2.3
Energy demand/real GDP -1.7 -1.7 -1.8 -1.8
CO2/energy demand 0.0 -7.2 0.0 -7.0
CO2/real GDP -1.8 -8.7 -2.1 -8.7
ww
w.w
orld
com
mer
cere
view
.com
Table 1B. Factors of the Kaya identity and CO2/GDP, average yearly rates of change (%) at EU27 level in historical reference periods and net zero emission scenario
Note: targeted gross CO2 levels in 2050 are based on the LED/P1 pathway of the IPCC (2018) for the global estimates and on the 1.5 LIFE pathway of European Commission (2018) for EU27 estimates. Both pathways rely little on negative emission technologies. Our net zero scenario uses forecasted population and GDP per capita data by the OECD (EU GDPpc approximated by euro area data) and assumes (arbitrarily) that energy demand/real GDP will continue to decline at the same yearly rate as its average in the relevant reference period (1995-2018 or 2005-2018). Note that due to the different sources of the historical data, rates in the historical columns do not add up entirely as can be expected mathematically. We nevertheless made efforts to make the historical data as consistent as possible. Numbers should be interpreted as rough estimations.Source: Bruegel, based on OWID for CO2 emissions and CO2/GDP, OECD (2018) for GDP per capita data, OECD (2021a) for population, OECD (2021b) for energy demand/real GDP, and IEA (2020b) for CO2/energy demand.
EU27 Historical1995-2018
Net zero scenario2019-2050
Historical2005-2018
Net zero scenario2019-2050
CO2 -0.8 -8.1 -1.6 -8.1
Population 0.2 0.0 0.2 0.0
Real GDP per capita 1.2 1.4 0.8 1.4
Energy demand/real GDP -1.8 -1.8 -2.1 -2.1
CO2/energy demand -0.7 -7.7 0.7 -7.4
CO2/real GDP -3.3 -9.4 -3.7 -9.4
ww
w.w
orld
com
mer
cere
view
.com
A decline in energy demand/real GDP can be driven by improvements in energy efficiency from using better technologies for production, transport, isolation etc; by behavioural change towards less energy-intensive consumption (eg. increased use of public transport, a larger sharing economy and more re-use of durable goods); and by a changing economic structure towards a more ‘immaterial’ service-oriented economy.
A decline in CO2/energy demand is mostly driven by the shift from fossil fuels to renewable energy sources. Changing behaviour also plays a role (choosing to travel by rail rather than by air for example).
So far, energy demand/real GDP has declined more since 1995 than CO2/energy demand. Perhaps this is somewhat surprising as in the long run it seems more likely that energy would be almost completely decarbonised than that the global economy would be completely ‘de-energised’: goods still need to be produced somewhere and transport, heating and lighting will remain necessary.
In practice, both factors will have to decline simultaneously to sufficiently reduce gross CO2 emissions. This is also visible in Tables 1A and 1B, which show that if energy demand/real GDP continues to decline at its current rate, a very steep drop in CO2/energy demand will be necessary for both the world and the EU.
If energy demand/real GDP is also addressed more strongly, the ‘burden’ can be spread over both factors of the Kaya identity (see for example the different rates depending on which reference period is used for energy demand/real GDP).
The data presented here suggest that an absolute decoupling of CO2 and GDP is possible, but that it is currently still too slow to reach net zero. Note that while the required decoupling rate is higher for the EU than for the world, the
ww
w.w
orld
com
mer
cere
view
.com
EU is closer to its goal: while the overall decoupling rate must increase around five-fold for the whole world, the EU itself only needs less than a three-fold acceleration.
The historical decoupling rate against which to compare also increases if one takes a more recent reference period, as is visible in the table. Speeding-up will still take tremendous effort: if the energy intensity of GDP decreases at the same speed as in the last few decades, even the EU would need to speed up its decarbonisation of energy by a factor of around 11 to reach its required decoupling rate.
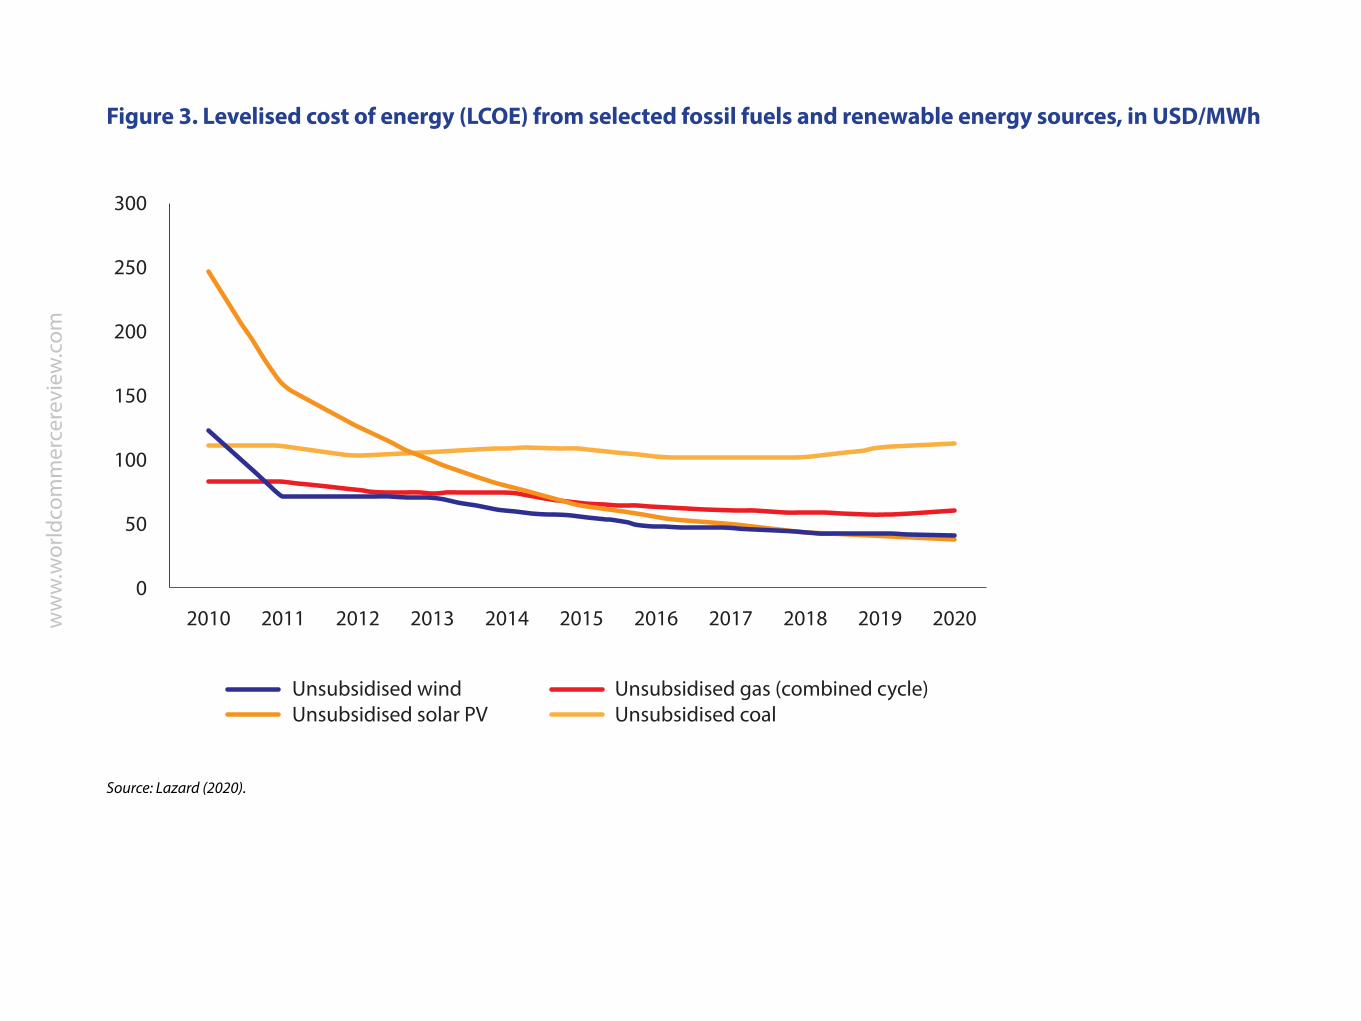
The drastic decline in prices of renewable energy technologies suggests that such an accelerated decarbonisation of energy may be feasible. Figure 3 shows that over the last decade, the cost of generating electricity with solar panels has decreased by 85 percent, while the cost of doing so with wind turbines has decreased by 68 percent.
The costs of energy from solar and wind have become lower than fossil fuel alternatives even without subsidies. Firms and governments all over the world would therefore have economic incentives to make the necessary investments to save money and at the same time reduce their emissions.
Investment decisions are of course not based solely on market prices but also on government policies and strategies. Money is still being invested in fossil fuels, but volumes are declining. Meanwhile global investments in renewable energy generation have been on the rise uninterruptedly since 2017, even during the pandemic in 2020.
Moreover, it takes time before lower costs are translated into larger investments, and other key investments must be made before renewable energy can be used at a massive scale, notably in energy storage capacity and more reliable distribution and transmission.
ww
w.w
orld
com
mer
cere
view
.com
As investments in battery storage are surging while costs are declining and investments in grids are set to recover in 2021, we can expect that the upward trend in renewable energy investment will continue for the foreseeable future (IEA, 2021d).
Already in the earlier literature rejecting degrowth pessimism, the central role of technology was highlighted. Stiglitz (1974) and Kamien and Schwartz (1978) did not yet address GHG emissions, but rather whether continued consumption growth is possible in a world with exhaustible resources.
They found that technology-driven efficiency gains allow the limits set by nature to be pushed forward so that continued expansion is possible. Later papers, including Weitzman (1999), Acemoglu et al (2012) and Aghion et al (2016), discussed endogenous and directed technical change with more optimistic outlooks.
The 1987 Brundtland report Our Common Future is seen as a milestone for green growth with its definition7 of ‘sustainable development’ (Jacob, 2012)8. The term ‘green growth’ only gained popularity in the wake of the global financial crisis of 2008 as an idea for short-term stimulus that incorporated environmental objectives (eg. OECD, 2009), and was adopted as a policy objective by international organisations in the subsequent years (Jacob, 2012).
Today it underpins the United Nations’ Sustainable Development Goals9, and to varying degrees different Green (New) Deal proposals (eg. European Commission, 2019; US House of Representatives, 2019).
No single definition has been developed of what is meant by ‘green growth’. For example, the World Bank (2012), OECD (2011) and UNEP (2011) each define green objectives differently (Hickel and Kallis, 2020).
ww
w.w
orld
com
mer
cere
view
.com
Figure 3. Levelised cost of energy (LCOE) from selected fossil fuels and renewable energy sources, in USD/MWh
Source: Lazard (2020).
300
250
200
150
100
50
02010 2011 2012 2013 2014 2015 2016 2017 2018 2019 2020
Unsubsidised windUnsubsidised solar PV
Unsubsidised gas (combined cycle)Unsubsidised coal

ww
w.w
orld
com
mer
cere
view
.com
Jacobs (2012) wrote that green GDP growth is understood as either: (1) higher growth than in a scenario without strong environmental or climate policies, both in the short and long run (dubbed the ‘strong’ version of green growth), or (2) lower in the short run and higher in the long run (the ‘standard’ version)10.
Whatever the exact interpretation of green growth, publications from international organisations or governments predict both environmental benefits in the form of avoided climate damages and economic benefits resulting from increased investment and innovation11.
This ‘double dividend’ forms the heart of the green-growth argument. The green-growth narrative rests on four pillars:
(1) subsidies for innovation and investments in renewable energy and energy efficiency that boost GDP;
(2) carbon pricing to further stimulate efficiency gains and renewables, and to avoid rebound effects, combined with recycling of tax revenues to cut corporate or labour taxes and boost employment;
(3) assumptions about innovation and negative emission technologies to accelerate the decoupling process; and
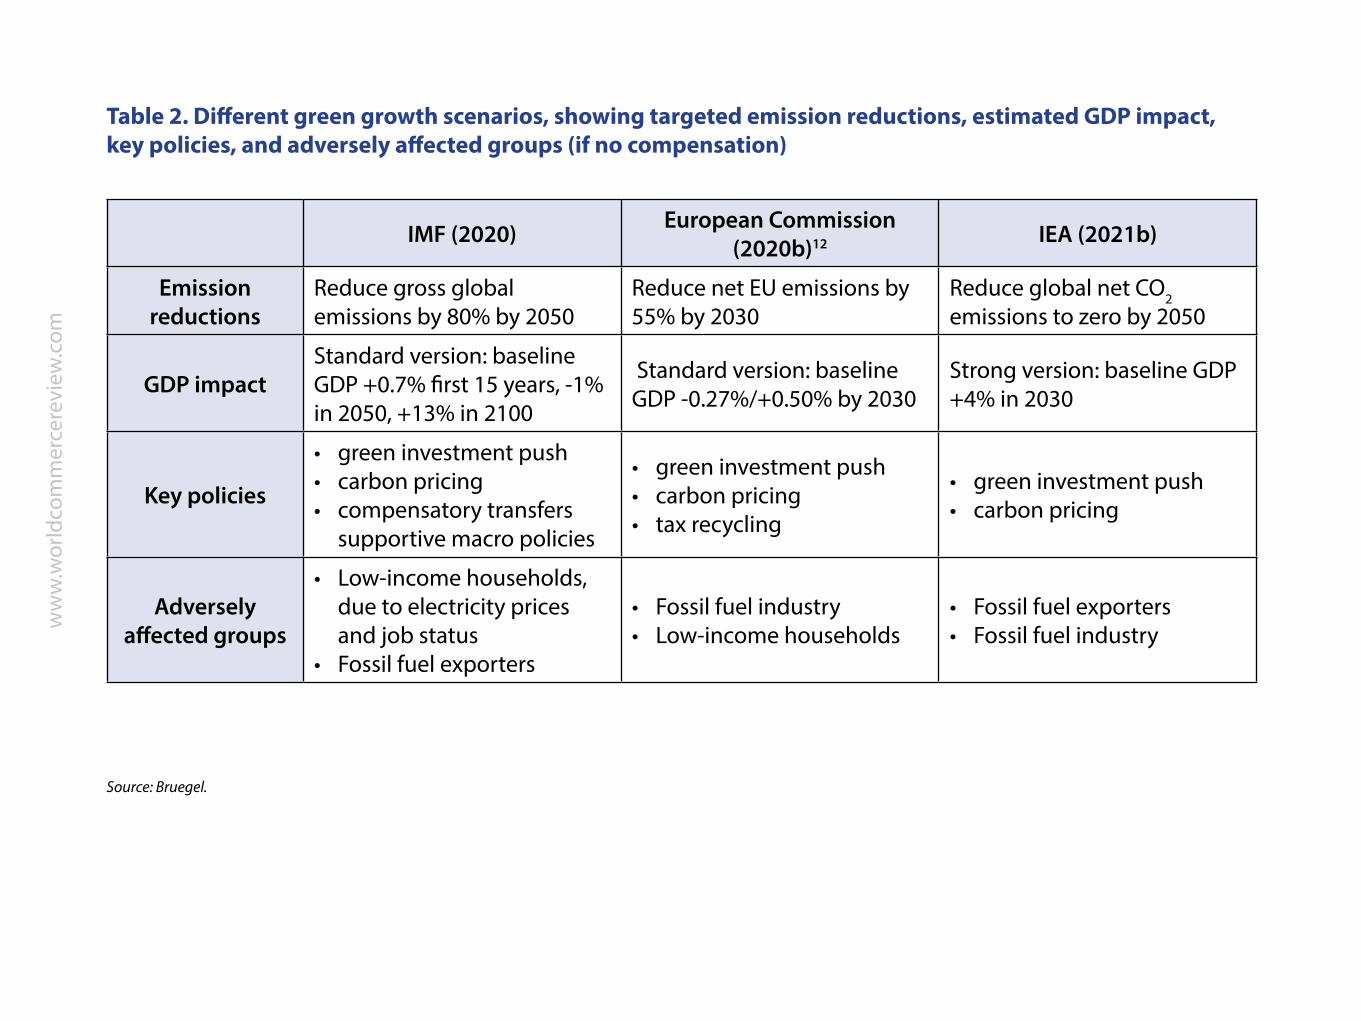
(4) compensation schemes for the poorest households, displaced workers or disadvantaged regions to make the transition politically feasible (see for example Table 2).
ww
w.w
orld
com
mer
cere
view
.com
IMF (2020) European Commission (2020b)12 IEA (2021b)
Emission reductions
Reduce gross global emissions by 80% by 2050
Reduce net EU emissions by 55% by 2030
Reduce global net CO2 emissions to zero by 2050
GDP impactStandard version: baseline GDP +0.7% first 15 years, -1% in 2050, +13% in 2100
Standard version: baseline GDP -0.27%/+0.50% by 2030
Strong version: baseline GDP +4% in 2030
Key policies
• green investment push• carbon pricing• compensatory transfers
supportive macro policies
• green investment push• carbon pricing• tax recycling
• green investment push• carbon pricing
Adversely affected groups
• Low-income households, due to electricity prices and job status
• Fossil fuel exporters
• Fossil fuel industry• Low-income households
• Fossil fuel exporters• Fossil fuel industry
Source: Bruegel.
Table 2. Different green growth scenarios, showing targeted emission reductions, estimated GDP impact, key policies, and adversely affected groups (if no compensation)
ww
w.w
orld
com
mer
cere
view
.com
Inclusion of such social elements puts current proposals a step beyond earlier incarnations of Green New Deals (Mastini et al 2021). In its most extreme form, green growth is believed to come as a result of free markets and does not even require public intervention other than carbon pricing (Gueret et al (2019) refer to this as ‘green capitalism’).
Overall, however, the empirical evidence for a double dividend looks mixed. In fact, some of the reports by official institutions state that a double dividend can be achieved only if very specific assumptions are made, while in many scenarios, strong climate action could at least in the short-term lower GDP growth.
5 Techno-optimism: important caveatsThe numbers we have given show that the world needs to decouple gross GHG emissions and GDP growth much faster than currently. In the following, we set out the key actions necessary to achieve such a faster decoupling13.
5.1 Need for massive investment in deployment of existing green technologiesTo decouple GHG emissions and GDP growth, a huge expansion in green investment and a big shift in investment are needed. For instance, the IEA’s (2021b) net-zero pathway estimates that global energy capital investments must increase from a current yearly average of about $2 trillion to $5 trillion (2019 prices) by 2030, after which they must stay at almost the same level until 2050.
As a fraction of global GDP, this would be an increase from 2.5 percent today to 4.5 percent in 2030, followed by a gradual decline back to 2.5 percent. Encouragingly, most of the technologies to be invested in up to 2030 (for 85 percent of emission reductions; see IEA, 2021b) are readily available.
Beyond 2030, that will be much less the case: only 54 percent of emission reductions will be accomplished with current technologies. Most of the investments up to 2050 (about 65 percent) would be directed to generating low-
ww
w.w
orld
com
mer
cere
view
.com
carbon electricity, upgrading the electricity system for distribution and storage and electrifying new sectors of the economy (CO2/energy demand), while a smaller though still significant share (about 15 percent) would be spent on efficiency improvements (energy demand/real GDP).
Governments will have to foot part of the bill, especially for large infrastructure projects or technologies still under development (IEA, 2021b). But the private sector will need to cover most of the investments.
It is therefore important that governments use policies to create incentives and facilitate investments, for example through carbon pricing, ‘green’ financial regulations and supervisory practises, or cooperation with the private sector through public financial institutions such as the European Investment Bank.
Clear and credible policy commitments also help by reducing the uncertainty that can keep firms from investing (Dechezlepretre et al 2021).
5.2 Need for breakthrough green technologies for decarbonisationMost emission reduction scenarios that predict continued economic growth rely to varying degrees on the use of technologies that are not yet available. This is frequently used by degrowth proponents as an argument to question the feasibility of green growth.
The IEA net-zero pathway (2021b), for instance, relies to a great extent on future innovation: 15 percent of the emissions reductions by 2030 and 46 percent of the reductions between 2030 and 2050 are to be achieved with technologies that are currently in a demonstration or prototype phase, such as CCS, green hydrogen and advanced batteries.
ww
w.w
orld
com
mer
cere
view
.com
The breakthroughs achieved in the current decade will therefore be crucial. Unfortunately, none of the technologies needed beyond 2030 are currently on track to being deployed in time (IEA, 2021c), as the road from concept to commercialisation is typically long and winding.
To accelerate the development of these innovative technologies, governments and the private sector both need to substantially increase their research and innovation funding. Fostering green innovation and bringing green technologies from the laboratory to the market requires government action, for example via pricing of emissions.
Public-private partnerships schemes, adequate risk-taking by public institutions and green industrial policy can further deliver breakthrough innovation (Tagliapietra and Veugelers, 2020). But, of course, there cannot be a guarantee that such breakthrough technologies will materialise in time.
5.3 Need to foster behavioural changeIn theory, emissions from energy production could be sufficiently reduced solely on the back of technology. However, we noted that both declines in energy demand/real GDP and CO2/energy demand also depend on behavioural changes.
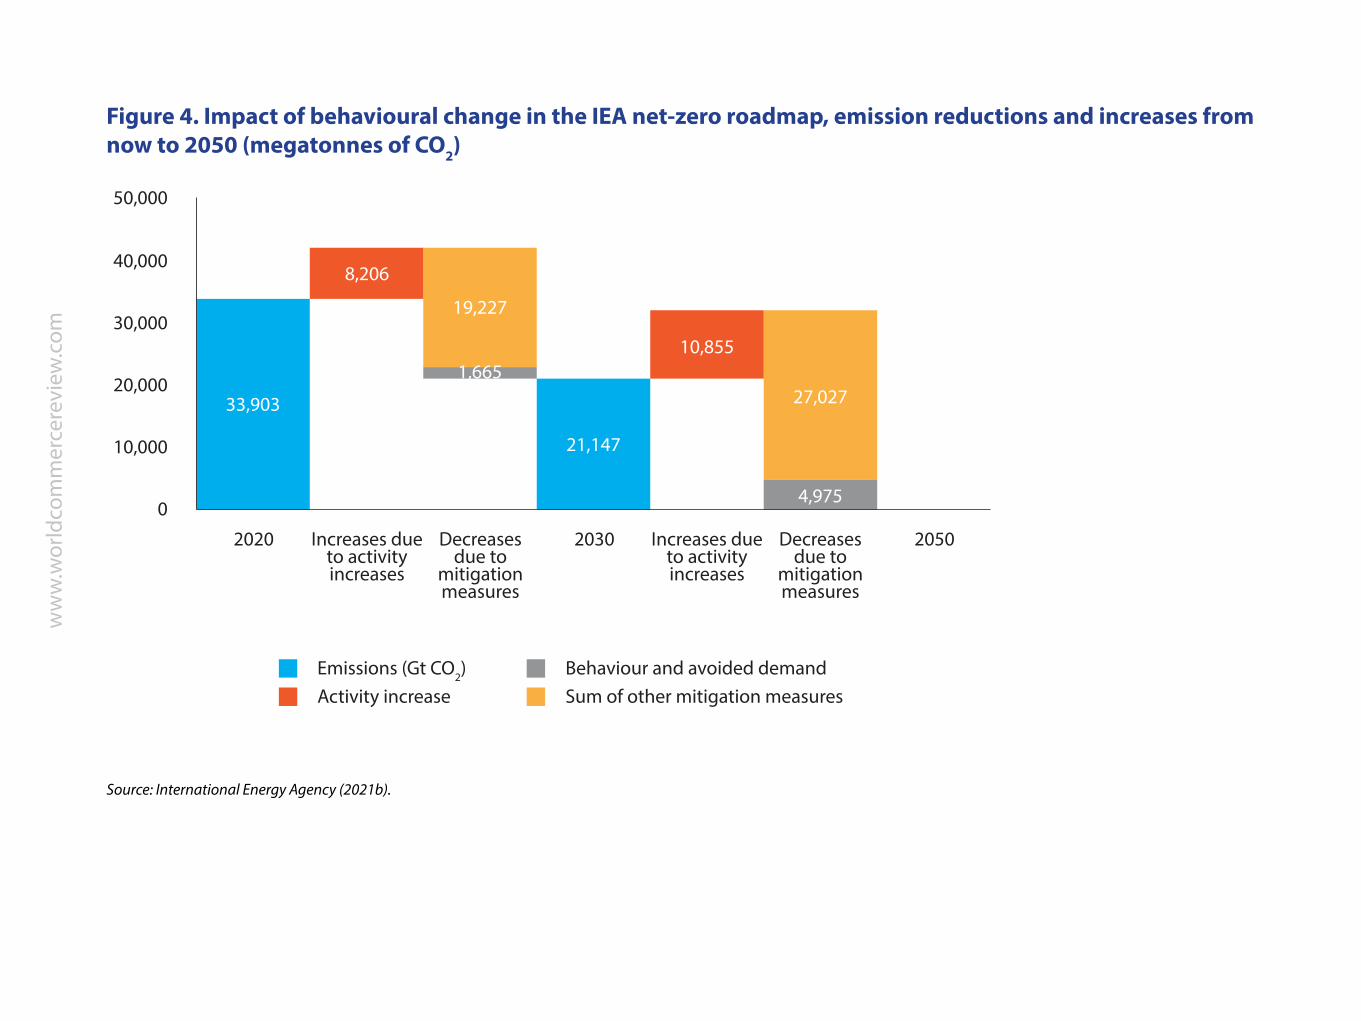
In practice, these will be needed to swiftly and affordably reduce emissions from sources that are more difficult to decarbonise, such as air travel. For instance, in the IEA (2021b) net-zero roadmap, behavioural change accounts for 12.5 percent of global CO2 reductions between today and 2050 (Figure 4).
Behavioural change can also reduce the cost of the green transition. To appreciate this point, it is useful to compare the EU investment requirements to reach net zero by 2050 estimated by the European Commission under two
ww
w.w
orld
com
mer
cere
view
.com
Figure 4. Impact of behavioural change in the IEA net-zero roadmap, emission reductions and increases from now to 2050 (megatonnes of CO2)
Source: International Energy Agency (2021b).
50,000
40,000
30,000
20,000
10,000
0
2020 2030 2050Increases due to activity increases
Decreases due to
mitigation measures
Increases due to activity increases
Decreases due to
mitigation measures
33,903
8,206
19,227
1,665
21,147
10,855
27,027
4,975
Emissions (Gt CO2)Activity increase
Behaviour and avoided demandSum of other mitigation measures
ww
w.w
orld
com
mer
cere
view
.com
different scenarios: one relying only on technology (1.5 TECH), and one relying on both technology and behavioural changes (1.5 LIFE).
Between 2031 and 2050, the 1.5 TECH scenario requires additional average annual investment of €289.5 billion compared to the baseline, while the 1.5 LIFE scenario requires only €175.7 billion (European Commission, 2018).
Furthermore, the energy sector is responsible for 73 percent of global GHG emissions14. This implies that even cutting energy-related emissions to zero would not be sufficient to achieve climate neutrality by mid-century, since the remaining emissions would still exceed the amounts permissible to limit global warming to 1.5°C (UNEP, 2020a).
Other sectors that primarily emit gasses including methane (CH4) and nitrous oxide (N2O) for other reasons than energy therefore also have an indispensable role to play in emission reductions. For much of these emissions however, particularly from agriculture and land use, which account for 18.4 percent of the total, technology is not likely to have much impact.
We have not made much progress in decoupling GHG emission from food production (1.0 percent per year since 1990, according to FAO data). As Turner (2020) put it, the technology ‘cow’ has indeed barely changed over the last millennia.
GHG emissions per kilo of meat from cattle have declined by a mere 0.4 percent per year on average since 1990. They account for 37 percent for all emissions from food production documented by the FAO15 (FAOSTAT, 2021). A change in diet and the way we use land for producing other goods might thus become necessary.
ww
w.w
orld
com
mer
cere
view
.com
Bearing this in mind, it is important to consider degrowthers’ warnings of rebound effects. If policies to reduce emissions through investments in renewables and efficiency gains achieve positive income effects or too optimistic perceptions, a narrow focus on certain sectors could leave room for harmful effects from increased emissions elsewhere. This could offset at least part of the progress made in emission reductions from energy16.
5.4 Need to develop and scale-up negative emission technologiesAll IPCC emission pathways, including the one on which we based our calculations in sections 2 and 3, consider net CO2 emissions, with reductions from agriculture, forests and other land use.
Reforestation, afforestation, habitat and soil management can be used to remove CO2 from the atmosphere, provided that increased efforts are made in these areas. This is why gross emissions can remain small but positive in a net-zero situation.
Unlike the conservative pathway we used, most of the IPCC pathways (IPCC, 2018) also rely significantly on human-made negative emission technologies. They allow for greater remaining CO2 emissions from activities that are hard to decarbonise when reaching climate neutrality by mid-century and beyond, as these are offset by more carbon removal.
This in turn means that the high required decoupling rate of around 9 percent becomes somewhat lower, which would make a difference in the feasibility of net-zero by mid-century.
This is controversial among climate scientists, however. Negative emission technologies are currently under development or in early small-scale implementation and are not on track to being ready in time (IEA, 2021c).

ww
w.w
orld
com
mer
cere
view
.com
Furthermore, many scientists are sceptical about the feasibility and viability of certain technologies and are even worried that they may create numerous other serious environmental problems because of potentially high input requirements.
Governments should encourage the development of both natural and technological solutions but should be keenly aware that negative emission technologies cannot be a substitute for actual, immediate emission abatement.
5.5 Need to adapt our economies to unavoidable climate changeGlobal efforts to reduce GHG emissions are aimed at limiting global warming to 1.5°C, thus minimising dangerous climate change.
Unfortunately, with average temperatures already more than 1.0°C above pre-industrial levels (IPCC, 2018) climate change is already upon us. Natural disasters, most of which could be linked to climate change, reportedly caused $210 billion of damages worldwide in 202017 (Munich Re, 2021).
Structural change such as desertification and shifting seasonal patterns are already visible. Occasional and structural damages are bound to get worse and more frequent as temperatures rise to 1.5°C or 2°C in a mitigated scenario, let alone if we do nothing. For regions closer to the equator, climate change may become a matter of life and death, and political and other spillovers are to be expected.
It is therefore imperative that in parallel to mitigation efforts, investment in climate adaptation should accelerate. Coastal areas, often densely populated, will have to improve their flood defences, while many regions, in particular urban areas, simultaneously will have to save potable water for dry spells.
ww
w.w
orld
com
mer
cere
view
.com
Buildings and cities need to be adapted to cope with sometimes much higher temperatures, while forests must be managed to minimise fire hazard. Rural areas will need to change their sources of income if certain crops become difficult to cultivate and tourist destinations lose their appeal.
Like mitigation, climate adaptation measures are good investments. For instance, in a scenario with 3°C of global warming or more, the PESETA IV study by the European Commission (2020c) estimated that installing reservoirs to reduce flood risks in Europe will save €40 billion per year by 2100, for a yearly investment of only €3.3 billion up to then.
Annual damages of up to €220 billion by 2100 can be avoided if we start investing less than €2 billion in the protection of our coastlines. The analysis suggests that such investments will still be worthwhile in a scenario with only 2°C of global warming.
It is important to realise the sizable returns to adaptation, as annual adaptation costs in the developing world alone are estimated to be between $140 billion and $300 billion in 2030, while those of developed countries are even higher (UNEP, 2020b).
6 ConclusionsIn order to avoid global warming in excess of 1.5°C above pre-industrial levels, global GHG emissions must be rapidly reduced. Doing this without losses in economic prosperity will not be easy: so far, decoupling GHG emissions from GDP growth has been slow or absent.
This is seen as justification for degrowth scholars to propose a radical overhaul of our economic system. Yet this approach seems unrealistic. Asking for lower growth, let alone negative growth, would mean that large parts of the world could not develop, or only at the expense of even harsher degrowth in developed countries.
ww
w.w
orld
com
mer
cere
view
.com
Low-income countries will obviously not follow this advice and the notion of redistributing income from rich to poor countries is also unrealistic.
The real question therefore becomes whether decarbonisation efforts can be accelerated. While global emissions have not declined, GHG emissions from developed economies such as the EU have, despite continued economic growth.
The data also shows that the speed of decoupling of emissions and growth has accelerated in the world. The efforts to reduce the carbon intensity of energy in many economies have contributed to a steep decline in the prices of renewable energy technology, which has improved the economic case for rapid decarbonisation worldwide.
Belief that further innovation and investment will enable the world to successfully reach climate neutrality by 2050 without reducing welfare underlies the green-growth narrative advocated by most governments and international organisations.
The direction and pace of technological progress are impossible to predict. Neither the degrowth hypothesis as the only approach to achieve climate neutrality by 2050, nor the green-growth hypothesis can therefore be credibly excluded ex ante. However, as we argued in the previous section, there are important actions governments can take to enhance the likelihood that green growth is achieved.
Ultimately, if stringent emission targets are taken as a given, the choice to pursue green growth, degrowth or something in between is a choice about how much one is willing to trust in technology and how much one wants to hedge against the adverse effects of declining GDP.

ww
w.w
orld
com
mer
cere
view
.com
Both rely on untested ideas. The only certainty is that we should firmly commit to sticking to stringent targets no matter which path is chosen, and policy should evolve accordingly.
As the Stern Review (2007) put it, in the long run the benefits of strong climate action will outweigh the costs of climate action. ■
Klaas Lenaerts is a Research Assistant, Simone Tagliapietra a Senior Fellow and Guntram B Wolff is the Director, all at Bruegel
Endnotes1. See for example https://www.theguardian.com/environment/video/2019/sep/23/greta-thunberg-to-world-leaders-how-dare-you-you-have-stolen-my-dreams-and-my-childhood-video, accessed 15 July 2021.2. The remaining emissions arise from agriculture (11.2 percent), land use (7.2 percent), industrial processes (5.2 percent) and waste (3.2 percent) (see https://www.climatewatchdata.org/ghg-emissions). While this paper focusses mostly on GHG emissions from energy, the more difficult part of emissions reduction and sustainability in general may in fact be making the necessary changes in how we use natural resources to feed and dress ourselves. More on this in section 5.3. Energy production is what causes emissions, but the variable that must be impacted by policy is energy demand. We assume production is equal to demand and use IEA data on total primary energy supply to represent both. For IEA definitions see https://www.iea.org/commentaries/understanding-and-using-the-energy-balance4. From here on we switch from showing data on total GHG emissions to data on CO2 emissions for reasons of data availability and comparability to theoretical emission pathways. Since we focus on emissions mitigation in the energy sector, this is not an oversimplification: CO2 represented 91 percent of global GHG emissions from energy in 2018 (CH4: 8.6
ww
w.w
orld
com
mer
cere
view
.com
percent and N2O: 0.8 percent), and the energy sector accounts for 93 percent of global CO2 emissions (industry: 4.1 percent and LULUCF: 3.3 percent) (see https://www.climatewatchdata.org/ghg-emissions). LULUCF = land use, land-use change and forestry.5. Loosely based on the LED/P1 pathway of the IPCC (2018), which uses neither carbon capture and storage technology (CCS) nor bioenergy with CCS (BECCS), technologies that are currently under development and that degrowth scholars deem unfit for climate change mitigation.6. Decoupling is slowest in developing and emerging countries, where the carbon intensity of GDP is mostly higher than in Europe today. Between 1990 and 2016 the average yearly decoupling rate in India was -2.4 percent, in Africa -2.1 percent, in China -1.8 percent and in South America -1.1 (based on OWID data). It is important to note here that most of these countries had vastly lower levels of carbon intensity of GDP than developed countries throughout most of the previous century and have contributed much less to the current stock of CO2 in the atmosphere. Nevertheless, as these economies increase their shares of world GDP, faster decoupling will become increasingly important. It is not for this paper to review the vast discussion on international climate justice and the degree to which different parts of the world, because they have increased the global stock of CO2 in the atmosphere, should decouple more quickly.7. “Development that meets the needs of the present without compromising the ability of future generations to meet their own needs” (World Commission on Environment and Development 1987, p. 41).8. It lay at the basis of global ecological policy thinking of the next few years, such as at the Earth Summit and in the Rio Declaration in 1992, which explicitly called for economic growth to address environmental problems.9. The SDGs indeed also include ‘Decent Work and Economic Growth’ as SDG8.10. Adding to the confusion is lack of clarity about the baseline against which growth is usually compared: is it a trajectory based on historical average growth rates or a no-action scenario that includes serious damage from climate change in the long run? This is not trivial, as in comparison to an economy wrecked by runaway climate change, an economy that avoids global warming by growing more slowly or even by shrinking could be on a higher growth path, but this is generally not a scenario considered as ‘green growth’.
ww
w.w
orld
com
mer
cere
view
.com
11. The environmental benefits are sometimes augmented by more short-term co-benefits, mostly through improved health; see Karlsson et al (2020) for an overview.12. Includes JRC-GEM-E3, E3ME and E-QUEST model estimates.13. Because of the nature of renewable energy, global supply chains, and the consequences of climate change, as well as the benefits to be had from cooperation in R&D, each of these points should be addressed with international cooperation in mind (see for example Leonard et al 2021).14. See Climate Watch for historical GHG emissions.15. See FAOSTAT, Agri-Environmental Indicators, accessed on 20 July 2021.16. In the absence of a limit or prices on emissions, there can also be rebound effects within the energy sector, for example when people start using more energy because it is becoming cheaper or greener. This means increases in energy demand/real GDP offset decreases in CO2/energy demand.17. See ‘Record hurricane season and major wildfires – The natural disaster figures for 2020’, Munich RE, accessed 24 February 2021.
ReferencesAcemoglu, D, P Aghion, L Bursztyn and D Hemous (2012) ‘The environment and directed technical change’, American Economic Review 102(1):131-166. Aghion, P, A Dechezlepretre, D Hemous, R Martin and J Van Reenen (2016) ‘Carbon taxes, path dependency and directed technical change: evidence from the auto industry’, Journal of Political Economy, 124(1):1-51.Antal, M and J van den Bergh (2016) ‘Green Growth and climate change: conceptual and empirical considerations’, Climate Policy 16(2):165-177.Binswanger, H (2013) The Growth Spiral, Berlin: Springer

ww
w.w
orld
com
mer
cere
view
.com
Cosme, I, R Santos and D O’Neill (2017) ‘Assessing the degrowth discourse: a review and analysis of academic degrowth policy proposals’, Journal of Cleaner Production, 149: 321-334.Demaria, F, F Schneider, F Sekulova and J Martinez-Alier (2013) ‘What is degrowth? From an activist slogan to a social movement’, Environmental Values, 22(2): 191-215.Dechezleprêtre, A, T Kruse and C Berestycki (2021) ‘Measuring and Assessing the Effect of Environmental Policy Uncertainty’, Economics Department Working Paper, Organisation for Economic Cooperation and Development, forthcomingEastin, J, R Grundman and A Prakash (2011) ‚'The two limits debates: Limits to growth and climate change’, Futures 43(1): 16-26.Ehrlich, P (1968) The Population Bomb, Sierra Club/Ballantine BooksErbach, G and G Victoria (2021) ‘Carbon dioxide removal. Nature-based and technological solutions’, Briefing, European Parliamentary Research Service.European Commission (2018) In-depth analysis in support of the Commission Communication COM(2018) 773 ‘A Clean Planet for All’.European Commission (2019) ‘The European Green Deal’, COM(2019) 640 final.European Commission (2020a) AMECO Online. European Commission (2020b) Impact assessment accompanying the document “Stepping up Europe’s 2030 climate ambition: Investing in a climate-neutral future for the benefit of our people”, SWD(2020) 176 final.European Commission (2020c) Climate change impacts and adaptation in Europe, JRC PESETA IV final report.Friedlingstein, P, M O’Sullivan, MW Jones, RM Andrew, J Hauck, A Olsen, S Zaehle (2020) ‘Global Carbon Budget 2020’, Earth System Science Data 12(4): 3269-3340.Georgescu-Roegen, N (1971) The Entropy Law and the Economic Process, Cambridge: Harvard University PressGeorgescu-Roegen, N (1979) Demain la décroissance : entropie-écologie-économie, Lausanne: Pierre-Marcel FavreGorz, A (1972) ‘Proceedings from a public debate’, Nouvelle Observateur, 19 June
ww
w.w
orld
com
mer
cere
view
.com
Gueret, A, A Saussay and X Timbeau (2019) ‘On the economics of a Green (New) Deal’, presentation to OFCE Paris meeting, 16 SeptHaut Conseil pour le Climat (2020) Maitriser l’empreinte carbone de la France.Hickel, J and G Kallis (2020) ‘Is Green Growth Possible?’ New Political Economy 25(4):469-486.Hickel, J (2020) Less is more: how degrowth will save the world, CornerstoneHoldren, J and P Ehrlich (1974) ‘Human Population and the Global Environment: Population growth, rising per capita material consumption, and disruptive technologies have made civilization a global ecological force’, American Scientist 62(3):282-292.IEA (2020a) World Energy Outlook 2020, International Energy Agency.IEA (2020b) CO2 Emissions from Fuel Combustion Statistics. Indicators for CO2 emissions (Edition 2020), International Energy Agency.IEA (2021a) ‘After steep drop in early 2020, global carbon dioxide emissions have rebounded strongly’, press release, 2 March, International Energy Agency.IEA (2021b) Net Zero by 2050. A roadmap for the global energy sector, International Energy Agency.IEA (2021c) Tracking Clean Energy Progress, International Energy Agency.IEA (2021d) World Energy Investment 2021, International Energy Agency.IMF (2020) ‘Mitigating Climate Change’, chapter 3 in World Economic Outlook: a long and difficult assent, International Monetary Fund.IPCC (2018) Global Warming of 1.5 ºC, Special Report, Intergovernmental Panel on Climate Change.Jackson, T (2009) Prosperity without Growth: Economics for a Finite Planet, London: EarthscanJacobs, M (2012) ‘Green growth: economic theory and political discourse’, Working Paper No. 92, Grantham Research Institute on Climate Change and the Environment.Kallis, G, C Kerschner and J Martinez-Alier (2012) ‘The economics of degrowth’, Ecological Economics, 84: 172-180.

ww
w.w
orld
com
mer
cere
view
.com
Kallis, G, V Kostakis, S Lange, B Muraca, S Paulson and M Schmelze (2018) ‘Research on Degrowth’, Annual Review of Environment and Resources 43: 291-316.Kallis, G (2011) ‘In Defence of Degrowth’, Ecological Economics, 70(5): 873-880.Kamien, M and N Schwartz (1978) ‘Optimal exhaustible resource depletion with endogenous technical change’, Review of Economic Studies, 45(1): 179-196.Karlsson, M, E Alfredsson and N Westling (2020) ‘Climate policy co-benefits: a review’, Climate Policy 20(3): 292-316.Kaya, Y and K Yokoburi (1998) Environment, energy, and economy: strategies for sustainability, Tokyo: United Nations University PressKeysser, L and M Lenzen (2021) ‘1.5°C degrowth scenarios suggest the need for new mitigation pathways’, Nature Communications 12(2676).Latouche, S (2009) Farewell to Growth, Cambridge: PolityLazard (2020) Lazard’s levelized cost of energy analysis – Version 14.0.Leonard, M, J Pisani-Ferry, J Shapiro, S Tagliapietra and G Wolff (2021) ‘The geopolitics of the European Green Deal’, Policy Contribution 04/2021, Bruegel.Loehr, D (2012) ‘The euthanasia of the rentier—a way toward a steady-state economy?’ Ecological Economics 84: 232–239.Malthus, T (1798) An Essay on the Principle of Population, London: J JohnsonMarkkanen, S and A Anger-Kraavi (2019) ‘Social impacts of climate change mitigation policies and their implications for inequality’, Climate Policy 19(7): 827-844.Mastini, R, G Kallis and J Hickel (2021) ‘A Green New Deal without growth?’ Ecological Economics 179: 1-9.Meadows, D, D Meadows, J Randers and W Behrens (1972) The limits to growth, 5th printing, New York: Universe BooksOsborn, F (1948) Our plundered planet, New York: Little, Brown and CompanyOECD (2009) Declaration on Green Growth, Organisation for Economic Cooperation and Development.OECD (2011) Towards green growth, Organisation for Economic Cooperation and Development.
ww
w.w
orld
com
mer
cere
view
.com
OECD (2018) ‘Economic Outlook No 103 – Long term baseline projections’, Organisation for Economic Cooperation and Development.OECD (2021) Primary energy supply, Organisation for Economic Cooperation and Development.Paech, N (2012) Befreiung vom Überfluss: auf dem Weg in die Postwachstumsoekonomie, Munich: Oekom VerlagPeters, GP, JC Minx, CL Weber and O Edenhofer (2011) ‘Growth in emission transfers via international trade from 1990 to 2008’, Proceedings of the National Academy of Sciences 108: 8903- 8908.Raworth, K (2017) Doughnut economics: seven ways to think like a 21st-centrury economist, London: Random HouseStern, N (2007) The Stern Review: the economics of climate change, Cambridge University PressStiglitz, J (1974) ‘Growth with exhaustible natural resources: efficient and optimal growth paths’, Review of Economic Studies, 41: 123-137.Tagliapietra, S and R Veugelers R (2020) A green industrial policy for Europe, Blueprint 31, Bruegel.Turner, A (2020) ‘Techno-optimism, behaviour change and planetary boundaries’, Keele World Affairs Lectures on Sustainability.UNEP (2011) Towards a green economy. Pathways to Sustainable Development and Poverty Eradication, United Nations Environment Programme.UNEP (2020a) Emissions Gap Report 2020, United Nations Environment Programme.UNEP (2020b) Adaptation Gap report 2020, United Nations Environment Programme.UNFCCC (2015) Paris Agreement, United Nations Framework Convention on Climate Change.US House of Representatives (2019) ‘House Resolution 109 recognizing the duty of the Federal Government to create a Green New Deal’. van den Bergh, J (2011) ‘Environment versus growth – A criticism of “degrowth” and a plea for “a- growth”’, Ecological Economics 70: 881-890. van Griethuysen, P (2012) ‘Bona diagnosis, bona curatio: how property economics clarifies the degrowth debate’, Ecological Economics 84: 262–269.
ww
w.w
orld
com
mer
cere
view
.com
Vogt, W (1948) Road to Survival, New York: William Sloane AssociatesWeitzman, M (1999) ‘Pricing the limits to growth from minerals depletion’, Quarterly Journal of Economics 114(2): 691-706.World Bank Group (2012) Inclusive Green Growth. The pathway to Sustainable Development.World Commission on Environment and Development (1987) Our Common Future, Oxford University Press.
This article is based on the Bruegel Working Paper 10/2021.