Embed Size (px)
Citation preview
Can Adjacency Matrices Help in the Exploration and Understanding of Multi-Omics Data?
Georg Tremmel*, Atsushi Niida, and Satoru Miyano
Human Genome Center, Institute of Medial Science, The University of Tokyo, Japan
ABSTRACT One of the current critical steps of biological science is the
hypothesis generation from genome-wide data and the integration of various multi-omics data into a single, coherent view. To facilitate this, we are exploring the possibilities of multiple gene network matrices visualizations and are showing playful ways of interacting with the matrices. The goal is to create an environment, which would enable biologists to obtain insights from large biological multi-dimensional data.
KEYWORDS: Adjacency Matrix, Gene Networks, Multi-omics
Data, Information Visualization, Visual Analysis
INDEX TERMS: J.3 [Computer Applications]: Life and Medical Sciences—Biology and Genetics; H.5.2 [User Interfaces]: Interaction Styles
1 INTRODUCTION New technologies represented as Next-Generation Sequencing
(NGS) have enabled a comprehensive profiling of various types of multiple cellular variables assigned to each gene: mRNA quantity, protein quantity, Transcription Factor (TF) binding sites, Histone modification, etc.
From omics data, we generate gene regulatory networks, each of which is represented as an adjacency matrix. Multiple networks
from multiple data sources can be imagined as a third-order tensor consisting of adjacency matrices. We expect that the integrative analysis of such multiple matrices will produce richer hypothesis than separate analysis of each matrix.
2 BIOLOGICAL BACKGROUND We are assuming a 3-dimensional data space consisting of l
networks variables assigned to a matrix of n x m genes. By way of n x m x l we obtain a third-order tensor T, where and element T(i, j, k) represents the edge between gene i and gene j in network k.
Hierarchical clustering is applied to the tensor before visualization. We are calculating a squared Euclidian distance between the two first order slices, which corresponds to gene i1 and i2 as follows:
The second and third order slices are also reordered in a similar fashion. The slices of each order are visualized using 2 opposite colors,
2.1 CANCER CO-EXPRESSION NETWORKS AS ADJACENCY MATRIX MULTIPLES
We obtained over 260 mRNA expression datasets from the
GEO database along the following criteria: • Published after 2005 • Obtained by a major microarray platform • Contain more that 50 samples • Have the keyword 'Cancer'
Human Genome Center, Institute of Medical Science University of Tokyo, 4-6-1 Shirokanedai, Minatoku Tokyo 108-8639, Japan *e-mail: [email protected]
€
d2(T(i1,:,:),T(i2 ,:,:)) =j=1
m
∑ (T(i1, j,k),T(i2 , j,k))2
k=1
l
∑

We then created a weighted co-expression network for each dataset and calculated Pearson's correlation coefficient c between every gene pair as edge weights, which were then subject to a Fisher transformation. We also calculated the average of the absolute edge weights as hubness for each gene. The hubness for each gene was summed across the networks and the 1000 genes with the largest hubness were selected for display.
Adjacency matrices representing each network were created, after edge weights were normalized so that the mean is 0 and the variance is 1. We set the maximum and minimum of edge weights to 5 and -5, if a gene was missing in a dataset, we set the edge weight to 0 in the corresponding matrix. Finally, because of incoherent data, a total of 100 gene interaction matrices were obtained.
3 WHAT ARE THE CONTRAINTS For the purpose of this paper, we concentrate on the
visualization of 100 gene interaction adjacency matrices, each consisting of 1000 x 1000 genes. The challenge is provide on overview of the data while at the same time allow for visual comparison of subset of the networks.
With 100 matrices each consisting of 1000 x 1000 genes, the hope of displaying all the data simultaneously is in vain. The conceptual approach of showing the tensor data directly as 3d pixel heat maps, as we touched upon in Stacked Matrix, also showed that 3D is ill-suited for this task for various reasons.
4 WHAT (DO WE THINK) DOES THE BIOLOGIST WANT? We aim to provide a tool for exploring and visually comparing
the adjacency matrices. Because of the size of each individual matrix exceeds the size of an average screen we need to find visualizations which enables us to investigate details, while at the same time, allows us to keep an overview.
5 VISUALIZATION TECHNIQUES
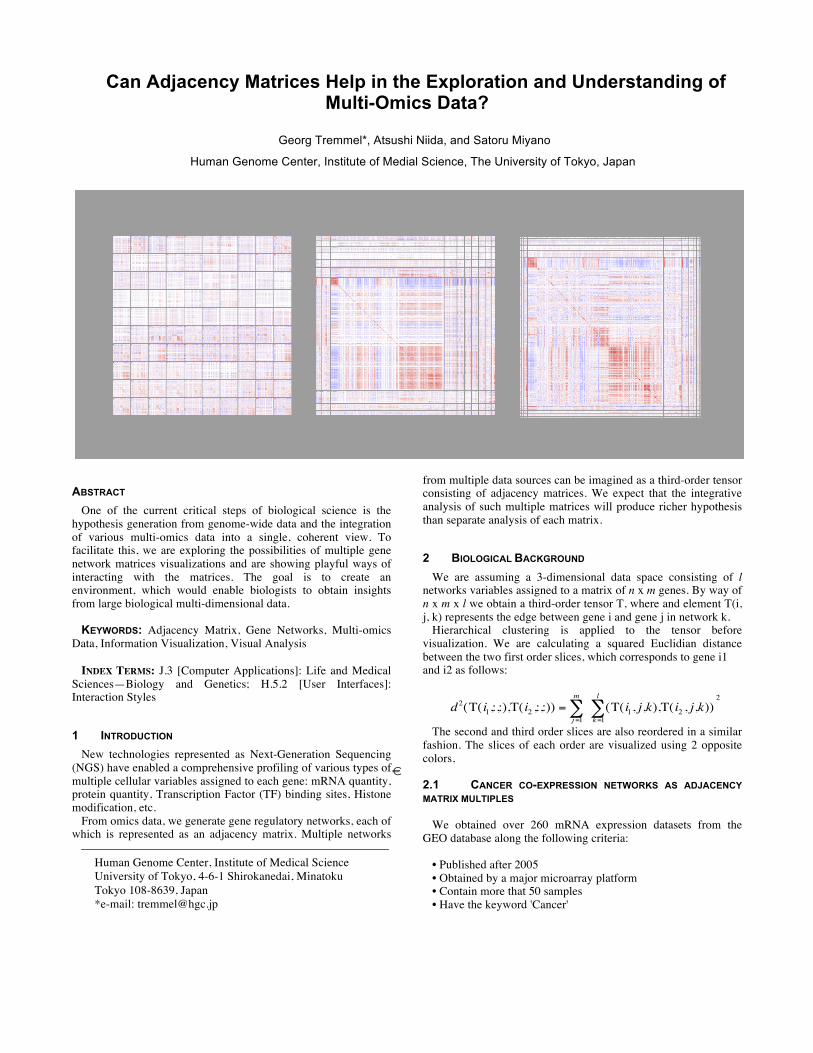
5.1 Overview: Small Multiples The 100 adjacency matrices are display as small multiples in a
matrix of 10 x 10 matrices to provide a visual overview.
5.2 Details: 2D Bifocal Enlargement
By selecting one particular matrix, it is uniformly enlarged, while at the same time the adjoined matrices are non-uniformly scaled to provide context. The non-uniform distortion of the matrices makes optimal use of the remaining screen estate at the cost of providing lower levels of detail.
Figure 2 shows the bifocal enlargement of matrix.
5.3 More and Multiple Details: Selecting Subsections
As the maximum enlargement of a matrix still does not
accommodate a 1000 x 1000 genes adjacency network on most screens, we also suggest to further select a subsection of the gene network for further inspection and highlighting. The sub selection [Figure 3] will also applied to the other matrices, making it possible to visually compare subsections across matrixes as small multiples.
Figure 3. Zooming into a subsection of an adjacency matrix, while the focus is on a particular matrix.
Figure 4. Overview of zooming into a subsection of an adjacency matrix
6 CONCLUSION AND OUTLOOK The combination of small multiples and selective zooming
allows for the quick comparison and exploration of possible relevant biological information and therefore can be helpful in the processes of hypothesis creation. In the examples in this paper we focused on matrices consisting of 1000 x 1000 genes and 100 interaction matrices thereof. In the future, we are aiming to explore other kinds of hypothetical tensor data and explore the upper limits of this visualization method.
REFERENCES [1] Edgar R, Domrachev M, Lash AE. Gene Expression Omnibus:
NCBI gene expression and hybridization array data repository, Nucleic Acids Res. 2002 Jan 1;30(1):207-10
[2] E. R. Tufte. The Visual Display of Quantitative Information. Graphics Press, Cheshire, Connecticut, 2001.
[3] Stein, K., Wegener, R., and Schlieder, C. (2010). Pixel-Oriented Visualization of Change in Social Networks. In Proceedings of the International Conference on Advances in Social Networks Analysis and Mining (ASONAM), pages 233–240, Los Alamitos, CA, USA. IEEE Computer Society.
[4] Holmquist, L.E. Focus+context visualization with flip zooming and the zoom browser. CHI '97 extended abstracts on Human factors in computing systems.
![Skew-adjacency matrices of graphs€¦ · adjacency matrices in Section 3. These relations and those for other matrices of graphs may be found in [8]. InSection4,theskewco-spectralcharacterizationofodd-cyclegraphsisproved(Theorem4.2).Eq](https://img.dokumen.tips/doc/110x75/5f1f54303fa6f02e775182cd/skew-adjacency-matrices-of-graphs-adjacency-matrices-in-section-3-these-relations.jpg)

![Spectral distributions of adjacency and Laplacian matrices ...users.stat.umn.edu/~jiang040/papers/Adj_Markov5.pdf · routing in graphs, one can see [15]. Although there are many matrices](https://img.dokumen.tips/doc/110x75/5fc5c36ad951d42aad3d1c2f/spectral-distributions-of-adjacency-and-laplacian-matrices-usersstatumnedujiang040papersadj.jpg)