Embed Size (px)
Citation preview

CAMPUT 2016 Energy Regulation Course:
Electricity Industry Overview
Geoff Smith
Director, Government Relations, CEA

The Canadian Electricity Association (CEA)
• Founded in 1891, the Canadian Electricity Association is the
national forum and voice of the evolving electricity business in
Canada.
• Mission Statement: A safe, secure, reliable, sustainable and
competitively-priced supply of electricity is essential to Canada’s
prosperity.
Page 2

CEA’s Corporate Utility Members
Page 3

Generating Electricity
• Affects of moving magnets
past wire.
• Moving magnets past a wire
makes electrons move
through it, thereby
generating electricity.
• Energy can neither be
created nor destroyed -it
can only be transformed
(converted) from one form
to another
Page 4

Page 5

Page 6

Page 7

Page 8

Canada’s Multi-Jurisdictional Environment
Page 9
Jurisdictional Division of Responsibility
Provincial/Territorial Governments Federal Government
• Resource management within
provincial boundaries
• Intra-provincial trade and commerce
• Intra-provincial environmental
impacts
• Generation and transmission of
electrical energy
• Conservation and demand response
policies
Resource management on frontier
lands
Nuclear safety
Inter-provincial and international trade
Trans-boundary environmental
impacts
Environmental impacts where federal
lands, investment or powers apply
Codes, standards and labeling relating
to conservation and demand
Other policies of national interest
Canada’s Regulatory Regime for Energy
Projects
Page 10
Environmental Assessment Process PermittingPlanning Follow-up
Species at Risk Act - EC/DFO
Canadian Env ironmental Assessment Act - CEA Agency *
Explosiv es Act - NRCan
Fisheries Act - DFO
NWPA - TC
Metal Mining Ef f luent Regulations - EC/DFO
National Energy Board Act - NEB*
Nuclear Saf ety and Control Act - CNSC*
Impact rev iews (YESAA, MVRMA Land Claim / CEAA)
Innuv ialuit Final Agreement - INAC* Management Boards
Territorial Lands / Water ActLand use plans
Others: MBCA / IBWTA / CPRA / Of f shore Accords / CEPA
*Permits required under other Acts trigger CEAA OGD participants
Illustrative – some components would not apply to same project
NWPA – Navigable Waters Protection Act / YESAA – Yukon Environmental and Socio-Economic Assessment Act
MVRMA – Mackenzie Valley Resource Management Act / MBCA - Migratory Birds Convention Act /
IBWTA – International Boundary Waters Treaty Act / CPRA – Canadian Petroleum Resource Act /
Offshore Accords – Canada - NS and NFLD Offshore Accords / CEPA – Canadian Environmental Protection Act

Electricity Demand in Canada by Sector, 2014
Page 11
Transportation 1%
Public Administration 3%
Industrial 43%
Residential 33%
Commercial & Institutional
18%
Agriculture 2%
Total Electricity Demand in Canada, 2014 = 491.22 TWh
*Numbers may not sum to 100 percent due to rounding
Source: Statistics Canada, Catalogue no 57-003-X, Report on Energy Supply and Demand in Canada, 2014 preliminary
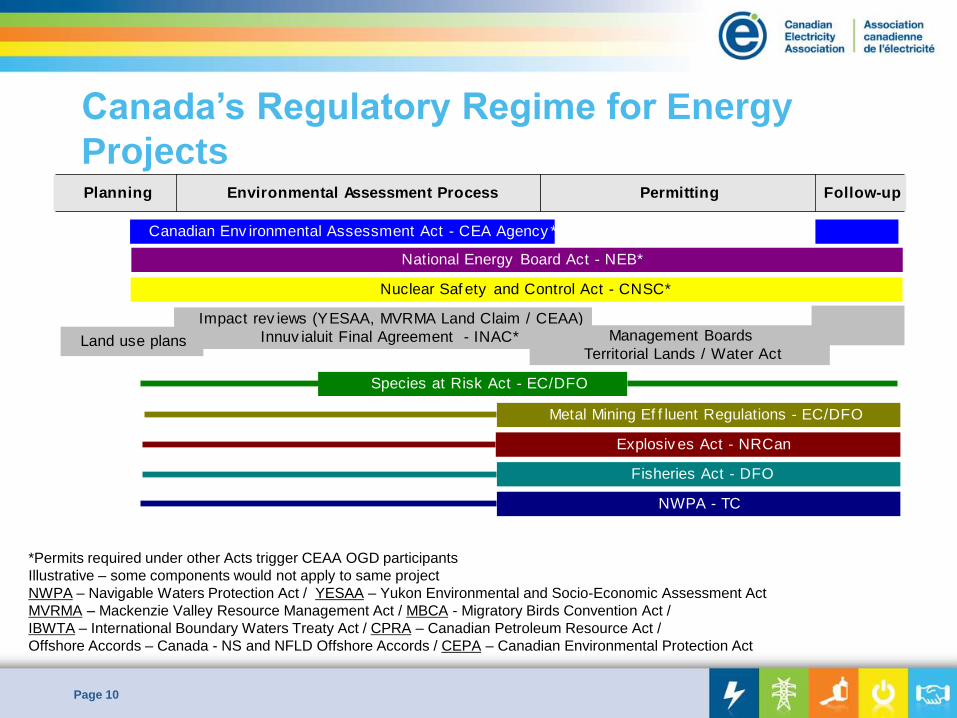
Canada’s Future Residential Electricity
Needs
Page 12
Reference: Graphics from BC Hydro: Lighting the Way. Estimates based on a
business as usual scenario. Stats Canada Population Projections: Table 052-0005

Electricity Generation in Canada by Fuel Type,
2014
Page 13
Hydro 60.6%
Conventional Steam 14.6%
Nuclear 16.2%
Internal Combustion 0.3%
Combustion Turbine 6.5%
Tidal 0.00%
Wind 1.8%
Solar 0.05%
Total Electricity Generated in Canada, 2014 = 627.68 TWh
*Numbers may not sum to 100 percent due to rounding.
Source: Statistics Canada, Electric power generation, by class of electricity producer, annual (CANSIM Table 127-0007), 2013
Retrieved Nov 26, 2015

Electricity Generation in Canada by
Province and Fuel Type, 2014
Page 14
Total Electricity Generation in Canada, 2014 = 627.68 TWh
0
50
100
150
200
250
BC AB SK MB ON QC NB* NS PEI NFLD
Gen
era
tio
n (
TW
h)
Solar
Tidal
Wind
Combustion Turbine
Internal Combustion
Nuclear
Conventional Steam
Hydro
Source: Statistics Canada, Electric power generation, by class of electricity producer, annual
(CANSIM Table 127-0007), 2013
Retrieved Nov 26, 2015
75.8 67
35.6
16.3
41.1
0.6
157.1
10.6
199.9
22.3
*Point Lepreau nuclear generating station resumed power production on November 23, 2012, nuclear has been re-established as a major
source (about 30%) of electricity in New Brunswick.
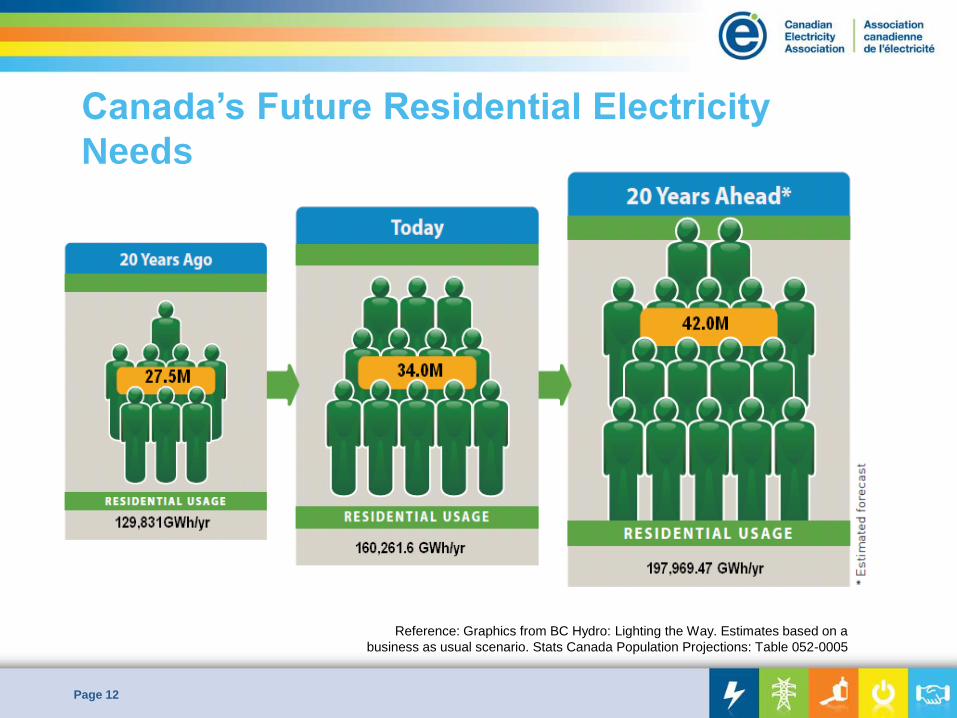
Installed Wind Capacity in Canada as of
December 2015
Page 15 Source: Canadian Wind Energy Association, retrieved September 10, 2014

Page 16

Coal Fleet Profile (MW)
Page 17 (Source: NPRI data).
0
2000
4000
6000
8000
10000
12000
14000
16000
18000
Cap
acit
y (
MW
)
Coal Capacity Reduction - Retirement as per the Coal Regulation*
* Retirement age 45-50 years as per the 2012 Reduction of Carbon Dioxide Emissions from Coal-
Fired Generation of Electricity Regulations. Includes Ontario coal shutdown by 2014.

Greenhouse Gas (GHG) Emissions in
Canada and the US by Sector, 2014
Page 18
Transportation23.4%
Oil & Gas26.3%
Electricity & Heat Generation
10.7%
Agriculture10.0%
Industrial Processes
10.4%Residential
6.3%
Commercial & Institutional
5.6%
Waste 7.4%
Total GHG Emissions in Canada, 2014 = 732 Mt CO2 Equivalent
Source: Environment Canada, National Inventory Report and US GHG Emissions and Sinks 1990- 2014, retrieved April, 2016
Inventory of U.S. Greenhouse Gas Emissions and Sinks, 1990-2014, retrieved April 2016
Electric Power Industry 30.3%
Transportation 26.4%
Industry 21.3%
Agriculture 9.1%
Commerical 6.6%
Residential 5.7%
U.S. Territories 0.7%
Total GHG Emissions in US, 2014 = 6,108 Mt
CO2 Equivalent

Electricity leading all Canadian industrial
sectors in reduction of CO2
Page 19
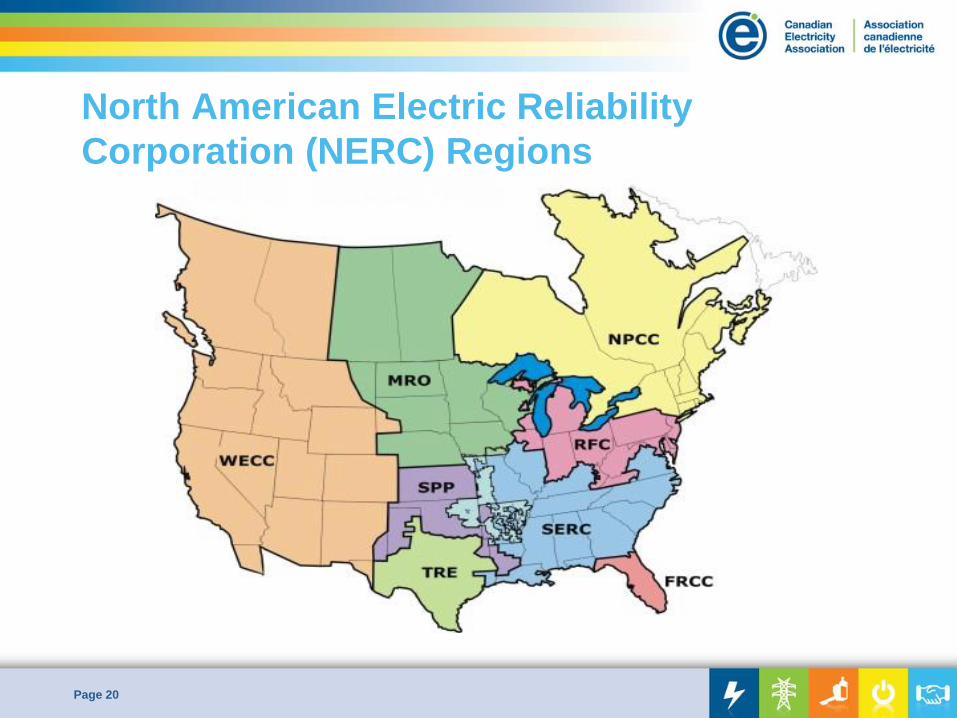
North American Electric Reliability
Corporation (NERC) Regions
Page 20

Major Canada-U.S. Transmission
Interconnections
Page 21
Map copyright CEA.
Lines shown are 345kV and above. There are
numerous interconnections between Canada and the
U.S. under 345KV that do not appear on this map.

• Manitoba Hydro (MH): 500 kV line
to U.S. border.
• Minnesota Power (MP): 500 kV
line from border to Duluth.
• “Hydro by wire” from Manitoba
enables “wind by wire” from North
Dakota.
• Overall project enhances regional
reliability and provides energy
market benefits.
• 2020 expected in-service date.
Page 22
Winnipeg
HVDC Line +/- 500kV
(600 miles)
HVDC Line +/- 500kV
(850 miles)
Manitoba
Hydro
Minnesota
Power
Manitoba-Minnesota Transmission Project
New Line
Existing Line

Major Canada-U.S. Transmission Interconnections
Page 23 Source: National Energy Board

Page 24
Electricity Exports and Imports Between
Canada and the U.S. (2014)
Data displayed are in gigawatt hours
Numbers may not sum due to rounding
Source: National Electricity Board, Export and Imports, 2014.
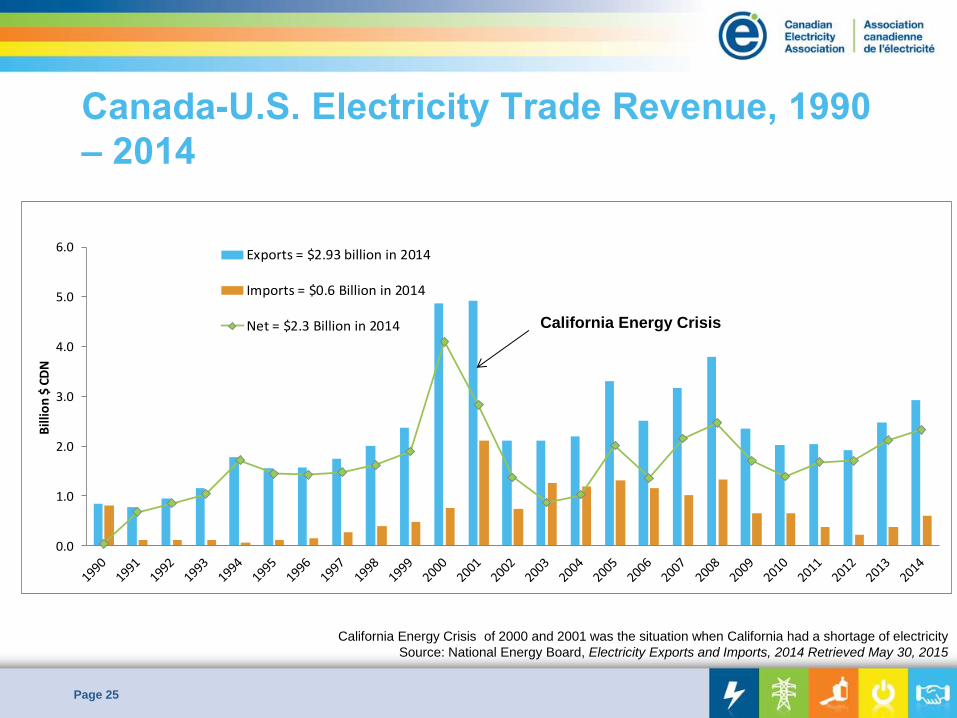
Canada-U.S. Electricity Trade Revenue, 1990
– 2014
Page 25
California Energy Crisis of 2000 and 2001 was the situation when California had a shortage of electricity
Source: National Energy Board, Electricity Exports and Imports, 2014 Retrieved May 30, 2015
0.0
1.0
2.0
3.0
4.0
5.0
6.0
Bill
ion
$ C
DN
Exports = $2.93 billion in 2014
Imports = $0.6 Billion in 2014
Net = $2.3 Billion in 2014 California Energy Crisis
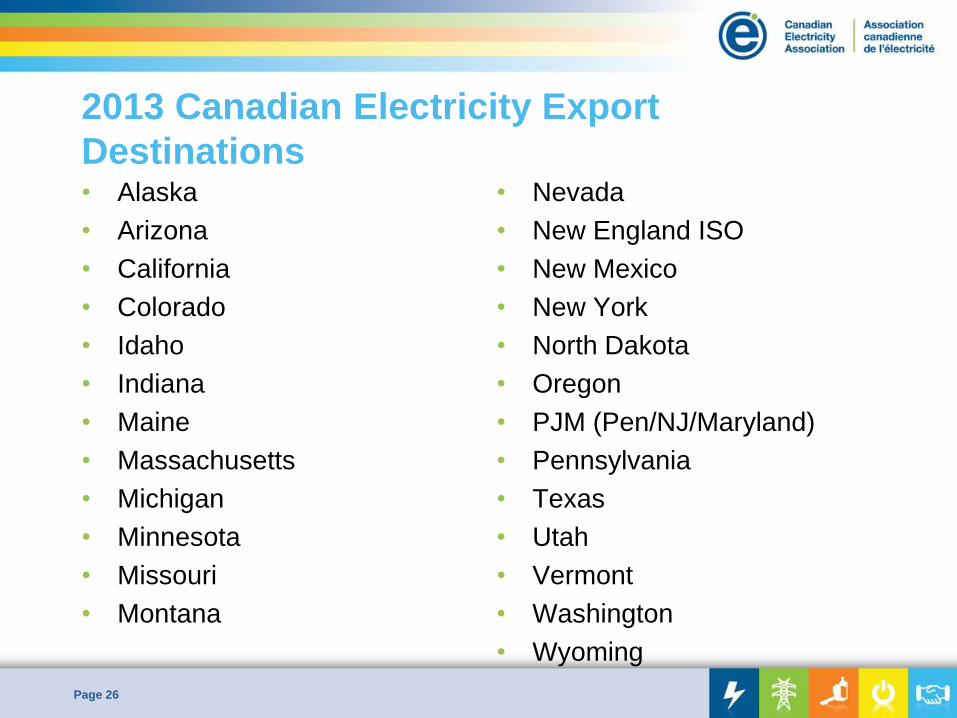
2013 Canadian Electricity Export
Destinations • Alaska
• Arizona
• California
• Colorado
• Idaho
• Indiana
• Maine
• Massachusetts
• Michigan
• Minnesota
• Missouri
• Montana
• Nevada
• New England ISO
• New Mexico
• New York
• North Dakota
• Oregon
• PJM (Pen/NJ/Maryland)
• Pennsylvania
• Texas
• Utah
• Vermont
• Washington
• Wyoming
Page 26

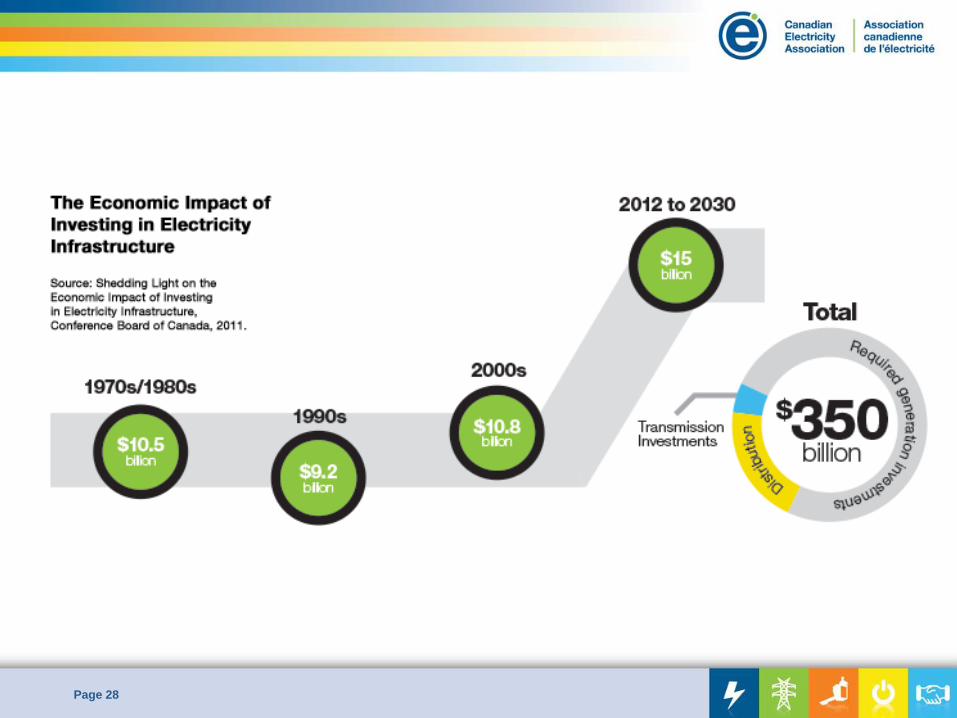
Building the Next Generation of
Infrastructure: Capital Investment
Requirements
Page 27
Billions of 2010 CDN dollars
Generation Transmission Distribution Total
2010 – 2030 195.7 35.8 62.3 293.8
Source: The Conference Board of Canada, Shedding Light on the Economic Impact of Investing in Electricity Infrastructure,
February 2012
Total Canadian Electric Sector Investment Required by 2030 =
293.8 Billion in 2010 CDN dollars, or 347.5 Billion in current CDN dollars.
Page 28
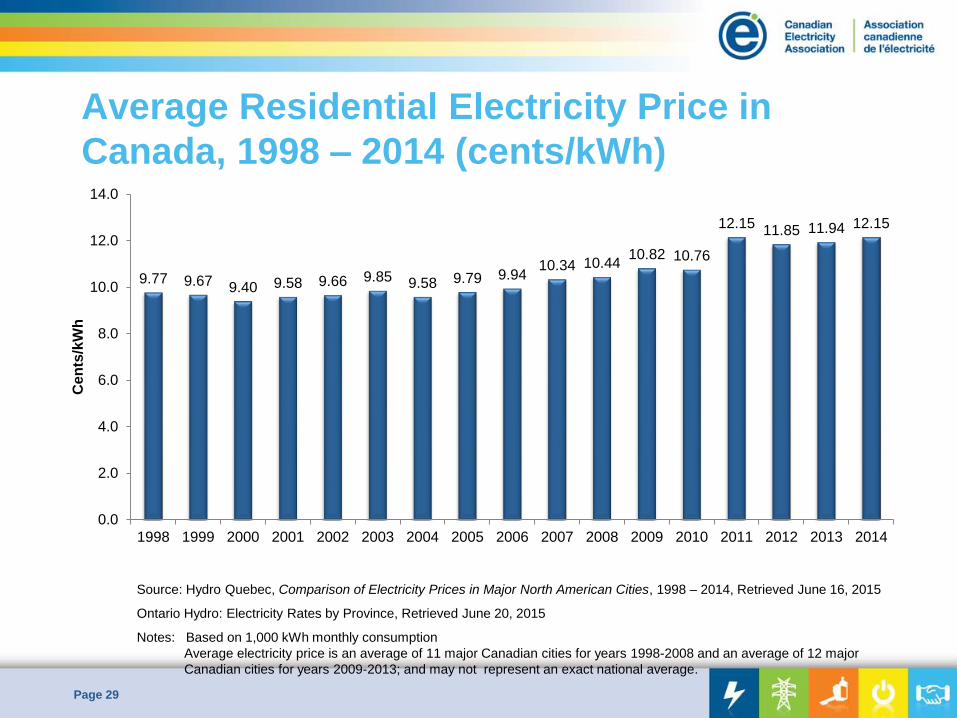
Average Residential Electricity Price in
Canada, 1998 – 2014 (cents/kWh)
Page 29
9.77 9.67 9.40 9.58 9.66 9.85 9.58 9.79 9.94 10.34 10.44
10.82 10.76
12.15 11.85 11.94 12.15
0.0
2.0
4.0
6.0
8.0
10.0
12.0
14.0
1998 1999 2000 2001 2002 2003 2004 2005 2006 2007 2008 2009 2010 2011 2012 2013 2014
Ce
nts
/kW
h
Source: Hydro Quebec, Comparison of Electricity Prices in Major North American Cities, 1998 – 2014, Retrieved June 16, 2015
Ontario Hydro: Electricity Rates by Province, Retrieved June 20, 2015
Notes: Based on 1,000 kWh monthly consumption
Average electricity price is an average of 11 major Canadian cities for years 1998-2008 and an average of 12 major
Canadian cities for years 2009-2013; and may not represent an exact national average.

Selected World Residential Electricity
Prices, 2014
Page 30
0 5 10 15 20 25 30 35 40 45
Mexico
Canada
United States
Turkey
Poland
Finland
France
Switzerland
Belgium
Japan
United Kingdom
Austria
Ireland
Italy
Denmark
US cents/kWh
Source : International Energy Agency, Key World Energy Statistics 2015 with 2014 data
Hydro Quebec, Comparison of Electricity Prices in North American Cities 2014

Selected World Industrial Electricity Prices,
2014
Page 31
0 5 10 15 20 25 30 35
United States
Canada
Poland
Denmark
Finland
Turkey
Mexico
France
Belgium
Switzerland
United Kingdom
Portugal
Ireland
Italy
US cents/kWh
Source : International Energy Agency, Key World Energy Statistics 2015 with 2014 data
Hydro Quebec, Comparison of Electricity Prices in North American Cities 2014
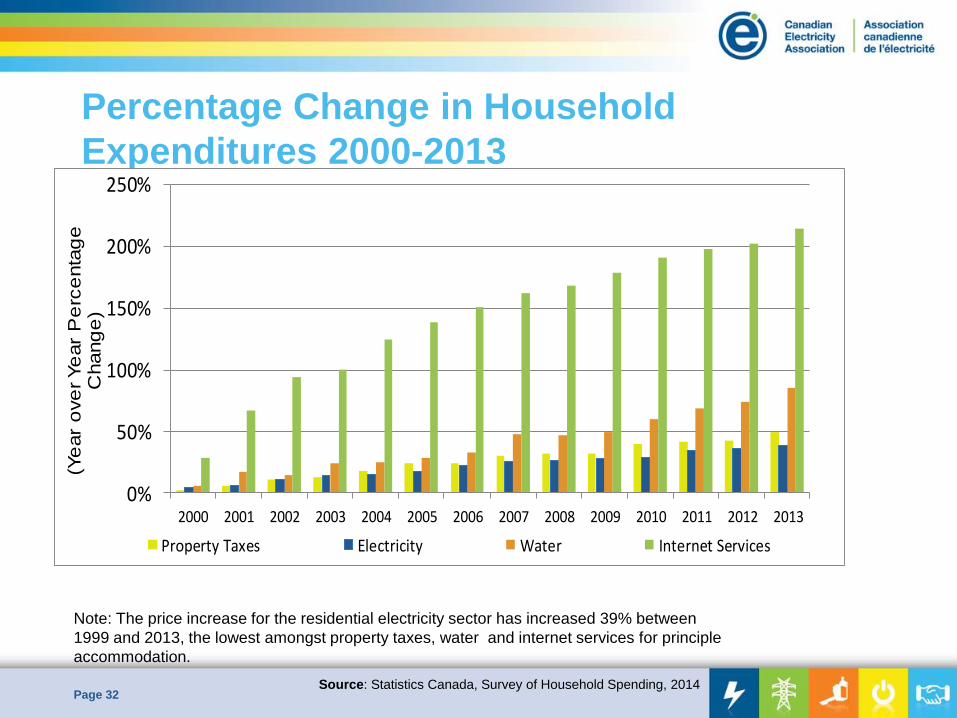
Percentage Change in Household
Expenditures 2000-2013
Page 32
0%
50%
100%
150%
200%
250%
2000 2001 2002 2003 2004 2005 2006 2007 2008 2009 2010 2011 2012 2013
(Ye
ar
ove
r Ye
ar
Pe
rce
nta
ge
C
hang
e)
Property Taxes Electricity Water Internet Services
Note: The price increase for the residential electricity sector has increased 39% between
1999 and 2013, the lowest amongst property taxes, water and internet services for principle
accommodation.
Source: Statistics Canada, Survey of Household Spending, 2014
Page 33
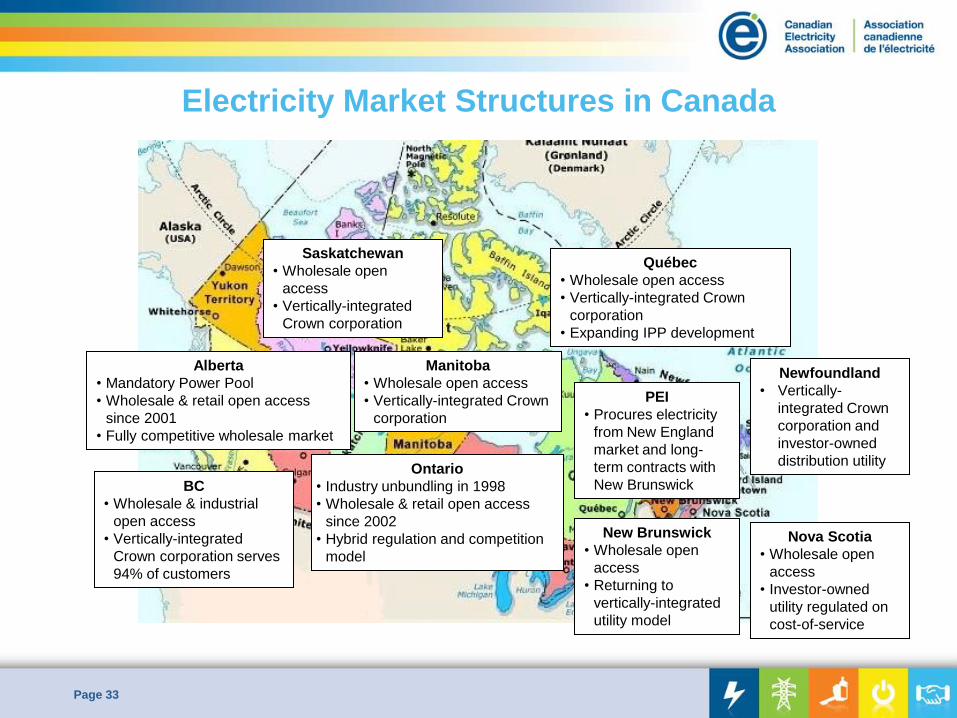
Saskatchewan
• Wholesale open
access
• Vertically-integrated
Crown corporation
Alberta
• Mandatory Power Pool
• Wholesale & retail open access
since 2001
• Fully competitive wholesale market
Manitoba
• Wholesale open access
• Vertically-integrated Crown
corporation
Ontario
• Industry unbundling in 1998
• Wholesale & retail open access
since 2002
• Hybrid regulation and competition
model
Québec
• Wholesale open access
• Vertically-integrated Crown
corporation
• Expanding IPP development
Newfoundland
• Vertically-
integrated Crown
corporation and
investor-owned
distribution utility
New Brunswick
• Wholesale open
access
• Returning to
vertically-integrated
utility model
Nova Scotia
• Wholesale open
access
• Investor-owned
utility regulated on
cost-of-service
BC
• Wholesale & industrial
open access
• Vertically-integrated
Crown corporation serves
94% of customers
PEI
• Procures electricity
from New England
market and long-
term contracts with
New Brunswick
Electricity Market Structures in Canada

EPRI: The Integrated Grid • REALIZING THE FULL VALUE OF CENTRAL AND DISTRIBUTED
ENERGY RESOURCES
Page 34
New York: Reforming the Energy Vision
(REV)
• New York will have a system operator at the
distribution (retail) level These Distributed System
Platform (DSP) Providers will serve as a retail-level
dispatcher for a grid supplied not only by traditional
power plants, but also by a vastly expanded fleet of
Distributed Energy Resources (DER).
• DER is defined in the REV order as:
• "including end-use energy efficiency,
• demand response,
• distributed storage,
• and distributed generation.
Page 35

For more information:
Geoff Smith
Director, Government Relations
Canadian Electricity Association
t 613.688.2064
www.electricity.ca
Page 36