Embed Size (px)
Citation preview

URBANICS CONSULTANTS LTD.
CAMPBELL RIVER EMPLOYMENT LAND STRATEGY STUDY

City of Campbell River
EMPLOYMENT LANDS STRATEGY STUDY
Prepared for: the City of Campbell River
August 2019
Prepared by: Urbanics Consultants Ltd.
Suite 1207 – 409 Granville Street, Vancouver BC, V6C 1T2

1
Executive Summary Urbanics Consultants Ltd. was retained by the City of Campbell River to conduct an Employment Lands Study for the City. The primary objectives of the study are to: • Create a comprehensive inventory of lands which includes:
o Existing supply of “employment lands” (industrial and commercial zoned land) of both developed and undeveloped employment lands;
o Size, ownership and potential best use of parcels according to industry trends; o Existing types of jobs and industry sectors in the City.
• Develop an employment strategy which addresses:
o General socio-economic conditions and trends in the City; o “Business ready” SWOT analysis of the City; o Highest and best use of land and identifying viable business classes that the City can consider pursuing.
To achieve these objectives, this study examines the socio-economic profile and economic base (aggregation of companies/ employers that generate jobs in the City). The study also projects future employment levels in the City to estimate potential demand for employment land over the next 20 years. The study uses a comprehensive employment land inventory and utilization analysis to estimate the available supply of employment land in the City. The reconciliation of the employment land supply, demand assessment, feedback received from the survey, stakeholder interviews and stakeholder consultation form the basis of the following findings and recommendations. The primary findings from the study are: EMPLOYMENT LAND SUPPLY
The City of Campbell River has 1,875 acres of land zoned for industrial uses and 615 acres of land zoned for commercial uses. The Table below sets out the gross area and percentage of each industrial and commercial land use type. As for commercial land, parcels zoned C–3, C–6, C–7 and C–8 represents a comparatively small percentage of the total number and land area, and as such, have been omitted from the Table.

2
LAND UTILIZATION • Industrial land utilization: In terms of utilization of the
industrially zoned land in the City, 80 percent of the I–1 zoned industrial land is fully utilized, with only 8.8 acres of land classified as vacant and 6.8 acres classified as underutilized land. By contrast, utilization for I–2 zoned industrial land is significantly lower than the other Industrial Zone classes. Only 18 percent of the zoned I–2 Industrial land is fully utilized, with 37 percent and 45 percent, respectively, classified as vacant or underutilized. Both of these land bases have strategic locations within the city and accommodate the largest number and broadest cross-section business activity.
• Airport land utilization: In terms of utilization of the Airport zoned land, 65 percent of the A–1 zoned airport land is classified as vacant. Lands zoned A-1 are airside and include both the runway area and the linear series of parcels on the east boundary of the airport.
Only 1 percent of A -2 airport land is utilized, which leaves 99 percent (approximately 1,110 acres) as vacant land. However, much of the A-2 land adjacent to the airport has practical limitations to its development - primarily physical characteristics, and ownership. However, A-2 lands that straddle Jubilee Parkway, east of the Airport have potential for development with lands north of the Parkway having more favourable topography, comparatively few riparian limitations, and lands south having a significantly higher degree of riparian sensitivity impacting the physical development.
• Commercial land utilization: Since there is comparatively small land base associated with parcels zoned: C–3, C–6, C–7 and C – 8, the study’s focus is on C–1, C–2, C–4 and C–5 zoned commercial land. With regard to C-1 Zoned lands, 79 percent (130 acres) is classified as fully utilized (discounting building condition),11% (18 acres) of the C–1 zoned commercial land is classified as vacant and 10% (16.6 acres) of the C–1 zoned commercial land is classified as underutilized. C–2 has only 4.7 acres of vacant land available. C–4 has the largest zoned land area and 54.8 acres of vacant land available. There are also 21.7 acres land available in C–5 zoning.
ZONE PERCENT SIZE (ACRES)
I-1 4 75
I-2 40 750
I-3 48 900
I-4 8 150
TOTAL 100 1875
C-1 27 166
C-2 9 55
C-4 38 234
C-5 23 142
TOTAL 97 597
Table 1: Breakdown of Industrial & Commercial Zoned Areas

3
EMPLOYMENT LAND DEMAND
• Industrial land demand In low-density development scenario, a total of 160 acres of industrial land will be needed by 2040; a high-density development scenario requires a total of 80 acres of industrial land by 2040.
• Commercial land demand
Office space. There is no new demand projected for office space within the period scope of the study. Office employment is expected to grow from 919 jobs in 2016 to 1,213 jobs in 2040. Warranted office space will grow from approximately 276,000 square feet to 364,000 square feet. However, the current total office space (369,000 square feet) is considered to be an adequate supply until 2040 (discounting building condition).
Retail space. There is projected demand for approximately 140,000 square feet of additional retail floorspace by 2035. About 380,000 accumulated retail space will be needed by 2040. With a FAR (floor area ratio – the ratio of the total floor area of a building (gross floor area) to the size of the associated parcel of land) of 0.35, there is estimated new demand for approximately 9 acres of commercial land by 2035. About 16 acres can be expected to be added by 2040, totalling about 25 acres of required new commercial land by 2040.
CAPACITY AND ADEQUACY OF EMPLOYMENT LANDS
• Capacity and adequacy of industrial lands: In terms of the total industrial land supply, there is sufficient inventory for future employment growth as a whole. However, there are caveats that include the potential limitations to practical development potential of some Industrially zoned land. In addition, land zoned for light industrial will be expected to grow faster than heavy industrial. There will not be a sufficient supply of zoned and serviced light industrial land to accommodate future growth.
• Capacity and adequacy of commercial lands: Given the current supply of commercially zoned land, the additional need for 25 acres for future development can be accommodated by the current vacant commercial land supply, potential in-fill development or otherwise redevelopment of low FAR properties adjacent to and within the downtown core. Little additional demand is anticipated for the primary village centers such as Dogwood/ 2nd Avenue, Dogwood/ Merecroft, Dogwood/ Hilchey, Dogwood/ Jubilee, Willow Point, and Campbellton.

4
RECOMMENDATIONS
• Capitalize on existing industrial base: Capitalize on the existing, established industrial base of the City by promoting manufacturing, especially related to value-added wood industries. There is an opportunity to enhance research and development to increase innovation in processing and manufacturing of value-added wood products. These can include such commodities as fabrication of specialized construction materials, log homes and furniture. The focus of a marketing strategy would be on innovation, synergy, quality, and location.
• Shift to more light industrial usage: The industrial base of the City is displaying lower demand for heavy industry and greater
demand for light industry. However, there can be a synergistic relationship between heavy and light industries. The sectors of forestry, aquaculture and aerospace can be a key focus. However, floorspace and vacant land to accommodate growth in the light industrial sector is low compared and warrants further attention and potential supply interventions.
• Pursue/ attract businesses that are involved in high-tech and consulting services: Businesses that are involved in high-
tech and consulting services rely less on transportation and place greater value on the quality of life for innovation employees. Maintaining an excellent work-life balance is a great attraction for people working in This sector. The City’s broadband network (CRadvantage) is a significant locational inducement for business and people working in high-tech and consulting services. In addition, such businesses can complement the resource-based economy by providing niche research and innovation such as for value-added wood products.
• Office space utilization: Due to the high vacancy rate for office space, the City could investigate the viability of developing an
“incubation center” or “collaboration space” for entrepreneurs by collaborating with associated property owners to facilitate the utilization of vacant office space – this also contributes to a sense of economic vibrancy of the downtown. If priced appropriately and marketed, such space could attract start-ups. High-tech and consulting service entrepreneurs do not need or seek a large floor space commitment at business start-up. However, they do need a space to launch their business, meet clients, and potentially collaborate with other entrepreneurs. An incubation center or collaboration space would be attractive to start-up entrepreneurs and, in the future, can be the place to promote the City’s programs for business attraction.
• Enhance downtown vibrancy: there is a relatively high commercial vacancy rate in the City though recent information from
local relators indicates that relative vacancy rates are beginning to trend downward. To reduce the commercial vacancy rate, the City can consider a number of options that range from minor to major intervention:
5
o Supporting the efficiency and effectiveness of the downtown BIA by increasing the budget allocated to downtown BIA for
advertisement and promotion; o Collaborating with merchants in the City to create a complete shopping experience for local residents, as well as, tourists, for
example:
- by continuing to organize people enticing events such as a 4-season festival event schedule, - facilitating retail merchandising workshops by professional merchandisers to maximize the visual impact on passing foot
traffic, - maintaining a façade improvement program, - establishing relatively similar business hours particularly during summer months when foot traffic can be expected to be
higher and in association with downtown events. o Building on previous work such as “Refresh Downtown Campbell River”, a continued focus of strategic investment in
programmed downtown place-making and experience enrichment, will boost downtown shopping visits and stays both of which typically translate into increased trade. An iconic downtown experience can also be a significant tourism draw. This can translate into greater economic vibrancy, which in turn, promotes reinvestment and employment.
o A continued emphasis of facilitating the development of downtown residential can also contribute to the economic vibrancy of
the downtown.
o Continue to invest in and develop more anchor attractions such as the Tidemark Theatre, Community Center, art gallery, Spirit Square, and public library for instance, in addition to investment in streetscape beautification projects and iconic public art installations, for example.
• Prepare for long term growth in the downtown: over the long term, the downtown can expect to add more commercial
floorspace to the existing inventory. While some infill and redevelopment opportunities exist, there is value in strategic planning for expansion of commercial floorspace in the area north of Shoppers Row to Dogwood Street. Under certain land ownership scenarios, land assembly can make future development more complicated and uncertain. Consider opportunities to partner with North Island College for downtown student housing.
6
• Promote tourism: Capitalize on the existing tourism resource base of the City and continue to both market the exceptional Campbell River and District experience and invest in the complementary infrastructure, such as the Discovery Fishing Pier or the Elk Falls Suspension Bridge, for example. Explore opportunities to reinforce and market Campbell River as an off-season mountain sports hub given its location between Mount Washington and Mount Cain.
• Promote education and skills development: Promote education in the City at the post-secondary level. Innovative industries
will need skilled labor, especially in the aviation industry. The City can consider the possibility of collaborating with North Island College and the major aviation employers to design a work-study program for students, for example.
• Possibility of light industrial park: The City can investigate the possibility of facilitating the development of a new light industrial park located on the A-2 zoned land. The Airport zoned land (A-2) is almost vacant and has access to both a major highway and airport. A major employer in aviation industry has located in the airport and is expecting to expand operations in the next few years. A state-of-the-art light industrial park accommodating innovative industries can be a business attraction advantage for the City.
LIMITATIONS
This study relies on data from a variety of sources, including Statistics Canada, BC Stats, and many others. Though efforts have been taken to ensure the completeness and accuracy of the information provided, it must be stated that this study may be impacted by the quality and availability of its underlying data. It should also be noted that this study does not assess the impact of industrial development on the First Nation Lands nor the challenges posed by contamination in any of the industrial areas in the City of Campbell River. It is expected that these two factors will potentially affect industrial and commercial development in the City of Campbell River, and efforts should be made to explore their potential impact.

7
Table of Contents Executive Summary ........................................................................................................................................................................... 1
List of Figures .................................................................................................................................................................................... 9
List of Tables .................................................................................................................................................................................... 11
1. Introduction ............................................................................................................................................................................... 13 1.1 Contextual overview ........................................................................................................................................................ 13 1.2 Employment Land Study ................................................................................................................................................. 14 1.3 Methodology ..................................................................................................................................................................... 14
1.3.1 Review of previous studies and policies governing land use ............................................................................................................ 14 1.3.2 Demographics analysis .................................................................................................................................................................. 15 1.3.3 Economic base analysis ................................................................................................................................................................ 15 1.3.4 Supply analysis .............................................................................................................................................................................. 15 1.3.5 Demand Analysis ........................................................................................................................................................................... 15 1.3.6 Community engagement ................................................................................................................................................................ 15 1.3.7 Findings and Recommendations ................................................................................................................................................... 16 1.3.8 Limitations ...................................................................................................................................................................................... 16
2. Demographic Analysis ............................................................................................................................................................. 17 2.1. Vancouver Island and Coast Context ............................................................................................................................. 17 2.2. The City of Campbell River Context ............................................................................................................................... 19
2.2.1. Historical Population Growth ......................................................................................................................................................... 19 2.2.2. Historical Population Composition ................................................................................................................................................ 21 2.2.3. Population Projection .................................................................................................................................................................... 24
3. Economic Base Analysis ......................................................................................................................................................... 27 3.1. Provincial economy ......................................................................................................................................................... 27 3.2. Historical Employment Trends ....................................................................................................................................... 28 3.3. Location Quotient Analysis ............................................................................................................................................. 33 3.4. Employment Projection ................................................................................................................................................... 35

8
3.5. Online Survey Summary .................................................................................................................................................. 39 3.6. Businesses Profile ........................................................................................................................................................... 39 3.7. Potential growth industries ............................................................................................................................................. 41
4. Industrial Zoning Summary ..................................................................................................................................................... 43
5. SWOT Synopsis ........................................................................................................................................................................ 45
6. Competitive Position in the Employment Land Market ......................................................................................................... 47
7. Land Supply Analysis ............................................................................................................................................................... 48 7.1. Supply of Land by Zoning Type ...................................................................................................................................... 48
7.1.1. Supply of Industrial Land by Zoning Type ..................................................................................................................................... 50 7.1.2. Supply of Utilized and Underutilized Industrial Land ..................................................................................................................... 51 7.1.3. Size of Industrial Land by Zoning Type ......................................................................................................................................... 52 7.1.4. Airport land .................................................................................................................................................................................... 52
7.2. Supply of Commercial Land ............................................................................................................................................ 57 7.2.1. Supply of Commercial Land by Zoning Type ................................................................................................................................ 57 7.2.2. Supply of Utilized and Underutilized Commercial Land ................................................................................................................ 58 7.2.1. Size of Commercial Land by Zoning Type .................................................................................................................................... 61
8. Land Needs Analysis ................................................................................................................................................................ 61 8.1. Industrial Land Needs Analysis ...................................................................................................................................... 61 8.2. Office Needs Analysis ...................................................................................................................................................... 64 8.3. Commercial Land Needs Analysis .................................................................................................................................. 65
8.3.1. Trade Area Delineation ................................................................................................................................................................. 65 8.3.2. Per Capita Retail Expenditure ....................................................................................................................................................... 66 8.3.3. Total Expenditure Potential in Primary Trade Area ....................................................................................................................... 66 8.3.4. Total Expenditure Potential in Secondary Trade Area .................................................................................................................. 68 8.3.5. Warranted Floor Space ................................................................................................................................................................. 70
9. Main Findings ............................................................................................................................................................................ 76
10. Recommendations ............................................................................................................................................................... 78

9
Appendix 1 ........................................................................................................................................................................................ 81
Appendix 2 ...................................................................................................................................................................................... 108
Examples/ Typologies of Tenant Mix in Industrial Zones and Airport Zoned Lands .............................................................. 115 Campbellton Neighborhood ..................................................................................................................................................................... 115 North Campbell River Neighborhood ....................................................................................................................................................... 116 Northwest of Campbell River ................................................................................................................................................................... 117 Campbell River Airport ............................................................................................................................................................................. 118 Quinsam Heights Neighborhood .............................................................................................................................................................. 119 West of middle Inland Island Highway ..................................................................................................................................................... 119
List of Figures Figure 1: Map of City of Campbell River, Study Area ....................................................................................................................... 13 Figure 2: Population Projections by Age Groups, Vancouver Island & Coast DR ........................................................................ 18 Figure 3: Historical Population in Campbell River & SRD ............................................................................................................... 20 Figure 4: Age Distribution in the City of Campbell River ................................................................................................................. 21 Figure 5: Historical Population by Age-cohort & Median Age ......................................................................................................... 22 Figure 6: Age Distribution in the SRD ................................................................................................................................................ 23 Figure 7: Past & Projected Population of Campbell River In Moderate & High Growth Scenarios .............................................. 25 Figure 8: Population Projection Distribution – the City of Campbell River (2019-2040) ............................................................... 26 Figure 9: Business Profile ................................................................................................................................................................... 40 Figure 10: Light Industry Property Tax In 2018 ................................................................................................................................. 47 Figure 11: Major industry property tax in 2018 ................................................................................................................................. 47 Figure 12: Total Supply of by Land Zoning Type .............................................................................................................................. 49 Figure 13: Supply of Industrial Land by Zoning Type ...................................................................................................................... 50 Figure 14: Employment Land in A-1 and A-2 Zoning ....................................................................................................................... 53 Figure 15: Employment Land in A - 1 Zoning .................................................................................................................................... 54 Figure 16: Employment Land in A - 2 Zoning .................................................................................................................................... 55 Figure 17: Supply of Commercial Land by Zoning Type .................................................................................................................. 58 Figure 18: Warranted Office Space Projection from 2016 to 2040 .................................................................................................. 64

10
Figure 19: Commercial Land Distribution: C - 1 - C - 3 .................................................................................................................... 81 Figure 20: Commercial Land Distribution: C - 4 ............................................................................................................................... 82 Figure 21: Commercial Land Distribution: C - 5 ............................................................................................................................... 83 Figure 22: Commercial Land Distribution: C – 6 ............................................................................................................................... 84 Figure 23: Commercial Land Distribution: C - 7 & C – 8 .................................................................................................................. 85 Figure 24: Employment Land: C - 1 .................................................................................................................................................... 86 Figure 25: Employment Land: C - 2a .................................................................................................................................................. 87 Figure 26: Employment Land: C - 2b ................................................................................................................................................. 88 Figure 27: Employment Land: C - 3 .................................................................................................................................................... 89 Figure 28: Employment Land: C - 4a .................................................................................................................................................. 90 Figure 29: Employment Land: C - 4b ................................................................................................................................................. 91 Figure 30: Employment Land: C - 4c .................................................................................................................................................. 92 Figure 31: Employment Land: C - 4d ................................................................................................................................................. 93 Figure 32: Employment Land: C - 4e .................................................................................................................................................. 94 Figure 33: Employment Land: C - 5a .................................................................................................................................................. 95 Figure 34: Employment Land: C - 5b ................................................................................................................................................. 96 Figure 35: Employment Land: C - 5c .................................................................................................................................................. 97 Figure 36: Employment Land: C - 6a .................................................................................................................................................. 98 Figure 37: Employment Land: C - 6b ................................................................................................................................................. 99 Figure 38: Employment Land: C - 6c ................................................................................................................................................ 100 Figure 39: Employment Land: C - 6d ............................................................................................................................................... 101 Figure 40: Employment Land: C - 7 .................................................................................................................................................. 102 Figure 41: Employment Land: C - 8a ................................................................................................................................................ 103 Figure 42: Employment Land: C - 8b ............................................................................................................................................... 104 Figure 43: Employment Land: C - 8c ................................................................................................................................................ 105 Figure 44: Employment Land: C - 8d ............................................................................................................................................... 106 Figure 45: Employment Land: C - 8e ................................................................................................................................................ 107 Figure 46: Current Employment Land Distribution in the City of Campbell River ....................................................................... 108 Figure 47: Map of Industrially Zoned Land Distribution ................................................................................................................ 109 Figure 48: Industrial Land: I – 1 ........................................................................................................................................................ 110 Figure 49: Industrial Land: I - 2 ......................................................................................................................................................... 111

11
Figure 50: Industrial Land: I - 3/ I - 3a ............................................................................................................................................. 112 Figure 51: Industrial Land: I - 3/ I - 3b ............................................................................................................................................. 113 Figure 52: Industrial Land: I - 4 ......................................................................................................................................................... 114
List of Tables Table 1: Breakdown of Industrial & Commercial Zoned Areas ......................................................................................................... 2 Table 2: Population Distribution in the Development Regions, BC ................................................................................................ 18 Table 3: Population Projections by Age Groups, Vancouver Island & Coast DR .......................................................................... 19 Table 4: Age Distribution in the City of Campbell River .................................................................................................................. 21 Table 5: Age Distribution in the SRD ................................................................................................................................................. 23 Table 6: Population Projection Distribution – City of Campbell River (2019-2040) ....................................................................... 24 Table 7: Population Projection Distribution – City of Campbell River (2019-2040) ....................................................................... 25 Table 8: Economic Indicators: British Columbia .............................................................................................................................. 28 Table 9: Employment Trends in City of Campbell River .................................................................................................................. 30 Table 10: Historic Employment by Employment Categories ........................................................................................................... 31 Table 11: Employment by Industry - City of Campbell River, Vancouver Island & Coast, British Columbia (2016) .................. 32 Table 12: Location Quotient – Campbell River & Vancouver Island & Coast Economic Region (2016) ...................................... 34 Table 13: Employment Projection By Population-Based Method ................................................................................................... 36 Table 14: Population-Based Employment Projection By Employment Categories ....................................................................... 37 Table 15: Employment Projection by Constant-Share Method........................................................................................................ 37 Table 16: Constant Share Employment Projection By Employment Categories ........................................................................... 38 Table17: Prominent Land Use Zones for Industrial Uses in the City of Campbell River .............................................................. 43 Table18: Prominent Land Use Zones for Industrial Uses in the City of Campbell River .............................................................. 44 Table 19: Supply of Industrial Land by Zoning Type ........................................................................................................................ 50 Table 20: Land utilization by industrial zoning ................................................................................................................................. 51 Table 21: Land utilization by industrial zoning in percent ............................................................................................................... 51 Table 22: Size of Industrial Land by Zoning Type ............................................................................................................................ 52 Table 23: Land utilization by airport zoning ...................................................................................................................................... 56 Table 24: Land utilization by airport zoning in percent .................................................................................................................... 56 Table 25: Size of Industrial Land by Airport Zoning ......................................................................................................................... 56
12
Table 26:Supply of CommercialLand by Zoning Type ..................................................................................................................... 57 Table 27: Land utilization by commercial zoning ............................................................................................................................. 59 Table 28: Land utilization by commercial zoning as a percentage ................................................................................................. 59 Table 29: Size of Commercial Land by Zoning Type ........................................................................................................................ 61 Table 30: Industrial Land Demand Projection ................................................................................................................................... 62 Table 31: Annual per capita expenditure in Campbell River, SRD, Trade area and BC ................................................................ 66 Table 32: Annual per capita expenditure in Campbell River, SRD, Trade area and BC ................................................................ 67 Table 33: Projected Retail Expenditure Potential in Primary Trade Area ....................................................................................... 68 Table 34: Per Capita Retail Expenditure – Secondary Trade Area vs. BC ...................................................................................... 69 Table 35: Projected Retail Expenditure Potential in Secondary Trade Area .................................................................................. 70 Table 36: Total Projected Retail Expenditure Potential - Capture - Warranted Floorspace- Commercial Land Demand .......... 75

13
1. Introduction 1.1 Contextual overview This study applies to the City of Campbell River. The City of Campbell River is on the east coast of Vancouver Island at the south end of Discovery Passage, along the important Inside Passage shipping route. At over 35,000 people, the City is the most populous community in the Strathcona Regional District (SRD) and third largest City on Vancouver Island. The primary economic activities in the City include aerospace, forestry and technology. This study was commissioned by the City to gain a better understanding of the supply-demand characteristics of its employment lands (lands zoned for industrial and commercial uses) and to develop strategies that inform the economic development and business pursuits of the City. Urbanics Consultants Ltd. has been retained by the City of Campbell River to undertake an Employment Lands Study which will aid in creating an inventory of employment land, estimating the need for employment land over the next 20 years, and developing an employment land strategy for the City of Campbell River. The study area is shown as in Figure 1.
Figure 1: Map of City of Campbell River, Study Area
Source: Urbanics Consultants Ltd., Sitewise

14
1.2 Employment Land Study The study evaluates the capacity of existing employment lands within the City and the scale of demand for various categories of employment land. The study has greatly benefitted from feedback from key stakeholders and staff from the City. Much of the feedback was obtained through three methods of engagement: online survey, stakeholder interviews and a stakeholder consultation session (conducted at the Comfort Inn on Friday, March 22, 2019). Key stakeholders participating in the consultation included major industrial property & business owners, and City staff. The purpose of the consultation was to inform stakeholders of preliminary study findings, receive feedback and to engage stakeholders in confirming their perceived challenges and opportunities in relation to business and investment in the City. The workshop included participant engagement exercises that tested ideas and encouraged dialogue among the different stakeholders. Consultation participants provided important and insightful anecdotal information related to a sector based economic outlook for the City, the challenges faced by various industry sectors in the City and the opportunities that can be capitalized on for achieving long-term economic stability. These insights are applied throughout the report and to develop approaches for creating an employment strategy for a more sustainable City. The key highlights are aggregated in the SWOT (Strengths, Weaknesses, Opportunities, Threats) summary below. 1.3 Methodology The Consultant utilized a broad and deep methodology for conducting the Employment Lands Strategy study. This process is set out below. 1.3.1 Review of previous studies and policies governing land use The Consultant collected and reviewed pertinent policies and regulations governing employment land use as well as studies related to employment lands in the City, including:
• City of Campbell River – Community Profile (2016 and 2019) • Airport Master Plan - Sept 2016 • Sustainable Official Community Plan • Zoning bylaw 3250, 2006, 2018

15
• GPRA’s City of Campbell River Downtown Growth Analysis 2016 • State of the Island Economic Report (2017 and 2018)
1.3.2 Demographics analysis Publicly available datasets from Statistics Canada and BC Stats were used to examine the demographic characteristics of the City. Projected population growth estimates from BC Stats were utilized to identify the impacts of growth in the region.
1.3.3 Economic base analysis Publicly available datasets from Statistics Canada, BC Stats, and the Canadian Labour Force Survey were used to examine the provincial, regional and local economic markets. These datasets included regional employment trends, with a focus on employment sectors that are key to the City. The study also examines the growth of small-business employment in the City, with a focus on small, innovative companies locating in industrial areas.
1.3.4 Supply analysis Parcel-level BC Assessment data and consolidated parcel-level zoning information was analyzed to document a quantitative and qualitative inventory of the existing supply of employment land within the City. This included the determination of utilized, vacant and underutilized industrial lands, servicing characteristics, and location attributes of the employment lands (i.e., in terms of proximity to work force, customer base and transportation and utility infrastructure).
1.3.5 Demand Analysis Based on the projected population growth, employment-based growth and historical employment land growth rates, the Consultant has projected how economic drivers could shape the employment land market over the next 20 years (2020 through to 2040). These employment land demand projections are corroborated by historical industrial and commercial permit information. Reconciling the results of these two methods enabled the Consultant to quantify employment land use demand in the City as well as evaluate whether the current supply of employment land could accommodate projected demand.
1.3.6 Community engagement The study methodology utilized a three-step method of engagement that began with identifying and informing the affected stakeholders, moved forward with a stakeholder survey and interviews to engage stakeholders and solicit strategic and general feedback, and a stakeholder consultation event to engage stakeholder and the broader community on the study results and their

16
implications. The results from the stakeholder consultation along with feedback from key stakeholders has provided insightful information regarding employment lands in the City and has greatly enriched this study.
1.3.7 Findings and Recommendations The final section of the study provides the most notable findings from an in-depth employment land supply and demand analysis in the City forecasted over the next 20 years (2020 through to 2040) and recommendations.
1.3.8 Limitations This study involves macro-level analyses of the City of Campbell River, which relies on data from a variety of sources, including the Statistics Canada, BC Stats and many others. Background data for this study was obtained from a variety of public (federal, provincial, regional, and municipal) and private sector sources during the period of Jan to May 2019. As a result, similar to market studies of this nature, this study has several limitations that might arise from the quality of background data, for example, the study relies on population growth projections from P.E.O.P.L.E. 2018, BC Stats, which makes several assumptions regarding the economy, migration and population trends. Moreover, this study makes a number of forecasts and assumptions regarding the state of the economy, future competitive influences, and population and employment projections, that may shift due to changes in regulatory environment, regional, provincial and global economy as well as natural triggers. These assumptions are made with great care and are based on the most recent and reliable information developed from research of the market and knowledge of the industry. Should these or any of the other assumptions noted in this study, be undermined by the course of future events, the Consultant recommends that the study’s findings be re-examined. It should also be noted that this study does not assess the impact of employment land development on the First Nation Lands within the City. It is expected that these two factors will affect industrial and commercial development in the City and there is value in exploring the projected impact.

17
2. Demographic Analysis 2.1. Vancouver Island and Coast Context The Vancouver Island and Coast Development Region1 is one of the eight development regions in the Province of BC. The others include:
• Mainland / Southwest Cariboo • Thompson – Okanagan Kootenay • North Coast Nechako • Northeast.
The Vancouver Island and Coast Development Region extends from Vancouver Island to the areas north of the Mainland/ Southwest development region. The Vancouver Island and Coast Development Region itself is comprised of nine Regional Districts (Alberni-Clayoquot, Capital, Central Coast, Comox Valley, Cowichan Valley, Mount Waddington, Nanaimo, Powell River and Strathcona). Naturally, each District possesses a relatively locationally indicative economic profile. The Capital Regional District (CRD), one of the most urbanized and populated of the regional districts, depends largely on service industries, public administration, post-secondary activities, and tourism as major economic drivers. The other regional districts are highly dependent on goods-producing industries such as logging and forest products, manufacturing, and mining. In addition, several communities on the east coast of Vancouver Island have become popular destinations for retirees. The Vancouver Island and Coast Development Region is the second-most populous, urbanized and dense regions in the Province. Due in part to increased migration rates, the region is expected to grow steadily over the 2016-2036, from a population of 805,870 in 2016 to 970,280 by 2036. However, the growth rate is expected to slow down to 0.6 percent during the period from 2036 to 2041. This translates into an annual growth rate of approximately 0.8 percent during the period 2016 to 2021, and 1.0 percent during the period 2016 to 2021 (Table 2). Overall, the Vancouver Island and Coast Development Region has a high proportion of its population aged 65 years and over. More specifically, 23 percent of the Region’s entire population (or approximately 184,457 people) is aged 65 years and over in 2016.
This share is expected to grow to 30 percent by 2041 (approximately 304,263 people). Further, while the population in the age group 18-65 will maintain its dominant share, its overall proportion is expected to decline from 64 percent in 2016 to 58 percent by 2041 (Table 2 and Figure 2).
1 Development Regions are large geographical regions that are formed by grouping several Regional Districts (geographical regions created by the Provincial Government for delivery of certain services). Development Regions provide a better unit for economic analysis, labour force surveys and employment projections.

18
Table 2: Population Distribution in the Development Regions, BC
Source: Urbanics Consultants Ltd., BC Stats
Year 2001 2006 2011 2016 2016/B.C. 2021 2026 2031 2036 2041 2041/B.C.1 B.C. 4,076,881 4,241,691 4,499,139 4,757,658 100% 5,039,706 5,343,319 5,644,989 5,923,919 6,178,287 100%2 Mainland/Southwest 2,402,949 2,529,711 2,725,373 2,933,973 62% 3,126,149 3,344,031 3,565,368 3,774,709 3,969,202 64%3 Vancouver Island and Coast 710,867 744,293 772,912 805,870 17% 848,779 892,335 933,805 970,280 1,001,694 16%4 Thompson Okanagan 480,059 502,454 529,617 552,023 12% 587,196 618,501 648,461 674,923 698,350 11%5 Cariboo 166,133 157,582 157,201 154,277 3% 155,177 156,677 157,429 157,144 156,111 3%6 Kootenay 147,041 143,351 148,470 148,580 3% 149,709 151,934 153,688 154,740 155,204 3%7 North East 62,100 65,505 67,822 67,987 1% 71,510 75,625 79,585 83,426 87,344 1%8 North Coast 65,620 59,775 57,201 54,083 1% 54,511 56,323 57,626 58,728 59,664 1%9 Nechako 42,112 39,020 40,543 40,865 1% 46,675 47,893 49,027 49,969 50,718 1%
Figure 2: Population Projections by Age Groups, Vancouver Island & Coast DR
Source: Urbanics Consultants Ltd.

19
Table 3: Population Projections by Age Groups, Vancouver Island & Coast DR
2.2. The City of Campbell River Context BC Stats has improved the efficacy of raw census data and it is held that the data from BC Stats depicts a more accurate picture of the population estimation in British Columbia. Therefore, the BC Stats population estimates and projections were applied in the population projection for Strathcona Regional District and the City of Campbell River.
2.2.1. Historical Population Growth Given the fact that there is no population projection by BC Stats specifically for the City of Campbell River, a historical population analysis was conducted for Strathcona Regional District (SRD) and the City. The analysis shows a distinct relationship between the population growth in the SRD and the City. The Consultant applied this relationship to derive the population projection of the City of Campbell River from the population projection of the SRD. According to BC Stats population estimates for the period between 2001 to 2018, the population in the SRD grew from 41,786 to 48,135, indicating an average annual growth rate of 0.84 percent. In contrast, the population in the City grew from 29,173 to 35,141
Year 1986 1991 1996 2001 2006 2011 2016 2021 2026 2031 2036 2041 0-4 36,839 39,704 40,425 32,977 31,727 33,881 34,631 35,422 36,967 37,358 36,850 36,797 5-14 71,620 81,644 91,200 85,409 78,195 71,469 71,266 76,645 79,864 82,869 84,910 84,518 15-24 82,767 79,611 87,133 90,066 94,419 91,796 91,271 86,093 85,409 91,451 95,446 98,997 25-44 172,356 201,295 217,509 195,563 182,319 183,443 187,580 205,158 215,907 216,555 219,918 220,575 45-64 111,518 127,598 158,600 188,473 227,047 242,212 236,665 225,049 219,131 224,856 237,969 256,544 65+ 81,668 99,065 109,913 118,379 130,586 150,111 184,457 220,412 255,057 280,716 295,187 304,263 All Ages 556,768 628,917 704,780 710,867 744,293 772,912 805,870 848,779 892,335 933,805 970,280 1,001,694
Share of Population(%) 15-64 66% 65% 66% 67% 68% 67% 64% 61% 58% 57% 57% 58% 65+ 15% 16% 16% 17% 18% 19% 23% 26% 29% 30% 30% 30%
Annual Growth Rate(%), All Ages 2.5% 2.3% 0.2% 0.9% 0.8% 0.8% 1.0% 1.0% 0.9% 0.8% 0.6%
Source: Urbanics Consultants Ltd. and BC Stats

20
with an average annual growth rate of 1.10 percent. The following Figure depicts the population growth trend in both the SRD and the City. The BC Stats projection of the SRD population is considered to be reliable for this purpose due to the fact that BC Stats uses a methodology that accounts for fertility rates, mortality rates, and migration rates. As shown in Figure 3, the City has a greater population growth rate than that of the SRD. Therefore, the City represents an increasing share of the SRD’s population. It is expected that this trend will continue and has applied this trend as the assumption for the population projection for the City. It is assumed that the its population will continue to grow with respect to the SRD as reflected in the historical trends.
Figure 3: Historical Population in Campbell River & SRD
Source: Urbanics Consultants Ltd., BC Stats
21
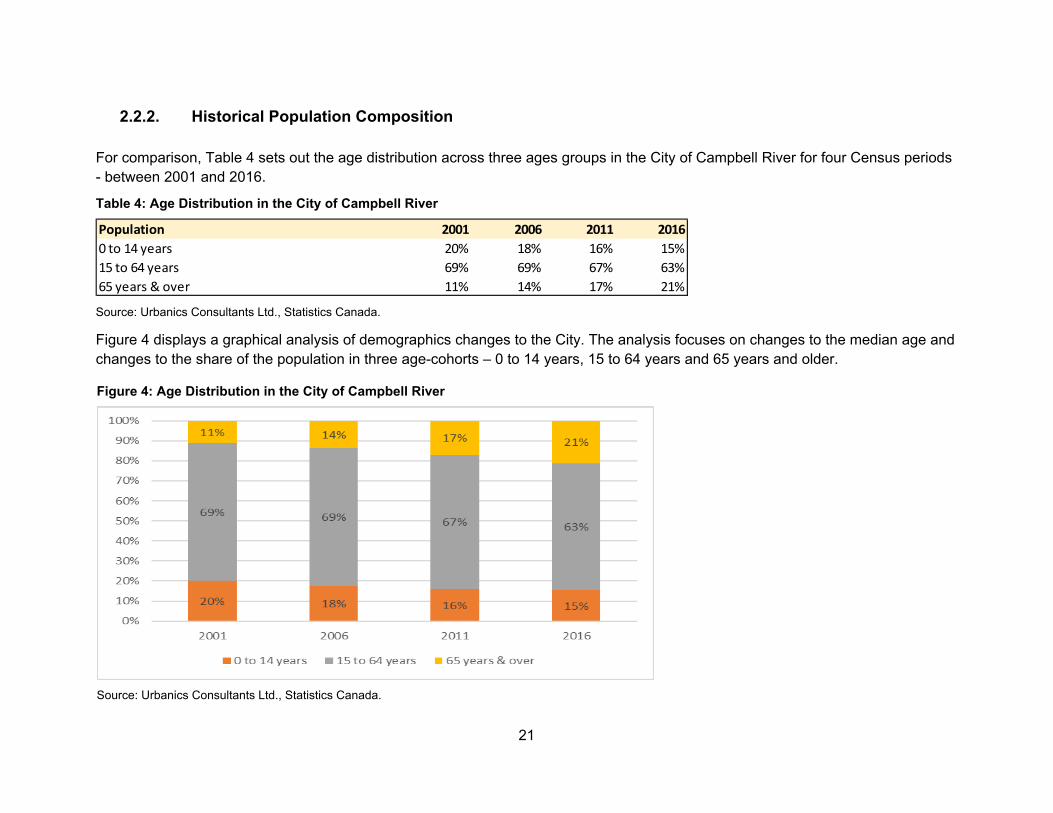
2.2.2. Historical Population Composition For comparison, Table 4 sets out the age distribution across three ages groups in the City of Campbell River for four Census periods - between 2001 and 2016.
Table 4: Age Distribution in the City of Campbell River
Source: Urbanics Consultants Ltd., Statistics Canada. Figure 4 displays a graphical analysis of demographics changes to the City. The analysis focuses on changes to the median age and changes to the share of the population in three age-cohorts – 0 to 14 years, 15 to 64 years and 65 years and older.
Population 2001 2006 2011 20160 to 14 years 20% 18% 16% 15%15 to 64 years 69% 69% 67% 63%65 years & over 11% 14% 17% 21%
Figure 4: Age Distribution in the City of Campbell River
Source: Urbanics Consultants Ltd., Statistics Canada.

22
Figure 5: Historical Population by Age-cohort & Median Age
Source: Urbanics Consultants Ltd., Statistics Canada. The median age of the City increased from 38.1 in 2001 to 46.5 in 2016. The size of the 15 to 64 years age-cohort (i.e., the working-age cohort), decreased from 69 percent of the population in 2001 to 63 percent in 2016 (decrease of 1,025). The share of the population under the age of 14 also decreased from 20 percent to 15 percent (decrease of 680) while the share of the population in the 65 year and older age-cohort increased from 11 percent to 21 percent (increase of 3,775). Similar to Vancouver Island and Coast Development Region, it is evident that the population of the City is becoming more concentrated in the 65 and over demographic. The implications of these demographic shifts will be addressed in the employment projection section and employment land demand section of this report.
23
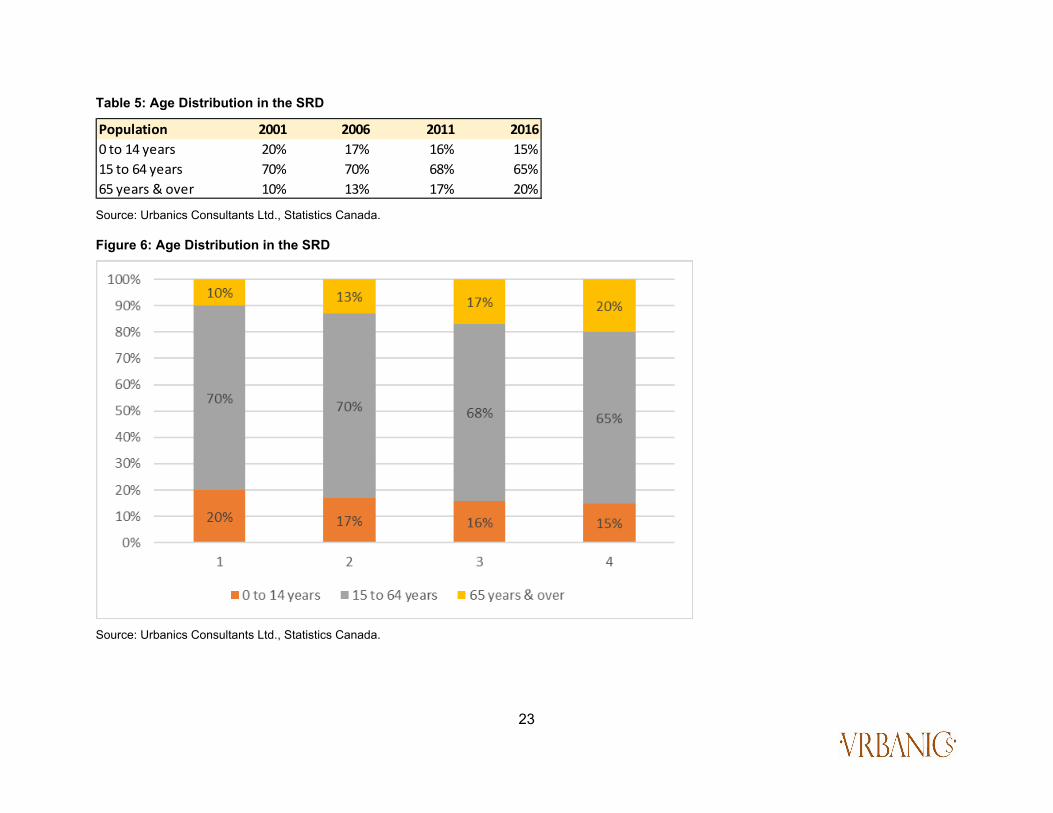
Table 5: Age Distribution in the SRD
Source: Urbanics Consultants Ltd., Statistics Canada. Figure 6: Age Distribution in the SRD
Source: Urbanics Consultants Ltd., Statistics Canada.
Population 2001 2006 2011 20160 to 14 years 20% 17% 16% 15%15 to 64 years 70% 70% 68% 65%65 years & over 10% 13% 17% 20%

24
During the period 2001 to 2016, the population composition in the SRD was similar to the City across three age-cohorts as a percentage of the total population. The assumption has been made that the population composition of the City will resemble the population composition of the SRD in the future, which forms the second factor for the population projection.
2.2.3. Population Projection Based on the assumptions that the City’s population will continue to grow as a commensurate percentage of the SRD, a population projection was prepared for City of Campbell River using 2018 as a base year and projecting growth to the year 2040. The projections were conducted by forecasting population growth in the City by age-cohort and gender utilizing BC stats projection for the SRD. In view of the projection analysis, moderate and high growth projection scenarios were selected for development. In the moderate growth scenario, the projections were conducted by forecasting population growth in the City by age-cohort and gender utilizing the BC stats projection for the SRD as described above. In the high growth scenario, a 0.2 percent additional increase per year was included specifically as a result of the completion of CRadvantage and the successful attraction of high speed, broadband fibre optic network reliant employment drivers moving to the City. There can be other drivers from established employment sectors that can also experience significant growth and commensurate employment. Examples can include aquaculture, value-added wood processing and aeronautics. However, the 0.2 percent increase was ascribed to the CRadvantage given its potential significance as a cross-cutting economic generator. As shown in the Figure 7, the population of the City is expected to grow from 35,141 in 2018 to 42,658 in 2040 in the moderate growth scenario and to 44,470 in 2040 in the high growth scenario. Table 6: Population Projection Distribution – City of Campbell River (2019-2040)
Source: Urbanics Consultant Ltd., Statistics Canada and BC Stats
Population 2019 2020 2025 2030 2035 20400-14 years 14% 14% 14% 13% 13% 13%15-64 years 61% 60% 57% 55% 56% 57%65+ years 25% 26% 29% 31% 31% 30%Total Population 100% 100% 100% 100% 100% 100%

25
Figure 7: Past & Projected Population of Campbell River In Moderate & High Growth Scenarios
Source: Urbanics Consultants Ltd., BC Stats.
Table 7: Population Projection Distribution – City of Campbell River (2019-2040)
Source: Urbanics Consultant Ltd., Statistics Canada and BC Stats
Population 2019 2020 2025 2030 2035 20400-14 years 14% 14% 14% 13% 13% 13%15-64 years 61% 60% 57% 55% 56% 57%65+ years 25% 26% 29% 31% 31% 30%Total Population 100% 100% 100% 100% 100% 100%

26
The City of Campbell River has a high proportion of population aged 65 years and over and the share of the population is expected to grow to 30 percent by 2040 (approximately 12,797 people) of this age cohort. While the population in the age group 18 – 64 years old will maintain its dominant share of the population, its share of the population is expected to decline significantly from 63 percent in 2016 to 55 percent by 2030, however age group from 18 – 64 years old is expected to increase beginning in 2030. Of particular importance is the growth of the working-age cohort, or those between the ages of 15 and 64, as this age-cohort will be utilized for the employment projection. The share of the working-age cohort is expected to decrease from 61 percent of the population in 2019 to 57 percent in 2040, however, in absolute terms it is expected to grow by 2,660 people between 2019 and 2040. Conversely, the share of the 65 and over age-cohort is expected to increase from 25 percent to 30 percent and the 14 years and under age-cohort is remain stable around 14 percent. It is expected that the population of the City will realize growth in each age-cohort, with the working-age cohort growing modestly, and the population share concentrated among the 65 years old and over cohort increasing significantly.
Figure 8: Population Projection Distribution – the City of Campbell River (2019-2040)
Source: Urbanics Consultant Ltd., Statistics Canada and BC Stats

27
3. Economic Base Analysis 3.1. Provincial economy
This section provides a brief economic outlook of the provincial economy. These macro-economic indicators are some of the important drivers at the provincial level. The following terms may be defined as:
• Real Gross Domestic Product (GDP) is an inflation-adjusted measure that reflects the value of all goods and services produced by an economy in a given year, expressed in base-year prices;
• Nominal Gross Domestic Product is a measure of the value of all finished goods and services produced by a country at their current market prices;
• Employment is number of people who have a job as a percentage of the working age population; • Unemployment rate is the share of the labor force that is jobless, expressed as a percentage; • Retail sales refers to purchases of finished goods and services by consumers and businesses; • Housing starts the number of new houses begun during a particular period; and, • Consumer Price Index an index of the variation in prices paid by typical consumers for retail goods and other item
The Province of British Columbia is expected to display stable GDP growth in 2019, primarily as a result of strong job growth and a robust housing market. According to RBC Economics Provincial Outlook March 2019, British Columbia’s Real GDP output grew by an estimated 1.7 percent in 2018 and is projected to grow by 2.5 percent in 2019 and 2.5 percent in 2020 (Table 8). According to RBC Economics Provincial Outlook March 2019, the Province is expected to display growth in employment in 2019 at a higher percent change as compared to the previous year (1.1 percent in 2018 as compared to 1.8 percent in 2019). The anticipated growth in employment as well as increase in home value gains are expected to lead to increases in consumer spending in the retail sales in the Province. The Province is expected to display strong growth in retail sales in 2019 (3.7 percent in 2019) and a higher rate of growth in 2020 (3.9 percent in 2020). However, housing starts are expected to decrease in 2019 and 2020 as compared to the last few years (from 40,900 in 2018 to 36,900 in 2019). The decline may be due to a low inventory of affordable housing across the Province with rising construction costs and cost of land. Overall, the Province is expected to experience continued economic growth and strong demand for housing in the near future. However, this also assumes that the impact of wildfires on the economy is localized and that the softwood lumber trade conflict with the US does not escalate further; the latter is of particular importance to the City.

28
The following section will address economic trends in the City of Campbell River and Vancouver Island and Coast that will have an affect on the demand for employment lands.
3.2. Historical Employment Trends Displayed in Table 9 are jobs by industry sector in Campbell River between 2006 and 2016. Industry sectors are classified using the North American Industry Classification System (NAICS), which segments industries into twenty distinct sectors that are categorized as either goods-producing or service-producing industries. The central economic activity classes in the City, in terms of employment numbers, are:
• agriculture; forestry; fishing and hunting (primarily forestry); • construction; • manufacturing; • retail trade; • transportation and warehousing; • professional; scientific and technical services
Table 8: Economic Indicators: British Columbia
Source: RBC Economics, Provincial Outlook (March 2019)
2012 2013 2014 2015 2016 2017 2018F 2019F 2020FReal GDP
% change 2.5 2.2 3.7 2.1 3.2 3.8 1.7 2.5 2.5Nominal GDP
% change 2.1 3.4 5.7 2.9 6 6.9 4.1 3.9 4.9Employment
% change 1.6 0.1 0.6 1.2 3.2 3.7 1.1 1.8 0.7Unemployment Rate (%)
rate % 6.8 6.6 6.1 6.2 6 5.1 4.7 4.7 4.8Retail Sales
% change 1.9 2.8 6.3 7 7.7 9.3 2 3.7 3.9Housing Starts 000's of
units 27.5 27.1 28.4 31.4 41.8 43.7 40.9 36.9 34Consumer Price Index
% change 1.1 -0.1 2.6 1.1 1.9 2.1 2.7 1.8 2.2
Economic Indicators

29
• health care and social assistance; and, • accommodation and food services (tourism). Among these eight industry classes, employment numbers (highlighted yellow in Table 9) within health care and social assistance class has experienced the highest annual growth rate of 5 percent during the period 2006 to 2016. Construction has the second highest annual growth rate at 4.4 percent for the same period. The annual growth rate for transportation and warehousing, together with professional, scientific and technical services was at 2.4 percent and 2.2 percent respectively. Despite the employment numbers decreasing slightly during the 2006 to 2016 period, agriculture, forestry, fishing and hunting (9 percent), retail trade (14 percent) and accommodation and food services (9 percent) combine to provide 32 percent of the total jobs in the City in 2016 (These three industries are highlighted green in Table 9). It is important to note that jobs in the manufacturing sector (highlighted blue in Table 9) have declined from 1,505 to 650. This can be accounted for, in part, by the 2009 closure of the Elk Falls Division of Catalyst Paper that saw a loss of over 500 jobs. In terms of percent distribution of all industries, manufacturing (10 percent) ranked second among all industries in 2006, but this percentage has dropped from 10 percent in 2006 to 4 percent in 2016 (a total loss of 855 jobs). According to the most recent Statistics Canada data, Campbell River experienced an employment rate of 54.1 percent which is significantly lower than the provincial average at 59.6 percent. In summary, the highest concentration of jobs in Campbell River are in the following industry sectors: • Agriculture, forestry, fishing and hunting: 9% or 1,495 jobs • Construction: 10% or 1,510 jobs • Retail trade: 14% or 2,170 jobs • Health care and social assistance: 13% or 2,125 jobs • Accommodation and food services: 9% or 1,475 jobs
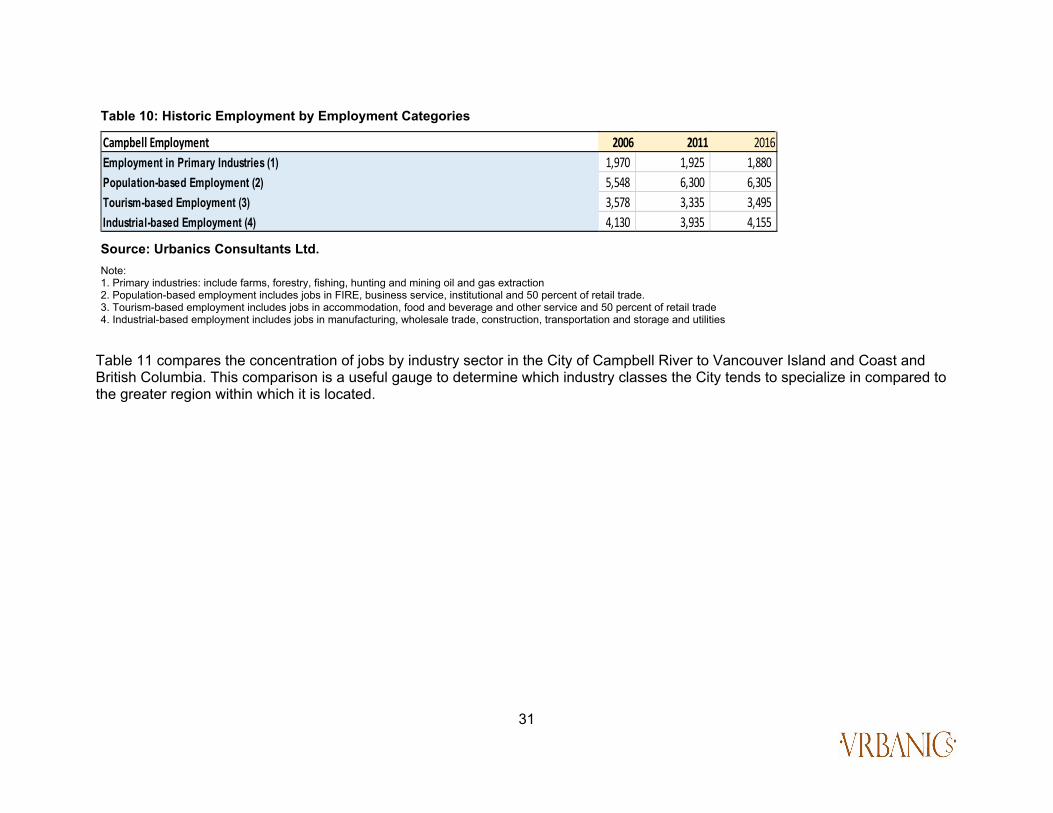
Jobs in all industries were disaggregated into the four categories in Table 10; these include employment in primary industries, population-based employment, tourism-based employment and industrial-based employment. As seen in Table 10, most of the jobs increase came from population-based employment from for the three Census periods 2006, 2011, and 2016. Tourism based employment was at 3,495, while industrial-based employment was at 4,155 in 2016. Employment in primary industries is the least significant within these categories (which is reflective of the on-going shift in this sector).

30
Table 9: Employment Trends in City of Campbell River
Source: Urbanics Consultants Ltd. & Statistics Canada
Employment Trends in City of Campbell River 2006 2011 2016 2006-2016(Annualized 10 year growth rate)Total Labour Force population (15 years+) by Industry - NAICS 2012 15,625 15805 16185 0.4% Industry - NAICS2012 - not applicable 365 310 350 -0.4% All industry categories 15,255 15495 15835 0.4% 11 Agriculture; forestry; fishing and hunting 1535 (10%) 1215 (8%) 1495 (9%) -0.3% 21 Mining; quarrying; and oil and gas extraction 435 710 385 -1.2% 22 Utilities 75 140 105 3.4% 23 Construction 985 (6%) 1350 (9%) 1510 (10%) 4.4% 31-33 Manufacturing 1505(10%) 665(4%) 650 (4%) -8.1% 41 Wholesale trade 335 390 345 0.3% 44-45 Retail trade 2210 (14%) 2445 (16%) 2170 (14%) -0.2% 48-49 Transportation and warehousing 580 (4%) 730 (5%) 735 (5%) 2.4% 51 Information and cultural industries 240 230 175 -3.1% 52 Finance and insurance 320 480 380 1.7% 53 Real estate and rental and leasing 325 335 300 -0.8% 54 Professional; scientific and technical services 650 (4%) 660 (4%) 810 (5%) 2.2% 55 Management of companies and enterprises 15 0 20 2.9% 56 Administrative and support; waste management and remediation services 625 515 600 -0.4% 61 Educational services 875 765 805 -0.8% 62 Health care and social assistance 1305 (9%) 1815 (12%) 2125 (13%) 5.0% 71 Arts; entertainment and recreation 275 425 340 2.1% 72 Accommodation and food services 1560 (10%) 1180 (8%) 1475 (9%) -0.6% 81 Other services (except public administration) 775 720 765 -0.1% 91 Public administration 615 725 665 0.8%
31
Table 11 compares the concentration of jobs by industry sector in the City of Campbell River to Vancouver Island and Coast and British Columbia. This comparison is a useful gauge to determine which industry classes the City tends to specialize in compared to the greater region within which it is located.
Table 10: Historic Employment by Employment Categories
Source: Urbanics Consultants Ltd. Note: 1. Primary industries: include farms, forestry, fishing, hunting and mining oil and gas extraction 2. Population-based employment includes jobs in FIRE, business service, institutional and 50 percent of retail trade. 3. Tourism-based employment includes jobs in accommodation, food and beverage and other service and 50 percent of retail trade 4. Industrial-based employment includes jobs in manufacturing, wholesale trade, construction, transportation and storage and utilities
Campbell Employment 2006 2011 2016Employment in Primary Industries (1) 1,970 1,925 1,880 Population-based Employment (2) 5,548 6,300 6,305 Tourism-based Employment (3) 3,578 3,335 3,495 Industrial-based Employment (4) 4,130 3,935 4,155

32
Table 11: Employment by Industry - City of Campbell River, Vancouver Island & Coast, British Columbia (2016)
Source: Statistics Canada, Urbanics Consultants Ltd.
Employment by Industry Campbell River British ColumbiaEmployment %Base Employment %Base Employment %Base
Total Labour Force population (15 years+) by Industry - NAICS 2012 16,185 100.0% 403,190 100.0% 2,471,665 100.0% Industry - NAICS2012 - not applicable 350 2.2% 7,145 1.8% 43,805 1.8% All industry categories 15,835 97.8% 396,045 98.2% 2,427,865 98.2% 11 Agriculture; forestry; fishing and hunting 1,495 9.2% 13,640 3.4% 65,205 2.6% 21 Mining; quarrying; and oil and gas extraction 385 2.4% 2,925 0.7% 25,920 1.0% 22 Utilities 105 0.6% 1,295 0.3% 12,445 0.5% 23 Construction 1,510 9.3% 32,090 8.0% 199,985 8.1% 31-33 Manufacturing 650 4.0% 17,945 4.5% 157,560 6.4% 41 Wholesale trade 345 2.1% 7,810 1.9% 82,105 3.3% 44-45 Retail trade 2,170 13.4% 49,290 12.2% 283,135 11.5% 48-49 Transportation and warehousing 735 4.5% 16,480 4.1% 128,400 5.2% 51 Information and cultural industries 175 1.1% 7,385 1.8% 67,225 2.7% 52 Finance and insurance 380 2.3% 11,255 2.8% 93,805 3.8% 53 Real estate and rental and leasing 300 1.9% 7,605 1.9% 54,995 2.2% 54 Professional; scientific and technical services 810 5.0% 27,650 6.9% 196,670 8.0% 55 Management of companies and enterprises 20 0.1% 345 0.1% 4,320 0.2% 56 Administrative and support; waste management and remediation services 600 3.7% 18,365 4.6% 109,095 4.4% 61 Educational services 805 5.0% 29,470 7.3% 173,820 7.0% 62 Health care and social assistance 2,125 13.1% 53,455 13.3% 270,855 11.0% 71 Arts; entertainment and recreation 340 2.1% 10,130 2.5% 57,940 2.3% 72 Accommodation and food services 1,475 9.1% 34,980 8.7% 207,045 8.4% 81 Other services (except public administration) 765 4.7% 17,770 4.4% 112,335 4.5% 91 Public administration 665 4.1% 36,155 9.0% 125,000 5.1%
Vancouver Island and Coast

33
The City of Campbell River, relative to Vancouver Island and Coast and British Columbia, has a high concentration of employment in the category agriculture, forestry, fishing and hunting (9.2 percent versus 3.4 percent versus 2.6 percent), mining; quarrying; and oil and gas extraction (2.4 percent versus 0.7 percent versus 1.0 percent), construction (9.3 percent versus 8.0 versus 8.1 percent), retail trade (13.4 percent versus 12.2 percent versus 11.5 percent) and accommodation and food services (9.1 percent versus 8.7 percent versus 8.4 percent).
3.3. Location Quotient Analysis In addition to the previous analysis of employment trends, this study also uses what is referred to as “location quotient analysis” to assess the economic base of the City of Campbell River. The location quotient analysis compares the local share of employment in an industry to the greater area’s share of employment in the same industry and identifies basic industries (i.e., industries that export from the region and bring in revenue from outside) and non-basic industries (i.e., industries that primarily serve locally and support basic industries) in an economy. This is expressed as LQ>one, LQ=one and LQ<one. An LQ value that is greater than one suggests a higher level of local employment in comparison to a greater area and provides evidence of basic employment for a given industry. An LQ value that is equal to one suggests similar levels of local employment in comparison to the greater area and signifies that the local employment is exactly sufficient to meet the local demand for a given good or service (i.e., the industry is non-basic in nature). Similarly, a LQ value of less than one suggests lower level of employment in an industry and suggests that all employment in the local industry is not meeting local demand and is non-basic in nature. This study compares the employment levels by industries for the City of Campbell River to Vancouver Island and Coast Economic Region in 2016. The analysis suggests that the goods-producing industries: agriculture, forestry, fishing, and hunting, mining, quarrying, oil/gas extraction, utilities and construction had a location quotient greater than one in 2016. Manufacturing, on the other hand, had an LQ less than one in 2016. This is indicative of the importance of agriculture, forestry, fishing, and hunting; mining, quarrying, oil/gas extraction, utilities and construction to the local economy in comparison to the Vancouver Island and Coast Economic Region as shown in Table 12. In the case of service-producing industries, the location quotient for wholesale trade, retail trade, management of companies and enterprises, accommodation and food services, and other services (except public administration) is higher than one. This LQ suggests that these industries employ a higher proportion of employment as compared to the same industries in Vancouver Island and Coast Economic Region, indicating that they are basic industries of the City of Campbell River. As stated, all of the industries with a location quotient greater than 1 suggest that they are basic industries of the City or an exporter of these services to the greater area.

34
Table 12: Location Quotient – Campbell River & Vancouver Island & Coast Economic Region (2016)
Source: Urbanics Consultants Ltd. and Statistics Canada
Goods-producing industries 11 Agriculture; forestry; fishing and hunting 2.73 21 Mining; quarrying; and oil and gas extraction 3.28 22 Utilities 2.02 23 Construction 1.17 31-33 Manufacturing 0.90Service-producing industries 41 Wholesale trade 1.10 44-45 Retail trade 1.10 48-49 Transportation and warehousing 1.11 51 Information and cultural industries 0.59 52 Finance and insurance 0.84 53 Real estate and rental and leasing 0.98 54 Professional; scientific and technical services 0.73 55 Management of companies and enterprises 1.44 56 Administrative and support; waste management and remediation services 0.81 61 Educational services 0.68 62 Health care and social assistance 0.99 71 Arts; entertainment and recreation 0.84 72 Accommodation and food services 1.05 81 Other services (except public administration) 1.07 91 Public administration 0.46
Location Quotient - Campbell River & Vancouver Island and Coast (2016)

35
3.4. Employment Projection Displayed in Table 13 and Table 14 is the employment forecast by industry sector for the City of Campbell River between 2019 and 2040. The forecast is based on current employment levels per industry sector in 2016. The Consultant has applied two methods to project the employment in the City, which include the “extrapolation-based method” and “constant share method”. The intent of conducting employment projections is to gain a better understanding of the future employment land use demand for the City. It must be noted that there is no definitive way for estimating the future employment levels and the estimates can only provide possible levels of industrial demand in the City. Primarily, this is because projections of population and employment are likely to be affected by changes in the regional, provincial or global economy and regulations. In addition, it should also be noted that both methods have their own benefits and shortcomings in estimating employment in the City. Therefore, both methods were utilized to forecast employment trends in the City and for estimating potential levels of demand for employment land. These estimates of potential levels of employment land demand can be utilized by the City for developing an appropriate frame of reference for long-term land use policy. Extrapolation of past trends: This method relies on population forecasts and historical employment to population ratios to forecast the future employment levels for a specific industry. This method assumes that the future employment can be determined by extrapolating historical levels of employment in a particular sector for the City. The method of linear extrapolation is mathematically simple and provides viable estimates of employment levels in the City. This method has been applied to the population forecasts based on forecasts by BC Stats and employment by industry data from the 2016 Canadian Census. However, these employment projections are driven largely by historical trends in the local economy (City of Campbell River’s economy) and do not account for either trends in the larger economic region (Vancouver Island’s economy) or the outlook for a particular industry in the larger economic region. Also, it must be noted that employment projections for larger geographic regions are generally more reliable than for a smaller region.

36
Table 13: Employment Projection By Population-Based Method
Source: Urbanics Consultants Ltd., Statistics Canada and BC Stats
Employment projection by population-based method 2019 2025 2030 2035 2040 11 Agriculture; forestry; fishing and hunting 1,510 1,499 1,515 1,607 1,695 21 Mining; quarrying; and oil and gas extraction 389 386 390 414 437 22 Utilities 106 105 106 113 119 23 Construction 1,525 1,515 1,531 1,623 1,712 31-33 Manufacturing 656 652 659 699 737 41 Wholesale trade 348 346 350 371 391 44-45 Retail trade 2,192 2,176 2,200 2,332 2,461 48-49 Transportation and warehousing 742 737 745 790 833 51 Information and cultural industries 177 176 177 188 198 52 Finance and insurance 384 381 385 408 431 53 Real estate and rental and leasing 303 301 304 322 340 54 Professional; scientific and technical services 818 812 821 871 919 55 Management of companies and enterprises 20 20 20 21 23 56 Administrative and support; waste management and remediation services 606 602 608 645 680 61 Educational services 813 807 816 865 913 62 Health care and social assistance 2,146 2,131 2,154 2,284 2,410 71 Arts; entertainment and recreation 343 341 345 365 386 72 Accommodation and food services 1,490 1,479 1,495 1,585 1,673 81 Other services (except public administration) 773 767 775 822 867 91 Public administration 672 667 674 715 754TOTAL 16,013 15,900 16,070 17,040 17,979
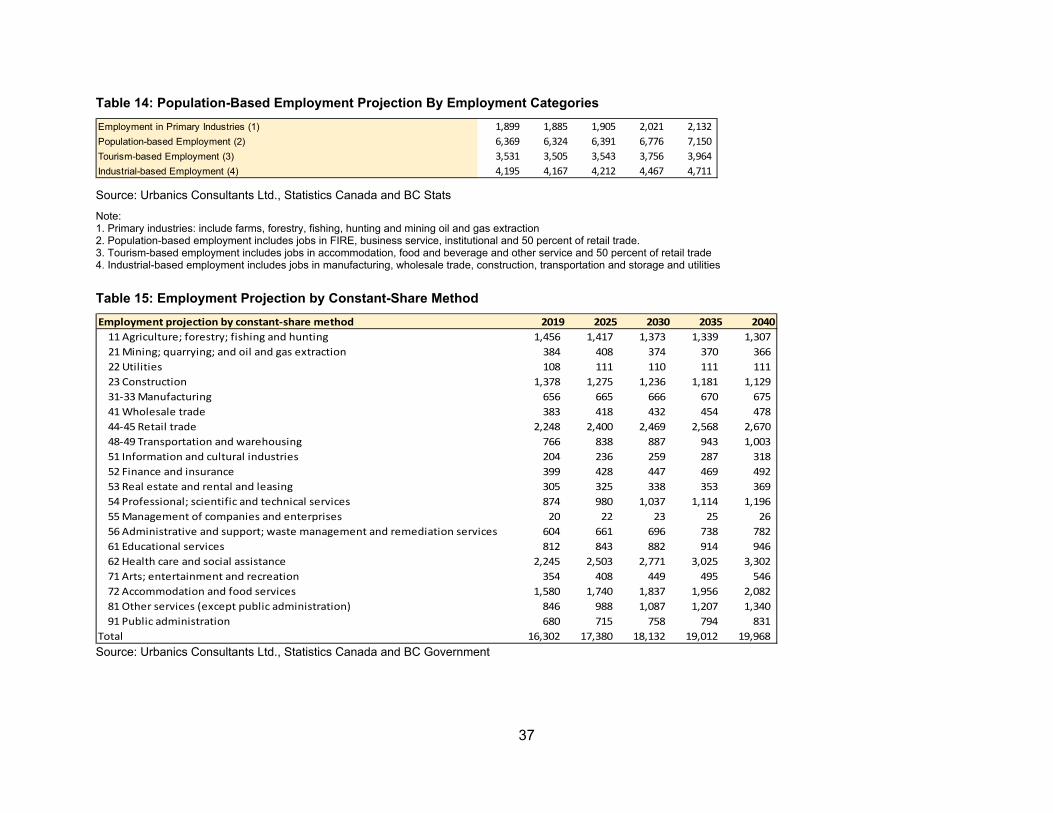
37
Table 14: Population-Based Employment Projection By Employment Categories
Source: Urbanics Consultants Ltd., Statistics Canada and BC Stats
Note: 1. Primary industries: include farms, forestry, fishing, hunting and mining oil and gas extraction 2. Population-based employment includes jobs in FIRE, business service, institutional and 50 percent of retail trade. 3. Tourism-based employment includes jobs in accommodation, food and beverage and other service and 50 percent of retail trade 4. Industrial-based employment includes jobs in manufacturing, wholesale trade, construction, transportation and storage and utilities Table 15: Employment Projection by Constant-Share Method
Source: Urbanics Consultants Ltd., Statistics Canada and BC Government
Employment in Primary Industries (1) 1,899 1,885 1,905 2,021 2,132 Population-based Employment (2) 6,369 6,324 6,391 6,776 7,150 Tourism-based Employment (3) 3,531 3,505 3,543 3,756 3,964 Industrial-based Employment (4) 4,195 4,167 4,212 4,467 4,711
Employment projection by constant-share method 2019 2025 2030 2035 2040 11 Agriculture; forestry; fishing and hunting 1,456 1,417 1,373 1,339 1,307 21 Mining; quarrying; and oil and gas extraction 384 408 374 370 366 22 Utilities 108 111 110 111 111 23 Construction 1,378 1,275 1,236 1,181 1,129 31-33 Manufacturing 656 665 666 670 675 41 Wholesale trade 383 418 432 454 478 44-45 Retail trade 2,248 2,400 2,469 2,568 2,670 48-49 Transportation and warehousing 766 838 887 943 1,003 51 Information and cultural industries 204 236 259 287 318 52 Finance and insurance 399 428 447 469 492 53 Real estate and rental and leasing 305 325 338 353 369 54 Professional; scientific and technical services 874 980 1,037 1,114 1,196 55 Management of companies and enterprises 20 22 23 25 26 56 Administrative and support; waste management and remediation services 604 661 696 738 782 61 Educational services 812 843 882 914 946 62 Health care and social assistance 2,245 2,503 2,771 3,025 3,302 71 Arts; entertainment and recreation 354 408 449 495 546 72 Accommodation and food services 1,580 1,740 1,837 1,956 2,082 81 Other services (except public administration) 846 988 1,087 1,207 1,340 91 Public administration 680 715 758 794 831 Total 16,302 17,380 18,132 19,012 19,968

38
Constant-share projection: This method is based on the assumption that the local share of a larger region’s (reference region) economic activity remains constant. For example, in this case, the share of employment for each industry in City of Campbell River is assumed to remain constant in comparison to the Vancouver Island and Coast Development Region (reference region). This assumes that the local economy (i.e. the City) is closely related to the larger region and any changes to the larger region’s economy will be closely reflected in the local economy. The benefit of this method is that employment projections for larger regions (i.e. Vancouver Island and Coast Development Region) are more frequent, detailed and reliable in comparison to smaller areas. Thus, the constant-share approach (Table 13) utilizes employment data by industry for the Vancouver Island and Coast Development Region provided by BC Stats (1996 – 2016), as well as employment data by industry for the City of Campbell River from 2006 to 2016 Census. Additionally, employment projections for the Vancouver Island and Coast Development Region from 2019 to 2040 were used for estimating future levels of employment for each industry in the City Table 16: Constant Share Employment Projection By Employment Categories
Source: Urbanics Consultants Ltd., Statistics Canada and BC Government Note: 1. Primary industries: include farms, forestry, fishing, hunting and mining oil and gas extraction 2. Population-based employment includes jobs in FIRE, business service, institutional and 50 percent of retail trade. 3. Tourism-based employment includes jobs in accommodation, food and beverage and other service and 50 percent of retail trade 4. Industrial-based employment includes jobs in manufacturing, wholesale trade, construction, transportation and storage and utilities Reconciliating the two methods, the constant-share method was considered to provide a much more reliable estimate of employment in the City than the extrapolation method. This is because the constant-share method better reflects the state of the regional economy and employment.
Employment in Primary Industries (1) 1,840 1,825 1,747 1,710 1,673 Population-based Employment (2) 6,549 7,114 7,611 8,110 8,647 Tourism-based Employment (3) 3,728 4,132 4,383 4,694 5,031 Industrial-based Employment (4) 4,165 4,287 4,368 4,473 4,591

39
3.5. Online Survey Summary A business-focussed survey was designed and conducted in collaboration with the City. The online survey helped to form a deeper understanding of operational, infrastructure and expansion needs of local businesses. The online survey received 30 responses. The key findings are summarized below: • The majority of the online survey participants (79 percent) considered the City as a good place to do business. Additionally, 14
percent of the online survey participants rated the City as an excellent place to do business; • In terms of labour availability and costs, 85 percent of participants indicated that labour costs are reasonable; however, over 48
percent considered the availability of labour as poor in the City, with additional comments regarding lack of skilled and unskilled workforce and lack of rental housing availability making it hard to attract talent.
• Regarding the suitability of the participants’ current facility, the responses were evening split: 50 percent of businesses indicated that they were satisfied with their currently facility; 50 percent of businesses indicated that they were not.
• In terms of expansion over the next 2 years, 44 percent of businesses expected to expand their space; 67 percent of businesses expected to increase the number of employees and 46 percent of businesses expected to increase their supply of equipment.
• Almost 60 percent per cent of the online survey participants indicated that they plan to maintain their current location, while 40 percent indicated they plan to move to another site in the next 2 years. Some respondents reported that it was not easy to find suitable industrial space.
3.6. Businesses Profile There are 2,165 businesses in total in the City as of April, 2019. Of that number, 696 of 2,165 businesses are identified as home-based businesses. The graphic below shows the composition of business establishments in the City. The 5 major categories of business are Professional Services (31%), Contractors (18%), Professional Businesses (12%), Retail Merchants (10%) and Building Rentals (6%). These are illustrated in Figure 9.

40
Figure 9: Business Profile
Source: City of Campbell River and Urbanics Consultants Ltd.

41
3.7. Potential growth industries Using the economic base and the future industrial outlook, a number of key potential growth industries were identified i.e., industries that have a higher probability of locating in the Campbell River over the next two decades. These growth industries are expected to be: • Local serving (non-basic) industries: Industries that service the Vancouver Island population and are consumer – oriented,
such as manufacturing related to outdoor activities (e.g. surfing), custom building, factory-built homes and technology (e.g. technology parts).
• Value-added Wood Industries: There are significant opportunities in the wood processing industries to support the production of
value-added wood products. This is primarily due to the City’s unique competitive advantage: access to raw materials and location relative to transportation. Despite the relatively convenient access to material inputs, the SRD has only 5 value-added manufacturers out of 137 value-added manufacturers in total on the Island2. The City can explore the opportunities to accommodate value-added wood industries, for example, engineered wood product, cabinets and furniture and artisanal products, etc.
• Transportation: Campbell River has excellent land, air, and sea-based transportation assets. The locational benefits of the City
can be capitalized successfully through growth in transportation and warehousing industries. In addition, the deep sea port in the City provides opportunities in accommodating large ships (panamax class).
• Technology industries: technology industries include jobs in the professional, scientific and technical services industry. The
CRadvantage is a municipally-owned broadband network invested in and owned by the City. This high speed and high-quality broadband network operates at a reasonable cost and can be expected to attract entrepreneurial growth from a variety of sectors including film, audio engineering, web development and digital development. The CRadvantage broadband network allows tech companies and entrepreneurs to flourish in their fields without sacrificing productivity, while enjoying a high quality of life and a lower cost of living relative to the Lower Mainland or Greater Victoria.
• Aviation industries: Campbell River airport represents a significant opportunity by attracting businesses from other regional
airports particularly related to aircraft maintenance and servicing, as well as supply-chain related services and flight training.
2 Economic Impact of the Value-added Wood Manufacturing Industry on Vancouver Island
42
• Tourism: The City can capitalize on its waterfront location, long coastal line and varieties of outdoor activities including
recreational fishing, trail biking, golf, etc. An additional economic growth opportunity relates to off-season tourism. Mount Washington offers skiing, snowboarding and other winter sports. Located in Electoral Area C of the Comox Valley Regional District, it seems to have been oriented to Courtenay, historically. Campbell River is considered to be suitably close to the mountain to attract indirect economic benefits: 33km from Courtenay versus 58km from Campbell River to Mount Washington or 34minutes versus 43 minutes driving time. Furthermore, with Mount Cain to the North of Campbell River, from a winter sports tourism perspective, Campbell River is more central and better positioned to be a winter sport hub than is Courtenay. Accordingly, there might be an opportunity to better capitalize on these amenities and attract more off-season tourism business to the City.
• Health Care: with the increasing population, goods and services related health care will be expected to grow accordingly. The
investment in a new $275 million hospital can be expected increase the attractiveness of the City to new residents.
• Other: Beyond the general trending for growth industries, there are two other specific considerations. The first is North Island College and its plans for expansion in Campbell River. The College recently completed a $17.6 million expansion and update of its facilities at the Dogwood campus. It is intended that this expansion will generate a greater retention of post-secondary school students in the community and new students. Investments in a state-of-the-art aquaculture lab, health simulation lab, community support lab, and new facilities for existing Aircraft Structures, Heavy Duty/Commercial Transport and Professional Cook students may serve to attract both new students and faculty to the City. To support its growth, North Island College is pursuing the construction of student residences in association with its Courtenay Campus. A similar opportunity exists for the Campbell River Campus. The City has an opportunity to explore potential synergies/ partnerships with the College for this purpose on downtown City owned lands. Increasing the number of residents in the downtown will support its economic vibrancy.
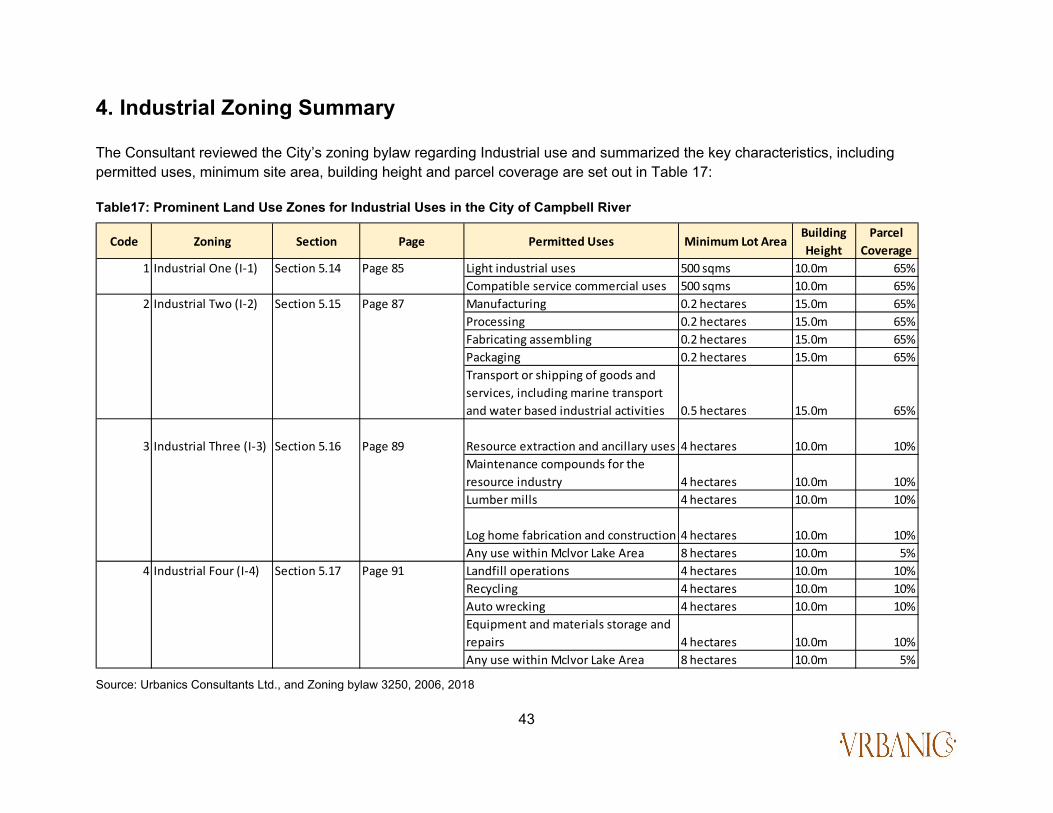
43
4. Industrial Zoning Summary The Consultant reviewed the City’s zoning bylaw regarding Industrial use and summarized the key characteristics, including permitted uses, minimum site area, building height and parcel coverage are set out in Table 17: Table17: Prominent Land Use Zones for Industrial Uses in the City of Campbell River
Source: Urbanics Consultants Ltd., and Zoning bylaw 3250, 2006, 2018
Code Zoning Section Page Permitted Uses Minimum Lot AreaBuilding Height
Parcel Coverage
1 Industrial One (I-1) Section 5.14 Page 85 Light industrial uses 500 sqms 10.0m 65%Compatible service commercial uses 500 sqms 10.0m 65%
2 Industrial Two (I-2) Section 5.15 Page 87 Manufacturing 0.2 hectares 15.0m 65%Processing 0.2 hectares 15.0m 65%Fabricating assembling 0.2 hectares 15.0m 65%Packaging 0.2 hectares 15.0m 65%Transport or shipping of goods and services, including marine transport and water based industrial activities 0.5 hectares 15.0m 65%
3 Industrial Three (I-3) Section 5.16 Page 89 Resource extraction and ancillary uses 4 hectares 10.0m 10%Maintenance compounds for the resource industry 4 hectares 10.0m 10%Lumber mills 4 hectares 10.0m 10%
Log home fabrication and construction 4 hectares 10.0m 10%Any use within Mclvor Lake Area 8 hectares 10.0m 5%
4 Industrial Four (I-4) Section 5.17 Page 91 Landfill operations 4 hectares 10.0m 10%Recycling 4 hectares 10.0m 10%Auto wrecking 4 hectares 10.0m 10%Equipment and materials storage and repairs 4 hectares 10.0m 10%Any use within Mclvor Lake Area 8 hectares 10.0m 5%

44
Table18: Prominent Land Use Zones for Industrial Uses in the City of Campbell River
Zone Approximate Location Purpose
I-1 Concentrated within the Campbellton neighbourhood and the Perkins Road and Highway 19 area north of the river
This zone provides for light industrial uses and compatible service commercial uses
I-2 Concentrated at the north end of the City straddling Highway 19. Comprises the former Elk Falls mill site and adjacent industrial parks
This zone provides areas for manufacturing, processing, fabricating assembling, packaging, and transport or shipping of goods and services, including marine transport and water based industrial activities
I-3 Concentrated along Highway 28 by McIvor Lake Road. There are few scattered I-3 zones west of Highway 19 at Merecroft Road and east of the Highway at Willis Road
This zone provides areas for resource extraction and ancillary uses, maintenance compounds for the resource industry, lumber mills and log home fabrication and construction
I-4 Concentrated along Highway 28 by McIvor Lake Road.
This zone provides areas for landfill operations, recycling, auto wrecking, equipment and materials storage and repairs
A-1 Airside airport lands This zone provides for aviation related uses and/or uses on the Campbell River airport lands which rely on the airport run-way or other uses associated with the airport operations
A-2 Adjacent to the west of the airport This zone provides for aviation related, and other related or complementary commercial and light industrial uses on privately owned lands adjacent or in proximity to the municipal airport
Source: Urbanics Consultants Ltd., and Zoning bylaw 3250, 2006, 2018

45
5. SWOT Synopsis A SWOT (Strengths, Weaknesses, Opportunities, and Threats) exercise was under undertaken through stakeholder consultation and analysis. This included:
A detailed survey for assessing the barriers and opportunities for enhancing employment in the City; • A stakeholder workshop; • Stakeholder interviews.
The consultation process targeted the following feedback: • Identifying perceived intrinsic strengths, such as location attributes and key business clusters and locational advantage. • Identifying weaknesses in the economic base, type and size of parcels, zoning regulations etc. • Identifying unmet opportunities, such as market “gaps” or underrepresented sectors within the economy that present a
realistic opportunity. • Identifying potential challenges to the local economy, such as exposure to cyclical primary industries, accessibility,
infrastructure availability.
The following is a summary of the key outcomes of the analysis. This information is used to inform recommendations later in this study.

46
•Ex
celle
nt q
ualit
y of
life/
spec
tacu
lar s
ettin
g •
Relia
ble
infra
stru
ctur
e •
Clu
ster
ed &
syne
rgist
ic la
nd u
ses
•Fu
ll-se
rvic
e m
arin
e te
rmin
al &
dee
p se
a p
ort
•A
ttra
ctiv
e d
ownt
own
with
room
for g
row
th
•St
rong
aqu
acu
lture
pre
senc
e •
Exce
llent
airp
ort w
ith a
vaila
ble
airs
ide
land
s •
Nor
th Is
land
ga
tew
ay
•Po
st-s
econ
da
ry e
duc
atio
n ca
mp
us
•N
ew h
ospi
tal
•La
ck o
f ski
lled
labo
ur to
serv
e a
via
tion
ind
ustry
•
Lack
of r
ead
ily-u
sea
ble
ind
ustri
al la
nds
•Sc
arc
ity o
f Ind
ustri
ally
zon
ed la
rge
lots
(+25
acr
es)
•Un
der
div
ersif
ied
eco
nom
y
•Pr
oxim
ity to
Dep
artu
re B
ay/
Duk
e Po
int f
errie
s •
Phys
ica
l res
trict
ions
to e
xpa
nsio
n of
I-2
land
s at t
he
north
end
of t
he C
ity
•La
ck o
f sui
tabl
e co
mm
erci
al s
pace
for s
ma
ll bus
ines
ses
•La
ck o
f affo
rda
ble
rent
al h
ousin
g •
Lack
of s
uita
ble
com
mer
cia
l spa
ce fo
r sm
all b
usin
ess
•Th
ere
is d
ema
nd fo
r ind
ustri
al la
nds f
or m
anu
fact
urin
g,
wa
ste
ma
nage
men
t, eq
uip
men
t and
ma
rine
dea
lers
hip
s •
Ther
e is
dem
and
for b
usin
esse
s in
sup
ply
cha
in in
avi
atio
n se
ctor
•
Con
tinue
d g
row
th in
the
aq
uacu
lture
ind
ustry
•
Dev
elop
men
t of A
-2 la
nds n
orth
of J
ubile
e •
Pote
ntia
l gro
wth
in th
e a
gric
ultu
re se
ctor
•
Subs
tant
ial g
row
th o
f the
65+
yea
r age
coh
ort
•Sk
illed
labo
ur is
retu
rnin
g fro
m e
nerg
y se
ctor
•
Mun
icip
al B
roa
db
and
Net
wor
k - C
Rad
vant
age
•
Agi
ng w
orki
ng p
opul
atio
n •
Com
petit
ion
from
Com
ox, C
ourte
nay
and
Cum
berla
nd
•Po
tent
ial in
com
pa
tibilit
y of
cer
tain
ind
ustri
al z
ones
and
a
ssoc
iate
d a
quife
r int
erfa
ce
•0-
14 y
ear o
ld a
ge c
ohor
t is t
rend
ing
dow
nwa
rd
•La
ck o
f ski
lled
labo
ur
•Lo
ss o
f bus
ines
s due
to la
ck o
f la
bor &
affo
rda
ble
re
nta
l hou
sing
•In
suffi
cien
t Ind
ustri
ally
zon
ed &
serv
iced
land
long
term
STRE
NG
THS
THRE
ATS
O
PPO
RTUN
ITIES
W
EAKN
ESSE
S

47
6. Competitive Position in the Employment Land Market Figure 10 and Figure 11 provide the findings from the assessment of taxes related to major industry and light industrial across six municipalities: Campbell River, Comox, Courtenay, Cumberland, Port Alberni and Port Hardy. The findings from the analysis show the competitiveness of the City of Campbell River in terms of both major industry and light industry. The City maintains a higher property tax rate in comparison to Comox and Courtenay for heavy industry. This makes the City less competitive than these municipalities from a taxation perspective. These communities can be considered as direct competitors for the City. However, the City has a lower property tax than Cumberland, Port Alberni and Port Hardy. In contrast, for light industry, the City’s property tax ranked second lowest among the six municipalities.
Figure 11: Major industry property tax in 2018
Source: Urbanics Consultants Ltd.
Figure 10: Light Industry Property Tax In 2018
Source: Urbanics Consultants Ltd.

48
7. Land Supply Analysis
7.1. Supply of Land by Zoning Type The land base in the City of Campbell River totals 34,000 acres. Other than Federally controlled lands, the City’s Zoning Bylaw divides all land into specifics land use zones and sets out permitted uses and associated regulations for each zone designation. The Bylaw can generally aggregated into the following categories: • Airport • Commercial • Industrial • Public Area • Residential • Rural • Specialized (Jubilee Heights and CD zones).
The Zoning categories that comprise the largest area of land are; Rural (19,245 acres); Public Area (5,131 acres), and, Residential (4,989 acres).
With respect to employment lands, there are three general land use zoning categories that regulate such activity. These include Industrial zones (4 zones), Airport Zoning (2 Zones), and Commercial Zoning (11 zones). Other zones that accommodate employment generating land uses such as the Comprehensive Development Zone for the development site at Jubilee and Dogwood include iterations of commercial zoning but are comparatively small. The City benefits from synergies associated with concentrating both industrially and commercially zoned land in established nodes. However, the primary challenges faced with respect to expanding land supply to accommodate growth in existing nodes include physical characteristics of adjacent lands (e.g. utilization, topography and riparian setbacks) and servicing (water, sewer, 3-phase power).

49
Figure 12: Total Supply of by Land Zoning Type
Source: Urbanics Consultants Ltd., City of Campbell River and BC Assessment

50
7.1.1. Supply of Industrial Land by Zoning Type
The industrial land base in the City of Campbell River is 1,848.7 acres. There are 4 categories of zoning under the City’s zoning bylaw: I–1, I–2, I–3 and I–4. The distribution of land among the 4 categories are displayed in Figure 13. The zoning type that occupies the largest amount of land is I–3 with 905.7 acres; I–2 comes in second with 741.7 acres; and there are 148.9 acres and 78.4 acres zoned for I–4 and I–1 respectively.
Figure 13: Supply of Industrial Land by Zoning Type
Source: Urbanics Consultants Ltd., City of Campbell River and BC Assessment
Table 19: Supply of Industrial Land by Zoning Type
Source: Urbanics Consultants Ltd., City of Campbell River and BC Assessment
Total %I - 1 78.4 4%I - 2 741.7 40%I -3 905.7 48%I -4 148.9 8%Total 1,874.7 100%
All Industrial Area(acres)Zoning Type

51
7.1.2. Supply of Utilized and Underutilized Industrial Land To examine the extent of land use among these industrial areas, data was used from the BC Assessment Authority (BCAA). This provides the land and improvements values for most parcels in the City. This data was used to assess the extent of industrial land utilization for each parcel on the basis of:
• Vacant (no buildings or improvement value); • Underutilized (improvement value <20 percent of land value); and • Utilized (improvement value >20 percent of land value). As shown in Table 20, in terms of utilization of the industrial land, 80 percent of the I–1 zoned industrial land is fully utilized, which leaves only 8.8 acres vacant land and 6.8 acres underutilized land in the I–1 zoning. The utilization for I–2 zoned industrial land is significantly lower than the other zoned industrial land: only 18 percent of the zoned I–2 industrial land is fully utilized with 37 percent vacant and 45 percent underutilized.
Table 20: Land utilization by industrial zoning
Source: Urbanics Consultants Ltd., City of Campbell River and BC Assessment
A-Vacant B-Underutilized C-Utilized TotalI - 1 8.8 6.8 62.8 78.4 I - 2 276.3 332.2 133.2 741.7 I - 3 179.8 125.6 600.3 905.7 I - 4 77.9 - 71.0 148.9 Total 542.8 464.5 867.3 1,874.7
Zoning Type All Industrial Area (acres)
Table 21: Land utilization by industrial zoning in percent
Source: Urbanics Consultants Ltd., City of Campbell River and BC Assessment
A-Vacant B-Underutilized C-Utilized TotalI - 1 11% 9% 80% 100%I - 2 37% 45% 18% 100%I -3 20% 14% 66% 100%I -4 52% 0% 48% 100%Total 100%
All Industrial Area (%)Zoning Type

52
7.1.3. Size of Industrial Land by Zoning Type There are 91 I–1 zoned industrial parcel in the City. They range in size up to five acres. This is a function of both the location of I-1 parcels, their history, coupled with the permitted range of uses. There are 11 and 12 parcels in I–2 and I–3 respectively that are between five to ten acres. Parcels more than 50 acres are located in I–2 and I–3 zoning. Large parcels are an important component of the industrial land inventory as they accommodate industries that require large assembly, storage or staging areas.
Table 22: Size of Industrial Land by Zoning Type
Source: Urbanics Consultants Ltd., City of Campbell River and BC Assessment
7.1.4. Airport land There is ample land located in the Campbell River airport zoned as A–1 and more so, A–2. Land zoned A–1 is City-owned land and currently intended for aviation-related uses and/or uses on the Campbell River airport lands that rely on an airside location, or for uses associated with the airport operations. The A–2 zoned lands are privately owned and are adjacent to or in proximity to the airport. It is a zone intended for aviation related or complementary commercial and light industrial uses.
Only 1 percent of A -2 airport land is utilized, which leaves 99 percent (approximately 1,110 acres) as vacant land. However, much of the A-2 land adjacent to the airport has practical limitations to its development such as physical characteristics, servicing viability, and ownership. However, A-2 lands that straddle Jubilee Parkway, east of the Airport have potential for development with lands north of the Jubilee Parkway having more favourable topography, comparatively few riparian limitations, can be fully serviced versus lands south having a significantly higher degree of riparian sensitivity impacting the physical development. Subdivision servicing standards and development obligations can impact the viability of bringing A-2 lands to market.
Area I-1 I-2 I-3 I-4Less than 1 acre 60 37 0 01 acre to 5 acres 31 29 4 05 acres to 10 acres 0 11 12 210 acres to 25 acres 0 8 7 025 acres to 50 acres 0 6 0 450 acres to 100 acres 0 1 2 0Greater than 100 acres 0 1 4 0Total Parcels 91 93 29 6

53
Figure 14: Employment Land in A-1 and A-2 Zoning
Source: Urbanics Consultants Ltd., Sitewise Pro.

54
Figure 15: Employment Land in A - 1 Zoning
Source: Urbanics Consultants Ltd., Sitewise Pro.
Note: 1. Land in blue is vacant; 2. Land in orange is occupied.

55
Figure 16: Employment Land in A - 2 Zoning
Source: Urbanics Consultants Ltd., Sitewise Pro. Note: 1. Land in blue is vacant; 2. Land in orange is occupied.
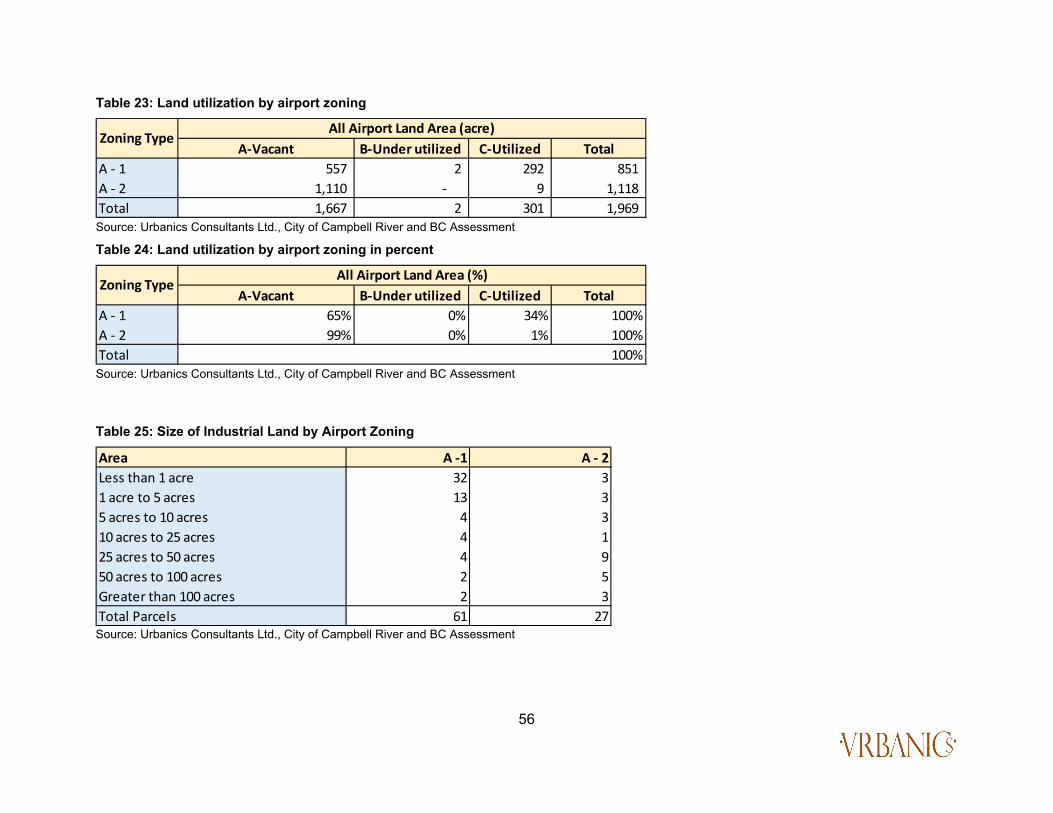
56
Table 23: Land utilization by airport zoning
Source: Urbanics Consultants Ltd., City of Campbell River and BC Assessment
Table 24: Land utilization by airport zoning in percent
Source: Urbanics Consultants Ltd., City of Campbell River and BC Assessment
A-Vacant B-Under utilized C-Utilized TotalA - 1 557 2 292 851 A - 2 1,110 - 9 1,118 Total 1,667 2 301 1,969
All Airport Land Area (acre)Zoning Type
A-Vacant B-Under utilized C-Utilized TotalA - 1 65% 0% 34% 100%A - 2 99% 0% 1% 100%Total 100%
All Airport Land Area (%)Zoning Type
Table 25: Size of Industrial Land by Airport Zoning
Source: Urbanics Consultants Ltd., City of Campbell River and BC Assessment
Area A -1 A - 2Less than 1 acre 32 31 acre to 5 acres 13 35 acres to 10 acres 4 310 acres to 25 acres 4 125 acres to 50 acres 4 950 acres to 100 acres 2 5Greater than 100 acres 2 3Total Parcels 61 27

57
7.2. Supply of Commercial Land
7.2.1. Supply of Commercial Land by Zoning Type The commercial land base in the City of Campbell River is 614.7 acres. There are 8 categories of zoning under the City’s zoning bylaw: C – 1, C – 2, C – 3, C – 4, C – 5, C – 6, C – 7 and C – 8. The distribution of land among the 8 categories is displayed in Figure 13. As illustrated, C – 1, C – 2, C – 4 and C – 5 together comprise 96 percent of total commercial land base. The zoning designation that occupies the largest amount of land is C – 4 with 232.3 acres; C – 1 is the next largest area at 164.6 acres; and, lastly, there are 142.3 acres and 52.8 acres zoned as C – 5 and C – 2 respectively. Table 26:Supply of CommercialLand by Zoning Type
Source: Urbanics Consultants Ltd., City of Campbell River and BC Assessment
Total %C - 1 164.6 27%C - 2 52.8 9%C - 3 3.3 1%C - 4 232.3 38%C - 5 142.3 23%C - 6 8.9 1%C - 7 4.0 1%C - 8 6.5 1%Total 614.7 100%
All Commercial Area (acres)Zoning Type
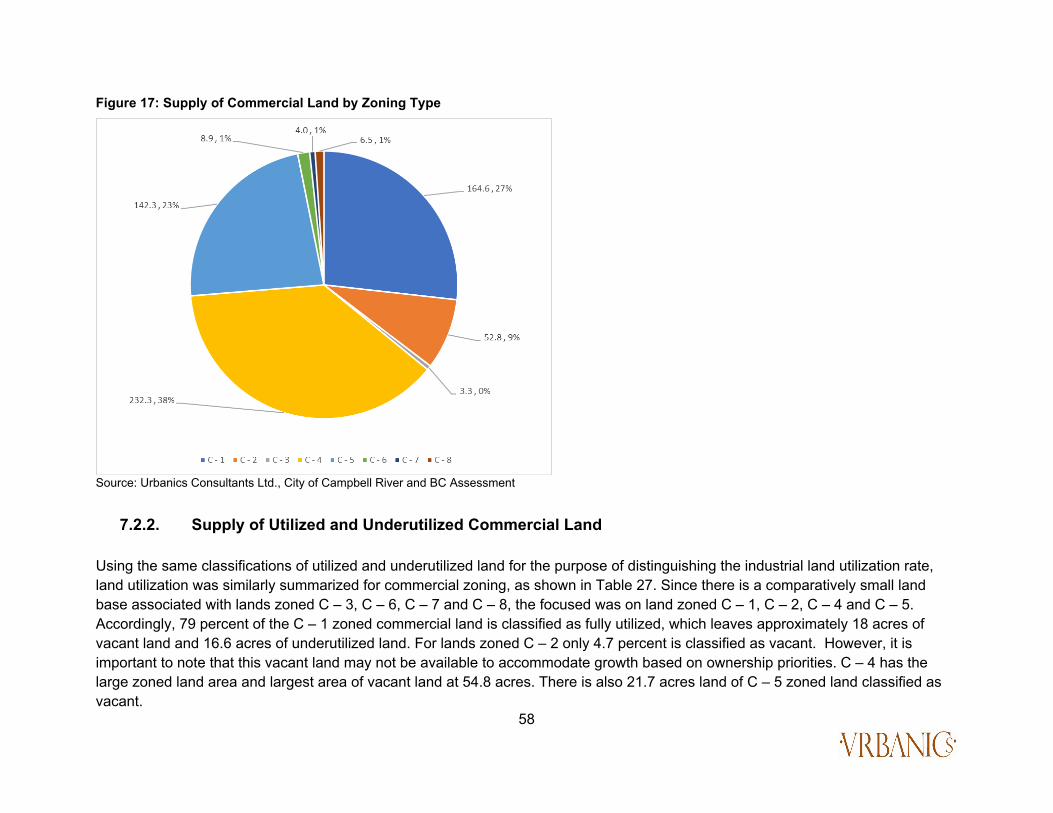
58
Figure 17: Supply of Commercial Land by Zoning Type
Source: Urbanics Consultants Ltd., City of Campbell River and BC Assessment
7.2.2. Supply of Utilized and Underutilized Commercial Land Using the same classifications of utilized and underutilized land for the purpose of distinguishing the industrial land utilization rate, land utilization was similarly summarized for commercial zoning, as shown in Table 27. Since there is a comparatively small land base associated with lands zoned C – 3, C – 6, C – 7 and C – 8, the focused was on land zoned C – 1, C – 2, C – 4 and C – 5. Accordingly, 79 percent of the C – 1 zoned commercial land is classified as fully utilized, which leaves approximately 18 acres of vacant land and 16.6 acres of underutilized land. For lands zoned C – 2 only 4.7 percent is classified as vacant. However, it is important to note that this vacant land may not be available to accommodate growth based on ownership priorities. C – 4 has the large zoned land area and largest area of vacant land at 54.8 acres. There is also 21.7 acres land of C – 5 zoned land classified as vacant.

59
Table 27: Land utilization by commercial zoning
Source: Urbanics Consultants Ltd., City of Campbell River and BC Assessment Table 28: Land utilization by commercial zoning as a percentage
Source: Urbanics Consultants Ltd., City of Campbell River and BC Assessment
A-Vacant B-Under utilized C-Utilized TotalC - 1 18.0 16.6 130.0 164.6 C - 2 4.7 3.3 44.8 52.8 C - 3 - - 3.3 3.3 C - 4 54.8 39.2 138.3 232.3 C - 5 21.7 5.5 115.1 142.3 C - 6 1.0 - 7.9 8.9 C - 7 2.4 0.4 1.2 4.0 C - 8 1.7 - 4.8 6.5 Total 104.3 65.0 445.4 614.7
All Commercial Area (acres)Zoning Type
A-Vacant B-Under utilized C-Utilized TotalC - 1 11% 10% 79% 100%C - 2 9% 6% 85% 100%C - 3 0% 0% 100% 100%C - 4 24% 17% 60% 100%C - 5 15% 4% 81% 100%C - 6 11% 0% 89% 100%C - 7 60% 10% 30% 100%C - 8 26% 0% 74% 100%Total 100%
All Commercial Area (%)Zoning Type

60
Commercial Zone Summary
Zone Designation
Purpose
C-1 Provides for a range of commercial services and uses as well as high density residential uses in the primary commercial designation for the downtown area.
C-2 Provides for a range of commercial services and uses as well as medium to high density residential uses in the secondary commercial designation areas of Willow Point, Dogwood Street and 2nd Ave. as well as Dogwood Street South and Merecroft Road.
C-3 Provides for a limited range of commercial services and uses as well as medium density residential uses in the tertiary commercial designation areas of South Dogwood and Hilchey Road, and South Dogwood and Jubilee Parkway.
C-4 Provides for a mix of limited retail, service, highway and tourist accommodation commercial services and uses, as well as medium to high density residential uses in the commercial designation areas of Campbellton, North Campbell River, and along the South Island Highway
C-5 Provides for waterfront-related recreational, tourist, and marine-oriented commercial uses.
C-6 Provides for highway-related tourist accommodation and related ancillary uses and facilities.
C-7 Provides facilities for the launching and loading of watercraft and limited ancillary commercial uses.
C-8 Provides for limited “stand-alone” retail and/or service-related commercial uses identified as “local commercial uses” in the official community plan.
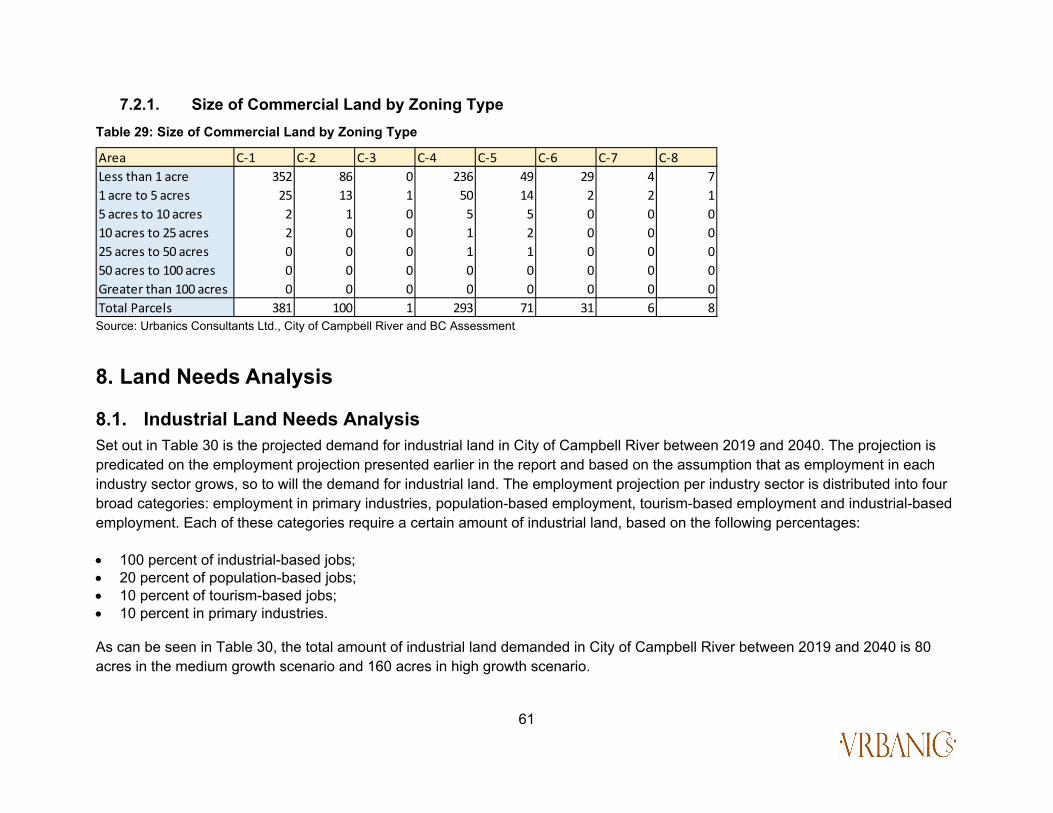
61
7.2.1. Size of Commercial Land by Zoning Type Table 29: Size of Commercial Land by Zoning Type
Source: Urbanics Consultants Ltd., City of Campbell River and BC Assessment
8. Land Needs Analysis
8.1. Industrial Land Needs Analysis Set out in Table 30 is the projected demand for industrial land in City of Campbell River between 2019 and 2040. The projection is predicated on the employment projection presented earlier in the report and based on the assumption that as employment in each industry sector grows, so to will the demand for industrial land. The employment projection per industry sector is distributed into four broad categories: employment in primary industries, population-based employment, tourism-based employment and industrial-based employment. Each of these categories require a certain amount of industrial land, based on the following percentages: • 100 percent of industrial-based jobs; • 20 percent of population-based jobs; • 10 percent of tourism-based jobs; • 10 percent in primary industries. As can be seen in Table 30, the total amount of industrial land demanded in City of Campbell River between 2019 and 2040 is 80 acres in the medium growth scenario and 160 acres in high growth scenario.
Area C-1 C-2 C-3 C-4 C-5 C-6 C-7 C-8Less than 1 acre 352 86 0 236 49 29 4 71 acre to 5 acres 25 13 1 50 14 2 2 15 acres to 10 acres 2 1 0 5 5 0 0 010 acres to 25 acres 2 0 0 1 2 0 0 025 acres to 50 acres 0 0 0 1 1 0 0 050 acres to 100 acres 0 0 0 0 0 0 0 0Greater than 100 acres 0 0 0 0 0 0 0 0Total Parcels 381 100 1 293 71 31 6 8

62
Table 30: Industrial Land Demand Projection
Source: Urbanics Consultants Ltd., City of Campbell River and BC Assessment Notes: 1. Primary industries: include farms, forestry, fishing, hunting and mining oil and gas extraction 2. Population-based employment includes jobs in FIRE, business service, institutional and 50 percent of retail trade. 3. Tourism-based employment includes jobs in accommodation, food and beverage and other service and 50 percent of retail trade 4. Industrial-based employment includes jobs in manufacturing, wholesale trade, construction, transportation and storage and utilities 5. Total Employment on industrial land is based on 100 percent of industrial-based jobs, plus 20 percent of the population-based employment and 10 percent of the employment in tourism and primary industry. 6. The assumed average employment density is 6 to12 people per gross acre. In a low-density scenario, a total 160 acres of industrially zoned land will be required by 2040. For a high-density scenario, 80 acres of industrially zoned land will be required by 2040. In terms of the spatial implications for future industrial land supply, there are two conventional key considerations: locational context and servicing. With regard to I-4 zoning, future demand for lands zoned to permit landfill operations, recycling, auto wrecking, equipment and materials storage and repairs is anticipated to be low as is the case with the I-3 uses that include landfill operations, recycling, auto wrecking, equipment and materials storage and repairs. The uses in these categories have varying degrees of reliance on municipal infrastructure but certainly not more than domestic volumes. These land uses are generally low intensity with respect to employees/ acre. That said, there are over 300 acres of vacant and underutilized I-3 land and nearly 80 acres of vacant I-4 land. A further
Employment by industries - City of Campbell River Based on Employment Growth 2019 2025 2030 2035 2040Employment in Primary Industries (1) 1,840 1,825 1,747 1,710 1,673 Population-based Employment (2) 6,549 7,114 7,611 8,110 8,647 Tourism-based Employment (3) 3,728 4,132 4,383 4,694 5,031 Industrial-based Employment (4) 4,165 4,287 4,368 4,473 4,591 Total Employment 16,282 17,358 18,109 18,987 19,942
Total Employment on Idustrial Land (5) 6,032 6,306 6,503 6,736 6,991 Growth Rate 0.7% 0.5% 0.6% 0.6%Incremental growth in employment on industrial land 274 198 232 255
Incremental growth in industrial land demand (acres)Density of 6 jobs per acre 46 33 39 43 Density of 12 jobs per acre 23 16 19 21

63
examination of these lands relative to their location, accessibility and servicing would determine their utility to accommodate future land supply.
The I-2 zoned lands comprise the second largest industrial land use designation by size at nearly 742 acres or 40% of the overall industrial land base with only I-3 lands being greater at just over 900 acres or 48% of the overall land base. I-2 lands tend of be concentrated at the north end of the city straddling Highway 19. A significant proportion of these lands comprise the land holdings of the former Elk Falls Mill operation and may remain under a single ownership. In this case, it could have implications for their future use and development. Of the 742 acres of I-2 land, 82% (608 acres) is classified as vacant or underutilized. While this number might suggest ample supply for growth, the actual area available to accommodate new industry is expected to be less given physical constraints (e.g. topography, riparian areas, etc.), potential servicing limitations beyond domestic supply, and parcel size coupled with ownership. A closer study to accurately assess the percentage of viably developable land would be beneficial in reconciling these considerations.
In the long term, notwithstanding the question of municipal servicing, there is a significant area of primarily greenfield land at the northern boundary of the city, west of Highway 19. The physical characteristics of this land are conducive to major industrial expansion across all zone designations. This land could be designated as “industrial reserve” lands and would warrant a long-term master planning exercise to, proactively, resolve questions of capacity and municipal infrastructure requirements. It is noted that there are very few large (50 acres), industrially zoned parcels in the city. There is an economic advantage to facilitating a small increase in the number to attract industry classes that require large parcels or otherwise, to accommodate future expansion of existing industry in the community. The subject area is large enough to accommodate the subdivision of a range of parcel sizes including large lots.
Lands zoned I-1 are largely concentrated within the Campbellton neighbourhood and west of Highway 19 north of the River. Lands with this zone designation are characterized by relatively small lot sizes, most of which are less than 1 acre in size with none being larger than 5 acres. Furthermore, only 20% of this Zone inventory are classified as vacant or underutilized. It is expected that demand for supply of this land use typology will be steady to 2040. However, there are two significant considerations associated with accommodating future growth and utilization of I-1 lands. This includes physical constraints to expansion within the existing locations and the future direction for land use within the Campbellton neighbourhood. That said, it is noted that the range of uses set out in the A-2 Zone is generally analogous to the range of uses permitted in the I-1 zone, particularly in regard to the nature and extent of potential land use impacts. Accordingly, it is noted that A-2 lands east of the airport and north of Jubilee Parkway are physically ideal (being relatively flat with few riparian features) for accommodating new development and with full municipal services along the parcel frontage. The range of uses permitted within the I-1 zone of through the potential creation of a new light industrial zone that reflects the key A-2 and I-1 uses could be very compatible with this strategic location adjacent to both the airport and Highway 19.

64
8.2. Office Needs Analysis As specified in the Rollo & Associates “Downtown Growth Analysis” report completed in 2016, the City had a total of 369,000 square feet of above ground office space. Of the total square feet, approximately 332,000 square feet is located in downtown Campbell River. This concentration helps reinforce the economic vibrancy of the downtown core which has associated implications community-wide. Since there was no new office space built during 2017-2018, it is considered reasonable to rely on the office inventory in 2016 as the base line for the office demand projection for the City.
Figure 18: Warranted Office Space Projection from 2016 to 2040
Source: Urbanics Consultants Ltd., and City of Campbell River

65
Based on the 2016 employment distribution in the City, approximately 10 percent of employment is assigned to office-based employment. The vacancy rate is approximately 25 percent, which resulted in around 276,000 square feet office space in actual use. An average of 300 square feet per employee was assumed and combined with the derived employment projection, the warranted office space projection was determined. The office demand projection is presented in Figure 18.
As illustrated in Figure 18, office employment is expected to grow from 919 jobs in 2016 to 1,213 jobs in 2040. Warranted office space is anticipated to grow from approximately 276,000 square feet to 364,000 square feet accordingly. Therefore, the current total office space (369,000 square feet) will be adequate until the year 2040.
8.3. Commercial Land Needs Analysis To arrive at an estimate for total retail expenditure and the warranted retail floorspace, the following methodology is followed:
• Define appropriate trade area; • Use average annual per capita retail expenditures to estimate the total retail expenditure potential; • Assign the market share estimates arrive at an approximation of total actualized retail sales; • Assign a reasonable annual retail sales productivity per square foot and use that to estimate the total warranted retail
floorspace.
8.3.1. Trade Area Delineation To support the objective of identifying retail demand in the City of Campbell River, it is necessary to define an appropriate trade area. A retail trade area is the geographic area surrounding the subject area from which the vast majority, normally 90 percent to 95 percent of annual sales volume is generated. The determination of a trade area boundary depends on a number of factors including the local and regional road network, natural and human-made transportation or psychological barriers, driving times, the proximity of competitive operations, and the location of population concentrations. Given the above observation, the Consultant has delineated the City of Campbell as the primary trade area and the rest of Strathcona Regional District (except Campbell River) as the secondary trade area. As a result, the entire Strathcona Regional District is the total trade area. This is important given the relatively large populations that exist in proximity to City boundaries.

66
8.3.2. Per Capita Retail Expenditure Table 31 provides a breakdown of the annual per capital retail expenditure distribution in each region for 2018. Table 31: Annual per capita expenditure in Campbell River, SRD, Trade area and BC
Source: Urbanics Consultants Ltd, National Household Survey 2018 and Sitewise
8.3.3. Total Expenditure Potential in Primary Trade Area The primary trade area is the City of Campbell River. As is illustrated in the Table 32 below, the annual per capita and per category expenditure levels for 2018 are similar to the general BC averages, with salient differences being the expenditure per capita in food and heath care is higher than provincial average respectively by 5 percent and 4 percent.
Expenditure CategoriesCampbell River - Primary Trade Area (Expenditure
per capita)
Strathcona (except Campbell River) - Secondary Trade Area
(Expenditure per capita)
Trade Area (Expenditure per
capita)
BC (Expenditure per capita)
Total Retail Expenditure 17,223 15,996 16,892 17,591 Food 5,375 5,001 5,274 5,124 Household operation 1,859 1,788 1,840 1,953 Health care 1,711 1,698 1,708 1,648 Household furnishings and equipment 1,554 1,466 1,530 1,609 Recreation 1,741 1,577 1,697 1,777 Personal care 790 674 759 810 Clothing 1,265 1,152 1,235 1,556
Reading materials and other printed matter 110 101 108 120
Tobacco products and alcoholic beverages 1,523 1,347 1,475 1,555 Games of chance 511 439 491 528 Miscellaneous expenditures 783 753 775 912
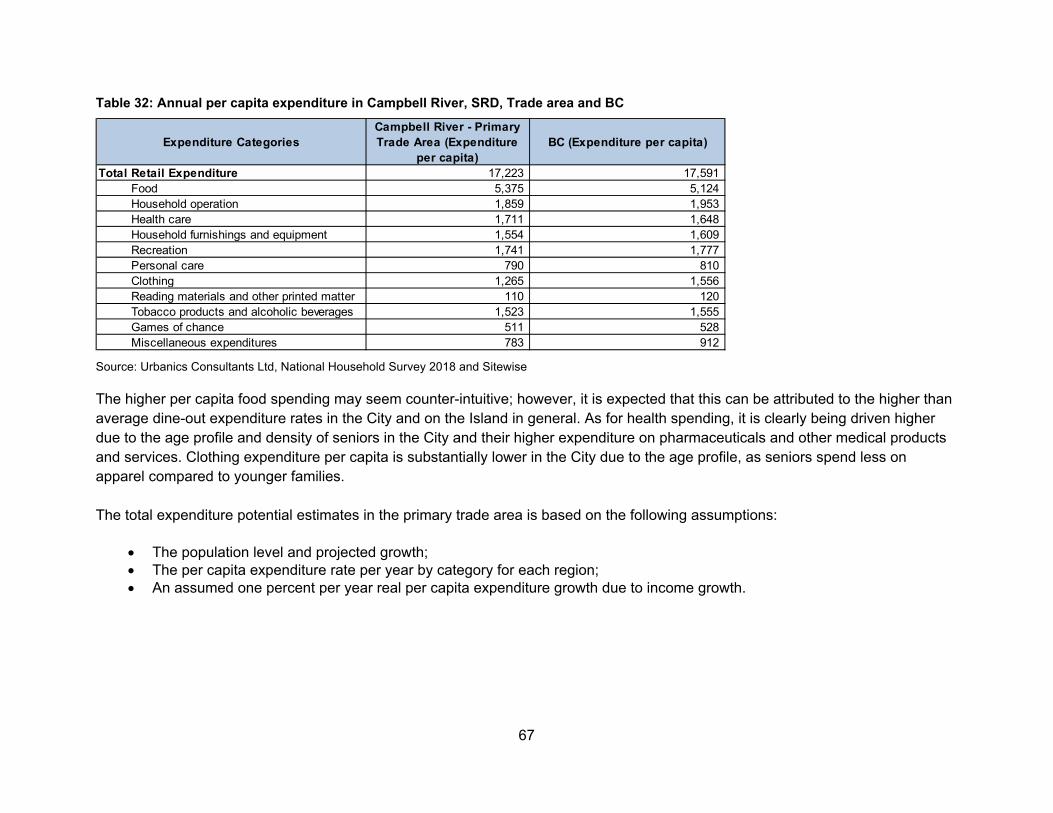
67
Table 32: Annual per capita expenditure in Campbell River, SRD, Trade area and BC
Source: Urbanics Consultants Ltd, National Household Survey 2018 and Sitewise The higher per capita food spending may seem counter-intuitive; however, it is expected that this can be attributed to the higher than average dine-out expenditure rates in the City and on the Island in general. As for health spending, it is clearly being driven higher due to the age profile and density of seniors in the City and their higher expenditure on pharmaceuticals and other medical products and services. Clothing expenditure per capita is substantially lower in the City due to the age profile, as seniors spend less on apparel compared to younger families. The total expenditure potential estimates in the primary trade area is based on the following assumptions:
• The population level and projected growth; • The per capita expenditure rate per year by category for each region; • An assumed one percent per year real per capita expenditure growth due to income growth.
Expenditure CategoriesCampbell River - Primary Trade Area (Expenditure
per capita)BC (Expenditure per capita)
Total Retail Expenditure 17,223 17,591 Food 5,375 5,124 Household operation 1,859 1,953 Health care 1,711 1,648 Household furnishings and equipment 1,554 1,609 Recreation 1,741 1,777 Personal care 790 810 Clothing 1,265 1,556 Reading materials and other printed matter 110 120 Tobacco products and alcoholic beverages 1,523 1,555 Games of chance 511 528 Miscellaneous expenditures 783 912
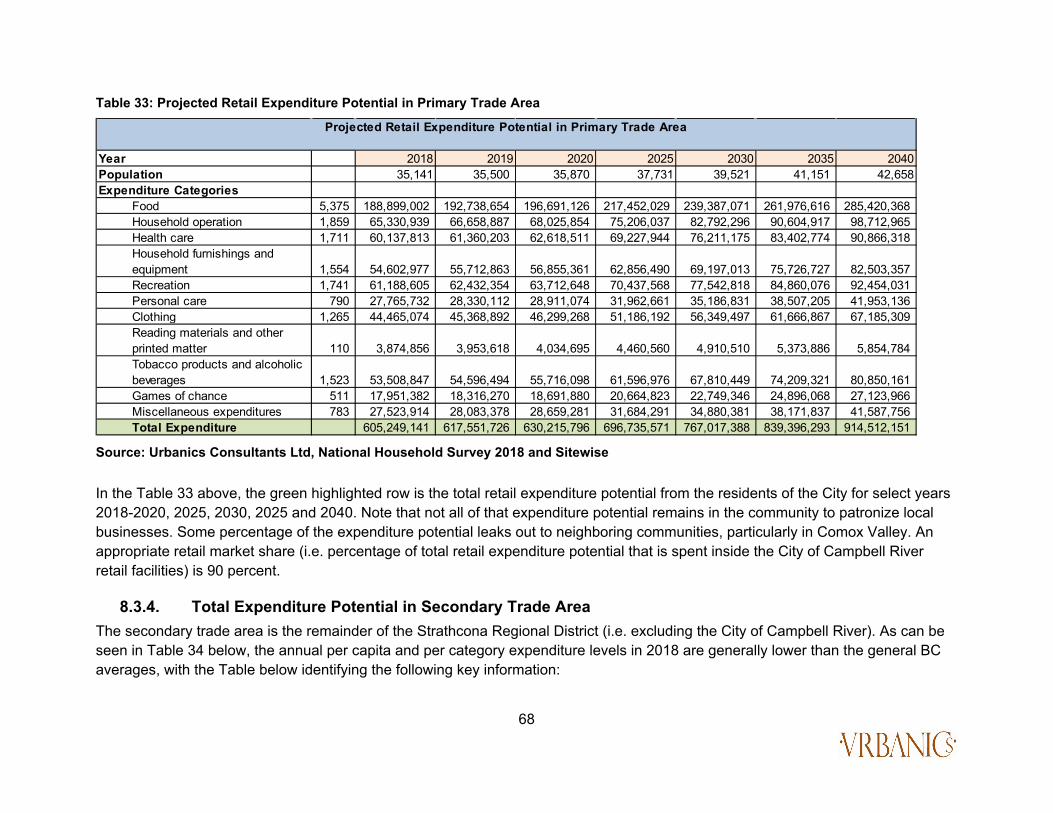
68
Table 33: Projected Retail Expenditure Potential in Primary Trade Area
Source: Urbanics Consultants Ltd, National Household Survey 2018 and Sitewise
In the Table 33 above, the green highlighted row is the total retail expenditure potential from the residents of the City for select years 2018-2020, 2025, 2030, 2025 and 2040. Note that not all of that expenditure potential remains in the community to patronize local businesses. Some percentage of the expenditure potential leaks out to neighboring communities, particularly in Comox Valley. An appropriate retail market share (i.e. percentage of total retail expenditure potential that is spent inside the City of Campbell River retail facilities) is 90 percent.
8.3.4. Total Expenditure Potential in Secondary Trade Area The secondary trade area is the remainder of the Strathcona Regional District (i.e. excluding the City of Campbell River). As can be seen in Table 34 below, the annual per capita and per category expenditure levels in 2018 are generally lower than the general BC averages, with the Table below identifying the following key information:
Year 2018 2019 2020 2025 2030 2035 2040Population 35,141 35,500 35,870 37,731 39,521 41,151 42,658Expenditure Categories
Food 5,375 188,899,002 192,738,654 196,691,126 217,452,029 239,387,071 261,976,616 285,420,368 Household operation 1,859 65,330,939 66,658,887 68,025,854 75,206,037 82,792,296 90,604,917 98,712,965 Health care 1,711 60,137,813 61,360,203 62,618,511 69,227,944 76,211,175 83,402,774 90,866,318 Household furnishings and equipment 1,554 54,602,977 55,712,863 56,855,361 62,856,490 69,197,013 75,726,727 82,503,357 Recreation 1,741 61,188,605 62,432,354 63,712,648 70,437,568 77,542,818 84,860,076 92,454,031 Personal care 790 27,765,732 28,330,112 28,911,074 31,962,661 35,186,831 38,507,205 41,953,136 Clothing 1,265 44,465,074 45,368,892 46,299,268 51,186,192 56,349,497 61,666,867 67,185,309 Reading materials and other printed matter 110 3,874,856 3,953,618 4,034,695 4,460,560 4,910,510 5,373,886 5,854,784 Tobacco products and alcoholic beverages 1,523 53,508,847 54,596,494 55,716,098 61,596,976 67,810,449 74,209,321 80,850,161 Games of chance 511 17,951,382 18,316,270 18,691,880 20,664,823 22,749,346 24,896,068 27,123,966 Miscellaneous expenditures 783 27,523,914 28,083,378 28,659,281 31,684,291 34,880,381 38,171,837 41,587,756 Total Expenditure 605,249,141 617,551,726 630,215,796 696,735,571 767,017,388 839,396,293 914,512,151
Projected Retail Expenditure Potential in Primary Trade Area

69
• Expenditure per capita in clothing is substantially lower than provincial average by 26 percent; • Expenditure per capita in personal care and game of chance is lower than provincial average by 17 percent respectively. Table 34: Per Capita Retail Expenditure – Secondary Trade Area vs. BC
Source: Urbanics Consultants Ltd., National Household Survey 2018 Spending Report and Sitewise The Consultant estimates the total expenditure potential in the second trade area based on the following assumptions: • The population level and projected growth; • The per capita expenditure rate per year by category for each region; • An assumed one percent per year real per capita expenditure growth due to income growth.
Expenditure Categories
Strathcona (except Campbell River) -
Secondary Trade Area (Expenditure per capita)
BC (Expenditure per capita)
Total Retail Expenditure 15,996 17,591 Food 5,001 5,124 Household operation 1,788 1,953 Health care 1,698 1,648 Household furnishings and equipment 1,466 1,609 Recreation 1,577 1,777 Personal care 674 810 Clothing 1,152 1,556 Reading materials and other printed matter 101 120 Tobacco products and alcoholic beverages 1,347 1,555 Games of chance 439 528 Miscellaneous expenditures 753 912

70
Table 35: Projected Retail Expenditure Potential in Secondary Trade Area
Source: Urbanics Consultants Ltd., National Household Survey 2018 Spending Report, Sitewise
In Table 35 above, the green highlighted row is the total retail expenditure potential from the residents of the SRD excluding the City for select years 2018-2020, 2025, 2030, 2025 and 2040. Note that not all of that expenditure potential remains in the community. A percentage of the expenditure potential leaks out to neighboring communities, particularly in the Comox Valley (primarily Courtenay). The projected market share (percentage of total retail expenditure potential that is spent inside the City of Campbell River) is 95 percent.
8.3.5. Warranted Floor Space 8.3.5.1 Existing Retail & Service Commercial
The Consultant has created an inventory of existing retail and service commercial in the City based on the following sources of data:
• GPRA’s City of Campbell River Downtown Growth Analysis; • Field examination by City staff;
Year 2018 2019 2020 2025 2030 2035 2040Population 11,652 11,569 11,485 11,024 10,463 9,790 9,027Expenditure Categories
Food 58,268,297 58,430,306 58,589,652 59,104,524 58,957,871 57,978,144 56,189,045 Household operation 20,829,942 20,887,857 20,944,821 21,128,879 21,076,453 20,726,217 20,086,644 Health care 19,789,570 19,844,593 19,898,711 20,073,576 20,023,769 19,691,025 19,083,397 Household furnishings and equipment 17,078,811 17,126,297 17,173,002 17,323,914 17,280,929 16,993,765 16,469,369 Recreation 18,380,707 18,431,813 18,482,078 18,644,494 18,598,233 18,289,178 17,724,808 Personal care 7,857,971 7,879,819 7,901,308 7,970,743 7,950,966 7,818,841 7,577,566 Clothing 13,420,357 13,457,671 13,494,372 13,612,957 13,579,180 13,353,529 12,941,464 Reading materials and other printed matter 1,175,717 1,178,986 1,182,201 1,192,590 1,189,631 1,169,862 1,133,762 Tobacco products and alcoholic beverages 15,697,849 15,741,495 15,784,424 15,923,134 15,883,624 15,619,680 15,137,685 Games of chance 5,114,807 5,129,029 5,143,016 5,188,212 5,175,338 5,089,338 4,932,290 Miscellaneous expenditures 8,775,307 8,799,706 8,823,704 8,901,245 8,879,158 8,731,610 8,462,168 Total Expenditure 186,389,336 186,907,572 187,417,289 189,064,267 188,595,152 185,461,189 179,738,200
Projected Retail Expenditure Potential in Secondary Trade Area

71
• Building permit data from the City; • Interview with realtors, developers and mall and building managers to provide market information, such as vacancy rates. Rollo’s Downtown Growth Analysis report (2016) included an inventory of existing retail and service commercial space in the City of Campbell River. After careful consideration, the number from Rollo (2016) was combined with the new permits issued for commercial development from 2017 to 2018 to create an updated inventory. There is 3,450,312 square feet retail and service commercial space in the City, out of which, 550,034 square feet are vacant. The vacancy rate is approximately at 16 percent. New commercial building permits with building area was provided by the City. Three permits were issued in 2017 that totalled 1,637 square feet building area. Five permits issued in 2018 totalling 698 square feet building area. Both totals are considered to be very low and as such, of little consequence to the aggregate numbers. Adding the previous inventory of 3,450,312 square feet from Rollo (2016), the updated inventory for retail and service commercial is 3,452,647 square feet. Interviews with local realtors, developers and mall or building managers indicate that the commercial space in the City is adequate for current commercial business activities. Although not being finalized, there will be some new commercial space in the upcoming Jubilee Heights mixed-use development.
8.3.5.2 Projected Warranted Floor Space
The Consultant constructed a total projected retail expenditure-capture and warranted floorspace model based on the following assumptions:
• The primary trade area (City of Campbell River) retail expenditure potential data; • The secondary trade area retail expenditure potential data; • Estimates as to the capture share for the primary trade area and secondary trade area set at 90 percent and 95 percent for
primary and secondary trade areas respectively; • Assumed Online sales account for five percent of retail expenditures; • An increase to the baseline due to retail spending of visitors and tourists valued at approximately 35 percent;

72
• Annual retail sales productivity levels are given a low, a median and a high rate per square foot (PSF) between $325 PSF, $350 PSF, and $375 PSF3;
• The median option for annual per square foot sales productivity of $350 will be used and is highlighted in green in the Table below.
Currently the vacancy rate is assumed at approximately 16 percent and is expected to reach a healthier vacancy of five percent from 2020 onward; in fact, local realtors are reporting that there are signs it is trending this way already. As shown in Table 36, at a $350 PSF annual sales productivity level, there is approximately new demand for approximately 140,000 square feet of retail by 2035. About 380,000 accumulated retail space will be needed by 2040. With a FAR at 0.35, there is approximately new demand for approximately 9 acres of commercial land by 2035. Approximately 25 acres accumulated new commercial land will be needed by 2040. This study did not inventory and analyze certain details associated with existing commercial floorspace in the City. This includes such items as available floor area/ configurations for vacant commercial floorspace, lease rates, building condition etc. Accordingly, it can be expected that some commercial floor space is located in buildings that can be categorized as older structures (Class C), often in need of extensive renovation, the least desirable, and with outdated building infrastructure and technology. This type of building stock typically has the lowest lease rates, takes the longest time to lease, and can be considered prime for re-development. Accordingly, the Campbell River can expect to see some commercial building replacement during the time horizon of this report. However, commercial building replacement will be contingent on a number of critical factors that will determine redevelopment decisions beyond where ay given might sit in relation to its life expectancy. The City’s Sustainable Official Community Plan identifies three, scaled commercial land use classifications: Downtown, Village Centre, and Neighbourhood. These categories reflect the intended scale and the associated attributes. These principal commercial nodes include the following:
• Downtown • Willow Point • North Campbell River • Campbellton • Dogwood/ Merecroft
3 The Consultant is aware that these per square foot productivity assumptions are relatively low. However, the City is a smaller town, the Consultant considers these pre square foot productivity assumptions deem appropriate.

73
• Dogwood/ Hilchey • Dogwood/ Jubilee • Dogwood/ Second
It is acknowledged that there is overlap with commercial lands owned by the Wei Wai Kum (Discovery Harbour Shopping Center) and We Wai Kai (at Highway 19 and Willis Road). With regard to future expansion of commercially zoned land, there are very limited opportunities, and in some cases, no opportunity for increasing floorspace. This is particularly the case with all commercially zoned lands except C-4 and C-7. Lands zoned C-3 are 100% utilized but comprise only 3.3 acres. Lands zoned C-2 and C-3 (village center and neighbour commercial), are the City’s primary and secondary commercial, and commercial retail zones. Given the locational context of these zones, there is little opportunity for expansion. Growth will occur in form of redevelopment of underperforming building stock, major renovation and infill development opportunities. The majority of projected new retail floorspace should be focused within the downtown area which benefits from a reinforced commercial investment. There are physical limitations to growth within the downtown also. However, there is a significant opportunity to grow commercial northward, commensurate with demand. This would involve assembly and redevelopment of those parcels bounded by Dogwood Avenue, 16th Avenue and 13th Avenue. A significant amount of land within this polygon has been used historically for car dealerships. In a downtown context, low intensity and “course-grained” commercial land uses are not optimal. Accordingly, there is an important opportunity for the City to explore opportunities to support a future land assembly and mixed-use redevelopment of lands within the “Dogwood polygon”. Such preparations could include an analysis of potential closures of 14th Avenue and Cedar Street for the purpose of creating a contiguous development polygon; confirming appropriate infrastructure capacity, determining frontage improvement obligations etc. Furthermore, to support potential interest in redevelopment of this polygon, the City could consider the creation of a “city land development prospectus” that would set out all of the municipal considerations and development obligations associated with redevelopment of the site. How people experience the downtown is an important part of a community’s brand. Accordingly, the choreography of the downtown shopping and general urban experience benefits from being carefully crafted and implemented. For example, a comfortable, looped pedestrian circulation route is very beneficial to the commercial pedestrian retail experience (coupled with several other key considerations). The potential redevelopment of the “Dogwood polygon” could facilitate the establishment of such a pedestrian experience as currently, the retail experience in the downtown is primarily linear along both Shoppers Row and 11th Avenue and diminishes in pedestrian retail vitality toward Dogwood Street.

74
It is noted that there are a number of C-1 properties within the downtown core that are undeveloped or underutilized and as such, present a potential opportunity for redevelopment. Further study of these parcels would reveal constraints to redevelopment such as parcel size, servicing considerations, frontage improvements, etc. In turn, the City would be in a position to assess potential mitigation measures that would result in such properties being more attractive for redevelopment. The area from Dogwood Street through to Ironwood Street and then through to the Campbellton neighbourhood can be characterised as somewhat indistinct from a commercial land use perspective. Commercial lands are frequently underdeveloped, in the case of Campbellton, frequently non-contiguous. This backdrop presents as areas of transition. Commercial development and utilization would be enhanced within these areas by resolving the existing land use dissonance and establishing a more coherent and appropriate land use program including commensurate investments in complementary municipal infrastructure. Without this attention, this area can be expected to generally experience ad hoc redevelopment. A closer study of these areas in terms of land utilization and intensity, building condition, infrastructure condition etc. will provide some insight as to the scope and extent of opportunity to attract redevelopment as well as the preferred character for these commercial precincts. One of the key opportunities challenging the City relates to the undeveloped property immediately south of the Discovery Harbour Shopping Center and opposite to “Berwick by the Sea”. This site is iconic in terms of its unparalleled Vancouver Island waterfront backdrop and is highly strategic given its location as part of the downtown gateway sequencing. To reinforce the significance of the downtown as the economic, social/ cultural and tourist hub of the city, this site will benefit by a carefully crafted land use/ development program that contributes to the urban fabric accordingly.

75
Table 36: Total Projected Retail Expenditure Potential - Capture - Warranted Floorspace- Commercial Land Demand
Source: Urbanics Consultants Ltd., National Household Survey 2018 Spending Report and Sitewise
Year 2018 2019 2020 2025 2030 2035 2040Primary Trade Area 605,249,141 617,551,726 630,215,796 696,735,571 767,017,388 839,396,293 914,512,151
Secondary Trade Area 186,389,336 186,907,572 187,417,289 189,064,267 188,595,152 185,461,189 179,738,200
Primary Trade Area Capture Rate @ 90% 544,724,227 555,796,553 567,194,217 627,062,014 690,315,649 755,456,663 823,060,936
Secondary Trade Area Capture Rate @ 95% 177,069,869 177,562,193 178,046,425 179,611,054 179,165,395 176,188,129 170,751,290
Total 721,794,096 733,358,746 745,240,642 806,673,067 869,481,044 931,644,793 993,812,226
Online sales drag @ 5% 685,704,391 696,690,809 707,978,609 766,339,414 826,006,992 885,062,553 944,121,614
Tourism and visitor retial expenditure @ 35% 925,700,928 940,532,592 955,771,123 1,034,558,209 1,115,109,439 1,194,834,447 1,274,564,179
Vacancy Rate assumed @ 0%Sales productivity PSF @ $325 2,848,311 2,893,946 2,940,834 3,183,256 3,431,106 3,676,414 3,921,736 Sales productivity PSF @ $350 2,644,860 2,687,236 2,730,775 2,955,881 3,186,027 3,413,813 3,641,612 Sales productivity PSF @ $375 2,468,536 2,508,087 2,548,723 2,758,822 2,973,625 3,186,225 3,398,838
Vacancy Rate Assumption 16% 10% 5% 5% 5% 5% 5%Sales productivity PSF @ $325 3,390,846 3,215,496 3,095,615 3,350,796 3,611,690 3,869,909 4,128,143 Sales productivity PSF @ $350 3,148,643 2,985,818 2,874,500 3,111,453 3,353,713 3,593,487 3,833,276 Sales productivity PSF @ $375 2,938,733 2,786,763 2,682,866 2,904,023 3,130,132 3,353,921 3,577,724
New Retail Space - - - - - 140,840 239,789 Accumulated New Retail Space - - - - - 140,840 380,629
New Commercial Land Demand (acre) [email protected] - - - - - 9 16 Accumulated New Commercial Land Demand (acre) [email protected] - - - - - 9 25
Total Projected Retail Expenditure Potential - Capture - Warranted Flooorspace-Commercial Land Demand
76
9. Main Findings The City of Campbell River has the third largest population in the Vancouver Island and Coast Development Region, along with a stable employment base. Key sectors of the City’s economy are forestry, fishing, construction, retail trade, health care and tourism.
• Population projections: In the medium growth scenario, the City is predicted to experience relatively strong population growth compared to the SRD from 2018-2040, from a population of 35,141 in 2018 to 42,658 by 2040. This translates into an effective annual growth rate of nearly 1 percent for during 2019 – 2030 and 0.8 percent during 2030 – 2040. In the high growth scenario, the City’s population is projected to grow from 35,141 to 44,470. This translates into an effective annual growth rate of nearly 1.2 percent during 2019 – 2030 and 1 percent during 2030 – 2040.
• Industrial lands employment: The City has historically had a relatively high share of its labour force employed in sectors
that utilize industrial lands (i.e. forestry, mining, construction, manufacturing, utilities, wholesale trade and transportation and warehousing).
• Reliance on retail trade and tourism: The City relies on its retail trade and tourism to a greater degree as compared to the
Vancouver Island and Coast Region, and the Province. The City can be expected to derive significant economic benefits from promoting local tourism related businesses.
• Total industrial zoned land: The City has a total land area (zoned lands) of 34,000 acres, excluding First Nation lands. Of
the total land area, industrial zoned lands account for 1,847.7 acres of land, which translates to roughly 5 percent of the total land area.
• Share of industrial zoned lands by zoning type: The bulk of industrial land within the City is zoned heavy industrial (I – 3)
(roughly 48 percent of the total zoned industrial land) and medium industrial (40 percent of the total industrial land). The remaining amount of industrial land is zoned for recycling and wrecking (8 percent) and light industrial (4 percent).
• Industrial Land utilization (total zoned lands): Approximately 542.8 acres (out of 1,874.7 acres) of all industrial zoned
lands (29 percent of the total) in the City are currently vacant. Also, nearly 464.5 acres (25 percent of total) of industrial land is underutilized and the remaining, i.e. 867.3 (46 percent of total) is adequately utilized.

77
• Anticipated demand for industrial lands: The study projects the demand for industrial land to be in the range of 80 acres to 160 acres by 2040. This projection is based on employment projections by using the constant-share method for and the historical absorption rate for industrial lands in the City.
• Capacity and adequacy of industrial lands: The City currently has a supply of approximately 542.8 acres of vacant
industrial land and 464.5 acres of underutilized industrial land, while the anticipated demand for the City is expected to be in the range of 80 to 160 acres by 2040.
• Total commercial zoned land: The City has a total land area (zoned lands) of 34,000 acres, excluding First Nation lands. Of
the total land area, commercial zoned lands account for 614.7 acres of land, which translates to roughly 2 percent of the total land area.
• Share of commercial zoned lands by zoning type: The bulk of the commercial land within the City is C – 1 (27 percent of
the total zoned commercial land), C – 4 (38 percent of the total commercial land) and C – 5 (23 percent of the total commercial land). The remaining amount of industrial land is zoned for C – 2 (9 percent), C – 3 (1 percent), C – 6 (1 percent), C – 7 (1 percent) and C – 8 (1 percent).
• Commercial land utilization (total zoned lands): Approximately 104.3 acres (out of 614.7 acres) of all commercial zoned
lands (17 percent of the total) in the City are currently vacant. Also, nearly 65 acres (11 percent of total) of commercial land is underutilized, and the remaining 445.4 acres (72 percent of total) is adequately utilized.
• Anticipated demand for commercial lands (office and retail): The study projects that no demand is expected for new
office space construction (on a net basis) by 2040. The study projects the demand for retail land to be approximately 25 acres by 2040. This projection is based on per capita expenditure and population growth by using per square foot productivity for commercial lands in the City.
• Capacity and adequacy of commercial lands: The City currently has a supply of approximately 104.3 acres of vacant
commercial land and 65 acres of underutilized commercial land, while the anticipated demand for the City is expected to total approximately 25 acres by 2040.

78
• Airport land: Of the total land area, industrial zoned lands account for 1,969 acres of land, which translates to roughly 6 percent of the total land area. 65 percent out of the A – 1 zoned land is vacant. 99 percent out of the A – 2 zoned land is vacant.
• Competitive position in the region: Much of the City’s competition for attracting future industrial and commercial growth can be expected from the following five nearby municipalities: Comox, Courtenay, Cumberland, Port Alberni and Port Hardy. In terms of property tax, the City’s property tax ranked second lowest among the six municipalities for light industry; the City’s property tax for major industry is only less than Port Alberni and Port Hardy.
10. Recommendations Based on the findings of this study, the following strategies are proposed to enhance industrial and commercial development and overall economic resiliency within the City: • Capitalize on existing industrial base: Capitalize on the existing industrial base of the City and promote manufacturing,
especially related to value-added wood industries. The City can also enhance research and development to increase innovation in processing and manufacturing of value-added wood products. These can include value added wood manufacturing, such as fabrication of construction materials, log homes and furniture. A quality-focused marketing strategy would likely prove effective.
• Emphasize light industrial usage: The industrial base of the City is experiencing lower demand for heavy industry and greater demand for light industry. The supply of land zoned for light industrial is relatively low compared to other industrial zone types. Accordingly, there would be value in facilitating an increase in suitably zoned and serviced light industrial land supply. In the long term, the City can consider the possibility of developing a light industrial park on airport zoned land. The airport zoned land is nearly vacant and has access to both Highway 19 and the airport. A major aviation business, located at the airport, is expecting to expand in the next few years. A state-of-the-art light, locationally sensitive, industrial park accommodating innovative industries can be a significant investment draw for the City.
• Attract businesses that are involved in high-tech and consulting services: Businesses that are involved in high-tech and
consulting services rely less on transportation, but place a high value on quality of life for employees. Maintaining an excellent work-life balance is a major attraction for people work in these industries. CRadvantage is also a significant add-on for people working in high-tech and consulting services. In addition, these businesses can also complement the resource-based economy by providing innovation and marketing services for wood products.

79
• Office space utilization: Due to the relatively high vacancy rate in office space, the City might wish explore the possibility of facilitating the development of an additional incubation center or collaboration space for entrepreneurs by utilizing the vacant office space. High-tech or consulting services entrepreneurs do not need huge space when they start up their businesses. However, they do need a space to meet, to discuss and to meet clients. An incubation center or collaboration space will be able to attract entrepreneurs and, in the future, can be the place to promote the City’s programs for attracting entrepreneurs. The City of Prince George provides a good example of such a business start-up model.
• Enhance downtown vibrancy: There is a relatively high commercial vacancy rate in the City though recent information from local
relators indicates that relative vacancy rates are beginning to trend downward. To reduce the commercial vacancy rate, the City can consider a number of options that range from minor to major intervention:
• Supporting the efficiency and effectiveness of the downtown BIA by increasing the budget allocated to downtown BIA for
advertisement and promotion; • Collaborating with merchants in the City to create a complete shopping experience for local residents as well as tourists.
Example action items include the following listed below. o Continuing to organize people-attracting events, for example, through a 4-season festival event schedule. o Facilitating retail merchandising workshops by professional merchandisers to maximize the store-front visual impact
on passing foot traffic. o Maintaining a façade improvement program. o Facilitate an appropriate build-out of the vacant waterfront lands south of the Discovery Harbour Shopping Center; o Establishing relatively consistent business hours particularly during summer months when foot traffic can be expected
to be higher and in association and to complement with downtown events. o Building on previous work such as “Refresh Downtown Campbell River”, a continued focus of strategic investment in
programmed downtown place-making and experience enrichment, will boost downtown shopping visits and stays both of which typically translate into increased trade. An iconic downtown experience can also be a significant tourism draw. This can translate into greater economic vibrancy, which in turn, promotes reinvestment and employment.
o A continued emphasis of facilitating the development of downtown residential development can also contribute to the economic vibrancy of the downtown, by growing the base of customers who utilize downtown for daily shopping needs.
o Continue to invest in and develop more anchor attractions such as the Tidemark Theatre, Community Center, art gallery, Spirit Square, and public library for instance, in addition to investment in streetscape beautification projects and iconic public art installations, for example.

80
o Assess options for creating a retail pedestrian loop that capitalizes on the waterfront amenity.
• Promote tourism: Capitalize on the existing tourism resource base/ assets of the City and promote tourism more effectively.
• Promote education and skills development: Continue to support the expansion of post-secondary education with North Island College. Innovative industries will need skilled labor, especially in the aviation industry. The City can consider the possibility of facilitating collaboration with major aviation employers to design a work-study program for students.

81
Appendix 1 Figure 19: Commercial Land Distribution: C - 1 - C - 3
Source: Urbanics Consultants Ltd., Sitewise Pro.

82
Figure 20: Commercial Land Distribution: C - 4
Source: Urbanics Consultants Ltd., Sitewise Pro.

83
Figure 21: Commercial Land Distribution: C - 5
Source: Urbanics Consultants Ltd., Sitewise Pro.

84
Figure 22: Commercial Land Distribution: C – 6
Source: Urbanics Consultants Ltd., Sitewise Pro.

85
Figure 23: Commercial Land Distribution: C - 7 & C – 8
Source: Urbanics Consultants Ltd., Sitewise Pro.

86
Figure 24: Employment Land: C - 1
Source: Urbanics Consultants Ltd., Sitewise Pro.
Note: 1. Land in blue is vacant; 2. Land in orange is occupied
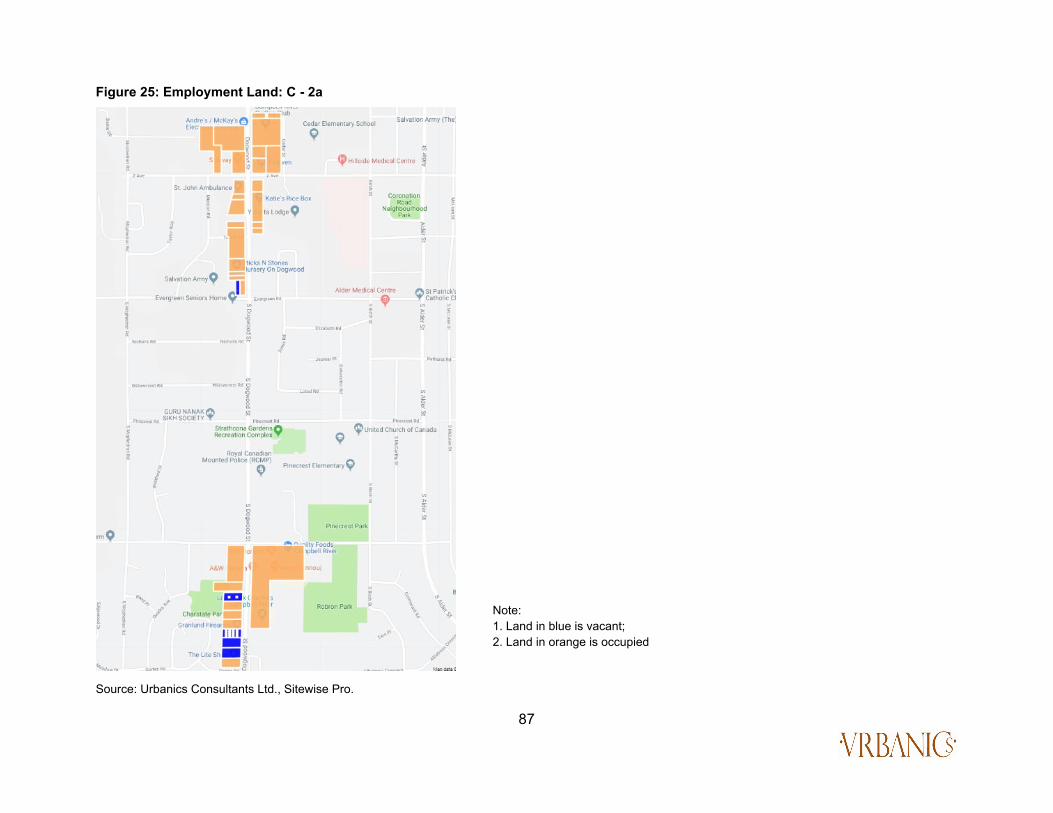
87
Figure 25: Employment Land: C - 2a
Source: Urbanics Consultants Ltd., Sitewise Pro.
Note: 1. Land in blue is vacant; 2. Land in orange is occupied

88
Figure 26: Employment Land: C - 2b
Source: Urbanics Consultants Ltd., Sitewise Pro.
Note: 1. Land in blue is vacant; 2. Land in orange is occupied

89
Figure 27: Employment Land: C - 3
Source: Urbanics Consultants Ltd., Sitewise Pro.
Note: 1. Land in orange is occupied

90
Figure 28: Employment Land: C - 4a
Source: Urbanics Consultants Ltd., Sitewise Pro.
Note: 1. Land in blue is vacant; 2. Land in orange is occupied

91
Figure 29: Employment Land: C - 4b
Source: Urbanics Consultants Ltd., Sitewise Pro.
Note: 1. Land in blue is vacant; 2. Land in orange is occupied

92
Figure 30: Employment Land: C - 4c
Source: Urbanics Consultants Ltd., Sitewise Pro.
Note: 1. Land in blue is vacant; 2. Land in orange is occupied
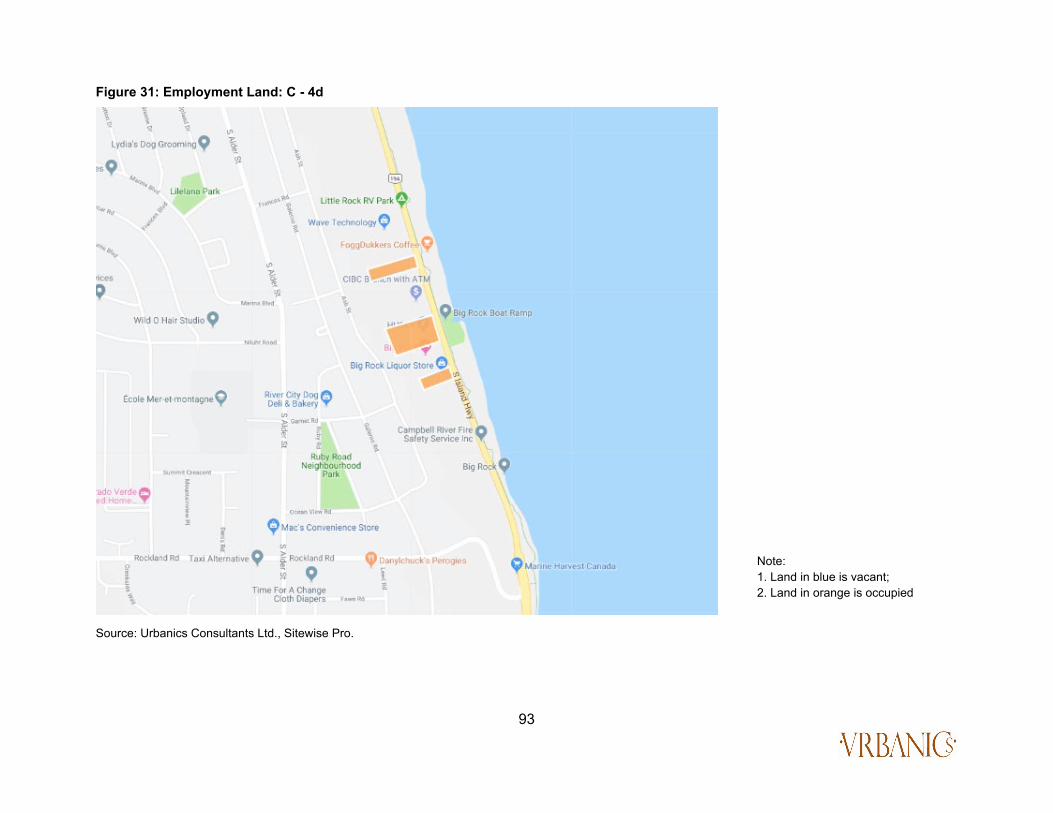
93
Figure 31: Employment Land: C - 4d
Source: Urbanics Consultants Ltd., Sitewise Pro.
Note: 1. Land in blue is vacant; 2. Land in orange is occupied

94
Figure 32: Employment Land: C - 4e
Source: Urbanics Consultants Ltd., Sitewise Pro.
Note: 1. Land in blue is vacant; 2. Land in orange is occupied

95
Figure 33: Employment Land: C - 5a
Source: Urbanics Consultants Ltd., Sitewise Pro.
Note: 1. Land in blue is vacant; 2. Land in orange is occupied

96
Figure 34: Employment Land: C - 5b
Source: Urbanics Consultants Ltd., Sitewise Pro.
Note: 1. Land in blue is vacant; 2. Land in orange is occupied

97
Figure 35: Employment Land: C - 5c
Source: Urbanics Consultants Ltd., Sitewise Pro.
Note: 1. Land in blue is vacant; 2. Land in orange is occupied

98
Figure 36: Employment Land: C - 6a
Source: Urbanics Consultants Ltd., Sitewise Pro.
Note: 1. Land in blue is vacant; 2. Land in orange is occupied

99
Figure 37: Employment Land: C - 6b
Source: Urbanics Consultants Ltd., Sitewise Pro.
Note: 1. Land in orange is occupied

100
Figure 38: Employment Land: C - 6c
Source: Urbanics Consultants Ltd., Sitewise Pro.
Note: 1. Land in blue is vacant; 2. Land in orange is occupied

101
Figure 39: Employment Land: C - 6d
Source: Urbanics Consultants Ltd., Sitewise Pro.
Note: 1. Land in blue is vacant; 2. Land in orange is occupied

102
Figure 40: Employment Land: C - 7
Source: Urbanics Consultants Ltd., Sitewise Pro.
Note: 1. Land in blue is vacant; 2. Land in orange is occupied
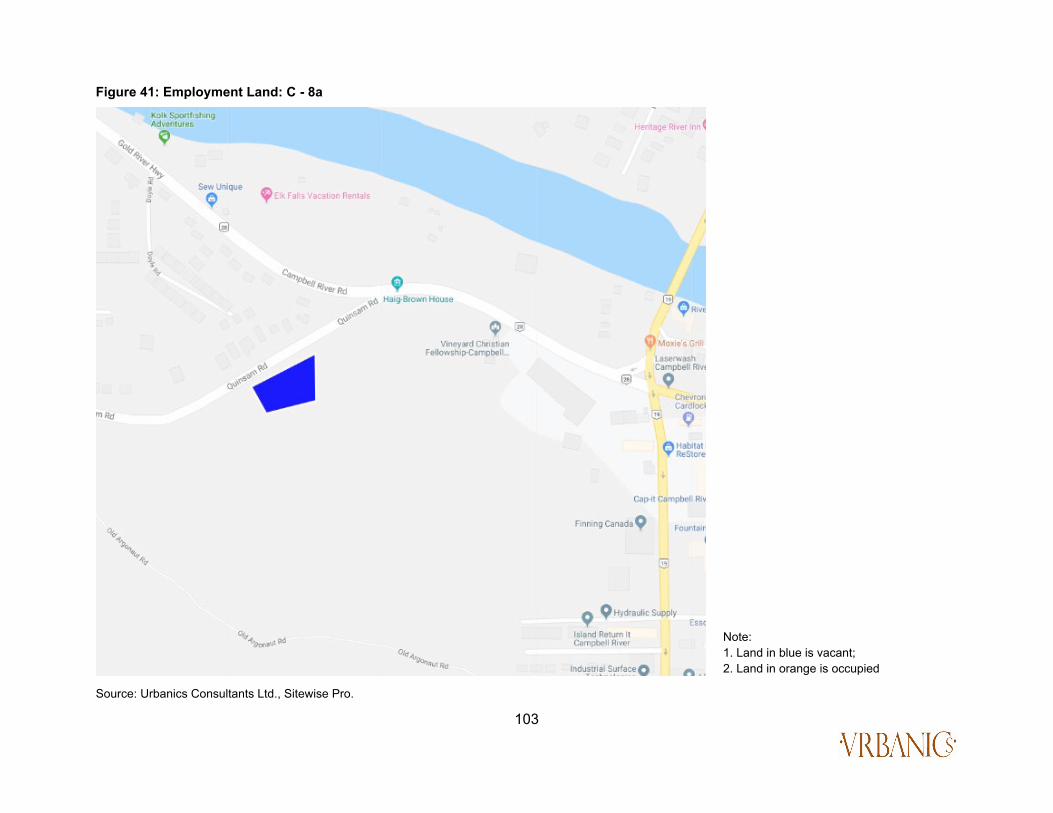
103
Figure 41: Employment Land: C - 8a
Source: Urbanics Consultants Ltd., Sitewise Pro.
Note: 1. Land in blue is vacant; 2. Land in orange is occupied
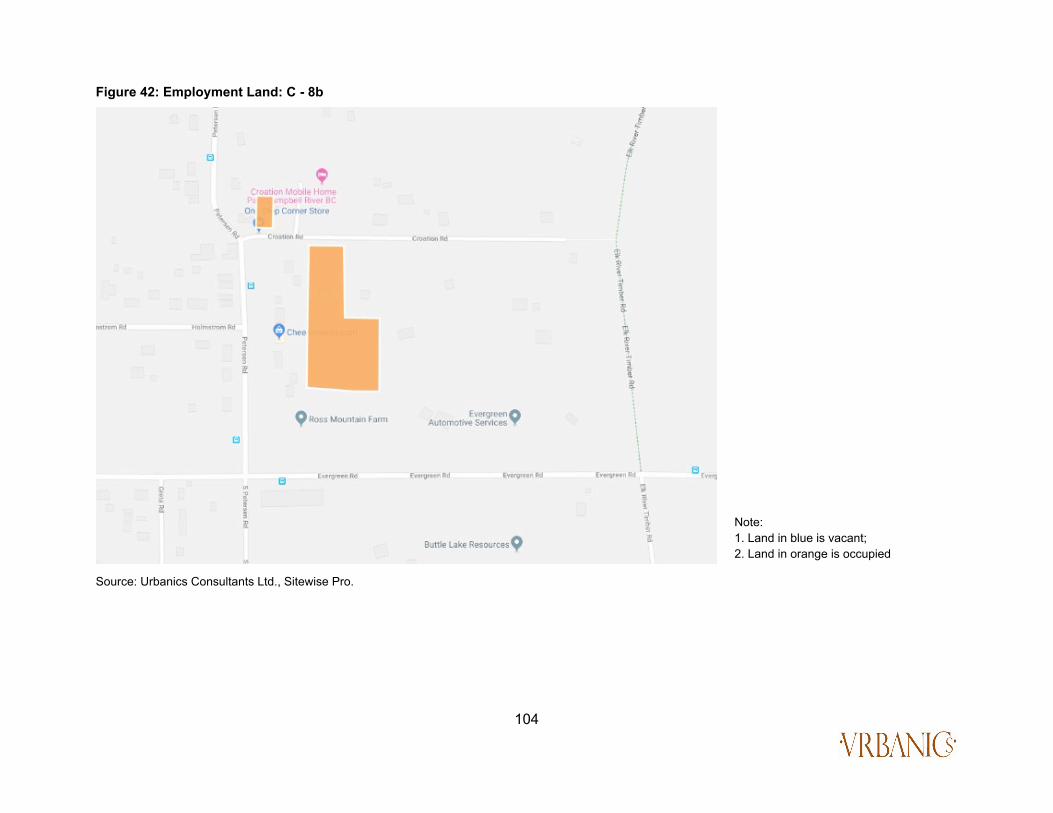
104
Figure 42: Employment Land: C - 8b
Source: Urbanics Consultants Ltd., Sitewise Pro.
Note: 1. Land in blue is vacant; 2. Land in orange is occupied

105
Figure 43: Employment Land: C - 8c
Source: Urbanics Consultants Ltd., Sitewise Pro.
Note: 1. Land in blue is vacant; 2. Land in orange is occupied

106
Figure 44: Employment Land: C - 8d
Source: Urbanics Consultants Ltd., Sitewise Pro.
Note: 1. Land in blue is vacant; 2. Land in orange is occupied
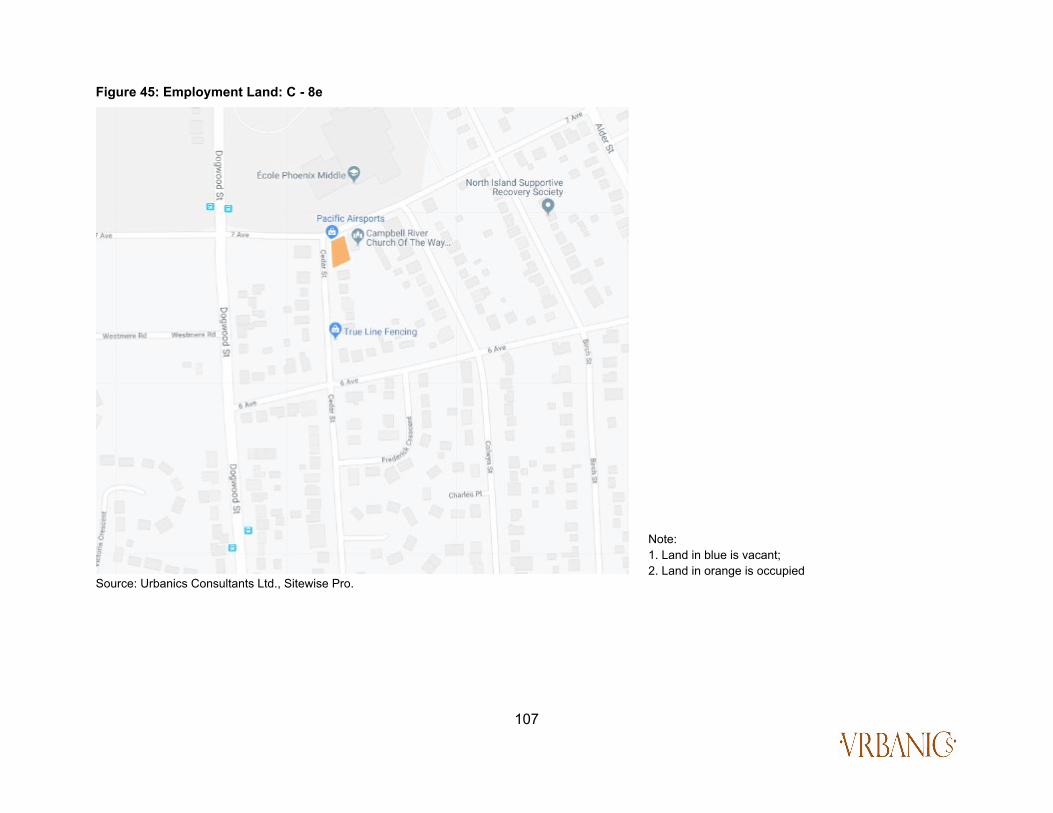
107
Figure 45: Employment Land: C - 8e
Source: Urbanics Consultants Ltd., Sitewise Pro.
Note: 1. Land in blue is vacant; 2. Land in orange is occupied

108
Appendix 2
.
Figure 46: Current Employment Land Distribution in the City of Campbell River
Note: 1. Land in blue is vacant; 2. Land in orange is occupied
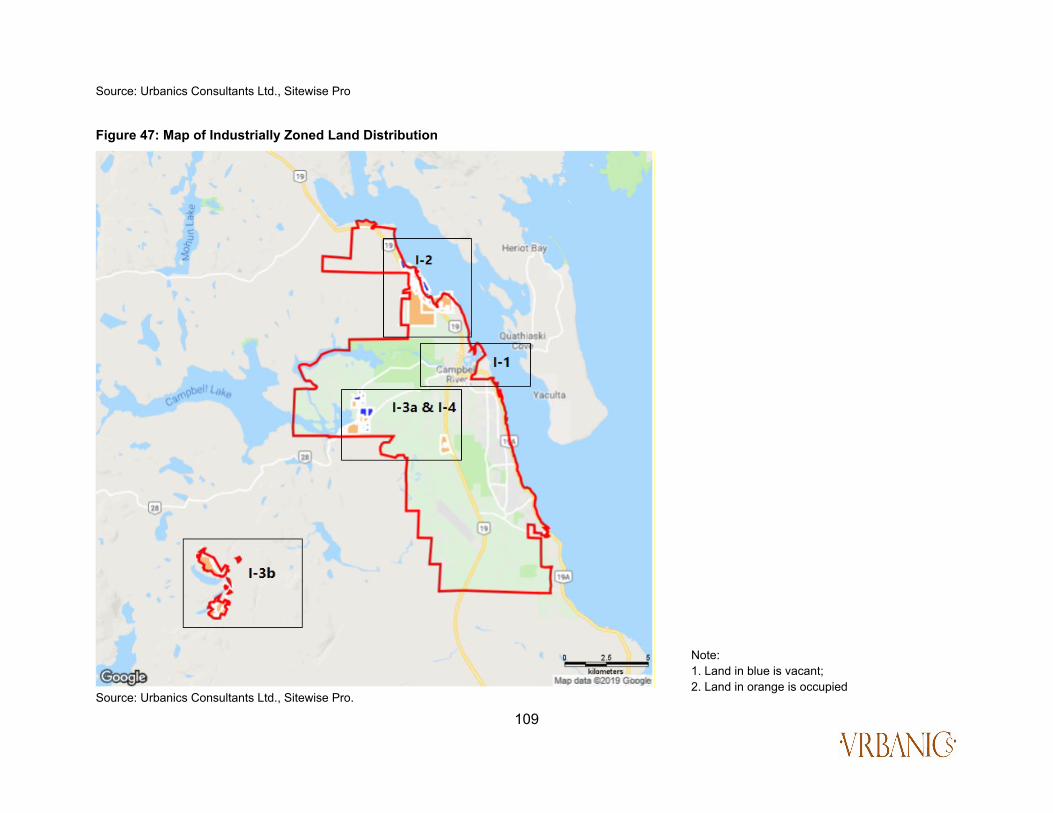
109
Source: Urbanics Consultants Ltd., Sitewise Pro
Figure 47: Map of Industrially Zoned Land Distribution
Source: Urbanics Consultants Ltd., Sitewise Pro.
Note: 1. Land in blue is vacant; 2. Land in orange is occupied

110
Figure 48: Industrial Land: I – 1
Note: 1. Land in blue is vacant; 2. Land in orange is occupied

111
Source: Urbanics Consultants Ltd., Sitewise Pro.
Figure 49: Industrial Land: I - 2
Source: Urbanics Consultants Ltd., Sitewise Pro.
Note: 1. Land in blue is vacant; 2. Land in orange is occupied
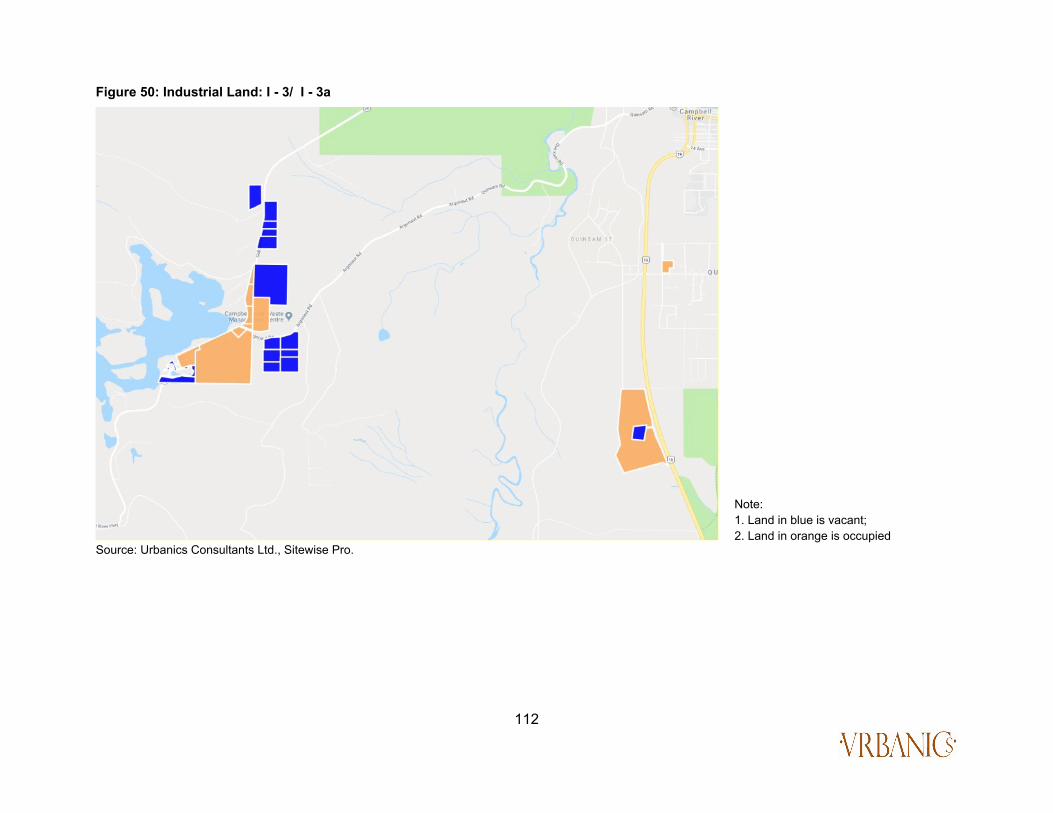
112
Figure 50: Industrial Land: I - 3/ I - 3a
Source: Urbanics Consultants Ltd., Sitewise Pro.
Note: 1. Land in blue is vacant; 2. Land in orange is occupied

113
Figure 51: Industrial Land: I - 3/ I - 3b
Source: Urbanics Consultants Ltd., Sitewise Pro.
Note: 1. Land in blue is vacant; 2. Land in orange is occupied

114
Figure 52: Industrial Land: I - 4
Source: Urbanics Consultants Ltd., Sitewise Pro.
Note: 1. Land in blue is vacant; 2. Land in orange is occupied

115
Examples/ Typologies of Tenant Mix in Industrial Zones and Airport Zoned Lands Most of the industrial zoned land parcels are located in Campbellton Neighborhood, North and Campbell River Neighborhood. In addition, there are industrial zoned land in Quinsam Heights Neighborhood, northwest of Campbell River (without neighborhood designation), west of middle Island Highway 19A (without neighborhood designation) and the Campbell River Airport.
Campbellton Neighborhood Industrial Land in Campbellton Neighborhood is mainly I – 1 zoning. Relish Interiors Campbell River
Windsor Plywood Campbell River

116
North Campbell River Neighborhood Morenot Canada
Try-max Transportation Ltd.
Discovery Crane
T-Mar Industries Ltd.

117
Auto & Truck Parts
Northwest of Campbell River Upland Excavating Ltd. Westshore Aggregate Ltd.
Campbell River Waste Management Center

118
Campbell River Airport AA Storage Sealand Aviation

119
Quinsam Heights Neighborhood There are no tenants occupying this industrial zoned area.
West of middle Inland Island Highway There are no tenants occupying this industrial zoned area.