Embed Size (px)
Citation preview

C A M P A I G N H E A D Q U A R T E R S
12355 SUNRISE VALLEY DRIVE SUITE 680
RESTON, VA 20191 T: 703.860.9790 F: 703.860.9795
EMAIL: [email protected] WWW.NOHARM.ORG
t h e c a m p a i g n f o r e n v i r o n m e n t a l l y r e s p o n s i b l e h e a l t h c a r e
Energy and Natural Resources Committee Written Testimony on House Bill 114 January 10, 2018 Dear Chairman Balderson and Members of the Senate Energy and Natural Resources Committee, As the committee reviews the current version of House Bill 114, it is important to consider the growing and significant shift towards energy efficiency and clean energy within the health care sector. As Ohio hospitals strive to achieve the Triple Aim – better patient care, improved population health, and lower costs – investments in energy efficiency, energy resilience, and clean energy become strategic considerations for health care leaders. House Bill 114 makes the renewable energy mandate voluntary by lifting the annual compliance mechanism, and then ultimately erasing the voluntary mandates by 2026. The energy efficiency resource standard is also reduced in this bill, from a target originally of 22.5% down to 17%. This bill would move Ohio in the wrong direction, affecting the cost of health care in the state and putting the health of our fellow citizens at risk. Instead, Health Care Without Harm urges members of the Senate Energy and Natural Resources Committee to strengthen Ohio’s commitment to investments in clean, renewable energy and energy efficiency. Ohio hospitals are investing in energy efficiency. Over the past four years, Ohio hospitals have shown tremendous interest in energy efficiency as both a cost saving measure and as a means of improving the health of the communities they serve. This is evidenced by the health systems that signed onto a letter with advanced economy companies, as well as by the nearly 50% of Ohio hospitals participating in energy efficiency initiatives. In 2016, Ohio hospitals saved enough energy to power over 10,000 homes for a year, or the equivalent of taking 6000 cars off the road or hiring 26 new nurses. Ohio hospitals are moving towards clean energy. The health care costs and impact on quality of life from air pollution are costs all Ohio residents must bear, but they fall particularly heavily upon our children. Health care organizations are on the front line of treating this preventable disease burden. This is why we are seeing movement within the Ohio health care sector towards the adoption of clean energy, such as, Cleveland Clinic’s recent announcement of a carbon-neutral goal by 2027, and the on-site solar project at the new UH Rainbow Center for Women & Children. Energy is about health. Our energy choices are ultimately about health: the financial viability of health care providers, the affordability of health care for patients, and the air quality within Ohio communities. Two of Ohio’s

Page 2
major metropolitan areas are rated “most polluted cities” in America by the American Lung Association, and 902,772 adults and 189,189 children suffer from asthma in Ohio. Transitioning to clean renewable energy and boosting energy efficiency across the state will lead to immediate health benefits for our fellow citizens. A report done evaluating the health benefits of the Ohio standards concluded that had the standards been reinstated in 2017, health care would have seen 100 fewer hospital admissions, 2230 less asthma attacks, and 16,900 gained work days. We urge you to review the attached documents to better understand the importance of the above matters from the perspective of health care organizations and providers in Ohio. Respectfully submitted,
Gary Cohen President and Founder Attachments:
1. Ohio health care providers join advanced energy companies to urge state lawmakers to support clean energy
2. Ohio Healthier Hospitals: A Collection of Energy Case Studies, a report featuring Ohio hospitals energy reduction case studies
3. Ohio Healthier Hospitals: A Collection of Environmental Leadership Case Studies, a report featuring Ohio hospitals environmental leadership case studies
4. Cleveland Clinic makes carbon-neutrality its newest sustainability goal Health system plans to reach goal through renewable energy purchases, continued energy efficiency
5. UH Rainbow Center for Women & Children – Opening in Spring 2018 6. Cleaner Air and Better Health: The Benefits of Ohio’s Renewable and Efficiency Standards

December 6, 2017
The Honorable Larry Obhof Senate President1 Capitol Square, 2nd Floor Columbus, OH 43215
The Honorable Cliff Rosenberger Speaker of the House 77 S. High St 14th Floor Columbus, OH 43215
Dear President Obhof & Speaker Rosenberger,
As businesses and health care providers with significant interest in accessing clean, reliable energy technologies, we are writing to urge you to consider undertaking a comprehensive approach to Ohio’s energy policy. This type of approach would value innovative technologies that institute energy efficiency and demand response as a resource and expand the deployment of advanced energy technologies that curb energy costs to consumers.
Our organizations have seen first-hand how investments in advanced energy technologies like solar and wind, energy storage, demand response, energy efficiency, and combined heat and power ensure the lights stay on during natural disasters and that we can deliver on our commitment to provide care to those in need.

In addition to reliability and health benefits that clean, advanced energy resources provide to the grid, the industry has created hundreds of thousands of jobs across the United States, with over 105,000 in Ohio, and drives billions of dollars in private investments. And as the advanced energy industry continues to grow, maintaining a healthy and productive workforce will be critical. Public health reports conclude that investing in Ohio’s renewable portfolio standard (RPS) and energy efficiency resource standard (EERS) through 2029 would prevent 335,770 lost work days.
Purchasing renewable energy not only makes good business sense, it is now also the expectation of our customers, employees, and investors. We are making progress toward these goals across our operations. Currently, 71% of Fortune 100 and 43% of Fortune 500 companies have renewable or sustainability commitments. In addition, over the last three years the percentage of facilities that generate or purchase renewable energy has increased by 81%.
In fact, because sustainability strategies reduce operating costs and create better patient outcomes, many hospitals and health systems are accelerating their investment in these technologies, hoping the gains they reap will translate to better health outcomes at lower costs to Ohioans.
Unfortunately, in Ohio, continued attempts to weaken the state’s requirement to invest in renewable energy and efficiency technologies along with the stringent wind-turbine setback standards have drastically stalled investment in advanced energy projects and severely limit our options to purchase renewable energy. This uncertainty has created hesitation among investors that are eager to bring jobs and economic growth to Ohio. Ohio must support and implement consistent, comprehensive policies that ensure a competitive energy market through procurement mechanisms and policies that ensure long-term energy price guarantees. These policies would strengthen grid resilience and allow for accelerated investments to be made in advanced energy technologies.
More specifically, Ohio must overturn the stringent wind-siting setback and instead adopt the language proposed in Senate Bill 188, along with require the state’s utilities to invest in renewable energy and energy efficiency by establishing an achievable RPS and EERS targets. This will undoubtedly bolster grid reliability, reduce energy costs for all consumers, and diversify the state’s energy portfolio, strengthening our ability to serve our communities in times of natural disasters.
John M. Starcher, Jr. President and CEO Mercy Health
Mark C. Clement President and CEO TriHealth
Jon Utech Senior Director, Office for a Healthy Environment Cleveland Clinic
Rick Sites Energy and Sustainability Lead Ohio Hospital Association

Sincerely,
Cc: Governor John Kasich Senator Troy Balderson, Chair, Senate Energy and Natural Resources Senator Kris Jordan, Vice Chair, Senate Energy and Natural Resources Senator Bill Beagle, Chair, Senate Senate Public Utilities Committee Senator Frank LaRose, Vice Chair, Senate Public Utilities Committee Representative Robert Cupp, Chair, House Public Utilities Committee
Representative Rick Carfagna, Vice Chair, House Public Utilities Committee
Edward H. Lamb, FACHE President and CEO Mount Carmel Health System
Steve Melink President & CEO Melink Corp
Mark Goodwin President & CEO Apex Clean Energy
Jason Slattery Director of Solar GEM Energy
Tom Sherman President Sustainable Energy Services
Lloyd Kass Vice President, Government Relations Lime Energy
Tom Philips Senior Director State Government Affairs Siemens Industry
William B. Owens, Jr. Managing Director Heelstone Energy Holdings, LLC
Clarence Hertzfeld Plant Manager First Solar
Ashley Patterson Vice President, Government Relations & Public Policy Ameresco
Rob Martens President Better Together Solar
Ohio Healthier HospitalsA COLLECTION OF ENERGY CASE STUDIES
2015
PREPARED BY

2
Health Care Without Harm seeks to transform the health sector worldwide, without compromising patient safety or care, so that it becomes ecologically sustainable and a leading advocate for environmental health and justice.
Visit www.noharm.org for more information.
The Ohio Hospital Association (OHA) Energy and Sustainability Program is an unbiased source of expertise to assist hospitals’ best use of energy and resources. Its goal is to improve the economic sustainability and resilience of OHA member facilities.
Learn more at www.ohiohospitals.org/energy.
The Healthier Hospitals Initiative (HHI) was launched in 2012 as a three-year national campaign designed to implement a new approach to improving environmental health and sustainability in the health care sector. HHI was led by three nonprofits—Health Care Without Harm, Practice Greenhealth, and Center for Health Design—with the help of 12 sponsoring health systems. In 2015, HHI will continue to help hospitals and health care systems reduce their impact and improve health as a free program of Practice Greenhealth.
More information is available at www.healthierhospitals.org.
Practice Greenhealth is the nation’s leading health care membership community that empowers its members to increase their efficiencies and environmental stewardship while improving patient safety and care through tools, best practices and knowledge.
To learn more about Practice Greenhealth www.practicegreenhealth.org.
Cover photo credits: Charles Carper; Cody Ellis; and shell24_7.

3
Dear Friends,
As Ohio hospitals strive to achieve the Triple Aim – better patient care, improved population health, and lower costs – energy efficiency, resiliency, and clean energy investments become strategic considerations for health care leaders.
Through a series of case studies, this report offers a roadmap for Ohio hospitals to implement energy reduction strategies that will lead to increased cost savings and improved public health.
We invite you to join the conversation to improve the health of our Ohio communities through energy reductions and clean energy investments.
Best,
Foreword
Please send comments and questions to:
• Lauren Kleinman, Healthier Hospitals, at [email protected]
• Rick Sites, Ohio Hospital Association, at [email protected]
Jim Baer, CEO
Highland District Hospital
Bill Peacock, COO
Cleveland Clinic
Ron Dziedzicki, COO
UH Case Medical Center

4
Given the energy intensive nature of a hospital environment, health care has started examining energy efficiency as a mechanism for significant cost savings. Energy Star for Healthcare reports that for every $1 a nonprofit healthcare organization saves on energy is equivalent to $20 in new revenues for hospitals1.
Beyond cost savings, hospitals have the opportunity to improve the air quality of the patient population they serve by reducing energy emissions. The 2015 State of the Air produced by the American Lung Association2 reported that while the air in Ohio has improved over the last 15 years, there is work to be done. Cleveland, Akron, Canton, Cincinnati, and Dayton areas still ranked in the worst 10 cities for year-round particle pollution. As of 2014, there were nearly 200,000 children and 680,000 adults with asthma at high risk from air pollution in Ohio.
Further, the Burden of Asthma in Ohio Report from the Ohio Department of Health3 indicates that children’s asthma rates are at 15% compared to the national CDC reported average of 8.3%4.
In terms of both a public health and cost savings potential, there are great opportunities for Ohio hospitals to start on an energy reduction journey.
HEALTHIER HOSPITALS IN OHIOHealthier Hospitals is a free program of Practice Greenhealth for hospitals beginning their sustainability and energy journey. Currently, there are 106 hospitals participating in Ohio, 80 of which are enrolled in the Leaner Energy Challenge5.
OHA ENERGY AND SUSTAINABILITY PROGRAMOhio Hospital Association (OHA) Energy and Sustainability Program has more than 100 member hospitals benchmarked in ENERGY STAR Portfolio Manager, with over 40 GWh saved in 20146. This is the equivalent to the yearly consumption of nearly 4,000 homes and according to the Practice Greenhealth Energy Impact Calculator7, results in an estimated reduction of 769 respiratory symptoms and 139 work days gained.
OHIO HOSPITAL BEST PRACTICES AND GETTING
STARTEDFeaturing four Ohio hospital case studies, this report offers energy reduction solutions that facilities ranging in size from critical access hospitals to large health systems can implement.
HOW ENERGY EFFICIENCY INCREASES COST SAVINGS AND IMPROVES PUBLIC HEALTH
Introduction
1http://www.energystar.gov/ia/business/healthcare/factsheet_0804.pdf?da37-0cd72http://www.stateoftheair.org/2015/assets/ALA_State_of_the_Air_2015.pdf3http://www.odh.ohio.gov/~/media/ODH/ASSETS/Files/eh/asthma/Burden%20of%20Asthma%20in%20Ohio%202012.ashx4http://www.cdc.gov/asthma/most_recent_data.htm5The Healthier Hospitals Leaner Energy How-To Guide provides a roadmap for getting started. For more information, visit: http://healthierhospitals.org/hhi-challenges/leaner-energy6http://ohiohospitals.org/energy7https://practicegreenhealth.org/tools-resources/energy-impact-calculator
Powering Down with Ohio Hospitals
and this is just the beginning!
This has led to:
In 2014, 31 OHA hospitals achieved 40 GWh in energy reductions.
That’s enough energy to power 4,000 Ohio households
for an entire year.
139 work days gained
769 respiratory symptoms reduced
$5 million in societal value
Calculations from Practice Greenhealth’s Energy Impact Calculator.
For more information about household energy use, visit tinyurl.com/c402gwc.

5
LEADERSHIP: ENERGY AS A KEY PRIORITYAn important note is the critical role that leadership plays in the ability of an energy program to be implemented. These Ohio hospital case studies all have that common thread – support from the top.
• Highland District Hospital Leadership made the decision in 2012 that 50% of the capital improvement budget would go towards upgrading boilers and chillers.
• Cleveland ClinicIn addition to the Department of Energy’s 2020 Building Challenge, a separate energy budget was allocated for projects to help meet energy reduction targets.
• University HospitalsA green revolving fund is set up for one of the medical centers, and there are efforts underway to expand that for the health system.
• ProMedica Setting a system-wide energy reduction target of 7% from a 2011 benchmark allowed energy projects to rise in priority for budget allocation.
Determining an energy baseline is where the journey starts. The Ohio Hospital Association offers free benchmarking support for member hospitals to input data into ENERGY STAR Portfolio Manager. Once the baseline is established, there are a number of opportunities to consider.
NO/LOW COST By committing to benchmarking data through ENERGY STAR Portfolio Manager, healthcare facilities are introduced to a wide range of opportunities in terms of cost savings and energy reductions. With such close margins, energy projects can lead to large annual savings at very low costs. University Hospitals’ Employee Energy Competition is a great example of a no-cost initiative to result in energy savings.
MODERATE INVESTMENT Energy retrofits and updating equipment entail a moderate upfront investment, and a great option for facilities that are suffering from high energy costs associated with aged equipment or inefficient energy operations. The Highland District Hospital case study is a good example of the savings associated with upgrading equipment.
HIGH INVESTMENTFacilities that have already laid the foundation for a robust energy efficiency program can start to look into new technology that can take a hospital’s energy program to the next level. Both Cleveland Clinic’s OR setback pilot and ProMedica’s installation of the Combined Heat and Power (CHP) system at one of their hospitals are examples of making investments with tangible results.
LOOKING FORWARD: CLEAN ENERGY
INVESTMENTSAccording to the Practice Greenhealth Benchmark report, 21% of award-winning hospitals reported purchasing or generating renewable energy in their portfolio in 2013. Hospitals are diversifying their energy portfolios which is leading to increased resilience, improved financial performance, improved community health and fulfillment of their organizational mission.
6
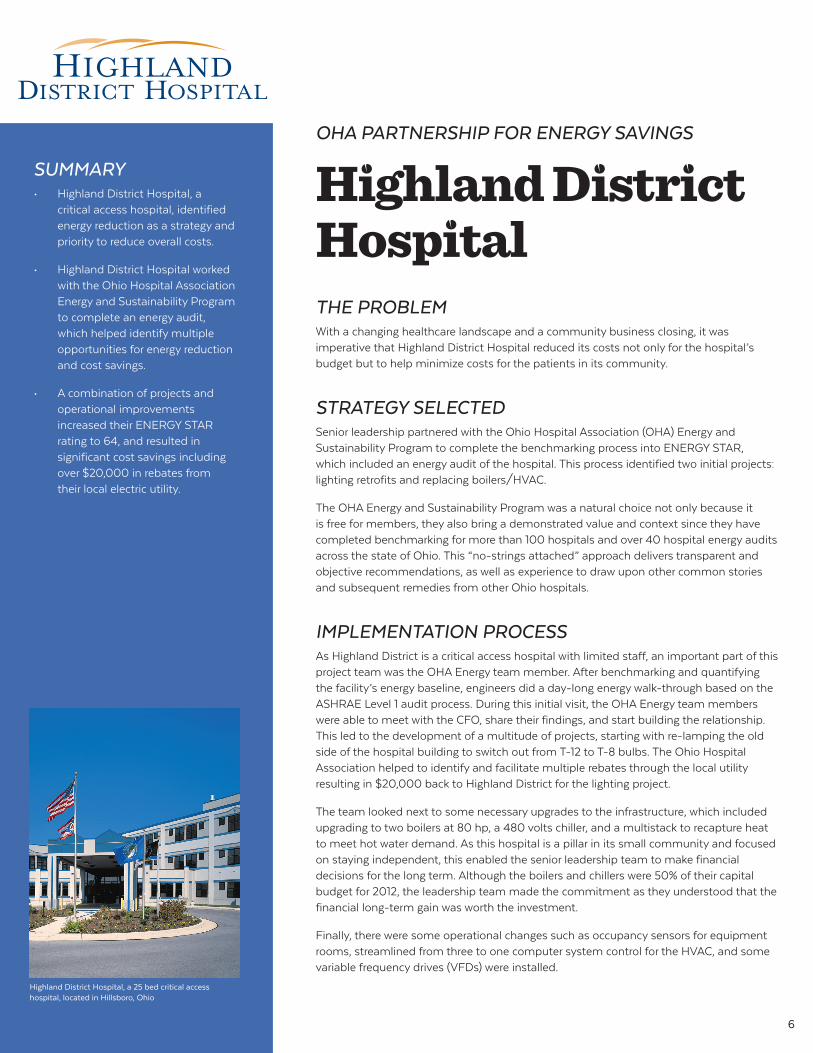
THE PROBLEM With a changing healthcare landscape and a community business closing, it was imperative that Highland District Hospital reduced its costs not only for the hospital’s budget but to help minimize costs for the patients in its community.
STRATEGY SELECTEDSenior leadership partnered with the Ohio Hospital Association (OHA) Energy and Sustainability Program to complete the benchmarking process into ENERGY STAR, which included an energy audit of the hospital. This process identified two initial projects: lighting retrofits and replacing boilers/HVAC.
The OHA Energy and Sustainability Program was a natural choice not only because it is free for members, they also bring a demonstrated value and context since they have completed benchmarking for more than 100 hospitals and over 40 hospital energy audits across the state of Ohio. This “no-strings attached” approach delivers transparent and objective recommendations, as well as experience to draw upon other common stories and subsequent remedies from other Ohio hospitals.
IMPLEMENTATION PROCESSAs Highland District is a critical access hospital with limited staff, an important part of this project team was the OHA Energy team member. After benchmarking and quantifying the facility’s energy baseline, engineers did a day-long energy walk-through based on the ASHRAE Level 1 audit process. During this initial visit, the OHA Energy team members were able to meet with the CFO, share their findings, and start building the relationship. This led to the development of a multitude of projects, starting with re-lamping the old side of the hospital building to switch out from T-12 to T-8 bulbs. The Ohio Hospital Association helped to identify and facilitate multiple rebates through the local utility resulting in $20,000 back to Highland District for the lighting project.
The team looked next to some necessary upgrades to the infrastructure, which included upgrading to two boilers at 80 hp, a 480 volts chiller, and a multistack to recapture heat to meet hot water demand. As this hospital is a pillar in its small community and focused on staying independent, this enabled the senior leadership team to make financial decisions for the long term. Although the boilers and chillers were 50% of their capital budget for 2012, the leadership team made the commitment as they understood that the financial long-term gain was worth the investment.
Finally, there were some operational changes such as occupancy sensors for equipment rooms, streamlined from three to one computer system control for the HVAC, and some variable frequency drives (VFDs) were installed.
OHA PARTNERSHIP FOR ENERGY SAVINGS
SUMMARY• Highland District Hospital, a
critical access hospital, identified energy reduction as a strategy and priority to reduce overall costs.
• Highland District Hospital worked with the Ohio Hospital Association Energy and Sustainability Program to complete an energy audit, which helped identify multiple opportunities for energy reduction and cost savings.
• A combination of projects and operational improvements increased their ENERGY STAR rating to 64, and resulted in significant cost savings including over $20,000 in rebates from their local electric utility.
Highland District Hospital
Highland District Hospital, a 25 bed critical access hospital, located in Hillsboro, Ohio

7
BENEFITS• Reduced general maintenance for staff with new equipment.
• Improved employee satisfaction with internal air quality and comfortable temperatures.
RESULTS• Energy costs reduced and received $20,000 in rebates from local utility.
• Improved ENERGY STAR score of 64.
CHALLENGES AND LESSONS LEARNEDOne of the challenges that a rural hospital often faces is a disadvantage in the bid process due to travel time. In this particular case, it only extended the length of the bid process, which ultimately added to the overall project time.
Highland District’s CEO, Jim Baer, had these three pieces of advice for a CEO of another rural hospital:
1. Look at energy as a significant savings opportunity, especially for the long-term.
2. Look for funding or resources – local providers, the state of Ohio, or other partnerships such as state hospital associations.
3. Start with an energy audit; this gives a roadmap of the short, medium and long term priorities.
Despite its initial success, this is only the beginning for Highland District Hospital. The critical access hospital is anticipating several upcoming projects in order to become an ENERGY STAR certified hospital. These include implementing an automatic computer shutdown program to further reduce energy, a water conservation program by changing toilets to low flow (1.6 gpf), light sensors for offices and bathrooms, and a parking light retrofit. Additionally, Highland District Hospital has partnered with the local utility service provider to participate in a Continuous Energy Improvement (CEI) hospital and university group.
DEMOGRAPHICS
Highland District Hospital is an acute care critical access hospital (25 beds) located in Hillsboro, Ohio.
The hospital employs more than 340 people, 70 community volunteers, and medical staff includes 60 physicians which represents 23 specialties to service an area of over 65,000 residents in Highland County and surrounding areas.
While Highland District is a community-centered hospital, they are also known for technology and sophisticated healthcare services.
8
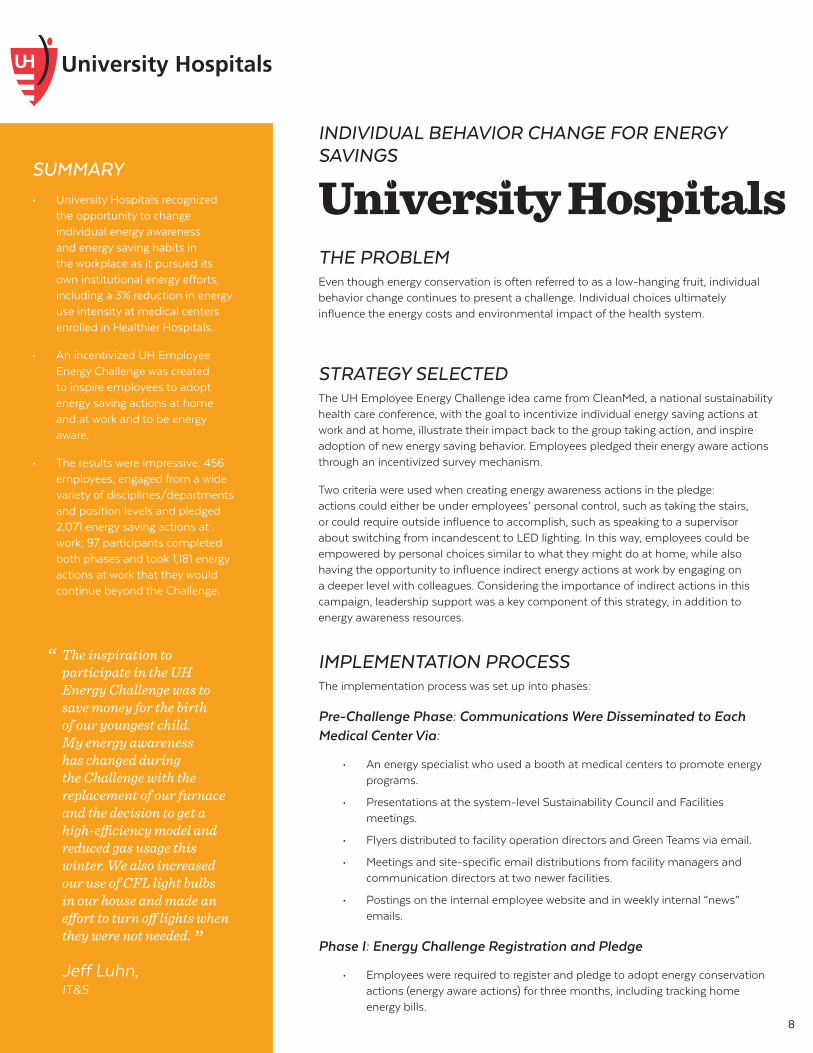
THE PROBLEM Even though energy conservation is often referred to as a low-hanging fruit, individual behavior change continues to present a challenge. Individual choices ultimately influence the energy costs and environmental impact of the health system.
STRATEGY SELECTEDThe UH Employee Energy Challenge idea came from CleanMed, a national sustainability health care conference, with the goal to incentivize individual energy saving actions at work and at home, illustrate their impact back to the group taking action, and inspire adoption of new energy saving behavior. Employees pledged their energy aware actions through an incentivized survey mechanism.
Two criteria were used when creating energy awareness actions in the pledge: actions could either be under employees’ personal control, such as taking the stairs, or could require outside influence to accomplish, such as speaking to a supervisor about switching from incandescent to LED lighting. In this way, employees could be empowered by personal choices similar to what they might do at home, while also having the opportunity to influence indirect energy actions at work by engaging on a deeper level with colleagues. Considering the importance of indirect actions in this campaign, leadership support was a key component of this strategy, in addition to energy awareness resources.
IMPLEMENTATION PROCESSThe implementation process was set up into phases:
Pre-Challenge Phase: Communications Were Disseminated to Each Medical Center Via:
• An energy specialist who used a booth at medical centers to promote energy programs.
• Presentations at the system-level Sustainability Council and Facilities meetings.
• Flyers distributed to facility operation directors and Green Teams via email.
• Meetings and site-specific email distributions from facility managers and communication directors at two newer facilities.
• Postings on the internal employee website and in weekly internal “news” emails.
Phase I: Energy Challenge Registration and Pledge
• Employees were required to register and pledge to adopt energy conservation actions (energy aware actions) for three months, including tracking home energy bills.
SUMMARY
• University Hospitals recognized the opportunity to change individual energy awareness and energy saving habits in the workplace as it pursued its own institutional energy efforts, including a 3% reduction in energy use intensity at medical centers enrolled in Healthier Hospitals.
• An incentivized UH Employee Energy Challenge was created to inspire employees to adopt energy saving actions at home and at work and to be energy aware.
• The results were impressive: 456 employees, engaged from a wide variety of disciplines/departments and position levels and pledged 2,071 energy saving actions at work; 97 participants completed both phases and took 1,181 energy actions at work that they would continue beyond the Challenge.
University Hospitals INDIVIDUAL BEHAVIOR CHANGE FOR ENERGY SAVINGS
The inspiration to participate in the UH Energy Challenge was to save money for the birth of our youngest child. My energy awareness has changed during the Challenge with the replacement of our furnace and the decision to get a high-efficiency model and reduced gas usage this winter. We also increased our use of CFL light bulbs in our house and made an effort to turn off lights when they were not needed.
Jeff Luhn, IT&S
“
“

9
• Upon online submission of the registration/pledge, the energy awareness webpage opened for participants with access to energy education resources for home and work.
Phase II: Follow-Up – Three Months Later
• All participants were surveyed and asked to comment on actions they took and will continue to pursue in order to quantify impacts of the Challenge on individual behavior.
• Participants also reported electric and natural gas usage for the three months of the challenge, which was compared to regional averages and reported back to them.
• A prize drawing amongst the participants who completed both phases was accomplished through random selection (grand prize was a nest home thermostat and iPad mini, with two additional prizes of LED bulbs).
• The final communication piece, called “Energy Usage: UH and You”, tied together individuals’ efforts in particular areas (using power strips) and how they are related to UH Energy efforts (HHI Leaner Energy Challenge). This was published on the Greening UH Energy webpage and presented to the System Sustainability Council.
BENEFITS/OUTCOMES• Participants who reported home electricity usage used on average 45 kWh less/month
than the monthly OH average of 892 kWh.
• Survey results indicated intentional long-term behavior change by participants, with top actions being posting energy education and having energy conversations with supervisors.
• Participation of new UH employees: 121 out of 456 Phase I participants were from new facilities acquired by the system.
• 75% of participants found the Greening UH Energy webpage useful and 85% said they would join another energy challenge in the future.
• The program identified engaged employees who can be cultivated as future front-line green team members.
CHALLENGES AND LESSONS LEARNED• As this was a communications-focused employee engagement program, support from
communication teams and facility-level operations directors were key to its success.
• Future energy challenges should include an interactive survey tool or energy usage calculation tools to give immediate feedback to participants.
• The competition became a great welcoming opportunity for employees from new medical centers that recently joined the UH health system.
• Participant survey feedback suggested: opportunities to better prepare managers on UH Energy practices, new initiatives to make employee conversations more productive, offering energy provider and energy saving device discounts through the employee discount program, and awarding HealthMiles (discount off health insurance premium) for participation.
DEMOGRAPHICS
University Hospitals, the second largest employer in Northeast Ohio with 25,000 employees, serves the needs of patients through an integrated network of 15 hospitals, 29 outpatient health centers and primary care physician offices in 15 counties.
At the core of this $3.5 billion health system is University Hospitals Case Medical Center, ranked among America’s 50 best hospitals by U.S. News & World Report in all 12 methodology-ranked specialties.
Its main campus includes UH Rainbow Babies and Children’s Hospital, ranked among the top children’s hospitals in the nation; UH MacDonald Women’s Hospital, Ohio’s only hospital for women; and UH Seidman Cancer Center, part of the NCI-designated Case Comprehensive Cancer Center at Case Western Reserve University.
Inspiration was honestly the prize, however I was equally happy about the education and self-awareness of my utility consumption. So concepts or challenges like this I believe are great and may be the best way to involve a larger amount of our population to see larger scale changes.
Bret Mason, General Maintenance
“
“
Greening UH poster educating energy efficient behavior

10
THE PROBLEM Heating, ventilation and air conditioning (HVAC) is the single most energy-intensive component in the health system’s energy profile (51%). There are 215 operating rooms (ORs) across the health system running multiple cases per day. Because of the ORs’ requirements for air changes per hour, strict temperature and humidity parameters, pressure relationships, and energy-intensive surgical lighting systems, OR HVAC systems came into sharp focus as a strategic priority for energy demand reduction.
STRATEGY SELECTEDThe first step was to illustrate the scale of the opportunity that OR setbacks presented. A third-party engineering firm assessed OR occupancy, existing conditions and costs to implement, control and maintain an OR HVAC setback strategy.
Facilities Institute Guidelines (FGI) and the American Society of Heating, Refrigerating and Air-Conditioning Engineers (ASHRAE) guidelines govern the minimum total and outdoor air change rates for ORs to maintain temperature, ensure particulate removal, and overcome equipment loads. ANSI/ ASHRAE/ ASHE Standard 170-2013: Ventilation of Health Care Facilities requires a minimum of 20 ACH total and four ACH of outdoor air when the room is in use. Cleveland Clinic’s design specification exceeded the guideline by 5 ACH, with no measurable benefits. ASHRAE 170 and many state codes also allow the number of air changes to be reduced when the space is unoccupied1. OR HVAC setback, also referred to as “unoccupied setback”, is an energy saving strategy that reduces the amount of air supplied to an OR when the room is not in use while still maintaining temperature and humidity ranges. HVAC systems run all night—even when the OR is unoccupied. Facilities recognized the enormous potential that unoccupied settings presented - on the order of $2,000,000 per year2. Yet, clinicians had concerns about needing to condition the space at a moment’s notice and require assurances that the implementation will not negatively impact patient safety or infection rates.
IMPLEMENTATION PROCESSIn collaboration with the Infection Prevention Department, Surgical Operations Executive Committee, and the Design and Planning Department, the Facilities Department adjusted all main campus ORs to 20 ACH and OR design standards were adjusted down to the 20 ACH per ASHRAE 170’s guidance.
The team included representatives from facilities, design and planning team, surgical operations, infection prevention, surgical staff, and other key stakeholders. Their task was to evaluate and provide a recommendation for unoccupied settings:
• Identify peer facilities that implemented setbacks with no safety risks.
• Identify what the users of the space needed versus wanted.
SUMMARY• To meet the Cleveland Clinic’s
$12M energy demand reduction target1, one of the reduction strategies included an analysis of the operating rooms (ORs).
• OR air exchange rates, measured in air exchanges per hour (ACH), were investigated as an energy conservation measure. It was known that OR ACH rates remained high even when surgical cases were not being performed. This included nights and weekends.
• Annual air balance reports indicated that even the surgical conditions ACH rates exceeded universally accepted guidelines by 5-15 ACH.
• Estimated annual savings of $250,000 per year with approval and implementation of OR ACH setbacks down to the levels specified by the engineering guidelines (20 ACH).
• Reducing ACH during the non-surgical periods reduces energy consumption by up to 484,500 kBTU per OR/year (which equates to approximately $10,000 in utility costs). By adjusting the air changes per hour (ACH) to meet the state and federal codes of 20 ACH, this resulted in an estimated annual savings of $250,000 per year.
REDUCING OR AIR EXCHANGE RATES FOR ENERGY SAVINGS
11 7.1-Subsection 1.c: when the space is unoccupied providing that the required pressure relationship to adjoining spaces is maintained while the space is unoccupied and that the minimum number of air changes, temperature and pressure relationships indicated is reestablished anytime the space becomes occupied2Based on findings from third party study funded at request of the Greening the OR Committee
Cleveland Clinic

11
• Articulate what permissions were necessary to override settings.
• Map out HVAC usage per OR suite.
• Research available technologies.
• Pilot solutions/prove out setbacks.
• Conduct cost benefits analysis when retrofitting an existing facility.
• Implement across the health system.
The end goal of this concept is to reduce the ACH when conditions permit, on a space-by-space basis. This concept was pilot-tested in E Building’s OR Renovation Project, an integrated set of OR design criteria and performance standards.
BENEFITS OF PILOT RESULTS• Based on measured reduction in fan power and cubic feet or air per minute (CFM)
of cooling, an estimated $10,000/year/OR can be achieved.
• 20,000,000 kWh of electricity will be saved.
• The system will provide better oversight of room conditions to assure that it is always within the required guidelines for temperature, humidity, pressurization and ACH and make those parameters visible to the surgical team within the room.
CHALLENGES AND LESSONS LEARNED1. Costs
The OR setback strategy can be adopted with little or no additional upfront cost in new construction, while a retrofit of an existing facility requires upfront costs to be weighed against the expected energy savings. Since most OR setback solutions require periodic maintenance, the cost of maintenance should be part of the equation. Pitching for a total cost setback strategy is not an easy sell to a management team focused on cost reductions.
2. Adaptive Comfort To respond to user differences, ORs may be kept in “ready” mode, i.e. in occupied mode, even though there is no code requirement to do so. Clinical and facility staff are working together to decide which control solution meets the surgical team’s needs while still saving energy.
3. OR Controls It’s complicated. The facilities/buildings have different and varied HVAC system controls. Designing the right control interface was very important to the success of this project for our various user groups.
4. Surgical Staff One strategy to ease surgical staff concerns was to automate OR setbacks with the surgical schedule. This is achieved by linking setbacks to the OR scheduling system which programmed the ORs to be set back once the schedule is completed and designed to return to occupied mode 30 minutes prior to the initiation of the daily schedule. A safety feature embedded into the surgical light ensures that setbacks aren’t activated if the surgical light is on. The monitoring system controlling OR setbacks also gives better visibility and control of prescribed temperature ranges for the surgical staff.
Enterprise implementation is slated for 2015.
DEMOGRAPHICS
Cleveland Clinic is a nonprofit multispecialty academic medical center that integrates clinical and hospital care with research and education.
More than 3,000 full-time salaried physicians and researchers and 11,000 nurses represent 120 medical specialties and subspecialties.
The Cleveland Clinic health system includes a main campus, eight community hospitals, more than 75 Northern Ohio outpatient locations, Cleveland Clinic Florida, the Lou Ruvo Center for Brain Health in Las Vegas, Cleveland Clinic Canada, and Cleveland Clinic Abu Dhabi (scheduled to begin seeing patients in 2015).
In 2013, there were 5.5 million outpatient visits throughout the Cleveland Clinic health system and 157,000 hospital admissions.
Cleveland Clinic OR, an energy-intensive space

12
THE OPPORTUNITYAs a mission-driven, community-based healthcare system, one of the ways ProMedica positively impacts the community is by reducing their energy consumption. The savings associated with energy conservation not only lowers operating cost, but also is re-invested into patient care and the communities that ProMedica supports.
Using 2011 as a benchmark, the health system set out with the goal to reduce energy consumption by 7% at hospitals and largest medical office buildings (MOBs). To this end, ProMedica enlisted energy consultants for benchmarking and to perform ASHRAE Level 2 energy audits. In addition to the energy consultation, ProMedica worked with a utility bill pay service to consolidate all utility bill payments. This consolidation ensured that late payments were avoided, and provided a consistent process for utility data collection. That data was then exported for analysis and input into ENERGY STAR Portfolio Manager for all sites.
STRATEGY SELECTEDAn extensive team including leadership, facility managers, service vendors, automation control teams and an assortment of suppliers came together to create and implement the ongoing energy management plan. A number of solutions were selected for the overall energy management plan: LED lights are now installed consistently across the facility, variable frequency drives are being used, and electric motors have been replaced. Additionally, the system-wide Sustainability Council is working to promote individual behavior change (such as unplugging cell phone chargers).
BENEFITS OF A COMBINED HEAT AND POWER
SYSTEMOne critical aspect of the energy management plan was the decision to incorporate a combined heat and power system at ProMedica Wildwood Orthopaedic and Spine Hospital. The onsite power system uses natural gas to provide electricity and heat to the hospital. Benefits to the facility include a reduction in annual energy costs, greenhouse gas emissions and source energy use intensity. The compact size and low sound level of the Capstone micro-turbine system was a key consideration because it was housed in the upper floor mechanical room above patient care areas.
The hospital has around-the-clock access to the operation and performance of the system with a distributed generation control system. This web-based dashboard – accessible on mobile devices or computers – provides facility managers with real-time data so that daily energy consumption can be monitored and balanced with the hospital’s needs and the system’s energy production. This increases savings by providing a baseload of electricity and heat generated by the combined heat and power system.
USING COMBINED HEAT AND POWER SYSTEM FOR ENERGY SAVINGS
ProMedicaSUMMARY• With a continuous need for
electricity and heat, hospitals benefit from the energy efficiency and reliability that combined heat and power systems provide.
• ProMedica Wildwood Orthopaedic and Spine Hospital installed an advanced combined heat and power system using two Capstone C65 micro-turbines®.
• With the system in its second year of continuous operation, ProMedica has achieved the energy and GHG reduction goals established during the feasibility and design process.
Capstone C65 microturbines

13
MEASURING SUCCESSKey performance indicators are prepared monthly and communicated to the ProMedica leadership team on energy intensity, cost avoidance and progress of energy conservation measures for all target facilities. This information is then used to make informative future decisions – such as putting combined heat and power systems in other facilities.
RESULTS• Source energy use index has decreased over 18%.
• GHG reduction of 700 tons or the equivalent of 115 automobiles saved annually.
• Energy supply cost risk mitigated due to multi-fuel purchase options.
COMMUNITY BENEFITS• Reduced energy consumption equals increased investments into patient care.
• Decreased environmental impact improves the wellness of facilities and the community.
CHALLENGES AND LESSONS LEARNEDInitially, there was reluctance by the maintenance staff about the use of the new technology, and, while leadership was very supportive of the concept of a combined heat and power system, capital improvements like these still compete with other needed capital items for patient care such as MRIs and other clinical equipment.
However, once peers from other ProMedica facilities toured the installation and the staff saw the enthusiasm by their colleagues, they realized what a great system they had. In fact, due to the successful energy reduction, cost avoidance, and the ability to meet electricity and hot water demands, ProMedica is now considering combined heat and power systems for retrofits at other existing hospitals as an alternative to replacing boilers.
Similar systems have been installed at over 200 hospitals nationally with some having emergency power capabilities to improve resiliency and provide redundancy during power outages.
DEMOGRAPHICS
ProMedica Wildwood Orthopaedic and Spine Hospital (WOSH), a division of ProMedica Toledo Hospital, was built with patients in mind. The 70,000-square-foot facility is the region’s only free-standing hospital devoted exclusively to caring for orthopaedic and spine patients. The entire hospital was designed to provide a state-of-the-art environment that is customized to treat and rehabilitate adults with bone, joint and spine disorders and injuries.
As ProMedica’s first all-electronic hospital, WOSH features 36 private rooms with added amenities, including convenient room service; six integrated operating rooms; 24/7 in-house hospitalist care; pre-operative education sessions; a bloodless care program; pain management blocks and anesthesia rounding to aid post-op recovery; and inpatient physical therapy. The high quality of care provided at WOSH has been recognized by the 2014 Healthgrades Patient Safety Excellence Award™ and the Press Ganey Beacon of Excellence for Physician Engagement Award.
Installing the Capstone C65 microturbines

14
Learn More
Healthier Hospitals
www.healthierhospitals.org
Practice Greenhealth
www.practicegreenhealth.org
Health Care Without Harm
www.noharm.org
Ohio Hospital Association Energy
and Sustainability Program
www.ohiohospitals.org/energy

15
LEVEL 1
Reduce greenhouse gases by decreasing weather-adjusted energy intensity from metered energy use by 3% from baseline.
HOSPITAL NAMEThe Bellevue Hospital St. Elizabeth Boardman
Doctors Hospital Nelsonville UH Ahuja Medical Center
Marion General Hospital
Healthier Hospitals Leaner Energy ChallengeFrom powering life-saving equipment to ensuring the comfort of patients and staff, twenty-four hours a
day, seven days a week, energy is paramount to quality health care. However, with hospitals and health
systems—the second most energy-intensive building sector in the United States—emitting 8% of the nation’s
greenhouse gas emissions, it is imperative that hospitals cut emissions through improved operations and
equipment maintenance efficiency. There is a need to track both efficiency, as measured by energy used per
unit of service or size of hospital, and aggregate use.
Healthier Hospital’s Leaner Energy Challenge helps hospitals set off on that energy reduction journey. More
than 80 Ohio hospitals have committed to the Leaner Energy Challenge.
Cleveland Clinic health system Mercy Tiffin Hospital
Cleveland Clinic main campus Ohio Health Grant Medical Center
Euclid Hospital, a Cleveland Clinic hospital
Southern Ohio Medical Center
Fairfield Medical Center Summa Wadsworth Hospital
H.B. Magruder Memorial hospital UH Conneaut Medical Center
Lakewood Hospital, a Cleveland Clinic hospital
UH Richmond Medical Center
Lutheran Hospital, a Cleveland Clinic hospital
Adena Greenfield Medical Center Mercy Medical Center
Bluffton Hospital Ohio Health Grady Memorial
Fairview Hospital, a Cleveland Clinic hospital
Summa St. Thomas
Good Samaritan - PremierSycamore - Kettering Health Network
Highland District Hospital Trinity Medical Center East
Hillcrest Hospital, a Cleveland Clinic hospital
UH Geneva Medical Center
Medina Hospital, a Cleveland Clinic hospital
Wright Patterson Air Force Base Medical Center
LEVEL 3
Reduce greenhouse gases by decreasing weather-adjusted energy intensity from metered energy use by 10% from baseline; OR, if facility is already an ENERGY STAR rated facility (> 75), maintain ES status.
Congratulations to these Leaner Energy hospitals for achieving Levels 1-3!
LEVEL 2
Reduce greenhouse gases by decreasing weather-adjusted energy intensity from metered energy use by 5% from baseline.

GENERAL INQUIRIESwww.HealthierHospitals.org
703.860.9790
MEDIA [email protected]
703.870.7494
MAILING ADDRESSHealthier Hospitals
Practice Greenhealth
12355 Sunrise Valley Drive
Suite 680
Reston, VA 20191

Ohio Healthier HospitalsA Collection of Environmental Leadership Case Studies
Prepared by

2
About OHAOHA’s Energy & Sustainability Program assists hospitals with energy procurement, advocacy, ENERGY STAR benchmarking, energy audits, pollution prevention and environmentally conscious sustainability programs.
In the five-year period ending June 2016, hospitals participating in OHA’s ENERGY STAR benchmarking project saved enough money due to reduced energy use to hire 137 nurses, and reduced their carbon footprint equivalent to taking 22,168 cars off the road or the climate benefits of 2.7 million mature trees. The U.S. Environmental Protection Agency recognized OHA with a 2016 ENERGY STAR Partner of the Year—Energy Efficiency Program Delivery Award for the association’s efforts to promote energy efficiency and adoption of energy-efficient products.
OHA advocates before the Public Utilities Commission of Ohio on behalf of hospitals, saving hospitals millions of dollars in rate cases and working to connect them with financial incentives offered by utilities and government to fund energy efficiency projects. Learn more at www.ohiohospitals.org/energy.
About OHA’s Environmental Leadership CouncilThe Ohio Hospital Association Board of Trustees more than 15 years ago established a board committee named the Environmental Leadership Council. The Council’s mission is
to lead Ohio hospitals toward the goals of environmental sustainability, regulatory compliance, energy efficiency and pollution prevention, all of which will result in healthier hospital workforces and communities.
About OHA Environmental & Sustainability AwardsNamed after OHA Hall of Fame Inductee, Melvin Creeley, former CEO from East Liverpool City Hospital and past chair of OHA’s Environmental Leadership Council, the Melvin Creeley Environmental Leadership award recognizes hospitals for promoting sound practices through environmental stewardship. Recipients of OHA’s Melvin Creeley award are eligible to receive the John Chapman Award. OHA’s John Chapman Award recognizes a hospital or health system that demonstrates excellence in initiating or supporting pollution prevention programs. The award is named after John Chapman or “Johnny Appleseed,” who planted thousands of apple trees across the Midwest during the 19th century.
About Practice GreenhealthPractice Greenhealth is the nation’s leading health care membership community that empowers its members to increase their efficiencies and environmental stewardship while improving patient safety and care through tools, best practices and knowledge. To learn more about Practice Greenhealth www.practicegreenhealth.org.

3
Dear Ohioans and beyond,
Ohio hospitals strive to achieve the Triple Aim—better patient care, improved population health, and lower costs—and environmental stewardship has become an important strategic consideration to meet those aims.
To make environmental stewardship a strategic imperative, it is essential to have a systematic approach in tracking and reporting sustainability efforts. Both Ohio Hospital Association and Practice Greenhealth offer an opportunity to formally measure this effort through an awards process.
In Ohio, hospitals may apply for the Melvin Creeley and the John Chapman awards process through OHA. This awards process has been ongoing for the past 15 years. Nationally, hospitals may apply for the Practice Greenhealth Environmental Excellence Awards, an awards system in place for the last twelve years.
Our hope is Ohio hospitals are participating in every assessment and tracking process available.
Hospitals measuring and reporting sustainability data can benchmark their efforts with like facilities across the state and country.
This collection* of case studies describes the environmental efforts and successes of OHA Melvin Creeley and John Chapman award winners. Through the sharing of progress and best practices, the health care sector can continue to make the important improvements necessary to make our communities healthier, one hospital at a time.
Best,
Rick Sites Energy and Sustainability Team Leader Ohio Hospital Association
Sarah Manwell Chief Membership Officer Practice Greenhealth
FOREWORD
*Unless otherwise stated, all information is based on 2015 data.

4
Ohio Leads the U.S. in ENERGY STAR HospitalsENERGY STAR Hospitals save an average of $3,000 per bed, per year on energy costs. OHA offers participating hospitals access to the energy utilization database, enabling them to benchmark their energy efficiency and qualify for an ENERGY STAR rating.
Ohio ENERGY STAR hospitals:
• Adena Greenfield Medical Center • Barnesville Hospital• Firelands Regional Medical Center - South Campus • TriHealth Good Samaritan Hospital - Cincinnati• Mercy Medical Center – Canton• Mercy Tiffin Hospital• Mercy Willard Hospital• Miami Valley Hospital South• Ohio State University Hospital East • ProMedica Bay Park Hospital• Southern Ohio Medical Center• Summa St. Thomas Hospital
The mission of a hospital has been expanding beyond the singular patient to populations for some time now.
As health care begins to tackle the idea of healing communities, environmental stewardship aligns very well to that new mission. The air a patient breathes, the food they have access to, the chemicals they are exposed to—all of this now comes into focus and must be considered when considering the new definition of health.
Additionally, the intersection of environmental actions as a mechanism for significant cost savings is another compelling reason:
• ENERGY STAR for Healthcare reports that every $1 a nonprofit health care organization saves on energy is equivalent to $20 in new revenues.
• Practice Greenhealth’s Benchmark Report found that the median cost for Regulated Medical Waste is nearly 11 times more expensive than solid waste, and that award-winning members are saving $75,419 per facility in avoided supply and waste costs by reformulating Operating Room kits.
This is still a newer philosophy and strategy for hospitals, which is where organizations like OHA and Practice Greenhealth help spread the knowledge and best practices to accelerate the uptick of environmental stewardship in health care.
INTRODUCTION
In 2016, Ohio hospitals saved enough energy to power 10,351 homes for a year.
It’s the equivalent of taking 6,000 cars off the road.
The financial savings equate to salaries for 26 nurses.

5
P2 University Environmental Best PracticesOHA’s Environmental Leadership Council provides support and technical resources to Ohio hospitals’ efforts to reduce waste, prevent pollution and comply with environmental regulations through the Pollution Prevention University, or P2 University.
OHA’s Pollution Prevention University takes a hands-on approach to evaluate waste systems. Participating hospitals learn how to identify cost saving opportunities for pollution prevention and waste minimization activities, review the requirements of the Joint Commission’s Environment of Care Standards involving the safe management of hazardous materials and hazardous wastes, prepare pollution prevention plans and programs to increase compliance with state and federal laws, and conduct a thorough audit of a hospital waste stream.
The next step in evaluating waste streams is to report out on that progress following the education through OHA’s awards process:
• MELVIN CREELEY AWARD This award recognizes hospitals and health systems that demonstrate their commitment to environmental stewardship through implementing waste reduction programs, recycling initiatives and other activities to preserve the health of the planet for future generations.
• JOHN CHAPMAN AWARD The John Chapman Award winner is selected from the Melvin Creeley nominees. This award recognizes a hospital or health system that has demonstrated leadership in guiding its facility toward the goals of environmental sustainability, regulatory compliance, energy efficiency and pollution prevention, all of which are proven to result in healthier hospital workforces and communities.
The following are case studies from Ohio hospitals that previously applied for OHA’s Melvin Creeley Award.
• 88th Medical Group at Wright-Patterson Air Force Base
• Louis Stokes Cleveland VA Medical Center
• Mercy Health Youngstown Region
• Mount Carmel Health System
• TriHealth
• University Hospitals
This report highlights how these six hospitals and health systems have approached environmental stewardship and how they have found significant successes.

6
THE OPPORTUNITYThe original Wright-Patterson Medical Center facility was built in 1956 and encompassed 297,000 square feet, with another 378,000 square feet added in 1987, for a total area of 784,452 square feet. The facility requires a 13,201 square feet central energy plant that controls all steam, water and electrical systems for the hospital. In addition, the hospital utilizes 26,000 gallons of water each day, including 8,000 gallons of hot water. Two boilers provide 8,200 pounds of steam every hour which is utilized to heat water, supply autoclaves, maintain sterilizers and operate kitchen equipment and humidifiers. Due to the age and size of the facility, Wright-Patterson Air Force Base recognizes the importance of improving efficiency across the entire facility.
THE STRATEGY AND IMPLEMENTATION PROCESSWPAFB identified and established green initiatives structured to integrate and balance concerns related to the environment, economy and community. To meet the goals of these green initiatives, the WPFAB Medical Center committed to executing initiatives that promote greener government, business and personal practices that both ensures the environmental sustainability of the facility and enhances the quality of life for staff members and patients.
SUMMARY
• The Wright-Patterson Air Force Base Medical Center enhanced installation sustainability by implementing recycling and waste management programs, diverting several hundred tons from the landfill each year.
• Because of the waste management programs, the medical center reduced regulated medical waste by 36 percent from the federal baseline.
88th Medical Group
Wright-Patterson Air Force Medical Center/Region V
Wright-Patterson Air Force Base, Ohio
57 Beds and 38 Clinics
ACCOMPLISHMENTS SINCE WINNING THE MELVIN CREELEY AWARD• Employed the use of Xenex ultraviolet
disinfection robots
• Base implemented the “Throttle Back” energy conservation initiative where over the weekends individuals are asked to unplug or turn off all nonessential electrical and electronic devices
• Installed drug take-back kiosks for patients to drop off expired or unneeded drugs
• Installed several “GUS” disinfection soak probe cleaning stations
• Discussing the use of “Trophon” hydrogen peroxide based cleaning station for cleaning ultrasound probes
88th Medical Group at Wright-Patterson Air Force Base

7
Solid Waste Reduction
The waste reduction policies and procedures in place are overseen by the WPAFB Environmental Management Office and Medical Center’s Unit Environmental Coordinator, with a goal of diverting 50 percent of solid waste generation. Language has been written into all renovation contracts stipulating that contractors must conform to the recycling program procedures. WPAFB Medical Center’s recycling program collected more than 400 tons of cardboard, 72 tons of paper products, over 8 tons of plastics, 2.5 tons of aluminum and glass, 400 wooden pallets, 300 ink and toner cartridges, 3000 ceiling tiles, 1500 fluorescent light bulbs, 700 light fixtures and 350 tons of various metals, which were collected in a 30-yard dumpster producing roughly 30 dumpster loads in a year’s time. Additional programs include the installation of high efficiency ovens which have nearly eliminated grease and oil waste, and a food pulper, the waste from which may be used as compost in the future. WPAFB Medical Center utilizes reusable linens and the Defense Reutilization Marketing Office oversees the recycling of used furniture through a medical furniture and equipment redistribution system. To further reduce waste packaging, materials are reused and double sided copies are encouraged.
Regulated Medical Waste Management
The volume of regulated medical waste strived for is less than 10 percent of total waste generated. While this provides a baseline of 112,000 pounds per year, the WPAFB produced only 72,000 pounds in 2014, resulting in a 36 percent reduction.
Universal Waste and Recycled Hazardous Waste
Electronics are all turned into Defense Reutilization and Marketing Office for recycling or reuse, and lead batteries are turned into the Base recycling center with all other
non-alkaline batteries going to the Base hazardous waste contractor. Recently the entire Medical Center was retrofitted with electronic ballasts and lower energy T8 light tubes, while all parking lot lighting was replaced with LEDs, recycling the old lighting components. Further reduction of hazardous waste has been accomplished through the installation of processors on the second floor that effectively recycle alcohol, xylene and formalin. The WPAFB Medical Center has implemented a paint, x-ray and lead apron recycling program as well as a Pharmaceutical Reverse Distribution, wherein all drugs not considered hazardous are sent back to the distributor.
Hazardous Waste Management
Hazardous waste at the WPAFB Medical Center is managed by the medical group unit environmental coordinator. WPAFB has been a mercury free facility since 2005. For other hazardous wastes such as pharmaceutical, chemotherapy and chemical, the WPAFB Medical Center utilizes the Enterprise Environmental, Safety and Occupational Health Management Information System.
Facilities Waste Management System and Preferable Purchasing
The WPAFB Medical Center has almost eliminated suction canisters that had to be disposed of as regulated medical waste through utilization of the Dornoch suction system, which ties into the sanitary sewer system. Digital imaging has eliminated film waste and reusable cleaning cloths are being utilized to reduce cleaning waste. The Base also requires that all products purchased be ENERGY STAR rated.
Energy Conservation Measures
During the recent renovation several air handling units, air distribution systems, air return fans, exhaust fans, air terminal variable air volume boxes, re-heat coil boxes,

8
dampers and controls were upgraded. As another energy conservation measure, a Progressive Water Softener System was installed. Unlike a timed system, which cycles water every 10 to 12 hours going through about 45,000 gallons a week, the progressive system cycles the water softener when the demand reaches a certain threshold. This improved system saves the WPAFB Medical Center thousands of gallons of water each week. Complimenting this upgrade was the installation of dual flush toilets, which reduces water consumption from 3.5 to 5 gallons
per flush to 1.6 gallons per flush. The occupancy sensors were updated, which automatically turn lights off when rooms are empty. In addition to the HVAC improvements, all steam and condensate insulation was repaired or replaced, and a maintenance program adopted for the hospitals cooling towers. Lastly the WPAFB has initiated an Employee Carpooling/Ride to Work Program. This program encourages carpooling while also reimbursing employees if they ride the bus to work, reducing the amount of greenhouse gas the WPAFB employees produce.
Chemicals Energy Waste Purchasing Food
Alcohol, xylene and formalin recycling
Mercury free facility
Medical center retrofit with lower energy ballasts and T8 light tubes
Parking Lot Upgrade to LEDs
HVAC improvements
Employee Car Pool Program
36 percent reduction in regulated medical wastes and a comprehensive recycling program
Reusable linens and cleaning cloths
Progressive water softener system saves thousands of gallons per week
Reverse pharmaceutical program
Purchase ENERGY STAR rated products
Contractor compliance with recycling program
Created a patient diabetic garden
Benefits and Results
Challenges and Lessons Learned• Since Wright-Patterson Medical Center is a federal/
military organization, it is bound by federal, state, Air Force, base and hospital rules, regulations and policies. Making changes must go through many levels of chain of command. Leadership is fully supportive in the Greening the government initiative, however everyone in the approval process has input or questions that need to be addressed.
• The renovation projects provided the opportunity to salvage outlets, switches, doors, cork boards, dry erase boards, hinges, and fixtures that were all deemed construction debris. These items were turned over to the Montgomery county recycling center for use in Habitat for Humanity projects.
• Another challenge the medical center encountered was finding adequate space for storage and transportation for the cardboard recycling. The recycling storage originally began in small bins, and as the program grew, moved to a flatbed truck then a 30-yard compactor. Although it required hiring a local waste hauler to transport the compactor to the recycling center, the 30-yard compactor was a good solution for the high volume of recycling.
• A major challenge was recycling old Xray films and computer disks with patient information on them. These could not be sent to the Base recycling center to be shredded due to the sensitive nature of the information they contain, so WFAB purchased a commercial shredder and installed it in a secure area in the medical center so authorized staff could shred these items.

9
THE OPPORTUNITYAs a Federal Government Agency, the Louis Stokes Cleveland VA Medical Center must conform to sustainability executive orders to conduct business in an environmentally, economically and fiscally sound manner that is integrated, continuously improving, efficient and sustainable while also making the reduction of greenhouse gas emissions a priority. The Louis Stokes Cleveland VA Medical Center created a strategy to manage and coordinate the
SUMMARY
• The Louis Stokes Cleveland VA Medical Center has employed a green environmental management system coordinator to oversee the implementation of environmental programs while ensuring that the facility is compliant with national and regional regulatory bodies such as the Ohio EPA, U.S. EPA, the Northeast Ohio Regional Sewer District, Cleveland Department of Public Health, Division of Air Quality and the Joint Commission.
• The GEMS coordinator position has expanded recycling, increased energy efficiency through continuous upgrading efforts and minimized the use of toxic and hazardous chemicals while maintaining health and safety standards for patients and employees.
Louis Stokes Cleveland VA Medical Center
660 beds
Provides care to 110,000 veterans
ACCOMPLISHMENTS SINCE WINNING THE MELVIN CREELEY AWARD• Accomplished 93 percent diversion rate
for construction and demolition debris, and a 38 percent recycling rate in 2016
• Working with a local food bank to start a CSA program for patients
• Working towards a 25 percent energy reduction by 2025
Louis Stokes Cleveland Veterans Affairs Medical Center

10
environmental programs while maintaining compliance with current regulations without sacrificing the facility’s exceptional patient care.
THE STRATEGY AND IMPLEMENTATION PROCESS
Green Program and Team Formation
The Louis Stokes Cleveland VA Medical Center manages environmental programs under GEMS based on continuous improvement through the ISO 14001:2004(E) standard. To complement this system, the Louis Stokes Cleveland VA Medical Center employed the services of a GEMS Coordinator beginning in 2008 and has been free of significant violations since the coordinator’s arrival. In 2012, VA Headquarters in Washington, D.C. initiated its Green Routine program as a way to motivate staff participation in facility efforts to improve sustainability performance. This program was adapted by the Louis Stokes Cleveland VA Medical Center Green Team, and headed by the GEMS Coordinator. Since its initial introduction the GEMS Coordinator has expanded the Green Routine program and established the Green Routine Award, which is presented monthly to the winning department or employee. The coordinator continues to drive attention to these recycling efforts through monthly newsletter coverage, the Digital Announcement Network, the Cleveland VA Official Digital Signage System, Green Routine events and outreach events sponsored by the facility.
Advancing Waste Prevention and Recycling
Through these various efforts, the Louis Stokes Cleveland VA Medical Center has developed a robust recycling
program. In 2014, the recycling program at the Louis Stokes Cleveland VA Medical Center achieved a diversion rate of 29 percent by recycling the following: 266 pounds of electronic ballast, 6,880 pounds of batteries, 76,440 pounds of comingled recyclables, over 1 million pounds of construction and demolition waste, 232,800 pounds of corrugated cardboard, 168,000 pounds of electronic waste, 7,200 pounds of cooking oil, 2,122 pounds of fluorescent lamps, 4,560 pounds scraps of food waste, 194,200 pounds of shredded paper, 18,000 pounds of scrap metal, 38,262 pounds of regulated medical waste from sharps containers, 1,629 pounds of Styrofoam and 44,000 pounds of wood pallets. Further supplementing the facility’s recycling accomplishments was the purchase of two recycling units for ethanol and xylene. These units were purchased with green initiative funds and have saved the VA Medical Center 75 percent from product purchasing and waste disposal services.
Reducing Facility Energy Intensity
Aiding the GEMS Coordinator is an energy engineer who researches and develops ways to improve energy efficiency, thus reducing greenhouse gas emissions through reduced energy intensity. Projects include the installation of a Smart Building System, which integrates all stand-alone building automation control systems, as well as smart electrical and mechanical meters. Equipment upgrades were performed for energy efficiency in air handling units, heat exchangers, pumps and variable frequency drives, process chillers and distribution loops, and steam unit heaters. Boiler Plant upgrades include flue gas economizers on water-tube boilers, blow down recovery system, low nitrogen oxide burners, motors and variable frequency drives. The lighting in the parking garage was converted to LED and operated by motion sensor reducing energy intensity by 50 percent. In 2014, the Louis Stokes Cleveland VA Medical Center was able to reduce over 4.4 megawatts electric load during the American Transmission Service, Inc. performance event.
Increasing Renewable Energy and Renewable Energy Generation at the Facility Level
The Louis Stokes Cleveland VA Medical Center’s Transient Resident House has been equipped with a photovoltaic system. As a result, PV and Combined Heat and Power feasibility studies have been completed for the medical center’s main campus.

11
Promoting Sustainable Acquisition and Purchasing
The Louis Stokes Cleveland VA Medical Center utilizes the General Service Administration’s online shopping and ordering system, GSA Advantage. This platform provides instant access to millions of products and services that meet VA approval. As such all Louis Stokes Cleveland VA Medical Center employees responsible for purchasing products and services receive mandatory training in using the platform, streamlining the process of purchasing items that are compatible with the environmental programs being implemented.
Safer Chemicals
The Chemical Management and Pollution Prevention Program is coordinated through the Chemical Hygiene Committee, which is overseen by the GEMS coordinator and industrial hygienist. The goal is to reduce the risk to human health from hazardous and toxic chemicals. The MAXCOM program is a chemical management system based on the new Occupational Safety and Health Administration’s Globally Harmonized System of Classification and Labeling of Chemicals. This system provides employees with user friendly tools for the acquisition, handling and storage of hazardous and toxic chemicals. The MAXCOM system
automatically applies acquisition and procurement practices in order to meet statutory mandates requiring purchase preferences for less toxic and hazardous chemicals. In addition to MAXCOM, the Louis Stokes Cleveland VA Medical Center has a pharmaceutical waste management system that is considered a best practice by the EPA. In 2014, this waste management system diverted 10,000 pounds of pharmaceutical waste from waterways and landfills.
Promoting Electronics Stewardship
The electronic stewardship addresses the life cycle management of electronics from procurement to disposal. The Louis Stokes Cleveland VA Medical Center Electronics Stewardship Program ensures procurement preference for Electronic Product Environmental Assessment Tool designated electronic products, which is certified and ENERGY STAR approved. This enables power management, duplex printing and other energy efficient or environmentally preferable features. When disposing of electronics, the Louis Stokes Cleveland VA Medical Center employs environmentally sound practices for the disposition of excess electronics through its partnership with UNICOR.
Chemicals Energy Waste Purchasing Food
Eliminated volatile organic compounds in paints
75 percent savings on xylene and ethanol purchasing and disposal
Shed 4.4 megawatts
Photovoltaic installation, led retrofit in parking garage
Smart Building System integrating climate regulating functions
29 percent Waste Diversion Rate
38,262 pounds radioactive mixed wastes diverted from landfills
10,000 pounds of pharmaceutical waste diverted
EPAT and ENERGY STAR certified electronics
MAXCOM program
Healthy Teaching Kitchen Garden
Benefits and Results
Challenges and Lessons Learned• Communication continues to be a challenge, especially
with waste responsibilities. New employee orientation reviews waste disposal, and soon there will be staff re-training to clearly communicate the waste disposal process.
• As with most sustainability projects, culture change of everyone being an environmental steward takes time. It does not solely live with the GEMs coordinator, and projects are underway to address the culture change that must happen.

12
SUMMARY• For over 100 years, Mercy Health Youngstown
Region has held steadfast to its mission of providing excellent care and serving the surrounding community. In late 2009, Mercy Health leadership decided to expand the servant ministry mission by attempting to fully appreciate the environmental impact that provided services have on the surrounding community. Upon review, a significant opportunity was identified to become better stewards of the environment by reducing the organization’s ecological footprint.
• In 2010 Mercy Health started its journey towards embracing and practicing systems, processes and metrics that will drive continuous improvement towards achieving environmental sustainability.
• As an organization, sustainability has become a core component of the culture and a key factor in all decisions. The following describes the six year journey Mercy Health has taken towards finding sustainable solutions to reduce its impact on both the environment and the surrounding community in the Mahoning Valley.
Mercy Health—Youngstown Region is a three-hospital system within Mercy Health
Represents 930 beds
1,400+ physicians and dentists
Mercy Health Youngstown
THE OPPORTUNITYMercy Health’s environmental mission calls for the promotion of environmental stewardship by establishing and monitoring metrics for environmental initiatives that are reported to the leadership team.
THE STRATEGY AND IMPLEMENTATION PROCESSTo accomplish its environmental mission, Mercy Health has identified different priorities and goals that foster a greener community through environmental protection. The priority of

13
greater community health has manifested in two goals: the diversion of medical waste and elimination of lead poisoning in children.
Reducing Pharmaceutical WasteTo divert pharmaceutical wastes from wastewater and landfills, Mercy Health is participating in Stericycles Pharmaceutical Waste Compliance Program via the RX Waste Compliance Service, which helps Mercy Health manage prescription waste in compliance with federal regulations. Mercy Health continuously educates the community and hosts prescription drug take-back events in partnership with the Drug Enforcement Administration. Mercy Health initiatives to reduce pharmaceutical waste seek to remain compliant with best practices.
Decreasing Lead Poisoning in ChildrenEliminating lead poisoning in children is addressed through lead screening clinic at the St. Elizabeth Youngstown Hospital, aiming to increase the number of children screened while adhering to best practices standards. The Mercy Health group provides support for the Mahoning County’s Lead based paint Hazard Control Program, demolishing blighted structures and remediation of contaminated yet sound structures.
Promoting System-Wide Energy EfficiencyComplimenting Mercy Health’s two community health goals are the hospital-wide recycling program and the hospital-wide reduce and reuse initiatives that limit the total number of printers and promote two sided copies as well as black and white printing. Mercy’s conversion to Electronic Medical Records via Carepath Software has eliminated paper records, while the cafeteria has eliminated the use of disposable plates. Energy efficient upgrades include LED fixture installation and the optimization of HVAC.
Recently Mercy Health has been enrolled in the Healthier Hospital Initiative’s Leaner Energy Challenge with the goal of reducing greenhouse gas by reducing weather adjusted energy intensity from metered energy use by 3, 5 and 10 percent.
The Environmental Services Department at Mercy Health designs and reviews the usage of green and sustainable chemicals throughout the system’s facilities. They have used the LEED EBOM IEQc3:3 to oversee the transition in purchasing practices resulting in 87 percent green product usage. Further green management practices address noise performance, environmental performance, integrated pest management and supply chain management.
The greatest energy and sustainability accomplishment is the new construction of the St. Elizabeth Boardman Hospital. The 125-patient bed was recommissioned, which resulted in a 15 percent reduction in energy costs, as well as 80 percent of construction waste recycled.
Chemicals Energy Waste Purchasing
Increased lead screening
LEED EBOM IEQc3:3
Resulting in 87 percent Green Chemicals used
Healthier Hospital Initiative Leaner Energy Challenge
LED retrofit
$120,000 in energy efficiency savings
Biosystems Sharps management system
Eliminated paper records/ electronic medical records
Removal of disposable plates from the cafeteria
80 percent recycling rate of construction rate
LEED EBOM IEQc3:3
Benefits and Results
Challenges and Lessons LearnedWith any large-scale program and implementation process, there are bound to be speedbumps along the way. Some of the challenges revolved around the aging infrastructure of Mercy Health’s buildings.
• Both St. Joseph and St. Elizabeth use a labor-intensive method to collect and segregate waste. It is a large enough undertaking to collect solid and regulated medical waste—then you start to add in hundreds of pounds of recyclables each week, it can become cumbersome to manage. With the uncertainties in health care these days, resources are at a premium, and as a department/ organization, you need to make the decision to become more efficient in other areas to not compromise the sustainability program.
• Staff turnover can quickly become an agent that stalls your program. When key stakeholders of your sustainability
program either leave the organization, or go onto other duties, it is vital that you reel in those folks’ replacements or find new, passionate folks who share in the mission of the program. Ultimately, this is not the work of one person or one group of people, the entire organization needs to buy into it.
• With that said, it is acceptable to go through a “restart”. Understanding the weaknesses of the program will ultimately allow you to give an honest assessment of where you are at, and where you need to go. Through time, the accessibility of assets (or actual recycle bins) becomes aged. You must make the commitment to put the dollars aside to pay for new access points to ensure recycling is easy for everyone, both employees and public alike.

14
SUMMARY
• Mount Carmel Health System created a system-wide green team, committed to all six Healthier Hospitals Challenges and created a shared goal/purpose statement.
• As a result of these efforts, Mount Carmel became an early participant in a by-product synergy network.
• Recycling efforts at Mount Carmel East in just one year have saved the equivalent of 2,298 barrels of oil, reduced the equivalent of 386.4 metric tons of Greenhouse Gas emissions, resulting in a Net Energy savings of 7,573.5 British Thermal Units and saved the equivalent of 3,463 trees.
Mount Carmel is a four-hospital system
Central Ohio
10,900 colleagues
2,100 Physicians
900+ volunteers
Mount Carmel Health System
THE OPPORTUNITYThe Catholic health ministry is called to act responsibly toward the environment to show respect for all creation and to promote the health of communities and the world.
THE STRATEGY AND IMPLEMENTATION PROCESSThe first step towards energy efficiency and sustainability was to develop the first Mount Carmel Health System Green Team. Practices relative to environmental sustainability and good stewardship of resources were already in place at Mount Carmel, but there weren’t mechanisms to support these activities and report. Mount Carmel needed a team that could pull the activities together to avoid duplication and assign to the right stakeholders for follow-thru.
Developing the Green Team
The Green Team is comprised of representatives from multiple hospital departments to include representation from the entire health system. There are currently 20 members, which include one consultant from the Ohio By-Product Synergy network.

15
The team meets bi-monthly and is approved by the senior vice president of Mount Carmel’s Human Resources department.
The Mount Carmel Green Team’s mission is to continuously improve the health of communities. The Green Team builds organizational awareness to develop an environmentally conscious culture in the pursuit of lowering environmental impact through sustainable use of resources. The Green Team will pursue and take actions involving green initiatives and new opportunities for strengthening Mount Carmel’s commitment to environmental sustainability.
Mount Carmel Green Team accomplishments
• Participation in the Healthier Hospitals Initiative
• Member of the Ohio By-Product Synergy Network
• Representation on the OHA Environmental Leadership Council and in 2014 served as P2 University faculty
• Hospital garden at Mount Carmel St. Ann’s that can be used for diabetic education and harvesting foods to donate to food bank
• Reduced paper consumption by 40 tons annually
• Solvent Reuse Program which reuses the material as a product to clean railroad cars
• Mount Carmel West has received ENERGY STAR recognition and is participating in AEP’s Continuous Energy Improvement
• 2014 Mount Carmel Medication Disposal Day
• Ohio collected 21,197 pounds of medication for disposal. Several Green Team members participated. Mercury thermometers were also collected. Mount Carmel had two collection points. Mount Carmel Health System’s headquarters collected 57 pounds and Mount Carmel St. Ann’s collected 137 pounds
• MORPC: Be Air Aware in Central Ohio—Mount Carmel is working with MORPC and will be receiving air quality alerts for projected poor air quality days in 2015. These alerts will be sent the day before, so Mount Carmel hospitals are advised and colleagues can act to help reduce the impact.
• Recycling partnership with Green IT
• System-wide meatless Mondays
• Executed a Green Team website
Chemicals Waste Purchasing Recycling Food
Solvent reuse project 20 percent reduction in food waste and hospital garden
5-10 percent radioactive mixed wastes diverted from landfills
Reduced paper waste by 40 tons per year
Hospital garden
25-36 percent with goal of 40 percent
System-wide meatless Mondays
Hospital garden used as a diabetic patient education space
Benefits and Results
Challenges and Lessons Learned• Since turnover or staff changes occur, especially among key
contract staff, be sure to have at least three organizers for managing the Green Team or related events.
• To encourage engagement and participation, ensure that a minimum amount of time is spent by members at meetings.
• Communicate in such a way that colleagues understand environmental sustainability in order to adapt to related/requested changes (i.e. utilizing paper recycle containers,
turning off lights) and telling the story in a compelling manner.
• Ensure coordination with all those that are involved in event planning, sustainable changes or consultant work, including housekeeping, dietary, property management, design and constructions and communications department. A coordinated effort with all stakeholders is necessary for this work.

16
THE OPPORTUNITYTriHealth recognized the savings opportunity as well as the community benefit by having a focused effort on sustainability. After a pilot program to demonstrate the value of a dedicated sustainability employee, leadership moved forward with a full-time sustainability manager.
THE STRATEGY AND IMPLEMENTATION PROCESSThe Green Committee expanded and split to form two site committees, one at Bethesda North Hospital and one at Good Samaritan Hospital. The team reviewed and amended the Environmental Commitment Statement to include aspects of sustainability beyond waste management such as energy and water conservation, chemicals and food. A strategic planning session was held in the fall of 2014 to develop an organizational strategy and goals for sustainability. Progress and goals were shared with the CEO, vice presidents and directors at a leadership meeting.
Community engagement efforts were taken on by hosting two Earth Day volunteer events for Cincinnati Parks, participating in Green Umbrella (a local sustainability non-profit), becoming a member of the Greater Cincinnati Green Business Council and supporting the Taking Root campaign on Make-A-Difference Day in October with planting trees on six TriHealth sites. The internal sustainability webpage now includes resources for staff to engage at work and home, highlights internal success stories and has a reusable furniture and
SUMMARY
• TriHealth Good Samaritan and Bethesda North hospitals developed strategic sustainability plans and system budgets.
• TriHealth received a local county grant to implement and expand mixed recycling programs.
• Given leadership support for these efforts, TriHealth achieved such results through the coordinated effort of the sustainability manager.
TriHealth Good Samaritan Hospital
TriHealth Bethesda North Hospital
ACCOMPLISHMENTS SINCE WINNING THE MELVIN CREELEY AWARD• TriHealth Bethesda North is now at a nearly
25 percent recycling rate and Good Samaritan Hospital at 19 percent, in part due to the waste efforts such as:
• Implemented a single-stream medical materials recycling program that began in the operating rooms that includes all clean plastics (blue wrap, peel packs, Tyvek, basins, trays and bags), foil packaging and instrument and supply boxes
• Expanded the device collection program to include invasive devices from the operating rooms for reprocessing
• Strengthened community engagement through annual sponsorship and volunteering at the Ohio River Sweep, a cleanup effort for the Ohio River and hosting an annual community recycling drop-off event that includes universal waste, electronics, medication disposal and document shredding
• Provided educational opportunities to team members through Lunch and Learns on the following topics: Backyard Composting, Sustainable Backyards and LEED 101
• Eliminated hand soaps that contain Triclosan
• TriHealth Bethesda North achieved a 63 Energy Star rating and Good Samaritan Hospital achieved Energy Star certification in 2016 with a 78 rating
• Achieved Practice GreenHealth’s Making Medicine Mercury Free award
TriHealth Good Samaritan and Bethesda North Hospitals

17
equipment forum where TriHealth staff can first look for items to be reused before deciding to purchase new.
TriHealth received a large grant from Hamilton County to implement basic recycling programs across a dozen of its facilities. This has involved a lot of planning, education and strategizing before TriHealth moved to the implementation
phase. In addition, TriHealth was awarded the Recycling at Work Program of the Year Award from Hamilton County’s Recycling and Solid Waste District for programs with recycling blue wrap and diverting medical supplies, metal furniture and equipment. TriHealth was also awarded the Making Medicine Mercury Free award from Practice Greenhealth for eliminating all sources of mercury in the hospital.
Hospital Food Recycling RMW
SUD Reprocessing Savings (2013–2014)
TriHealth Good Samaritan
TriHealth Bethesda North
Farmer’s Market
n/a
13.98 percent
17.3 percent
8.3 percent
9.83 percent
n/a
$645,202
Benefits and Results
Challenges and Lessons Learned• In a large organization, making significant changes takes
patience and time as many departments and leaders are involved in the process. Effective and timely communication is the key to successful programs and minimal delays. Input in the beginning and clear understanding drives initiatives forward and maintains the momentum.
• Since sustainability touches every function of a hospital, narrowing the focus on a few programs and changes at a time rather than many topics and small projects that differed between sites, proved to be more effective.
• A major challenge was finding space to stage recyclables. Solutions for this issue were site specific and required creative thinking with vendors and other stakeholders.
• Talking to waste vendors about sustainability goals created new opportunities and outlets for materials. For example, the blue surgical wrap recycling program happened by reaching out to vendors and asking if they would accept the product for recycling.
• The recycling rate dropped at Good Samaritan Hospital in 2014 because of equipment failure with the cardboard compactor and the lengthy process to get capital approved for repair. The hospital could see that the recycling program was saving money with the ability of data tracking of the recycling rate and increased cost of recyclables going to the landfill when the cardboard compactor wasn’t working.
• Having a data tracking software program served as a valuable resource, not only to detect change but to also provide a clear baseline and the ability to set goals.

18
THE OPPORTUNITYUniversity Hospitals is committed to sustainability to enhance the health and wellbeing of patients, employees and the local community, and to steward the natural environment. For the past few years, the system has undertaken a series of sustainability-driven initiatives to drive quality outcomes within the hospitals and throughout the communities served.
THE STRATEGY AND IMPLEMENTATION PROCESSIn 2014, UH sought to demonstrate progress through the development of the second annual Progress Report on Sustainability, which details the system’s initiatives, opportunities and priorities through 2013. As the report suggests, the mission is to integrate environmental, social and economic considerations into every aspect of business practices to advance the health system’s commitment to quality, safety, efficiency and wellness.
In addition to documenting improvement within the 2014 Progress Report on Sustainability, dozens of other efforts
SUMMARY
• Routinely convened a system-wide sustainability council, committed to all six Healthier Hospitals Challenges and created a shared goal/purpose statement
• The Greening UH program earned significant leadership support, resulting in an expansion to a team of three in the Sustainability Office
• Significant improvements and progress through the pledge to purchase flame retardant free furnishing in sprinkler areas, improvement in antibiotic free meat purchases and a 31 percent system-wide recycling rate
University Hospitals Health System
15 hospitals
24,000 employees
ACCOMPLISHMENTS SINCE WINNING THE MELVIN CREELEY AWARD• The Employee Energy Challenge to reduce
energy use at work and at home had over 1,000 employees participate. Home solar programs were promoted through partnership with Geostellar and local Cuyahoga County solar aggregation program.
• LED Retrofit plan designed for health system started incremental adoption beginning in late 2016.
• There was a strong focus in 2015-2016 on transportation initiatives as opportunities to positively impact the social determinants of health in the communities UH anchors, including title sponsorship of the Cleveland and Cuyahoga County bikeshare system, called UHBikes, community focused bike rides with UH bike medics and regular participation in local and regional transportation planning partnerships.
• The local and Sustainable percent of total food spending for 2016 was 9.55 percent.
• In 2016, 95 percent of the system surgical kits were reviewed saving the system $109,050.20 in tools and equipment removed from the kits.
• Triclosan-free soap has been adopted by UH Rainbow Babies & Children’s Hospital as well as in administrative buildings as part of antimicrobial stewardship.
University Hospitals Health System

19
were made to drive sustainability-related outcomes such as pollution prevention, safer working and healing spaces, and environmentally preferable purchasing. Below is a brief description of some key highlights for the year:
Engagement in Healthier Hospitals
In late 2012 all of University Hospital’s major medical centers signed on to all six of the Healthier Hospitals Initiative Challenge Areas, which has provided a health care community-supported framework for organizing, tracking and reporting sustainability efforts from 2013 onward. The value these efforts is the motivation and reinforcement University Hospital’s received from being part of a nationwide movement around tracking sustainability efforts in health care. Goals based primarily around these initiatives are implemented and reported through the coordinated sustainability structure from department-level Green Teams to facility level Sustainability Committees to the system level Sustainability
Council to System Senior Leadership. This organizational structure was developed thoughtfully using a model similar to preexisting successful models in our health system, such as the Community Benefit program.
UH’s partnership with a regional company, established in late 2012, to utilize tracking software around the sustainability priority areas has been pivotal in recording the state of the system and projecting future progress. Utility and purchasing data is tracked and expressed in dashboard format with this software, allowing for concise and meaningful reporting of sustainability efforts to the C-suite and other stakeholders.
Qualitative sustainability goals are also organized and tracked with this software using Sustainability Scorecards that measure real time progress on any initiative. UH has developed scorecards for all HHI outcome areas to compare progress internally amongst facilities and organize communication during regular sustainability meetings.
Chemicals Food Waste Energy Purchasing
79 percent green cleaners
71 percent flame retardant free furnishing purchases
20 percent antibiotic free meat purchases
5 percent local food purchases
31.86 percent recycling rate
6.23 percent RMW
450 employees participated in Energy Competition
LED retrofits in 50 percent of ORs
100 percent EPEAT registered electronics
Increased spending on DEHP/PVC free products by 40 percent
Benefits and Results
Challenges and Lessons Learned• Contract obligations in supply chain currently limit UH’s
agility in reprocessing devices, a large financial savings and positive environmental impact opportunity being pursued by hospitals nationwide. UH Sustainability is working with supply chain leadership on how to address contractual limitations to this and other impactful opportunities related to purchasing, such as the procurement of additional DEHP/PVC-free medical products and medical furnishings free from five targeted chemicals of concern.
• The initiatives expand the system’s impact not only through incremental improvement and implementation, but also in leaps and bounds. UH Sustainability has learned that continuing conversations with key stakeholders, especially with unanticipated slow progress, can suddenly result in a great leap forward in an effort—such as transportation. Relationship cultivation within the organization as well as with closely connected key external stakeholders such as the GPOs, vendors, other community anchors and peer hospital groups help raise the boat in moving the marketplace forward to help UH achieve its goals, and in keeping sustainable health care a successful reality.

Congratulations 2016 OHA Energy Cup Winners
155 E. Broad St., Suite 301 Columbus, OH 43215
T: 614-221-7614ohiohospitals.org
12355 Sunrise Valley Dr., Suite 680 Reston, VA 2019
Contact Rick Sites, Regulatory CounselOhio Hospital Association
LARGE HOSPITAL
Southern Ohio Medical Center
Finalists:
Mount Carmel East
Mount Carmel St. Ann’s
SMALL HOSPITAL
Barnesville Hospital
Finalists:
Mercy Willard Hospital
Trinity Hospital Twin City (Dennison)
NON-HOSPITAL
Woodley Medical Center (Toledo)
Finalists:
Twinsburg Family Health & Surgery Center
Marymount Medical Center (Garfield Heights)

HTTPS://WWW.HFMMAGAZINE.COM/ARTICLES/3210-CLEVELAND-CLINIC-MAKES-CARBON-NEUTRALITY-ITS-NEWEST-SUSTAINABILITY-GOAL SUSTAINABILITY
Cleveland Clinic makes carbon-neutrality its newest sustainability goal Health system plans to reach goal through renewable energy purchases, continued energy efficiency November 30, 2017 Jeff Ferenc
Cleveland Clinic is expanding successful energy-saving strategies it has implemented and purchasing renewable energy to reach its goal of being carbon-neutral in 10 years. Photo courtesy of Cleveland Clinic

For the past decade, Cleveland Clinic has embarked on a systemwide sustainability drive that could make some health systems green with benign envy.
The effort has encompassed energy and water-reducing strategies, energy-efficient facility design, environmentally friendly purchasing and an aggressive recycling effort. And everyone from the top down pitches in — it’s all part of the culture at Cleveland Clinic.
So far, so great. In 10 years, the hospital and health system have saved an estimated $50 million in energy costs and $30 million in materials purchased, diverted more than 100,000 tons of material from landfills and saved more than 600,000 trees, says Jon Utech, director of Cleveland Clinic’s office for a healthy environment.
Cleveland Clinic hosts tree planting event with participation of community residents, students and caregivers. Photo courtesy of Cleveland Clinic
“Our CEO, Toby Cosgrove, saw the importance of the environmental-sustainability movement and its relevance for health care,” Utech says. “Environmental health and human health are linked, so we’ve been working on this for 10 years.”
Impressive results, but Cleveland Clinic has established a new loftier set of sustainability objectives going forward, including becoming carbon-neutral in 10 years.
The health system plans to accomplish that by expanding the successful use of energy-saving strategies it has implemented and by purchasing renewable energy such as wind and solar from the power grid. It also will implement on-site energy systems where it makes sense.
The purchases will offset greenhouse gas emissions generated by energy used by health care and administrative facilities on the main campus, in the region and even out of state, Utech says.
The strategies include expanding the installation of LED lighting, which will be used in all new construction, and retrofitting fixtures in existing facilities by the third quarter of

2018, he says. More than 400,000 LED tubes have been installed in facilities, saving more than $3 million in energy costs annually.
Operating room (OR) setbacks have been a key energy saver in the past and part of the plan going forward, too, he says. The number of air exchanges are drastically reduced when ORs are not in use and are maintained at the required rate rather than exceeding it during surgeries, he says.
The optimization of HVAC equipment and especially chillers is a major strategy for cutting energy use now and in the future. Those steps help to maintain patient room temperature ranges to save more energy, he explains.
Through its online Energy Savings & You program, Cleveland Clinic engages its 51,000 staff and its contractors to save energy whenever possible. For staff, that could be as simple as turning off the lights, TVs and computers to save energy, he says.
While the health care system diverts 38 percent of all nonregulated waste from the landfill now, the goal is to get that level to 100 percent in 10 years. It will continue to encourage staff to recycle and also increase use of recyclable packaging with help from its suppliers, he says.
Another goal is to reduce water consumption by 10 percent by installing low-flow showers and faucets in new construction and existing buildings over time. Cooling-tower water use will be optimized too, he says. Total savings will add up to about $1 million annually.
“We ultimately are trying to impact the health of the population that we serve and these goals guide our work,” Utech says about the ongoing sustainability initiative. “We also want to inspire others to follow us since improving air quality, reducing carbon pollution and improving water quality benefits everyone.”

http://www.uhhospitals.org/rainbow/uh-rainbow-center-for-women-and-children
UH Rainbow Center for Women & Children – Opening in Spring 2018 Supporting Families and Community New Home for Rainbow Ambulatory Practice and MacDonald Women’s Health Clinics
UH Rainbow Center for Women & Children will be the new home for the Rainbow Ambulatory Practice and MacDonald Women’s Health Clinic, currently located on the first floor of University Hospitals Rainbow Babies & Children’s Hospital. These outpatient practices have grown significantly over the past decades, seeing more than 40,000 patient visits each year. These clinics are primary sites for our training of the next generation of pediatric and OB-GYN clinicians. A Conveniently Located, Healthy Building The 40,000-square-foot, three-story facility will be located in the heart of Cleveland’s Midtown neighborhood, at the corner of Euclid Avenue and East 59th Street, two miles west of University Hospitals Cleveland Medical Center in University Circle.

Conveniently located in close proximity to the RTA HealthLine and with ample space for free parking, the freestanding outpatient center will improve access to quality health care for residents of Cleveland and surrounding communities. With ongoing input and partnership from patients, families and community representatives, the Center will aim to optimize patient experience, and to provide an inviting and accessible campus. The center will be part of a walkable and vibrant neighborhood, with beautiful garden space. Our commitment to environmental stewardship is a reflection of our care for the communities we serve. The center will use healthy materials for optimal indoor air quality, and onsite solar panels will be a great investment in clean energy. The building is expected to receive the U.S. Green Building Council’s Leadership in Energy & Environmental Design (LEED) Gold designation.
Made Possible through Community Support and Generous Donations The UH Rainbow Center for Women & Children $26 million capital project was funded through generous philanthropy and New Markets Tax Credits (NMTC) with PNC, Cleveland Development Advisors, and Northeast Ohio Development Fund. PNC allocated $5 million in Federal NMTC to the project, while the Greater Cleveland Partnership’s real estate affiliate, Cleveland Development Advisors and Northeast Ohio Development Fund (a CDE controlled by the Cleveland-Cuyahoga County Port Authority) allocated an additional $16 million. The project was also the recipient of an Ohio New Markets Tax Credit allocation. Significant philanthropic gifts include $5 million from both Rainbow Babies & Children’s Foundation and the George M. & Pamela S. Humphrey Fund, and $1 million each from the Edward A. & Catherine L. Lozick Foundation, the Jack, Joseph and Morton Mandel Foundation and the Mandel Supporting Foundations, and Sylvia Oliver and her late husband Heath.

september 2015 r-15-09-A
CLEANER AIR AND BETTER HEALTH: THE BENEFITS OF OHIO’S RENEWABLE AND EFFICIENCY STANDARDS A REPORT BY: ENVIRONMENTAL LAW & POLICY CENTER, LEAGUE OF CONSERVATION VOTERS, NATURAL RESOURCES DEFENSE COUNCIL, AND OHIO ENVIRONMENTAL COUNCIL

ABOUT ENVIRONMENTAL LAW & POLICY CENTERThe Environmental Law & Policy Center is the Midwest’s leading public interest environmental legal advocacy organization. We develop strategic campaigns to protect natural resources and improve environmental quality. Our multi-disciplinary staff employs teamwork approaches using legal, economic, and public policy tools to produce successes that improve our environment and economy.
ABOUT LEAGUE OF CONSERVATION VOTERSLCV works to turn environmental values into national, state and local priorities. LCV works on the national and state level to advocate for sound environmental laws and policies, hold elected officials accountable for their votes and actions, and elect pro-environment candidates who will champion our priority issues.
ABOUT NRDCThe Natural Resources Defense Council is an international nonprofit environmental organization with more than 1.4 million members and online activists. Since 1970, our lawyers, scientists, and other environmental specialists have worked to protect the world’s natural resources, public health, and the environment. NRDC has offices in New York City, Washington, D.C., Los Angeles, San Francisco, Chicago, Montana, and Beijing. Visit us at nrdc.org.
ABOUT OHIO ENVIRONMENTAL COUNCILThe mission of the Ohio Environmental Council is to secure healthy air, land, and water for all who call Ohio home. Using legislative initiatives, legal action, scientific principles, and statewide partnerships, the Ohio Environmental Council advocates for a healthier, more sustainable Ohio.
NRDC Chief Communications Officer: Lisa BenensonNRDC Deputy Director of Communications: Lisa GoffrediNRDC Policy Publications Director: Alex KennaughDesign and Production: www.suerossi.com
© Natural Resources Defense Council 2015
ACkNOWLEDGMENTS This paper was made possible through the generous time and efforts of Conrad Schneider of the Clean Air Task Force and David Schoengold of MSB Energy Associates. The authors gratefully acknowledge the review comments of Starla Yeh, Kevin Steinberger, and Tina Swanson of the Natural Resources Defense Council and Tracy Sabetta of the Moms Clean Air Force. Last, we would like to thank Mary Heglar of the Natural Resources Defense Council for the publication design.
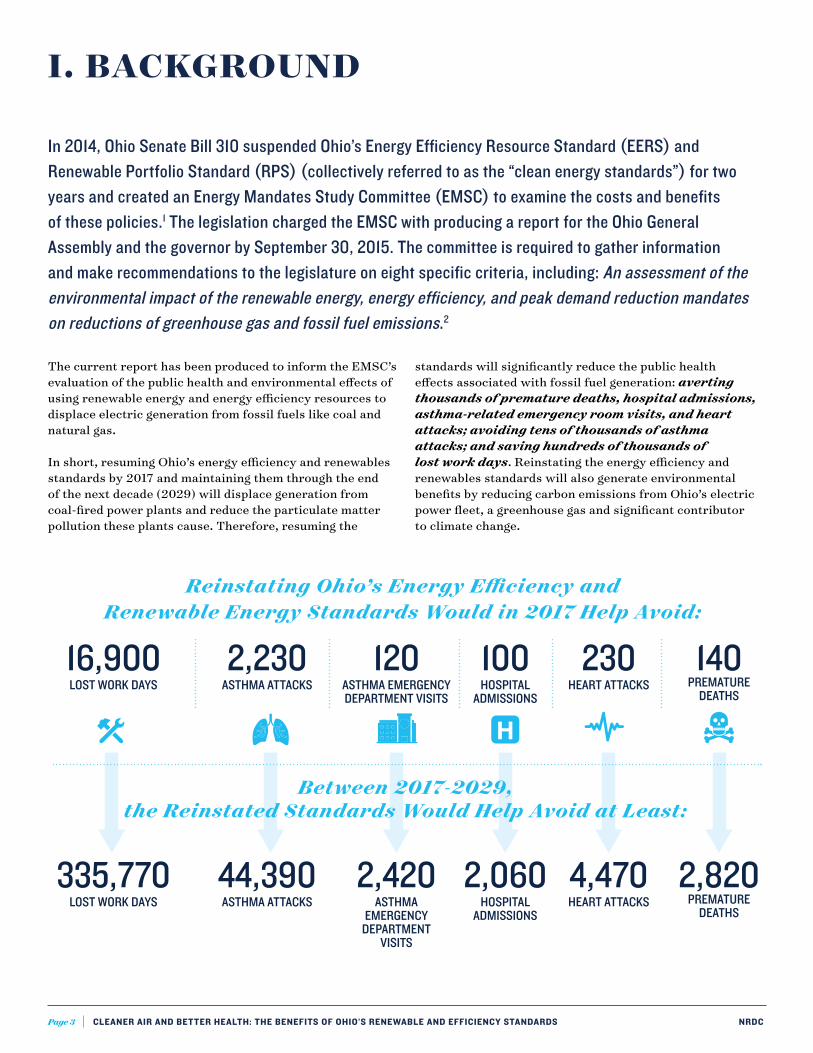
Page 3 CLeANer AIr AND better HeALtH: tHe beNeFIts OF OHIO’s reNeWAbLe AND eFFICIeNCY stANDArDs NrDC
In 2014, Ohio Senate Bill 310 suspended Ohio’s Energy Efficiency Resource Standard (EERS) and Renewable Portfolio Standard (RPS) (collectively referred to as the “clean energy standards”) for two years and created an Energy Mandates Study Committee (EMSC) to examine the costs and benefits of these policies.1 The legislation charged the EMSC with producing a report for the Ohio General Assembly and the governor by September 30, 2015. The committee is required to gather information and make recommendations to the legislature on eight specific criteria, including: An assessment of the environmental impact of the renewable energy, energy efficiency, and peak demand reduction mandates on reductions of greenhouse gas and fossil fuel emissions.2
The current report has been produced to inform the EMSC’s evaluation of the public health and environmental effects of using renewable energy and energy efficiency resources to displace electric generation from fossil fuels like coal and natural gas.
In short, resuming Ohio’s energy efficiency and renewables standards by 2017 and maintaining them through the end of the next decade (2029) will displace generation from coal-fired power plants and reduce the particulate matter pollution these plants cause. Therefore, resuming the
standards will significantly reduce the public health effects associated with fossil fuel generation: averting thousands of premature deaths, hospital admissions, asthma-related emergency room visits, and heart attacks; avoiding tens of thousands of asthma attacks; and saving hundreds of thousands of lost work days. Reinstating the energy efficiency and renewables standards will also generate environmental benefits by reducing carbon emissions from Ohio’s electric power fleet, a greenhouse gas and significant contributor to climate change.
I. BACKGROUND
16,900LOST WORK DAYS
335,770LOST WORK DAYS
2,230ASTHMA ATTACKS
120ASTHMA EMERGENCYDEPARTMENT VISITS
100HOSPITAL
ADMISSIONS
230HEART ATTACKS
140PREMATURE
DEATHS
4,470HEART ATTACKS
2,820PREMATURE
DEATHS
Reinstating Ohio’s Energy E�ciency and Renewable Energy Standards Would in 2017 Help Avoid:
44,390ASTHMA ATTACKS
2,420ASTHMA
EMERGENCYDEPARTMENT
VISITS
2,060HOSPITAL
ADMISSIONS
H
Between 2017-2029,the Reinstated Standards Would Help Avoid at Least:

Page 4 CLeANer AIr AND better HeALtH: tHe beNeFIts OF OHIO’s reNeWAbLe AND eFFICIeNCY stANDArDs NrDC
Fossil fuel–fired power plants, and especially coal plants, emit pollutants that are harmful to human health, including particulate matter.3 These emissions are related to increased frequency and severity of asthma attacks and other respiratory diseases and are known to contribute to heart attacks, cardiovascular diseases, and premature deaths.4 Replacing fossil generation with cleaner energy sources can significantly reduce these negative health effects.
While this report does not specifically address toxic air emissions, coal plants also produce pollutants such as mercury, lead, polycyclic aromatic hydrocarbons, and acid gases, which can cause cancer, harm the developing nervous systems of children, and pose other human health hazards.5 Using efficiency and renewable resources to displace electric generation from coal plants will yield significant co-benefits for the public—beyond those described in this report—by reducing these toxic air pollutants.6
Finally, fossil fuel combustion produces carbon pollution that contributes significantly to a warming global climate,7 a trend that is already having adverse impacts in Ohio. For example, extreme rainfall events have become nearly 50 percent more frequent in Ohio over the past 60 years.8,9
These heavy rains not only increase the risk of flooding, the second deadliest of all weather-related hazards in the nation, but can also lead to drinking water contamination.10,11 Ohioans are experiencing this firsthand as increasingly intense rainfall events contribute to now-frequent toxic algae blooms in Lake Erie.12,13 Transitioning away from fossil generation will be a key step in mitigating the worst environmental effects of climate change in the coming years.
These problems are of particular concern in Ohio. Prior to the establishment of the state’s clean energy standards, Ohio relied almost exclusively on fossil fuels to generate electricity, with coal accounting for 85 percent of its electric power in 2008.14 Despite some progress made over the past six years in transitioning to cleaner energy sources, coal-fired power plants still provided 67 percent and natural gas plants 18 percent of Ohio’s electricity in 2014.15 Ohio’s power plants are among the largest emitters of carbon pollution of all state generation fleets in the nation.16
II. METHODS
The public health findings described in this report were generated by converting Ohio’s EERS and RPS targets into quantitative environmental benefits and reduced public health effects using the Clean Power Plan Compliance Tool (M.J. Bradley and Associates) and the Powerplant Impact Evaluator (PIE) model, the latter of which incorporates the same peer-reviewed methodology used by the U.S. Environmental Protection Agency.17,18
The analyses were conducted in two parts. First, to measure the environmental effects of the EERS and RPS, the M.J. Bradley model was used to project the annual changes in fossil generation that would result if Ohio reinstated the EERS and RPS in 2017 and implemented these policies through 2029, relative to 2012 levels. To provide a conservative range of results across different assumptions, two scenarios were modeled. In one scenario, each incremental megawatt hour (MWh) of renewable energy and energy efficiency generation displaces 0.6 MWh of coal generation (i.e., 1:0.6 displacement), with the remaining 0.4 MWh displacing natural gas-fired generation.19 The other scenario is even more conservative, with each MWh of renewable energy and energy efficiency displacing 0.4 MWh of coal (1:0.4). The corresponding carbon pollution reductions that would result from full implementation of the clean energy standards were then calculated under each of these two scenarios.
Second, the Clean Air Task Force (CATF) used the PIE model to convert the M.J. Bradley results into avoided health effects from the displacement of fossil generation with cleaner sources of electricity.
Further detail on the methodology is provided in Appendix A.

Page 5 CLeANer AIr AND better HeALtH: tHe beNeFIts OF OHIO’s reNeWAbLe AND eFFICIeNCY stANDArDs NrDC
This report quantifies the specific avoided public health effects that would result from reinstating Ohio’s RPS and EERS through at least 2029.
In the seven years since their passage, Ohio’s clean energy standards have reduced pollution and helped avert adverse public health effects by replacing coal-fired generation and by decreasing overall electricity demand, which further reduces coal generation. The two-year freeze imposed by Senate Bill 310 stalled that progress. However, allowing the standards to resume in 2017 will put Ohio back on track to achieving substantial decreases in harmful pollution through a transition to clean energy.
We find that, along with other planned changes to Ohio’s electricity mix, restoring the EERS and RPS by 2017 would:20
n In 2017 alone (with the freeze lifted), reduce particulate matter pollution enough to prevent at least 16,900 lost work days, 2,230 asthma attacks, 120 asthma emergency department visits, 100 hospital admissions, 230 heart attacks, and at least 140 premature deaths;
n Prevent at least 335,770 lost work days, 44,390 asthma attacks, 2,420 asthma emergency department visits, 2,060 hospital admissions, 4,470 heart attacks, and at least 2,820 premature deaths in total between 2017 and 2029; and
n Reduce Ohio’s annual carbon pollution by about 10 million tons between 2017 and 2029—equivalent to avoiding emissions from the annual electricity consumption of 1 million homes.21
By allowing Ohio’s clean energy standards to resume in full by 2017, the Ohio legislature will protect thousands of people—particularly vulnerable populations such as children and the elderly—from premature deaths, heart attacks, emergency room visits, asthma attacks, and lost work days.22
It is also notable that the environmental benefits of reduced carbon pollution would help Ohio satisfy the Clean Power Plan, which was finalized by the U.S. Environmental Protection Agency on August 3, 2015.23 These limits give states flexibility and discretion to design a customized plan that capitalizes on each state’s own energy mix and policy goals. With this flexibility, Ohio has the option to incorporate renewable energy and energy efficiency into its strategy to reduce carbon emissions. Recent analysis indicates that by lifting the freeze on Ohio’s clean
III. FINDINGS
energy standards, along with other planned changes to its power sector, the state would dramatically reduce its carbon emissions and meet its Clean Power Plan limit.24 Moreover, prior analysis of the proposed Clean Power Plan indicates that relying on the EERS and RPS can help Ohio cost-effectively reduce carbon emissions while lowering electricity bills for Ohioans.25
On the next page are detailed findings of the health effects projected to occur when fossil generation in Ohio is displaced, under two scenarios. As described above, scenario 1 conservatively assumes that each MWh of renewable energy and energy efficiency generation displaces 0.6 MWh of coal. Scenario 2 is even more conservative and assumes that each MWh of renewable energy and energy efficiency displaces 0.4 MWh of coal. It is important to note that neither situation eliminates coal from Ohio’s resource mix. Rather, each scenario reduces coal generation proportionately as more renewable energy and energy efficiency enter the system.
As shown in Tables 1 and 2, resuming the EERS and RPS in full by 2017 would yield significant benefits by avoiding the harmful public health effects of fossil fuel generation, with these benefits increasing each year as the state’s clean energy standards ramp up. This is true under both scenarios considered.
Ohio’s clean energy standards can also substantially reduce the carbon pollution associated with the state’s power sector. Carbon emissions reductions from Ohio’s fossil fuel–fired power plants will generate environmental benefits by reducing a key greenhouse gas that contributes to climate change.26 Further information is provided in Appendix A demonstrating the significant downward trajectory of carbon emissions between 2017 and 2029 under both coal displacement scenarios analyzed.
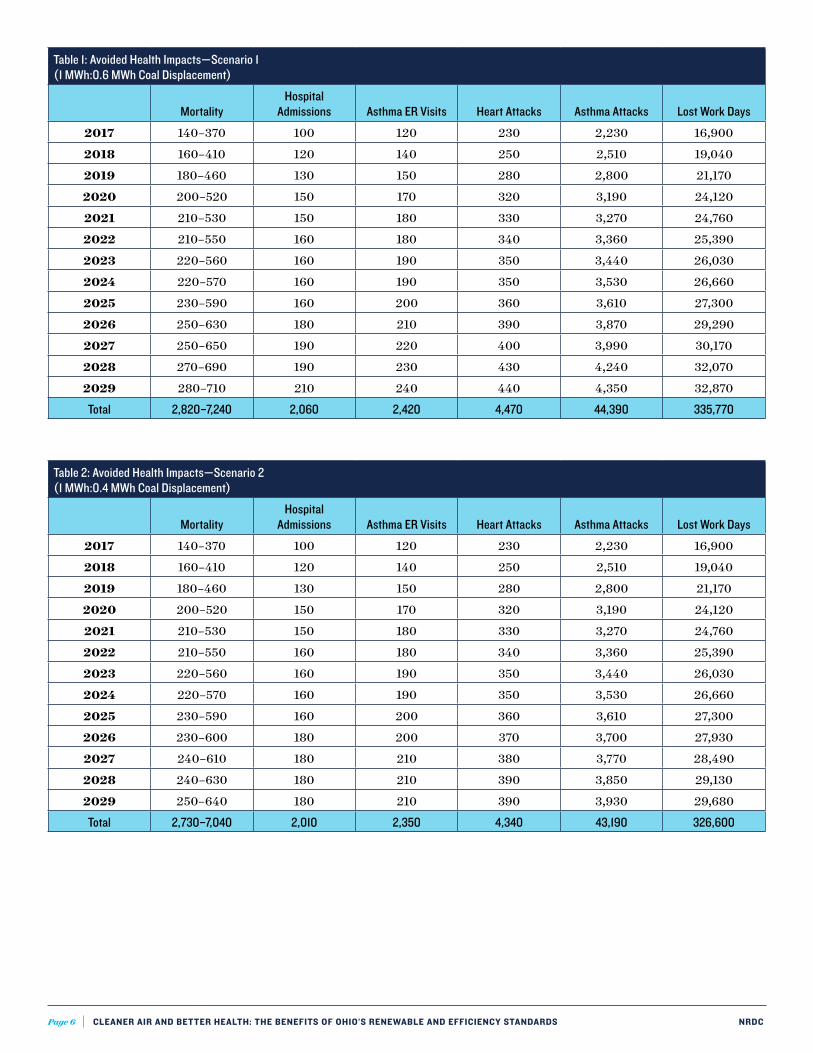
Page 6 CLeANer AIr AND better HeALtH: tHe beNeFIts OF OHIO’s reNeWAbLe AND eFFICIeNCY stANDArDs NrDC
Table 1: Avoided Health Impacts—Scenario 1 (1 MWh:0.6 MWh Coal Displacement)
MortalityHospital
Admissions Asthma ER Visits Heart Attacks Asthma Attacks Lost Work Days
2017 140–370 100 120 230 2,230 16,900
2018 160–410 120 140 250 2,510 19,040
2019 180–460 130 150 280 2,800 21,170
2020 200–520 150 170 320 3,190 24,120
2021 210–530 150 180 330 3,270 24,760
2022 210–550 160 180 340 3,360 25,390
2023 220–560 160 190 350 3,440 26,030
2024 220–570 160 190 350 3,530 26,660
2025 230–590 160 200 360 3,610 27,300
2026 250–630 180 210 390 3,870 29,290
2027 250–650 190 220 400 3,990 30,170
2028 270–690 190 230 430 4,240 32,070
2029 280–710 210 240 440 4,350 32,870
Total 2,820–7,240 2,060 2,420 4,470 44,390 335,770
Table 2: Avoided Health Impacts—Scenario 2 (1 MWh:0.4 MWh Coal Displacement)
MortalityHospital
Admissions Asthma ER Visits Heart Attacks Asthma Attacks Lost Work Days
2017 140–370 100 120 230 2,230 16,900
2018 160–410 120 140 250 2,510 19,040
2019 180–460 130 150 280 2,800 21,170
2020 200–520 150 170 320 3,190 24,120
2021 210–530 150 180 330 3,270 24,760
2022 210–550 160 180 340 3,360 25,390
2023 220–560 160 190 350 3,440 26,030
2024 220–570 160 190 350 3,530 26,660
2025 230–590 160 200 360 3,610 27,300
2026 230–600 180 200 370 3,700 27,930
2027 240–610 180 210 380 3,770 28,490
2028 240–630 180 210 390 3,850 29,130
2029 250–640 180 210 390 3,930 29,680
Total 2,730–7,040 2,010 2,350 4,340 43,190 326,600

Page 7 CLeANer AIr AND better HeALtH: tHe beNeFIts OF OHIO’s reNeWAbLe AND eFFICIeNCY stANDArDs NrDC
Ohio is currently reviewing its clean energy policies and the EMSC will be making recommendations that determine the future of Ohio’s energy landscape. These recommendations will presumably be based, at least in part, on the projected environmental and public health effects of deploying greater levels of energy efficiency and renewable energy.
Our analyses strongly suggest that reinstating Ohio’s EERS and RPS by at least 2017 and implementing these policies in full through the next decade and a half would help the state shift to clean energy sources, reduce emissions of harmful pollutants, and decrease greenhouse gas emissions.
IV. CONCLUSION
As these findings demonstrate, Ohio’s clean energy policies hold significant untapped potential to protect the environment and safeguard public health, particularly the health of children, pregnant women, the elderly, and other vulnerable populations, as well as those who work and play outdoors.
From the environmental and public health perspective, these policies are performing just as intended when they were first enacted in 2008. Delaying their reinstatement would only withhold these critical benefits from the people of Ohio.
ENDNOTES
1 The standards were established by Ohio Senate Bill 221 (Schuler by Request, 127-GA), archives.legislature.state.oh.us/bills.cfm?ID=127_SB_221.
2 Temp Law , Section 4 (C) (7), page 35, archives.legislature.state.oh.us/BillText130/130_SB_310_EN_N.pdf
3 See Union of Concerned Scientists, “Environmental Impacts of Coal Power: Air Pollution,” http://www.ucsusa.org/clean_energy/coalvswind/c02c.html#.VeXqD_2FOzl; see also American Lung Association, State of the Air 2015, “Particle Pollution: Where Does Particle Pollution Come From?” http://www.stateoftheair.org/2015/health-risks/health-risks-particle.html#wheredoes; U.S. Environmental Protection Agency (hereinafter EPA), “Clean Energy: Air Emissions,” www.epa.gov/cleanenergy/energy-and-you/affect/air-emissions.html.
4 See EPA, “Six Common Air Pollutants,” www.epa.gov/airquality/urbanair. See also EPA, “Particle Pollution: Health,” http://www.epa.gov/airquality/particlepollution/health.html; American Lung Association, State of the Air 2015, “Particle Pollution: What Can Particles Do To Your Health?” http://www.stateoftheair.org/2015/health-risks/health-risks-particle.html#cando.
5 See EPA, “Clean Energy: Air Emissions.” See also EPA, information on the health impacts of mercury, available at www.epa.gov/mercury/effects.htm; arsenic at www.epa.gov/ttnatw01/hlthef/arsenic.html; lead at www.epa.gov/airquality/lead; acid gases at www.epa.gov/acidrain; and polycyclic aromatic hydrocarbons at www.epa.gov/osw/hazard/wastemin/minimize/factshts/pahs.pdf.
6 Schwartz, J., et al., Health Co-Benefits of Carbon Standards for Existing Power Plants, Harvard University, Boston University, and Syracuse University, September 30, 2014, www.chgeharvard.org/sites/default/files/userfiles2/Health%20Co-Benefits%20of%20Carbon%20Standards.pdf.
7 EPA, “Clean Energy: Air Emissions,” www.epa.gov/cleanenergy/energy-and-you/affect/air-emissions.html.
8 Extreme rainfall is classified by identifying the 64 largest 1-day precipitation totals during the 64-year period of analysis. Madsen, T., and N. Willcox. When It Rains It Pours: Global Warming and the Increase in Extreme Precipitation from 1948 to 2011. Environment America Research & Policy Center, 2012.
9 Downer, C., et al., 2014 National Climate Assessment: Midwest, U.S. Global Change Research Program, nca2014.globalchange.gov/report/regions/midwest#intro-section-2.
10 Curriero, F.C., et al. “The Association Between Extreme Precipitation and Waterborne Disease Outbreaks in the United States, 1948–1994.” American Journal of Public Health 91 (2001): 1194-1199.
11 Ashley, S.T., and W.S. Ashley. “Flood Fatalities in the United States.” Journal of Applied Meteorology and Climatology 47 (2008): 805-818, journals.ametsoc.org/doi/pdf/10.1175/2007JAMC1611.1.
12 Ohio State University, “Climate Change Brings Mostly Bad News for Ohio: Big Algae Bloom in Lake Erie, Very Dry 2015 Forecast,” Science Daily, May 20, 2014, www.sciencedaily.com/releases/2014/05/140520120135.htm; National Oceanic and Atmospheric Administration, “NOAA, partners pre-dict severe harmful algal bloom for Lake Erie: Heavy June rains causing heavy nutrient runoff into lake basin,” July 9, 2015, www.noaanews.noaa.gov/stories2015/20150709-noaa-partners-predict-severe-harmful-algal-bloom-for-lake-erie.html.
13 Troy, Tom, “Mayor Collins Speaks on Toledo Water Crisis at Great Lakes Gathering,” Toledo Blade, September 24, 2014, www.toledoblade.com/lo-cal/2014/09/24/Mayor-Collins-speaks-on-Toledo-water-crisis-at-Great-Lakes-gathering.html; Henry, Tom, “Lake Erie algal bloom could grow difficult,” Toledo Blade, August 26, 2015, www.toledoblade.com/local/2015/08/26/Lake-Erie-algal-bloom-could-grow-difficult.html#QSuTOoPzq0GR5bJh.99.
14 Energy Information Administration, “Electricity: Ohio Electricity Profile,” Table 5: Electric Power Industry Generation by Primary Energy Source,” July 8, 2015, www.eia.gov/electricity/state/Ohio.

Page 8 CLeANer AIr AND better HeALtH: tHe beNeFIts OF OHIO’s reNeWAbLe AND eFFICIeNCY stANDArDs NrDC
15 Energy Information Administration, “Ohio: State Profile and Energy Estimates,” last updated March 19, 2015, www.eia.gov/state/?sid=OH.
16 Van Atten, C., A. Saha, and L. Reynolds, Benchmarking Air Emissions, M.J. Bradley & Associates, May 2013, www.mjbradley.com/sites/default/files/Benchmarking-Air-Emissions-2013.pdf. See also Van Atten, C., et al., Benchmarking Air Emissions, M.J. Bradley & Associates, July 2015, www.nrdc.org/air/pollution/benchmarking/files/benchmarking-2015.pdf.
17 See “Clean Power Plan Evaluation Tools,” mjbradley.com/about-us/case-studies/clean-power-plan-evaluation-tools.
18 See Abt Associates Inc., Technical Support Document for the Powerplant Impact Evaluator Software Tool, July 2010, www.catf.us/resources/publications/view/137.
19 1 MWh is equivalent to 1,000 kilowatts of electricity used continuously for one hour.
20 All reductions are relative to 2012 levels. Health impact estimates from the PIE include Ohio as well as downwind areas outside of the state. A substantial portion of the impacts would be felt in-state, however, given the significant proportion of emissions sourced from fossil generation in Ohio as well as the large population centers likely to be affected by pollution emissions.
21 In 2012, 113.93 million homes in the United States consumed 1,375 billion kilowatt-hours of electricity. On average, each home consumed 12,069 kWh of delivered electricity, with about 1,328.0 lbs CO2 per megawatt-hour for delivered electricity, assuming transmission and distribution losses at 7.2%. See EPA, Greenhouse Gas Equivalencies Calculator, www.epa.gov/cleanenergy/energy-resources/calculator.html.
22 M.J. Bradley’s projections account for the two-year delay in implementation of the standards under SB 310. The model assumes that the EERS and RPS are frozen at current levels through the end of 2016, at which point they resume their trajectory. Note that for the purposes of this analysis, 2012 is the baseline to which we compare all other years. A more detailed projection of what might replace the lost output from Ohio’s retiring coal plants if the EERS and RPS were reinstated would require a dispatch model that factors in cost information. This is because even in the absence of SB 310 some renewable energy and energy efficiency, albeit in smaller amounts, will still enter the resource mix based on market forces. Projections of this sort are not within the scope of the M.J. Bradley tool.
23 See EPA, “Clean Power Plan for Existing Power Plants,” August 2015, www2.epa.gov/cleanpowerplan/clean-power-plan-existing-power-plants. See also EPA, “Clean Power Plan: State at a Glance (Ohio),” August 2015, www.epa.gov/airquality/cpptoolbox/ohio.pdf.
24 Natural Resources Defense Council, “Issue Brief: Ohio’s Pathway to Cutting Carbon Polltion,” August 2015, www.nrdc.org/air/clean-power-plan/files/CPP-Ohio-Compliance-IB.pdf.
25 See, e.g., PJM Interconnection, PJM Economic Analysis of EPA’s Proposed Clean Power Plan: State-Level Detail, March 2, 2015, www.pjm.com/~/media/documents/reports/20150302-state-level-detail-pjm-economic-analysis-of-epas-proposed-clean-power-plan.ashx. See also Natural Resources Defense Council, “Ohio and the Clean Power Plan: Affordable, Reliable, Achievable,” June 2015, www.nrdc.org/energy/files/oh-clean-power-plan-IB.pdf; Public Citizen, “Ohio: Clean Power, Clear Savings,” June 16, 2015, www.citizen.org/SSLPage.aspx?pid=6568. While the cited reports analyze Ohio’s potential for cost savings when using clean energy to meet the draft Clean Power Plan, similar analyses of the final rules are pending and will be available in the fall of 2015.
26 See EPA, “Clean Energy: Air Emissions.”

Page 9 CLeANer AIr AND better HeALtH: tHe beNeFIts OF OHIO’s reNeWAbLe AND eFFICIeNCY stANDArDs NrDC
The findings described in this report were generated by converting Ohio’s EERS and RPS targets into quantitative environmental and public health benefits, based on an M.J. Bradley & Associates (M.J. Bradley) model and analyses conducted by the Clean Air Task Force (CATF) and MSB Energy Associates.
The M.J. Bradley model was used to conduct the initial environmental effects, determining the fossil generation reductions that would result from Ohio’s EERS and RPS and the corresponding carbon pollution reductions. CATF and MSB Energy then used these estimates of pollution reductions to calculate the avoided health effects of implementing Ohio’s clean energy standards.
Details of the two-step analysis are provided below.
M.J. Bradley’s Clean Power Plan Compliance Tool was used to estimate the avoided carbon emissions associated with implementing the RPS and EERS from 2017 to 2029.1 This tool is designed to perform a simple resource analysis for each state, simulating the overall changes in generation that result from specified policies—in this case, displacement of coal- and natural gas–fired generation with full utilization of the RPS and EERS—under a given set of background assumptions.
For this report, we projected carbon emissions reductions in Ohio from 2017 to 2029, relative to 2012, using the Compliance Tool with the following assumptions:
n Ohio achieves annual incremental energy efficiency savings of 1% between 2017 and 2020. Annual incremental savings increase to 2% in 2021 and remain at that level through the end of the Clean Power Plan compliance period. This is consistent with the amended requirements of Senate Bill 310.
n Generation from renewable energy sources is fixed at 2.5% of electricity sales through 2016. Starting in 2017, this share is increased by 1 percentage point annually until it reaches 12.5% of sales in 2026. The share of renewable energy in Ohio’s generation mix remains unchanged thereafter. This is consistent with the amended requirements of Senate Bill 310.
n About one-third of Ohio’s existing coal fired capacity (7 GW) is projected to be retired by 2020 (based on a list of announced coal plant retirements compiled by M.J. Bradley). Full implementation of the EERS and RPS
Appendix A:ANALYTICAL METHODS
ensures that this generation is not replaced by a ramp-up of other coal-fired power plants. Instead, this generation is replaced with a mix of energy efficiency, renewable energy, and natural gas–fired generation. In a given year and scenario, if the amount of incremental energy efficiency and renewable energy exceeds the resource gap left by retiring coal units, then the EE and RE resources further decrease overall coal-fired generation. For purposes of this analysis, we considered two scenarios: one in which incremental energy efficiency and renewable energy would displace fossil generation in a 60:40 ratio, with 60% displacing coal-fired generation and 40% displacing natural gas resources; and one in which these clean energy sources would displace fossil fuels based on a 40:60 ratio, with 40% displacing coal-fired generation and 60% displacing natural gas resources.
n Contributions of other generating resources including nuclear and hydropower remain constant at their 2012 levels.
n Based on average emissions factors, coal plants produce 2,126 pounds of carbon dioxide per MWh and natural gas plants produce 963 pounds of carbon dioxide per MWh.
Figure 1 shows the significant downward trajectory of carbon emissions between 2017 and 2029 under both coal displacement scenarios analyzed.
Business as Usual: Without EE/RE Standards
60,000,000
65,000,000
70,000,000
75,000,000
80,000,000
85,000,000
90,000,000
95,000,000
100,000,000
105,000,000
2017
2018
2019
2020
2021
2022
2023
2024
2025
2026
2027
2028
2029
60% Coal Displacement 40% Coal Displacement Ca
rbon
Dio
xide
Emis
sion
s (To
ns)
Figure 1: OhiO CarbOn POllutiOn emmissiOns

Page 10 CLeANer AIr AND better HeALtH: tHe beNeFIts OF OHIO’s reNeWAbLe AND eFFICIeNCY stANDArDs NrDC
CATF conducted the second part of the analysis, projecting the resulting public health effects from full implementation of the EERS and RPS from 2017 to 2029. Since coal-fired power generation is the primary source of such impacts, CATF used the M.J. Bradley model’s avoided coal generation projections as the basis for calculating avoided health effects. Health impact estimates from the PIE include Ohio as well as downwind areas outside of the state. A substantial portion of the impacts would be felt in-state, however, given the significant proportion of emissions sourced from fossil generation in Ohio as well as the large population centers likely to be affected by pollution emissions.
CATF made a few key assumptions in conducting the health impacts analysis. For in-state generation, CATF used the M.J. Bradley model’s projections regarding percentage of coal generation in each year. With respect to power imports to Ohio from out of state, the M.J. Bradley data provided overall import estimates, without specifying a percentage of imported coal generation. In estimating imports into Ohio, the M.J. Bradley model adjusted electricity demand beyond 2012 levels to reflect any incremental energy efficiency savings. CATF reviewed the Electric Power Annual and determined that coal plants made up 80.7% of the fossil generation in surrounding states that would be likely to be imported to Ohio (i.e., that would not be necessary to serve baseload in those states).2 CATF used that fraction to convert the M.J. Bradley calculation of reductions in overall imports to reductions in imports from coal generation. CATF then used the Powerplant Impact Evaluator (PIE) model to calculate the health effects per MWh of coal generation. The PIE model was developed by Abt Associates, the consulting firm used by the U.S. Environmental Protection Agency (EPA) to assess the avoided health effects of federal air pollution regulations. The PIE model incorporates the same peer-reviewed methodology used by EPA, which is widely accepted in the scientific community.
The PIE model uses data on the emissions from each coal-fired power plant in the geographic area under consideration, based on each plant’s reports to the EPA’s Continuous Emissions Monitoring Site (CEMS) database. These emissions data are combined with weather data and atmospheric chemistry to determine each plant’s contribution to the concentration of air pollutants in the atmosphere. The model uses these concentrations as inputs into a set of equations that relate pollutant levels to specific adverse health effects. These equations are derived from the peer-reviewed health studies of dose-response relationships used by EPA in assessing the benefits of its air pollution regulations. Running the PIE model thus produces estimates of each coal plant’s annual health impacts in each county affected by the plant’s emissions. Combining these county-level results provides health impacts on a statewide level. A more detailed description of the PIE model is given in the last section of this Appendix.
To estimate the health impacts of future reductions in coal-fired power generation, CATF used the above analysis and calculated the health impacts per MWh of generation for both in-state and out-of-state generation. First, CATF determined the health impacts caused by Ohio coal plants in 2012 and ran the model using 2012 emissions data. Second, CATF divided the health impacts of Ohio’s coal-fired generation by the amount of MWh generated in Ohio from coal in 2012 to produce estimates of per-MWh health impacts caused by coal plants in the state.
CATF’s analysis also accounts for the fact that roughly one-quarter of the power used in Ohio comes from out of state. It is quite difficult to model the exact sources of imported electricity. To address this, CATF assumed that the power coming into Ohio would, for the most part, come from bordering states: Indiana, Michigan, Pennsylvania, Kentucky, and West Virginia. CATF treated those five states as a single block and calculated the health impacts per unit of coal generation from the entire block, using the same approach described for Ohio plants above.
Finally, CATF multiplied the estimated impacts per MWh of coal generation for Ohio and the surrounding states by the MWh changes in coal generation and coal-generated imports by year resulting from the EERS and RPS. This calculation produced the annual health effect figures set forth in Tables 1 and 2 of the report.
DesCriPtiOn OF POwerPlant imPaCt evaluatOr mODel methODOlOgyPIE was developed specifically to estimate the health and economic impacts of electric generating units (EGUs) in the United States, focusing on the impacts of particulate matter less than 2.5 microns in aerodynamic diameter (PM2.5). This air pollutant has been linked to a variety of serious health effects, including asthma attacks, chronic bronchitis, hospital admissions, and premature mortality.
To estimate the PM2.5-related benefits associated with reducing emissions from EGUs, the PIE model first calculates the impact on ambient air quality. Then, using the results from epidemiological studies, it estimates the number of adverse health impacts (e.g., avoided deaths), and finally, it estimates the associated economic benefits (the latter are not included in this report). This three-step process is the standard approach for evaluating the health and economic benefits of reduced air pollution. EPA used this approach when evaluating the National Ambient Air Quality Standards (U.S. EPA, 2006), the Clean Air Act (U.S. EPA, 1999b), the benefits of reducing greenhouse gases (Abt Associates Inc., 1999), the health effects of motor vehicles (U.S. EPA, 2000; 2004), and other major regulations.

Page 11 CLeANer AIr AND better HeALtH: tHe beNeFIts OF OHIO’s reNeWAbLe AND eFFICIeNCY stANDArDs NrDC
Abt Associates developed the PIE tool to support assessments of the human health benefits of air pollution reductions and their associated economic benefits. PIE is the result of years of research and development and reflects methods that are based on the peer-reviewed health and benefits analysis literature.
PIE is based on a damage function approach, which involves modeling changes in ambient air pollution levels, calculating the associated change in adverse health effects, such as premature mortality, and then assigning an economic value to these effects. For changes in the concentrations of particulate matter, this is typically done by translating a change in pollutant levels into associated changes in human health effects.
The process involves health impact functions, which are derived from concentration-response functions reported in the peer-reviewed epidemiological literature. A typical health impact function has four components:
1. an effect estimate, which quantifies the change in health effects per unit of change in a pollutant and is derived from a particular concentration-response function from an epidemiology study;
2. a baseline incidence rate for the health effect;
3. the affected population; and
4. the estimated change in the concentration of the pollutant.
The result of these functions is an estimated change in the incidence of a particular health effect for a given change in air pollution. Examples of health effects that have been associated with changes in air pollution levels include premature mortality, hospital admissions for respiratory and cardiovascular illnesses, and asthma exacerbation.Finally, the calculation of total avoided health effects involves summing estimated benefits across all non-overlapping health effects, such as hospital admissions for pneumonia, chronic lung disease, and cardiovascular-related problems.
A PIE analysis relies on first estimating a reduction in air pollution emissions. The determination of the emission reduction occurs outside of PIE and is used as input to the PIE analysis. In the case of the present study, the emission factors were provided to CATF by MJ Bradley. After the user enters this information into PIE, the model then estimates:
1. the reduction in ambient PM2.5 levels in each county in the continental United States; and
2. the associated reduction in the incidence of various adverse health effects.
For more detailed information on each step, see technical support documents for the PIE.3
ENDNOTES
1 See mjbradley.com/about-us/case-studies/clean-power-plan-evaluation-tools.
2 See Energy Information Administration, Electric Power Annual (most recent data is 2013), www.eia.gov/electricity/annual/.
3 See Abt Associates Inc., Technical Support Document for the Powerplant Impact Evaluator Software Tool, July 2010, www.catf.us/resources/publications/view/137.