Embed Size (px)
Citation preview

Cameron Renshaw - “Heifers with Data”
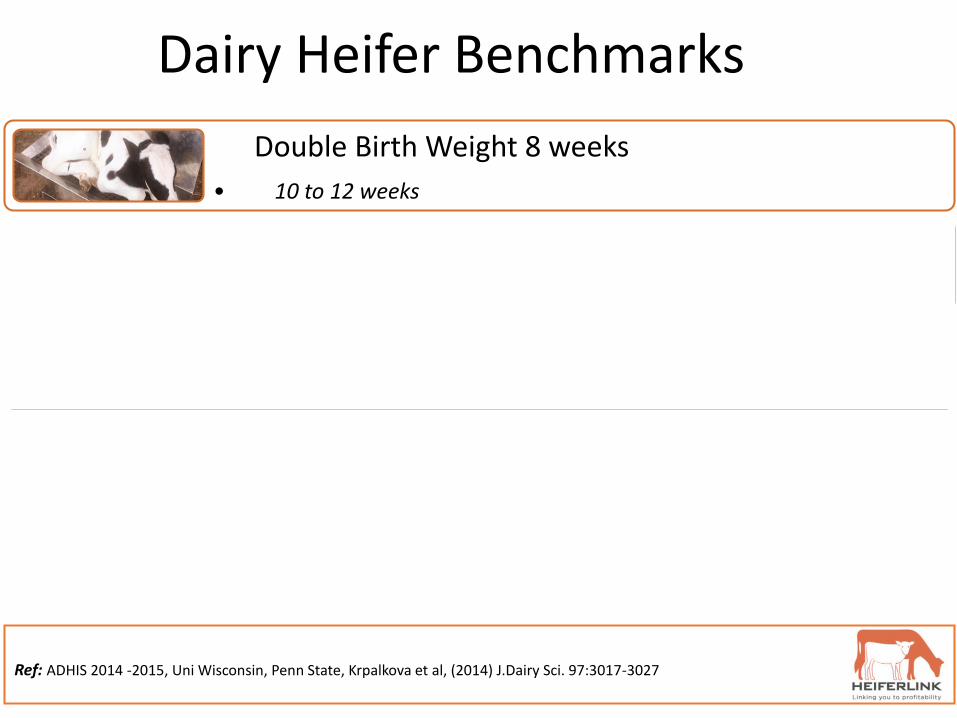
Ref: ADHIS 2014 -2015, Uni Wisconsin, Penn State, Krpalkova et al, (2014) J.Dairy Sci. 97:3017-3027
Double Birth Weight 8 weeks
• 10 to 12 weeks
Start Mating 13 Months at 55% MBW
• 17 months at 50 %
AFC 22 – 24 Months at 94% MBW
• > 26 to 30 months at 80 to 85% MBW
90% Production To Mature Herd
< 80% in lactation 1
Achieve 4 to 5 Lactations
Av. 2.5 to 3 lactations
Dairy Heifer Benchmarks
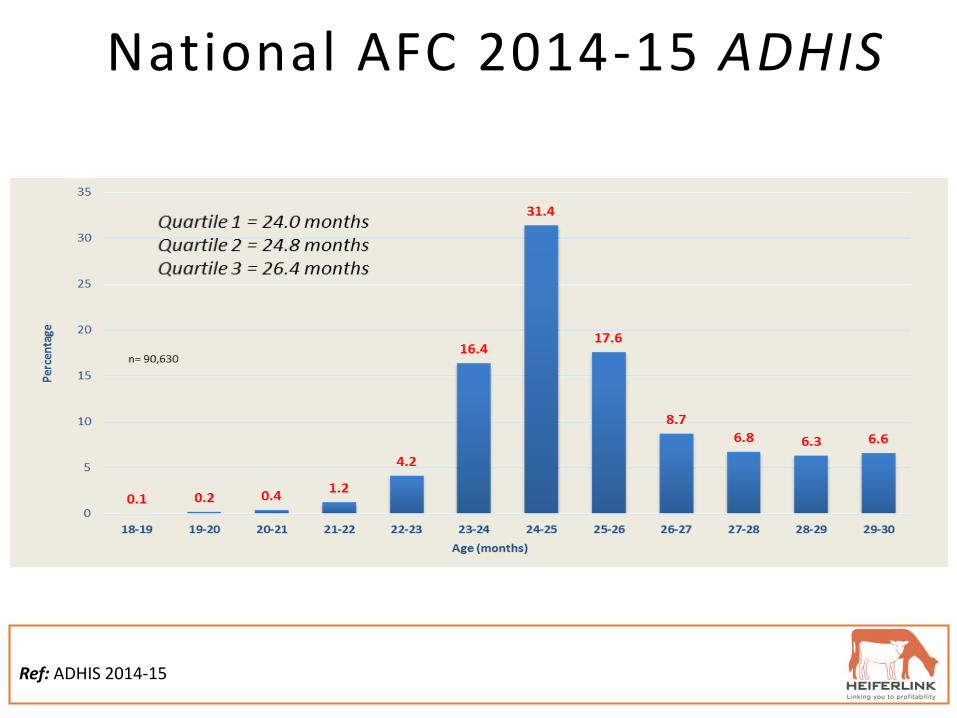
Ref: ADHIS 2014-15
National AFC 2014-15 ADHIS

Ref: Universal MBW Growth Chart - Uni Wisconsin
M BW
Setting Your Targets
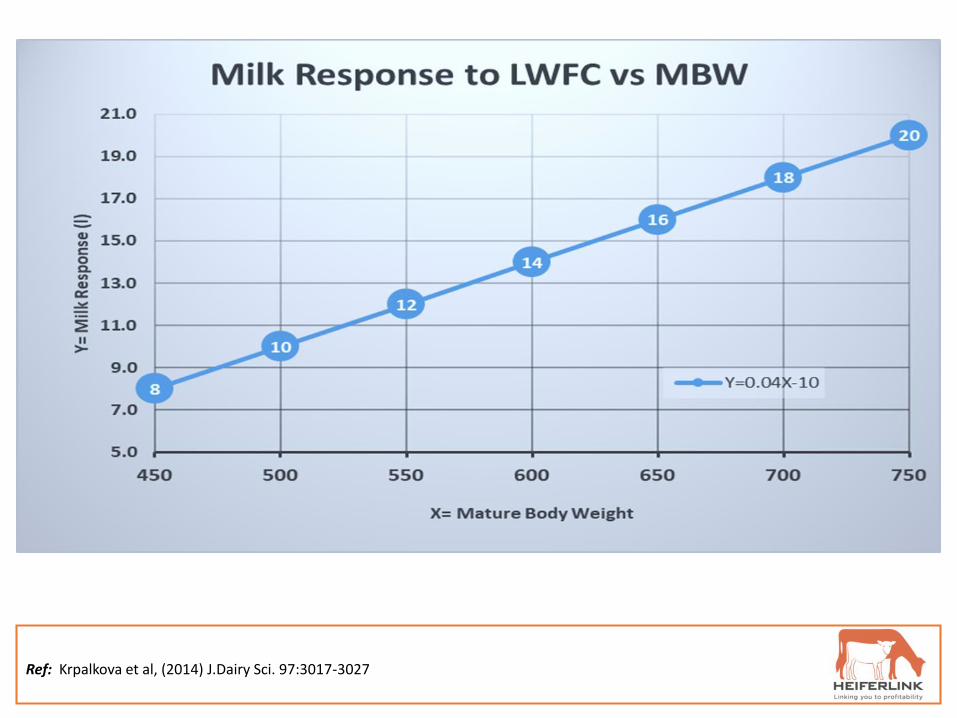
Ref: Krpalkova et al, (2014) J.Dairy Sci. 97:3017-3027

REF: Krpalkova et al, (2014) J.Dairy Sci. 97:3017-3027
Lactation 1. 50 kg LW x 16Lt = 800 litres
Lactation 3. = 800 litres
Lactation 2. = 800 litres
Liveweight & Milk Response
M I L K R E S P O N S E Heifers are typical 50 kg* under live weight (LW) potential at 1st calving
L i f e t i m e R e s p o n s e = 2 4 0 0 l i t r e s

Ref: Heiferlink field data 2015-16
Typical Weight for Age Graph (without data)
• AFC = 28 Months
• LW at 1st Calving = 80% MBW or 540 kg

Ref: Heiferlink Data 2015-16
Weight for Age Graph (with data)

Average Daily Gain (ADG)

Overall Average Daily Gain (Ov/ADG)
6 Key Objectives for heifer rearing:
1. Lower the AFC from 26.3 down to 23 – 24 Months
2. Increase heifers joining weights to 54% MBW
3. Increase heifers calving weight to 94% MBW
4. Implement strict culling guidelines of heifers
5. Implement a strategy around “supp” feeding of post weaner & rising 2-yo heifers
6. Undertake Yearly Reviews
On Farm ManagementUpper Murray – Dairy Farm

Ref: Appendix 2.
Upper Murray – Dairy Farm
The distribution of AFC shown in this graph is:
Quartile 1: 24.4 months
Quartile 2: 26.3 months
Quartile 3: 31.9 months
.

REF: Heiferlink, Upper Murray 2017-18
Lactation Analysis 2015 Calving Season
a) Lactation Analysis by Age
ALL Mature >48m (4 years)
22 -23 m 24-30 m
Number Animals 390 129 30 84
T Milk 8,124 8,833 (100%) 6,372 (72%) 7,381 (84%)
T solids 616 655 (100%) 488 (75%) 553 (84%)
Days 348 334 324 426
S Milk (305 days) 6,957 7,703 (100%) 5,468 (71%) 6,147 (80%)
S Solids (305 days) 517 562 (100%) 411 (73%) 450 (80%)
Refer to Appendix 3 for full data set
Age Distribution 2015

Ref: Heiferlink Data 2017-18
Hidden Rearing Costs
• 30% cull rate, down to 25%. Was 20 less heifers required in the system = $20,000
• Lower the AFC of (Q3) from 28 Mth to 24 Mth on 25% of heifers • Bring forward 2400 Lt/head (92,000lt) milk into Vat = $38,400
• Reduced Feed Costs • 120 days less feed @ $2.00/head/day over 40 heifers = $9600*
• Increase heifers LWFC by 50 kg - 70 kg has a lifetime milk responseof 14 Lt*/KG extra liveweight
• 50kg X 14lt =700lt milk per heifer over 120 heifers = 84,000 Lt = $33,600 (L1)
= 92,000

WHAT CAN WE DO TOMORROW
1. Set your growth targets with your (MBW)
2. Know your AFC – Don’t assume your AFC
3. Ask what the 1st lactation heifers are achieving

Cameron Renshaw “Heifers with Data”

Ref: Penn State Uni

Pensylvania 2011

D.A Advanced Nutrition 2017, Heiferlink
Feed Conversion

REF: Heiferlink Upper Murray 2017-18
Lactation Analysis 2016 Calving Season
a) Lactation Analysis by Age
ALL Mature >48m (4 years)
22 -23 m 24-30 m
Number Animals 225 60 3 63
T Milk 7,078 7,979(100%) 6,100 (76%) 6,094 (76%)
T solids 534 598 (100%) 443 (74%) 459 (77%)
Days 308 314 336 306
S Milk (305 days) 6,568 7,357 (100%) 5,609 (76%) 5,665 (77%)
S Solids (305 days) 493 549 (100%) 404 (74%) 424 (77%)
Refer to Appendix 4 for a full data set.
Age Distribution 2016


Ref: Universal MBW Growth Chart - Uni Wisconsin
M BW
Setting Your Targets