Embed Size (px)
Citation preview

Cambridgeshire Pension Fund
Employer Forum
• Geoff Nathan • Jamie Clark• 30 November 2016
Hymans Robertson LLP is authorised and regulated by the Financial Conduct Authority

2
What are we going to cover?
Whole Fund results
Cambridgeshire Fund in the LGPS
Valuation overview Inter –valuation experience
Employer funding strategies Results Schedules

3
The Cambridgeshire
Fund in the LGPS

4
Government
LGPS
LGPS Regulations (other Regulations)
Fund Fund Fund
NHS Scheme
Teachers Scheme
Civil Service Scheme
unfunded....
Public sector pension schemes
Employers EmployersEmployers ....

5
Local Government Pension Scheme
Employer
Pension Fund
Set by Regulations
Contributions
Contributions
Benefits
Administering AuthoritySet by Fund Actuary
Set by Regulations
6
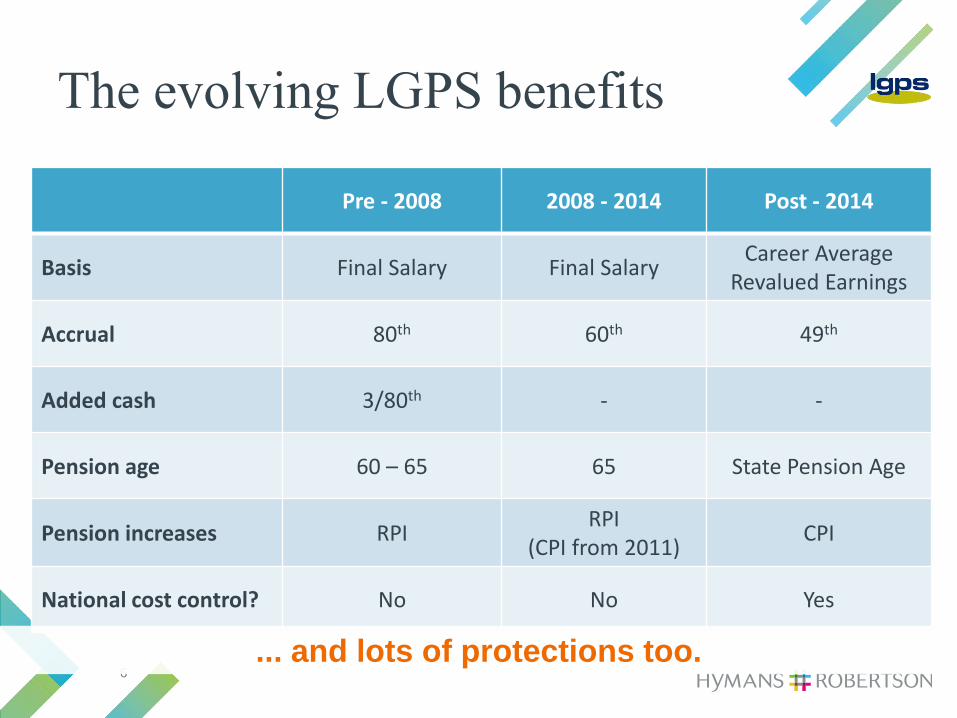
The evolving LGPS benefits
Pre - 2008 2008 - 2014 Post - 2014
Basis Final Salary Final SalaryCareer Average
Revalued Earnings
Accrual 80th 60th 49th
Added cash 3/80th - -
Pension age 60 – 65 65 State Pension Age
Pension increases RPIRPI
(CPI from 2011)CPI
National cost control? No No Yes
... and lots of protections too.

7
Cambridgeshire Pension Fund
• More than 77,000 members
• Managing assets of £2,276m*
• Over 350 employers
*as at 31 March 2016

8
Valuation overview

9
Why do we do a valuation?
Compliance with legislation
Set employer contribution rates
Determine money needed to meet accrued liabilities
Calculate solvency (“funding level”)
Monitor experience vs. assumptions
Manage risks to Fund and employers
Review the Funding Strategy Statement (FSS)

10
Promise now, pay later
Lump Sum
Dependant’s
Pension
Member’s
Pension
40 65 85
Recruitment
Contributions
Exp
endi
ture
Inco
me
Retirement Death

11
Valuation - the ultimate objective
• How much money does the Fund need, and how should it be invested, in order to be able to meet the promised benefits?
Assets
Which ones?
How is it done
efficiently?
?What are the liabilities?

12
Meeting the objective
Assets
Future outperformance
Future contributions
AssetsLiabilities
Liabilities
Stru
cture
Managers

13
Inter-valuation
experience

14
Investment return vs expected
…. asset returns have been stronger than expected
14.4%18.9%
0.0%
5.0%
10.0%
15.0%
20.0%
Expected return Actual return

15
Experience since 2013 (yields)
Falling bond yields have increased liabilities…

16
Membership experience
• Pay growth– Lower than expected– Does vary across employers
• Pension increases (pension increase orders)– Expected 2.5% p.a. (7.7%)– Actual 2.7%, 1.2%, 0.0% (3.9%)
• Movements– More early leavers than expected– Fewer pensioner deaths than expected
• 50:50 take-up– Lower than expected

17
Whole Fund results

18
Changes to the 2016 valuation
financial assumptions
1. Asset Outperformance Assumption (AOA)– Increase to 1.8% p.a. (from 1.6% p.a.)
2. Salary growth assumption– Continued public sector pay freeze– Run off of pre2014 final salary linked liabilities– Reduce post freeze increases to RPI
3. RPI / CPI gap– Increase to 1.0% p.a. (from 0.8% p.a.)

19
Key assumptions for funding target
2013 valuation 2016 valuation Derivation of assumption
Discount rate (assumed future investment return)
4.6% 3.9% Change in approach:Gilts plus prudent asset out-performance assumption (AOA)At 2013: AOA = 1.6% p.a.At 2016: AOA = 1.8% p.a.
Long term pay growth 4.3% 2.4% Change in approach:At 2013: RPI + 1.0%At 2016: RPI - 0.7%
Pension increases (CPI) 2.5% 2.1% Change in approach:At 2013: CPI = RPI - 0.8% At 2016: CPI = RPI - 1.0%
50:50 take up 10% 5% Lower than anticipated take up
Longevity ClubVITA with CMI 2010 model for
future improvements
ClubVITA with CMI 2013 model for
future improvements
2013 not 2015 in order to remove volatility experienced in last two years

20
Impact of discount rate
£100
20 years
£46.52
£40.68
Discount rate 4.6%
Discount rate 3.9%

21
Whole fund valuation results
31 March 2013 31 March 2016
Active 1,042m 953m
Deferred 581m 726m
Pensioner 1,010m 1,222m
Total liabilities 2,633m 2,902m
Assets 1,905m 2,276m
Deficit (728m) (626m)
Funding level 72% 78%
Increase in funding level, and reduction in deficit, at the 2016 valuation

22
Why has the funding position
changed?Analysis (£m)
Surplus / (deficit) at 31 March 2013 (728)
Interest on surplus / (deficit) (105)
Investment returns greater than expected 81
Contributions greater than cost of accrual 9
Membership experience over the period 146
Change in demographic assumptions (2)
Change in base mortality assumption 29
Change in longevity improvements assumption 1
Change in financial assumptions (24)
Impact of LGPS 50/50 take up (17)
Other experience items (16)
Surplus / (deficit) at 31 March 2016 (625)

23
Employer Funding
Strategies
24
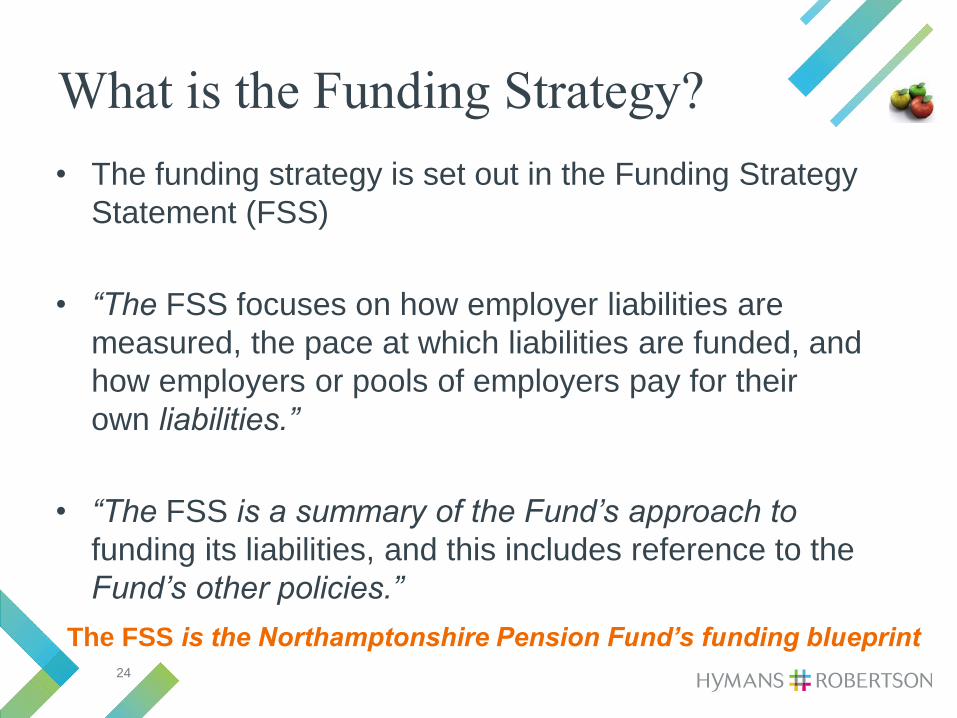
What is the Funding Strategy?
• The funding strategy is set out in the Funding Strategy Statement (FSS)
• “The FSS focuses on how employer liabilities are measured, the pace at which liabilities are funded, and how employers or pools of employers pay for their own liabilities.”
• “The FSS is a summary of the Fund’s approach to
funding its liabilities, and this includes reference to the Fund’s other policies.”
The FSS is the Northamptonshire Pension Fund’s funding blueprint

25
Why is the FSS important to
employers?
• The FSS helps employers understand– how their contributions are calculated;– how these are fair by comparison to other
employers in the Fund; and– in what circumstances the employer might need to
pay more.

26
Setting funding targets at 2016
Understand employers
100% funding
Timeframe varies depending on profile and circumstances
Based on Employer’s Risk Profile
27
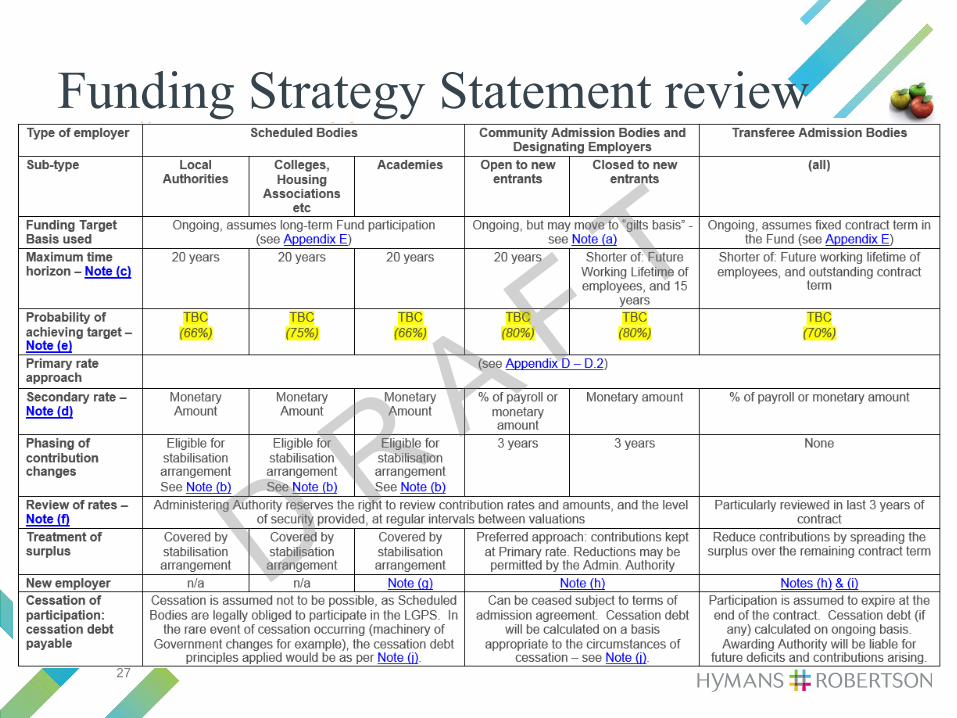
Funding Strategy Statement review

28
Historic approach to funding plans
50%
60%
70%
80%
90%
100%
110%
2013 2015 2017 2019 2021 2023 2025 2027 2029 2031 2033 2035 2037
Fun
din
g le
vel
Year
80% growth strategyFunding progression
Actuary & Fund agree one set of
assumptions
Actuary calculates contribution rates
Based on the assumption that future conditions are certain

29
Risk based approach: recognise
uncertainty
50%
60%
70%
80%
90%
100%
110%
2013 2015 2017 2019 2021 2023 2025 2027 2029 2031 2033 2035 2037
Fun
din
g le
vel
Year
2016 2019 2022 2025 2028 2031 2034 2037 2040
30
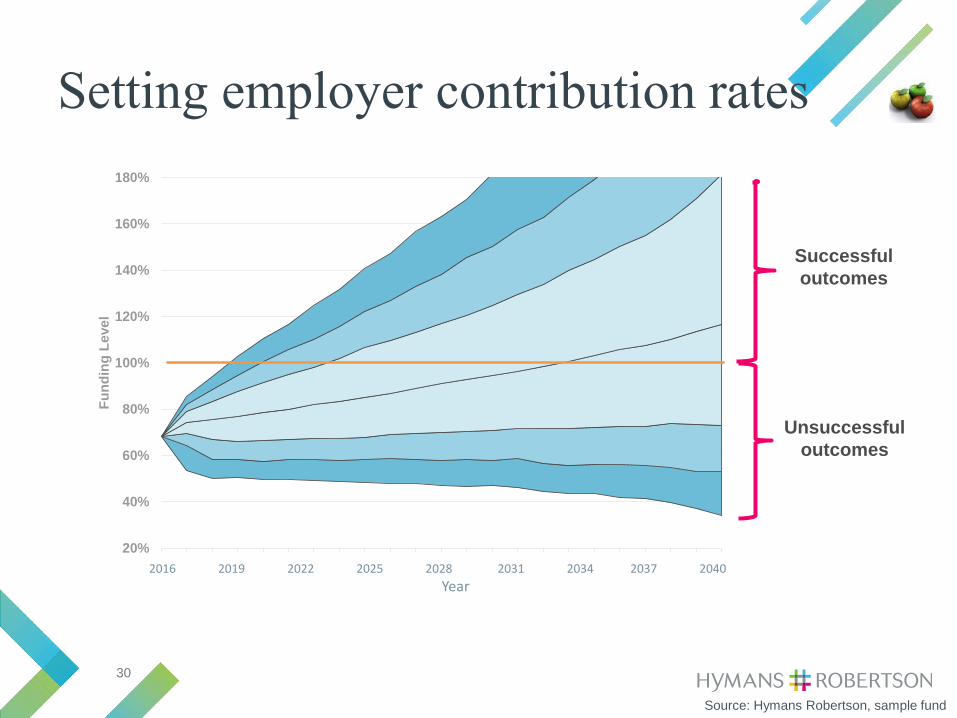
Setting employer contribution rates
20%
40%
60%
80%
100%
120%
140%
160%
180%
2013 2015 2017 2019 2021 2023 2025 2027 2029 2031 2033 2035
Fu
nd
ing
Lev
el
Year
Successful outcomes
Unsuccessful outcomes
Source: Hymans Robertson, sample fund
2016 2019 2022 2025 2028 2031 2034 2037 2040
Year

31
20%
40%
60%
80%
100%
120%
140%
160%
180%
2013 2015 2017 2019 2021 2023 2025 2027 2029 2031 2033 2035
Fu
nd
ing
Lev
el
Year
60% of outcomes
above 100% funding
Setting employer contribution rates
Source: Hymans Robertson, sample fund
2016 2019 2022 2025 2028 2031 2034 2037 2040
Year
32
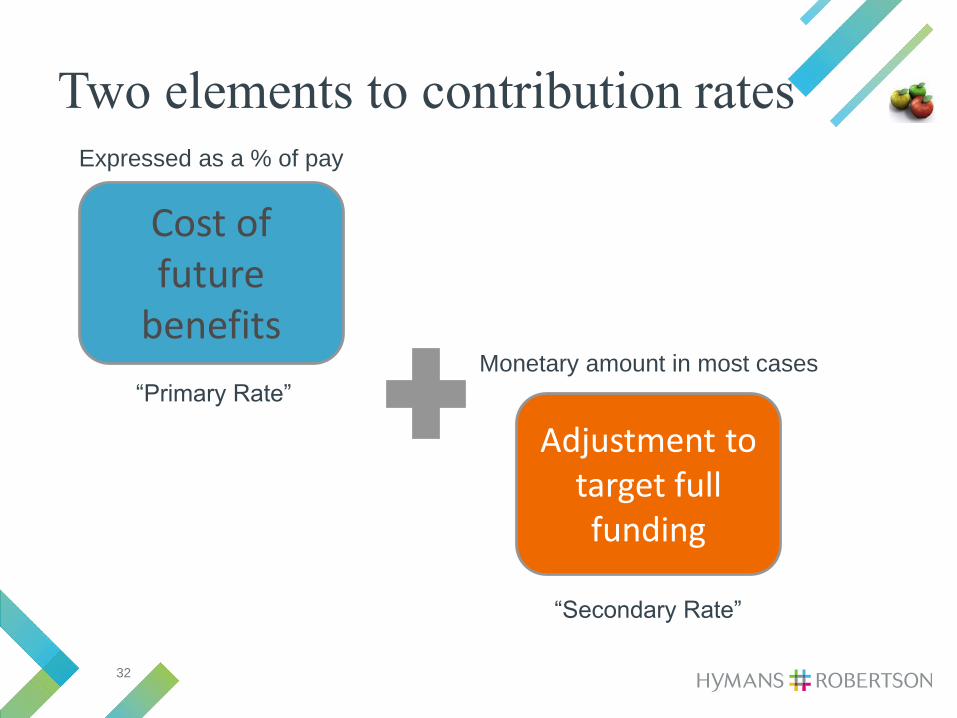
Two elements to contribution rates
Cost of future
benefits
Adjustment to target full funding
Expressed as a % of pay
“Secondary Rate”
Monetary amount in most cases“Primary Rate”

33
Payroll of £100,000
Deficit recovery:10% of pay
Why pay monetary deficit amounts?
Deficit recovery = £10,000
Over 3 yearsPayroll of £60,000
Deficit recovery = £6,000
Deficit does not reduce in line with falling payrollMonetary amounts ensure the deficit is still repaid

34
Why doesn’t everyone pay the same
rate?
Term Maturity
Security Guarantor
Planning to exit
Closed to new entrants
Funding level
Employers are a diverse group with different objectives
Size
No actives

35
Risk-based approach for all
employers
Contribution Stability
Mechanism
Risk-based approach
Prob of success = 66%
Risk-based approach
Prob of success = 70%
Low risk employers
Other Admitted
Bodies
Local Authorities
/Academies?
Risk-based approach
Prob of success = 80%
Community Admitted Bodies/
Designated Employers

36
What this looks like in practice
• Help all parties understand approach to setting contribution rates (including SAB and DCLG)
Transparent approach to funding plans
EmployerFunding
targetRecovery
periodRisk
categoryLikelihood of
successEmployer A Ongoing 17 years Low 66%Employer B Ongoing 17 years Medium 75%Employer C Ongoing 10 years High 80%
Employer D Gilts 5 years High 70%1
Employer E Ongoing 3 years Low 66%Notes:1. Charge on assets, reduction in likelihood of success from 80% to 70% to reflect additional security

37
Valuation results schedule
Fund Cambridgeshire Pension Fund
Administering Authority Cambridgeshire County Council
Employer
Pool (if applicable) Individual
Employer code/Pool Name
Open/Closed Closed
Employer Type CAB
2016 Valuation Results - Balance SheetFunding Position Relative to Employer Funding Target
Ongoing Ongoing
Funding Basis Funding Basis
31 March 2013 31 March 2016
(£000) (£000)
Past Service Liabilities
- Active Members (Final salary) 3,000 4,000
- Active Members (CARE) - 1,000
- Deferred Pensioners 1,500 2,000
- Pensioners 4,500 7,000
Total 9,000 14,000
Asset Share 7,750 12,500
Surplus / (Deficit) (1,250) (1,500)
Funding Level 86% 89%

38
Valuation results schedule2016 Valuation Results
% of payroll £(000) p.a.
Rate paid in 2016/2017 22.4% -
Contribution Rates Primary Rate Secondary Rate
Cost of New Benefits Accruing Deficit (Surplus) Repayment
% of payroll plus £(000) p.a. *
2016 Valuation Rate 29.3% plus 60
Recommended Contribution Rates
2017/18 24.7% plus 20
2018/19 27.0% plus 40
2019/20 29.3% plus 60
*These monetary amounts will increase in line with our salary growth assumption.
The cost of providing LGPS pension benefits is dependent on many uncertain factors including the investment performance of the Fund's assets.
To reflect the uncertainty, employer contribution rates have been set by modelling the contributions required to fund the benefits under 5000 different
economic scenarios. The likelihood that the 2016 Valuation Contribution Rate above will pay for both benefits accruing and return the employer to a fully
funded position over a period of 7 years is 80%.
Further details of how contribution rates have been calculated are included in the Employer Results Report and the Funding Strategy Statement
The Primary Rate includes an allowance of 0.7% for administration expenses.

39
Valuation results scheduleData
Membership Statistics Numbers Actual Pay / Pension (£000) CARE Pot (£000)1
31 March 2013 31 March 2016 31 March 2013 31 March 2016 31 March 2016
Actives 83 62 2,194 1,852 74
Deferred Pensioners 14 30 55 87 -
Pensioners 22 32 145 200 -
1 CARE Pot for deferred and pensioner members is included in the pension figures
Membership Statistics Average Age2 Duration
31 March 2013 31 March 2016 31 March 2016
Actives 52.2 53.5 21.9
Deferred Pensioners 51.0 51.4 23.1
Pensioners 63.6 65.4 12.7
2 Weighted by liability
Assumptions
Financial Assumptions
Ongoing Ongoing
CessationFunding Basis Funding Basis Funding Basis31 March 2013 31 March 2016 42460
Discount Rate
- Pre Retirement 4.6% 4.0% 0.0218
- Post Retirement 4.6% 4.0% 0.0218
Salary Increases 4.3% 2.4% 0.0245
Pension Increases / CARE revaluation 2.5% 2.1% 0.0214

40
Any questions?