Embed Size (px)
Citation preview

CASE STUDY OF
CALSTRS HEADQUARTERS
WEST SACRAMENTO, CALIFORNIA
Final Report: August, 2011

1
Contents Acknowledgements ....................................................................................................................................... 2
Introduction .................................................................................................................................................. 3
About the building ........................................................................................................................................ 3
Context and characteristics ....................................................................................................................... 3
Design and process ................................................................................................................................... 5
Surveys ...................................................................................................................................................... 7
Interviews .................................................................................................................................................. 7
Results ........................................................................................................................................................... 8
Comparisons with peers ............................................................................................................................ 8
Temperature .............................................................................................................................................. 9
Lighting ................................................................................................................................................... 10
Speech privacy ....................................................................................................................................... 10
Occupant perception of building features and functionality ................................................................... 11
Operator perception of building features and functionality .................................................................... 13
Building Energy Management System ................................................................................................... 14
Other Findings ........................................................................................................................................ 14
Conclusion .................................................................................................................................................. 14
Thermal comfort and overcooling ........................................................................................................... 15
Speech privacy ........................................................................................................................................ 15
Occupant controls for energy and comfort ............................................................................................. 15
Operator/building controls ...................................................................................................................... 16
Constituent input ..................................................................................................................................... 16
Landscaping ............................................................................................................................................ 16
References ................................................................................................................................................... 17
2
Acknowledgements This report would not have been possible without cooperation of and information provided by many collaborators. In particular, we are grateful for the support and information provided by the following: HOK Dmitri Avdienko Zorana Bosnic Kathy Doi Olive Ho Mark Otsea Sam Poquiz David Troup Paul Woolford CalSTRS CalSTRS Facilities Staff Lisa Blatnic Theresa Gonzales Theresa Romeo Able Engineering Able Engineering Staff David Hill Panattoni Development Company Michelle Azevedo Jones Lang LaSalle Betsie Goulart About CBE The Center for the Built Environment (CBE) was established in May 1997 at the University of California, Berkeley, to provide timely unbiased information on promising new building technologies and design strategies. The Center's work is supported by the National Science Foundation and CBE's Industry Partners, a consortium of corporations and organizations committed to improving the design and operation of commercial buildings. Researchers: John Goins, Center for the Built Environment Mithra Moezzi, Portland State University Student Researchers: Evangelina Alvarez Katherine Duong
3
Introduction
It is a widely accepted fact that buildings must use less energy and reduce greenhouse gas (GHG) emissions to help mitigate global climate change. At the same time, buildings are for people: to succeed they must also provide environments that suit their intended occupants. Researchers usually consider these two criteria – reducing GHG emissions and providing good environments for their occupants -- separately despite their close relationship; buildings generally require energy and emit GHGs to produce suitable environments. This building performance case study presents findings about energy use and occupant sentiment together, seeking to uncover new relationships between the two concerns. It considers the designers, owners, operators and occupants’ contributions and relationship to energy use in the California State Teachers Retirement System (CalSTRS) Headquarters building in West Sacramento, California. More specifically, the study investigates how the design and operations processes contribute to the building’s low source energy use intensity, as indicated by its ENERGY STAR rating of 95, while maintaining high occupant satisfaction ratings for building features and indoor environmental quality (IEQ.) The study reviews these satisfaction ratings in light of the low measured energy intensity. This report addresses issues commonly observed in green building design and operations; and the recommendations it includes suggest ways to enhance the design process, improve operations efficiency and increase occupant satisfaction. For these reasons, this report is particularly useful to designers of green office buildings and members of organizations that own and/or operate office buildings. Findings were developed from surveys and interviews of building occupants, building operators, owners’ representatives and facilities staff. These surveys and interviews were performed during spring 2011 and were conducted in close collaboration with Hellmuth, Obata and Kassabaum (HOK) staff. The project was a collaboration between Center for the Built Environment at the University of California, Berkeley, and Portland State University. The report proceeds as follows. We begin with a description of the building and its physical context, followed by a discussion of the data and methods used. A discussion of findings is next. Findings related to building performance are presented first, followed by findings related to operations. A summary completes the report.
About the building
Context and characteristics This section describes the physical context and background of the building. Many of the items presented represent design and operational decisions that affect the building’s IEQ and energy performance. The implications of these decisions are discussed in the Results section. CalSTRS is a quasi-public financial organization that invests member contributions for retirement, disability and survivorship. While its funding comes from non-State of California sources primarily, its employees are State of California workers. Since the organization's funding sources are mostly private, this building project was not bound by State building project guidelines -- for example, the requirement to achieve LEED Silver. Yet, many of the CalSTRS building occupants would likely have worked in other State managed buildings; and there were a number of comparisons between this building and other State buildings during our investigation. The building is a thirteen-story tower on the Riverwalk in West Sacramento, California (Figure 1). It was completed in 2009 and includes 490,000 square feet of office space (Figure 2), two floors of public space and both covered and uncovered parking. The building has only one tenant and is owner-occupied by CalSTRS, which sets it apart from the more common notion of the multi-tenanted office building. The building was awarded a LEED Gold certification and includes a number of features aimed at reducing energy use while

4
promoting occupant comfort, including underfloor air distribution (UFAD) with adjustable diffusers, daylight optimization and heat pumps. Occupants have access to a number of comfort controls including task lights, airflow diffusers and -- more communally -- window blinds. Occupants may bring in personal fans if necessary, but personal heaters are prohibited. In 2010, the building achieved an ENERGY STAR rating of 95 and is currently seeking LEED-EBOM (Existing Building Operations and Maintenance) certification.
Figure 1: East-west longitudinal section of the CalSTRS building.
Assuming full occupancy (1200 occupants), the CalSTRS building has a smaller amount of square footage per occupant than the average for office buildings in Commercial Building Energy Consumption Survey (CBECS) database1 and CBE’s database2 (Figure 3). During visits to the building, it was noted however, that building is
1 CBECS’ averages of floor space are based on a randomly sampled pool of buildings and cannot match the mean of the actual population of buildings. Still, we use it here because it is the mean of a representative sample. 2 CBE’s data point is gross square footage as reported by building managers or design team members.
5
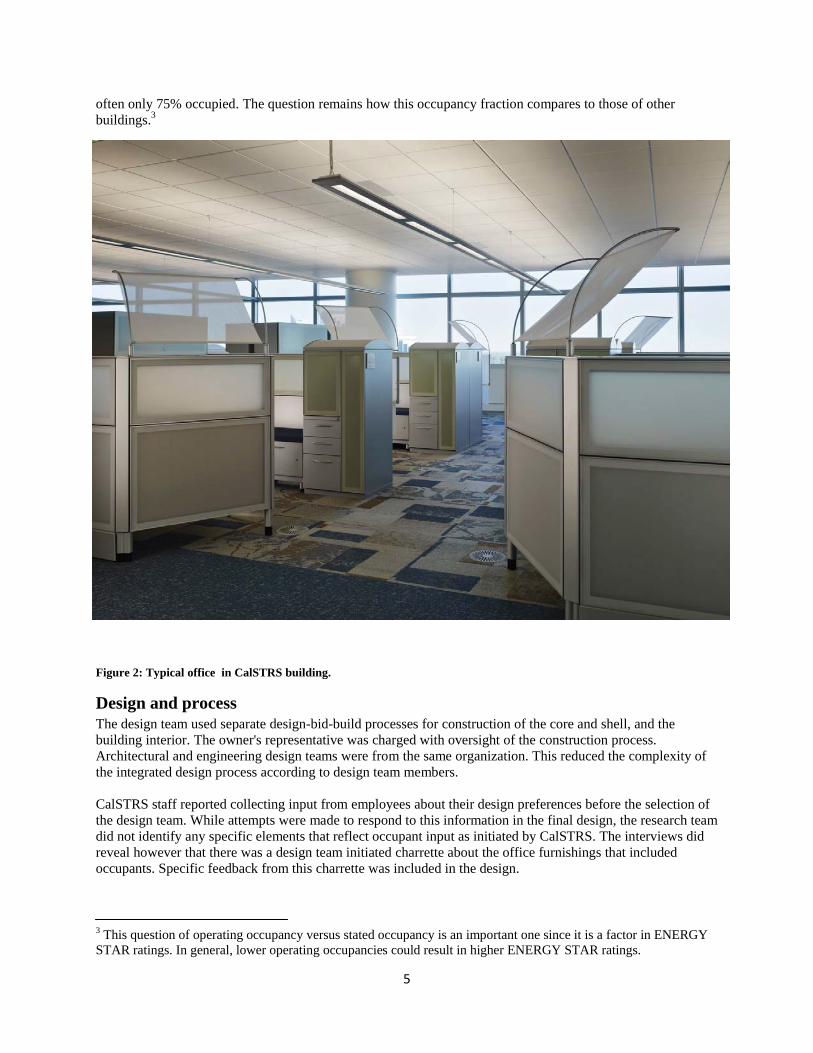
often only 75% occupied. The question remains how this occupancy fraction compares to those of other buildings.3
Figure 2: Typical office in CalSTRS building.
Design and process The design team used separate design-bid-build processes for construction of the core and shell, and the building interior. The owner's representative was charged with oversight of the construction process. Architectural and engineering design teams were from the same organization. This reduced the complexity of the integrated design process according to design team members.
CalSTRS staff reported collecting input from employees about their design preferences before the selection of the design team. While attempts were made to respond to this information in the final design, the research team did not identify any specific elements that reflect occupant input as initiated by CalSTRS. The interviews did reveal however that there was a design team initiated charrette about the office furnishings that included occupants. Specific feedback from this charrette was included in the design.
3 This question of operating occupancy versus stated occupancy is an important one since it is a factor in ENERGY STAR ratings. In general, lower operating occupancies could result in higher ENERGY STAR ratings.

6
CalSTRS utilizes a combination of internal and external operations staff to manage the building. The majority of operations issues are presented to the internal CalSTRS operations team first, who may handle the matter. HVAC system issues are delegated to Able Engineering and procurement issues to Jones Lange LaSalle.
Figure 3: Square footage per occupant at 100% occupancy using gross square footage.
This building project deviates from a standard green building process and design in at least one respect, but complies with standard practice in several others. For example, the owner's representative and design team asserted that this project had a higher than normal 'public benefit' requirement, since it is essentially a public building. The project was required to promote societal good within its region. This is most likely not a direct or explicit requirement of most green buildings. At the same time, from a design process perspective, the project appears similar to the standard 'green' office building project in several ways. Strict financial metrics about payback periods for sustainability features were in-line with industry standards. The design process also incorporated a sensitivity about the marketability of the space should the building ever need to be occupied by another organization. It is also useful to characterize the building along several additional parameters. The first is energy. This building has a site energy use intensity of approximately 63 kBTUs (1,000 British Thermal Units) per square foot per year (Table 1) and an ENERGY STAR rating of 95. Monthly energy consumption varies by
more than a factor of two in the year shown, from 3,936 in July to less than half as much two months later. It is also worth considering the building's HVAC systems. CalSTRS headquarters incorporates a number of high-tech strategies to reduce and manage energy use as mentioned previously.
356
438
585 547
0
100
200
300
400
500
600
CalSTRS CBECS CBE office CBE LEED
mean
median
Monthly Site Energy Use: July 2009 - June 2010 Utility Company: Pacific Gas & Electric Co.
in MMBTU
Month Gas Electricity Total all fuels
July 83 3,854 3,936
August 69 3,135 3,204
September 91 1,778 1,869
October 250 1,971 2,222
November 372 1,780 2,153
December 590 1,756 2,346
January 436 1,646 2,083
February 400 1,761 2,161
March 343 1,767 2,110
April 286 1,769 2,055
May 207 1,715 1,921
June 117 1,879 1,996
TOTAL 3,246 24,811 28,056
Building square footage 409,000 BTU/sq ft/yr
63,837
Table 1: Energy use during 12-month period in 2009 - 2010.

7
The results presented here may be applicable to projects that exhibit similar characteristics or that were designed under similar constraints.
Data and Methods This section describes the data the research team collected about indoor environmental quality, building features and functionality and building operations. The data were gathered from multiple streams: an occupant IEQ satisfaction survey; a building operations and maintenance survey administered to building operators and other facilities staff; on-site interviews with design team members; and telephone interviews with the owners’ representative.
Surveys A modified version of CBE's web-based Occupant Indoor Environmental Quality survey (Zagreus, 2004) was administered to all occupants. Slightly over 500 responded, representing 42% of the building's average daily occupancy.4 CBE's standard occupant survey includes questions about office layout and furnishings, thermal comfort, air quality, lighting, acoustic quality and cleanliness. It most commonly ends with questions about overall satisfaction with the building and with individual workspaces. The survey for the CalSTRS building replaced the office layout and furnishings questions with questions about occupants' process for resolving comfort or other building-related problems and questions about what occupants liked about the building. These questions were added to help elucidate how interactions between occupants and building staff affect both building energy use and occupant satisfaction.5 As usual, if the occupant expresses dissatisfaction with any area, he or she is offered the opportunity to explain the source or circumstances related to this condition. Both internal and external operations staff were surveyed using CBE's web-based Operations and Maintenance survey. This survey gathers operations staff's assessments of the design for operations and functionality. Unlike the indoor environmental quality survey, the operations and maintenance survey is customized for each building where it is administered. In this case, questions were added about operators’ experience with and opinions about occupant behavior and energy use. Nine people responded to this survey from all three organizations involved in building management. Both surveys yielded open-ended text responses as well as closed end responses, including 7-point ordinal scale satisfaction ratings, and checkbox responses. Both types of data were analyzed for this report. Open ended, free-text responses were analyzed using the method described in Moezzi (2010) using SPSS Text Analytics for Surveys. Numeric data were analyzed using CBE's Building Scorecard.6
Interviews The team also collected data via a series of ten semi-structured interviews with operations staff and the design team. Interviewees were asked the same set of core questions, but probing questions were not standardized; interview sessions were approximately 60 minutes each. The goal was to uncover and explore themes related to building operations, design and performance that were of interest to each group. Operations team interviews were largely performed in groups by organization: internal staff, operations engineering and operations procurement. Design team interviews involved a single participant with one exception: engineering. The remaining design team interviews were with representatives from landscape design, project management, conceptual design, interiors, design principals and the owners’ representative.
4 Average daily occupancy was provided by facilities staff, but was corroborated during researchers' building visit. 5 In particular, these questions supported an ARB-sponsored project led by University of California Davis, “Behavioral strategies to bridge the gap between potential and actual savings in commercial buildings” (http://eec.ucdavis.edu/projects/arbbehavioralstrategies.php). 6 www.cbesurvey.org/scorecard

8
These data were analyzed qualitatively with a goal of identifying meaningful themes about the design process and the building's resultant performance.
The interview guide used for this project covered six themes:
Comparisons: Elicited and compared ideal scenarios – about buildings, occupants, energy, operations and comfort.
Complaint management: Polled participants about the ways operations staff and occupants interact under specific scenarios.
Energy management: Included questions about energy use and management given specific scenarios.
Design: Questions about the use and functionality of specific building features.
Table 2: List of interviews.
Results
Comparisons with peers
CalSTRS LEED CBE office CBE UFAD
# of respondents 515 12,221 24,313 9,492 Figure 4: Overview of IEQ results.
Figure 4 summarizes the occupant’s satisfaction ratings of building’s IEQ. It compares the CalSTRS building to three peer groups: LEED-rated buildings7, all office buildings regardless of LEED certification, and
7 All buildings marked as LEED certified or pending in the CBE database irrespective of certification level.
20%
30%
40%
50%
60%
70%
80%
temperature air quality light level visual comfort
noise level speech privacy
% s
atis
fied
CalSTRS
LEED
CBE office
UFAD
Operations interviews 1. internal facilities management – 3 interviewees 2. outsourced building operations – 4 interviewees 3. outsourced procurement – 1 interviewee
Design team interviews 4. landscape design – 1 interviewee 5. project management – 1 interviewee 6. conceptual design – 1 interviewee 7. interiors– 1 interviewee 8. design principals– 1 interviewee 9. engineering– 2 interviewees 10. owners’ representative – 1 interviewee via telephone
9
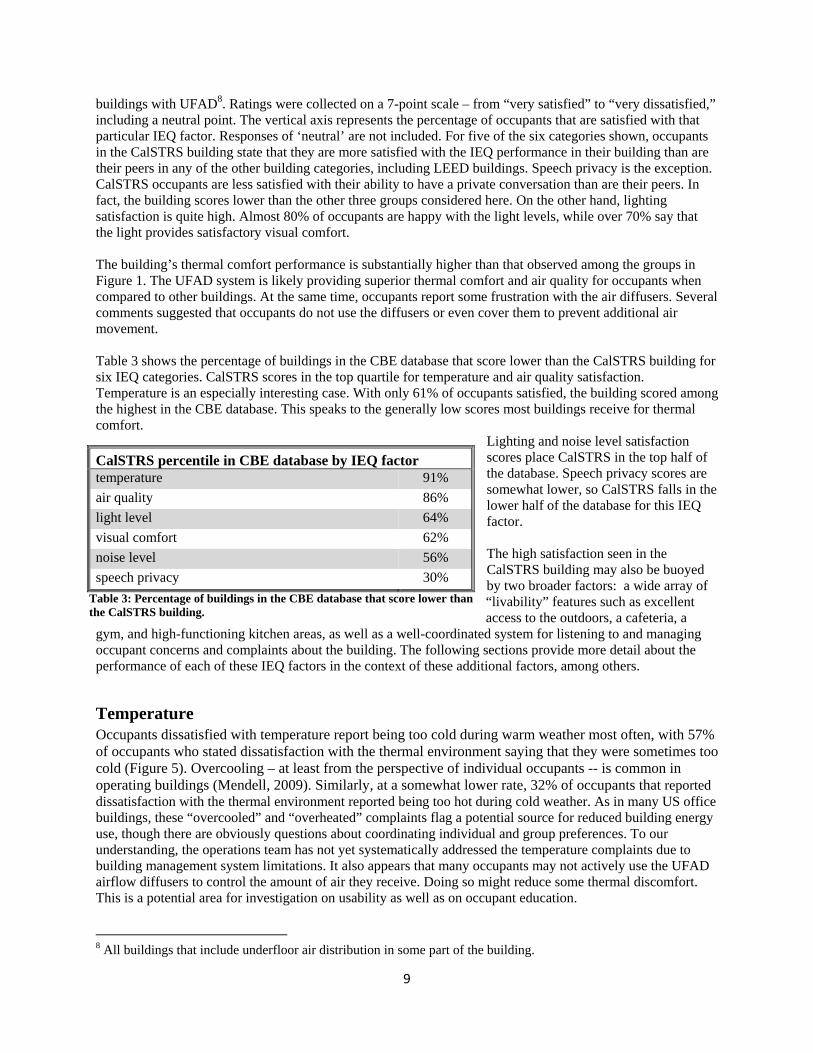
buildings with UFAD8. Ratings were collected on a 7-point scale – from “very satisfied” to “very dissatisfied,” including a neutral point. The vertical axis represents the percentage of occupants that are satisfied with that particular IEQ factor. Responses of ‘neutral’ are not included. For five of the six categories shown, occupants in the CalSTRS building state that they are more satisfied with the IEQ performance in their building than are their peers in any of the other building categories, including LEED buildings. Speech privacy is the exception. CalSTRS occupants are less satisfied with their ability to have a private conversation than are their peers. In fact, the building scores lower than the other three groups considered here. On the other hand, lighting satisfaction is quite high. Almost 80% of occupants are happy with the light levels, while over 70% say that the light provides satisfactory visual comfort. The building’s thermal comfort performance is substantially higher than that observed among the groups in Figure 1. The UFAD system is likely providing superior thermal comfort and air quality for occupants when compared to other buildings. At the same time, occupants report some frustration with the air diffusers. Several comments suggested that occupants do not use the diffusers or even cover them to prevent additional air movement. Table 3 shows the percentage of buildings in the CBE database that score lower than the CalSTRS building for six IEQ categories. CalSTRS scores in the top quartile for temperature and air quality satisfaction. Temperature is an especially interesting case. With only 61% of occupants satisfied, the building scored among the highest in the CBE database. This speaks to the generally low scores most buildings receive for thermal comfort.
Lighting and noise level satisfaction scores place CalSTRS in the top half of the database. Speech privacy scores are somewhat lower, so CalSTRS falls in the lower half of the database for this IEQ factor. The high satisfaction seen in the CalSTRS building may also be buoyed by two broader factors: a wide array of “livability” features such as excellent access to the outdoors, a cafeteria, a
gym, and high-functioning kitchen areas, as well as a well-coordinated system for listening to and managing occupant concerns and complaints about the building. The following sections provide more detail about the performance of each of these IEQ factors in the context of these additional factors, among others.
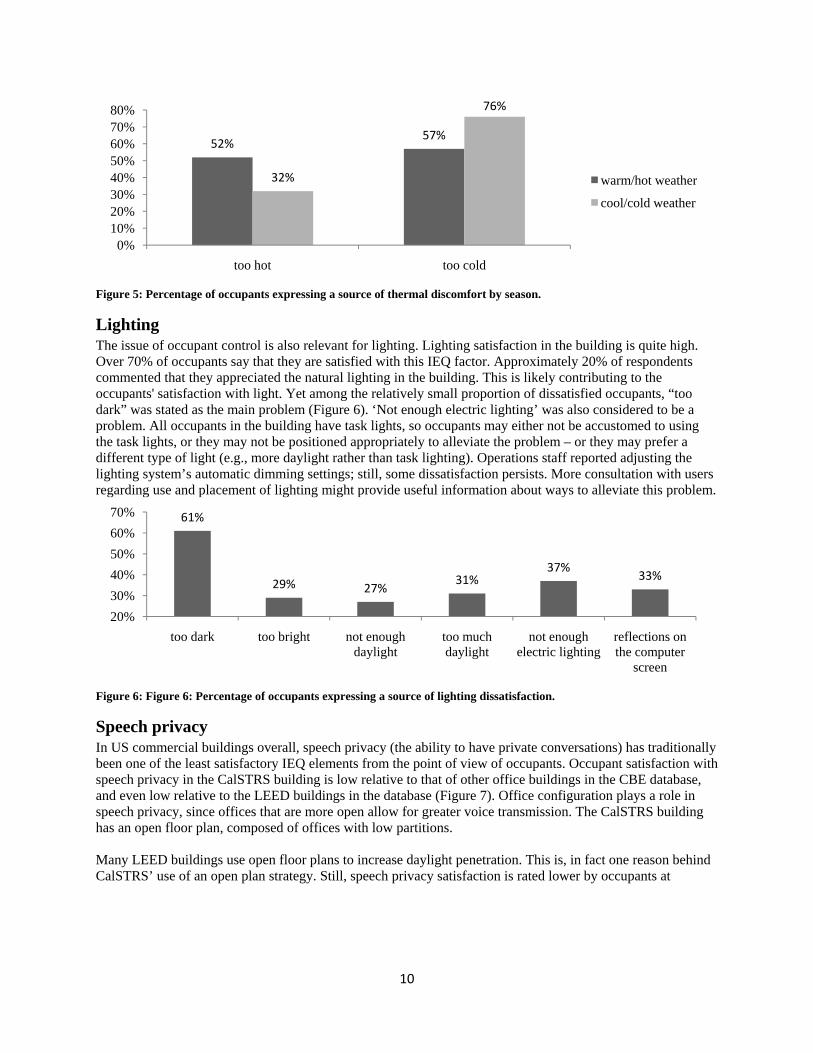
Temperature Occupants dissatisfied with temperature report being too cold during warm weather most often, with 57% of occupants who stated dissatisfaction with the thermal environment saying that they were sometimes too cold (Figure 5). Overcooling – at least from the perspective of individual occupants -- is common in operating buildings (Mendell, 2009). Similarly, at a somewhat lower rate, 32% of occupants that reported dissatisfaction with the thermal environment reported being too hot during cold weather. As in many US office buildings, these “overcooled” and “overheated” complaints flag a potential source for reduced building energy use, though there are obviously questions about coordinating individual and group preferences. To our understanding, the operations team has not yet systematically addressed the temperature complaints due to building management system limitations. It also appears that many occupants may not actively use the UFAD airflow diffusers to control the amount of air they receive. Doing so might reduce some thermal discomfort. This is a potential area for investigation on usability as well as on occupant education.
8 All buildings that include underfloor air distribution in some part of the building.
CalSTRS percentile in CBE database by IEQ factor temperature 91%
air quality 86%
light level 64%
visual comfort 62%
noise level 56%
speech privacy 30%
Table 3: Percentage of buildings in the CBE database that score lower than the CalSTRS building.
10
Figure 5: Percentage of occupants expressing a source of thermal discomfort by season.
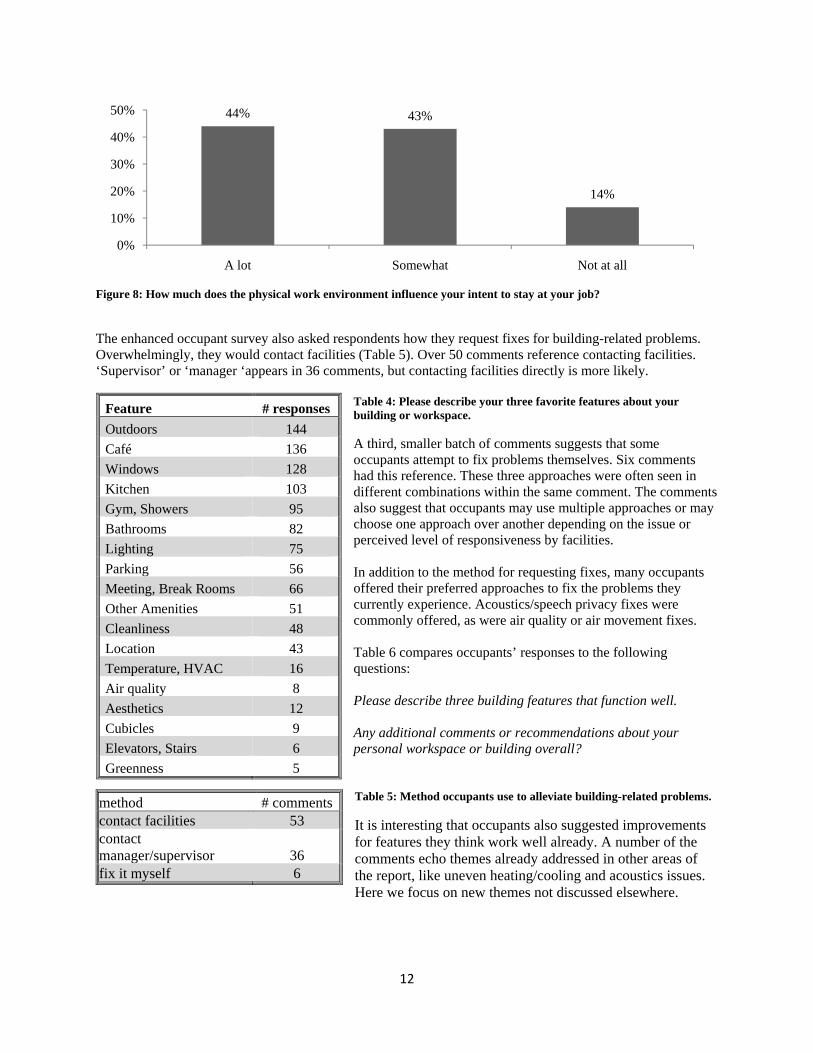
Lighting The issue of occupant control is also relevant for lighting. Lighting satisfaction in the building is quite high. Over 70% of occupants say that they are satisfied with this IEQ factor. Approximately 20% of respondents commented that they appreciated the natural lighting in the building. This is likely contributing to the occupants' satisfaction with light. Yet among the relatively small proportion of dissatisfied occupants, “too dark” was stated as the main problem (Figure 6). ‘Not enough electric lighting’ was also considered to be a problem. All occupants in the building have task lights, so occupants may either not be accustomed to using the task lights, or they may not be positioned appropriately to alleviate the problem – or they may prefer a different type of light (e.g., more daylight rather than task lighting). Operations staff reported adjusting the lighting system’s automatic dimming settings; still, some dissatisfaction persists. More consultation with users regarding use and placement of lighting might provide useful information about ways to alleviate this problem.
Figure 6: Figure 6: Percentage of occupants expressing a source of lighting dissatisfaction.
Speech privacy In US commercial buildings overall, speech privacy (the ability to have private conversations) has traditionally been one of the least satisfactory IEQ elements from the point of view of occupants. Occupant satisfaction with speech privacy in the CalSTRS building is low relative to that of other office buildings in the CBE database, and even low relative to the LEED buildings in the database (Figure 7). Office configuration plays a role in speech privacy, since offices that are more open allow for greater voice transmission. The CalSTRS building has an open floor plan, composed of offices with low partitions. Many LEED buildings use open floor plans to increase daylight penetration. This is, in fact one reason behind CalSTRS’ use of an open plan strategy. Still, speech privacy satisfaction is rated lower by occupants at
52%57%
32%
76%
0%10%20%30%40%50%60%70%80%
too hot too cold
warm/hot weather
cool/cold weather
61%
29% 27%31%
37%33%
20%
30%
40%
50%
60%
70%
too dark too bright not enough daylight
too much daylight
not enough electric lighting
reflections on the computer
screen

11
CalSTRS than other LEED buildings in the CBE database.
Figure 7: Sound privacy satisfaction.
Occupant density may also affect speech privacy satisfaction. The average of office buildings in 2003 CBECs shows 200 square feet more per person than CalSTRS average occupancy9. However, the building is often less than fully occupied. At 75% occupied (the reported operating occupancy) the square footage per person roughly matches that reported in the CBE database and CBECS. Acoustics is the lowest scoring factor across all buildings in the CBE database, so we might expect acoustics dissatisfaction in the CalSTRS building even at 75% occupancy, where it about matches the density in other buildings in the CBE database. Several other factors may also be contributing to the acoustics problems. The first is that underfloor air distribution systems are quieter than overhead systems. While overhead systems provide some white noise and sound masking, UFAD systems do not. Most of the CalSTRS building occupants previously worked in a building with an overhead system, so the new, quiet UFAD system represented a change of conditions for them. Additionally, some floors in the CalSTRS building have high-noise uses like call centers. While sound privacy scores are negative on all floors throughout the building, floors with the high-noise uses have even lower scores. The interviews revealed that an acoustical consultant was involved in the project. Thus, the building's owners were aware of the potential for acoustics problems. Still they judged that the potential solution of sound masking was cost prohibitive from their perspective.
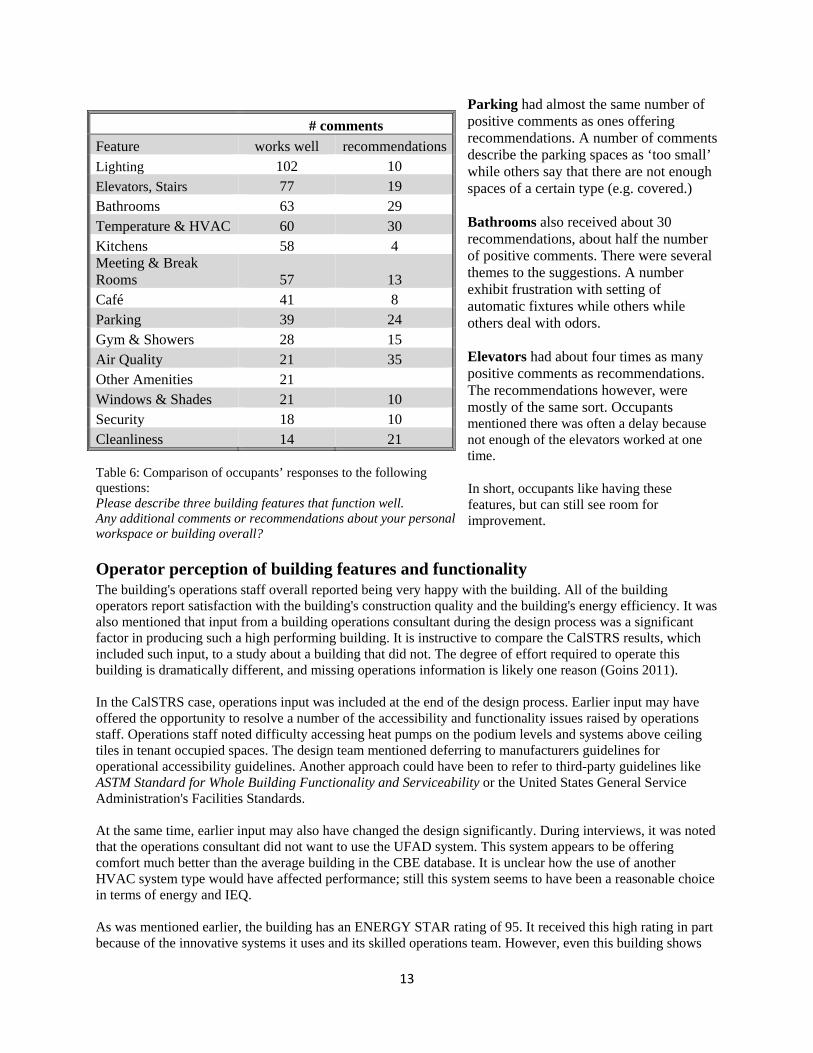
Occupant perception of building features and functionality 80% of occupants said that the building affected their intent to stay positively (Figure 8). The enhanced occupant survey asked occupants to list their three favorite features of the building. Occupants reported that that the ability to get outdoors, the cafe, the windows and the common kitchens were their favorite aspects about the building (Table 4). Occupants thought the lighting, elevators and stairs, bathrooms and HVAC systems worked well (Table 6.) Other items on this list included parking, cleanliness and air quality.
9 CBE’s building size metric is based on gross square footage and is entered by building operators. CBECs data are also reported by similar building personnel and is also based on gross square footage. See: http://eber.ed.ornl.gov/pub/CBECS03/2003%20CBECS%20Questionnaire.pdf
22%
30%28% 29%
0%
5%
10%
15%
20%
25%
30%
35%
CalSTRS LEED CBE office UFAD
12
Figure 8: How much does the physical work environment influence your intent to stay at your job?
The enhanced occupant survey also asked respondents how they request fixes for building-related problems. Overwhelmingly, they would contact facilities (Table 5). Over 50 comments reference contacting facilities. ‘Supervisor’ or ‘manager ‘appears in 36 comments, but contacting facilities directly is more likely.
Table 4: Please describe your three favorite features about your building or workspace.
A third, smaller batch of comments suggests that some occupants attempt to fix problems themselves. Six comments had this reference. These three approaches were often seen in different combinations within the same comment. The comments also suggest that occupants may use multiple approaches or may choose one approach over another depending on the issue or perceived level of responsiveness by facilities. In addition to the method for requesting fixes, many occupants offered their preferred approaches to fix the problems they currently experience. Acoustics/speech privacy fixes were commonly offered, as were air quality or air movement fixes. Table 6 compares occupants’ responses to the following questions: Please describe three building features that function well. Any additional comments or recommendations about your personal workspace or building overall? Table 5: Method occupants use to alleviate building-related problems.
It is interesting that occupants also suggested improvements for features they think work well already. A number of the comments echo themes already addressed in other areas of the report, like uneven heating/cooling and acoustics issues. Here we focus on new themes not discussed elsewhere.
44% 43%
14%
0%
10%
20%
30%
40%
50%
A lot Somewhat Not at all
Feature # responses
Outdoors 144
Café 136
Windows 128
Kitchen 103
Gym, Showers 95
Bathrooms 82
Lighting 75
Parking 56
Meeting, Break Rooms 66
Other Amenities 51
Cleanliness 48
Location 43
Temperature, HVAC 16
Air quality 8
Aesthetics 12
Cubicles 9
Elevators, Stairs 6
Greenness 5
method # comments contact facilities 53 contact manager/supervisor 36 fix it myself 6
13
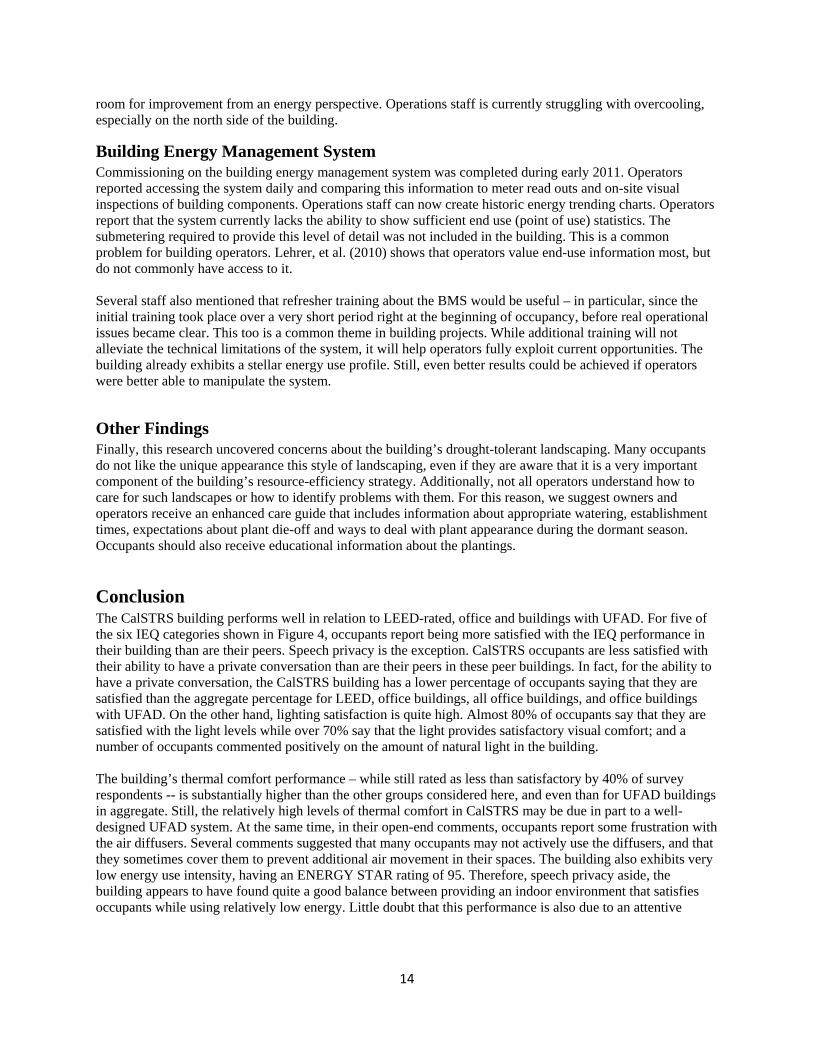
Parking had almost the same number of positive comments as ones offering recommendations. A number of comments describe the parking spaces as ‘too small’ while others say that there are not enough spaces of a certain type (e.g. covered.) Bathrooms also received about 30 recommendations, about half the number of positive comments. There were several themes to the suggestions. A number exhibit frustration with setting of automatic fixtures while others while others deal with odors. Elevators had about four times as many positive comments as recommendations. The recommendations however, were mostly of the same sort. Occupants mentioned there was often a delay because not enough of the elevators worked at one time. In short, occupants like having these features, but can still see room for improvement.
Operator perception of building features and functionality
The building's operations staff overall reported being very happy with the building. All of the building operators report satisfaction with the building's construction quality and the building's energy efficiency. It was also mentioned that input from a building operations consultant during the design process was a significant factor in producing such a high performing building. It is instructive to compare the CalSTRS results, which included such input, to a study about a building that did not. The degree of effort required to operate this building is dramatically different, and missing operations information is likely one reason (Goins 2011). In the CalSTRS case, operations input was included at the end of the design process. Earlier input may have offered the opportunity to resolve a number of the accessibility and functionality issues raised by operations staff. Operations staff noted difficulty accessing heat pumps on the podium levels and systems above ceiling tiles in tenant occupied spaces. The design team mentioned deferring to manufacturers guidelines for operational accessibility guidelines. Another approach could have been to refer to third-party guidelines like ASTM Standard for Whole Building Functionality and Serviceability or the United States General Service Administration's Facilities Standards. At the same time, earlier input may also have changed the design significantly. During interviews, it was noted that the operations consultant did not want to use the UFAD system. This system appears to be offering comfort much better than the average building in the CBE database. It is unclear how the use of another HVAC system type would have affected performance; still this system seems to have been a reasonable choice in terms of energy and IEQ. As was mentioned earlier, the building has an ENERGY STAR rating of 95. It received this high rating in part because of the innovative systems it uses and its skilled operations team. However, even this building shows
# comments
Feature works well recommendationsLighting 102 10 Elevators, Stairs 77 19 Bathrooms 63 29 Temperature & HVAC 60 30 Kitchens 58 4 Meeting & Break Rooms 57 13 Café 41 8 Parking 39 24 Gym & Showers 28 15 Air Quality 21 35 Other Amenities 21 Windows & Shades 21 10 Security 18 10 Cleanliness 14 21
Table 6: Comparison of occupants’ responses to the following questions: Please describe three building features that function well. Any additional comments or recommendations about your personal workspace or building overall?
14
room for improvement from an energy perspective. Operations staff is currently struggling with overcooling, especially on the north side of the building.
Building Energy Management System Commissioning on the building energy management system was completed during early 2011. Operators reported accessing the system daily and comparing this information to meter read outs and on-site visual inspections of building components. Operations staff can now create historic energy trending charts. Operators report that the system currently lacks the ability to show sufficient end use (point of use) statistics. The submetering required to provide this level of detail was not included in the building. This is a common problem for building operators. Lehrer, et al. (2010) shows that operators value end-use information most, but do not commonly have access to it. Several staff also mentioned that refresher training about the BMS would be useful – in particular, since the initial training took place over a very short period right at the beginning of occupancy, before real operational issues became clear. This too is a common theme in building projects. While additional training will not alleviate the technical limitations of the system, it will help operators fully exploit current opportunities. The building already exhibits a stellar energy use profile. Still, even better results could be achieved if operators were better able to manipulate the system.
Other Findings Finally, this research uncovered concerns about the building’s drought-tolerant landscaping. Many occupants do not like the unique appearance this style of landscaping, even if they are aware that it is a very important component of the building’s resource-efficiency strategy. Additionally, not all operators understand how to care for such landscapes or how to identify problems with them. For this reason, we suggest owners and operators receive an enhanced care guide that includes information about appropriate watering, establishment times, expectations about plant die-off and ways to deal with plant appearance during the dormant season. Occupants should also receive educational information about the plantings.
Conclusion The CalSTRS building performs well in relation to LEED-rated, office and buildings with UFAD. For five of the six IEQ categories shown in Figure 4, occupants report being more satisfied with the IEQ performance in their building than are their peers. Speech privacy is the exception. CalSTRS occupants are less satisfied with their ability to have a private conversation than are their peers in these peer buildings. In fact, for the ability to have a private conversation, the CalSTRS building has a lower percentage of occupants saying that they are satisfied than the aggregate percentage for LEED, office buildings, all office buildings, and office buildings with UFAD. On the other hand, lighting satisfaction is quite high. Almost 80% of occupants say that they are satisfied with the light levels while over 70% say that the light provides satisfactory visual comfort; and a number of occupants commented positively on the amount of natural light in the building. The building’s thermal comfort performance – while still rated as less than satisfactory by 40% of survey respondents -- is substantially higher than the other groups considered here, and even than for UFAD buildings in aggregate. Still, the relatively high levels of thermal comfort in CalSTRS may be due in part to a well-designed UFAD system. At the same time, in their open-end comments, occupants report some frustration with the air diffusers. Several comments suggested that many occupants may not actively use the diffusers, and that they sometimes cover them to prevent additional air movement in their spaces. The building also exhibits very low energy use intensity, having an ENERGY STAR rating of 95. Therefore, speech privacy aside, the building appears to have found quite a good balance between providing an indoor environment that satisfies occupants while using relatively low energy. Little doubt that this performance is also due to an attentive
15
building management staff who actively tries to reduce wasted energy.10 Finally, the CalSTRS project also reinforces the importance of operational input during the design process. All parties agree that this was a pivotal part of the project's success. We have also suggested several opportunities to improve the building’s performance. Several of the following conclusions comment on opportunities in the current green building landscape and are likely relevant to many current and future projects. Our recommendations are grouped thematically.
Thermal comfort and overcooling Many CalSTRS building occupants currently report that they are often too cold during the summer, indicating too much air conditioning, especially on the north side of the building. As other studies have indicated, “too much air conditioning” is not unusual (e.g., Moezzi and Goins 2010). However, it also presents an opportunity to increase occupant comfort while reducing energy use. CalSTRS building management staff indicated a desire to be better trained on capacities of the building management system – the training they had was early on, before the building was fully in operation. There may also be need for improved reporting capabilities (i.e. end-use energy data). In combination, these might help to alleviate this “too cold” problem. In the absence of these improvements, operations staff may be limited to a reactive response to both the comfort and energy implications of this problem. Additionally, it is unclear the extent to which occupants understood what to expect from the UFAD system, or how many really used the diffusers as designed. Closing the diffusers, thus reducing air movement could help to alleviate some discomfort. Additional training about this feature could be useful to occupants. This training should include acknowledgement that there may still be limited air movement even when the diffuser is completely closed, as several occupants expressed frustration about this issue.
Speech privacy Occupants report very low satisfaction with speech privacy throughout the building. Floors with call centers exhibit the most dissatisfaction. Though expensive, sound masking is one solution to this problem. Another possibility would be to design trainings or policies designed to alleviate these problems and that suggest alternative behaviors like relocating “loud” individuals or activities. Speech privacy is, in fact, indirectly related to energy use, in that features designed to reduce energy use can compete with features that would increase speech privacy. Natural light replaces electric light and lighting energy by opening up the floor plan and reducing partition heights. This choice can produce energy (and collaboration) benefits, but can also reduce speech privacy. The conflict between speech privacy and natural light is a relevant theme in the CalSTRS building and many other green buildings CBE has studied. Additionally, during this project, operators from several buildings reported frustration about the lack of suitable solutions to the conflict. This suggests that additional research is needed in this area.
Occupant controls for energy and comfort Though not designed to collect detailed evidence on this point, our study suggests that occupants may make less use of the controls available to them than expected by the designers. In the data collected here, many occupants did not seem aware of the controls available to them. For example, about ¾ of occupants report having task lights despite all desks being equipped with one. Periodic training or education about these controls could increase their frequency of use by occupants, as well as affecting occupant expectations and satisfaction positively. Knowing how occupants actually use controls, and what they expect of them, is an area ripe for more research.
10 Note that at the time of our interviews, the building was just completing the LEED EBOM certification process.

16
A pre-design survey about control acceptability and use may also have been a useful tool for the design team to employ. Several occupant comments suggest that experiences with controls in past buildings influenced expectations about controls in this building. A better understanding of these expectations may have led to greater use and acceptance of the installed controls. There is a general need for greater knowledge about occupant expectation regarding their controls and other building features as more and more buildings are employing energy reduction strategies that require occupant action.
Operator/building controls Follow-up training on the use of the building management system could help here as well. Operations staff reported only recently being able to view historic energy information, so it remains an open question how this data will be used. They also reported dissatisfaction with some of the current control sequences, which they had learned to override. Additional training and customization could help operators better exploit the system’s functions and reconfigure the system to meet current operational needs. The need for improvement in BMS is recurring theme in CBE’s field studies. There is also a need for more information about the kinds of information most useful to operators and the best ways to present this information to them. Lehrer (2010) represents an initial look at this issue, but further study is required.
Constituent input While a building operations consultant was involved in the design process, we suggest that earlier involvement could have resolved some of the functionality concerns currently observed in the building. For many projects, of course, who will eventually be operating the building is unknown at the design phase. Still a consultant serving in this capacity may be able to offer appropriate information. Third-party guidelines for functionality and serviceability may also be useful in these situations. Little input from occupants (outside of one furniture charrette) appears to have filtered into the design process. Information about occupant control use is one area where such involvement could have benefitted the project. One possibility is that the design team use web-based pre-design surveys to gather this information from occupants. There is a potential drawback, of course, in that users who provided input that they believe was not heeded may be especially disappointed. In general, many firms may be engaged in related pre-design activities, but do not often visit the project after completion to appraise the success of their effort. Without an understanding how their design decision affect occupants, such efforts risk misinterpreting pre-design survey results. For this reason, we suggest consulting results from post-occupancy studies – customized, as necessary, to assess particular issues -- to assist with the development of pre-design studies.
Landscaping To manage owner and operator expectations regarding drought-tolerant plants, we suggest they receive an enhanced care guide that includes information about appropriate watering, establishment times, expectations about plant die-off and ways to deal with plant appearance during the dormant season. Occupants can receive educational information about the plantings. While landscaping does not have a direct relationship late to energy use, it may reflect on an organization's ability to employ sustainability strategies. Prior research (Moezzi and Goins, 2010) suggests that occupants' willingness to take conservation-related actions is affected by their notion of the reasonableness and success of organization's conservation strategies, of which drought-tolerant landscaping is one. In other words, occupants are less likely to conserve if they do not think the organization as a whole conserves energy.
17
This case study represents a 'critical case' because of its combination of relatively low energy use and relatively high occupant satisfaction with most core indoor environmental quality factors. Occupant density is greater (at full occupancy) than CBECS and CBE averages, which as noted above may negatively impact acoustics and speech privacy. Finally, the project used a design-bid-build procurement process and an integrated design process. These factors will likely influence the usefulness of future comparisons. The findings presented here could likely apply to other office building projects that are also subject to similar constraints.
References Goins, John. “Case Study of Kresge Foundation Office Complex”, April 1, 2011. http://www.escholarship.org/uc/item/6db458q9. Lehrer, D., and J. Vasudev. “Visualizing Information to Improve Building Performance: A Study of Expert Users”, August 15, 2010. http://www.escholarship.org/uc/item/4n08r2q2. Mendell, Mark. “Development and Field-Testing of a Study Protocol, including a Web-Based Occupant Survey Tool, for Use in Intervention Studies of Indoor Environmental Quality,” August 18, 2009. http://www.escholarship.org/uc/item/03b8f09b.
Moezzi, Mithra, and John Goins. “Text mining for occupant perspectives on the physical workplace.” Building Research & Information 39, no. 2 (2011): 169.
Zagreus, L., C. Huizenga, E. Arens, and D. Lehrer. “Listening to the Occupants: A Web-based Indoor Environmental Quality Survey”, December 1, 2004. http://www.escholarship.org/uc/item/8cf6c6dr.