Embed Size (px)
Citation preview

UNITED STATESSECURITIES AND EXCHANGE COMMISSION
Washington, D.C. 20549
FORM 10-Q☒ Quarterly Report Pursuant to Section 13 or 15(d) of the Securities Exchange Act of 1934
For The Quarterly Period Ended March 31, 2018OR
☐ Transition Report Pursuant to Section 13 or 15(d) of the Securities Exchange Act of 1934For the transition period from ____________ to ____________
Commission File Number 001-14039
Callon Petroleum Company(Exact Name of Registrant as Specified in Its Charter)
�
Delaware(State or Other Jurisdiction ofIncorporation or Organization)
64-0844345(IRS Employer
Identification No.)
200 North Canal Street
Natchez, Mississippi(Address of Principal Executive Offices)
39120(Zip Code)
601-442-1601(Registrant’s Telephone Number, Including Area Code)
Not Applicable(Former Name, Former Address and Former Fiscal Year, If Changed Since Last Report)
Indicate by check mark whether registrant (1) has filed all reports required to be filed by Section 13 or 15(d) of the Securities Exchange Actof 1934 during the preceding 12 months (or for such shorter period that the registrant was required to file such reports), and (2) has beensubject to such filing requirements for the past 90 days. Yes ☒ No ☐
Indicate by check mark whether the registrant has submitted electronically and posted on its corporate Web site, if any, every InteractiveData File required to be submitted and posted pursuant to Rule 405 of Regulation S-T (232.405 of this chapter) during the preceding 12months (or for such shorter period that the registrant was required to submit and post such files). Yes ☒ No ☐
Indicate by check mark whether the registrant is a large accelerated filer, an accelerated filer, a non-accelerated filer, smaller reportingcompany, or an emerging growth company. See the definitions of “large accelerated filer,” “accelerated filer,” “smaller reportingcompany,” and “emerging growth company” in Rule 12b-2 of the Exchange Act (check one):
Large accelerated filer ☒ Accelerated filer ☐ Non-accelerated filer ☐ (Do not check if smaller reporting company) Smaller reporting company ☐ Emerging growth company ☐
If an emerging growth company, indicate by check mark if the registrant has elected not to use the extended transition period for complyingwith any new or revised financial accounting standards provided pursuant to Section 13(a) of the Exchange Act. ☐
Indicate by check mark whether the registrant is a shell company (as defined in Rule 12b-2 of the Exchange Act). Yes ☐ No ☒The Registrant had 201,958,575 shares of common stock outstanding as of April 27, 2018.

Table of Contents
Part I. Financial Information Item 1. Financial Statements (Unaudited)
Consolidated Balance Sheets 4
Consolidated Statements of Operations 5
Consolidated Statements of Cash Flows 6
Notes to Consolidated Financial Statements 7 Item 2. Management’s Discussion and Analysis of Financial Condition and Results of Operations 19 Item 3. Quantitative and Qualitative Disclosures about Market Risk 27 Item 4. Controls and Procedures 28 Part II. Other Information Item 1. Legal Proceedings 29 Item 1A. Risk Factors 29 Item 2. Unregistered Sales of Equity Securities and Use of Proceeds 29 Item 3. Defaults Upon Senior Securities 29 Item 4. Mine Safety Disclosures 29 Item 5. Other Information 29 Item 6. Exhibits 30
2
Table of Contents
Glossary of Certain Terms
All defined terms under Rule 4-10(a) of Regulation S-X shall have their prescribed meanings when used in this report. As used in thisdocument:
• ARO: asset retirementobligation.
• ASU: accounting standardsupdate.
• Bbl or Bbls: barrel or barrels of oil or natural gasliquids.
• BOE: barrel of oil equivalent, determined by using the ratio of one Bbl of oil or NGLs to six Mcf of gas. The ratio of one barrelof oil or NGL to six Mcf of natural gas is commonly used in the industry and represents the approximate energy equivalence of oilor NGLs to natural gas, and does not represent the economic equivalency of oil and NGLs to natural gas. The sales price of a barrelof oil or NGLs is considerably higher than the sales price of six Mcf of natural gas.
• BBtu: billionBtu.
• BOE/d: BOE perday.
• BLM: Bureau of LandManagement.
• Btu: a British thermal unit, which is a measure of the amount of energy required to raise the temperature of one pound of waterone degree Fahrenheit.
• Completion: The process of treating a drilled well followed by the installation of permanent equipment for the production of oilor natural gas or, in the case of a dry hole, the reporting of abandonment to the appropriate agency.
• Cushing: An oil delivery point that serves as the benchmark oil price for West TexasIntermediate.
• DOI: Department ofInterior.
• EPA: Environmental ProtectionAgency.
• FASB: Financial Accounting StandardsBoard.
• GAAP: Generally Accepted Accounting Principles in the UnitedStates.
• Henry Hub: A natural gas pipeline delivery point that serves as the benchmark natural gas price underlying NYMEX natural gasfutures contracts.
• Horizontal drilling: A drilling technique used in certain formations where a well is drilled vertically to a certain depth and thendrilled at a right angle within a specified interval.
• GHG: greenhousegases.
• LIBOR: London Interbank OfferedRate.
• LOE: lease operatingexpense.
• MBbls: thousand barrels ofoil.
• MBOE: thousandBOE.
• Mcf: thousand cubic feet of naturalgas.
• MMBOE: millionBOE.
• MMBtu: millionBtu.
• MMcf: million cubic feet of naturalgas.
• NGL or NGLs : natural gas liquids, such as ethane, propane, butanes and natural gasoline that are extracted from natural gasproduction streams.
• NYMEX: New York MercantileExchange.
• Oil: includes crude oil andcondensate.
• OPEC: Organization of Petroleum ExportingCountries.
• PDPs: proved developed producingreserves.
• PDNPs: proved developed non-producingreserves.
• PUDs: proved undevelopedreserves.
• Realized price: The cash market price less all expected quality, transportation and demand

adjustments.• Royalty interest: An interest that gives an owner the right to receive a portion of the resources or revenues without having to
carry any costs of development.• RSU: restricted stock
units.• SEC: United States Securities and Exchange
Commission.• Working interest : An operating interest that gives the owner the right to drill, produce and conduct operating activities on the
property and receive a share of production and requires the owner to pay a share of the costs of drilling and production operations.• WTI: West Texas Intermediate grade crude oil, used as a pricing benchmark for sales contracts and NYMEX oil futures
contracts.
With respect to information relating to our working interest in wells or acreage, “net” oil and gas wells or acreage is determined bymultiplying gross wells or acreage by our working interest therein. Unless otherwise specified, all references to wells and acres are gross.
3

Table of Contents
Part I. Financial InformationItem I. Financial Statements
Callon Petroleum CompanyConsolidated Balance Sheets
(in thousands, except par and per share data)
March 31, 2018 December 31, 2017ASSETS Unaudited Current assets: Cash and cash equivalents $ 18,473 $ 27,995Accounts receivable 122,411 114,320Fair value of derivatives 4,210 406Other current assets 2,078 2,139Total current assets 147,172 144,860Oil and natural gas properties, full cost accounting method:
Evaluated properties 3,598,868 3,429,570Less accumulated depreciation, depletion, amortization and impairment (2,119,599 ) (2,084,095 )Net evaluated oil and natural gas properties 1,479,269 1,345,475Unevaluated properties 1,174,385 1,168,016
Total oil and natural gas properties 2,653,654 2,513,491Other property and equipment, net 21,173 20,361Restricted investments 3,382 3,372Deferred tax asset 26 52Deferred financing costs 4,588 4,863Acquisition deposit — 900Other assets, net 5,524 5,397Total assets $ 2,835,519 $ 2,693,296LIABILITIES AND STOCKHOLDERS’ EQUITY Current liabilities: Accounts payable and accrued liabilities $ 187,267 $ 162,878Accrued interest 18,491 9,235Cash-settleable restricted stock unit awards 4,081 4,621Asset retirement obligations 2,784 1,295Fair value of derivatives 25,912 27,744Total current liabilities 238,535 205,773Senior secured revolving credit facility 75,000 25,0006.125% senior unsecured notes due 2024, net of unamortized deferred financing costs 595,374 595,196Asset retirement obligations 7,717 4,725Cash-settleable restricted stock unit awards 2,392 3,490Deferred tax liability 1,950 1,457Fair value of derivatives 2,942 1,284Other long-term liabilities 465 405Total liabilities 924,375 837,330Commitments and contingencies Stockholders’ equity: Preferred stock, series A cumulative, $0.01 par value and $50.00 liquidationpreference, 2,500,000 shares authorized; 1,458,948 shares outstanding 15 15Common stock, $0.01 par value, 300,000,000 shares authorized; 201,947,883 and201,836,172 shares outstanding, respectively 2,019 2,018Capital in excess of par value 2,182,599 2,181,359Accumulated deficit (273,489 ) (327,426 )Total stockholders’ equity 1,911,144 1,855,966Total liabilities and stockholders’ equity $ 2,835,519 $ 2,693,296
The accompanying notes are an integral part of these consolidated financial statements.
4

Table of Contents
Callon Petroleum CompanyConsolidated Statements of Operations
(Unaudited; in thousands, except per share data)
Three Months Ended March 31, 2018 2017Operating revenues:
Oil sales $ 115,286 $ 72,008Natural gas sales 12,154 9,355
Total operating revenues 127,440 81,363Operating expenses:
Lease operating expenses 13,039 12,937Production taxes 8,463 5,904Depreciation, depletion and amortization 35,417 24,433General and administrative 8,769 5,206Accretion expense 218 184Acquisition expense 548 450
Total operating expenses 66,454 49,114Income from operations 60,986 32,249
Other (income) expenses: Interest expense, net of capitalized amounts 460 665(Gain) loss on derivative contracts 4,481 (15,303)Other income (211) (708)
Total other (income) expense 4,730 (15,346)Income before income taxes 56,256 47,595
Income tax expense 495 466Net income 55,761 47,129Preferred stock dividends (1,824) (1,824)
Income available to common stockholders $ 53,937 $ 45,305Income per common share:
Basic $ 0.27 $ 0.23Diluted $ 0.27 $ 0.22
Shares used in computing income per common share:
Basic 201,921 201,054Diluted 202,588 201,740
The accompanying notes are an integral part of these consolidated financial statements.
5

Table of Contents
Callon Petroleum CompanyConsolidated Statements of Cash Flows
(Unaudited; in thousands)�
Three Months Ended March 31, 2018 2017Cash flows from operating activities: Net income $ 55,761 $ 47,129Adjustments to reconcile net income to cash provided by operating activities:
Depreciation, depletion and amortization 36,066 24,932Accretion expense 218 184Amortization of non-cash debt related items 453 665Deferred income tax expense 495 466Net gain on derivatives, net of settlements (3,978 ) (17,794 )Non-cash expense related to equity share-based awards 1,131 930Change in the fair value of liability share-based awards 1,012 (291 )Payments to settle asset retirement obligations (366 ) (765 )Changes in current assets and liabilities:
Accounts receivable (8,067 ) (4,066 )Other current assets 61 576Current liabilities 12,938 9,903Other long-term liabilities 87 —Other assets, net (507 ) (523 )
Payments to settle vested liability share-based awards(3,089 ) (8,662 )
Net cash provided by operating activities 92,215 52,684Cash flows from investing activities: Capital expenditures (111,330 ) (66,154 )Acquisitions (38,923 ) (648,485 )Acquisition deposit 900 46,138
Net cash used in investing activities (149,353 ) (668,501 )Cash flows from financing activities: Borrowings on senior secured revolving credit facility 80,000 —Payments on senior secured revolving credit facility (30,000 ) —Payment of preferred stock dividends (1,824 ) (1,824 )Tax withholdings related to restricted stock units (560 ) (79 )
Net cash provided by (used in) financing activities 47,616 (1,903 )Net change in cash and cash equivalents (9,522 ) (617,720 )
Balance, beginning of period 27,995 652,993Balance, end of period $ 18,473 $ 35,273
The accompanying notes are an integral part of these consolidated financial statements.
6

Callon Petroleum Company Notes to the Consolidated Financial Statements(All dollar amounts in thousands, except per share and per unit data)
Table of Contents
Index to the Notes to the Consolidated Financial Statements
1. Description of Business and Basis of Presentation 7. Fair Value Measurements2. Revenue Recognition 8. Income Taxes3. Acquisitions 9. Asset Retirement Obligations4. Earnings Per Share 10. Equity Transactions5. Borrowings 11. Other6. Derivative Instruments and Hedging Activities
Note 1 - Description of Business and Basis of Presentation
Description of business
Callon Petroleum Company is an independent oil and natural gas company established in 1950. The Company was incorporated under thelaws of the state of Delaware in 1994 and succeeded to the business of a publicly traded limited partnership, a joint venture with aconsortium of European investors and an independent energy company. As used herein, the “Company,” “Callon,” “we,” “us,” and “our”refer to Callon Petroleum Company and its predecessors and subsidiaries unless the context requires otherwise.
Callon is focused on the acquisition, development, exploration and exploitation of unconventional onshore, oil and natural gas reserves inthe Permian Basin. The Company’s operations to date have been predominantly focused on the horizontal development of severalprospective intervals, including multiple levels of the Wolfcamp formation and the Lower Spraberry shales. Callon has assembled a multi-year inventory of potential horizontal well locations and intends to add to this inventory through delineation drilling of emerging zones onits existing acreage and acquisition of additional locations through working interest acquisitions, leasing programs, acreage purchases, jointventures and asset swaps.
Basis of presentation
Unless otherwise indicated, all dollar amounts included within the Footnotes to the Financial Statements are presented inthousands, except for per share and per unit data.
The interim consolidated financial statements of the Company have been prepared in accordance with (1) GAAP, (2) the SEC’sinstructions to Quarterly Report on Form 10-Q and (3) Rule 10-01 of Regulation S-X, and include the accounts of Callon PetroleumCompany, and its subsidiary, Callon Petroleum Operating Company (“CPOC”). CPOC also has subsidiaries, namely Callon OffshoreProduction, Inc. and Mississippi Marketing, Inc.
These interim consolidated financial statements should be read in conjunction with the Company’s Annual Report on Form 10-K for theyear ended December 31, 2017. The balance sheet at December 31, 2017 has been derived from the audited financial statements at thatdate. Operating results for the periods presented are not necessarily indicative of the results that may be expected for the year endedDecember 31, 2018.
In the opinion of management, the accompanying unaudited consolidated financial statements reflect all adjustments, including normalrecurring adjustments and all intercompany account and transaction eliminations, necessary to present fairly the Company’s financialposition, the results of its operations and its cash flows for the periods indicated. Certain prior year amounts may have been reclassified toconform to current year presentation.
Accounting Standards Updates (“ASUs”)
Recently Adopted ASUs - Revenue Recognition
In May 2014, the FASB issued ASU No. 2014-09, Revenue from Contracts with Customers (“ASU 2014-09”). The standard requires anentity to recognize revenue in a manner that depicts the transfer of goods or services to customers at an amount that reflects theconsideration to which the entity expects to be entitled in exchange for those goods or services. ASU 2014-09 replaced most of the existingrevenue recognition requirements in GAAP. The standard can be applied using either the full retrospective approach or a modifiedretrospective approach at the date of adoption.
Throughout 2015 and 2016, the FASB issued several updates to the revenue recognition guidance in Accounting Standards CodificationTopic 606 (“ASC 606”). In August 2015, the FASB issued ASU No. 2015-14, deferring the effective date of ASU 2014-09 by one year. InMarch 2016, the FASB issued ASU No. 2016-08, Revenue from Contracts with Customers - Principal versus Agent Considerations(Reporting Revenue Gross versus Net). Under this update, an entity should recognize revenue to depict the transfer of promised goods
7

Callon Petroleum Company Notes to the Consolidated Financial Statements(All dollar amounts in thousands, except per share and per unit data)
Table of Contents
or services to customers in an amount that reflects the consideration to which the entity expects to be entitled in exchange for those goods orservices. In April 2016, the FASB issued ASU No. 2016-10, Revenue from Contracts with Customers - Identifying PerformanceObligations and Licensing. This update clarifies two principles of ASC 606: identifying performance obligations and the licensingimplementation guidance. In May 2016, the FASB issued ASU No. 2016-12, Revenue from Contracts with Customers - Narrow-ScopeImprovements and Practical Expedients. This update applies only to the following areas from ASC 606: assessing the collectabilitycriterion and accounting for contracts that do not meet the criteria for step 1, presentation of sales taxes and other similar taxes collectedfrom customers, non-cash consideration, contract modification at transition, completed contracts at transition and technical correction.
The Company adopted the new standard on January 1, 2018 using the modified retrospective method at the date of adoption. See Note 2 foradditional information on Revenue Recognition.
Recently adopted ASUs - Other
In August 2016, the FASB issued ASU No. 2016-15, Statement of Cash Flows (Topic 230): Classification of Certain Cash Receipts andCash Payments (“ASU 2016-15”). The objective of the standard is to reduce the existing diversity in practice of several cash flow issues,including debt prepayment or debt extinguishment costs, settlement of zero-coupon debt instruments or other debt instruments with couponrates that are insignificant in relation to the effective interest rate of the borrowing, contingent consideration payment made after a businesscombination, proceeds from the settlement of insurance claims, proceeds from the settlement of corporate-owned life insurance policies,including bank-owned life insurance policies, distributions received from equity method investees, beneficial interests in securitizationtransactions, and separately identifiable cash flows and application of the predominance principle. The guidance in ASU 2016-15 iseffective for public entities for annual reporting periods beginning after December 15, 2017, including interim periods therein. Earlyadoption is permitted and is to be applied on retrospective basis. The Company adopted this update on January 1, 2018 and it did not have amaterial impact on its consolidated financial statements.
In January 2017, the FASB issued ASU No. 2017-01, Business Combinations-Clarifying the Definition of a Business (“ASU 2017-01”).The guidance in ASU 2017-01 clarifies the definition of a business with the objective of adding guidance to assist entities with evaluatingwhether transactions should be accounted for as acquisitions or disposals of assets or businesses. The guidance provides a screen todetermine when a set of assets and activities is not a business. The screen requires that when substantially all of the fair value of the grossassets acquired or disposed of is concentrated in a single identifiable asset or a group of similar identifiable assets, the set is not a business.The guidance in ASU 2017-01 is effective for annual reporting periods beginning after December 15, 2017, including interim periodstherein. The Company adopted this update effective January 1, 2018. The adoption of this update did not have a material impact on itsconsolidated financial statements.
Recently issued ASUs
In February 2016, the FASB issued ASU No. 2016-02, Leases (Topic 842) (“ASU 2016-02”). The standard requires all lease transactions(with terms in excess of 12 months) to be recognized on the balance sheet as lease assets and lease liabilities. Public entities are required toapply ASU 2016-02 for annual and interim reporting periods beginning after December 15, 2018 with early adoption permitted. In January2018, the FASB issued ASU No. 2018-01, Leases (Topic 842) (“ASU 2018-01”). The standard provides an optional transition practicalexpedient to not evaluate under Topic 842 existing or expired land easements that were not previously accounted for as leases under thecurrent leases guidance in Topic 840. Public entities are required to apply ASU 2016-02 for annual and interim reporting periods beginningafter December 15, 2018 with early adoption permitted. The Company is currently evaluating the impact of its pending adoption of thisguidance on its consolidated financial statements.
Note 2 - Revenue Recognition
Revenue from contracts with customers
Oil sales
Under the Company’s oil sales contracts it sells oil production at the point of delivery and collects an agreed upon index price, net ofpricing differentials. The Company recognizes revenue when control transfers to the purchaser at the point of delivery at the net pricereceived.
Natural gas sales
Under the Company’s natural gas sales processing contracts, it delivers natural gas to a midstream processing entity. The midstreamprocessing entity gathers and processes the natural gas and remits proceeds to the Company for the resulting sale of natural gas. Therevenue received from the sale of NGLs is included in the natural gas sales. Under these processing agreements, when control of the
8

Callon Petroleum Company Notes to the Consolidated Financial Statements(All dollar amounts in thousands, except per share and per unit data)
Table of Contents
natural gas changes at the point of delivery, the treatment of gathering and treating fees are recorded net of revenues. Gathering andtreating fees have historically been recorded as an expense in lease operating expense in the statement of operations. The Company hasmodified the presentation of revenues and expenses to include these fees net of revenues. For the three months ended March 31, 2018,$1,252 of gathering and treating fees were recognized and recorded as a reduction to natural gas revenues in the consolidated statement ofoperations. For the three months ended March 31, 2017, $723 of gathering and treating fees were recognized and recorded as part of leaseoperating expense in the consolidated statement of operations.
Production imbalances
Previously, the Company elected to utilize the entitlements method to account for natural gas production imbalances, which is no longerapplicable. In conjunction with the Company’s adoption of the new revenue recognition accounting standards, there was no material impactto the financial statements due to this change in accounting for its production imbalances.
Transaction price allocated to remaining performance obligations
For the Company’s product sales that have a contract term greater than one year, it has utilized the practical expedient in AccountingStandards Codification 606-10-50-14, which states the Company is not required to disclose the transaction price allocated to remainingperformance obligations if the variable consideration is allocated entirely to a wholly unsatisfied performance obligation. Under these salescontracts, each unit of product generally represents a separate performance obligation; therefore future volumes are wholly unsatisfied anddisclosure of the transaction price allocated to remaining performance obligations is not required.
Prior period performance obligations
The Company records revenue in the month production is delivered to the purchaser. However, settlement statements for sales may not bereceived for 30 to 90 days after the date production is delivered, and as a result, the Company is required to estimate the amount ofproduction delivered to the purchaser and the price that will be received for the sale of the product. The Company records the differencesbetween estimates and the actual amounts received for product sales in the month that payment is received from the purchaser. TheCompany has existing internal controls for its revenue estimation process and related accruals, and any identified differences between itsrevenue estimates and actual revenue received historically have not been significant.
Note 3 - Acquisitions
Acquisitions were accounted for under the acquisition method of accounting, which involves determining the fair value of the assetsacquired and liabilities assumed under the income approach.
2018 Acquisitions
During the three months ended March 31, 2018, the Company completed acquisitions of additional working interests and acreage in theCompany’s existing core operating areas of Monarch and Wildhorse, located in the Permian Basin, for an aggregate total purchase price ofapproximately $35,900 excluding customary purchase price adjustments.
2017 Acquisitions
On February 13, 2017, the Company completed the acquisition of 29,175 gross (16,688 net) acres in the Delaware Basin, primarily locatedin Ward and Pecos Counties, Texas from American Resource Development, LLC, for total cash consideration of $646,559 excludingcustomary purchase price adjustments (the “Ameredev Transaction”). The Company funded the cash purchase price with the net proceedsof an equity offering (see Note 10 for additional information regarding the equity offering). The Company obtained an 82% averageworking interest (75% average net revenue interest) in the properties acquired in the Ameredev Transaction. In December 2016, inconnection with the execution of the purchase and sale agreement for the Ameredev Transaction, the Company paid a deposit in theamount of $46,138 to a third party escrow agent, which was recorded as Acquisition deposit on the balance sheet as of December 31, 2016.The following table summarizes the estimated acquisition date fair values of the acquisition:
Evaluated oil and natural gas properties $ 137,368Unevaluated oil and natural gas properties 509,359Asset retirement obligations (168)
Net assets acquired $ 646,559
On June 5, 2017, the Company completed the acquisition of 7,031 gross (2,488 net) acres in the Delaware Basin, located near the acreageacquired in the Ameredev Transaction discussed above, for total cash consideration of $52,500 excluding customary purchase price
9
Callon Petroleum Company Notes to the Consolidated Financial Statements(All dollar amounts in thousands, except per share and per unit data)
Table of Contents
adjustments. The Company funded the cash purchase price with its available cash and proceeds from the issuance of an additional $200,000of its 6.125% senior notes due 2024 (see Note 5 for additional information regarding the Company’s debt obligations).
Unaudited pro forma financial statements
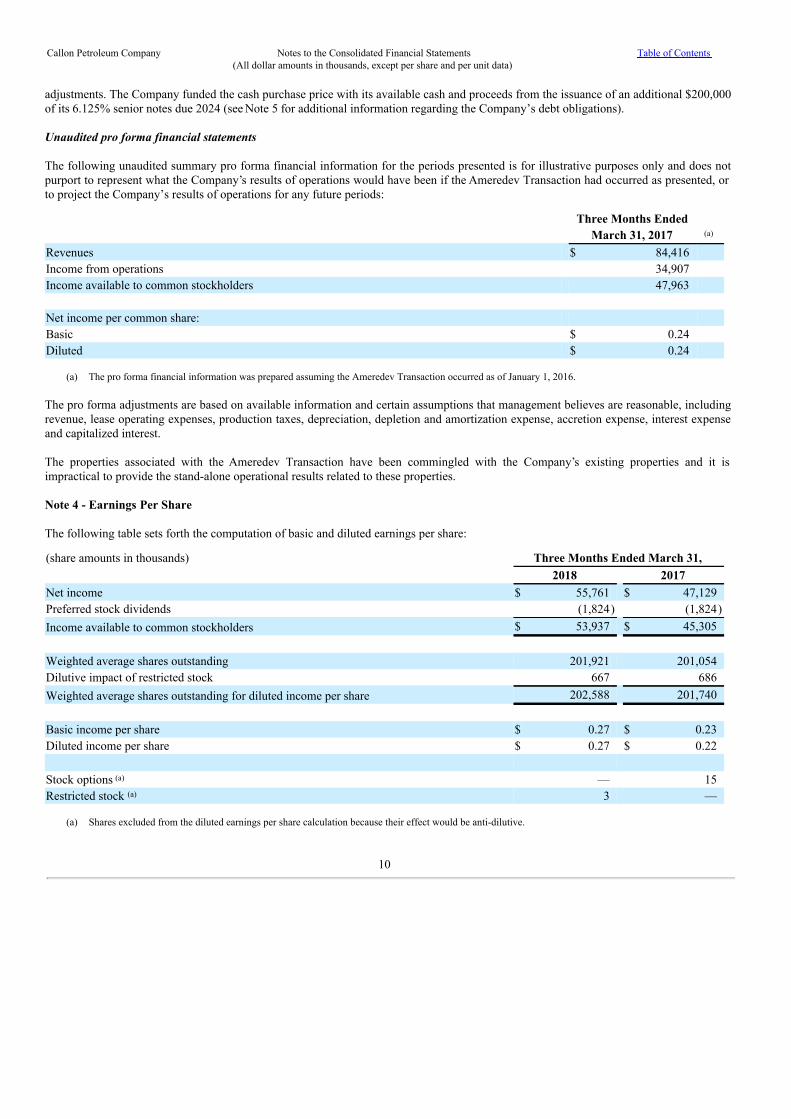
The following unaudited summary pro forma financial information for the periods presented is for illustrative purposes only and does notpurport to represent what the Company’s results of operations would have been if the Ameredev Transaction had occurred as presented, orto project the Company’s results of operations for any future periods:
Three Months Ended March 31, 2017 (a) Revenues $ 84,416 Income from operations 34,907 Income available to common stockholders 47,963 Net income per common share: Basic $ 0.24 Diluted $ 0.24
(a) The pro forma financial information was prepared assuming the Ameredev Transaction occurred as of January 1, 2016.
The pro forma adjustments are based on available information and certain assumptions that management believes are reasonable, includingrevenue, lease operating expenses, production taxes, depreciation, depletion and amortization expense, accretion expense, interest expenseand capitalized interest.
The properties associated with the Ameredev Transaction have been commingled with the Company’s existing properties and it isimpractical to provide the stand-alone operational results related to these properties.
Note 4 - Earnings Per Share
The following table sets forth the computation of basic and diluted earnings per share:
(share amounts in thousands) Three Months Ended March 31, 2018 2017Net income $ 55,761 $ 47,129Preferred stock dividends (1,824) (1,824)Income available to common stockholders $ 53,937 $ 45,305 Weighted average shares outstanding 201,921 201,054Dilutive impact of restricted stock 667 686Weighted average shares outstanding for diluted income per share 202,588 201,740 Basic income per share $ 0.27 $ 0.23Diluted income per share $ 0.27 $ 0.22 Stock options (a) — 15Restricted stock (a) 3 —
(a) Shares excluded from the diluted earnings per share calculation because their effect would be anti-dilutive.
10

Callon Petroleum Company Notes to the Consolidated Financial Statements(All dollar amounts in thousands, except per share and per unit data)
Table of Contents
Note 5 - Borrowings
The Company’s borrowings consisted of the following at: �
March 31, 2018 December 31, 2017Principal components: Senior secured revolving credit facility $ 75,000 $ 25,0006.125% senior unsecured notes due 2024 600,000 600,000
Total principal outstanding 675,000 625,000Premium on 6.125% senior unsecured notes due 2024, net of accumulated amortization 7,312 7,594Unamortized deferred financing costs (11,938 ) (12,398 )
Total carrying value of borrowings $ 670,374 $ 620,196
Senior secured revolving credit facility (the “Credit Facility”)
On May 25, 2017, the Company entered into the Sixth Amended and Restated Credit Agreement to the Credit Facility with a maturity dateof May 25, 2022. JPMorgan Chase Bank, N.A. is Administrative Agent, and participants include 17 institutional lenders. The total notionalamount available under the Credit Facility is $2,000,000. Amounts borrowed under the Credit Facility may not exceed the borrowing base,which is generally reviewed on a semi-annual basis. The Credit Facility is secured by first preferred mortgages covering the Company’smajor producing properties. As of March 31, 2018, the Credit Facility’s borrowing base was $700,000 with an elected commitment amountof $500,000.
As of March 31, 2018, there were $75,000 of principal and $1,250 in letters of credit outstanding under the Credit Facility. For the quarterended March 31, 2018, the Credit Facility had a weighted-average interest rate of 3.75%, calculated as the LIBOR plus a tiered rate rangingfrom 2.00% to 3.00%, which is determined based on utilization of the facility. In addition, the Credit Facility carried a commitment fee of0.375% per annum, payable quarterly, on the unused portion of the borrowing base.
On April 5, 2018, the Company entered into the first amendment to the Sixth Amended and Restated Credit Agreement to the CreditFacility, which (1) increased the borrowing base to $825,000, (2) increased the elected commitment amount to $650,000, (3) decreased theapplicable margins for interest rates, based on utilization, to a range of 1.25% to 2.25%, and (4) extended the maturity date to May 25,2023.
6.125% senior unsecured notes due 2024 (“6.125% Senior Notes”)
On October 3, 2016, the Company issued $400,000 aggregate principal amount of 6.125% Senior Notes with a maturity date of October 1,2024 and interest payable semi-annually beginning on April 1, 2017. The net proceeds of the offering, after deducting initial purchasers’discounts and estimated offering expenses, were approximately $391,270. The 6.125% Senior Notes are guaranteed on a senior unsecuredbasis by the Company’s wholly-owned subsidiary, Callon Petroleum Operating Company, and may be guaranteed by certain futuresubsidiaries. The subsidiary guarantor is 100% owned, all of the guarantees are full and unconditional and joint and several, the parentcompany has no independent assets or operations and any subsidiaries of the parent company other than the subsidiary guarantor are minor.
On May 19, 2017, the Company issued an additional $200,000 aggregate principal amount of its 6.125% Senior Notes which with theexisting $400,000 aggregate principal amount of 6.125% Senior Notes are treated as a single class of notes under the indenture. The netproceeds of the offering, including a premium issue price of 104.125% and after deducting initial purchasers’ discounts and estimatedoffering expenses, were approximately $206,139. The Company used the proceeds, in part, to fund an acquisition completed on June 5,2017 (discussed further in Note 3) and for general corporate purposes.
The Company may redeem the 6.125% Senior Notes in accordance with the following terms: (1) prior to October 1, 2019, a redemption ofup to 35% of the principal in an amount not greater than the net proceeds from certain equity offerings, and within 180 days of the closingdate of such equity offerings, at a redemption price of 106.125% of principal, plus accrued and unpaid interest, if any, to the date of theredemption, if at least 65% of the principal will remain outstanding after such redemption; (2) prior to October 1, 2019, a redemption of allor part of the principal at a price of 100% of principal of the amount redeemed, plus an applicable make-whole premium and accrued andunpaid interest, if any, to the date of the redemption; and (3) a redemption, in whole or in part, at a redemption price, plus accrued andunpaid interest, if any, to the date of the redemption, (i) of 104.594% of principal if the redemption occurs on or after October 1, 2019, butbefore October 1, 2020, and (ii) of 103.063% of principal if the redemption occurs on or after October 1, 2020, but before October 1, 2021,and (iii) of 101.531% of principal if the redemption occurs on or after October 1, 2021, but before October 1, 2022, and (iv) of 100% ofprincipal if the redemption occurs on or after October 1, 2022.
11

Callon Petroleum Company Notes to the Consolidated Financial Statements(All dollar amounts in thousands, except per share and per unit data)
Table of Contents
Following a change of control, each holder of the 6.125% Senior Notes may require the Company to repurchase all or a portion of the6.125% Senior Notes at a price of 101% of principal of the amount repurchased, plus accrued and unpaid interest, if any, to the date ofrepurchase.
Restrictive covenants
The Company’s Credit Facility and the indenture governing its 6.125% Senior Notes contain various covenants including restrictions onadditional indebtedness, payment of cash dividends and maintenance of certain financial ratios. The Company was in compliance withthese covenants at March 31, 2018.
Note 6 - Derivative Instruments and Hedging Activities
Objectives and strategies for using derivative instruments
The Company is exposed to fluctuations in oil and natural gas prices received for its production. Consequently, the Company believes it isprudent to manage the variability in cash flows on a portion of its oil and natural gas production. The Company utilizes a mix of collars,swaps, put and call options and similar derivative financial instruments to manage fluctuations in cash flows resulting from changes incommodity prices. The Company does not use these instruments for speculative or trading purposes.
Counterparty risk and offsetting
The use of derivative instruments exposes the Company to the risk that a counterparty will be unable to meet its commitments. While theCompany monitors counterparty creditworthiness on an ongoing basis, it cannot predict sudden changes in counterparties’ creditworthiness.In addition, even if such changes are not sudden, the Company may be limited in its ability to mitigate an increase in counterparty creditrisk. Should one of these counterparties not perform, the Company may not realize the benefit of some of its derivative instruments underlower commodity prices while continuing to be obligated under higher commodity price contracts subject to any right of offset under theagreements. Counterparty credit risk is considered when determining the fair value of a derivative instrument; see Note 7 for additionalinformation regarding fair value.
The Company executes commodity derivative contracts under master agreements with netting provisions that provide for offsetting assetsagainst liabilities. In general, if a party to a derivative transaction incurs an event of default, as defined in the applicable agreement, theother party will have the right to demand the posting of collateral, demand a cash payment transfer or terminate the arrangement. Financial statement presentation and settlements
Settlements of the Company’s derivative instruments are based on the difference between the contract price or prices specified in thederivative instrument and a benchmark price, such as the NYMEX price. To determine the fair value of the Company’s derivativeinstruments, the Company utilizes present value methods that include assumptions about commodity prices based on those observed inunderlying markets. See Note 7 for additional information regarding fair value.
Derivatives not designated as hedging instruments
The Company records its derivative contracts at fair value in the consolidated balance sheets and records changes in fair value as a gain orloss on derivative contracts in the consolidated statements of operations. Cash settlements are also recorded as a gain or loss on derivativecontracts in the consolidated statements of operations.
The following table reflects the fair value of the Company’s derivative instruments for the periods presented:
Balance Sheet Presentation Asset Fair Value Liability Fair Value Net Derivative Fair ValueCommodity Classification Line Description 3/31/2018 12/31/2017 3/31/2018 12/31/2017 3/31/2018 12/31/2017
Natural gas Current Fair value of derivatives $ 317 $ 406 $ — $ — $ 317 $ 406Oil Current Fair value of derivatives 3,893 — (25,912) (27,744) (22,019) (27,744)Oil Non-current Fair value of derivatives — — (2,942) (1,284) (2,942) (1,284)Totals $ 4,210 $ 406 $ (28,854) $ (29,028) $ (24,644) $ (28,622)
As previously discussed, the Company’s derivative contracts are subject to master netting arrangements. The Company’s policy is topresent the fair value of derivative contracts on a net basis in the consolidated balance sheet. The following presents the impact of thispresentation to the Company’s recognized assets and liabilities for the periods indicated:
12

Callon Petroleum Company Notes to the Consolidated Financial Statements(All dollar amounts in thousands, except per share and per unit data)
Table of Contents
March 31, 2018 Presented without As Presented with Effects of Netting Effects of Netting Effects of NettingCurrent assets: Fair value of derivatives $ 10,638 $ (6,428) $ 4,210
Current liabilities: Fair value of derivatives $ (32,340) $ 6,428 $ (25,912)Long-term liabilities: Fair value of derivatives (2,942 ) — (2,942 )
December 31, 2017 Presented without As Presented with Effects of Netting Effects of Netting Effects of NettingCurrent assets: Fair value of derivatives $ 406 $ — $ 406 Current liabilities: Fair value of derivatives $ (27,744) $ — $ (27,744)Long-term liabilities: Fair value of derivatives (1,284 ) — (1,284 )
For the periods indicated, the Company recorded the following related to its derivatives in the consolidated statement of operations as gainor loss on derivative contracts:
Three Months Ended March 31, 2018 2017Oil derivatives Net loss on settlements $ (8,916 ) $ (2,524 )Net gain on fair value adjustments 4,067 17,266
Total gain (loss) on oil derivatives $ (4,849 ) $ 14,742Natural gas derivatives Net gain on settlements $ 457 $ 33Net gain (loss) on fair value adjustments (89 ) 528
Total gain on natural gas derivatives $ 368 $ 561 Total gain (loss) on oil & natural gas derivatives $ (4,481 ) $ 15,303
13

Callon Petroleum Company Notes to the Consolidated Financial Statements(All dollar amounts in thousands, except per share and per unit data)
Table of Contents
Derivative positions
Listed in the tables below are the outstanding oil and natural gas derivative contracts as of March 31, 2018:
For the Remainder of For the Full Year ofOil contracts (WTI) 2018 2019Swap contracts
Total volume (MBbls) 1,559 —Weighted average price per Bbl $ 51.88 $ —
Collar contracts (two-way collars) Total volume (MBbls) 275 —Weighted average price per Bbl
Ceiling (short call) $ 60.50 $ —Floor (long put) $ 50.00 $ —
Collar contracts combined with short puts (three-way collars) Total volume (MBbls) 2,612 2,739Weighted average price per Bbl
Ceiling (short call option) $ 60.86 $ 62.96Floor (long put option) $ 48.95 $ 53.67Short put option $ 39.21 $ 43.67
For the Remainder of For the Full Year ofOil contracts (Midland basis differential) 2018 2019Swap contracts
Volume (MBbls) 3,895 —Weighted average price per Bbl $ (0.86 ) $ —
For the Remainder of For the Full Year ofNatural gas contracts (Henry Hub) 2018 2019Swap contracts
Total volume (BBtu) 4,125 — Weighted average price per MMBtu $ 2.91 —
Subsequent Event
The following derivative contract was executed subsequent to March 31, 2018:
For the Remainder of For the Full Year ofOil contracts (WTI) 2018 2019Collar contracts combined with short puts (three-way collars)
Volume (MBbls) — 730Weighted average price per Bbl
Ceiling (short call option) $ — $ 66.53Floor (long put option) $ — $ 55.00Short put option $ — $ 45.00
Note 7 - Fair Value Measurements
The fair value hierarchy included in GAAP gives the highest priority to Level 1 inputs, which consist of unadjusted quoted prices foridentical instruments in active markets. Level 2 inputs consist of quoted prices for similar instruments. Level 3 valuations are derived frominputs that are significant and unobservable, and these valuations have the lowest priority.
Fair value of financial instruments
Cash, cash equivalents, and restricted investments. The carrying amounts for these instruments approximated fair value due to the short-term nature or maturity of the instruments.
14
Callon Petroleum Company Notes to the Consolidated Financial Statements(All dollar amounts in thousands, except per share and per unit data)
Table of Contents
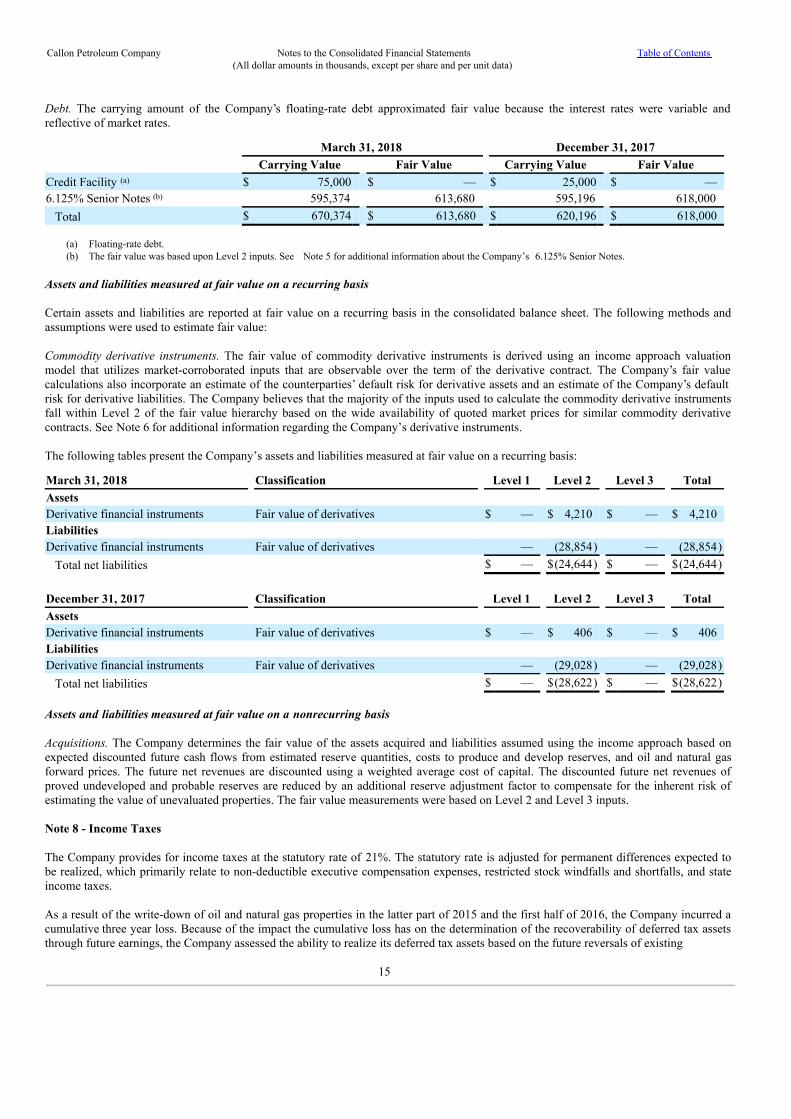
Debt. The carrying amount of the Company’s floating-rate debt approximated fair value because the interest rates were variable andreflective of market rates.
March 31, 2018 December 31, 2017Carrying Value Fair Value Carrying Value Fair Value
Credit Facility (a) $ 75,000 $ — $ 25,000 $ —6.125% Senior Notes (b) 595,374 613,680 595,196 618,000
Total $ 670,374 $ 613,680 $ 620,196 $ 618,000
(a) Floating-rate debt.(b) The fair value was based upon Level 2 inputs. See Note 5 for additional information about the Company’s 6.125% Senior Notes.
Assets and liabilities measured at fair value on a recurring basis
Certain assets and liabilities are reported at fair value on a recurring basis in the consolidated balance sheet. The following methods andassumptions were used to estimate fair value:
Commodity derivative instruments. The fair value of commodity derivative instruments is derived using an income approach valuationmodel that utilizes market-corroborated inputs that are observable over the term of the derivative contract. The Company’s fair valuecalculations also incorporate an estimate of the counterparties’ default risk for derivative assets and an estimate of the Company’s defaultrisk for derivative liabilities. The Company believes that the majority of the inputs used to calculate the commodity derivative instrumentsfall within Level 2 of the fair value hierarchy based on the wide availability of quoted market prices for similar commodity derivativecontracts. See Note 6 for additional information regarding the Company’s derivative instruments. The following tables present the Company’s assets and liabilities measured at fair value on a recurring basis:
March 31, 2018 Classification Level 1 Level 2 Level 3 TotalAssets Derivative financial instruments Fair value of derivatives $ — $ 4,210 $ — $ 4,210Liabilities Derivative financial instruments Fair value of derivatives — (28,854) — (28,854)
Total net liabilities $ — $(24,644) $ — $(24,644)
December 31, 2017 Classification Level 1 Level 2 Level 3 TotalAssets Derivative financial instruments Fair value of derivatives $ — $ 406 $ — $ 406Liabilities Derivative financial instruments Fair value of derivatives — (29,028) — (29,028)
Total net liabilities $ — $(28,622) $ — $(28,622)
Assets and liabilities measured at fair value on a nonrecurring basis
Acquisitions. The Company determines the fair value of the assets acquired and liabilities assumed using the income approach based onexpected discounted future cash flows from estimated reserve quantities, costs to produce and develop reserves, and oil and natural gasforward prices. The future net revenues are discounted using a weighted average cost of capital. The discounted future net revenues ofproved undeveloped and probable reserves are reduced by an additional reserve adjustment factor to compensate for the inherent risk ofestimating the value of unevaluated properties. The fair value measurements were based on Level 2 and Level 3 inputs.
Note 8 - Income Taxes
The Company provides for income taxes at the statutory rate of 21%. The statutory rate is adjusted for permanent differences expected tobe realized, which primarily relate to non-deductible executive compensation expenses, restricted stock windfalls and shortfalls, and stateincome taxes.
As a result of the write-down of oil and natural gas properties in the latter part of 2015 and the first half of 2016, the Company incurred acumulative three year loss. Because of the impact the cumulative loss has on the determination of the recoverability of deferred tax assetsthrough future earnings, the Company assessed the ability to realize its deferred tax assets based on the future reversals of existing
15

Callon Petroleum Company Notes to the Consolidated Financial Statements(All dollar amounts in thousands, except per share and per unit data)
Table of Contents
deferred tax liabilities. Accordingly, the Company established a full valuation allowance for the net U.S. federal deferred tax asset in 2015.In subsequent periods where the Company has recorded pre-tax income, it has reversed a portion of the U.S. federal valuation allowance,net of discrete items, to the extent necessary to offset U.S. federal income tax expense on pre-tax income recorded for the period. Incometax expense recorded in this period relates to deferred State of Texas gross margin tax. The valuation allowance was $49,166 as ofMarch 31, 2018.
Note 9 - Asset Retirement Obligations
The table below summarizes the activity for the Company’s asset retirement obligations:
Three Months EndedMarch 31, 2018
Asset retirement obligations at January 1, 2018 $ 6,020Accretion expense 218Liabilities incurred 44Liabilities settled (95 )Revisions to estimate (a) 4,314Asset retirement obligations at end of period 10,501Less: Current asset retirement obligations (2,784 )
Long-term asset retirement obligations at March 31, 2018 $ 7,717
(a) Revisions to estimated ARO obligations can result from changes in retirement cost estimates, revisions to estimated inflation rates and changes in theestimated timing of abandonment.
Certain of the Company’s operating agreements require that assets be restricted for abandonment obligations. Amounts recorded in theconsolidated balance sheet at March 31, 2018 as long-term restricted investments were $3,382. These assets, which primarily include short-term U.S. Government securities, are held in abandonment trusts dedicated to pay future abandonment costs for several of the Company’soil and natural gas properties.
Note 10 - Equity Transactions
10% Series A Cumulative Preferred Stock (“Preferred Stock”)
Holders of the Company’s Preferred Stock are entitled to receive, when, as and if declared by the Company’s Board of Directors, out offunds legally available for the payment of dividends, cumulative cash dividends at a rate of 10.0% per annum of the $50.00 liquidationpreference per share (equivalent to $5.00 per annum per share). Dividends are payable quarterly in arrears on the last day of each March,June, September and December when, as and if declared by the Company’s Board of Directors. Preferred Stock dividends were $1,824 forthe three months ended March 31, 2018 and 2017, respectively.
The Preferred Stock has no stated maturity and is not subject to any sinking fund or other mandatory redemption. On or after May 30, 2018,the Company may, at its option, redeem the Preferred Stock, in whole or in part, by paying $50.00 per share, plus any accrued and unpaiddividends to the redemption date.
Following a change of control in which the Company or the acquirer no longer have a class of common securities listed on a nationalexchange, the Company will have the option to redeem the Preferred Stock, in whole but not in part, for $50.00 per share in cash plusaccrued and unpaid dividends (whether or not declared) to the redemption date. If the Company does not exercise its option to redeem thePreferred Stock upon such change of control, the holders of the Preferred Stock have the option to convert the Preferred Stock into anumber of shares of the Company’s common stock based on the value of the common stock on the date of the change of control asdetermined under the certificate of designations for the Preferred Stock. If the change of control occurred on March 31, 2018, and theCompany did not exercise its right to redeem the Preferred Stock, using the closing price of $13.24 as the value of a share of commonstock, each share of Preferred Stock would be convertible into approximately 3.8 shares of common stock. If the Company exercises itsredemption rights relating to shares of Preferred Stock, the holders of Preferred Stock will not have the conversion right described above.
Common stock
O n December 19, 2016, the Company completed an underwritten public offering of 40,000,000 shares of its common stock for totalestimated net proceeds (after the underwriter’s discounts and estimated offering expenses) of approximately $634,934. Proceeds from theoffering were used to substantially fund the Ameredev Transaction, described in Note 3.
16

Callon Petroleum Company Notes to the Consolidated Financial Statements(All dollar amounts in thousands, except per share and per unit data)
Table of Contents
Note 11 - Other
Operating leases
As of March 31, 2018 the Company had contracts for five horizontal drilling rigs. The contract terms, as amended through March 31, 2018,will end on various dates between July 2018 and February 2021. All of the drilling rig contracts provide for early termination, withpenalties calculated at a reduced daily rate. In the event that Callon terminated all five drilling contracts as of May 2, 2018, the Companywould owe a maximum of $23,682 over the remaining terms of the respective contracts, offset by any revenues earned for replacementwork subsequently secured by the contractor. Management does not currently anticipate the early termination of any drilling rig contracts.
Other commitments
In March 2018, the Company entered into a contract for dedicated fracturing and pump down perforating crews, which will be effective onApril 16, 2018. The term of the agreement is for two years from the effective date.
17

Callon Petroleum Company Notes to the Consolidated Financial Statements(All dollar amounts in thousands, except per share and per unit data)
Table of Contents
Special Note Regarding Forward Looking Statements
This report includes “forward-looking statements” within the meaning of Section 27A of the Securities Act of 1933 (the “Securities Act”),as amended, and Section 21E of the Securities Exchange Act of 1934, as amended (the “Exchange Act”). These statements involve knownand unknown risks, uncertainties and other factors that may cause our actual results, performance or achievements to be materially differentfrom any future results, performance or achievements expressed or implied by the forward-looking statements. In some cases, you canidentify forward-looking statements in this Form 10-Q by words such as “anticipate,” “project,” “intend,” “estimate,” “expect,” “believe,”“predict,” “budget,” “projection,” “goal,” “plan,” “forecast,” “target” or similar expressions.
All statements, other than statements of historical facts, included in this report that address activities, events or developments that weexpect or anticipate will or may occur in the future are forward-looking statements, including such things as:
• our oil and gas reserve quantities, and the discounted present value of thesereserves;
• the amount and nature of our capitalexpenditures;
• our future drilling and development plans and our potential drillinglocations;
• the timing and amount of future production and operatingcosts;
• commodity price risk management activities and the impact on our average realizedprices;
• business strategies and plans ofmanagement;
• our ability to efficiently integrate recentacquisitions;
• prospect development and property acquisitions;and
• the expected impact of the Tax Cuts and Jobs Act of2017.
Some of the risks, which could affect our future results and could cause results to differ materially from those expressed in our forward-looking statements, include:
• general economic conditions including the availability of credit and access to existing lines ofcredit;
• the volatility of oil and natural gasprices;
• the uncertainty of estimates of oil and natural gasreserves;
• impairments;• the impact of
competition;• the availability and cost of seismic, drilling and other equipment, water, and
personnel;• operating hazards inherent in the exploration for and production of oil and natural
gas;• difficulties encountered during the exploration for and production of oil and natural
gas;• difficulties encountered in delivering oil and natural gas to commercial
markets;• changes in customer demand and producers’
supply;• the uncertainty of our ability to attract capital and obtain financing on favorable
terms;• compliance with, or the effect of changes in, the extensive governmental regulations regarding the oil and natural gas business
including those related to climate change and greenhouse gases;• the impact of government regulation, including regulation of hydraulic fracturing and water disposal
wells;• any increase in severance or similar
taxes;• the financial impact of accounting regulations and critical accounting
policies;• the comparative cost of alternative
fuels;• credit risk relating to the risk of loss as a result of non-performance by our
counterparties;• cyberattacks on the Company or on systems and infrastructure used by the oil and gas
industry;• weather conditions;
and

• any other factors listed in the reports we have filed and may file with theSEC.
We caution you that the forward-looking statements contained in this Form 10-Q are subject to all of the risks and uncertainties, many ofwhich are beyond our control, incident to the exploration for and development, production and sale of oil and natural gas. These risksinclude, but are not limited to, the risks described in Item 1A of our Annual Report on Form 10-K for the year ended December 31, 2017(the “2017 Annual Report on Form 10-K”), and all quarterly reports on Form 10-Q filed subsequently thereto.
Should one or more of the risks or uncertainties described herein or in our 2017 Annual Report on Form 10-K occur, or should underlyingassumptions prove incorrect, our actual results and plans could differ materially from those expressed in any forward-looking statements.We specifically disclaim all responsibility to publicly update any information contained in a forward-looking statement or any forward-looking statement in its entirety and therefore disclaim any resulting liability for potentially related damages.
All forward-looking statements attributable to us are expressly qualified in their entirety by this cautionary statement.
18

Callon Petroleum Company Management’s Discussion and Analysis of Financial Condition and Results Table of Contents
Item 2. Management’s Discussion and Analysis of Financial Condition and Results of Operations
General
The following management’s discussion and analysis describes the principal factors affecting the Company’s results of operations,liquidity, capital resources and contractual cash obligations. This discussion should be read in conjunction with the accompanyingunaudited consolidated financial statements and our 2017 Annual Report on Form 10-K, which include additional information about ourbusiness practices, significant accounting policies, risk factors, and the transactions that underlie our financial results. Our website addressis www.callon.com. All of our filings with the SEC are available free of charge through our website as soon as reasonably practicable afterwe file them with, or furnish them to, the SEC. Information on our website does not form part of this report on Form 10-Q.
We are an independent oil and natural gas company established in 1950. We are focused on the acquisition, development, exploration andexploitation of unconventional, onshore, oil and natural gas reserves in the Permian Basin. The Permian Basin is located in West Texas andsoutheastern New Mexico and is comprised of three primary sub-basins: the Midland Basin, the Delaware Basin, and the Central BasinPlatform. We have historically been focused on the Midland Basin and more recently entered the Delaware Basin through an acquisitioncompleted in February 2017. Our operating culture is centered on responsible development of hydrocarbon resources, with a particularfocus on safety and the environment, which we believe strengthens our operational performance. Our operational performance is enhancedby the empowerment of our employees. Our drilling activity is predominantly focused on the horizontal development of several prospectiveintervals, including multiple levels of the Wolfcamp formation and the Lower Spraberry shales. We have assembled a multi-year inventoryof potential horizontal well locations and intend to add to this inventory through delineation drilling of emerging zones on our existingacreage and acquisition of additional locations through working interest acquisitions, leasing programs, acreage purchases, joint venturesand asset swaps. Our production was approximately 77% oil and 23% natural gas for the three months ended March 31, 2018. OnMarch 31, 2018, our net acreage position in the Permian Basin was approximately 56,929 net acres.
Operational Highlights
All of our producing properties are located in the Permian Basin. As a result of our acquisitions and horizontal development efforts, ourproduction grew 30% for the three months ended March 31, 2018, compared to the same period of 2017, increasing to 2,391 MBOE from1,838 MBOE.
For the three months ended March 31, 2018, we drilled 16 gross (13.2 net) horizontal wells and completed 8 gross (4.4 net) horizontal wellsand had 12 gross (10.8 net) horizontal wells awaiting completion.
As of March 31, 2018, we had 553 gross (443.2 net) working interest oil wells, three gross (0.1 net) royalty interest oil wells and no naturalgas wells. A well is categorized as an oil well or a natural gas well based upon the ratio of oil to natural gas reserves on a BOE basis.However, most of our wells produce both oil and natural gas.
Liquidity and Capital Resources
Historically, our primary sources of capital have been cash flows from operations, borrowings from financial institutions, the sale of debtand equity securities, and asset dispositions. Our primary uses of capital have been for the acquisition, development, exploration andexploitation of oil and natural gas properties, in addition to refinancing of debt instruments. We continue to evaluate other sources of capitalto complement our cash flow from operations and as we pursue our long-term growth plans.
As of March 31, 2018, we had $75.0 million outstanding on our Credit Facility, which had a borrowing base of $700 million with an electedcommitment of $500 million. Effective April 5, 2018, the borrowing base was increased to $825 million with an elected commitment of$650 million. For the three months ended March 31, 2018, cash and cash equivalents decreased $16.8 million to $18.5 million compared to$35.3 million at March 31, 2017.
Liquidity and cash flow
Three Months Ended March 31,(in thousands) 2018 2017Net cash provided by operating activities $ 92,215 $ 52,684Net cash used in investing activities (149,353 ) (668,501 )Net cash provided by (used in) financing activities 47,616 (1,903 )
Net change in cash and cash equivalents $ (9,522) $ (617,720)
19

Callon Petroleum Company Management’s Discussion and Analysis of Financial Condition and Results Table of Contents
Operating activities. For the three months ended March 31, 2018, net cash provided by operating activities was $92.2 million compared tonet cash provided by operating activities of $52.7 million for the same period in 2017. The change was predominantly attributable to thefollowing:
• An increase inrevenue;
• A decrease on settlements of derivativecontracts;
• An increase in certain operating expenses related to acquired properties;
• An decrease in payments in cash-settled restricted stock unit (“RSU”) awards;and
• A change related to the timing of working capital payments andreceipts.
Production, realized prices, and operating expenses are discussed below in Results of Operations. See Notes 6 and 7 in the Footnotes to theFinancial Statements for a reconciliation of the components of the Company’s derivative contracts and disclosures related to derivativeinstruments including their composition and valuation.
Investing activities. For the three months ended March 31, 2018, net cash used in investing activities was $149.4 million compared to$668.5 million for the same period in 2017. The change was predominantly attributable to the following:
• A $43.3 million increase in operational expenditures due to the transition from a three-rig program in the first quarter 2017 to afive-rig program commencing February 2018; and
• A $564.3 million decrease in acquisition activity. See Note 3 in the Footnotes to the Financial Statements for additionalinformation on the Company’s acquisitions.
Our investing activities, on a cash basis, include the following for the periods indicated (in thousands):
Three Months Ended March 31, 2018 2017 $ ChangeOperational expenditures $ 98,849 $ 55,503 $ 43,346Seismic, leasehold and other 6,481 6,230 251Capitalized general and administrative costs 5,187 3,934 1,253Capitalized interest 813 487 326 Total capital expenditures(a) 111,330 66,154 45,176 Acquisitions 38,923 648,485 (609,562)Acquisition deposits (900) (46,138) 45,238Proceeds from the sale of mineral interest and equipment — — — Total investing activities $ 149,353 $ 668,501 $ (519,148)
(a) On an accrual (GAAP) basis, which is the methodology used for establishing our annual capital budget, operational expenditures for the three months endedMarch 31, 2018 were $110.3 million . Inclusive of capitalized general and administrative and capitalized interest costs, total capital expenditures for thethree months ended March 31, 2018 were $133.2 million .
General and administrative expenses and capitalized interest are discussed below in Results of Operations. See Note 3 in the Footnotes tothe Financial Statements for additional information on acquisitions.
Financing activities. We finance a portion of our working capital requirements, capital expenditures and acquisitions with borrowingsunder our Credit Facility, term debt and equity offerings. For the three months ended March 31, 2018, net cash provided by financingactivities was $47.6 million compared to net cash used in financing activities of $1.9 million for the same period of 2017. The change waspredominantly attributable to the following:
• A $50.0 million increase in net borrowings on our CreditFacility.
Net cash provided by (used in) financing activities includes the following for the periods indicated (in thousands):
Three Months Ended March 31, 20182018 2017 $ Change
Net borrowings on senior secured revolving credit facility $ 50,000 $ — $ 50,000Payment of preferred stock dividends (1,824) (1,824) —Tax withholdings related to restricted stock units (560) (79) (481)
Net cash provided by (used in) financing activities $ 47,616 $ (1,903) $ 49,519

20
Callon Petroleum Company Management’s Discussion and Analysis of Financial Condition and Results Table of Contents
See Note 5 in the Footnotes to the Financial Statements for additional information on our debt.
Capital Plan and Year to Date 2018 Summary
Our operational capital budget for 2018 was established in the range of $500 to $540 million on an accrual, or GAAP, basis, inclusive of atransition from a four-rig program that commenced in July 2017 to a five-rig program by mid-February 2018.
As part of our 2018 operated horizontal drilling program, we expect to place 43 to 46 net horizontal wells on production with lateral lengthsranging from 5,000’ to 10,000’.
�
In addition to the operational capital expenditures budget, which includes well costs, facilities and infrastructure capital, and surface landpurchases, we budgeted an estimated $23 to $28 million for capitalized general and administrative expenses on an accrual, or GAAP, basis.
Operational capital expenditures on an accrual basis were $110.3 million for the three months ended March 31, 2018. In addition to theoperational capital expenditures, $6.3 million of capitalized general and administrative and $10.1 million of capitalized interest expenseswere accrued in the three months ended March 31, 2018.
Our revenues, earnings, liquidity and ability to grow are substantially dependent on the prices we receive for, and our ability to develop ourreserves of oil and natural gas. We believe the long-term outlook for our business is favorable due to our resource base, low cost structure,financial strength, risk management, including commodity hedging strategy, and disciplined investment of capital. We monitor current andexpected market conditions, including the commodity price environment, and our liquidity needs and may adjust our capital investmentplan accordingly.
21
Callon Petroleum Company Management’s Discussion and Analysis of Financial Condition and Results Table of Contents
Results of Operations
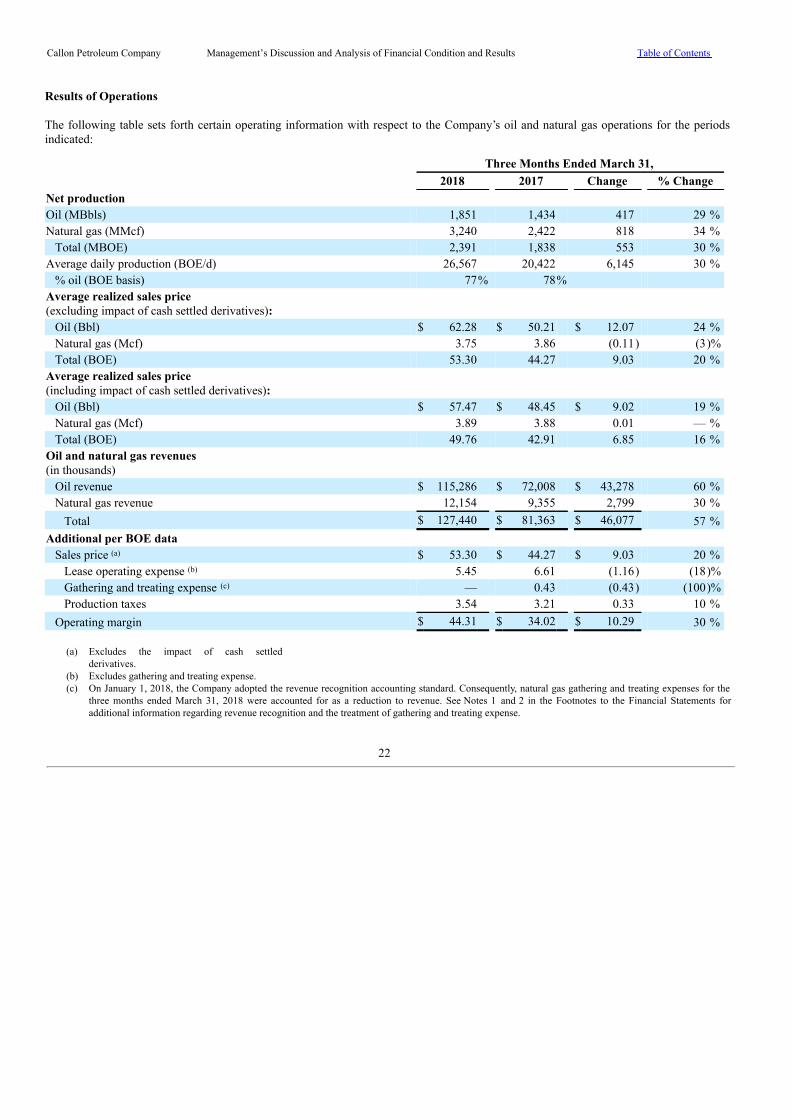
The following table sets forth certain operating information with respect to the Company’s oil and natural gas operations for the periodsindicated:
Three Months Ended March 31, 2018 2017 Change % ChangeNet production Oil (MBbls) 1,851 1,434 417 29 %Natural gas (MMcf) 3,240 2,422 818 34 % Total (MBOE) 2,391 1,838 553 30 %Average daily production (BOE/d) 26,567 20,422 6,145 30 % % oil (BOE basis) 77% 78% Average realized sales price(excluding impact of cash settled derivatives): Oil (Bbl) $ 62.28 $ 50.21 $ 12.07 24 % Natural gas (Mcf) 3.75 3.86 (0.11) (3)% Total (BOE) 53.30 44.27 9.03 20 %Average realized sales price(including impact of cash settled derivatives): Oil (Bbl) $ 57.47 $ 48.45 $ 9.02 19 % Natural gas (Mcf) 3.89 3.88 0.01 — % Total (BOE) 49.76 42.91 6.85 16 %Oil and natural gas revenues(in thousands) Oil revenue $ 115,286 $ 72,008 $ 43,278 60 % Natural gas revenue 12,154 9,355 2,799 30 % Total $ 127,440 $ 81,363 $ 46,077 57 %Additional per BOE data Sales price (a) $ 53.30 $ 44.27 $ 9.03 20 % Lease operating expense (b) 5.45 6.61 (1.16) (18)% Gathering and treating expense (c) — 0.43 (0.43) (100)% Production taxes 3.54 3.21 0.33 10 % Operating margin $ 44.31 $ 34.02 $ 10.29 30 %
(a) Excludes the impact of cash settledderivatives.
(b) Excludes gathering and treating expense.(c) On January 1, 2018, the Company adopted the revenue recognition accounting standard. Consequently, natural gas gathering and treating expenses for the
three months ended March 31, 2018 were accounted for as a reduction to revenue. See Notes 1 and 2 in the Footnotes to the Financial Statements foradditional information regarding revenue recognition and the treatment of gathering and treating expense.
22
Callon Petroleum Company Management’s Discussion and Analysis of Financial Condition and Results Table of Contents
Revenues
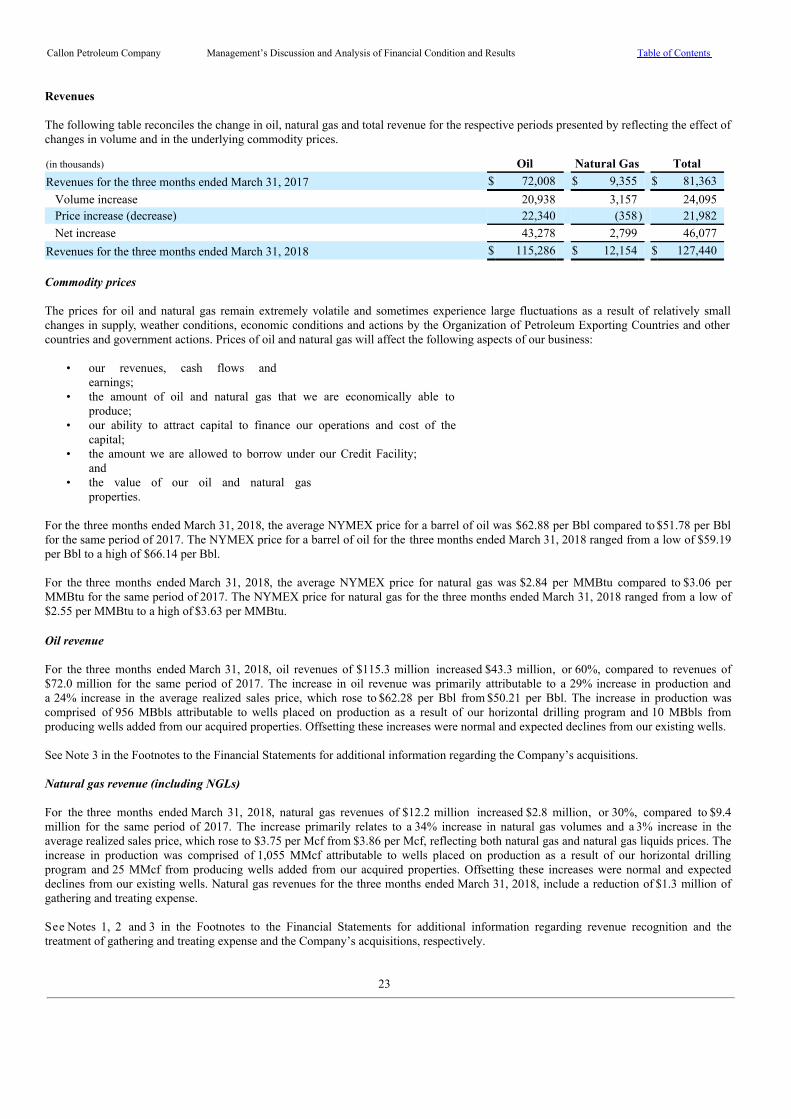
The following table reconciles the change in oil, natural gas and total revenue for the respective periods presented by reflecting the effect ofchanges in volume and in the underlying commodity prices.
(in thousands) Oil Natural Gas TotalRevenues for the three months ended March 31, 2017 $ 72,008 $ 9,355 $ 81,363 Volume increase 20,938 3,157 24,095 Price increase (decrease) 22,340 (358) 21,982 Net increase 43,278 2,799 46,077Revenues for the three months ended March 31, 2018 $ 115,286 $ 12,154 $ 127,440
Commodity prices
The prices for oil and natural gas remain extremely volatile and sometimes experience large fluctuations as a result of relatively smallchanges in supply, weather conditions, economic conditions and actions by the Organization of Petroleum Exporting Countries and othercountries and government actions. Prices of oil and natural gas will affect the following aspects of our business:
• our revenues, cash flows andearnings;
• the amount of oil and natural gas that we are economically able toproduce;
• our ability to attract capital to finance our operations and cost of thecapital;
• the amount we are allowed to borrow under our Credit Facility;and
• the value of our oil and natural gasproperties.
For the three months ended March 31, 2018, the average NYMEX price for a barrel of oil was $62.88 per Bbl compared to $51.78 per Bblfor the same period of 2017. The NYMEX price for a barrel of oil for the three months ended March 31, 2018 ranged from a low of $59.19per Bbl to a high of $66.14 per Bbl.
For the three months ended March 31, 2018, the average NYMEX price for natural gas was $2.84 per MMBtu compared to $3.06 perMMBtu for the same period of 2017. The NYMEX price for natural gas for the three months ended March 31, 2018 ranged from a low of$2.55 per MMBtu to a high of $3.63 per MMBtu.�
Oil revenue
For the three months ended March 31, 2018, oil revenues of $115.3 million increased $43.3 million, or 60%, compared to revenues of$72.0 million for the same period of 2017. The increase in oil revenue was primarily attributable to a 29% increase in production anda 24% increase in the average realized sales price, which rose to $62.28 per Bbl from $50.21 per Bbl. The increase in production wascomprised of 956 MBbls attributable to wells placed on production as a result of our horizontal drilling program and 10 MBbls fromproducing wells added from our acquired properties. Offsetting these increases were normal and expected declines from our existing wells.
See Note 3 in the Footnotes to the Financial Statements for additional information regarding the Company’s acquisitions.
Natural gas revenue (including NGLs)
For the three months ended March 31, 2018, natural gas revenues of $12.2 million increased $2.8 million, or 30%, compared to $9.4million for the same period of 2017. The increase primarily relates to a 34% increase in natural gas volumes and a 3% increase in theaverage realized sales price, which rose to $3.75 per Mcf from $3.86 per Mcf, reflecting both natural gas and natural gas liquids prices. Theincrease in production was comprised of 1,055 MMcf attributable to wells placed on production as a result of our horizontal drillingprogram and 25 MMcf from producing wells added from our acquired properties. Offsetting these increases were normal and expecteddeclines from our existing wells. Natural gas revenues for the three months ended March 31, 2018, include a reduction of $1.3 million ofgathering and treating expense.
See Notes 1, 2 and 3 in the Footnotes to the Financial Statements for additional information regarding revenue recognition and thetreatment of gathering and treating expense and the Company’s acquisitions, respectively.
23

Callon Petroleum Company Management’s Discussion and Analysis of Financial Condition and Results Table of Contents
Operating Expenses
(in thousands, except per unit amounts) Three Months Ended March 31, Per Per Total Change BOE Change 2018 BOE 2017 BOE $ % $ %Lease operating expenses (a) $ 13,039 $ 5.45 $ 12,937 $ 7.04 $ 102 1% $ (1.59) (23)%Production taxes 8,463 3.54 5,904 3.21 2,559 43% 0.33 10 %Depreciation, depletion andamortization 35,417 14.81 24,433 13.29 10,984 45% 1.52 11 %General and administrative 8,769 3.67 5,206 2.83 3,563 68% 0.84 30 %Accretion expense 218 0.09 184 0.10 34 18% (0.01) (10)%Acquisition expense 548 0.23 450 0.24 98 22% (0.01) (4)%
(a) On January 1, 2018, the Company adopted the revenue recognition accounting standard. Consequently, natural gas gathering and treating expenses for thethree months ended March 31, 2018 were accounted for as a reduction to revenue. See Notes 1 and 2 in the Footnotes to the Financial Statements foradditional information regarding revenue recognition and the treatment of gathering and treating expense.
Lease operating expenses (“LOE”). These are daily costs incurred to extract oil and natural gas and maintain our producing properties.Such costs also include maintenance, repairs, salt water disposal, insurance and workover expenses related to our oil and natural gasproperties.
For the three months ended March 31, 2018, LOE increased by 1% to $13.0 million compared to $12.9 million for the same period of 2017.For the three months ended March 31, 2018, LOE per BOE decreased to $5.45 per BOE, excluding gathering and treating expense,compared to $7.04 per BOE, including $0.43 per BOE of gathering and treating expense, for the same period of 2017, which was primarilyattributable to higher production volumes from an increased number of producing wells from our horizontal drilling program andacquisitions as discussed above. See Notes 1 and 2 in the Footnotes to the Financial Statements for additional information regardingrevenue recognition and the treatment of gathering and treating expense.
Production taxes. Production taxes include severance and ad valorem taxes. In general, production taxes are directly related to commodityprice changes; however, severance taxes are based upon current year commodity prices, whereas ad valorem taxes are based upon prioryear commodity prices. Severance taxes are paid on produced oil and natural gas based on a percentage of revenues from products sold atfixed rates established by federal, state or local taxing authorities. Where available, we benefit from tax credits and exemptions in ourvarious taxing jurisdictions. In the counties where our production is located, we are also subject to ad valorem taxes, which are generallybased on the taxing jurisdictions’ valuation of our oil and gas properties.
Production taxes for the three months ended March 31, 2018 increased by 43% to $8.5 million compared to $5.9 million for the sameperiod of 2017. The increase was primarily due to an increase in severance taxes, which was attributable to the increase in revenue. Alsocontributing to the increase was an increase in ad valorem taxes, which was attributable to an increase in the valuation of our oil and gasproperties by taxing jurisdictions as a result of an increased number of producing wells from our horizontal drilling program, acquisitions asdiscussed above, and an increase in commodity prices year over year. On a per BOE basis, production taxes for the three months endedMarch 31, 2018 increased by 10% compared to the same period of 2017.
Depreciation, depletion and amortization (“DD&A”). Under the full cost accounting method, we capitalize costs within a cost center andthen systematically expense those costs on a units-of-production basis based on proved oil and natural gas reserve quantities. We calculatedepletion on the following types of costs: (i) all capitalized costs, other than the cost of investments in unevaluated properties, lessaccumulated amortization; (ii) the estimated future expenditures to be incurred in developing proved reserves; and (iii) the estimateddismantlement and abandonment costs, net of estimated salvage values. Depreciation of other property and equipment is computed usingthe straight line method over their estimated useful lives, which range from three to fifteen years.
For the three months ended March 31, 2018, DD&A increased 45% to $35.4 million compared to $24.4 million for the same period of2017. The increase is primarily attributable to a 30% increase in production and an 11% increase in our per BOE DD&A rate. For the threemonths ended March 31, 2018, DD&A on a per unit basis increased to $14.81 per BOE compared to $13.29 per BOE for the same period of2017. The increase is attributable to greater increases in our depreciable base and assumed future development costs to undeveloped provedreserves relative to the increase in our estimated proved reserve base. The increases in our depreciable base, assumed future developmentcosts and estimated proved reserve base are a result of additions made through our horizontal drilling efforts and acquisitions.
General and administrative, net of amounts capitalized (“G&A”). These are costs incurred for overhead, including payroll and benefitsfor our corporate staff, severance and early retirement expenses, costs of maintaining offices, managing our production and developmentoperations, franchise taxes, depreciation of corporate level assets, public company costs, vesting of equity and liability awards under
24

Callon Petroleum Company Management’s Discussion and Analysis of Financial Condition and Results Table of Contents
share-based compensation plans and related mark-to-market valuation adjustments over time, fees for audit and other professional services,and legal compliance.
G&A for the three months ended March 31, 2018 increased to $8.8 million compared to $5.2 million for the same period of 2017. Theincrease is primarily attributable to non-cash compensation and the corresponding rise in personnel costs due to the growth in our operatingactivities. G&A expenses for the periods indicated include the following (in thousands):
Three Months Ended March 31, 2018 2017 $ Change % ChangeRecurring expenses G&A $ 6,673 $ 4,592 $ 2,081 45 % Share-based compensation 1,105 921 184 20 % Fair value adjustments of cash-settled RSU awards 991 (307) 1,298 (423)%Total G&A expenses $ 8,769 $ 5,206 $ 3,563 68 %
Accretion expense. The Company is required to record the estimated fair value of liabilities for obligations associated with the retirementof tangible long-lived assets and the associated ARO costs. Interest is accreted on the present value of the ARO and reported as accretionexpense within operating expenses in the consolidated statements of operations.
Accretion expense related to our ARO increased 18% for the three months ended March 31, 2018, compared to the same period of 2017.Accretion expense generally correlates with the Company’s ARO, which was $10.5 million at March 31, 2018 as compared to $6.2 millionat March 31, 2017. See Note 9 in the Footnotes to the Financial Statements for additional information regarding the Company’s ARO.
Acquisition expense. Acquisition expense increased $0.1 million for the three months ended March 31, 2018, compared to the same periodof 2017. Acquisition expense for all periods was related to costs with respect to our acquisition efforts in the Permian Basin. See Note 3 inthe Footnotes to the Financial Statements for additional information regarding the Company’s acquisitions.
Other Income and Expenses and Preferred Stock Dividends
(in thousands) Three Months Ended March 31, 2018 2017 $ Change % ChangeInterest expense, net of capitalized amounts $ 460 $ 665 $ (205) (31)%(Gain) loss on derivative contracts 4,481 (15,303) 19,784 (129)%Other income (211) (708) 497 (70)% Total other (income) expense $ 4,730 $ (15,346) Income tax expense $ 495 $ 466 $ 29 6 %Preferred stock dividends (1,824) (1,824) — — %
�Interest expense, net of capitalized amounts. We finance a portion of our working capital requirements, capital expenditures andacquisitions with borrowings under our Credit Facility or with term debt. We incur interest expense that is affected by both fluctuations ininterest rates and our financing decisions. We reflect interest paid to our lender in interest expense, net of capitalized amounts. In addition,we include the amortization of deferred financing costs (including origination and amendment fees), commitment fees and annual agencyfees in interest expense.
Interest expense, net of capitalized amounts, incurred during the three months ended March 31, 2018 decreased $0.2 million compared tothe same period of 2017. The decrease is primarily attributable to a $3.5 million increase in capitalized interest compared to the 2017period, resulting from a higher average unevaluated property balance for the three months ended March 31, 2018 as compared to the sameperiod of 2017. The increase in unevaluated property was primarily due to acquired properties. Offsetting the decrease was a $3.3 millionincrease in interest expense on our Credit Facility and term debt. See Notes 3 and 5 in the Footnotes to the Financial Statements for additional information on our acquisitions and debt.
Gain (loss) on derivative instruments. We utilize commodity derivative financial instruments to reduce our exposure to fluctuations incommodity prices. This amount represents the (i) gain (loss) related to fair value adjustments on our open derivative contracts and (ii) gains(losses) on settlements of derivative contracts for positions that have settled within the period.
25
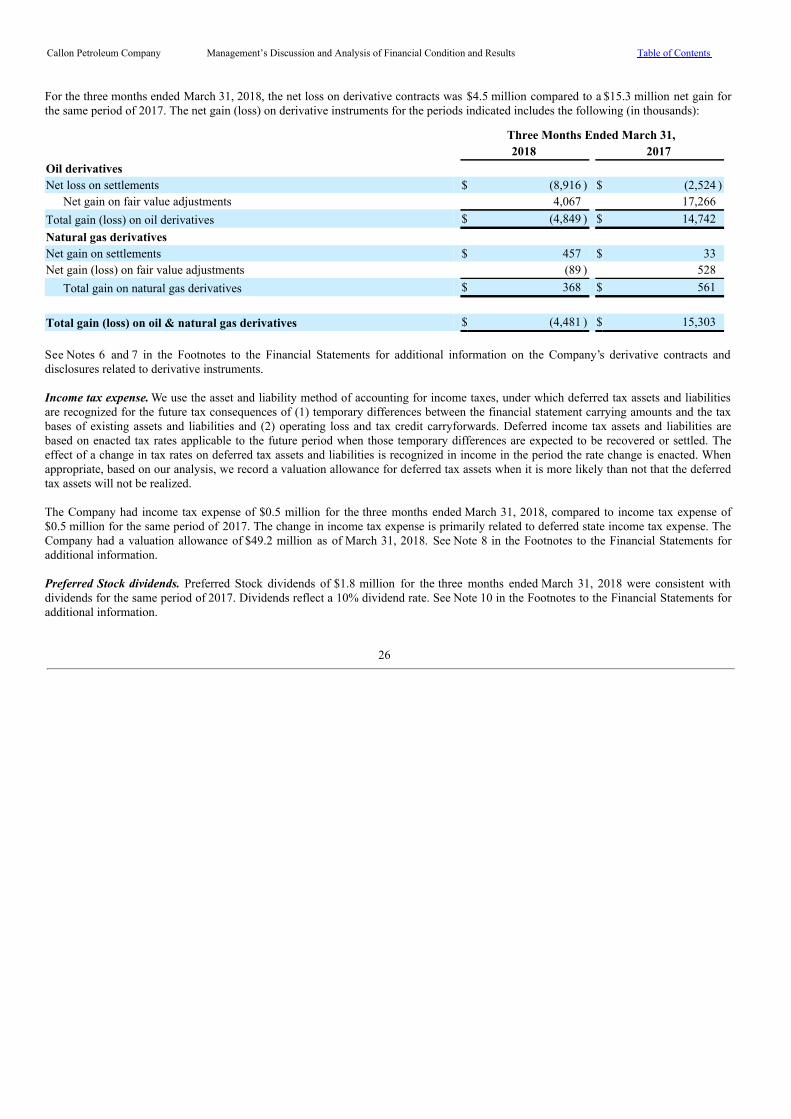
Callon Petroleum Company Management’s Discussion and Analysis of Financial Condition and Results Table of Contents
For the three months ended March 31, 2018, the net loss on derivative contracts was $4.5 million compared to a $15.3 million net gain forthe same period of 2017. The net gain (loss) on derivative instruments for the periods indicated includes the following (in thousands):
Three Months Ended March 31, 2018 2017Oil derivatives Net loss on settlements $ (8,916 ) $ (2,524 )
Net gain on fair value adjustments 4,067 17,266Total gain (loss) on oil derivatives $ (4,849 ) $ 14,742Natural gas derivatives Net gain on settlements $ 457 $ 33Net gain (loss) on fair value adjustments (89 ) 528
Total gain on natural gas derivatives $ 368 $ 561 Total gain (loss) on oil & natural gas derivatives $ (4,481 ) $ 15,303
�
See Notes 6 and 7 in the Footnotes to the Financial Statements for additional information on the Company’s derivative contracts anddisclosures related to derivative instruments.
Income tax expense. We use the asset and liability method of accounting for income taxes, under which deferred tax assets and liabilitiesare recognized for the future tax consequences of (1) temporary differences between the financial statement carrying amounts and the taxbases of existing assets and liabilities and (2) operating loss and tax credit carryforwards. Deferred income tax assets and liabilities arebased on enacted tax rates applicable to the future period when those temporary differences are expected to be recovered or settled. Theeffect of a change in tax rates on deferred tax assets and liabilities is recognized in income in the period the rate change is enacted. Whenappropriate, based on our analysis, we record a valuation allowance for deferred tax assets when it is more likely than not that the deferredtax assets will not be realized.
The Company had income tax expense of $0.5 million for the three months ended March 31, 2018, compared to income tax expense of$0.5 million for the same period of 2017. The change in income tax expense is primarily related to deferred state income tax expense. TheCompany had a valuation allowance of $49.2 million as of March 31, 2018. See Note 8 in the Footnotes to the Financial Statements foradditional information.
Preferred Stock dividends. Preferred Stock dividends of $1.8 million for the three months ended March 31, 2018 were consistent withdividends for the same period of 2017. Dividends reflect a 10% dividend rate. See Note 10 in the Footnotes to the Financial Statements foradditional information.
26

Callon Petroleum Company Table of Contents
Item 3. Quantitative and Qualitative Disclosures about Market Risk
We are exposed to a variety of market risks including commodity price risk, interest rate risk and counterparty and customer risk. Wemitigate these risks through a program of risk management including the use of derivative instruments.
Commodity price risk
The Company’s revenues are derived from the sale of its oil and natural gas production. The prices for oil and natural gas remain volatileand sometimes experience large fluctuations as a result of relatively small changes in supply, weather conditions, economic conditions andgovernment actions. From time to time, the Company enters into derivative financial instruments to manage oil and natural gas price risk,related both to NYMEX benchmark prices and regional basis differentials. The total volumes which we hedge through use of our derivativeinstruments varies from period to period; however, generally our objective is to hedge approximately 40% to 60% of our anticipatedinternally forecast production for the next 12 to 24 months, subject to the covenants under our Credit Facility. Our hedge policies andobjectives may change significantly with movements in commodities prices or futures prices, in addition to modification of our capitalspending plans related to operational activities and acquisitions.
The Company’s hedging portfolio, linked to NYMEX benchmark pricing, covers approximately 4,446 MBbls and 4,125 MMBtu of ourexpected oil and natural gas production, respectively, for the remainder of 2018. We also have commodity hedging contracts linked toMidland WTI basis differentials relative to Cushing covering approximately 3,895 MBbls of our expected oil production for the remainderof 2018. See Note 6 in the Footnotes to the Financial Statements for a description of the Company’s outstanding derivative contracts atMarch 31, 2018, and derivative contracts established subsequent to that date.
The Company may utilize fixed price swaps, which reduce the Company’s exposure to decreases in commodity prices and limit the benefitthe Company might otherwise have received from any increases in commodity prices. Swap contracts may also be enhanced by thesimultaneous sale of call or put options to effectively increase the effective swap price as a result of the receipt of premiums from theoption sales.
The Company may utilize price collars to reduce the risk of changes in oil and natural gas prices. Under these arrangements, no paymentsare due by either party as long as the applicable market price is above the floor price (purchased put option) and below the ceiling price(sold call option) set in the collar. If the price falls below the floor, the counter-party to the collar pays the difference to the Company, andif the price rises above the ceiling, the counterparty receives the difference from the Company. Additionally, the Company may sell put (orcall) options at a price lower than the floor price (or higher than the ceiling price) in conjunction with a collar (three-way collar) and use theproceeds to increase either or both the floor or ceiling prices. In a three-way collar, to the extent that realized prices are below the floorprice of the sold put option (or above the ceiling price of the sold call option), the Company’s net realized benefit from the three-way collarwill be reduced on a dollar-for-dollar basis.
The Company may purchase put and call options, which reduce the Company’s exposure to decreases in oil and natural gas prices whileallowing realization of the full benefit from any increases in oil and natural gas prices. If the price falls below the floor, the counterpartypays the difference to the Company.
The Company enters into these various agreements to reduce the effects of volatile oil and natural gas prices and does not enter intoderivative transactions for speculative purposes. Presently, none of the Company’s derivative positions are designated as hedges foraccounting purposes.
Interest rate risk
The Company is subject to market risk exposure related to changes in interest rates on our indebtedness under our Credit Facility. As ofMarch 31, 2018, the Company had $75.0 million outstanding under the Credit Facility with a weighted average interest rate of 3.75%. Anincrease or decrease of 1.00% in the interest rate would have a corresponding increase or decrease in our annual net income ofapproximately $0.8 million based on the balance outstanding at March 31, 2018. See Note 5 in the Footnotes to the Financial Statementsfor more information on the Company’s interest rates on its Credit Facility.
Counterparty and customer credit risk
The Company’s principal exposures to credit risk are through receivables from the sale of our oil and natural gas production, joint interestreceivables and receivables resulting from derivative financial contracts.
The Company markets its oil and natural gas production to energy marketing companies. We are subject to credit risk due to theconcentration of our oil and natural gas receivables with several significant customers. The inability of our significant customers to meet
27
Callon Petroleum Company Table of Contents
their obligations to us or their insolvency or liquidation may adversely affect our financial results. At March 31, 2018 our total receivablesfrom the sale of our oil and natural gas production were approximately $75.2 million.
Joint interest receivables arise from billings to entities that own partial interests in the wells we operate. These entities participate in ourwells primarily based on their ownership in leases on which we have or intend to drill. We have little ability to control whether theseentities will participate in our wells. At March 31, 2018 our joint interest receivables were approximately $45.4 million.
Our oil and natural gas derivative arrangements expose us to credit risk in the event of nonperformance by counterparties. Most of thecounterparties on our derivative instruments currently in place are lenders under our Credit Facility. We are likely to enter into additionalderivative instruments with these or other lenders under our Credit Facility, representing institutions with investment grade ratings. Wehave existing International Swap Dealers Association Master Agreements (“ISDA Agreements”) with our derivative counterparties. Theterms of the ISDA Agreements provide us and the counterparties with rights of offset upon the occurrence of defined acts of default byeither us or a counterparty to a derivative, whereby the party not in default may offset all derivative liabilities owed to the defaulting partyagainst all derivative asset receivables from the defaulting party.
Item 4. Controls and Procedures
Disclosure controls and procedures. Disclosure controls and procedures include, without limitation, controls and procedures designed toensure that information required to be disclosed by an issuer in the reports that it files or submits under the Securities Exchange Act of1934, as amended (the “Exchange Act”), is accumulated and communicated to the issuer’s management, including its principal executiveand financial officers, or persons performing similar functions, as appropriate to allow timely decisions regarding required disclosure. OurChief Executive Officer and Chief Financial Officer performed an evaluation of our disclosure controls and procedures (as defined in Rules13a-15(e) and 15d-15(e) under the Exchange Act). Based on this evaluation, our principal executive and principal financial officers haveconcluded that the Company’s disclosure controls and procedures were effective as of March 31, 2018.
Changes in internal control over financial reporting. There were no changes to our internal control over financial reporting during our lastfiscal quarter that have materially affected, or are reasonable likely to materially affect, our internal control over financial reporting.
28

Callon Petroleum Company Table of Contents
Part II. Other Information
Item 1. Legal Proceedings
We are a defendant in various legal proceedings and claims, which arise in the ordinary course of our business. We do not believe theultimate resolution of any such actions will have a material effect on our financial position or results of operations.
Item 1A. Risk Factors
There have been no material changes with respect to the risk factors disclosed in our 2017 Annual Report on Form 10-K.
Item 2. Unregistered Sales of Equity Securities and Use of Proceeds
None.
Item 3. Defaults Upon Senior Securities
None.
Item 4. Mine Safety Disclosures
None.
Item 5. Other Information
None.
29
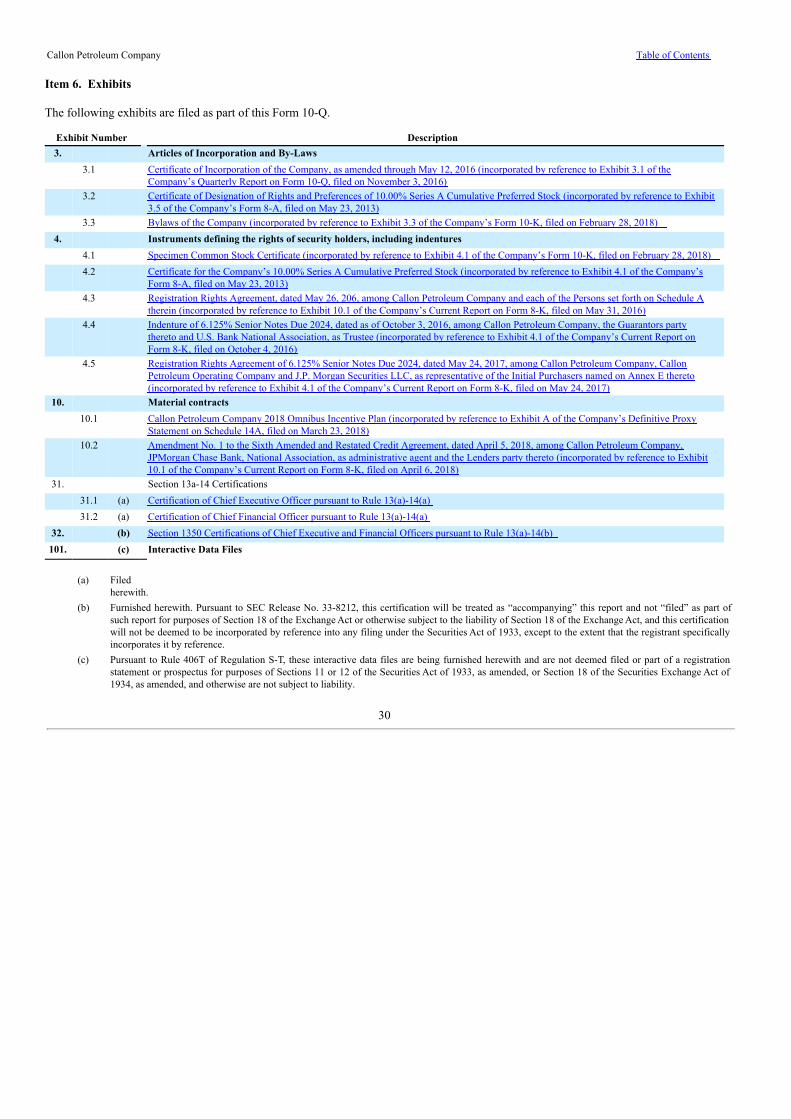
Callon Petroleum Company Table of Contents
Item 6. Exhibits
The following exhibits are filed as part of this Form 10-Q.
Exhibit Number Description3. Articles of Incorporation and By-Laws
3.1
Certificate of Incorporation of the Company, as amended through May 12, 2016 (incorporated by reference to Exhibit 3.1 of theCompany’s Quarterly Report on Form 10-Q, filed on November 3, 2016)
3.2
Certificate of Designation of Rights and Preferences of 10.00% Series A Cumulative Preferred Stock (incorporated by reference to Exhibit3.5 of the Company’s Form 8-A, filed on May 23, 2013)
3.3 Bylaws of the Company (incorporated by reference to Exhibit 3.3 of the Company’s Form 10-K, filed on February 28, 2018)4. Instruments defining the rights of security holders, including indentures
4.1 Specimen Common Stock Certificate (incorporated by reference to Exhibit 4.1 of the Company’s Form 10-K, filed on February 28, 2018)
4.2
Certificate for the Company’s 10.00% Series A Cumulative Preferred Stock (incorporated by reference to Exhibit 4.1 of the Company’sForm 8-A, filed on May 23, 2013)
4.3
Registration Rights Agreement, dated May 26, 206, among Callon Petroleum Company and each of the Persons set forth on Schedule Atherein (incorporated by reference to Exhibit 10.1 of the Company’s Current Report on Form 8-K, filed on May 31, 2016)
4.4
Indenture of 6.125% Senior Notes Due 2024, dated as of October 3, 2016, among Callon Petroleum Company, the Guarantors partythereto and U.S. Bank National Association, as Trustee (incorporated by reference to Exhibit 4.1 of the Company’s Current Report onForm 8-K, filed on October 4, 2016)
4.5
Registration Rights Agreement of 6.125% Senior Notes Due 2024, dated May 24, 2017, among Callon Petroleum Company, CallonPetroleum Operating Company and J.P. Morgan Securities LLC, as representative of the Initial Purchasers named on Annex E thereto(incorporated by reference to Exhibit 4.1 of the Company’s Current Report on Form 8-K, filed on May 24, 2017)
10. Material contracts
10.1
Callon Petroleum Company 2018 Omnibus Incentive Plan (incorporated by reference to Exhibit A of the Company’s Definitive ProxyStatement on Schedule 14A, filed on March 23, 2018)
10.2
Amendment No. 1 to the Sixth Amended and Restated Credit Agreement, dated April 5, 2018, among Callon Petroleum Company,JPMorgan Chase Bank, National Association, as administrative agent and the Lenders party thereto (incorporated by reference to Exhibit10.1 of the Company’s Current Report on Form 8-K, filed on April 6, 2018)
31. Section 13a-14 Certifications
31.1 (a) Certification of Chief Executive Officer pursuant to Rule 13(a)-14(a)
31.2 (a) Certification of Chief Financial Officer pursuant to Rule 13(a)-14(a)32. (b) Section 1350 Certifications of Chief Executive and Financial Officers pursuant to Rule 13(a)-14(b)
101. (c) Interactive Data Files
(a) Filedherewith.
(b) Furnished herewith. Pursuant to SEC Release No. 33-8212, this certification will be treated as “accompanying” this report and not “filed” as part ofsuch report for purposes of Section 18 of the Exchange Act or otherwise subject to the liability of Section 18 of the Exchange Act, and this certificationwill not be deemed to be incorporated by reference into any filing under the Securities Act of 1933, except to the extent that the registrant specificallyincorporates it by reference.
(c) Pursuant to Rule 406T of Regulation S-T, these interactive data files are being furnished herewith and are not deemed filed or part of a registrationstatement or prospectus for purposes of Sections 11 or 12 of the Securities Act of 1933, as amended, or Section 18 of the Securities Exchange Act of1934, as amended, and otherwise are not subject to liability.
30

Callon Petroleum Company Table of Contents
SIGNATURES
Pursuant to the requirements of the Securities Exchange Act of 1934, the registrant has duly caused this report to be signed on its behalf bythe undersigned thereunto duly authorized.
Callon Petroleum Company
Signature Title Date
/s/ Joseph C. Gatto, Jr. President and May 2, 2018Joseph C. Gatto, Jr. Chief Executive Officer
/s/ James P. Ulm, II Senior Vice President and May 2, 2018James P. Ulm, II Chief Financial Officer
31

Exhibit 31.1
CERTIFICATIONS
I, Joseph C. Gatto, Jr., certify that:
1. I have reviewed this Quarterly Report on Form 10-Q of Callon PetroleumCompany;
2. Based on my knowledge, this report does not contain any untrue statement of a material fact or omit to state a material factnecessary to make the statements made, in light of the circumstances under which such statements were made, not misleading withrespect to the period covered by this report;
3. Based on my knowledge, the financial statements, and other financial information included in this report, fairly present in allmaterial respects the financial condition, results of operations and cash flows of the registrant as of, and for, the periods presentedin this report;
4. The registrant’s other certifying officer and I are responsible for establishing and maintaining disclosure controls and procedures(as defined in Exchange Act Rules 13a-15(e) and 15d-15(e)) and internal control over financial reporting (as defined in ExchangeAct Rules 13a-15(f) and 15d-15(f)) for the registrant and have:
a. Designed such disclosure controls and procedures, or caused such disclosure controls and procedures to be designedunder our supervision, to ensure that material information relating to the registrant, including its consolidated subsidiaries,is made known to us by others within those entities, particularly during the period in which this report is being prepared;
b. Designed such internal control over financial reporting, or caused such internal control over financial reporting to bedesigned under our supervision, to provide reasonable assurance regarding the reliability of financial reporting and thepreparation of financial statements for external purposes in accordance with generally accepted accounting principles;
c. Evaluated the effectiveness of the registrant’s disclosure controls and procedures and presented in this report ourconclusions about the effectiveness of the disclosure controls and procedures as of the end of the period covered by thisreport based on such evaluation; and
d. Disclosed in this report any change in the registrant’s internal control over financial reporting that occurred during theregistrant’s most recent fiscal quarter (the registrant's fourth fiscal quarter in the case of an annual report) that hasmaterially affected, or is reasonably likely to materially affect, the registrant’s internal control over financial reporting;and
5. The registrant’s other certifying officer and I have disclosed, based on our most recent evaluation of internal control over financialreporting, to the registrant’s auditors and the audit committee of registrant’s board of directors (or persons performing theequivalent functions):
a. All significant deficiencies and material weaknesses in the design or operation of internal control over financial reportingwhich are reasonably likely to adversely affect the registrant’s ability to record, process, summarize and report financialinformation; and
b. Any fraud, whether or not material, that involves management or other employees who have a significant role in theregistrant’s internal control over financial reporting.
Date: May 2, 2018 /s/ Joseph C. Gatto, Jr. Joseph C. Gatto, Jr. President and Chief Executive Officer (Principal executive officer)

Exhibit 31.2
CERTIFICATIONS
I, James P. Ulm II, certify that:
1. I have reviewed this Quarterly Report on Form 10-Q of Callon PetroleumCompany;
2. Based on my knowledge, this report does not contain any untrue statement of a material fact or omit to state a material factnecessary to make the statements made, in light of the circumstances under which such statements were made, not misleading withrespect to the period covered by this report;
3. Based on my knowledge, the financial statements, and other financial information included in this report, fairly present in allmaterial respects the financial condition, results of operations and cash flows of the registrant as of, and for, the periods presentedin this report;
4. The registrant’s other certifying officer and I are responsible for establishing and maintaining disclosure controls and procedures(as defined in Exchange Act Rules 13a-15(e) and 15d-15(e)) and internal control over financial reporting (as defined in ExchangeAct Rules 13a-15(f) and 15d-15(f)) for the registrant and have:
a. Designed such disclosure controls and procedures, or caused such disclosure controls and procedures to be designedunder our supervision, to ensure that material information relating to the registrant, including its consolidated subsidiaries,is made known to us by others within those entities, particularly during the period in which this report is being prepared;
b. Designed such internal control over financial reporting, or caused such internal control over financial reporting to bedesigned under our supervision, to provide reasonable assurance regarding the reliability of financial reporting and thepreparation of financial statements for external purposes in accordance with generally accepted accounting principles;
c. Evaluated the effectiveness of the registrant’s disclosure controls and procedures and presented in this report ourconclusions about the effectiveness of the disclosure controls and procedures as of the end of the period covered by thisreport based on such evaluation; and
d. Disclosed in this report any change in the registrant’s internal control over financial reporting that occurred during theregistrant’s most recent fiscal quarter (the registrant's fourth fiscal quarter in the case of an annual report) that hasmaterially affected, or is reasonably likely to materially affect, the registrant’s internal control over financial reporting;and
5. The registrant’s other certifying officer and I have disclosed, based on our most recent evaluation of internal control over financialreporting, to the registrant’s auditors and the audit committee of registrant’s board of directors (or persons performing theequivalent functions):
a. All significant deficiencies and material weaknesses in the design or operation of internal control over financial reportingwhich are reasonably likely to adversely affect the registrant’s ability to record, process, summarize and report financialinformation; and
b. Any fraud, whether or not material, that involves management or other employees who have a significant role in theregistrant’s internal control over financial reporting.
Date: May 2, 2018 /s/ James P. Ulm, II James P. Ulm, II Senior Vice President and Chief Financial Officer (Principal financial officer)

Exhibit 32
CERTIFICATION PURSUANT TO 18 U.S.C. SECTION 1350
In connection with the Quarterly Report on Form 10-Q of Callon Petroleum Company for the quarterly period ended March 31, 2018, asfiled with the Securities and Exchange Commission on the date hereof (the “Report”), the undersigned, in the capacities and on the datesindicated below, each hereby certify pursuant to 18 U.S.C. section 1350, as adopted pursuant to Section 906 of the Sarbanes-Oxley Act of2002, that the Report fully complies with requirements of Section 13(a) or 15(d) of the Securities Exchange Act of 1934 and theinformation contained in the Report fairly presents, in all material respects, the financial condition and results of operations of theCompany.
Date: May 2, 2018 /s/ Joseph C. Gatto, Jr. Joseph C. Gatto, Jr. (Principal executive officer)
Date: May 2, 2018 /s/ James P. Ulm, II James P. Ulm, II (Principal financial officer)
The foregoing certification is being furnished as an exhibit to the Report pursuant to Item 601(b)(32) of Regulation S-K and Section 906 ofthe Sarbanes-Oxley Act of 2002 (subsections (a) and (b) of Section 1350, Chapter 63 of Title 18, United States Code) and, accordingly, isnot being filed as part of the Report for purposes of Section 18 of the Securities Exchange Act of 1934, as amended, and is not incorporatedby reference into any filing of the Company, whether made before or after the date hereof, regardless of any general incorporationlanguage in such filing.