Embed Size (px)
Citation preview
NOEP
CALIFORNIA’S OCEAN ECONOMY
Report to the Resources Agency, State of California
Prepared by The National Ocean Economics Program
Professor Judith KildowPrincipal Investigator
California State Un
iv ersity Monterey Bay
Professor C arles S. ColganChief conomist
University of Southern Maine
July 2005
h
E

NOEP
NOEP
Table of Contents
Executive Summary............................................................................................................... 1 Acknowledgements ...............................................................................................................3
PART I BACKGROUND AND SUMMARY OF FINDINGS....................................5 Chapter 1 Introduction................................................................................................5
1.1 California and the Sea......................................................................................................5 1.2 About this Study ..............................................................................................................6 1.3 Definitions and Terminology..........................................................................................7 1.4 Limitations and Omissions..............................................................................................9
Chapter 2 Summary of Findings ................................................................................11 2.1 Introduction ....................................................................................................................11 2.2 California’s Coastal Economy.........................................................................................11 2.3 California’s Ocean Economy: Comparisons with the Nation ....................................... 15 2.4 California’s Ocean Economy: Comparisons with Other States..................................... 17 2.5 California’s Ocean Economy: Regional Comparisons .................................................. 19 2.6 California’s Ocean Economy: Statewide Summaries by Sector..................................... 24 2.7 Indirect and Induced Estimates of California’s Ocean Economy ............................... 27 2.8 Changes in the California Ocean Economy 1990-2000 ................................................. 28 2.9 References..................................................................................................................... 30
PART II THE SECTORS OF THE CALIFORNIA OCEAN ECONOMY ........... 31 Chapter 3 California Living Resources.................................................................. 31
3.1 Overview of Activities: Fisheries Landings and Values................................................. 34 3.1.1 Influences on California’s Fishing Industry................................................................ 38
3.1.2 Landings and Values by Species ................................................................................................................ 38 3.1.3 Landings and Values by Region and County 1990 to 2002 ................................................................... 39
3.3 Kelp and Sea Vegetable Harvesting.............................................................................. 42 3.4 Recreational and Sport fishing...................................................................................... 44 3.4 Conclusion .................................................................................................................... 45 3.5 References..................................................................................................................... 45
Chapter 4 California Ocean Minerals.................................................................... 47 4.1 Marine Minerals ............................................................................................................ 47
4.1.1 Production and Revenue from Offshore Oil and Gas Production ..................................................... 48 4.1.2 Geographic Location of Offshore Production......................................................................................... 50
4.2 Offshore Natural Gas Production in California............................................................ 52 4.3 Estimate of the Economic Contribution of Ocean Minerals........................................ 52
i
NOEP
4.4 References..................................................................................................................... 54 Chapter 5 California Marine Transportation ......................................................... 55
5.1 Marine Transportation .................................................................................................. 56 5.1.1 Overview of Activities ................................................................................................................................. 56 5.1.2 Composition of Cargo for all California Ports by Commodity............................................................. 59 5.1.3 Estimated Value of Imports and Exports for Major California Ports ................................................. 62
5.2 CA Water Transportation: Regional and State Employment and Income................... 65 5.2.1 Regional and State Indirect Employment and Income from IMPLAN Model .......... 67 5.2 References...................................................................................................................... 73
Chapter 6 California Marine Construction ............................................................ 75 6.1 Marine Construction (maintenance, repair and restoration) ........................................ 75 6.2 Port Development ......................................................................................................... 76
6.2.1 Historical Capital Expenditures for California Public Port Development ........................................... 77 6.2.2 Proposed Capital Expenditure for California Public Port Development: Total US vs. CA 2002-2006.......................................................................................................................................................................... 85 6.2.3 Funding Resources for Port Development.............................................................................................. 88 6.2.4 Economic Impact ........................................................................................................................................ 91
6.3 Beach Nourishment...................................................................................................... 93 6.3.1 Funding Sources ........................................................................................................................................... 94
6.4 References..................................................................................................................... 95 Chapter 7: California Ship & Boat Building................................................................ 97
7.1 Ship & Boat Building and Repair: Description of the Sector ....................................... 98 7.2 Ship & Boat Building in California............................................................................... 98 7.3 References....................................................................................................................101
Chapter 8 Coastal Tourism & Recreation ............................................................103 8.0 Estimated Economic Summaries of the California Coastal Tourism & Recreation Sector ..................................................................................................................................103 8.1 California Coastal Tourism & Recreation: Scope, Scale and Definition ......................104 8.2 Coastal Recreational Activities .....................................................................................106
8.2.1 Beach Activities........................................................................................................................................... 107 8.2.2 California Beach Valuation: The Non-market Value of California Beaches ..................................... 109 8.2.3 Recreational Fishing and Boating ............................................................................................................. 113 8.2.4 Marinas......................................................................................................................................................... 113 8.2.5 State parks and recreational areas along the coast.................................................................................. 114 8.2.6 Other marine recreational activities ......................................................................................................... 115
8.3 The Travel and Tourism Industry in California Coastal Counties: Description and Expenditures ......................................................................................................................115
8.3.1 Travel Spending Estimates ........................................................................................................................ 116 8.4 Regional Estimates of California Coastal Tourism & Recreation................................119 8.5 References.....................................................................................................................125
8.5.1 References for Beach Valuation Section ................................................................................................. 125 PART III CONCLUSION ........................................................................................127
ii
NOEP PART IV APPENDIX ..............................................................................................129
Appendix A: The NOEP Ocean Economy: The Methodology .......................................129 A.1 Market Data................................................................................................................................................... 129 A.2 Market and Non-Market Valuation............................................................................................................ 134
Appendix B: Fishing Industry Data ..................................................................................136 2001 Employment And Payroll By NAICS Codes.......................................................................................... 136
Appendix C: California Marine Research Institutions......................................................139 Appendix D: California Beaches .......................................................................................141
iii
NOEP
Index of Tables Table 1-1: The Sectors and Industries of the Ocean Economy....................................................................8 Table 2-1: Population and Housing Densities 1990-2000 ...........................................................................12 Table 2-2: Regional Population and Housing Growth Rates......................................................................13 Table 2-3: California Housing Comparisons..................................................................................................14 Table 2-4: Comparison of California Coastal County Employment Growth with California Total
Employment.........................................................................................................................................14 Table 2-5: Growth Rates for Coastal County Housing, Population, and Employment .........................15 Table 2-6: California’s Share in the US Ocean Economy 2000 ..................................................................15 Table 2-7: California Rank by Sector Among Coastal States 2000.............................................................17 Table 2-8: Ocean Economy GSP Rankings of Coastal States 1990 and 2000 .........................................18 Table 2-9: Ocean Economy Coastal Regions ................................................................................................19 Table 2-10: California Ocean Economy 2000 by Region with Multipliers ...............................................21 Table 2-11: Changes in the Ocean Economy by Region 1990 - 2000 .......................................................21 Table 2-12: The Direct California Ocean Economy in 1990 and 2000.....................................................25 Table 2-13: Multiplier Effects of The California Ocean Economy 2000..................................................27 Table 2-14: Changes in the California Ocean Economy, 1990-2000 (Direct)..........................................28 Table 3-1: Summary of Direct Value of Living Resources Industry 2000 ................................................31 Table 3-2: Summary of Living Resources Industry with Multipliers - 2000 .............................................31 Table 3-3: Direct Changes in California Living Resources 1990-2000 ......................................................32 Table 3-4: Regional Landings and Values 2000-2002...................................................................................40 Table 3-5: Total Economic Impacts Generated From Marine Recreational And Sport Fishing
Expenditures in California - 2000.....................................................................................................44 Table 4-1: Summary of Ocean Minerals with Multipliers in 2000..............................................................47 Table 4-2: Direct Changes in Ocean Minerals Sector 1990-2000...............................................................47 Table 4-3: California Offshore Oil Production in bbl *...............................................................................49 Table 4-4: California Onshore and Offshore Oil Production in bbl ........................................................49 Table 4-5: Share of Offshore Oil Production................................................................................................49 Table 4-6: Coastal Counties Onshore and Offshore Oil Production 2001 ..............................................51 Table 4-7: Value of Offshore Oil Production in 2001 .................................................................................51 Table 4-8: Offshore Natural Gas Production - 2001 ...................................................................................52 Table 4-9: Employment, Wages and GSP of Ocean Mineral Industries - 2000 ......................................53 Table 5-1: Summary of Direct Values for Marine Transportation 2000 ...................................................55 Table 5-2: Summary of Marine Transportation with Multipliers - 2000 ...................................................55 Table 5-3: Direct Changes in California Marine Transportation 1990-2000 ............................................55 Table 5-4: Port Rankings 2001 by Total, Import and Export Cargo Value (in Millions of US dollars)
................................................................................................................................................................63Table 5-5: Deep Sea Foreign Freight (SIC code 4412, 4424)......................................................................65 Table 5-6: Water Transportation for Passengers (SIC code 4481, 4482, and 4489)................................65 Table 5-7: Marine Transportation Services (SIC code 4491, 4492, and 4499) .........................................66 Table 5-8: Search and Navigation Equipment (SIC code 3812).................................................................66 Table 5-9: Warehousing (SIC code 4222 and 4225) .....................................................................................67 Table 5-10: Deep Sea Freight ...........................................................................................................................68 Table 5-11: Marine Passenger Transportation...............................................................................................69 Table 5-12: Marine Transportation Services ..................................................................................................70 Table 5-13: Search and Navigation Equipment.............................................................................................71 Table 5-14: Warehousing ..................................................................................................................................72 Table 6-1: Sum Of 2000 Marine Construction With Multipliers................................................................75 Table 6-2: Changes in Marine Construction 1990-2000 ..............................................................................75 Table 6-3: Direct Regional Economic Impact of Marine Construction, 1990 and 2000........................91
iv
NOEP Table 6-4: 2000 Employment, Wages and GSP: Impact of Marine Construction Industry from
IMPLAN Model ..................................................................................................................................92 Table 6-5: Benefit of Beach Restorations in California................................................................................94 Table 6-6: Funding for California Beach Restoration Projects...................................................................95 Table 6-7: Total Beach Restoration Funding by Category ..........................................................................95 Table 7-1 Summary of California Ship & Boat Building and Repair Industry in 2000...........................97 Table 7-2 Summary of Ship and Boat Building & Repair with Multipliers for 2000 ..............................97 Table 7-3: Changes in Direct Economy of California Ship & Boat Building and Repair 1990-2000...97Table 7-4: Direct Employment, Wages, and GSP for Ship and Boat Building and Repair Industry
1990 .......................................................................................................................................................99 Table 7-5: Total Regional Employment, Wages, and GSP for CA. Shipbuilding and Repair Industry
for 2000.............................................................................................................................................. 100 Table 8-1: California Coastal Tourism & Recreation Direct Values 2000 ............................................. 103 Table 8-2: California Coastal Tourism & Recreation Sector with Multipliers for 2000....................... 103 Table 8-3: Changes in California Coastal Tourism & Recreation Direct Values between 1990 and
2000 .................................................................................................................................................... 103 Table 8-4: Measure of Participation in Marine Recreational Activities .................................................. 107 Table 8-5: Participation in Beach Related Recreational Activities........................................................... 108 Table 8-6: Estimates of the Consumer Surplus Value of Beach Visits in Southern California .......... 112 Table 8-7: Participation in Recreational Fishing and Boating Activities ................................................ 113 Table 8-8: Marina Recreators’ Characteristics by Use ............................................................................... 114 Table 8-9: Marina Recreators’ Characteristics by Boat Length Segment................................................ 114 Table 8-10: California’s Top Beach/Coastal Park Attendance ................................................................ 114 Table 8-11: Participation in Other Marine Related Recreation................................................................ 115 Table 8-12: Economic Impact of the Travel Industry of California...................................................... 116 Table 8-13: Travel Spending by Type of Business Service ($ Billion) .................................................... 118 Table 8-14: Employment Generated by Travel Spending (1,000 Jobs).................................................. 118 Table 8-15: Visitor Volumes in Coastal Counties of California*( Millions of person-trips)............... 119 Table 8-16: Employment, wages and GSP: Coastal Tourism & Recreation Sector ............................. 120 Table 8-17: Regional Summary of Coastal Tourism & Recreation Total Employment, Wages and
GSP 2000........................................................................................................................................... 123 Table A-1: NOEP Industries and Related SIC Codes .............................................................................. 130 Table B-1: Commercial Fisheries (NAICS Code 1141) 2001 Employment and Total Effects on
Income by County and Region ...................................................................................................... 137 Table B-2: California’s Seafood Product Preparation and Packaging (NAICS Code 3117) 2001
Employment and Total Effects on Income by County and Region ........................................ 138 Table B-3: Aquaculture (NAICS Code 11251) 2001 Employment and Total Effects on Income in
California............................................................................................................................................ 138 Table D-1: Regional Beaches and Locations .............................................................................................. 141 Table D-2: Regional Beaches from EPA..................................................................................................... 147
v
NOEP
Index of Charts and Figures Figure 2-1: 2000 Employment, California vs. US Economy.......................................................................16 Figure 2-2: 2000 Ocean GSP, California vs. US Economy .........................................................................16 Figure 2-3: Changes in California’s Regional Ocean Economy, 1990-2000 .............................................20 Figure 2-4: California Ocean Employment, Region vs. State......................................................................22 Figure 2-5: Regional Percentage of Ocean Employment.............................................................................23 Figure 2-6: California Sectoral Comparisons by GSP ..................................................................................24 Figure 2-7: California Sectoral Comparisons by Employment ...................................................................25 Figure 2-8: 2000 Distribution of the California Ocean Economy..............................................................26 Figure 2-9: Changes in California’s Ocean Economy by Sector, 1990-2000............................................28 Figure 3-1: Changes in Living Resources Sector from 1990 to 2000.........................................................32 Figure 3-2: US Total Commercial Fishery Landings and Values................................................................35 Figure 3-3: California Commercial Fishery Landings and Values ..............................................................36 Figure 3-4: California Share of US commercial Fisheries ............................................................................37 Figure 3-5: 2002 California’s Top 10 Commercial Marine Species ............................................................39 Figure 3-6: 1993 to 2002 Weight of Landings by Region ............................................................................41 Figure 3-7: 1993 to 2002 Value of Landings by Region...............................................................................41 Figure 3-8: Historical California Kelp Production........................................................................................43 Figure 4-1: Changes in Ocean Minerals Industries from 1990 to 2000.....................................................47 Figure 5-1: Changes in California Marine Transportation 1990-2000 .......................................................56 Figure 5-2: 2001 Major California Ports, Composition of Tonnage..........................................................57 Figure 5-3: 2000 Major California Ports, Composition of Tonnage..........................................................57 Figure 5-4: 1997-2001 Combined California Ports, Composition of Tonnage........................................58 Figure 5-5: 1997-2001 Long Beach – Los Angeles Ports, Composition of Tonnage .............................59 Figure 5-6: 2000 Major California Ports, Tonnage by Commodity ...........................................................60 Figure 5-7: 2000 Combined California Ports, Tonnage by Commodity ...................................................60 Figure 5-8: Major California Ports, 1992-2001 Values of Imports and Exports .....................................61 Figure 5-9: Los Angeles and Long Beach Ports, 1992-2001 Import and Export Values .......................62 Figure 5-10: Top Ten California Ports by Cargo Value, 1992-2001 ..........................................................64 Figure 6-1: Changes in Marine Construction from 1990 to 2000...............................................................75 Figure 6-2: Port Development Expenditure Overview................................................................................77 Figure 6-3: Capital Expenditures for US Port Facilities and Infrastructure by Region ..........................78 Figure 6-4: California’ Share of Port Development Expenditures, 1997-2001 ........................................79 Figure 6-5: Leading US Port Authorities by Capital Expenditures, 2001 .................................................79 Figure 6-6: Expenditures on US Ports by Type of Facility, 2001...............................................................80 Figure 6-7: California’s Share of US Expenditures on Ports, 2001............................................................81 Figure 6-8: US Expenditures on New Port Construction, 2001.................................................................82 Figure 6-9: US Expenditures on Port Modernization and Rehabilitation, 2001 ......................................83 Figure 6-10: California’s Share of US Port Expenditures by Construction Type, 2001 .........................84 Figure 6-11: Proposed US Port Construction Expenditures, 2002-2006..................................................85 Figure 6-12: Leading Port Authorities by Proposed Expenditures, 2002-2006 .......................................85 Figure 6-13: California’s Share of US Port Construction Expenditures, 2002-2006...............................86 Figure 6-14: US Port Construction Expenditures by Type of Facility, 2002-2006..................................87 Figure 6-15: California’s Share of Port Expenditures by Types of Financing, 2001 ...............................88 Figure 6-16: California’s Share of Port Expenditures by Types of Financing, 2002-2006 .....................89 Figure 6-17: US Port Expenditures by Financing Methods, 2001..............................................................89 Figure 6-18: US Port Expenditures by Financing Methods, 2002-2006....................................................90 Figure 7-1: Change in Ship & Boat Building and Repair from 1990 to 2000...........................................97 Figure 8-1: Changes in California Coastal Tourism & Recreation from 1990 to 2000........................ 104 Figure 8-2: Proportion of Different Marine Recreational Activities....................................................... 107 Figure 8-3: Proportion of Beach Related Marine Recreation Activity Days.......................................... 108
vi
NOEP Figure 8-4: Fishing and Boating Related Activity Days............................................................................. 113 Figure 8-5: Attendance at Top 10 California Beach/Coastal Parks ........................................................ 115 Figure 8-6: Travel and Tourism Industry Spending and Earnings in California................................... 117 Figure 8-7: Travel and Tourism Industry Employment in California..................................................... 117
vii

NOEP
viii
NOEP
Executive Summary California’s Ocean Economy is the most expansive study of its kind in the nation and provides an update to the 1994 economic study conducted by the California Research Bureau and later released as part of the Resources Agency ocean strategy titled, California’s Ocean Resources: An Agenda for the Future. This report from the National Ocean Economics Program (NOEP) provides a more comprehensive understanding of the economic role of California’s ocean resources than has been available to date. It also provides California with strong evidence that its unique ocean and coastal resources are important to sustaining California’s economy. This information highlights the economic importance of the ocean and coast to California and the nation and underscores the need for continued leadership in balancing resource protection and economic development. Summary of Findings California - Largest Ocean Economy in the Nation California has the largest Ocean Economy in the United States, ranking number one overall for both employment and gross state product (GSP), an impressive position, because California was the 5th largest economy in the world in 2000.1 The sectors of the Ocean Economy studied include: (1) coastal construction, (2) living resources, (3) offshore minerals, (4) ship and boat building and repair, (5) maritime transportation and ports, and (6) coastal tourism and recreation. The total GSP of California’s Ocean Economy in 2000 was approximately $42.9 billion. California’s Ocean Economy directly provided approximately 408,000 jobs in 2000, and almost 700,000 jobs when multiplier effects are included. It provided more than $11.4 billion in wages and salaries in 2000, and more than $24 billion when multiplier effects are included. The NOEP also evaluated the total value of all economic transactions within 19 coastal counties (mainland coast and four additional counties added within San Francisco Bay and the Sacramento River Delta) and identified approximately $ 1.15 trillion of economic activity,2 (86% of total state economic activity), that is referred to as the “Coastal Economy.” The natural resources of the coast and coastal ocean are a solid foundation for California’s economy and these resources must be sustained to maintain the strength in the six sectors evaluated within the Ocean Economy and the much larger Coastal Economy. California’s Ocean Economy: Comparisons with the Nation California provides a larger share of the national Ocean Economy than any other state. Overall, California made up nearly 19% of the US Ocean Economy in 2000 in both employment and GSP. A major reason for this was the increase in the Tourism & Recreation sector and the strength of the Transportation sector. California’s Marine Transportation sector is more than a quarter of the national Marine Transportation sector with the Ports of Long Beach and Los Angeles among the largest in the nation.
1 2001 California Society of Certified Public Accountants, Gale Group. 2 County shares of GSP computed as county share of wages from the BLS Quarterly Census of Employment and Wages applied to the estimate of GSP from the Bureau of Economic Analysis.
1
NOEP Coastal Tourism and Recreation – More Growth/Lower Wages Coastal Tourism & Recreation dominated job growth with lower wages, while higher wage jobs in ocean-related sectors declined. This trend, which also took place nationally, represents a shift from goods-related economic activity towards services. It points to the need for California to continue to address housing and transportation issues to accommodate this workforce. In addition, California must continue its leadership efforts to protect and enhance the natural resources, which draw visitors from all over the world. Coastal Population Density Is High – More Growth Inland Not only are the oceans important economically to the state, they are much loved by the residents. In 2000, 77% of California’s population lived in coastal counties, which represent 25% of the land. In fact, population density along the coast increased markedly over the decade to 671 people per square mile compared to population density for the entire state of 217 people per square mile. However, between 1990 and 2000, California’s coastal population grew more slowly than the overall state population; 11.3% compared to the total state population growth of 13.7%, a difference of 2.4%. Areas of highest population growth were the inland areas immediately adjacent to the coast, where land was more available and less expensive at the time. Coastal Economy: Employment and Gross State Product Total Coastal County GSP in 2000 represented approximately 86% of California’s GSP, estimated at $1.15 Trillion. Coastal employment in California increased by 13.2% from 1990 to 2000 compared to the state’s overall employment growth of approximately 12%. In 2000, total employment in coastal counties represented 81% of the state’s total employment or 11,994,814 salaried workers. Regional Growth Regionally, the largest growth occurred in the central region of California, which includes Monterey, San Mateo, and Santa Cruz counties. The growth rates on all three measures, employment, wages and GSP, were larger than any other region, and were driven primarily by growth in Tourism & Recreation. The largest Ocean Economy is in the Southern, most populous region. Rural areas indicated a higher proportion of jobs relating to the coastal and ocean economy than in urban areas. The Ocean Economy represented 2.7% of employment in the highly populated Southern California economy and nearly 10% of the jobs in the northern rural region of Humboldt, Del Norte, and Mendocino counties. National Ocean Economics Program This report was funded by a Coastal Impact Assistance Program (CIAP) Grant awarded by the California Resources Agency to the National Ocean Economics Program. The NOEP team, conducting a national investigation into the ocean based economy of the United States, has carried out this work using the most reliable available sources of information to prepare this report. The information and views expressed in this report are those of the authors and do not reflect any official views or position of the State of California. Professors Judith T. Kildow of California State University at Monterey Bay and Charles S. Colgan from the University of Southern Maine led the team.
2
NOEP Acknowledgements The State of California Resources Agency sponsored this study with CIAP funds. The research team from the National Ocean Economics Program prepared this report from the most reliable, available sources. The information found in the following pages reflects the views and work of the staff of this project, and not necessarily those of the sponsor. Professor Judith Kildow led the team; Professor Charles Colgan was the Chief Economist; Professor Linwood Pendleton of UCLA participated in writing the beach valuation paper with Duan Zhuang and Shivendu Shivendu, research assistants at the University of Southern California, and Robin Tindall of the University of Vermont assisted with the project. Thanks to the Wrigley Institute for Environmental Studies at the University of Southern California for providing the offices and additional support for this work. Thanks are especially due to the NOEP staff at California State University at Monterey Bay for their enormous efforts in helping to complete the Final Report: Staff members, Pat Johnston and Bonnie Lockwood; student assistants, Lindsay Carr, Amy Lockwood, Eric Ensch, and Scott Norris. Finally, our appreciation goes out to the many reviewers whose valuable suggestions and observations went into the final report. Karen Polenske, MIT; Giulio Pontecorvo, Columbia University; Robert Solow, MIT; Linwood Pendleton, UCLA; Phil King, San Francisco State University; Tim Tyrell, University of Rhode Island; Rosa Moller, State of California; Paul Kelly, Rowan Companies; Karen Garrison, Natural Resource Defense Council; Lesley Ewing, California Coastal Commission; Howard J. Shatz, Public Policy Institute of California; and others who volunteered comments and suggestions throughout the project.
3

NOEP
4
NOEP PART I BACKGROUND AND SUMMARY OF FINDINGS
Chapter 1 Introduction 1.1 California and the Sea California has always been influenced by the sea. Unlike other western states, California was founded from the sea inward, first by the Spanish and then by the Americans. California retains close links to the Pacific and by utilizing its resources, was the fifth largest industrial economy in 2000.3 Its connections to the ocean are evidenced by the economic activity of thousands of businesses, its burgeoning ports, and in the behavior of millions of people who flock to the shore. Besides attracting millions of people, California is a fascinating place to examine and an important place to understand. California’s coast has unique physical qualities. Geographically and geologically, California’s coast is a mixture of broad sand beaches, enormous estuaries turned ports, and rocky cliff formations that make it conducive to differing economies and lifestyles. The varied climate along its coast contributes to differing patterns of living. Demographically, it is heavily urban in the Bay area and Southern Coastal areas, mixed rural and semi-urban along the Central Coast, and mostly rural along the Northern coast. In the past, it has been difficult to fully appreciate the magnitude of the connections to the ocean. Now, it is possible to measure the economic and demographic relationships as they change over time throughout the state as a whole, and in the different coastal regions of California. Between 1990 and 2000, California’s population grew from 29.8 million to approximately 33.9 million, an estimated annual growth rate of 13.7%. Seventy-seven percent of the population lives in or near the coast, and a faster growing population inhabits the inland areas immediately adjacent to the coast. Another important indicator of change, employment, is growing faster along the coast than inland, indicating a strong growth in the economy along the shore. California holds a prominent political leadership position with respect to coastal zone and ocean management. For many years it has initiated innovative programs and policies to meet the challenges of balancing protection of it resources and development for its growing population and economy. As the first state to pass coastal management legislation in 19764, it continues as a model for other states by its responses to coastal issues. California’s growing population and historic popularity as a tourist destination have brought it both economic wealth and the accompanying challenges of enormous pressure on all of its natural resources, particularly those along its more populated coastal areas. Beaches are the top destination for its tourists and one of California’s greatest assets. Its beaches stretch the length of the state, and are sought particularly in Southern California due 3 2001 California Society of Certified Public Accountants, Gale Group. 4 Coastal Act of 1976, Coastal Resources Planning & Management Policies. <http://www.coastal.ca.gov/fedca/cach3.pdf>. The Act created policies for public access, recreation, marine environment, land resources, and development.
5
NOEP to its warmer climate. For this study the value of beaches and coastal areas has been calculated to demonstrate their importance to the California economy, and the significance of maintaining both. Protecting the beaches from pollution is only part of the challenge; they also are eroding because California, like other places, has damned up most of its coastal watersheds, thus preventing the fresh-running waters carrying essential nourishing sediments to the coast. As a result, California conducts some artificial beach nourishment to ensure its revenues from tourism continue, and to protect this unique and desirable asset. Californians can boast a long list of challenges and activities that dominate the California coastal landscape. These activities require monitoring and management to ensure that the shores of California can sustain the pressures and deliver the amenities and goods the public seeks. To date, however, there has been little information about the value of the coast and ocean to the state of California, and even less information about how these values have changed over time. Likewise, there continues to be little understanding of the state’s economic dependence on these natural resources. Uncovering California’s relationships to the ocean and its economy is the purpose of this report. 1.2 About this Study This report is an update of a study of California’s Ocean Economy that was undertaken in 1994 by staff of the California Research Bureau,5 and later published as part of a larger report in 1997 by the California Resources Agency.6 A research team from the National Ocean Economics Program (NOEP), headquartered at the University of Southern California (1999-2003) and California State University at Monterey Bay (2003-present), has conducted a national investigation into the ocean-based economy of the United States. The general outline and scope of the 1994 study were followed, but there are some differences. This report incorporates the latest data and analytic techniques developed by the NOEP to measure the Ocean Economy of all states, and thus yields somewhat different estimates. Data from the years 1990 and 2000 shows changes in the California Ocean Economy over time utilizing a single methodology in order to provide a nationally consistent approach to measuring the ocean and coastal economy of the US. The NOEP methodology permits greater precision in estimates, particularly in tourism and recreation, and also provides data that permits measurement over time. Appendix A contains a brief discussion of the methodological issues involved in preparing this report. More detailed information can be found in Measurement of the Ocean and Coastal Economy: Theory and Methods (Colgan 2003).7 NOEP developed its methodology because the data available to measure the Ocean Economy were imperfect for the following reasons: (1) standard economic data series available for this study were not designed to measure in detail the relationship between the
5 R. Moeller and J. Fitz, 1994. An Economic Assessment of Ocean Dependent Activities, Sacramento: California Research Bureau. 6 The Resources Agency, California, 1997. California’s Ocean Resources: An Agenda for the Future. 7 C. Colgan, 2003. Measurement of the Ocean and Coastal Economy: Theory and Methods working paper, NOEP, <www.OceanEconomics.org/Download/NOEPMethodv8.pdf >.
6
NOEP ocean and economic activity, so a methodology has been devised that allows the data sets to be as compatible as possible with the realities of this particular slice of the economy; (2) other essential data are missing or irregularly available. Particularly, sector data at the county, and even regional level, in many cases cannot be publicly revealed because of federal rules of disclosure that protect proprietary information on firms; (3) standard economic data do not fully capture all of the economic value of the ocean. Recreational uses such as a day at the beach, or just enjoying a view of the sea do not appear in market data sets, but rather, are found in studies using a range of methodologies, and are thus not included in our estimates. 1.3 Definitions and Terminology To avoid repetition and for clarification purposes, the following terms and definitions regarding economic indicators and valuation categories are found in the beginning of this report, so that the reader can fully understand what is intended. Coastal Economy: the sum of all economic activity occurring in counties defined as part of a state’s coastal zone management program, including four additional counties that are part of San Francisco Bay and the Sacramento River Delta areas. Most, but not all of the Ocean Economy is part of the Coastal Economy. Ocean Economy: those activities that create goods and services, a portion of whose value is affected by the ocean and its resources. Economic statistics are grouped by a classification system known as the Standard Industrial Classification (SIC), which imperfectly reflects the relationship between economic activity and the ocean.8 Only part of the Coastal Economy is part of the Ocean Economy. Dollar Values: expressed in constant 2000 dollars (adjusted by the Consumer Price Index). • Dollar values are estimated as direct and indirect values. Indirect values include induced
values. • Direct values: those activities associated only with the designated ocean industries such
as travel and tourism and living resources (examples include labor and capital costs associated with hotel accommodations or labor and capital costs for fish processing).
• Multipliers: indirect and induced values. Multipliers affect the estimates of employment, wages, and output within the region. Indirect effects include both the change in economic activity in industries within the region that buy or sell from ocean industries (examples include sales of food to restaurants and hotels and the activities of travel agents booking trips) and the change in economic activity resulting from the spending of the wages earned by those employed by the ocean industries within the region. All indirect values or multiplier effects are based on IMPLAN, a standard and widely used economic impact model.
8 After 2000, all industries are classified using the North American Industry Classification System (NAICS) rather than the Standard Industrial Classification (SIC by BLS). Both SIC and NAICS codes have been provided for 2001 as a benchmark leaving further calculations to the user. NAICS focuses on how products and services are created, as opposed to SIC which focuses on what is produced. Using NAICS yields significantly different industry groupings from those produced using SIC. These differences in NAICS and SIC structures, preclude direct comparison between NAICS data and SIC-based data for earlier years for historical series.
7
NOEP • Unless otherwise indicated, all measures are stated as direct values. Employment: annual average wage and salary private employment excluding self-employment.
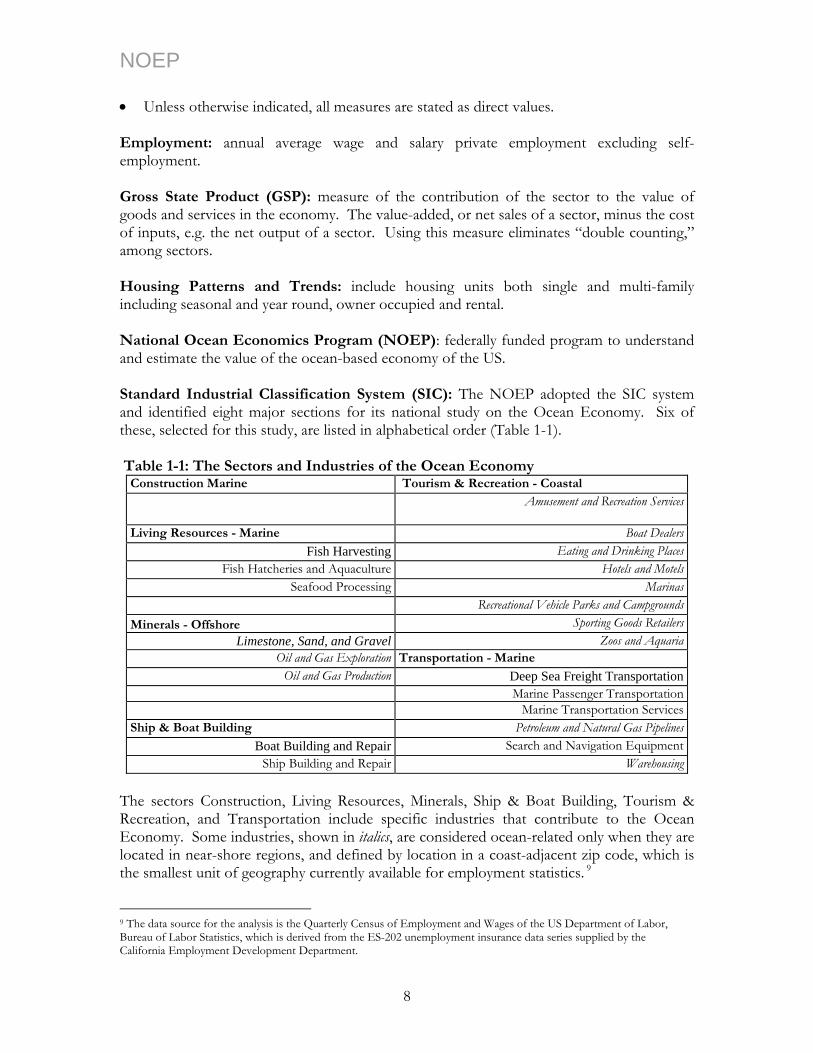
Gross State Product (GSP): measure of the contribution of the sector to the value of goods and services in the economy. The value-added, or net sales of a sector, minus the cost of inputs, e.g. the net output of a sector. Using this measure eliminates “double counting,” among sectors. Housing Patterns and Trends: include housing units both single and multi-family including seasonal and year round, owner occupied and rental. National Ocean Economics Program (NOEP): federally funded program to understand and estimate the value of the ocean-based economy of the US. Standard Industrial Classification System (SIC): The NOEP adopted the SIC system and identified eight major sections for its national study on the Ocean Economy. Six of these, selected for this study, are listed in alphabetical order (Table 1-1).
Table 1-1: The Sectors and Industries of the Ocean Economy
Construction Marine Tourism & Recreation - Coastal Amusement and Recreation Services
Living Resources - Marine Boat DealersFish Harvesting Eating and Drinking Places
Fish Hatcheries and Aquaculture Hotels and MotelsSeafood Processing Marinas
Recreational Vehicle Parks and CampgroundsMinerals - Offshore Sporting Goods Retailers
Limestone, Sand, and Gravel Zoos and AquariaOil and Gas Exploration Transportation - Marine
Oil and Gas Production Deep Sea Freight Transportation Marine Passenger Transportation Marine Transportation ServicesShip & Boat Building Petroleum and Natural Gas Pipelines
Boat Building and Repair Search and Navigation EquipmentShip Building and Repair Warehousing
The sectors Construction, Living Resources, Minerals, Ship & Boat Building, Tourism & Recreation, and Transportation include specific industries that contribute to the Ocean Economy. Some industries, shown in italics, are considered ocean-related only when they are located in near-shore regions, and defined by location in a coast-adjacent zip code, which is the smallest unit of geography currently available for employment statistics. 9
9 The data source for the analysis is the Quarterly Census of Employment and Wages of the US Department of Labor, Bureau of Labor Statistics, which is derived from the ES-202 unemployment insurance data series supplied by the California Employment Development Department.
8
NOEP The use of SIC codes and geography provides the best means of measuring the Ocean Economy. This methodology is based on available data consistent across all states and can provide information from the national to the local level. Wages and Salaries: the wages and salaries paid; all wages are shown in year 2000 dollars. 1.4 Limitations and Omissions Although this report covers all categories found in the earlier California report, it does not capture the full value of the California Ocean Economy. This study omits some important segments of the California Ocean Economy: • Ocean Economy is measured only in coastal counties at this time, although Ocean
Economy activities extend throughout the country. • The government sector is excluded; the SIC codes do not distinguish between coast and
ocean-related sectors and non-ocean related activities of the federal, state, and local government agencies.
• Fisheries harvesting employment values are omitted because they are not included in the nation’s employment database, and are not accurately and consistently available from any other source.
• Marine science and education are not included since data related to this field cannot be separated easily within larger organizations such as colleges and universities that undertake most marine scientific research. However, a list of California’s marine science research and education institutions can be found in the Appendix. C.
• Real estate is not included because such information requires a different approach to valuation.
• Corporate investment estimates as well as consumptive values are missing because they require a different approach to valuation.
9

NOEP
10
NOEP
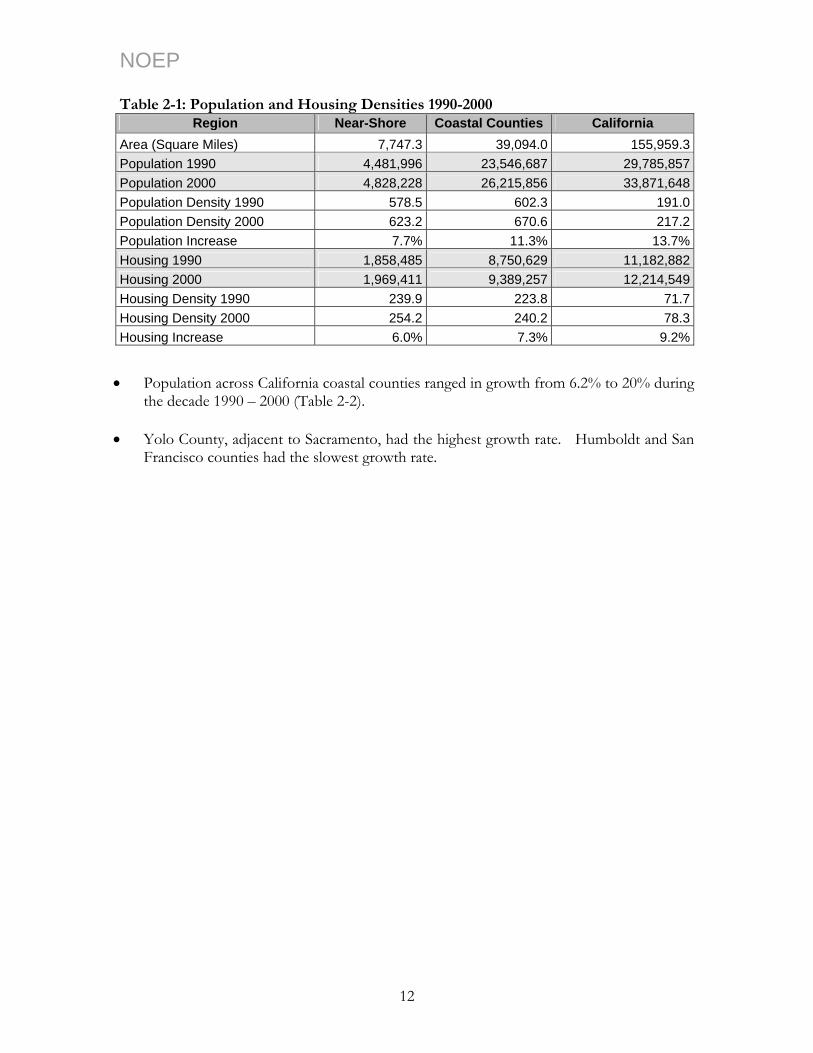
Chapter 2 Summary of Findings 2.1 Introduction This chapter has been separated into four categories highlighting the more interesting findings. The first two categories are (1) California’s Coastal Economy, which includes the demographic patterns that define and drive it;10 and (2) comparison of California’s Ocean Economy with the nation that also includes other coastal states. These are added solely to provide context and a fuller understanding of the data generated for this report, yet are not analyzed or elaborated further. The second two categories, (3) comparison of California’s Regional Ocean Economies with each other and with the state over time;11 and (4) comparison of California’s Ocean Economy by sectors, over time are further elaborated in the following chapters. 2.2 California’s Coastal Economy As explained in Chapter 1, California’s Coastal Economy reflects all activities within either coastal zip codes or coastal counties, which are part of the California Coastal Zone Management Program. This includes all counties with ports and harbors in watersheds that host important maritime activities. Population and housing estimates are added to show important trends. California’s coastal population did not increase as rapidly as the state’s population during the decade between 1990 and 2000, (11.3% compared to the total state population growth of 13.7%, a difference of 2.4%). However, density of California’s coastal population continues to far exceed that of the state. In the year 2000, density along the coast was more than 623 people per square mile vs. 217people per square mile for the state. • In 2000, 77% of California’s population lived in coastal counties, which represent 25%
of the land.
• According to US Census reports, the areas of highest population growth, however, were those found immediately adjacent to the coastal areas, inland along coastal watersheds, where property was less expensive and more available at the time.12 While population density in coastal areas clearly exceeds these areas for now, inland areas merit close monitoring, because they are vulnerable to overexploitation of the natural landscape and the filling in of valuable and limited green space that could affect the quality of watersheds and ultimately the shoreline. See Table 2-1, Coastal County densities.
10 California State Summary of Coastal and Ocean Social and Economic Trends, December 2004. 11 The State has been divided into 5 regions, as was done in the previous CA study. However, due to changes in marine-based activities in watersheds, we have added the counties of Yolo, San Joaquin, and Sacramento to ensure that all significant activities were included. 12 Examples would be the “inland empire” in LA County, the Salinas Valley in Monterey County, the Inland areas of Sonoma county, the Sacramento Delta areas.
11
NOEP Table 2-1: Population and Housing Densities 1990-2000
Region Near-Shore Coastal Counties California Area (Square Miles) 7,747.3 39,094.0 155,959.3Population 1990 4,481,996 23,546,687 29,785,857Population 2000 4,828,228 26,215,856 33,871,648Population Density 1990 578.5 602.3 191.0Population Density 2000 623.2 670.6 217.2Population Increase 7.7% 11.3% 13.7%Housing 1990 1,858,485 8,750,629 11,182,882Housing 2000 1,969,411 9,389,257 12,214,549Housing Density 1990 239.9 223.8 71.7Housing Density 2000 254.2 240.2 78.3Housing Increase 6.0% 7.3% 9.2%
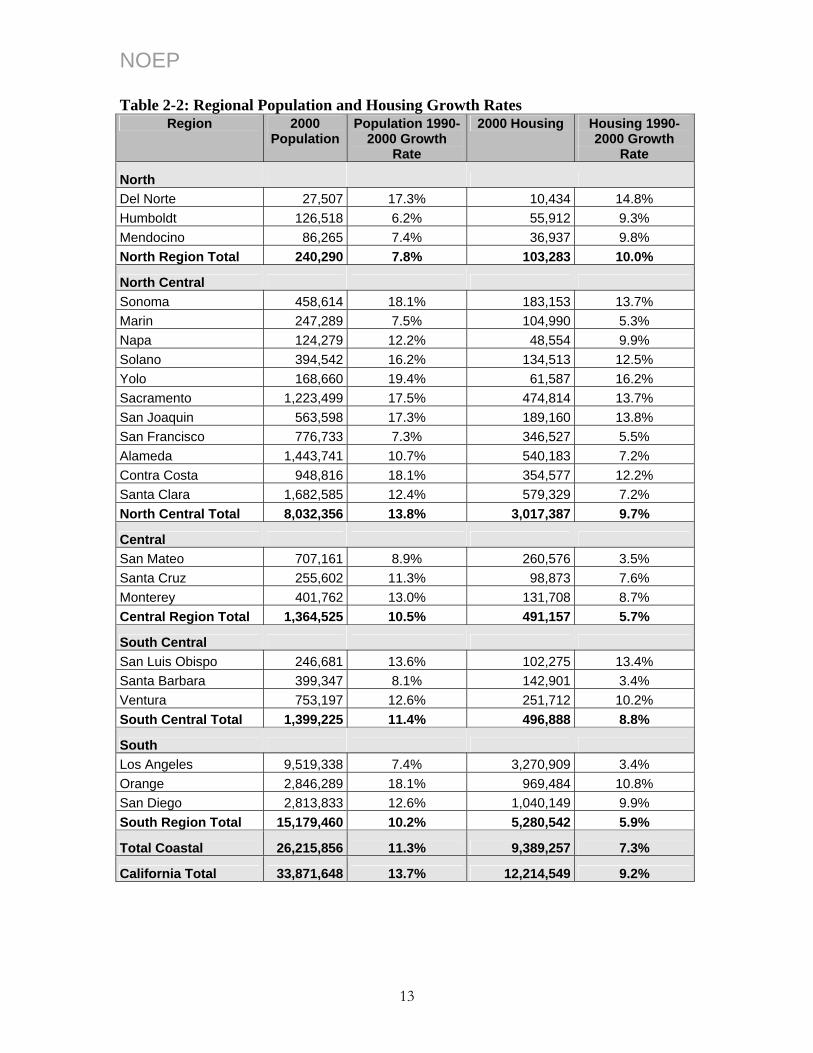
• Population across California coastal counties ranged in growth from 6.2% to 20% during
the decade 1990 – 2000 (Table 2-2). • Yolo County, adjacent to Sacramento, had the highest growth rate. Humboldt and San
Francisco counties had the slowest growth rate.
12
NOEP Table 2-2: Regional Population and Housing Growth Rates
Region 2000 Population
Population 1990-2000 Growth
Rate
2000 Housing Housing 1990-2000 Growth
Rate
North Del Norte 27,507 17.3% 10,434 14.8% Humboldt 126,518 6.2% 55,912 9.3% Mendocino 86,265 7.4% 36,937 9.8% North Region Total 240,290 7.8% 103,283 10.0%
North Central Sonoma 458,614 18.1% 183,153 13.7% Marin 247,289 7.5% 104,990 5.3% Napa 124,279 12.2% 48,554 9.9% Solano 394,542 16.2% 134,513 12.5% Yolo 168,660 19.4% 61,587 16.2% Sacramento 1,223,499 17.5% 474,814 13.7% San Joaquin 563,598 17.3% 189,160 13.8% San Francisco 776,733 7.3% 346,527 5.5% Alameda 1,443,741 10.7% 540,183 7.2% Contra Costa 948,816 18.1% 354,577 12.2% Santa Clara 1,682,585 12.4% 579,329 7.2% North Central Total 8,032,356 13.8% 3,017,387 9.7%
Central San Mateo 707,161 8.9% 260,576 3.5% Santa Cruz 255,602 11.3% 98,873 7.6% Monterey 401,762 13.0% 131,708 8.7% Central Region Total 1,364,525 10.5% 491,157 5.7%
South Central San Luis Obispo 246,681 13.6% 102,275 13.4% Santa Barbara 399,347 8.1% 142,901 3.4% Ventura 753,197 12.6% 251,712 10.2% South Central Total 1,399,225 11.4% 496,888 8.8%
South Los Angeles 9,519,338 7.4% 3,270,909 3.4% Orange 2,846,289 18.1% 969,484 10.8% San Diego 2,813,833 12.6% 1,040,149 9.9% South Region Total 15,179,460 10.2% 5,280,542 5.9%
Total Coastal 26,215,856 11.3% 9,389,257 7.3%
California Total 33,871,648 13.7% 12,214,549 9.2%
13
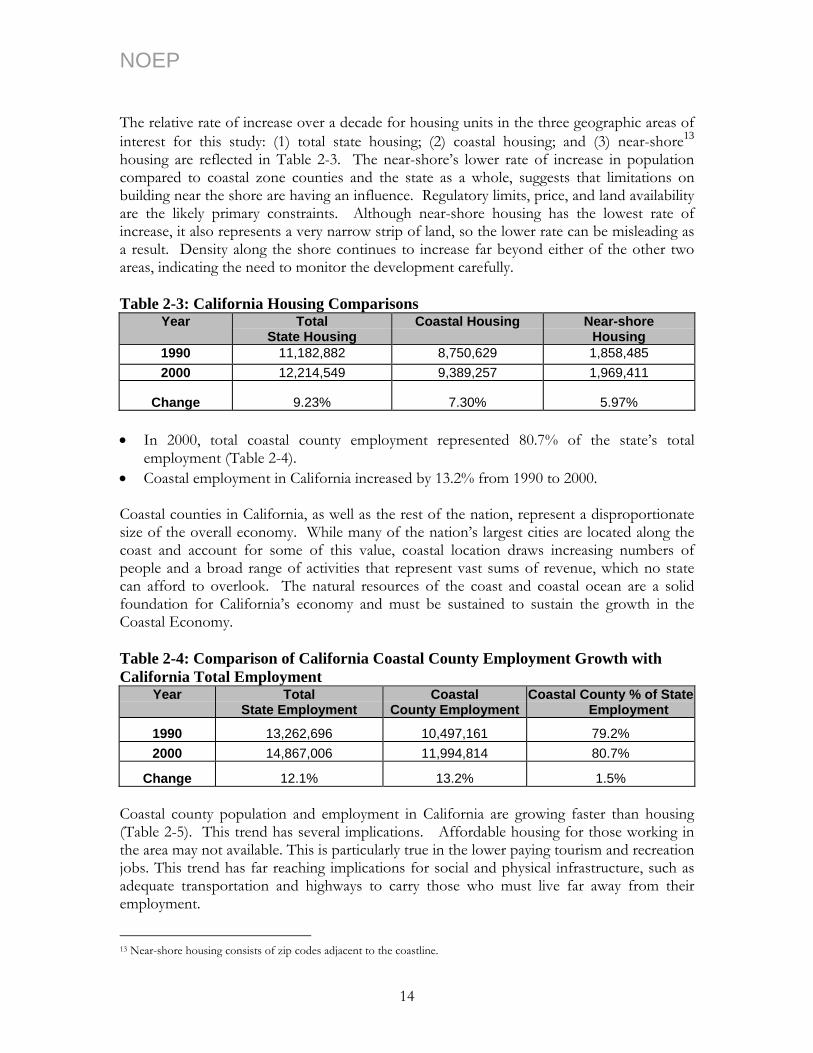
NOEP The relative rate of increase over a decade for housing units in the three geographic areas of interest for this study: (1) total state housing; (2) coastal housing; and (3) near-shore13 housing are reflected in Table 2-3. The near-shore’s lower rate of increase in population compared to coastal zone counties and the state as a whole, suggests that limitations on building near the shore are having an influence. Regulatory limits, price, and land availability are the likely primary constraints. Although near-shore housing has the lowest rate of increase, it also represents a very narrow strip of land, so the lower rate can be misleading as a result. Density along the shore continues to increase far beyond either of the other two areas, indicating the need to monitor the development carefully. Table 2-3: California Housing Comparisons
Year Total State Housing
Coastal Housing Near-shore Housing
1990 11,182,882 8,750,629 1,858,485 2000 12,214,549 9,389,257 1,969,411
Change 9.23% 7.30% 5.97% • In 2000, total coastal county employment represented 80.7% of the state’s total
employment (Table 2-4). • Coastal employment in California increased by 13.2% from 1990 to 2000. Coastal counties in California, as well as the rest of the nation, represent a disproportionate size of the overall economy. While many of the nation’s largest cities are located along the coast and account for some of this value, coastal location draws increasing numbers of people and a broad range of activities that represent vast sums of revenue, which no state can afford to overlook. The natural resources of the coast and coastal ocean are a solid foundation for California’s economy and must be sustained to sustain the growth in the Coastal Economy. Table 2-4: Comparison of California Coastal County Employment Growth with California Total Employment
Year
Total State Employment
Coastal County Employment
Coastal County % of State Employment
1990 13,262,696 10,497,161 79.2% 2000 14,867,006 11,994,814 80.7%
Change 12.1% 13.2% 1.5% Coastal county population and employment in California are growing faster than housing (Table 2-5). This trend has several implications. Affordable housing for those working in the area may not available. This is particularly true in the lower paying tourism and recreation jobs. This trend has far reaching implications for social and physical infrastructure, such as adequate transportation and highways to carry those who must live far away from their employment.
13 Near-shore housing consists of zip codes adjacent to the coastline.
14
NOEP Table 2-5: Growth Rates for Coastal County Housing, Population, and Employment
1990 - 2000 Housing Growth Rate
1990 - 2000 Population Growth Rate
1990 - 2000 Employment Growth Rate
7.30% 11.30% 13.2%
2.3 California’s Ocean Economy: Comparisons with the Nation • California’s share of the national Ocean Economy is substantially larger than its share of
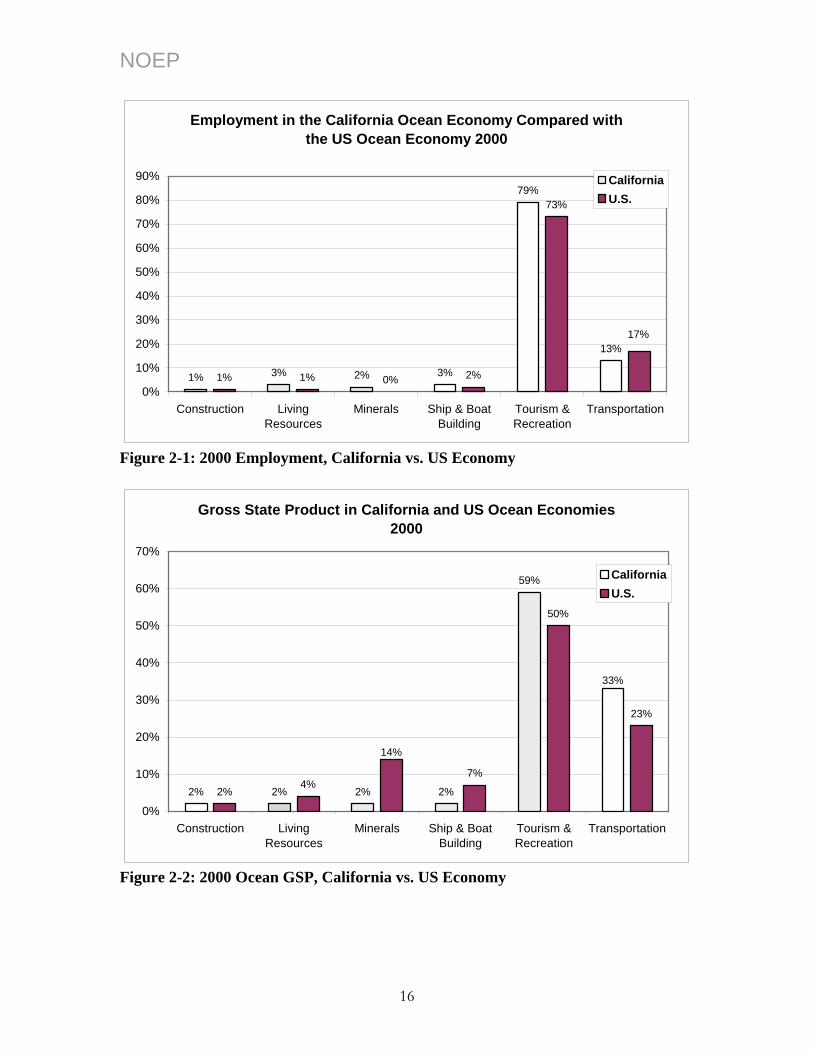
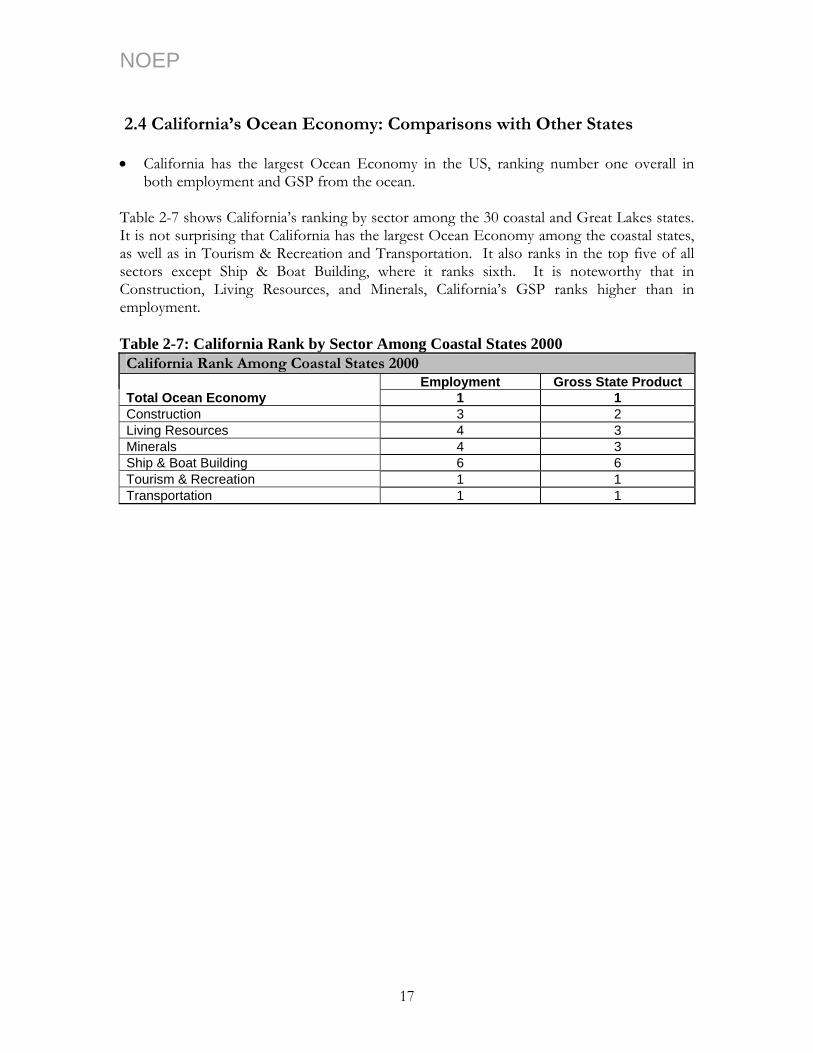
the total US economy. The nationally consistent measurements of the Ocean Economy, which have been developed by the NOEP, allow comparisons of California’s Ocean Economy with other states and the nation.14 Overall California made up nearly 19% of the US Ocean Economy in 2000 in both employment and GSP (Table 2-6). During that same year, California had 11.4% of total US employment and 13.4% of US GSP. California provided a larger portion of the national Ocean Economy than its contribution to the total economy. Major reasons for this were the increase in the Tourism & Recreation sector and the strength of the Transportation sector. California’s Marine Transportation sector is more than a quarter of the national Marine Transportation sector with the Ports of Long Beach and Los Angeles being among the largest in the nation. Table 2-6: California’s Share in the US Ocean Economy 2000
California’s share in the US Ocean Economy 2000 Employment Gross State Product Total Ocean Economy 18.7% 18.9%Construction 9.6% 13.1%Living Resources 10.6% 7.4%Minerals 9.2% 6.7%Ship & Boat Building 10.2% 9.6%Tourism & Recreation 20.1% 22.1%Transportation 26.1% 28.1%
Figures 2-1 and 2-2 compare the distribution of employment and GSP between the two areas in 2000. For employment, California has a larger proportion of its Ocean Economy in Ship & Boat Building, Living Resources, and Minerals than the US has as part of its economy. However, the value of GSP in the US is larger in Ship & Boat Building and Minerals, while the value of the Transportation sector’s GSP is much larger in California. The value of Tourism & Recreation also is larger in California.
14 All values reported in this part of the study are direct values, unless otherwise noted.
15
NOEP
Employment in the California Ocean Economy Compared with the US Ocean Economy 2000
1% 3% 2% 3%
79%
13%
1% 1% 0% 2%
73%
17%
0%
10%
20%
30%
40%
50%
60%
70%
80%
90%
Construction LivingResources
Minerals Ship & BoatBuilding
Tourism &Recreation
Transportation
CaliforniaU.S.
Figure 2-1: 2000 Employment, California vs. US Economy
Gross State Product in California and US Ocean Economies 2000
2% 2% 2% 2%
59%
2%4%
7%
50%
23%
33%
14%
0%
10%
20%
30%
40%
50%
60%
70%
Construction LivingResources
Minerals Ship & BoatBuilding
Tourism &Recreation
Transportation
CaliforniaU.S.
Figure 2-2: 2000 Ocean GSP, California vs. US Economy
16
NOEP 2.4 California’s Ocean Economy: Comparisons with Other States • California has the largest Ocean Economy in the US, ranking number one overall in
both employment and GSP from the ocean. Table 2-7 shows California’s ranking by sector among the 30 coastal and Great Lakes states. It is not surprising that California has the largest Ocean Economy among the coastal states, as well as in Tourism & Recreation and Transportation. It also ranks in the top five of all sectors except Ship & Boat Building, where it ranks sixth. It is noteworthy that in Construction, Living Resources, and Minerals, California’s GSP ranks higher than in employment. Table 2-7: California Rank by Sector Among Coastal States 2000 California Rank Among Coastal States 2000 Employment Gross State Product Total Ocean Economy 1 1 Construction 3 2 Living Resources 4 3 Minerals 4 3 Ship & Boat Building 6 6 Tourism & Recreation 1 1 Transportation 1 1
17

NOEP Table 2-8 shows California maintained its first place rank among all coastal and Great Lakes states in Ocean Economy GSP from 1990 to 2000. Table 2-8: Ocean Economy GSP Rankings of Coastal States 1990 and 2000 Rank State 1990 2000 State Rank
1 California 14,703,784,251 21,434,428,141 California 1 2 Louisiana 14,599,213,346 15,248,432,508 Louisiana 2 3 New York 6,603,086,278 11,676,830,383 Florida 3 4 Florida 6,321,459,167 7,683,892,713 Washington 4 5 Alaska 5,296,007,820 6,848,544,553 New Jersey 5 6 Washington 5,260,776,080 6,446,339,764 Texas 6 7 New Jersey 4,885,639,675 5,239,162,298 Alaska 7 8 Texas 3,039,803,670 5,092,727,554 New York 8 9 Virginia 2,556,648,972 4,030,681,483 Hawaii 9
10 Hawaii 2,546,093,848 3,565,652,519 Virginia 10 11 Maryland 2,201,909,490 3,324,045,497 Illinois 11 12 Illinois 2,085,041,271 2,867,222,029 Pennsylvania 12 13 Connecticut 2,068,303,837 2,454,068,194 Connecticut 13 14 Michigan 1,210,080,844 2,363,494,739 Maryland 14 15 Maine 1,061,506,497 2,002,302,949 Michigan 15 16 Wisconsin 1,030,262,706 1,785,750,627 Mississippi 16 17 Mississippi 916,079,810 1,519,896,601 Maine 17 18 South Carolina 815,872,218 1,422,939,938 South Carolina 18 19 Rhode Island 711,994,326 1,241,080,165 Wisconsin 19 20 North Carolina 662,450,171 1,167,788,146 Georgia 20 21 Pennsylvania 622,336,827 1,097,149,561 North Carolina 21 22 Ohio 577,922,814 994,142,073 Indiana 22 23 New Hampshire 573,964,731 942,681,414 Ohio 23 24 Georgia 570,192,354 862,983,177 Rhode Island 24 25 Oregon 490,307,531 766,574,374 Alabama 25 26 Indiana 484,263,909 710,837,378 Oregon 26 27 Alabama 424,109,254 519,075,829 New Hampshire 27 28 Minnesota 281,665,137 454,283,828 Minnesota 28 29 Delaware 217,172,151 362,687,784 Delaware 29
18
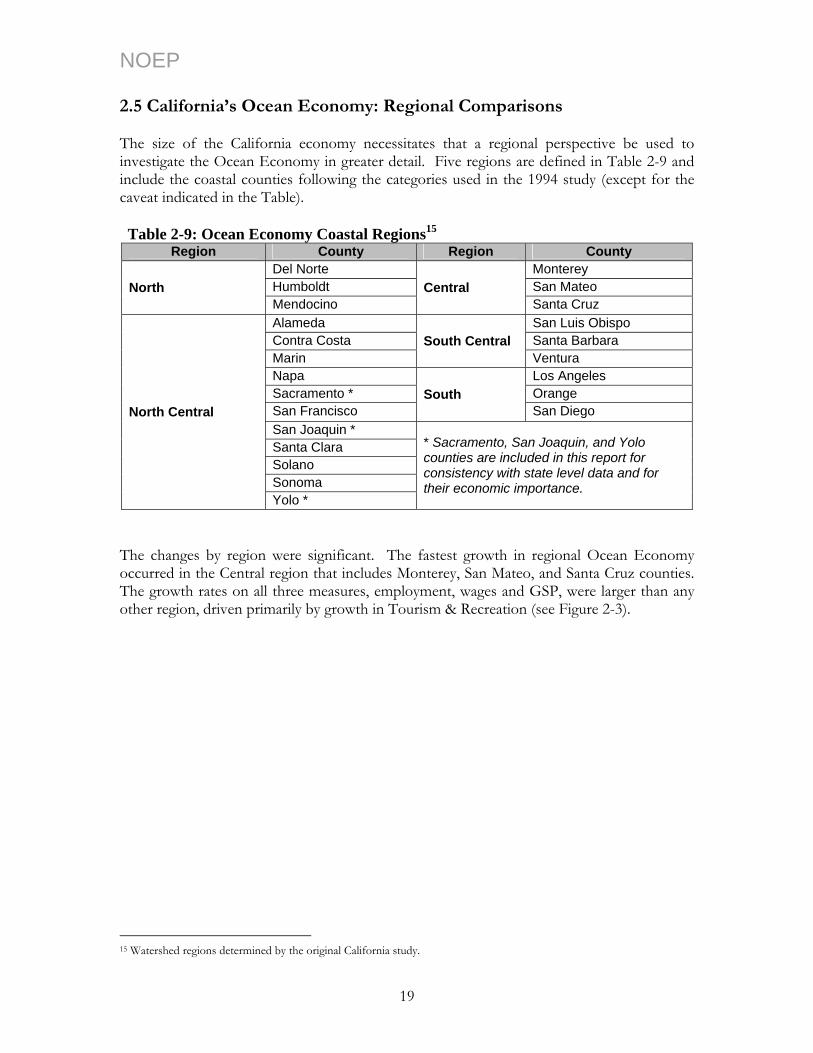
NOEP 2.5 California’s Ocean Economy: Regional Comparisons The size of the California economy necessitates that a regional perspective be used to investigate the Ocean Economy in greater detail. Five regions are defined in Table 2-9 and include the coastal counties following the categories used in the 1994 study (except for the caveat indicated in the Table). Table 2-9: Ocean Economy Coastal Regions15
Region County Region County Del Norte Monterey Humboldt San Mateo North Mendocino
Central Santa Cruz
Alameda San Luis Obispo Contra Costa Santa Barbara Marin
South Central Ventura
Napa Los Angeles Sacramento * Orange San Francisco
South San Diego
San Joaquin * Santa Clara Solano Sonoma
North Central
Yolo *
* Sacramento, San Joaquin, and Yolo counties are included in this report for consistency with state level data and for their economic importance.
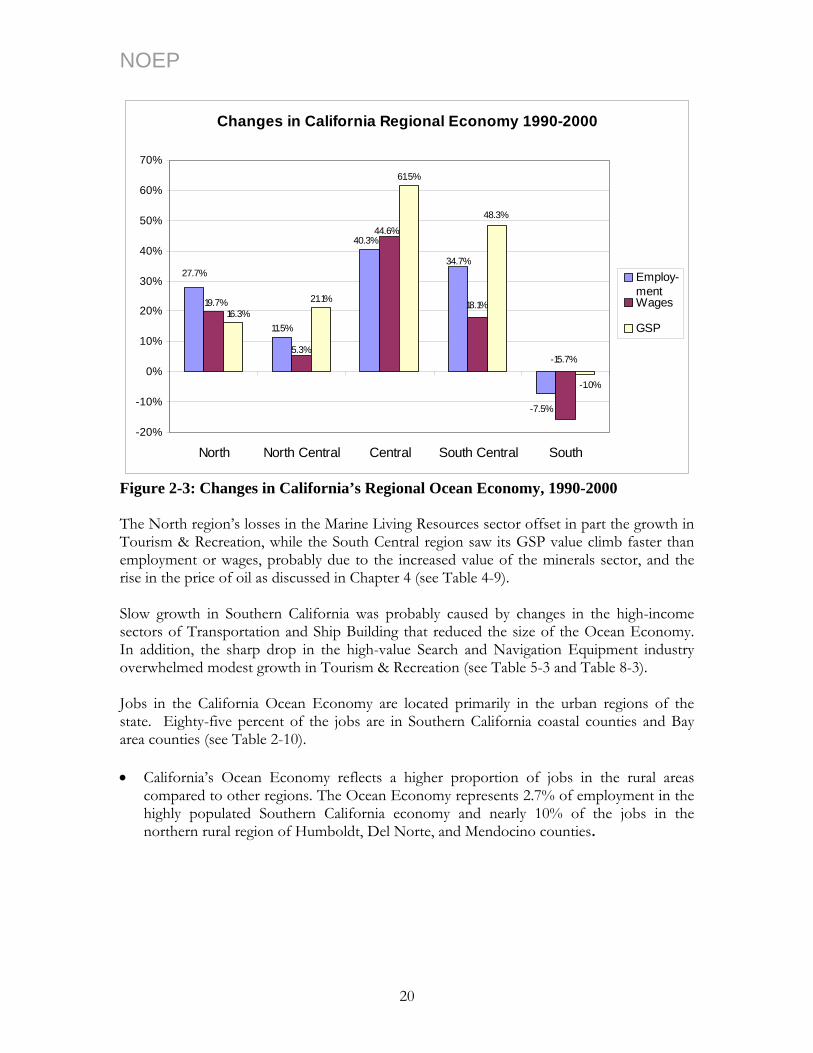
The changes by region were significant. The fastest growth in regional Ocean Economy occurred in the Central region that includes Monterey, San Mateo, and Santa Cruz counties. The growth rates on all three measures, employment, wages and GSP, were larger than any other region, driven primarily by growth in Tourism & Recreation (see Figure 2-3).
15 Watershed regions determined by the original California study.
19
NOEP
Changes in California Regional Economy 1990-2000
11.5%
21.1%
61.5%
40.3%
34.7%
-7.5%
27.7%
44.6%
19.7%
-15.7%
18.1%
5.3%
48.3%
-1.0%
16.3%
-20%
-10%
0%
10%
20%
30%
40%
50%
60%
70%
North North Central Central South Central South
Employ-mentWages
GSP
Figure 2-3: Changes in California’s Regional Ocean Economy, 1990-2000 The North region’s losses in the Marine Living Resources sector offset in part the growth in Tourism & Recreation, while the South Central region saw its GSP value climb faster than employment or wages, probably due to the increased value of the minerals sector, and the rise in the price of oil as discussed in Chapter 4 (see Table 4-9). Slow growth in Southern California was probably caused by changes in the high-income sectors of Transportation and Ship Building that reduced the size of the Ocean Economy. In addition, the sharp drop in the high-value Search and Navigation Equipment industry overwhelmed modest growth in Tourism & Recreation (see Table 5-3 and Table 8-3). Jobs in the California Ocean Economy are located primarily in the urban regions of the state. Eighty-five percent of the jobs are in Southern California coastal counties and Bay area counties (see Table 2-10). • California’s Ocean Economy reflects a higher proportion of jobs in the rural areas
compared to other regions. The Ocean Economy represents 2.7% of employment in the highly populated Southern California economy and nearly 10% of the jobs in the northern rural region of Humboldt, Del Norte, and Mendocino counties.
20
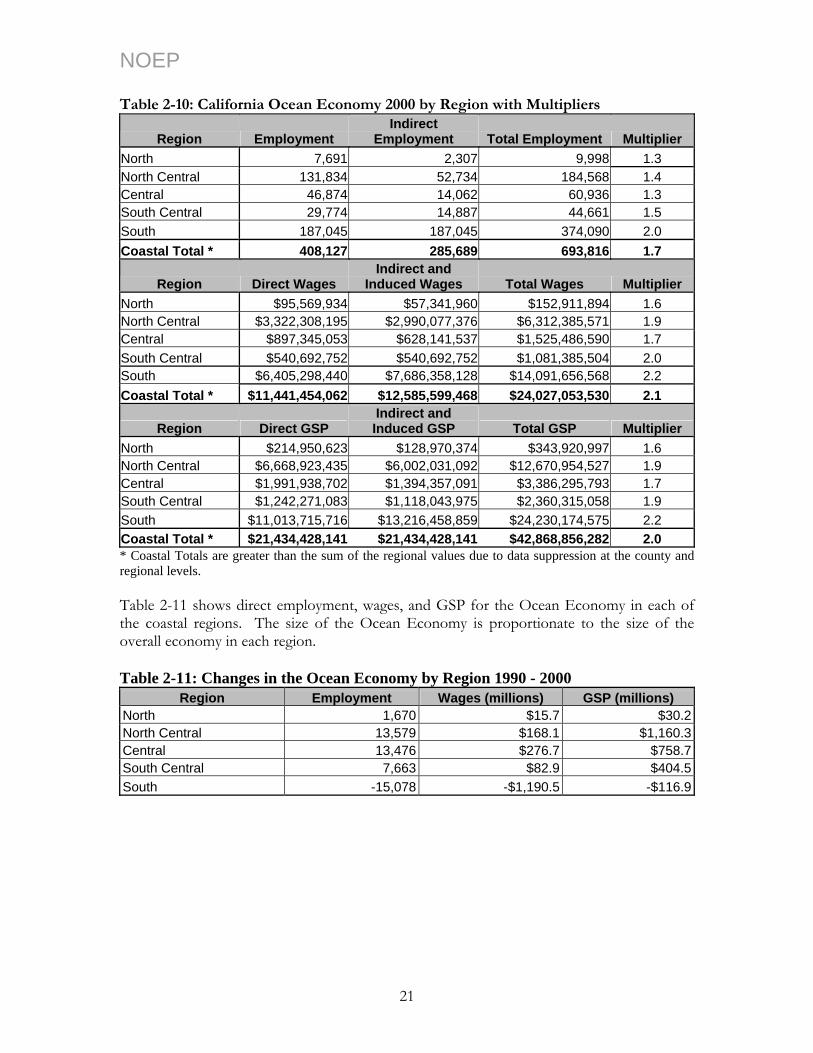
NOEP Table 2-10: California Ocean Economy 2000 by Region with Multipliers
Region Employment Indirect
Employment Total Employment Multiplier North 7,691 2,307 9,998 1.3 North Central 131,834 52,734 184,568 1.4 Central 46,874 14,062 60,936 1.3 South Central 29,774 14,887 44,661 1.5 South 187,045 187,045 374,090 2.0 Coastal Total * 408,127 285,689 693,816 1.7
Region Direct Wages Indirect and
Induced Wages Total Wages Multiplier North $95,569,934 $57,341,960 $152,911,894 1.6 North Central $3,322,308,195 $2,990,077,376 $6,312,385,571 1.9 Central $897,345,053 $628,141,537 $1,525,486,590 1.7 South Central $540,692,752 $540,692,752 $1,081,385,504 2.0 South $6,405,298,440 $7,686,358,128 $14,091,656,568 2.2 Coastal Total * $11,441,454,062 $12,585,599,468 $24,027,053,530 2.1
Region Direct GSP Indirect and Induced GSP Total GSP Multiplier
North $214,950,623 $128,970,374 $343,920,997 1.6 North Central $6,668,923,435 $6,002,031,092 $12,670,954,527 1.9 Central $1,991,938,702 $1,394,357,091 $3,386,295,793 1.7 South Central $1,242,271,083 $1,118,043,975 $2,360,315,058 1.9 South $11,013,715,716 $13,216,458,859 $24,230,174,575 2.2 Coastal Total * $21,434,428,141 $21,434,428,141 $42,868,856,282 2.0 * Coastal Totals are greater than the sum of the regional values due to data suppression at the county and regional levels. Table 2-11 shows direct employment, wages, and GSP for the Ocean Economy in each of the coastal regions. The size of the Ocean Economy is proportionate to the size of the overall economy in each region. Table 2-11: Changes in the Ocean Economy by Region 1990 - 2000
Region Employment Wages (millions) GSP (millions) North 1,670 $15.7 $30.2North Central 13,579 $168.1 $1,160.3Central 13,476 $276.7 $758.7South Central 7,663 $82.9 $404.5South -15,078 -$1,190.5 -$116.9
21
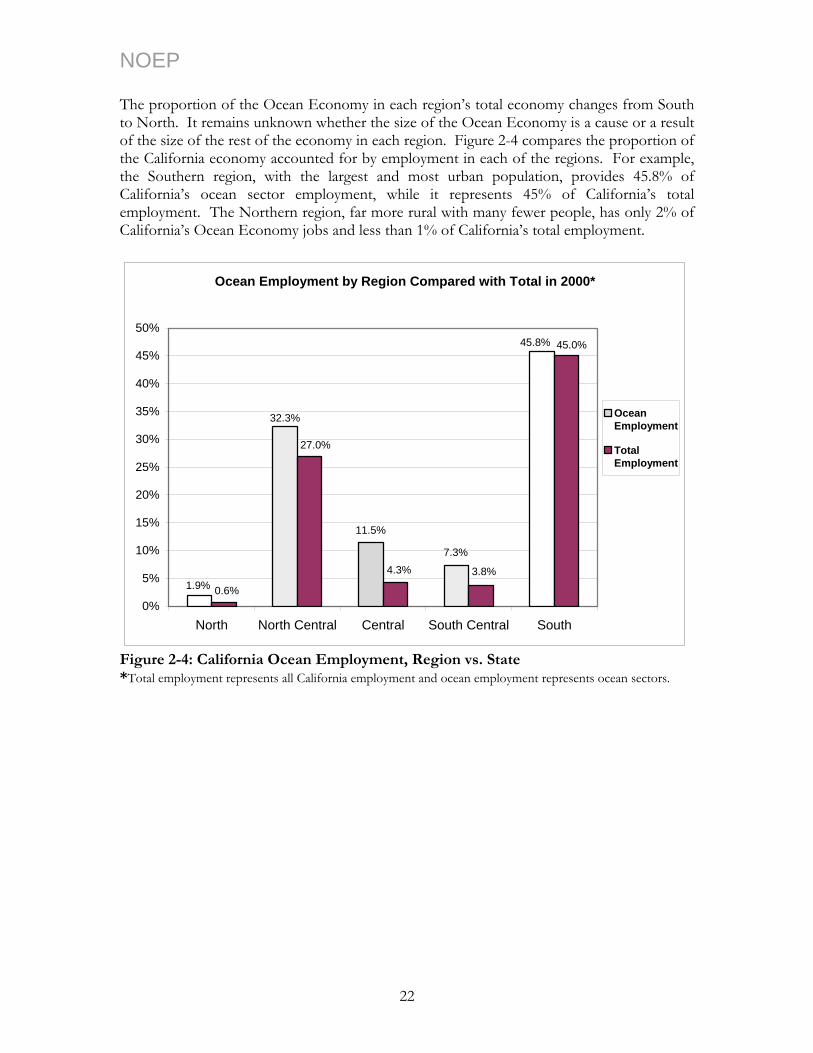
NOEP The proportion of the Ocean Economy in each region’s total economy changes from South to North. It remains unknown whether the size of the Ocean Economy is a cause or a result of the size of the rest of the economy in each region. Figure 2-4 compares the proportion of the California economy accounted for by employment in each of the regions. For example, the Southern region, with the largest and most urban population, provides 45.8% of California’s ocean sector employment, while it represents 45% of California’s total employment. The Northern region, far more rural with many fewer people, has only 2% of California’s Ocean Economy jobs and less than 1% of California’s total employment.
Ocean Employment by Region Compared with Total in 2000*
11.5%
1.9%
32.3%
45.8%
7.3%
0.6%
27.0%
4.3% 3.8%
45.0%
0%
5%
10%
15%
20%
25%
30%
35%
40%
45%
50%
North North Central Central South Central South
OceanEmployment
TotalEmployment
Figure 2-4: California Ocean Employment, Region vs. State *Total employment represents all California employment and ocean employment represents ocean sectors.
22
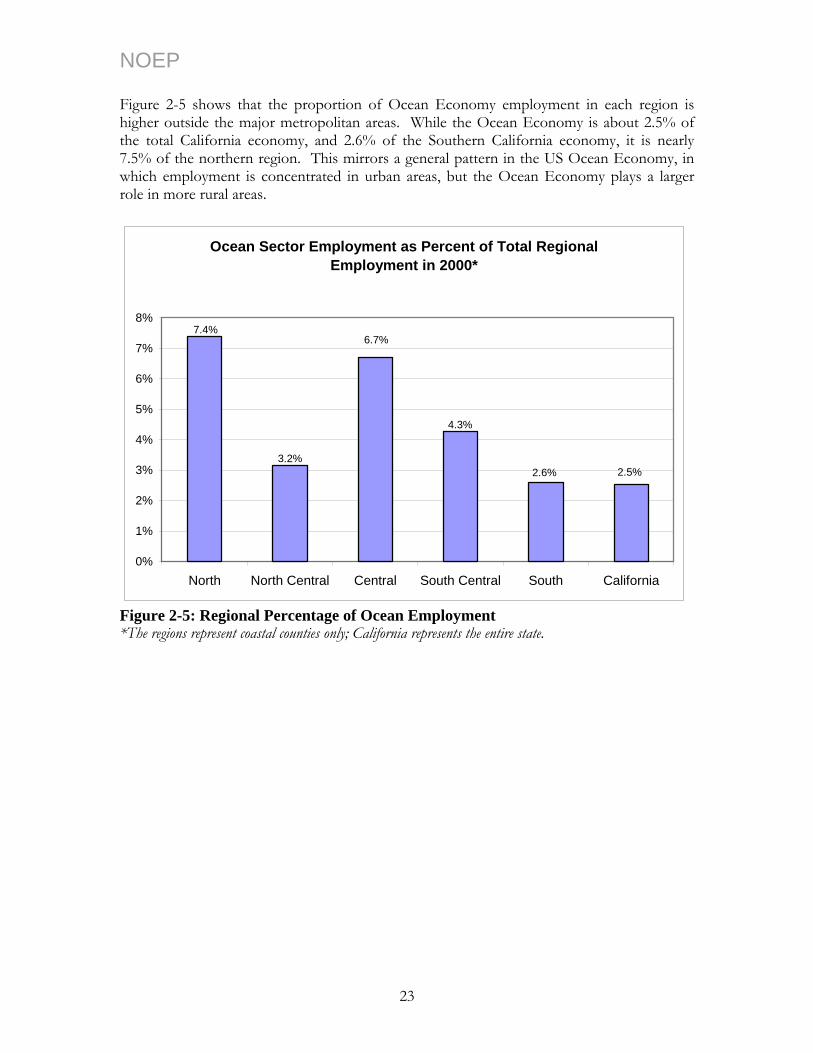
NOEP Figure 2-5 shows that the proportion of Ocean Economy employment in each region is higher outside the major metropolitan areas. While the Ocean Economy is about 2.5% of the total California economy, and 2.6% of the Southern California economy, it is nearly 7.5% of the northern region. This mirrors a general pattern in the US Ocean Economy, in which employment is concentrated in urban areas, but the Ocean Economy plays a larger role in more rural areas.
Ocean Sector Employment as Percent of Total Regional Employment in 2000*
4.3%
3.2%
7.4%
2.6% 2.5%
6.7%
0%
1%
2%
3%
4%
5%
6%
7%
8%
North North Central Central South Central South California
Figure 2-5: Regional Percentage of Ocean Employment *The regions represent coastal counties only; California represents the entire state.
23
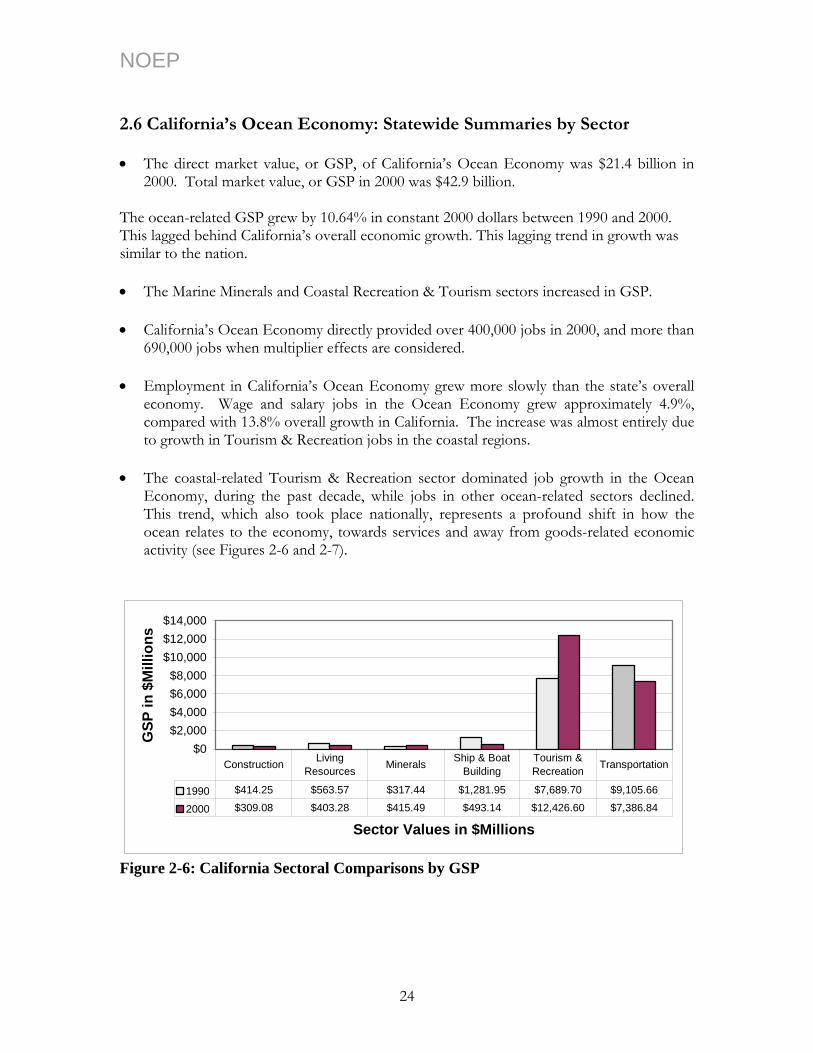
NOEP 2.6 California’s Ocean Economy: Statewide Summaries by Sector • The direct market value, or GSP, of California’s Ocean Economy was $21.4 billion in
2000. Total market value, or GSP in 2000 was $42.9 billion. The ocean-related GSP grew by 10.64% in constant 2000 dollars between 1990 and 2000. This lagged behind California’s overall economic growth. This lagging trend in growth was similar to the nation.
• The Marine Minerals and Coastal Recreation & Tourism sectors increased in GSP.
• California’s Ocean Economy directly provided over 400,000 jobs in 2000, and more than
690,000 jobs when multiplier effects are considered.
• Employment in California’s Ocean Economy grew more slowly than the state’s overall economy. Wage and salary jobs in the Ocean Economy grew approximately 4.9%, compared with 13.8% overall growth in California. The increase was almost entirely due to growth in Tourism & Recreation jobs in the coastal regions.
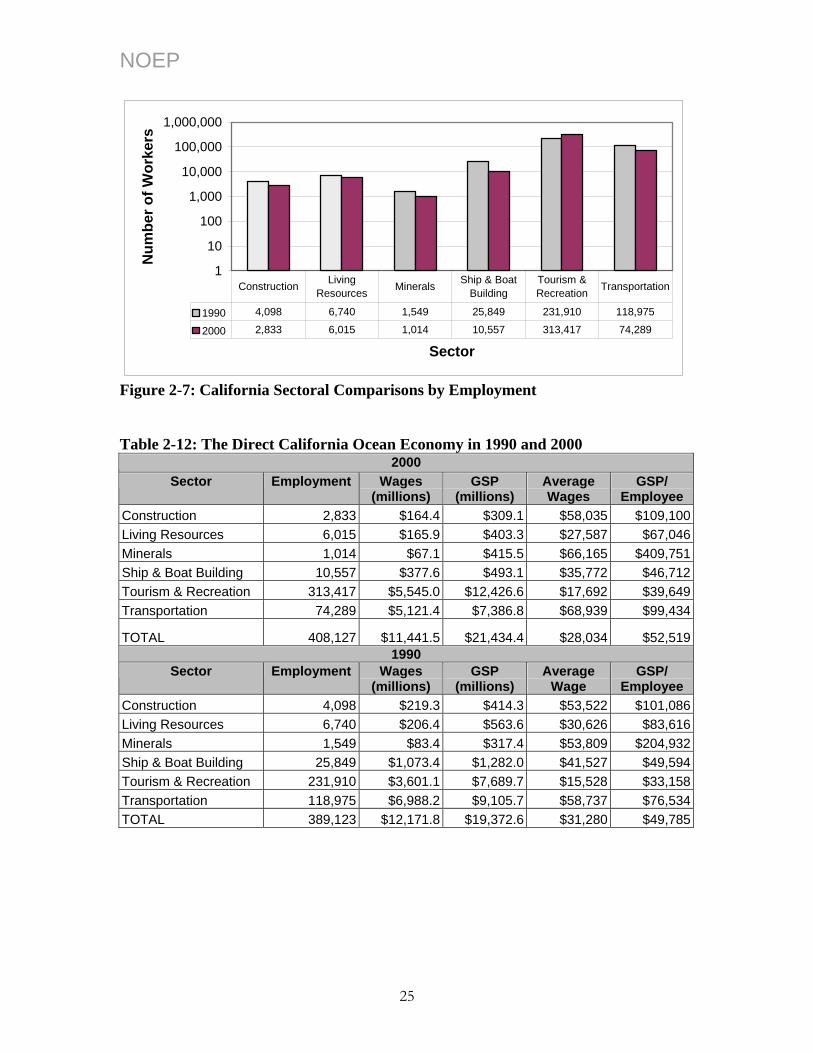
• The coastal-related Tourism & Recreation sector dominated job growth in the Ocean Economy, during the past decade, while jobs in other ocean-related sectors declined. This trend, which also took place nationally, represents a profound shift in how the ocean relates to the economy, towards services and away from goods-related economic activity (see Figures 2-6 and 2-7).
$0$2,000$4,000$6,000$8,000
$10,000$12,000$14,000
Sector Values in $Millions
GSP
in $
Mill
ions
1990 $414.25 $563.57 $317.44 $1,281.95 $7,689.70 $9,105.66
2000 $309.08 $403.28 $415.49 $493.14 $12,426.60 $7,386.84
Construction Living Resources Minerals Ship & Boat
BuildingTourism & Recreation Transportation
Figure 2-6: California Sectoral Comparisons by GSP
24
NOEP
1
10
100
1,000
10,000
100,000
1,000,000
Sector
Num
ber o
f Wor
kers
1990 4,098 6,740 1,549 25,849 231,910 118,975
2000 2,833 6,015 1,014 10,557 313,417 74,289
Construction Living Resources Minerals Ship & Boat
BuildingTourism & Recreation Transportation
Figure 2-7: California Sectoral Comparisons by Employment Table 2-12: The Direct California Ocean Economy in 1990 and 2000
2000 Sector Employment Wages
(millions) GSP
(millions) Average Wages
GSP/ Employee
Construction 2,833 $164.4 $309.1 $58,035 $109,100Living Resources 6,015 $165.9 $403.3 $27,587 $67,046Minerals 1,014 $67.1 $415.5 $66,165 $409,751Ship & Boat Building 10,557 $377.6 $493.1 $35,772 $46,712Tourism & Recreation 313,417 $5,545.0 $12,426.6 $17,692 $39,649Transportation 74,289 $5,121.4 $7,386.8 $68,939 $99,434
TOTAL 408,127 $11,441.5 $21,434.4 $28,034 $52,5191990
Sector Employment Wages (millions)
GSP (millions)
Average Wage
GSP/ Employee
Construction 4,098 $219.3 $414.3 $53,522 $101,086Living Resources 6,740 $206.4 $563.6 $30,626 $83,616Minerals 1,549 $83.4 $317.4 $53,809 $204,932Ship & Boat Building 25,849 $1,073.4 $1,282.0 $41,527 $49,594Tourism & Recreation 231,910 $3,601.1 $7,689.7 $15,528 $33,158Transportation 118,975 $6,988.2 $9,105.7 $58,737 $76,534TOTAL 389,123 $12,171.8 $19,372.6 $31,280 $49,785
25

NOEP The Tourism & Recreation sector accounted for the largest proportion of employment and GSP with 76.8% of the former and 58% of the latter (Figure 2-8). However, it represented the lowest average wages and GSP per employee. The Transportation sector is the second largest in terms of employment and GSP, accounting for 18.2% of employment, but almost a third of GSP. And, the Transportation sector as well as the Minerals sector represented much higher average wages and GSP per employee. The Tourism & Recreation sector pays significantly lower wages and has significantly lower GSP per employee than all other sectors. These other sectors are the reason that the California Ocean Economy pays higher wages than the average wage for the state economy. The implication here is that the slower growth sectors contribute significantly to the California economy through higher wages, making up a critical element of the economy. More detailed discussions of these sectors, and the industries they include, are found in Part II The Sectors of the California Ocean Economy.
Distribution of the California Ocean Economy in 2000
0.7% 1.5% 0.2%
18.2%
2.6%
76.8%
58.0%
34.5%
2.3%1.9%1.9%1.4%0%
10%
20%
30%
40%
50%
60%
70%
80%
Construction LivingResources
M inerals Ship & BoatBuilding
Tourism &Recreation
Transportation
Employment
Gross StateProduct
Figure 2-8: 2000 Distribution of the California Ocean Economy
26
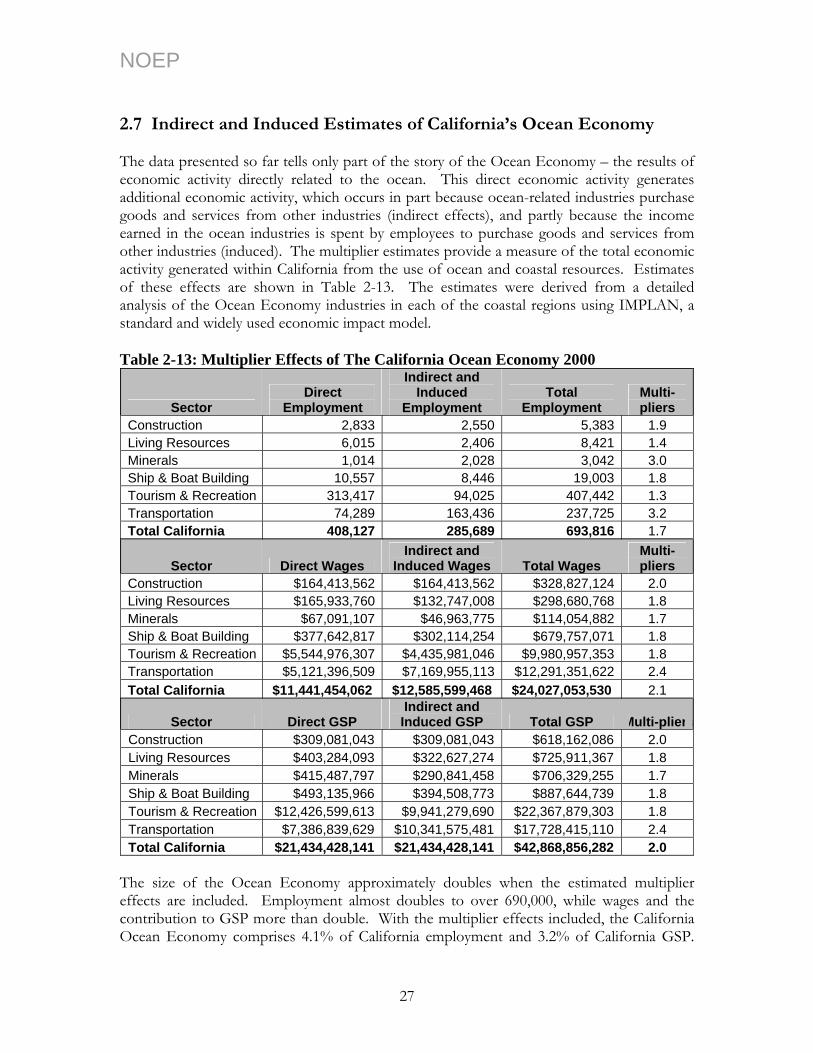
NOEP 2.7 Indirect and Induced Estimates of California’s Ocean Economy The data presented so far tells only part of the story of the Ocean Economy – the results of economic activity directly related to the ocean. This direct economic activity generates additional economic activity, which occurs in part because ocean-related industries purchase goods and services from other industries (indirect effects), and partly because the income earned in the ocean industries is spent by employees to purchase goods and services from other industries (induced). The multiplier estimates provide a measure of the total economic activity generated within California from the use of ocean and coastal resources. Estimates of these effects are shown in Table 2-13. The estimates were derived from a detailed analysis of the Ocean Economy industries in each of the coastal regions using IMPLAN, a standard and widely used economic impact model. Table 2-13: Multiplier Effects of The California Ocean Economy 2000
Sector Direct
Employment
Indirect and Induced
Employment Total
Employment Multi-pliers
Construction 2,833 2,550 5,383 1.9 Living Resources 6,015 2,406 8,421 1.4 Minerals 1,014 2,028 3,042 3.0 Ship & Boat Building 10,557 8,446 19,003 1.8 Tourism & Recreation 313,417 94,025 407,442 1.3 Transportation 74,289 163,436 237,725 3.2 Total California 408,127 285,689 693,816 1.7
Sector Direct Wages Indirect and
Induced Wages Total Wages Multi-pliers
Construction $164,413,562 $164,413,562 $328,827,124 2.0 Living Resources $165,933,760 $132,747,008 $298,680,768 1.8 Minerals $67,091,107 $46,963,775 $114,054,882 1.7 Ship & Boat Building $377,642,817 $302,114,254 $679,757,071 1.8 Tourism & Recreation $5,544,976,307 $4,435,981,046 $9,980,957,353 1.8 Transportation $5,121,396,509 $7,169,955,113 $12,291,351,622 2.4 Total California $11,441,454,062 $12,585,599,468 $24,027,053,530 2.1
Sector Direct GSP Indirect and Induced GSP Total GSP Multi-pliers
Construction $309,081,043 $309,081,043 $618,162,086 2.0 Living Resources $403,284,093 $322,627,274 $725,911,367 1.8 Minerals $415,487,797 $290,841,458 $706,329,255 1.7 Ship & Boat Building $493,135,966 $394,508,773 $887,644,739 1.8 Tourism & Recreation $12,426,599,613 $9,941,279,690 $22,367,879,303 1.8 Transportation $7,386,839,629 $10,341,575,481 $17,728,415,110 2.4 Total California $21,434,428,141 $21,434,428,141 $42,868,856,282 2.0
The size of the Ocean Economy approximately doubles when the estimated multiplier effects are included. Employment almost doubles to over 690,000, while wages and the contribution to GSP more than double. With the multiplier effects included, the California Ocean Economy comprises 4.1% of California employment and 3.2% of California GSP.
27

NOEP The Transportation sector has the largest employment, wage, and GSP multiplier effects, while the Minerals sector also has a substantial employment multiplier. 2.8 Changes in the California Ocean Economy 1990-2000 The California Ocean Economy underwent profound changes during the decade 1990- 2000. Table 2-14: Changes in the California Ocean Economy, 1990-2000 (Direct)
Employment Wages GSP Sector Change % Change Change
(millions) % Change Change
(millions) % Change
Construction -1,265 -30.9% -$54.9 -25.04% -$105.2 -25.39%Living Resources -725 -10.8% -$40.5 -19.61% -$160.3 -28.44%Minerals -535 -34.5% -$16.3 -19.51% $98.0 30.89%Ship & Boat Building -15,292 -59.2% -$695.8 -64.82% -$788.8 -61.53%Tourism & Recreation 81,507 35.2% $1,943.9 53.98% $4,736.9 61.60%Transportation -44,686 -37.6% -$1,866.8 -26.71% -$1,718.8 -18.88%All Ocean Sectors 19,004 4.9% -$730.4 -6.00% $2,061.9 10.64% Only the Tourism & Recreation sector exhibited growth in employment, wages, and GSP as shown in Figure 2-9. Every other sector in the Ocean Economy declined in employment and real wages, and all except Minerals declined in direct GSP. This is a significant change toward services-oriented uses and away from goods-related uses related to the ocean.
California Ocean Sector Changes 1990-2000
-37.56%
4.88%
-64.82%
-6.00%
-28.44%
30.89%
61.60%
10.64%
35.15%
-34.54%-30.87%
-10.76%
-59.16%
53.98%
-25.04% -19.61%
-19.51%-26.71%-25.39%
-61.53%
-18.88%
-80%
-60%
-40%
-20%
0%
20%
40%
60%
80%
Construction Living Resources Minerals Ship & BoatBuilding
Tourism &Recreation
Transportation All OceanSectors
Ocean Sector
Employ-mentWages
GSP
Figure 2-9: Changes in California’s Ocean Economy by Sector, 1990-2000 Possible reasons for these changes follow:
28
NOEP • Construction trends in marine related Heavy Construction are very difficult to measure,
in part because the industry is not measured well in the SIC system, and in part because the industry is highly cyclical and dependent, in particular on government spending for activities such as dredging, pier construction, etc. The declines shown were driven largely by changes in government spending over the decade, but detail on this spending is insufficient to measure accurately what activities have most changed.
• Living Resources declines are entirely related to declines in Fish Harvesting, which are
explained in more detail in Part II. • Minerals (mostly oil and gas) declined in employment and wages, but grew in GSP,
reflecting two trends. First, the industry itself became more efficient, requiring fewer workers for output. Second, the real value of the oil increased. A 1989 federal moratorium on leasing additional offshore lands in California, combined with mostly older wells in place, could account for the decrease in oil and gas production volume.16
• Ship and Boat Building had the largest decline of all the ocean sectors on all three
measures, GSP, employment, and wages. The decline is probably related to the end of the Cold War in 1990, and the peak in the Reagan era of seven-years of ship building expansion for the Navy, followed by the steady decline. This pattern occurred in all states where significant shipbuilding took place, and so California’s experience reflected this national trend. In addition, “part of this decline could be due to the reduction in offshore minerals leasing over this period and the reduction in exploration and production activity. Offshore service/supply vessels, for example, were built in the San Diego shipyards, as were other service vessels and some production facilities”.17
• Transportation exhibited the largest change in the Search and Navigation Equipment
industry, which makes equipment for both military and civilian uses. This industry is the “high tech” segment of the Ocean Economy, in which California has been a national leader. The industry lost nearly 60,000 jobs, more than half of those employed, from 1990 to 2000, reflecting almost entirely the same military spending trends that resulted in the declines in the Ship & Boat Building sector. Also, the Deep-sea Freight Transportation industry lost approximately 40% of its employment (nearly 1,800 jobs)
16 Paul Kelly, Sr. Vice-President, Rowan Companies, Communiqué 2004. “Another trend reflected in the decline in employment is the departure of pioneering companies from California once their base of operations in the State was impacted by offshore leasing moratoria. Longstanding State moratoria prohibiting new leasing and local opposition to federal leasing was expanded in 1989 with the first of Presidentially imposed new leasing moratoria. With their California bases of operations dealt this… blow to possible future work, most of these companies left the State [Orange and Ventura counties] for other… locations on the Texas and Louisiana Gulf Coast. Such companies included Santa Fe International (contract drilling and construction) to Dallas, Global Marine Drilling (contract drilling) to Houston, Varco International (technologically advanced drilling equipment) to Houston, Smith International (oilfield tubulars and equipment) to Houston, Oceaneering International (diving, underwater specialists and robotics) to Houston…. Also, earlier, in the 1980's, Armco Steel closed a plant in Southern California that manufactured pipe for petroleum operations. In addition, news stories in the Houston newspapers would indicate that California-based production companies such as UNOCAL and Chevron (now ChevronTexaco) have gradually been relocating jobs from California to Texas and Louisiana. In l989, the National Ocean Industries Association determined in an informal survey that approximately 37,000 jobs had been moved out of California as the result of these relocations.” 17 Paul Kelly, Communiqué 2004.
29
NOEP
despite large growth in the volume of cargo handled at California’s ports. This job loss reflected the industry’s increasing mechanization.
• Tourism & Recreation increased markedly over the decade consistent with national and
local trends. California’s beaches are among the most popular in the world. 2.9 References
US Department of Labor, Bureau of Labor Statistics. Quarterly Census of Employment and Wages. Moeller, R, and J Fitz 1994. “An Economic Assessment of Ocean-Dependent Activities.” California Research
Bureau. Sacramento. The Resource Agency. March 1997. California’s Ocean Resources: An Agenda for the Future. Sacramento.
Available from Ocean Resources Management Program or on-line <http://resources.ca.gov/ocean/97Agenda/html_index.html>.
Economy.com. The World Economy in Real Time. <http://www.economy.com/default.asp>.
Accessed 2004 December. The National Ocean Economics Program. <http://www.OceanEconomics.org>. Accessed 2004
December.
30
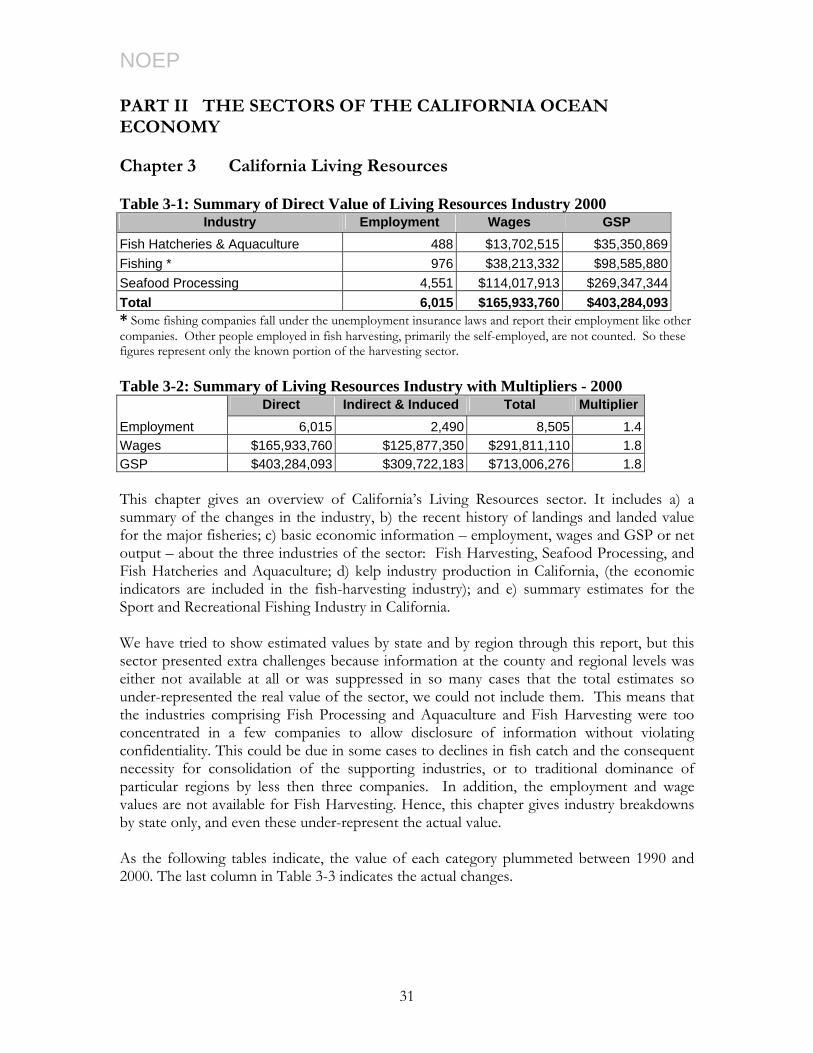
NOEP
PART II THE SECTORS OF THE CALIFORNIA OCEAN ECONOMY Chapter 3 California Living Resources Table 3-1: Summary of Direct Value of Living Resources Industry 2000
Industry Employment Wages GSP Fish Hatcheries & Aquaculture 488 $13,702,515 $35,350,869Fishing * 976 $38,213,332 $98,585,880Seafood Processing 4,551 $114,017,913 $269,347,344Total 6,015 $165,933,760 $403,284,093* Some fishing companies fall under the unemployment insurance laws and report their employment like other companies. Other people employed in fish harvesting, primarily the self-employed, are not counted. So these figures represent only the known portion of the harvesting sector. Table 3-2: Summary of Living Resources Industry with Multipliers - 2000 Direct Indirect & Induced Total Multiplier Employment 6,015 2,490 8,505 1.4 Wages $165,933,760 $125,877,350 $291,811,110 1.8 GSP $403,284,093 $309,722,183 $713,006,276 1.8 This chapter gives an overview of California’s Living Resources sector. It includes a) a summary of the changes in the industry, b) the recent history of landings and landed value for the major fisheries; c) basic economic information – employment, wages and GSP or net output – about the three industries of the sector: Fish Harvesting, Seafood Processing, and Fish Hatcheries and Aquaculture; d) kelp industry production in California, (the economic indicators are included in the fish-harvesting industry); and e) summary estimates for the Sport and Recreational Fishing Industry in California. We have tried to show estimated values by state and by region through this report, but this sector presented extra challenges because information at the county and regional levels was either not available at all or was suppressed in so many cases that the total estimates so under-represented the real value of the sector, we could not include them. This means that the industries comprising Fish Processing and Aquaculture and Fish Harvesting were too concentrated in a few companies to allow disclosure of information without violating confidentiality. This could be due in some cases to declines in fish catch and the consequent necessity for consolidation of the supporting industries, or to traditional dominance of particular regions by less then three companies. In addition, the employment and wage values are not available for Fish Harvesting. Hence, this chapter gives industry breakdowns by state only, and even these under-represent the actual value. As the following tables indicate, the value of each category plummeted between 1990 and 2000. The last column in Table 3-3 indicates the actual changes.
31

NOEP Table 3-3: Direct Changes in California Living Resources 1990-2000
Employment Wages GSP Industry 1990 Change
in 2000 1990 Change in
2000 1990 Change in
2000 Fish Hatcheries & Aquaculture 567 -79 $13,142,047 $560,468 $38,460,509 -$3,109,640Fishing * 1,498 -522 $61,452,930 -$23,239,598 $179,843,437 -$81,257,557Seafood Processing 4,674 -123 $131,824,548 -$17,806,635 $345,268,974 -$75,921,630Total 6,740 -725 $206,419,526 -$40,485,766 $563,572,921 -$160,288,828* Represents only the known portion of the harvesting sector.
Changes in California Living Resources 1990-2000
-13.9%
4.3%
-8.1%
-22.0%
-28.4%
-34.9%
-2.6%
-10.8%
-37.8%
-13.5%
-19.6%
-45.2%-50%
-40%
-30%
-20%
-10%
0%
10%
Fish Hatcheries &Aquaculture
Fish Harvesting SeafoodProcessing
Total
Industry
Employ-mentWages
GSP
Figure 3-1: Changes in Living Resources Sector from 1990 to 2000 The demand for seafood in the US is large. Consumption of seafood is about 15.6 pounds per capita annually, which represents about $26.7 billion in revenue. Due to a higher degree of health-consciousness and the large portion of Asian immigrants in the state18, the per capita demand for seafood in California is thought to be even larger than the national average. This has both national and international implications for California’s economy, since a portion of California’s fisheries is exported to foreign nations, and because the national and California markets are growing. The more California can effectively manage its fisheries for optimal sustainable productivity, the greater the opportunity for foreign trade as well as serving local and national markets. Of all the California Ocean Economy sectors, Living Resources is possibly the least understood and most controversial. The Living Resources sector data suffers from large disclosure issues, and much uncertainty and presents a challenge to indicate its value. Several variables make this sector difficult to 18 See <http://www.epa.gov/r10earth/offices/oea/risk/a&pi.pdf>.
32
NOEP assess: a) Landings and landed values have been unstable in the past and continue to be due to large declines in the catch of particular species; b) absence of mandated standardized employment and wage reporting for fish harvesting, preventing accurate accounting of the real value of fish harvesting to the state. Much of the fishing industry is considered “self-employed” and does not fall under the federal mandates for reporting wages and numbers of employees, as is the case in all other sectors with wages paid by companies. Hence, those “self-employed” vessels fall outside the reported data requirements. Only those fishing operations that report as regular private companies can be included in our dataset from the Federal Government. Hence, reporting wages, employment, and GSP for the entire Living Resources sector, when it is aggregated, and for the fish harvesting part of the sector, when that is reported separately, is under-reported. There is no way to accurately know how many fishermen there are in California nor how much they earn. The only amount that can be estimated is that amount of money that the owner of the boat receives for the catch at the dock, because legally, that must be reported by the buyer of the catch. This lack of standard reporting has several implications, not the least of which is that there can be no benchmark for regulators to determine the extent to which regulations or limits will impact the economy of the fishermen. Only state aggregated estimates for the value of the Living Resources sector can be found in this chapter. Regional estimates have been left out. The evident domination of the Fish Processing and the Hatcheries and Aquaculture industries by only a few companies per region have resulted in the suppression of data at county and regional levels. This industry concentration may reflect the steep decline in catch over the past decades, or they could be the result of traditionally family-owned enterprises who captured the market long ago and have remained successful. In either case, we cannot report the numbers by region. When compared with the larger Ocean Economy sectors in California such as Tourism & Transportation, the Living Resources market sector is relatively small. However, as a source of food and employment, the commercial fishing industry is very important to California’s coastal economy. Many activities are dependent on this industry, such as boat construction and repair, brokerage, dock handling, trucking and other transportation, gear and rigging stores, fish processing, and commercial seafood trade. In addition, the health of California’s fisheries is integrally related to the health of California’s coastal waters, reflecting the strength of offshore ecosystems. The size of the catch and its contribution to California’s economy is only a part of its value. These other values are not captured in the market place, but have far reaching effects on the sustainability of California’s coastal resources, which fuels its flourishing coastal economy. The long-term sustainability of California’s fisheries has additional values, or future values, because fisheries are a renewable resource that, if well-managed, could sustain a viable industry for years to come. Poor management of California’s fisheries would be an opportunity lost, taking a major source of revenue and food from the citizens of California, costing Californians in future earnings and revenues. While all Ocean Economy sectors but Tourism & Recreation declined during the decade 1990-2000, the Living Resources sector sustained the deepest cuts in relative terms. The real losses are not calculable from the market values published in this chapter. The additional values mentioned above need to be considered as well.
33
NOEP 3.1 Overview of Activities: Fisheries Landings and Values The US fishing industry has undergone massive changes during the past 25 years, but overall, landings have remained relatively steady at about 10 billion pounds a year and GSP at about $3.5 billion annually. In 1991 and 1994, the total US landings reached a peak, with more than 10 billion pounds in total landings each year (Figure 3-2). However, the overall national appearance is deceptive. Some states have increased their take with new species and others have seen their fisheries almost collapse. In California, the fisheries landings have shown the largest decline throughout the last 25 years, with the largest dip in the most recent years, showing a decrease from billions to millions in a 20-year time frame. Each of the five regions in California showed a decrease in landings, with an increase in value. This was not true for the Central Coast, which showed an increase in both landings and value. The Central Coast includes Monterey County, Santa Cruz County, and San Mateo County. In California, there is also concern about other competitive uses of the land and water, other than for fisheries. As tourism continues to grow, it needs space, sometimes out-competing fisheries for limited dock and shoreline space. These changes have had major impacts on California’s economy (Figure 3-2). Although we usually use 2000 as our latest benchmark, we have included figures representing the years after 2000 because these numbers were readily available and told an even more complete story. Figure 3-3 reflects some of these losses. • Between 1982 and 1999, California’s fishing fleet declined by an estimated 4000 vessels,
from approximately 6700 to 2700 boats. • In 1976, California’s fleet landed a peak of 1.3 billion pounds of fish and invertebrates,
compared to landings of 650 million pounds in 2000. • In 1980, the California fleet, at a peak since 1970, brought in more than $300 million in
landed value, compared to $142 million in 2000 and $91 million in 2002 (NMFS) (See Figure 3-3). California’s share of the US total commercial landings fell from approximately 19% in 1970 to about 7.1% of the US total, and 3.9% of total landed value in 2000 (See Figure 3-4).
• 1970 to 1990, total finfish and shellfish landings in California declined by more than half,
while total US landings almost doubled. California experienced a dramatic drop in landings of tuna, ground fish, urchin, shark, swordfish, salmon, and abalone.19
19 (NMFS site and www.OceanEconomics.org, which uses the data from that site)
34
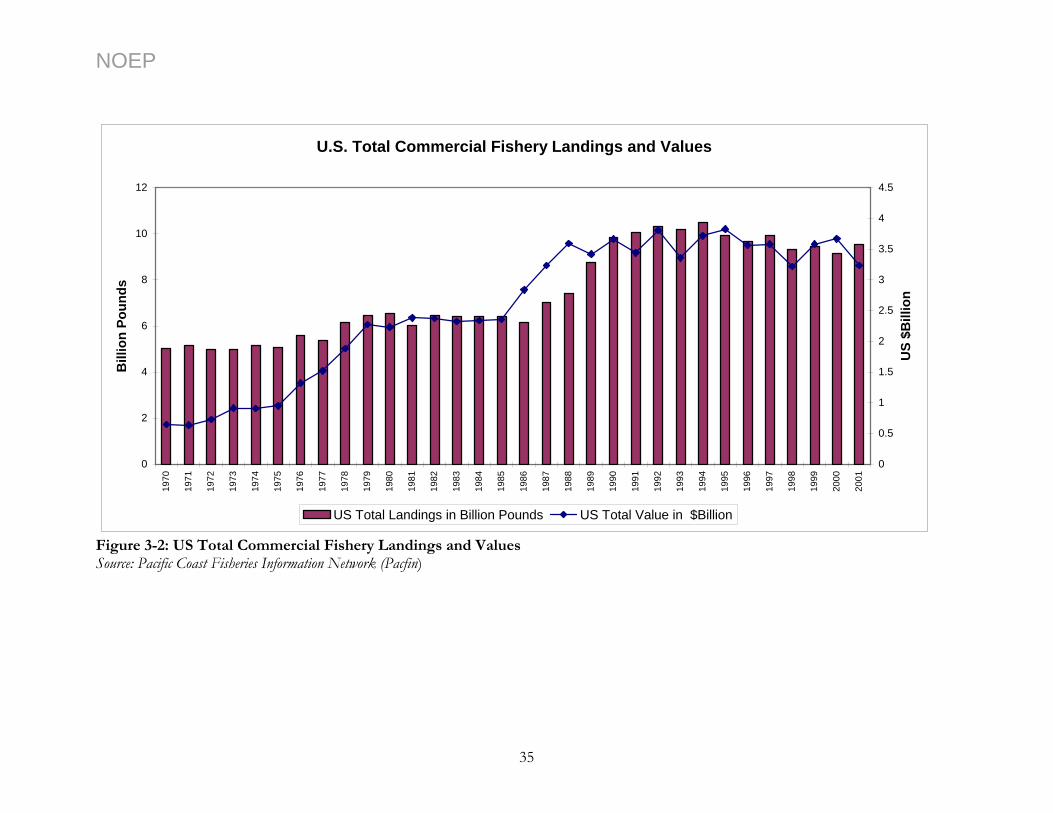
NOEP
U.S. Total Commercial Fishery Landings and Values
0
2
4
6
8
10
12
1970
1971
1972
1973
1974
1975
1976
1977
1978
1979
1980
1981
1982
1983
1984
1985
1986
1987
1988
1989
1990
1991
1992
1993
1994
1995
1996
1997
1998
1999
2000
2001
Bill
ion
Poun
ds
0
0.5
1
1.5
2
2.5
3
3.5
4
4.5
US
$Bill
ion
US Total Landings in Billion Pounds US Total Value in $Billion
Figure 3-2: US Total Commercial Fishery Landings and Values Source: Pacific Coast Fisheries Information Network (Pacfin)
35
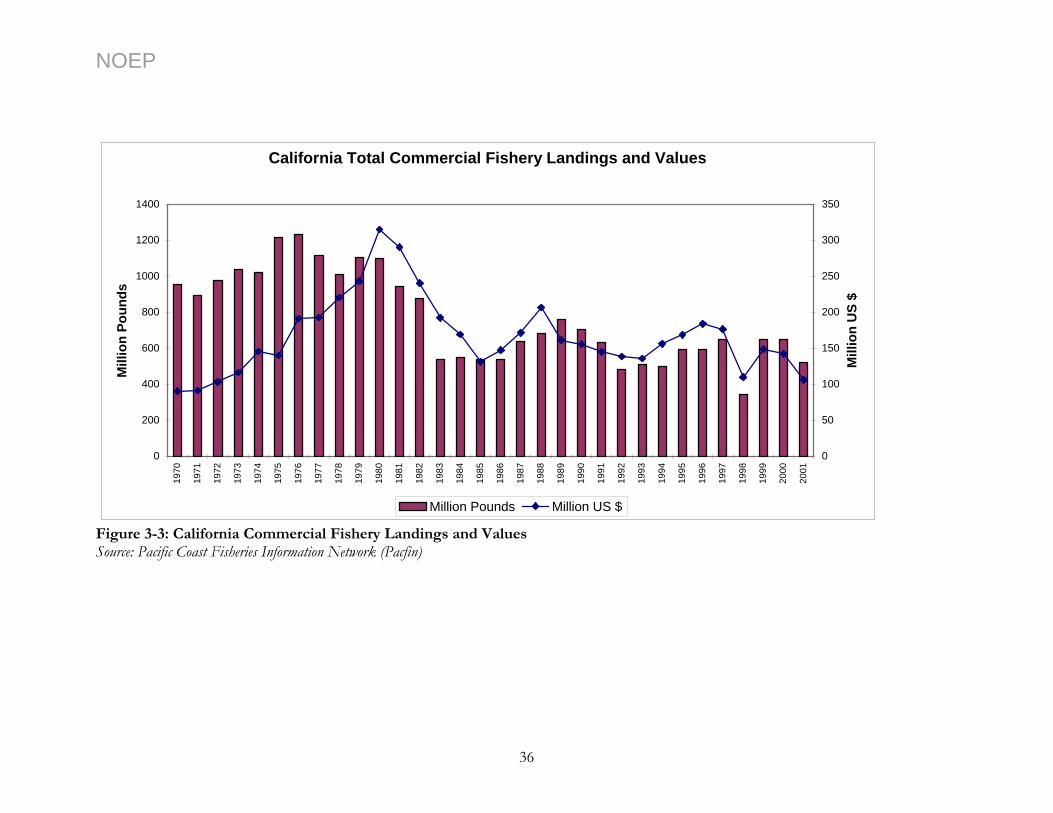
NOEP
California Total Commercial Fishery Landings and Values
0
200
400
600
800
1000
1200
1400
1970
1971
1972
1973
1974
1975
1976
1977
1978
1979
1980
1981
1982
1983
1984
1985
1986
1987
1988
1989
1990
1991
1992
1993
1994
1995
1996
1997
1998
1999
2000
2001
Mill
ion
Poun
ds
0
50
100
150
200
250
300
350
Mill
ion
US
$
Million Pounds Million US $
Figure 3-3: California Commercial Fishery Landings and Values Source: Pacific Coast Fisheries Information Network (Pacfin)
36
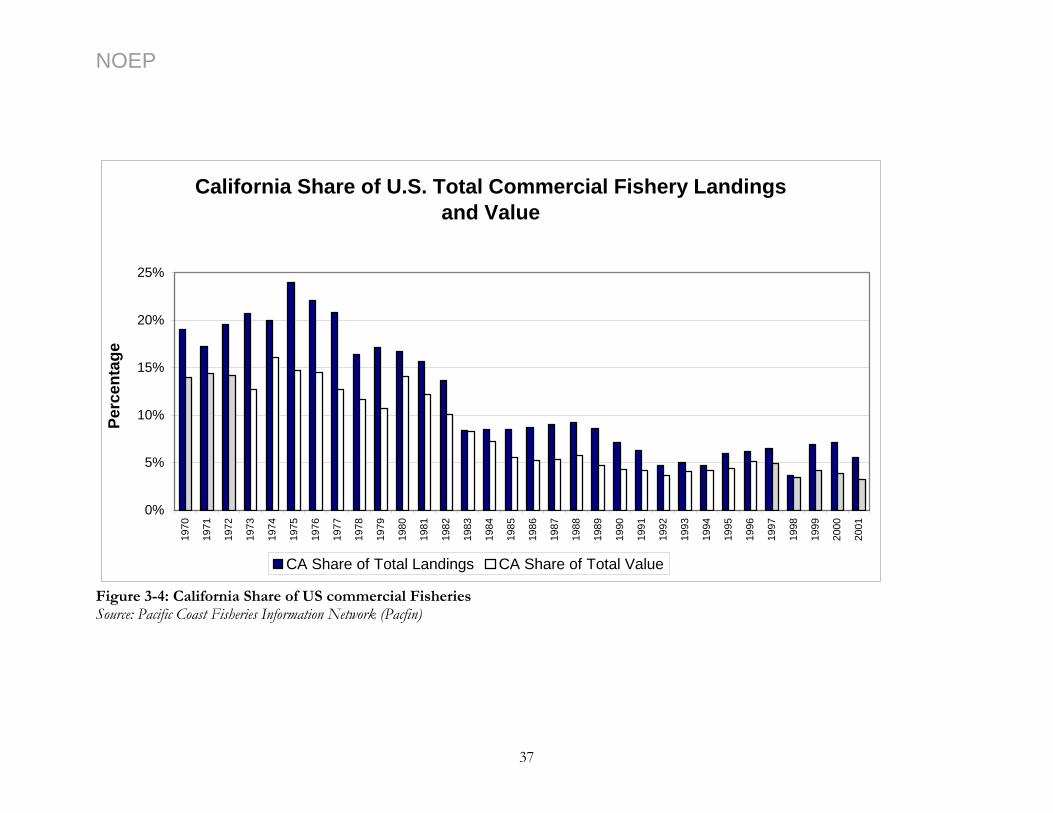
NOEP
California Share of U.S. Total Commercial Fishery Landings and Value
0%
5%
10%
15%
20%
25%
1970
1971
1972
1973
1974
1975
1976
1977
1978
1979
1980
1981
1982
1983
1984
1985
1986
1987
1988
1989
1990
1991
1992
1993
1994
1995
1996
1997
1998
1999
2000
2001
Perc
enta
ge
CA Share of Total Landings CA Share of Total Value
Figure 3-4: California Share of US commercial Fisheries Source: Pacific Coast Fisheries Information Network (Pacfin)
37
NOEP
3.1.1 Influences on California’s Fishing Industry According to California Living Marine Resources: A Status Report by the Department of Fish and Game (2001), the state’s marine resources and its management have undergone continuous changes in part because of changes in the economics of fisheries and partly because of the need to restrict fishing effort in order to manage commercial fishery populations. The decline in tuna landings was primarily a result of the shift of landing ports from California to less costly cannery operations in Samoa and Puerto Rico. Because of severe decreases in abalone stock and concerns about the extinction of the white abalone, the total commercial fishing of abalone was closed south of San Francisco. Ground fish production was disrupted by seasonal area closures, quota reduction, and long-term stock-building plans. Salmon fishing has raised public concerns since five California salmon populations have been listed under the federal Endangered Species Act (ESA). Additional regulations also played an important role in the development of California’s commercial fishing industry. For example, rockfish and Cabezon were considered lucrative, and a major fishery dedicated to those near-shore species was established during the 1990s. According to the Department of Fish and Game, in 1994, California Constitutional Amendment (Prop. 132) prohibited fishing by gillnet in the near-shore areas of central and southern California. The 1998 Marine Life Management Act (MLMA), led to additional suspension of permits in the near-shore fishery, and a squid management plan is in place, which involves restrictions of access. The 1999 Marine Life Protection Act authorizes new protections for ocean habitats and wildlife. It also will create a new network of marine protected areas along the coast, setting aside zones in some cases, where preservation of certain species will be undertaken to revive some of the more depleted stocks. Outside the industry, competing uses of waterfront for recreational boating, commercial cargo handling, and tourism, have confronted the California commercial fishing industry, and could limit the availability of shore-side space for support facilities. Despite the decline of landings for certain species in California, some other species have exhibited growth patterns, and have become the targets of fishery expansion. For example, according to the California Department of Fish and Game, increased international demand for squid resulted in a dramatic increase in landings during non-El Nino years, which has attracted participation from former salmon fishermen in California. Growth of California fisheries also included the development of specialized fisheries for sea urchin, Pacific herring, and rockfish. However, restrictions on rockfish are now affecting these efforts. 3.1.2 Landings and Values by Species Today, California’s fishing industry no longer depends on tuna fisheries; other species have gained importance. Squid and red sea urchin were the top two revenue-generating species in 2002. The revenue from market squid reached 16.5 million tons in 2002. Along with Squid, Chinook salmon, Pacific sardine, and Albacore entered into the top ten commercial species
38
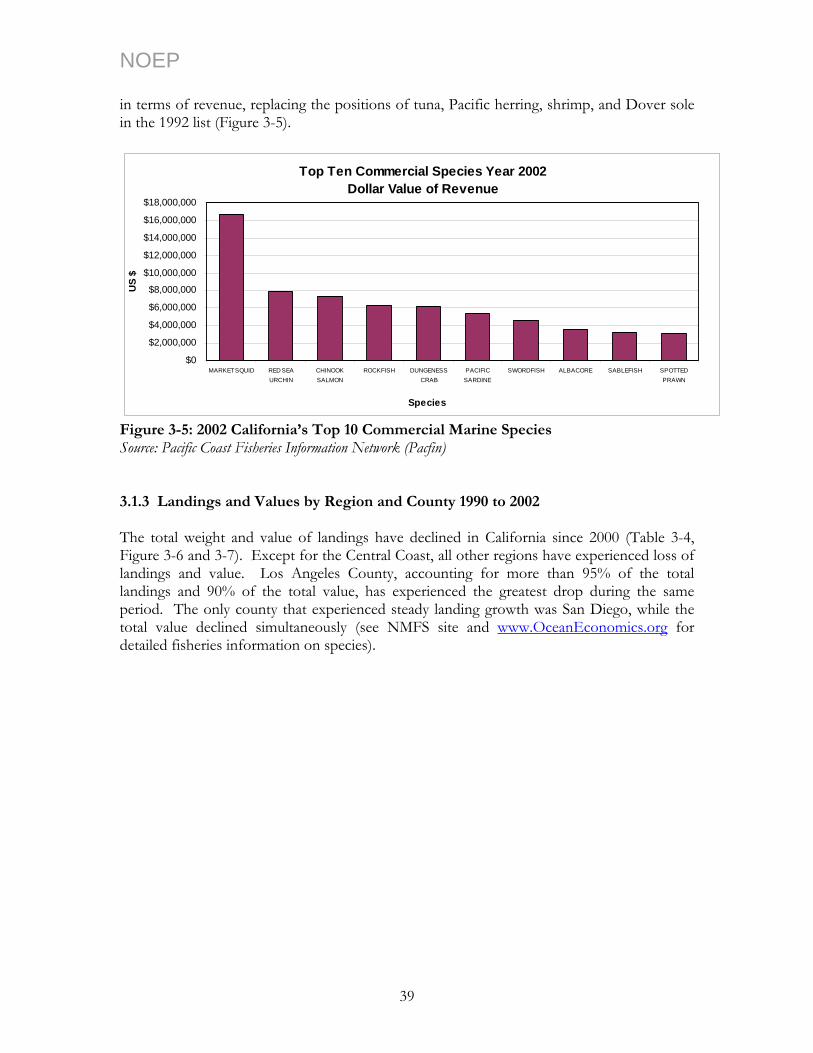
NOEP in terms of revenue, replacing the positions of tuna, Pacific herring, shrimp, and Dover sole in the 1992 list (Figure 3-5).
Top Ten Commercial Species Year 2002 Dollar Value of Re
$18,000,000venue
$16,000,000
Species
$12,000,000
$14,000,000
$0
$2,000,000
$4,000,000
$6,000,000
$8,000,000
$10,000,000
MARKET SQUID RED SEAURCHIN
CHINOOKSALMON
ROCKFISH DUNGENESSCRAB
PACIFICSARDINE
SWORDFISH ALBACORE SABLEFISH SPOTTEDPRAWN
US
$
Figure 3-5: 2002 California’s Top 10 Commercial Marine Species Source: Pacific Coast Fisheries Information Network (Pacfin) 3.1.3 Landings and Values by Region and County 1990 to 2002 The total weight and value of landings have declined in California since 2000 (Table 3-4, Figure 3-6 and 3-7). Except for the Central Coast, all other regions have experienced loss of landings and value. Los Angeles County, accounting for more than 95% of the total landings and 90% of the total value, has experienced the greatest drop during the same period. The only county that experienced steady landing growth was San Diego, while the total value declined simultaneously (see NMFS site and www.OceanEconomics.org for detailed fisheries information on species).
39

NOEP Table 3-4: Regional Landings and Values 2000-2002
. 2000 2001 2002
Region Weight of landings (lb)
Landed Value ($)
Weight of landings (lb)
Landed Value ($)
Weight of landings (lb)
Landed Value ($)
North Coast 27,711,244 27,057,783 22,080,412 18,908,402 21,904,644 18,227,627Del Norte 8,114,071 9,779,518 6,533,578 5,856,040 4,496,855 4,430,281 Humboldt 10,102,830 8,410,836 7,209,487 5,690,285 7,853,514 6,380,523 Mendocino 9,494,343 8,867,429 8,337,347 7,362,084 9,554,275 7,146,823 North Central 15,278,570 13,137,260 12,239,073 11,501,424 12,792,633 11,543,997Alameda 46,594 108,747 79,576 158,831 162,075 235,909 Contra Costa 10,737 27,564 6,747 19,394 13,138 33,038 Marin 1,919,644 1,672,380 2,986,961 2,137,359 364,236 629,607 San Francisco 10,204,780 7,313,606 6,491,229 5,889,007 8,751,549 6,625,709 Santa Clara 388,429 226,042 647,204 219,922 649,801 133,040 Solano 6,444 14,908 Sonoma 2,708,386 3,788,921 2,027,356 3,076,911 2,845,390 3,871,741 Central Coast 65,054,096 14,809,023 66,674,419 12,041,962 99,208,364 16,571,474Monterey 61,339,436 9,813,590 63,450,017 8,260,265 94,186,314 12,450,017San Mateo 3,029,606 3,925,871 2,885,194 3,256,384 4,651,711 3,609,970 Santa Cruz 685,054 1,069,562 339,208 525,313 370,339 553,173 South Central Coast 174,848,867 33,230,847 113,480,611 22,341,361 60,231,135 19,225,417San Luis Obispo 3,661,918 5,718,773 3,469,567 4,604,807 2,848,307 3,773,916 Santa Barbara 7,005,508 6,728,900 5,263,908 5,382,993 5,658,833 6,125,507 Ventura 164,231,441 20,783,174 104,747,136 12,353,561 51,723,995 9,325,994 South Coast 257,328,091 47,170,193 221,378,721 37,309,889 167,451,195 25,937,566Los Angeles 254,044,639 39,316,639 217,999,578 29,979,777 163,951,419 19,445,966Orange 548,667 1,774,456 556,041 1,694,446 529,351 1,646,180 San Diego 2,734,785 6,078,956 2,823,102 5,635,666 2,970,425 4,845,180 All Coastal Counties 540,220,868 135,405,106 435,853,236 102,103,038 361,587,971 91,506,081
40
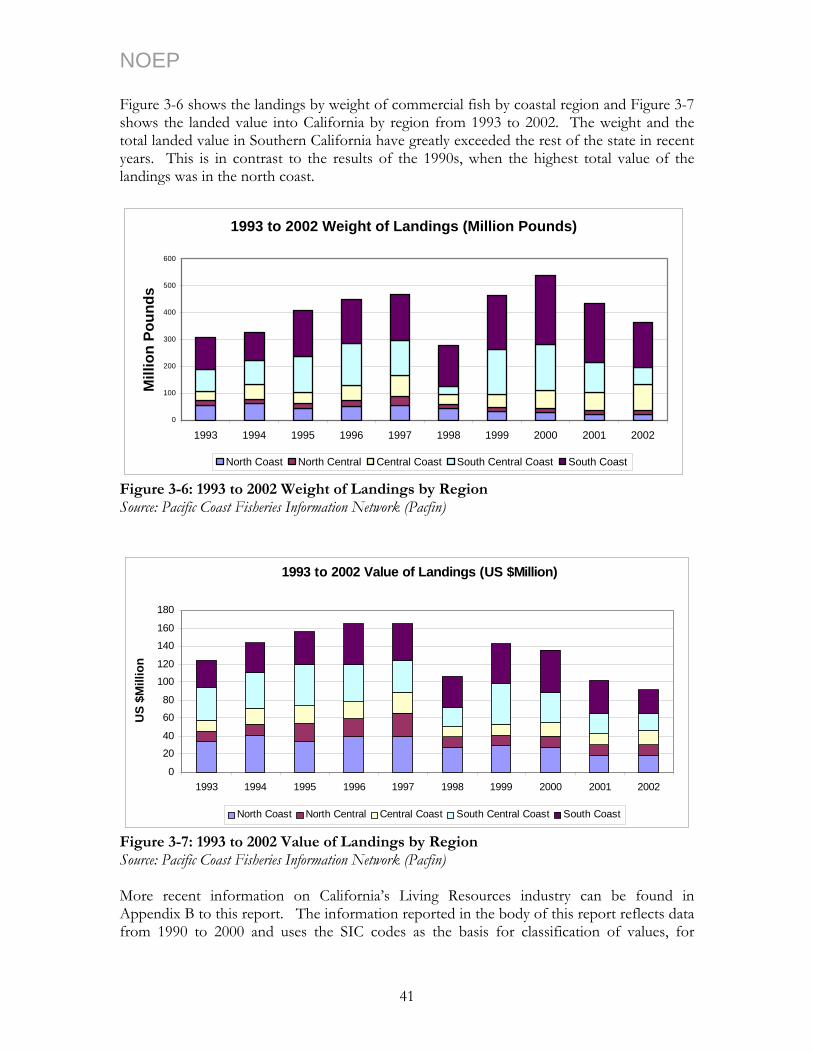
NOEP Figure 3-6 shows the landings by weight of commercial fish by coastal region and Figure 3-7 shows the landed value into California by region from 1993 to 2002. The weight and the total landed value in Southern California have greatly exceeded the rest of the state in recent years. This is in contrast to the results of the 1990s, when the highest total value of the landings was in the north coast.
1993 to 2002 Weight of Landings (Million Pounds)
0
100
200
300
400
500
600
1993 1994 1995 1996 1997 1998 1999 2000 2001 2002
Mill
ion
Poun
ds
North Coast North Central Central Coast South Central Coast South Coast
Figure 3-6: 1993 to 2002 Weight of Landings by Region Source: Pacific Coast Fisheries Information Network (Pacfin)
1993 to 2002 Value of Landings (US $Million)
0
20
40
60
80
100
120
140
160
180
1993 1994 1995 1996 1997 1998 1999 2000 2001 2002
US
$Mill
ion
North Coast North Central Central Coast South Central Coast South Coast
Figure 3-7: 1993 to 2002 Value of Landings by Region Source: Pacific Coast Fisheries Information Network (Pacfin) More recent information on California’s Living Resources industry can be found in Appendix B to this report. The information reported in the body of this report reflects data from 1990 to 2000 and uses the SIC codes as the basis for classification of values, for
41
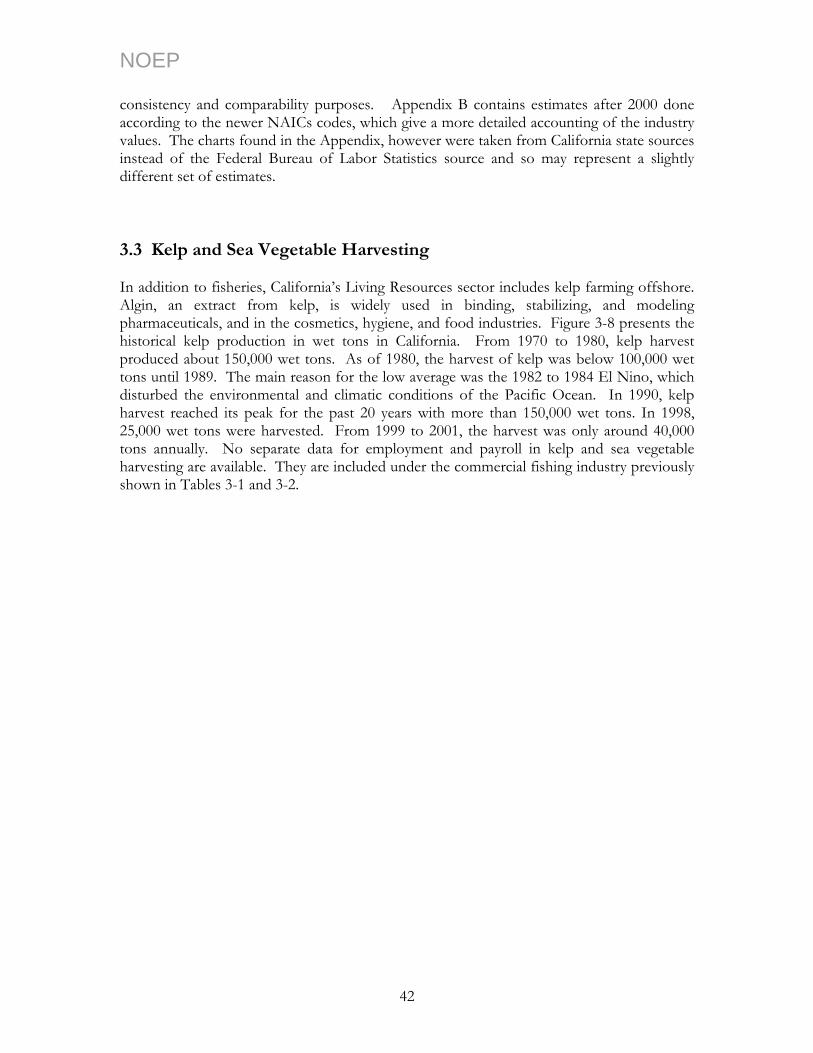
NOEP consistency and comparability purposes. Appendix B contains estimates after 2000 done according to the newer NAICs codes, which give a more detailed accounting of the industry values. The charts found in the Appendix, however were taken from California state sources instead of the Federal Bureau of Labor Statistics source and so may represent a slightly different set of estimates. 3.3 Kelp and Sea Vegetable Harvesting In addition to fisheries, California’s Living Resources sector includes kelp farming offshore. Algin, an extract from kelp, is widely used in binding, stabilizing, and modeling pharmaceuticals, and in the cosmetics, hygiene, and food industries. Figure 3-8 presents the historical kelp production in wet tons in California. From 1970 to 1980, kelp harvest produced about 150,000 wet tons. As of 1980, the harvest of kelp was below 100,000 wet tons until 1989. The main reason for the low average was the 1982 to 1984 El Nino, which disturbed the environmental and climatic conditions of the Pacific Ocean. In 1990, kelp harvest reached its peak for the past 20 years with more than 150,000 wet tons. In 1998, 25,000 wet tons were harvested. From 1999 to 2001, the harvest was only around 40,000 tons annually. No separate data for employment and payroll in kelp and sea vegetable harvesting are available. They are included under the commercial fishing industry previously shown in Tables 3-1 and 3-2.
42
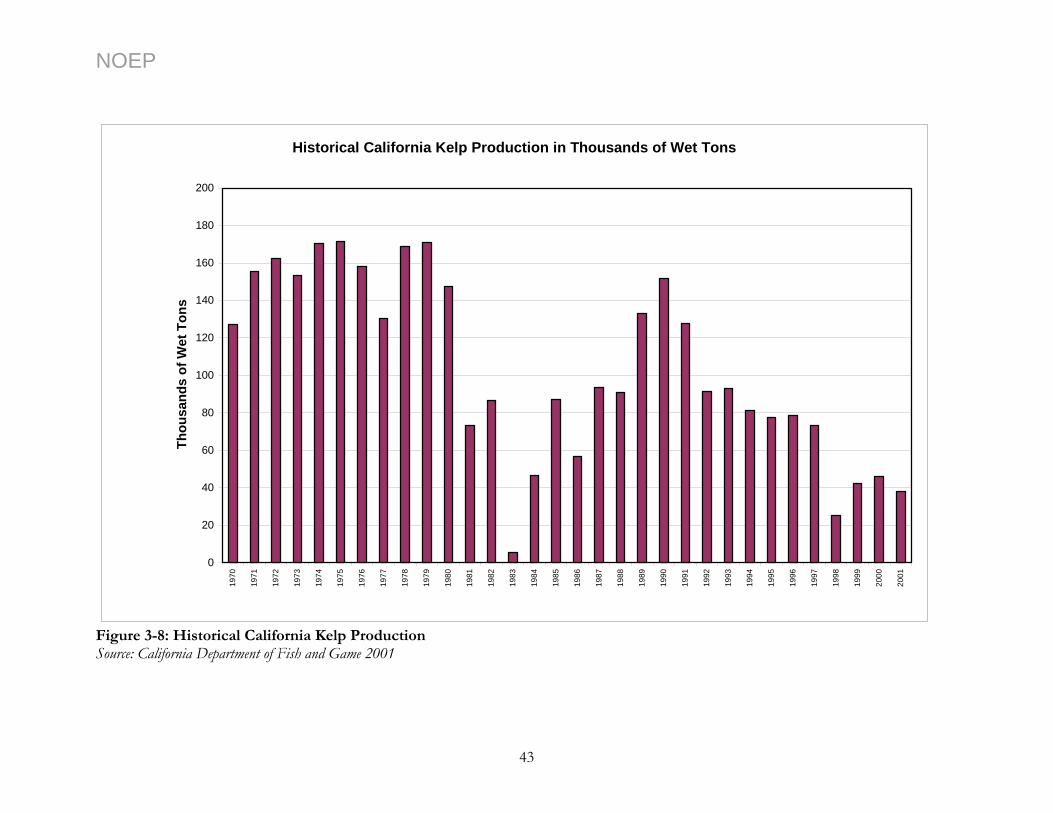
NOEP
Historical California Kelp Production in Thousands of Wet Tons
0
20
40
60
80
100
120
140
160
180
200
1970
1971
1972
1973
1974
1975
1976
1977
1978
1979
1980
1981
1982
1983
1984
1985
1986
1987
1988
1989
1990
1991
1992
1993
1994
1995
1996
1997
1998
1999
2000
2001
Tho
usan
ds o
f Wet
Ton
s
Figure 3-8: Historical California Kelp Production Source: California Department of Fish and Game 2001
43
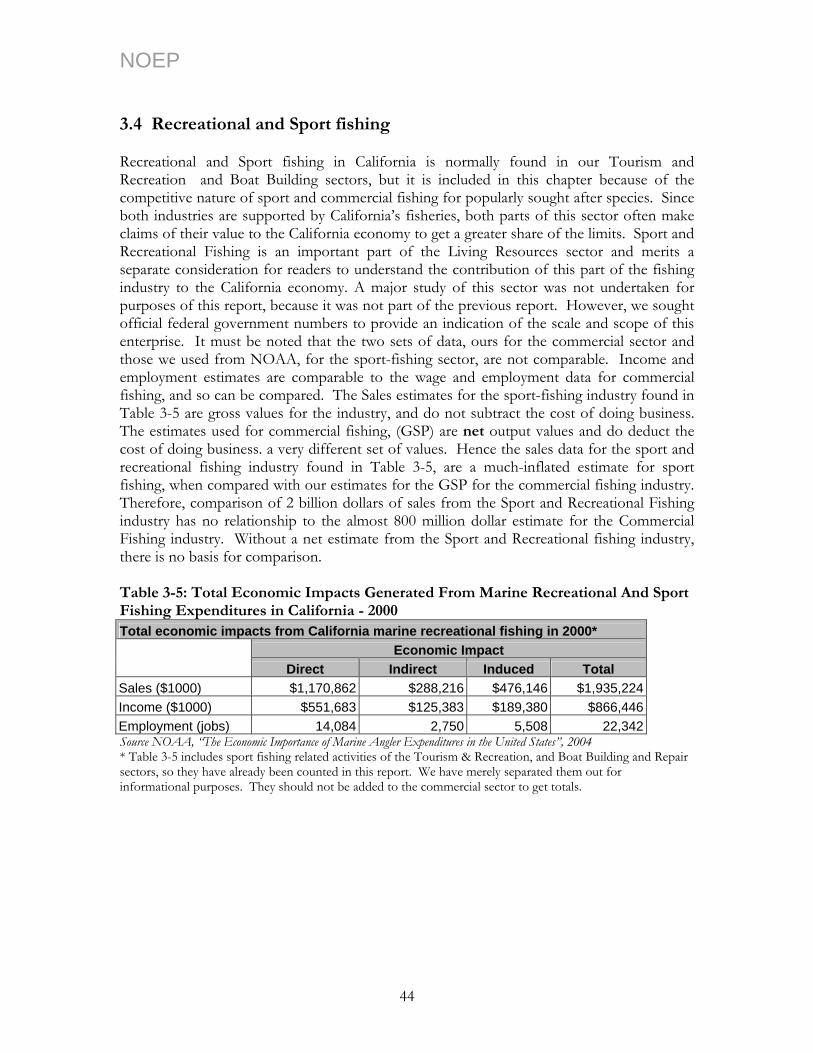
NOEP 3.4 Recreational and Sport fishing Recreational and Sport fishing in California is normally found in our Tourism and Recreation and Boat Building sectors, but it is included in this chapter because of the competitive nature of sport and commercial fishing for popularly sought after species. Since both industries are supported by California’s fisheries, both parts of this sector often make claims of their value to the California economy to get a greater share of the limits. Sport and Recreational Fishing is an important part of the Living Resources sector and merits a separate consideration for readers to understand the contribution of this part of the fishing industry to the California economy. A major study of this sector was not undertaken for purposes of this report, because it was not part of the previous report. However, we sought official federal government numbers to provide an indication of the scale and scope of this enterprise. It must be noted that the two sets of data, ours for the commercial sector and those we used from NOAA, for the sport-fishing sector, are not comparable. Income and employment estimates are comparable to the wage and employment data for commercial fishing, and so can be compared. The Sales estimates for the sport-fishing industry found in Table 3-5 are gross values for the industry, and do not subtract the cost of doing business. The estimates used for commercial fishing, (GSP) are net output values and do deduct the cost of doing business. a very different set of values. Hence the sales data for the sport and recreational fishing industry found in Table 3-5, are a much-inflated estimate for sport fishing, when compared with our estimates for the GSP for the commercial fishing industry. Therefore, comparison of 2 billion dollars of sales from the Sport and Recreational Fishing industry has no relationship to the almost 800 million dollar estimate for the Commercial Fishing industry. Without a net estimate from the Sport and Recreational fishing industry, there is no basis for comparison. Table 3-5: Total Economic Impacts Generated From Marine Recreational And Sport Fishing Expenditures in California - 2000 Total economic impacts from California marine recreational fishing in 2000*
Economic Impact Direct Indirect Induced Total Sales ($1000) $1,170,862 $288,216 $476,146 $1,935,224 Income ($1000) $551,683 $125,383 $189,380 $866,446 Employment (jobs) 14,084 2,750 5,508 22,342 Source NOAA, “The Economic Importance of Marine Angler Expenditures in the United States”, 2004 * Table 3-5 includes sport fishing related activities of the Tourism & Recreation, and Boat Building and Repair sectors, so they have already been counted in this report. We have merely separated them out for informational purposes. They should not be added to the commercial sector to get totals.
44

NOEP 3.4 Conclusion Living Resources contribute to the California economy through a range of activities. Commercial Fish Harvesting, including Kelp, Seafood Processing, Fish Hatcheries and Aquaculture, and Sport and Recreational Fishing represent a major source of revenue to the California economy. Fish Harvesting has suffered major declines over the past several decades. While there is not the evidence to indicate the loss in number of fishermen, nor in wages, the steep decline in catch, limitations on fishing, and loss of species has probably affected both the social and economic fabric of the coastal towns traditionally dependent on fishing. Estimates of the real value of the commercial sector are incomplete and under-estimated because of the lack of fishermen employment and wage data, and will not be able to become part of the record until the government requires regular and standard reporting of such information from the fishing industry. With escalating demand for fish throughout the world, California has much to gain from improving its circumstances. Future losses from mismanagement of this renewable resource have not been estimated here, because only reported market values have been considered. However, incalculable losses from over fishing and depletion of stocks have already occurred and will continue to occur into the future until California’s fisheries have recovered. As of 2000, the fishing industry directly contributed a little more than $400 million to the California economy. That compares with a contribution of more than $560 million in 1990. The differences in landings is even more striking. Between 1980 and 2000, landings dropped from a value of $300 million to $142 million. 3.5 References
Moeller R, Fitz J. 1994. An Economic Assessment of Ocean-Dependent Activities. California Research Bureau. Sacramento. National Marine Fisheries Service. Available at <http://www.nmfs.noaa.gov/>. The National Ocean Economics Program. <http://www.oceaneconomics.org>. Accessed 2004 December. Pacific Coast Fisheries Information Network. Available at <http://www.psmfc.org/pacfin/>. Pacific Fishery Management Council. Available at <http://www.pcouncil.org/>. The Resources Agency, California Department of Fish and Game. December 2001. California Living Marine Resources: A Status Report.
45

NOEP
46

NOEP Chapter 4 California Ocean Minerals Table 4-1: Summary of Ocean Minerals with Multipliers in 2000
Indicator Direct Indirect & Induced Total Multiplier
Employment 1,014 2,052 3,066 3.0 Wages $67,091,107 $46,963,775 $114,054,882 1.7 GSP $415,487,797 $290,841,458 $706,329,255 1.7 Includes Limestone Sand & Gravel, Oil & Gas Exploration and Production, and Oil & Gas Exploration Services industries. Table 4-2: Direct Changes in Ocean Minerals Sector 1990-2000 Employment Wages GSP
1990 Change
in 2000 1990 Change in
2000 1990 Change in
2000 Total Minerals * 1,549 -535 $83,350,066 -$16,258,959 $317,439,215 $98,048,582* Separate industries are not shown due to data suppressions in 2000
Changes in California Minerals 1990-2000
-34.5% -19.5%
30.9%
-40%-30%-20%-10%
0%10%20%30%40%
Employment Wages GSP
Figure 4-1: Changes in Ocean Minerals Industries from 1990 to 2000 4.1 Marine Minerals The Offshore Ocean Minerals sector primarily includes oil and gas production from offshore and onshore wells that tap pools of oil and gas that extend under the ocean out to three miles, over which California has direct jurisdiction and thus derives state revenues. The NOEP has estimated the contribution of this industry to California, but has not estimated the revenues from Federal Outer Continental Shelf (OCS) lands, which lie beyond three miles, since those revenues go to federal coffers. However, the NOEP has included federal activities in our employment, wage and GSP data that generate revenue inside of California. Since this offshore part of the industry is found in four counties in California: Orange, Los Angeles, Ventura and Santa Barbara, most of the revenue generated from these activities come from the South Central and Southern part of the state. Also included in the
47
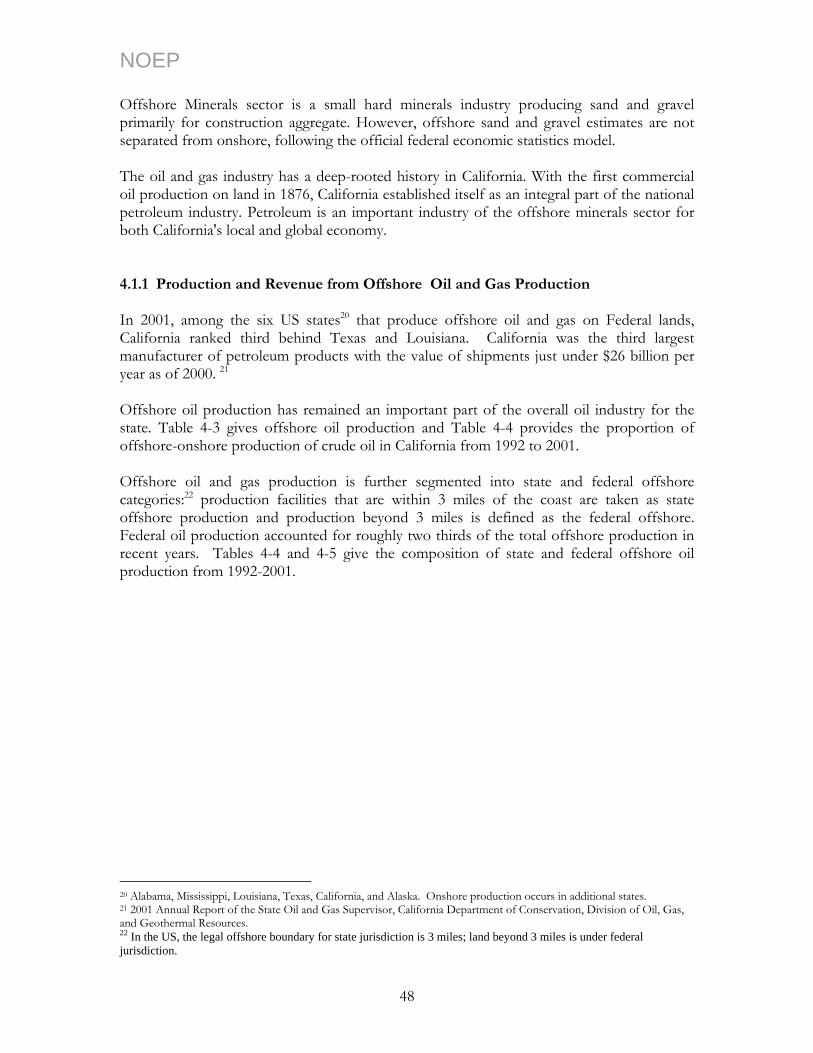
NOEP Offshore Minerals sector is a small hard minerals industry producing sand and gravel primarily for construction aggregate. However, offshore sand and gravel estimates are not separated from onshore, following the official federal economic statistics model. The oil and gas industry has a deep-rooted history in California. With the first commercial oil production on land in 1876, California established itself as an integral part of the national petroleum industry. Petroleum is an important industry of the offshore minerals sector for both California's local and global economy. 4.1.1 Production and Revenue from Offshore Oil and Gas Production In 2001, among the six US states20 that produce offshore oil and gas on Federal lands, California ranked third behind Texas and Louisiana. California was the third largest manufacturer of petroleum products with the value of shipments just under $26 billion per year as of 2000. 21
Offshore oil production has remained an important part of the overall oil industry for the state. Table 4-3 gives offshore oil production and Table 4-4 provides the proportion of offshore-onshore production of crude oil in California from 1992 to 2001. Offshore oil and gas production is further segmented into state and federal offshore categories:22 production facilities that are within 3 miles of the coast are taken as state offshore production and production beyond 3 miles is defined as the federal offshore. Federal oil production accounted for roughly two thirds of the total offshore production in recent years. Tables 4-4 and 4-5 give the composition of state and federal offshore oil production from 1992-2001.
20 Alabama, Mississippi, Louisiana, Texas, California, and Alaska. Onshore production occurs in additional states. 21 2001 Annual Report of the State Oil and Gas Supervisor, California Department of Conservation, Division of Oil, Gas, and Geothermal Resources. 22 In the US, the legal offshore boundary for state jurisdiction is 3 miles; land beyond 3 miles is under federal jurisdiction.
48
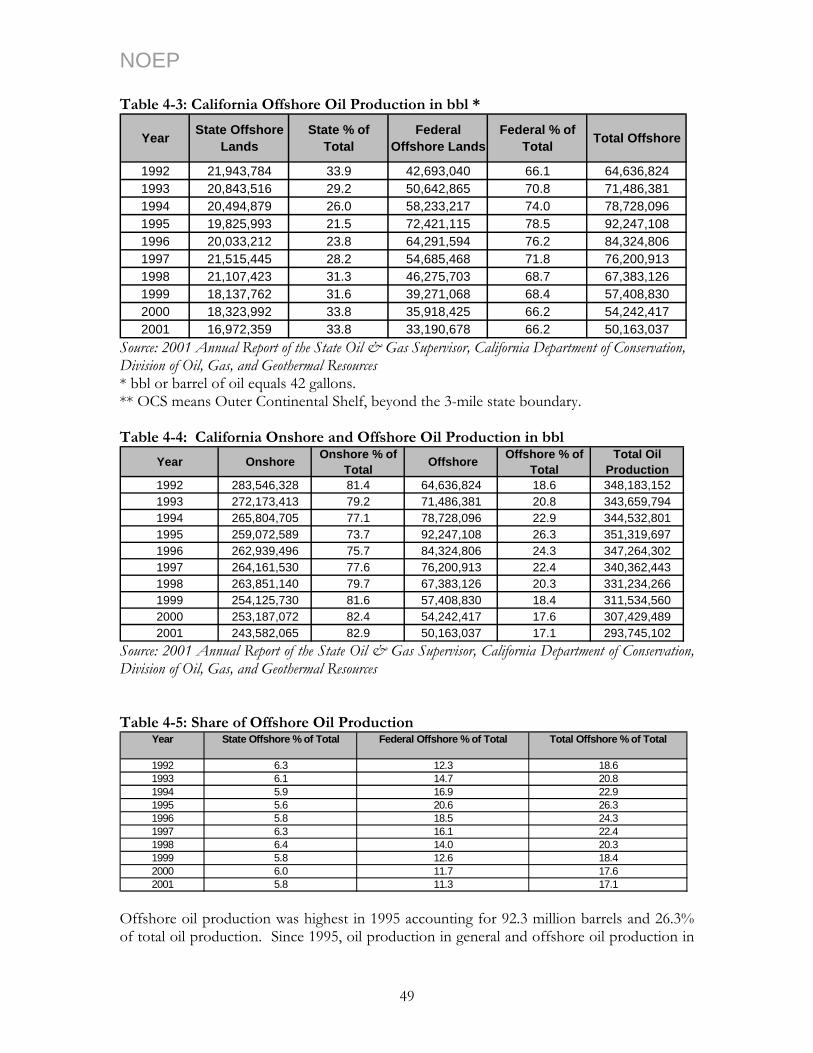
NOEP Table 4-3: California Offshore Oil Production in bbl *
Year State Offshore Lands
State % of Total
Federal Offshore Lands
Federal % of Total Total Offshore
1992 21,943,784 33.9 42,693,040 66.1 64,636,8241993 20,843,516 29.2 50,642,865 70.8 71,486,3811994 20,494,879 26.0 58,233,217 74.0 78,728,0961995 19,825,993 21.5 72,421,115 78.5 92,247,1081996 20,033,212 23.8 64,291,594 76.2 84,324,8061997 21,515,445 28.2 54,685,468 71.8 76,200,9131998 21,107,423 31.3 46,275,703 68.7 67,383,1261999 18,137,762 31.6 39,271,068 68.4 57,408,8302000 18,323,992 33.8 35,918,425 66.2 54,242,4172001 16,972,359 33.8 33,190,678 66.2 50,163,037
Source: 2001 Annual Report of the State Oil & Gas Supervisor, California Department of Conservation, Division of Oil, Gas, and Geothermal Resources * bbl or barrel of oil equals 42 gallons. ** OCS means Outer Continental Shelf, beyond the 3-mile state boundary. Table 4-4: California Onshore and Offshore Oil Production in bbl
Year Onshore Onshore % of Total Offshore Offshore % of
Total Total Oil
Production1992 283,546,328 81.4 64,636,824 18.6 348,183,1521993 272,173,413 79.2 71,486,381 20.8 343,659,7941994 265,804,705 77.1 78,728,096 22.9 344,532,8011995 259,072,589 73.7 92,247,108 26.3 351,319,6971996 262,939,496 75.7 84,324,806 24.3 347,264,3021997 264,161,530 77.6 76,200,913 22.4 340,362,4431998 263,851,140 79.7 67,383,126 20.3 331,234,2661999 254,125,730 81.6 57,408,830 18.4 311,534,5602000 253,187,072 82.4 54,242,417 17.6 307,429,4892001 243,582,065 82.9 50,163,037 17.1 293,745,102
Source: 2001 Annual Report of the State Oil & Gas Supervisor, California Department of Conservation, Division of Oil, Gas, and Geothermal Resources Table 4-5: Share of Offshore Oil Production
Year State Offshore % of Total Federal Offshore % of Total Total Offshore % of Total
1992 6.3 12.3 18.61993 6.1 14.7 20.81994 5.9 16.9 22.91995 5.6 20.6 26.31996 5.8 18.5 24.31997 6.3 16.1 22.41998 6.4 14.0 20.31999 5.8 12.6 18.42000 6.0 11.7 17.62001 5.8 11.3 17.1
Offshore oil production was highest in 1995 accounting for 92.3 million barrels and 26.3% of total oil production. Since 1995, oil production in general and offshore oil production in
49
NOEP particular, has declined steadily. The offshore oil production on state and federal leases dropped 7.5%, a decline from 54.2 million barrels produced in 2000 to 50.2 million barrels. In 2001, offshore production accounted for 17.1% of the total state oil production. In 2000, California, with 23 million registered automobiles, only produced one-half of the crude oil that it consumed; the other half was imported from other states or countries. 4.1.2 Geographic Location of Offshore Production There are eleven sedimentary basins along the coast of California with favorable geologic structures for accumulation of oil and gas deposits. These basins are the Southern California Shelf; the San Diego Offshore Area; the Los Angeles Basin; the Santa Barbara-Ventura Basin; the Santa Maria, the Salinas, the Santa Cruz, the Bodega, the Point Arena, and the Eel River Basin; and Bear-Mattole Offshore Area. Of these eleven basins, only the Los Angeles, Santa Barbara-Ventura, and Santa Maria basins have been commercially exploited up to now. Table 4-6 gives onshore and offshore oil production for all coastal counties of California in 2001. All of the coastal counties produced 30.9 million barrels of onshore oil and 17.0 million barrels of offshore oil. Offshore oil production is confined to Ventura, Santa Barbara, Los Angeles, and Orange counties. This production represents only state-owned lands. Los Angeles County alone accounts for approximately 50 percent of total onshore oil production of coastal counties and approximately 75 percent of the total offshore oil production for California. While Ventura County is a major onshore oil producer, its offshore oil production is only about 2 percent of California’s offshore oil production. For further analysis only Santa Barbara, Ventura, Los Angeles, and Orange counties will be examined.
50
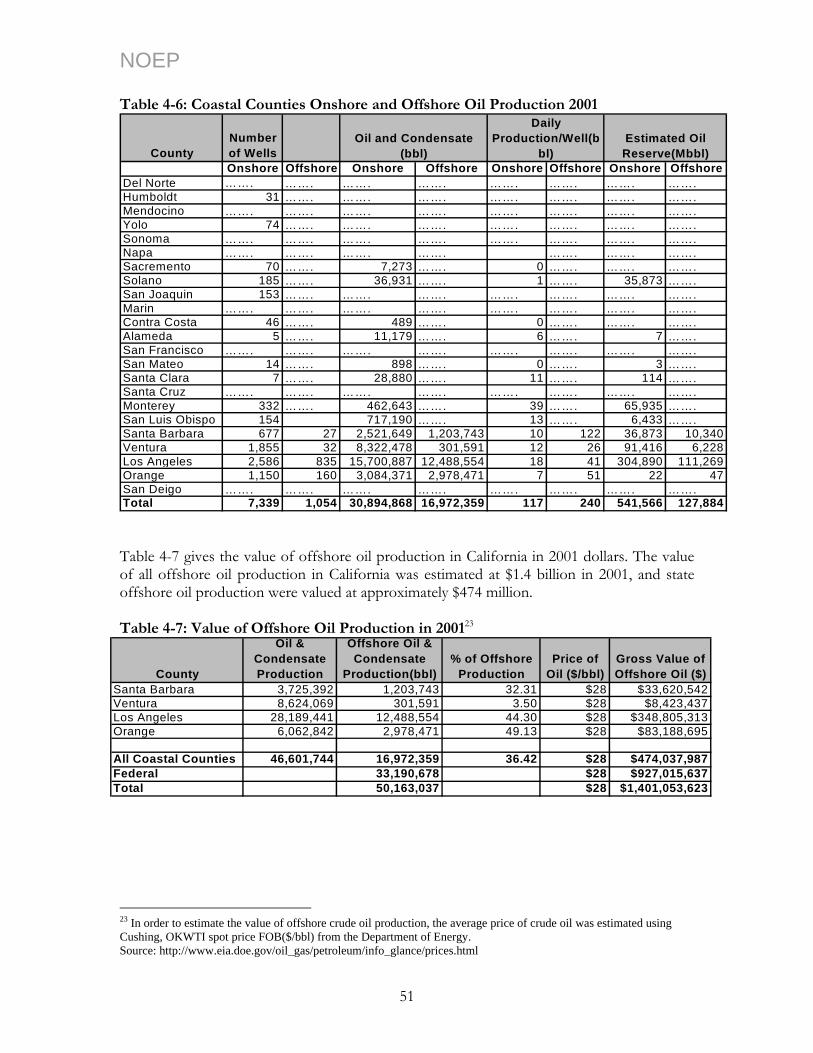
NOEP Table 4-6: Coastal Counties Onshore and Offshore Oil Production 2001
CountyNumber of WellsOnshore Offshore Onshore Offshore Onshore Offshore Onshore Offshore
Del Norte ……. ……. ……. ……. ……. ……. ……. …….Humboldt 31 ……. ……. ……. ……. ……. ……. …….Mendocino ……. ……. ……. ……. ……. ……. ……. …….Yolo 74 ……. ……. ……. ……. ……. ……. …….Sonoma ……. ……. ……. ……. ……. ……. ……. …….Napa ……. ……. ……. ……. ……. ……. …….Sacremento 70 ……. 7,273 ……. 0 ……. ……. …….Solano 185 ……. 36,931 ……. 1 ……. 35,873 …….San Joaquin 153 ……. ……. ……. ……. ……. ……. …….Marin ……. ……. ……. ……. ……. ……. ……. …….Contra Costa 46 ……. 489 ……. 0 ……. ……. …….Alameda 5 ……. 11,179 ……. 6 ……. 7 …….San Francisco ……. ……. ……. ……. ……. ……. ……. …….San Mateo 14 ……. 898 ……. 0 ……. 3 …….Santa Clara 7 ……. 28,880 ……. 11 ……. 114 …….Santa Cruz ……. ……. ……. ……. ……. ……. ……. …….Monterey 332 ……. 462,643 ……. 39 ……. 65,935 …….San Luis Obispo 154 717,190 ……. 13 ……. 6,433 …….Santa Barbara 677 27 2,521,649 1,203,743 10 122 36,873 10,340Ventura 1,855 32 8,322,478 301,591 12 26 91,416 6,228Los Angeles 2,586 835 15,700,887 12,488,554 18 41 304,890 111,269Orange 1,150 160 3,084,371 2,978,471 7 51 22 47San Deigo ……. ……. ……. ……. ……. ……. ……. …….Total 7,339 1,054 30,894,868 16,972,359 117 240 541,566 127,884
Estimated Oil Reserve(Mbbl)
Oil and Condensate (bbl)
Daily Production/Well(b
bl)
Table 4-7 gives the value of offshore oil production in California in 2001 dollars. The value of all offshore oil production in California was estimated at $1.4 billion in 2001, and state offshore oil production were valued at approximately $474 million.
Table 4-7: Value of Offshore Oil Production in 200123
County
Oil & Condensate Production
Offshore Oil & Condensate
Production(bbl)% of Offshore
ProductionPrice of
Oil ($/bbl)Gross Value of Offshore Oil ($)
Santa Barbara 3,725,392 1,203,743 32.31 $28 $33,620,542Ventura 8,624,069 301,591 3.50 $28 $8,423,437Los Angeles 28,189,441 12,488,554 44.30 $28 $348,805,313Orange 6,062,842 2,978,471 49.13 $28 $83,188,695
All Coastal Counties 46,601,744 16,972,359 36.42 $28 $474,037,987Federal 33,190,678 $28 $927,015,637Total 50,163,037 $28 $1,401,053,623
23 In order to estimate the value of offshore crude oil production, the average price of crude oil was estimated using Cushing, OKWTI spot price FOB($/bbl) from the Department of Energy. Source: http://www.eia.doe.gov/oil_gas/petroleum/info_glance/prices.html
51
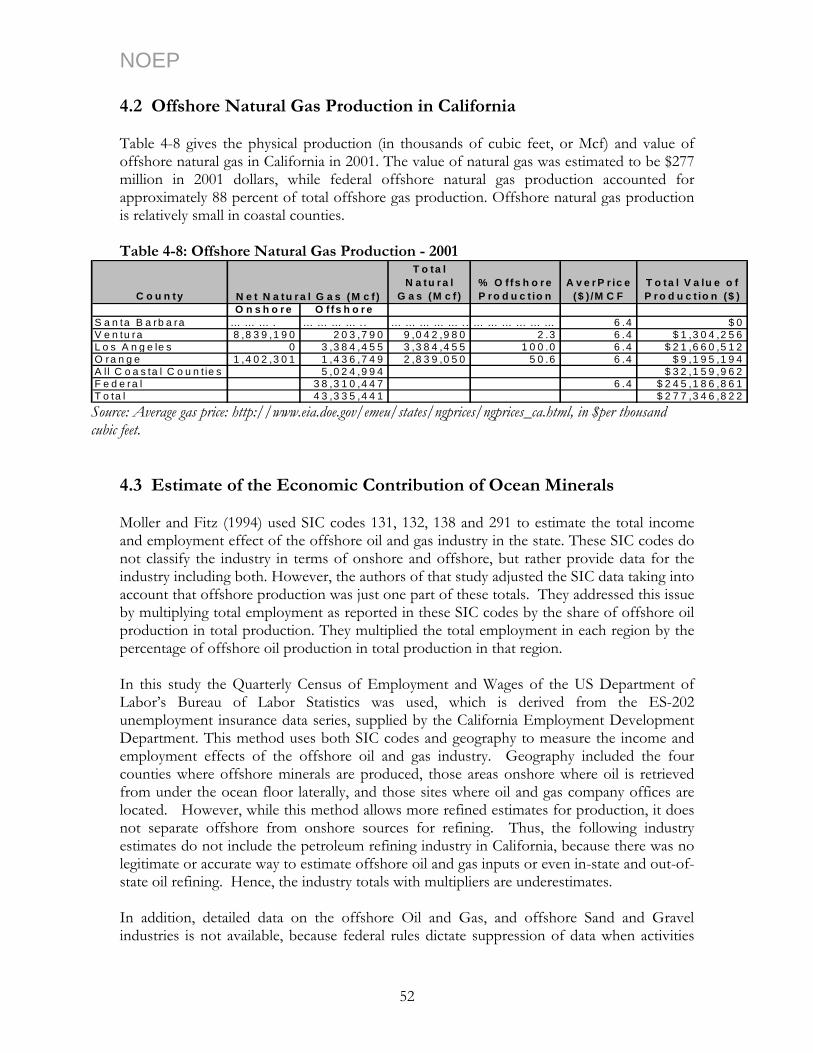
NOEP 4.2 Offshore Natural Gas Production in California Table 4-8 gives the physical production (in thousands of cubic feet, or Mcf) and value of offshore natural gas in California in 2001. The value of natural gas was estimated to be $277 million in 2001 dollars, while federal offshore natural gas production accounted for approximately 88 percent of total offshore gas production. Offshore natural gas production is relatively small in coastal counties. Table 4-8: Offshore Natural Gas Production - 2001
C o u n ty
T o ta l N a tu r a l
G a s (M c f )% O f fs h o r e P ro d u c t io n
A v e r P r ic e ($ ) /M C F
T o ta l V a lu e o f P r o d u c t io n ($ )
O n s h o r e O f fs h o r eS a n ta B a rb a ra … … … . … … … … .. … … … … … .. … … … … … … . 6 .4 $ 0V e n tu ra 8 ,8 3 9 ,1 9 0 2 0 3 ,7 9 0 9 ,0 4 2 ,9 8 0 2 .3 6 .4 $ 1 ,3 0 4 ,2 5 6L o s A n g e le s 0 3 ,3 8 4 ,4 5 5 3 ,3 8 4 ,4 5 5 1 0 0 .0 6 .4 $ 2 1 ,6 6 0 ,5 1 2O ra n g e 1 ,4 0 2 ,3 0 1 1 ,4 3 6 ,7 4 9 2 ,8 3 9 ,0 5 0 5 0 .6 6 .4 $ 9 ,1 9 5 ,1 9 4A ll C o a s ta l C o u n t ie s 5 ,0 2 4 ,9 9 4 $ 3 2 ,1 5 9 ,9 6 2F e d e ra l 3 8 ,3 1 0 ,4 4 7 6 .4 $ 2 4 5 ,1 8 6 ,8 6 1T o ta l 4 3 ,3 3 5 ,4 4 1 $ 2 7 7 ,3 4 6 ,8 2 2
N e t N a tu r a l G a s (M c f )
Source: Average gas price: http://www.eia.doe.gov/emeu/states/ngprices/ngprices_ca.html, in $per thousand cubic feet.
4.3 Estimate of the Economic Contribution of Ocean Minerals Moller and Fitz (1994) used SIC codes 131, 132, 138 and 291 to estimate the total income and employment effect of the offshore oil and gas industry in the state. These SIC codes do not classify the industry in terms of onshore and offshore, but rather provide data for the industry including both. However, the authors of that study adjusted the SIC data taking into account that offshore production was just one part of these totals. They addressed this issue by multiplying total employment as reported in these SIC codes by the share of offshore oil production in total production. They multiplied the total employment in each region by the percentage of offshore oil production in total production in that region. In this study the Quarterly Census of Employment and Wages of the US Department of Labor’s Bureau of Labor Statistics was used, which is derived from the ES-202 unemployment insurance data series, supplied by the California Employment Development Department. This method uses both SIC codes and geography to measure the income and employment effects of the offshore oil and gas industry. Geography included the four counties where offshore minerals are produced, those areas onshore where oil is retrieved from under the ocean floor laterally, and those sites where oil and gas company offices are located. However, while this method allows more refined estimates for production, it does not separate offshore from onshore sources for refining. Thus, the following industry estimates do not include the petroleum refining industry in California, because there was no legitimate or accurate way to estimate offshore oil and gas inputs or even in-state and out-of-state oil refining. Hence, the industry totals with multipliers are underestimates. In addition, detailed data on the offshore Oil and Gas, and offshore Sand and Gravel industries is not available, because federal rules dictate suppression of data when activities
52
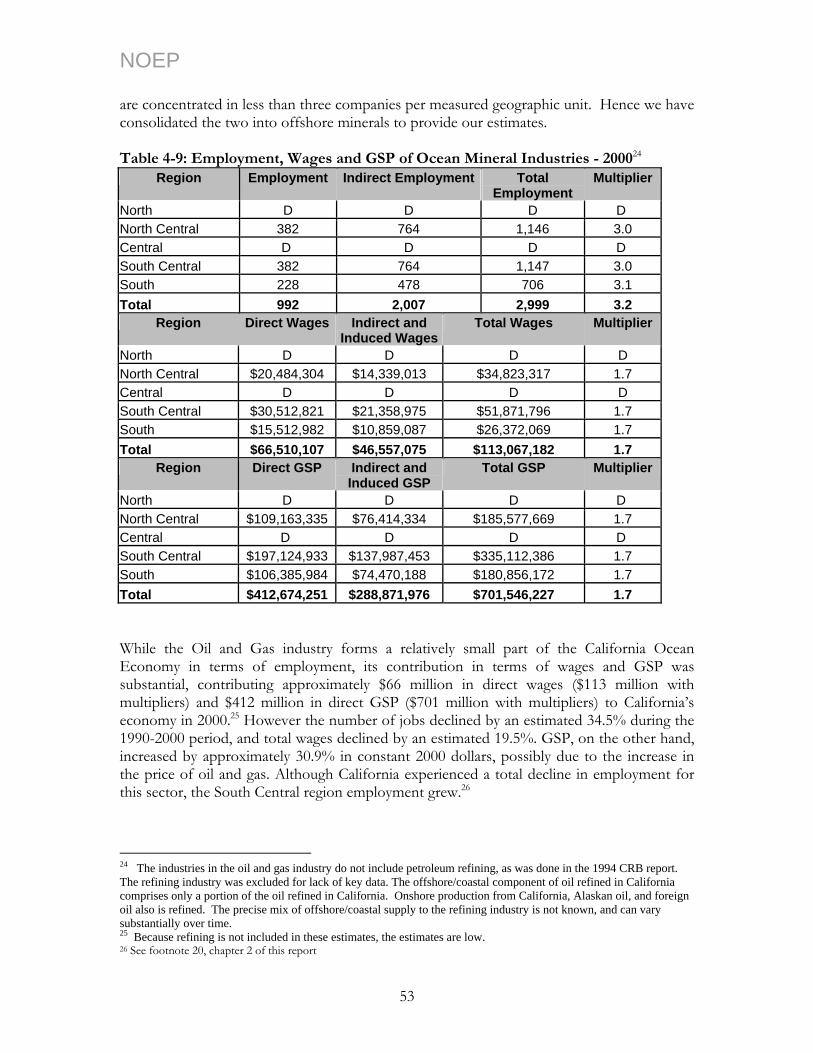
NOEP are concentrated in less than three companies per measured geographic unit. Hence we have consolidated the two into offshore minerals to provide our estimates. Table 4-9: Employment, Wages and GSP of Ocean Mineral Industries - 200024
Region Employment Indirect Employment Total Employment
Multiplier
North D D D D North Central 382 764 1,146 3.0 Central D D D D South Central 382 764 1,147 3.0 South 228 478 706 3.1 Total 992 2,007 2,999 3.2
Region Direct Wages Indirect and Induced Wages
Total Wages Multiplier
North D D D D North Central $20,484,304 $14,339,013 $34,823,317 1.7 Central D D D D South Central $30,512,821 $21,358,975 $51,871,796 1.7 South $15,512,982 $10,859,087 $26,372,069 1.7 Total $66,510,107 $46,557,075 $113,067,182 1.7
Region Direct GSP Indirect and Induced GSP
Total GSP Multiplier
North D D D D North Central $109,163,335 $76,414,334 $185,577,669 1.7 Central D D D D South Central $197,124,933 $137,987,453 $335,112,386 1.7 South $106,385,984 $74,470,188 $180,856,172 1.7 Total $412,674,251 $288,871,976 $701,546,227 1.7 While the Oil and Gas industry forms a relatively small part of the California Ocean Economy in terms of employment, its contribution in terms of wages and GSP was substantial, contributing approximately $66 million in direct wages ($113 million with multipliers) and $412 million in direct GSP ($701 million with multipliers) to California’s economy in 2000.25 However the number of jobs declined by an estimated 34.5% during the 1990-2000 period, and total wages declined by an estimated 19.5%. GSP, on the other hand, increased by approximately 30.9% in constant 2000 dollars, possibly due to the increase in the price of oil and gas. Although California experienced a total decline in employment for this sector, the South Central region employment grew.26
24 The industries in the oil and gas industry do not include petroleum refining, as was done in the 1994 CRB report. The refining industry was excluded for lack of key data. The offshore/coastal component of oil refined in California comprises only a portion of the oil refined in California. Onshore production from California, Alaskan oil, and foreign oil also is refined. The precise mix of offshore/coastal supply to the refining industry is not known, and can vary substantially over time. 25 Because refining is not included in these estimates, the estimates are low. 26 See footnote 20, chapter 2 of this report
53
NOEP 4.4 References 2001 Annual Report of the State Oil and Gas Supervisor, California Department of
Conservation, Division of Oil, Gas, and Geothermal Resources. Department of Energy. Available at
<http://www.eia.doe.gov/oil_gas/petroleum/info_glance/prices.html>. US Department of Labor, Bureau of Labor Statistics. “Quarterly Census of Employment
and Wages.
54
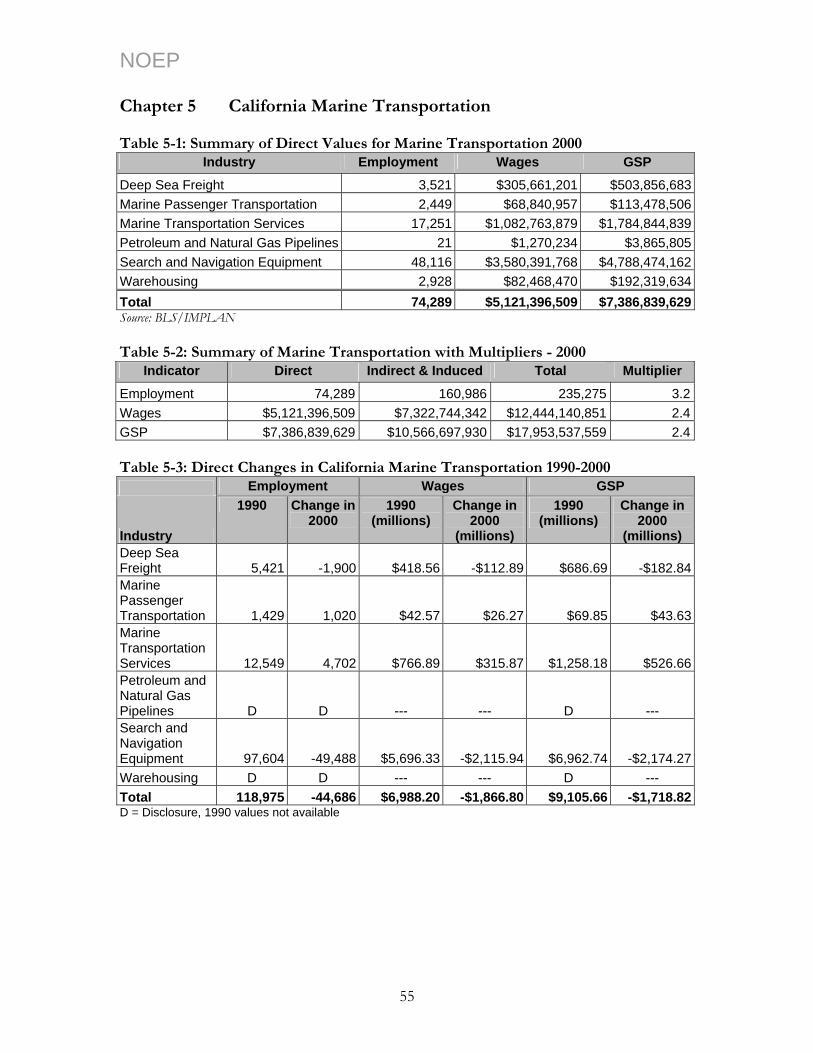
NOEP Chapter 5 California Marine Transportation Table 5-1: Summary of Direct Values for Marine Transportation 2000
Industry Employment Wages GSP Deep Sea Freight 3,521 $305,661,201 $503,856,683Marine Passenger Transportation 2,449 $68,840,957 $113,478,506Marine Transportation Services 17,251 $1,082,763,879 $1,784,844,839Petroleum and Natural Gas Pipelines 21 $1,270,234 $3,865,805Search and Navigation Equipment 48,116 $3,580,391,768 $4,788,474,162Warehousing 2,928 $82,468,470 $192,319,634Total 74,289 $5,121,396,509 $7,386,839,629Source: BLS/IMPLAN Table 5-2: Summary of Marine Transportation with Multipliers - 2000
Indicator Direct Indirect & Induced Total Multiplier Employment 74,289 160,986 235,275 3.2Wages $5,121,396,509 $7,322,744,342 $12,444,140,851 2.4GSP $7,386,839,629 $10,566,697,930 $17,953,537,559 2.4 Table 5-3: Direct Changes in California Marine Transportation 1990-2000 Employment Wages GSP
Industry
1990 Change in 2000
1990 (millions)
Change in 2000
(millions)
1990 (millions)
Change in 2000
(millions) Deep Sea Freight 5,421 -1,900 $418.56 -$112.89 $686.69 -$182.84Marine Passenger Transportation 1,429 1,020 $42.57 $26.27 $69.85 $43.63Marine Transportation Services 12,549 4,702 $766.89 $315.87 $1,258.18 $526.66Petroleum and Natural Gas Pipelines D D --- --- D --- Search and Navigation Equipment 97,604 -49,488 $5,696.33 -$2,115.94 $6,962.74 -$2,174.27Warehousing D D --- --- D --- Total 118,975 -44,686 $6,988.20 -$1,866.80 $9,105.66 -$1,718.82D = Disclosure, 1990 values not available
55
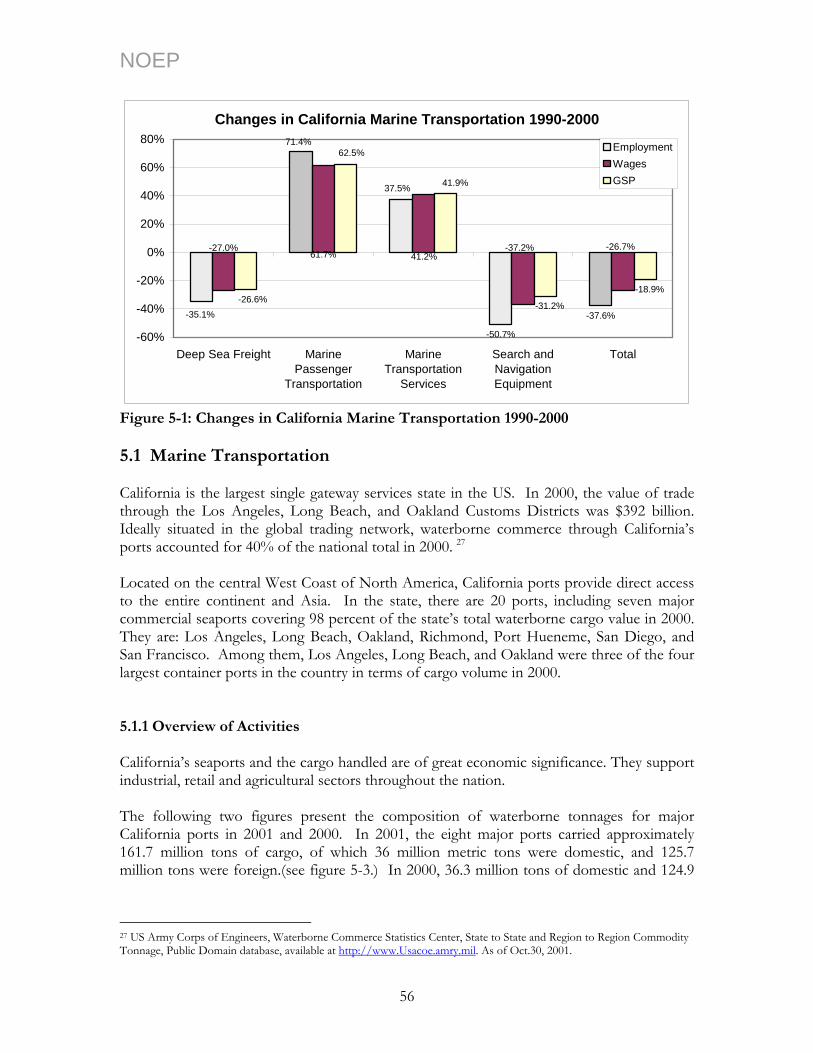
NOEP
Changes in California Marine Transportation 1990-2000
-50.7%
-37.6%-35.1%
71.4%
37.5%
-27.0%61.7% 41.2%
-37.2% -26.7%
-26.6%
62.5%
41.9%
-31.2%
-18.9%
-60%
-40%
-20%
0%
20%
40%
60%
80%
Deep Sea Freight MarinePassenger
Transportation
MarineTransportation
Services
Search andNavigationEquipment
Total
EmploymentWagesGSP
Figure 5-1: Changes in California Marine Transportation 1990-2000 5.1 Marine Transportation California is the largest single gateway services state in the US. In 2000, the value of trade through the Los Angeles, Long Beach, and Oakland Customs Districts was $392 billion. Ideally situated in the global trading network, waterborne commerce through California’s ports accounted for 40% of the national total in 2000. 27
Located on the central West Coast of North America, California ports provide direct access to the entire continent and Asia. In the state, there are 20 ports, including seven major commercial seaports covering 98 percent of the state’s total waterborne cargo value in 2000. They are: Los Angeles, Long Beach, Oakland, Richmond, Port Hueneme, San Diego, and San Francisco. Among them, Los Angeles, Long Beach, and Oakland were three of the four largest container ports in the country in terms of cargo volume in 2000. 5.1.1 Overview of Activities California’s seaports and the cargo handled are of great economic significance. They support industrial, retail and agricultural sectors throughout the nation. The following two figures present the composition of waterborne tonnages for major California ports in 2001 and 2000. In 2001, the eight major ports carried approximately 161.7 million tons of cargo, of which 36 million metric tons were domestic, and 125.7 million tons were foreign.(see figure 5-3.) In 2000, 36.3 million tons of domestic and 124.9
27 US Army Corps of Engineers, Waterborne Commerce Statistics Center, State to State and Region to Region Commodity Tonnage, Public Domain database, available at http://www.Usacoe.amry.mil. As of Oct.30, 2001.
56
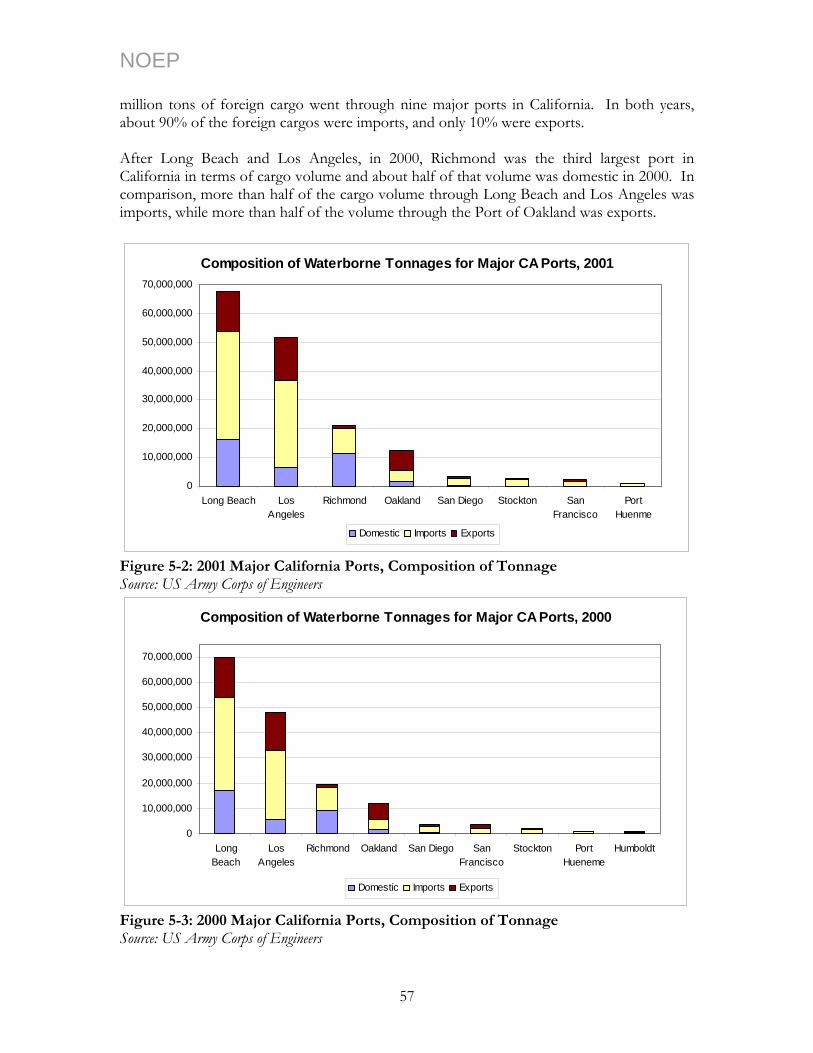
NOEP million tons of foreign cargo went through nine major ports in California. In both years, about 90% of the foreign cargos were imports, and only 10% were exports. After Long Beach and Los Angeles, in 2000, Richmond was the third largest port in California in terms of cargo volume and about half of that volume was domestic in 2000. In comparison, more than half of the cargo volume through Long Beach and Los Angeles was imports, while more than half of the volume through the Port of Oakland was exports.
Composition of Waterborne Tonnages for Major CA Ports, 2001
0
10,000,000
20,000,000
30,000,000
40,000,000
50,000,000
60,000,000
Long Beach LosAngeles
Richmond Oakland San Diego Stockton SanFrancisco
PortHuenme
70,000,000
Domestic Imports Exports
Figure 5-2: 2001 Major California Ports, Composition of Tonnage Source: US Army Corps of Engineers
Composition of Waterborne Tonnages for Major CA Ports, 2000
0
10,000,000
20,000,000
70,000,000
LongBeach
LosAngeles
Richmond Oakland San Diego SanFrancisco
Stockton PortHueneme
Humboldt
30,000,000
40,000,000
50,000,000
60,000,000
Domestic Imports Exports
Figure 5-3: 2000 Major California Ports, Composition of Tonnage Source: US Army Corps of Engineers
57

NOEP In recent years, California ports have become more and more significant as service providers to promote international commerce. Figure 5-4 shows the composition of waterborne tonnage for combined California ports from 1997 to 2001. The total volume of cargo through all ports grew 8.5% from 1997 to 2001. The most significant growth occurred from 1999-2000. with a 7.7% increase. From 1997 to 2001, total imports increased 85.8%.
Composition of Waterborne Tonnages for Combined California Ports, 1997 -2001 (in Units of 1,000 Tons)
80,000
40,000
60,000
0
20,000
1997 1998 1999 2000 2001
100,000
120,000
140,000
160,000
180,000
200,000
Outgoing_Domestic Exports Incoming_Domestic Imports Intrastate
Figure 5-4: 1997-2001 Combined California Ports, Composition of Tonnage Source: US Army Corps of Engineers Figure 5-5 presents the composition of waterborne tonnage for combined Long Beach and
ately two millions jobs nationwide were linked to the activities of the Ports of Los Angeles and Long Beach at that time. According to the California Marine and Inter-modal Transportation System Advisory Council, containerized cargo through the Ports of Los Angeles and Long Beach is expected to grow three times its current size between 2001 and 2020. The economic benefits of trade through the ports will be accompanied by major challenges of congestion and growth management. 28
Los Angeles Ports from 1997 to 2001. The Ports of Los Angeles and Long Beach, the two most active container ports in the nation. Combined, they represented the third largest container port in the world, only after Hong Kong and Singapore. In 2000, more than one third of all US waterborne containers moved through the Los Angeles and Long Beach ports. Approxim
28 For additional information on expected growth for California ports, see Jon Haveman, California Seaports, California Global Gateways: Trends and Issues.
58
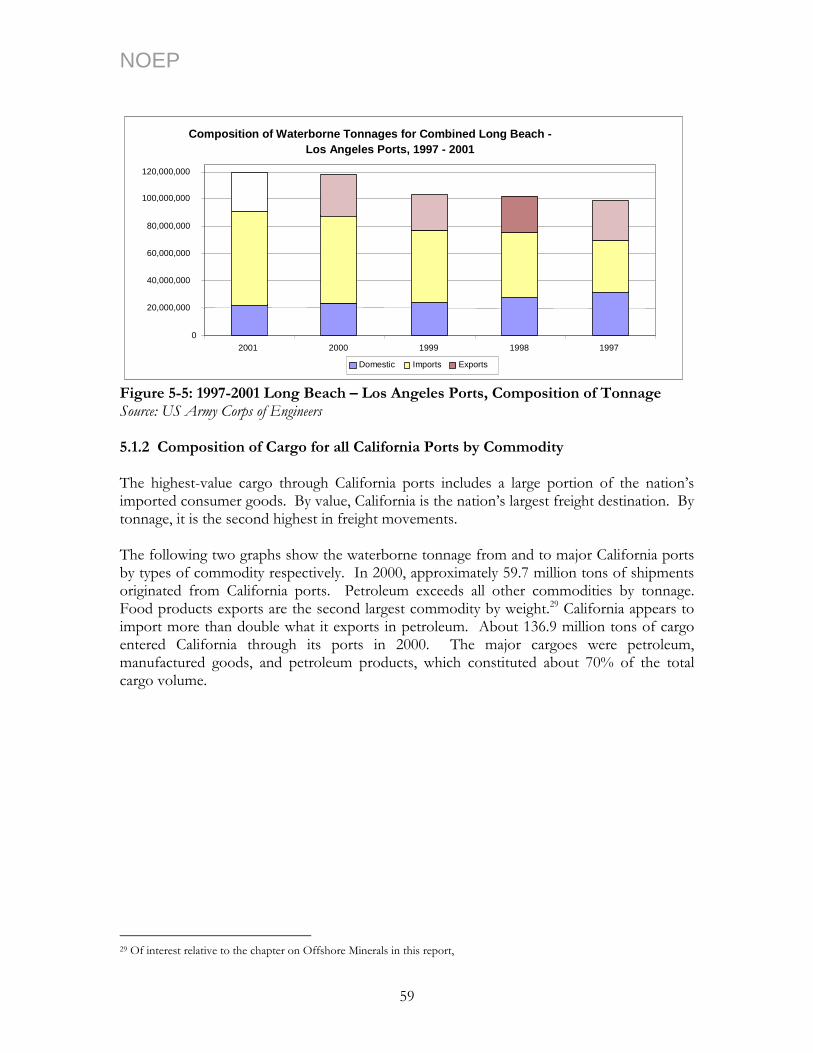
NOEP
Composition of Waterborne Tonnages for Combined Long Beach - Los Angeles Ports, 1997 - 2001
0 20,000,000 40,000,000 60,000,000 80,000,000
100,000,000 120,000,000
2001 2000 1999 1998 1997 Domestic Imports Exports
Figure 5-5: 1997-2001 Long Beach – Los Angeles Ports, Composition of Tonnage Source: US Army Corps of Engineers 5.1.2 Composition of Cargo for all California Ports by Commodity The highest-value cargo through California ports includes a large portion of the nation’s imported consumer goods. By value, California is the nation’s largest freight destination. By tonnage, it is the second highest in freight movements. The following two graphs show the waterborne tonnage from and to major California ports by types of commodity respectively. In 2000, approximately 59.7 million tons of shipments originated from California ports. Petroleum exceeds all other commodities by tonnage. Food products exports are the second largest commodity by weight.29 California appears to import more than double what it exports in petroleum. About 136.9 million tons of cargo entered California through its ports in 2000. The major cargoes were petroleum, manufactured goods, and petroleum products, which constituted about 70% of the total cargo volume.
29 Of interest relative to the chapter on Offshore Minerals in this report,
59
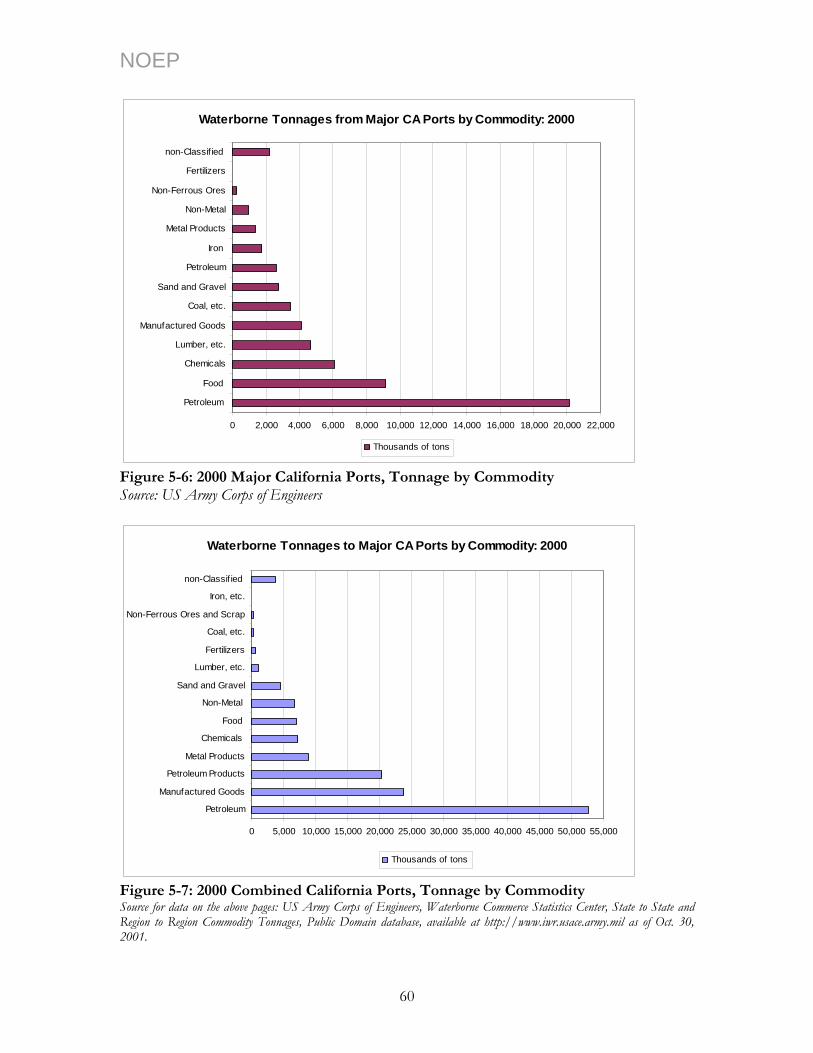
NOEP
Waterborne Tonnages from Major CA Ports by Commodity: 2000
0 2,000 4,000 6,000 8,000 10,000 12,000 14,000 16,000 18,000 20,000 22,000
Petroleum
Food
Chemicals
Lumber, etc.
Manufactured Goods
Coal, etc.
Sand and Gravel
Petroleum
Iron
Metal Products
Non-Metal
Non-Ferrous Ores
Fertilizers
non-Classif ied
Thousands of tons
Figure 5-6: 2000 Major California Ports, Tonnage by Commodity Source: US Army Corps of Engineers
Waterborne Tonnages to Major CA Ports by Commodity: 2000
0 5,000 10,000 15,000 20,000 25,000 30,000 35,000 40,000 45,000 50,000 55,000
Petroleum
Manufactured Goods
Petroleum Products
Metal Products
Chemicals
Food
Non-Metal
Sand and Gravel
Lumber, etc.
Fertilizers
Coal, etc.
Non-Ferrous Ores and Scrap
Iron, etc.
non-Classif ied
Thousands of tons
Figure 5-7: 2000 Combined California Ports, Tonnage by Commodity Source for data on the above pages: US Army Corps of Engineers, Waterborne Commerce Statistics Center, State to State and Region to Region Commodity Tonnages, Public Domain database, available at http://www.iwr.usace.army.mil as of Oct. 30, 2001.
60
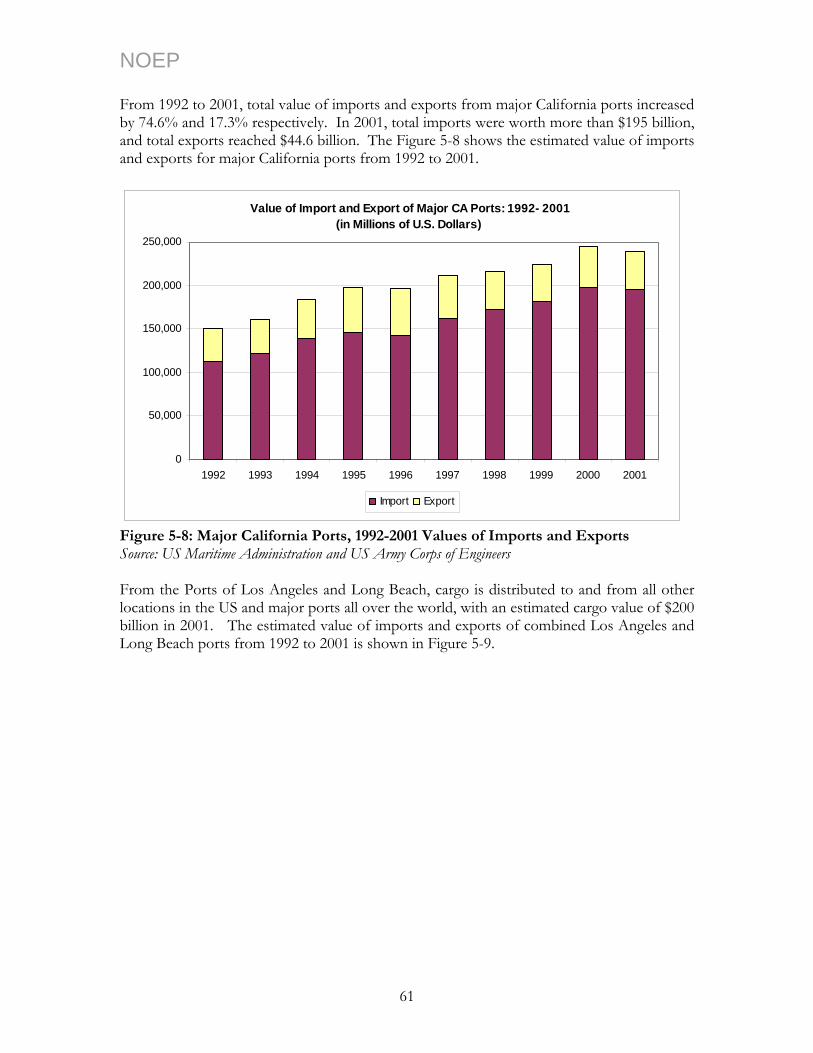
NOEP From 1992 to 2001, total value of imports and exports from major California ports increased by 74.6% and 17.3% respectively. In 2001, total imports were worth more than $195 billion, and total exports reached $44.6 billion. The Figure 5-8 shows the estimated value of imports and exports for major California ports from 1992 to 2001.
Value of Import and Export of Major CA Ports: 1992- 2001(in Millions of U.S. Dollars)
0,00025
150,000
200,000
0
50,000
100,000
1992 1993 1994 1995 1996 1997 1998 1999 2000 2001
Import Export
Figure 5-8: Major California Ports, 1992-2001 Values of Imports and Exports Source: US Maritime Administration and US Army Corps of Engineers
From the Ports of Los Angeles and Long Beach, cargo is distributed to and from all other locations in the US and major ports all over the world, with an estimated cargo value of $200 billion in 2001. The estimated value of imports and exports of combined Los Angeles and Long Beach ports from 1992 to 2001 is shown in Figure 5-9.
61
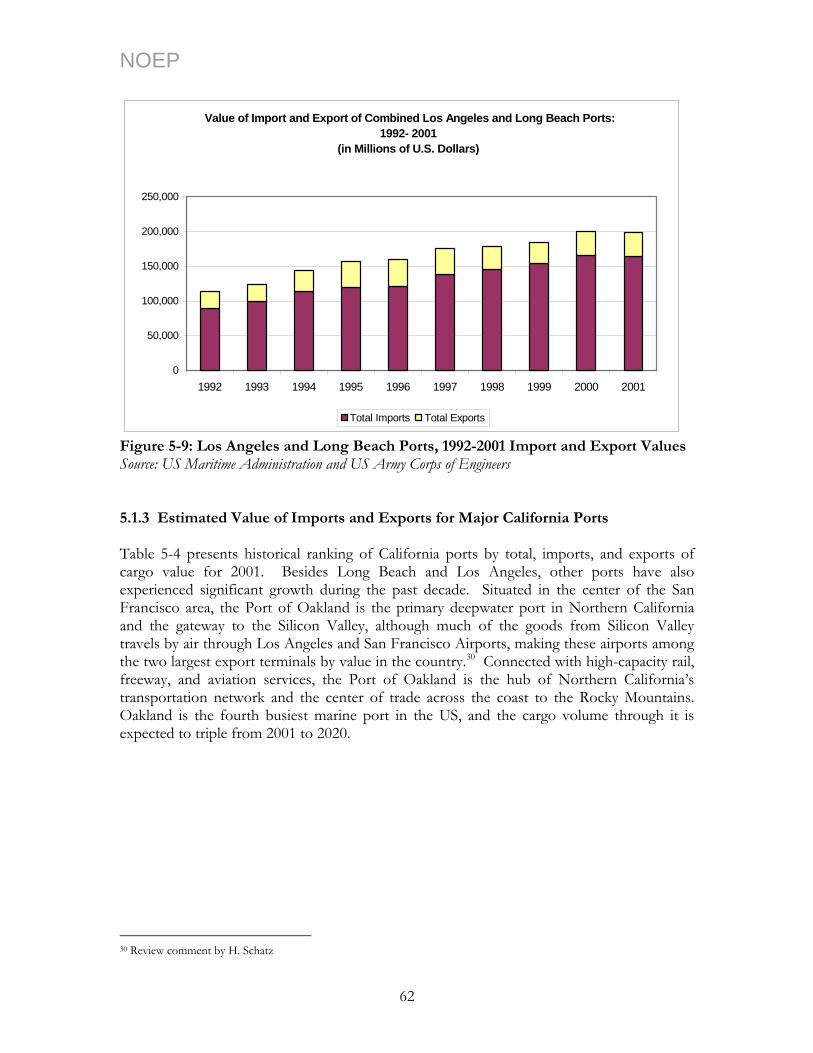
NOEP
Value of Import and Export of Combined Los Angeles and Long Beach Ports: 1992- 2001
(in Millions of U.S. Dollars)
0
50,000
100,000
150,000
200,000
250,000
1992 1993 1994 1995 1996 1997 1998 1999 2000 2001
Total Imports Total Exports
Figure 5-9: Los Angeles and Long Beach Ports, 1992-2001 Import and Export Values Source: US Maritime Administration and US Army Corps of Engineers 5.1.3 Estimated Value of Imports and Exports for Major California Ports Table 5-4 presents historical ranking of California ports by total, imports, and exports of cargo value for 2001. Besides Long Beach and Los Angeles, other ports have also experienced significant growth during the past decade. Situated in the center of the San Francisco area, the Port of Oakland is the primary deepwater port in Northern California and the gateway to the Silicon Valley, although much of the goods from Silicon Valley travels by air through Los Angeles and San Francisco Airports, making these airports among the two largest export terminals by value in the country.30 Connected with high-capacity rail, freeway, and aviation services, the Port of Oakland is the hub of Northern California’s transportation network and the center of trade across the coast to the Rocky Mountains. Oakland is the fourth busiest marine port in the US, and the cargo volume through it is expected to triple from 2001 to 2020.
30 Review comment by H. Schatz
62
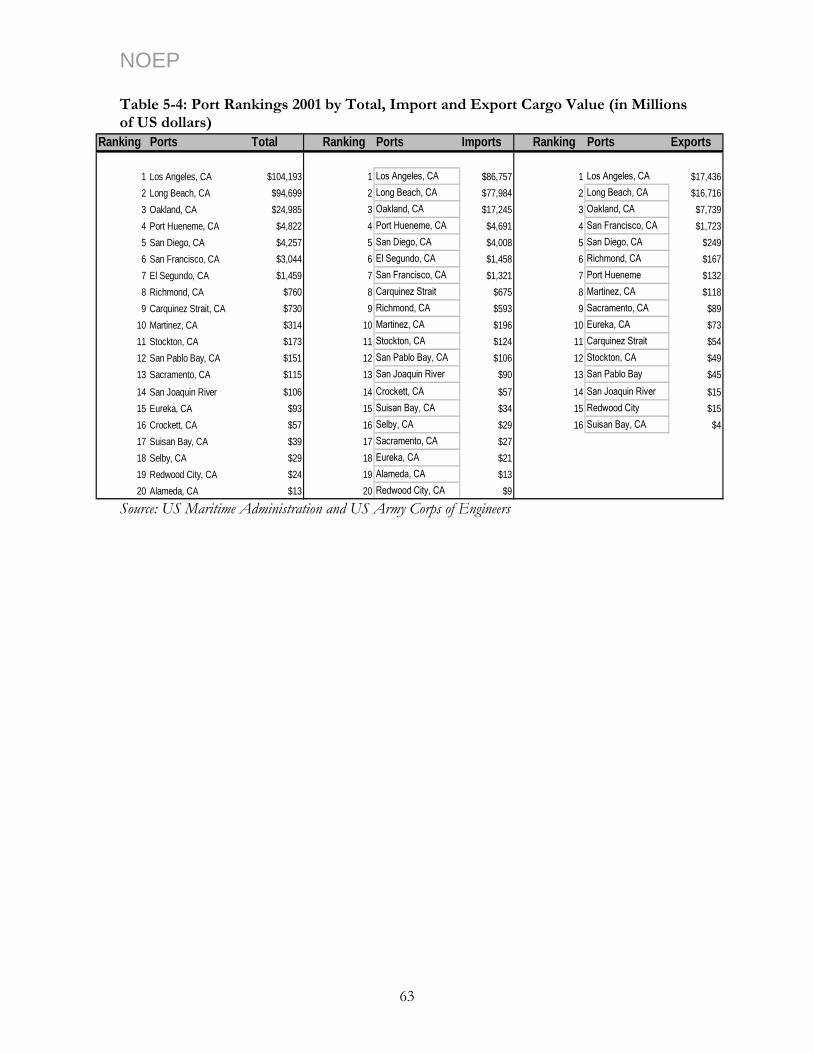
NOEP Table 5-4: Port Rankings 2001 by Total, Import and Export Cargo Value (in Millions of US dollars)
Ranking Ports Total Ranking Ports Imports Ranking Ports Exports
1 Los Angeles, CA $104,193 1 Los Angeles, CA $86,757 1 Los Angeles, CA $17,4362 Long Beach, CA $94,699 2 Long Beach, CA $77,984 2 Long Beach, CA $16,7163 Oakland, CA $24,985 3 Oakland, CA $17,245 3 Oakland, CA $7,7394 Port Hueneme, CA $4,822 4 Port Hueneme, CA $4,691 4 San Francisco, CA $1,7235 San Diego, CA $4,257 5 San Diego, CA $4,008 5 San Diego, CA $2496 San Francisco, CA $3,044 6 El Segundo, CA $1,458 6 Richmond, CA $1677 El Segundo, CA $1,459 7 San Francisco, CA $1,321 7 Port Hueneme $1328 Richmond, CA $760 8 Carquinez Strait $675 8 Martinez, CA $1189 Carquinez Strait, CA $730 9 Richmond, CA $593 9 Sacramento, CA $89
10 Martinez, CA $314 10 Martinez, CA $196 10 Eureka, CA $7311 Stockton, CA $173 11 Stockton, CA $124 11 Carquinez Strait $5412 San Pablo Bay, CA $151 12 San Pablo Bay, CA $106 12 Stockton, CA $4913 Sacramento, CA $115 13 San Joaquin River $90 13 San Pablo Bay $45
14 San Joaquin River $106 14 Crockett, CA $57 14 San Joaquin River $1515 Eureka, CA $93 15 Suisan Bay, CA $34 15 Redwood City $1516 Crockett, CA $57 16 Selby, CA $29 16 Suisan Bay, CA $417 Suisan Bay, CA $39 17 Sacramento, CA $2718 Selby, CA $29 18 Eureka, CA $2119 Redwood City, CA $24 19 Alameda, CA $1320 Alameda, CA $13 20 Redwood City, CA $9
Source: US Maritime Administration and US Army Corps of Engineers
63
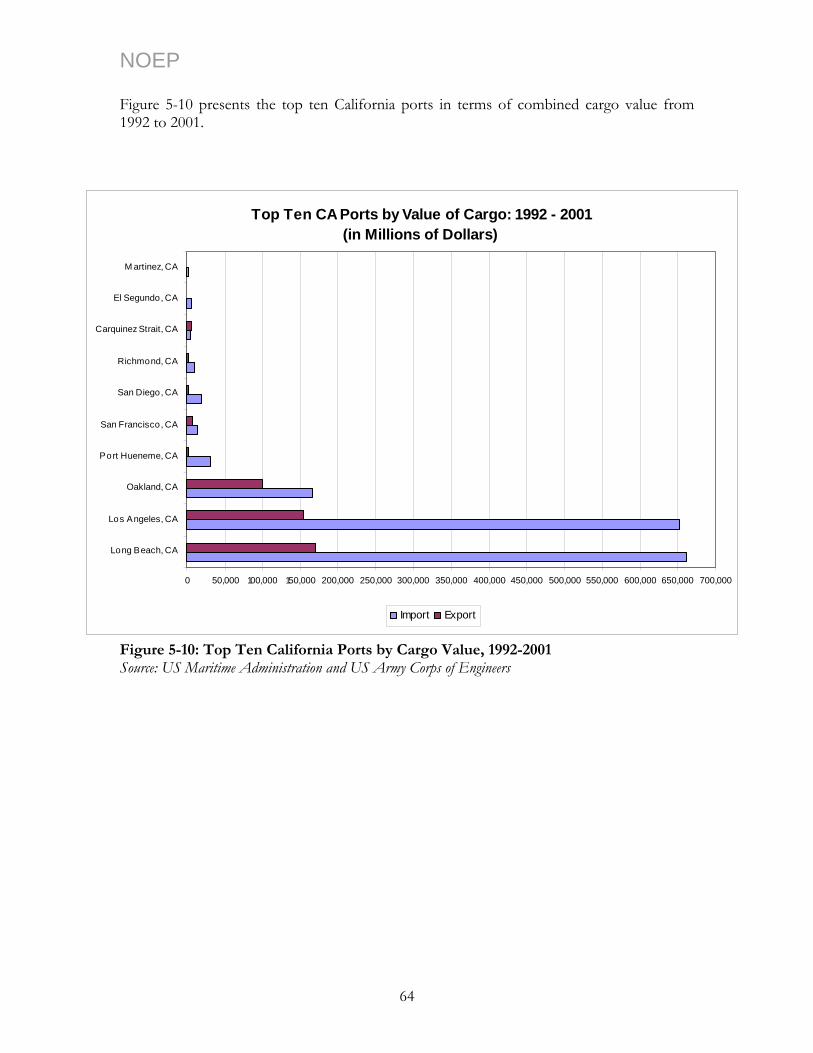
NOEP Figure 5-10 presents the top ten California ports in terms of combined cargo value from 1992 to 2001.
Top Ten CA Ports by Value of Cargo: 1992 - 2001(in Millions of Dollars)
0 50,000 100,000 150,000 200,000 250,000 300,000 350,000 400,000 450,000 500,000 550,000 600,000 650,000 700,000
Long Beach, CA
Los Angeles, CA
Oakland, CA
Port Hueneme, CA
San Francisco, CA
San Diego, CA
Richmond, CA
Carquinez Strait, CA
El Segundo, CA
M artinez, CA
Import Export
Figure 5-10: Top Ten California Ports by Cargo Value, 1992-2001 Source: US Maritime Administration and US Army Corps of Engineers
64
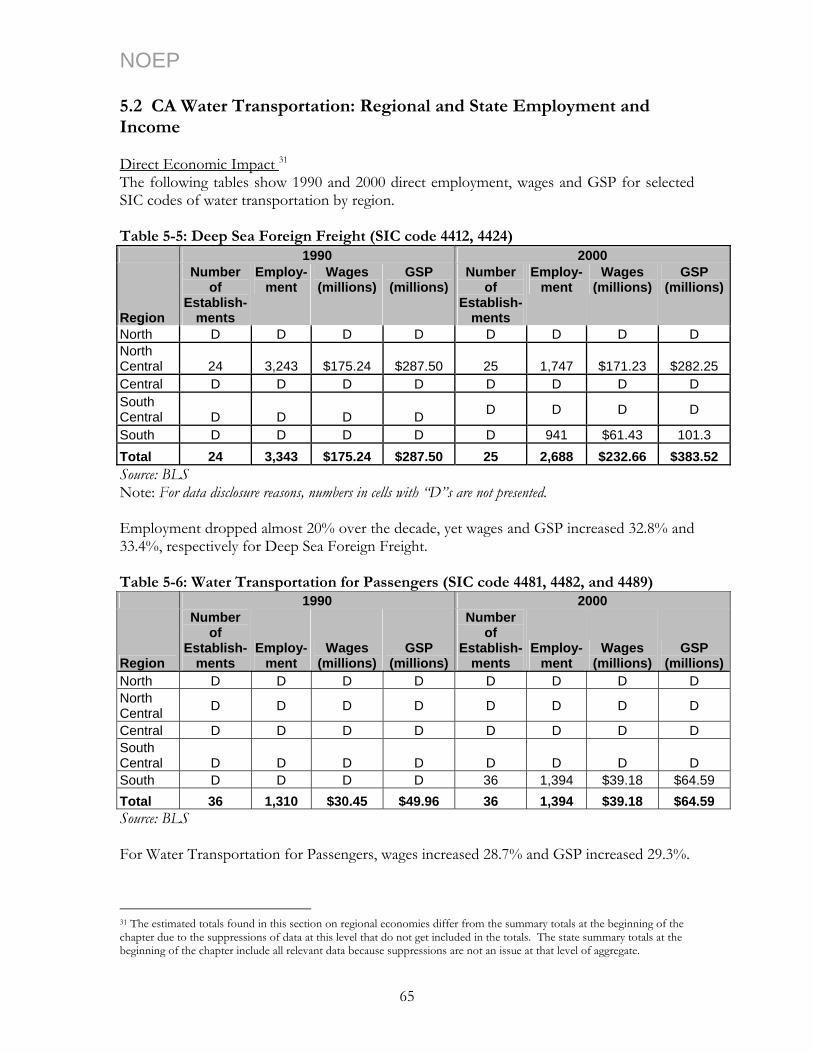
NOEP 5.2 CA Water Transportation: Regional and State Employment and Income Direct Economic Impact 31
The following tables show 1990 and 2000 direct employment, wages and GSP for selected SIC codes of water transportation by region. Table 5-5: Deep Sea Foreign Freight (SIC code 4412, 4424) 1990 2000
Region
Number of
Establish-ments
Employ-ment
Wages (millions)
GSP (millions)
Number of
Establish-ments
Employ-ment
Wages (millions)
GSP (millions)
North D D D D D D D D North Central 24 3,243 $175.24 $287.50 25 1,747 $171.23 $282.25 Central D D D D D D D D South Central D D D D D D D D
South D D D D D 941 $61.43 101.3 Total 24 3,343 $175.24 $287.50 25 2,688 $232.66 $383.52 Source: BLS Note: For data disclosure reasons, numbers in cells with “D”s are not presented. Employment dropped almost 20% over the decade, yet wages and GSP increased 32.8% and 33.4%, respectively for Deep Sea Foreign Freight. Table 5-6: Water Transportation for Passengers (SIC code 4481, 4482, and 4489) 1990 2000
Region
Number of
Establish-ments
Employ-ment
Wages (millions)
GSP (millions)
Number of
Establish-ments
Employ-ment
Wages (millions)
GSP (millions)
North D D D D D D D D North Central D D D D D D D D
Central D D D D D D D D South Central D D D D D D D D South D D D D 36 1,394 $39.18 $64.59 Total 36 1,310 $30.45 $49.96 36 1,394 $39.18 $64.59 Source: BLS For Water Transportation for Passengers, wages increased 28.7% and GSP increased 29.3%.
31 The estimated totals found in this section on regional economies differ from the summary totals at the beginning of the chapter due to the suppressions of data at this level that do not get included in the totals. The state summary totals at the beginning of the chapter include all relevant data because suppressions are not an issue at that level of aggregate.
65
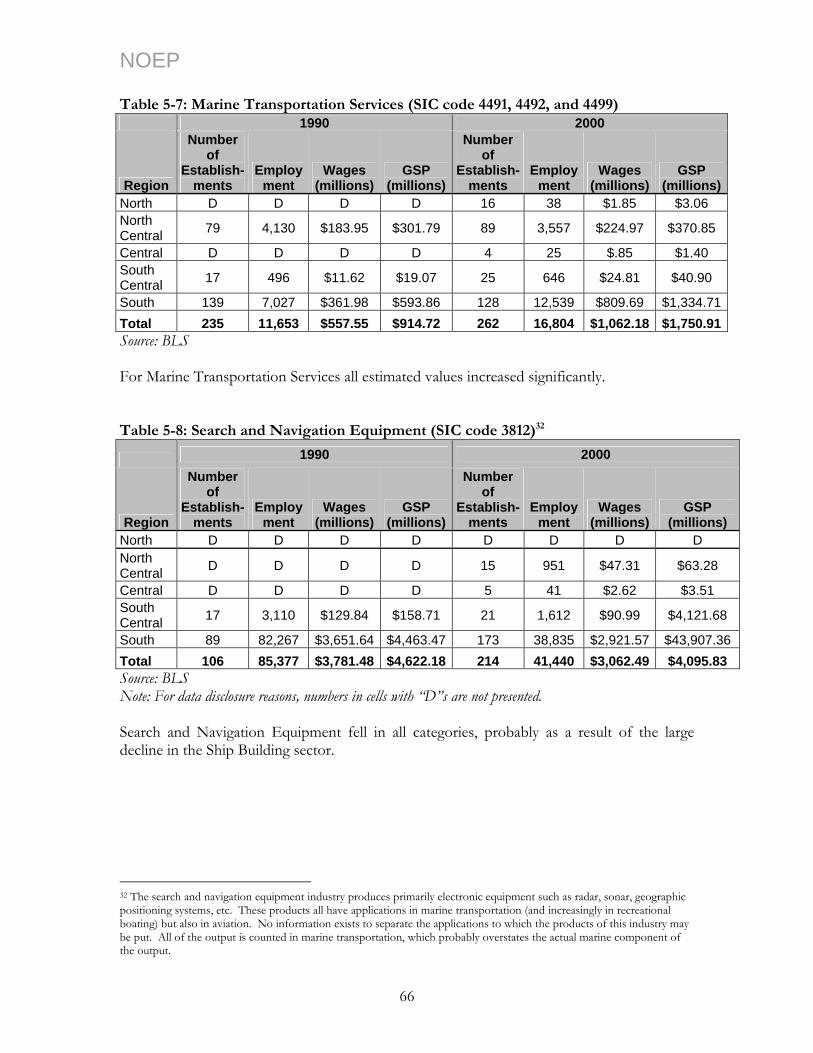
NOEP Table 5-7: Marine Transportation Services (SIC code 4491, 4492, and 4499) 1990 2000
Region
Number of
Establish-ments
Employment
Wages (millions)
GSP (millions)
Number of
Establish-ments
Employment
Wages (millions)
GSP (millions)
North D D D D 16 38 $1.85 $3.06 North Central 79 4,130 $183.95 $301.79 89 3,557 $224.97 $370.85
Central D D D D 4 25 $.85 $1.40 South Central 17 496 $11.62 $19.07 25 646 $24.81 $40.90
South 139 7,027 $361.98 $593.86 128 12,539 $809.69 $1,334.71Total 235 11,653 $557.55 $914.72 262 16,804 $1,062.18 $1,750.91Source: BLS For Marine Transportation Services all estimated values increased significantly. Table 5-8: Search and Navigation Equipment (SIC code 3812)32
1990 2000
Region
Number of
Establish-ments
Employment
Wages (millions)
GSP (millions)
Number of
Establish-ments
Employment
Wages (millions)
GSP (millions)
North D D D D D D D D North Central D D D D 15 951 $47.31 $63.28
Central D D D D 5 41 $2.62 $3.51 South Central 17 3,110 $129.84 $158.71 21 1,612 $90.99 $4,121.68
South 89 82,267 $3,651.64 $4,463.47 173 38,835 $2,921.57 $43,907.36 Total 106 85,377 $3,781.48 $4,622.18 214 41,440 $3,062.49 $4,095.83 Source: BLS Note: For data disclosure reasons, numbers in cells with “D”s are not presented. Search and Navigation Equipment fell in all categories, probably as a result of the large decline in the Ship Building sector.
32 The search and navigation equipment industry produces primarily electronic equipment such as radar, sonar, geographic positioning systems, etc. These products all have applications in marine transportation (and increasingly in recreational boating) but also in aviation. No information exists to separate the applications to which the products of this industry may be put. All of the output is counted in marine transportation, which probably overstates the actual marine component of the output.
66
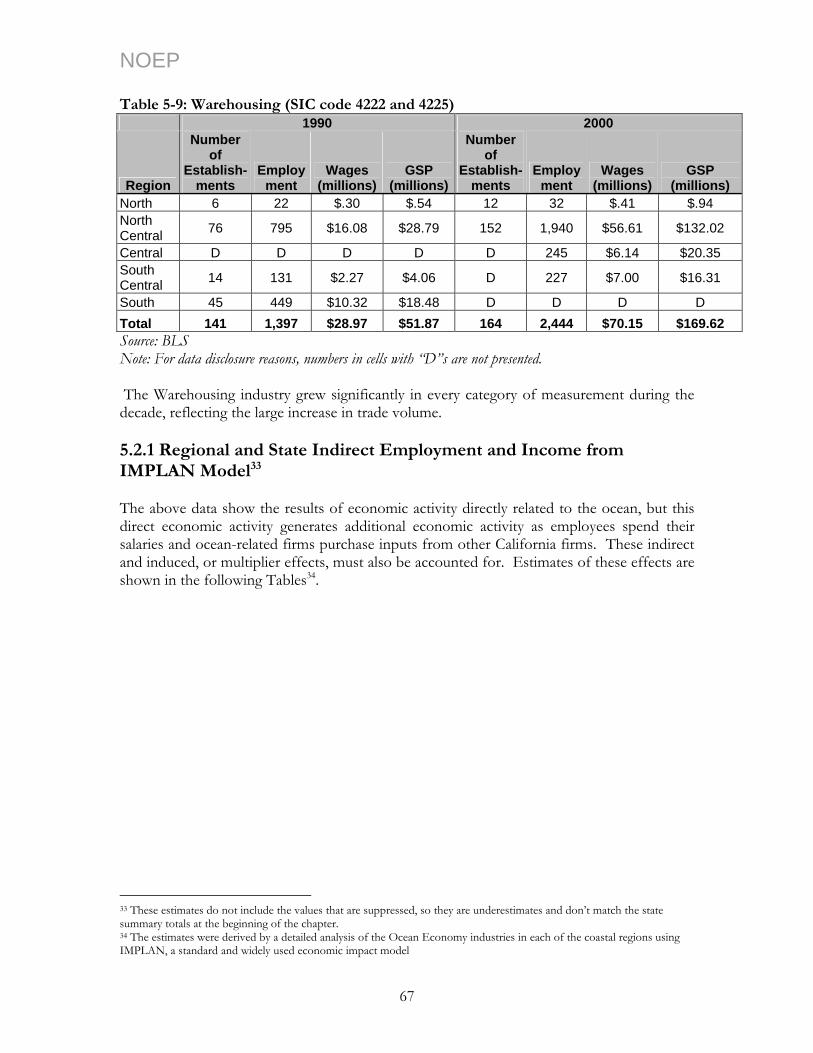
NOEP Table 5-9: Warehousing (SIC code 4222 and 4225) 1990 2000
Region
Number of
Establish-ments
Employment
Wages (millions)
GSP (millions)
Number of
Establish-ments
Employment
Wages (millions)
GSP (millions)
North 6 22 $.30 $.54 12 32 $.41 $.94 North Central 76 795 $16.08 $28.79 152 1,940 $56.61 $132.02
Central D D D D D 245 $6.14 $20.35 South Central 14 131 $2.27 $4.06 D 227 $7.00 $16.31
South 45 449 $10.32 $18.48 D D D D Total 141 1,397 $28.97 $51.87 164 2,444 $70.15 $169.62 Source: BLS Note: For data disclosure reasons, numbers in cells with “D”s are not presented. The Warehousing industry grew significantly in every category of measurement during the decade, reflecting the large increase in trade volume. 5.2.1 Regional and State Indirect Employment and Income from IMPLAN Model33
The above data show the results of economic activity directly related to the ocean, but this direct economic activity generates additional economic activity as employees spend their salaries and ocean-related firms purchase inputs from other California firms. These indirect and induced, or multiplier effects, must also be accounted for. Estimates of these effects are shown in the following Tables34.
33 These estimates do not include the values that are suppressed, so they are underestimates and don’t match the state summary totals at the beginning of the chapter. 34 The estimates were derived by a detailed analysis of the Ocean Economy industries in each of the coastal regions using IMPLAN, a standard and widely used economic impact model
67
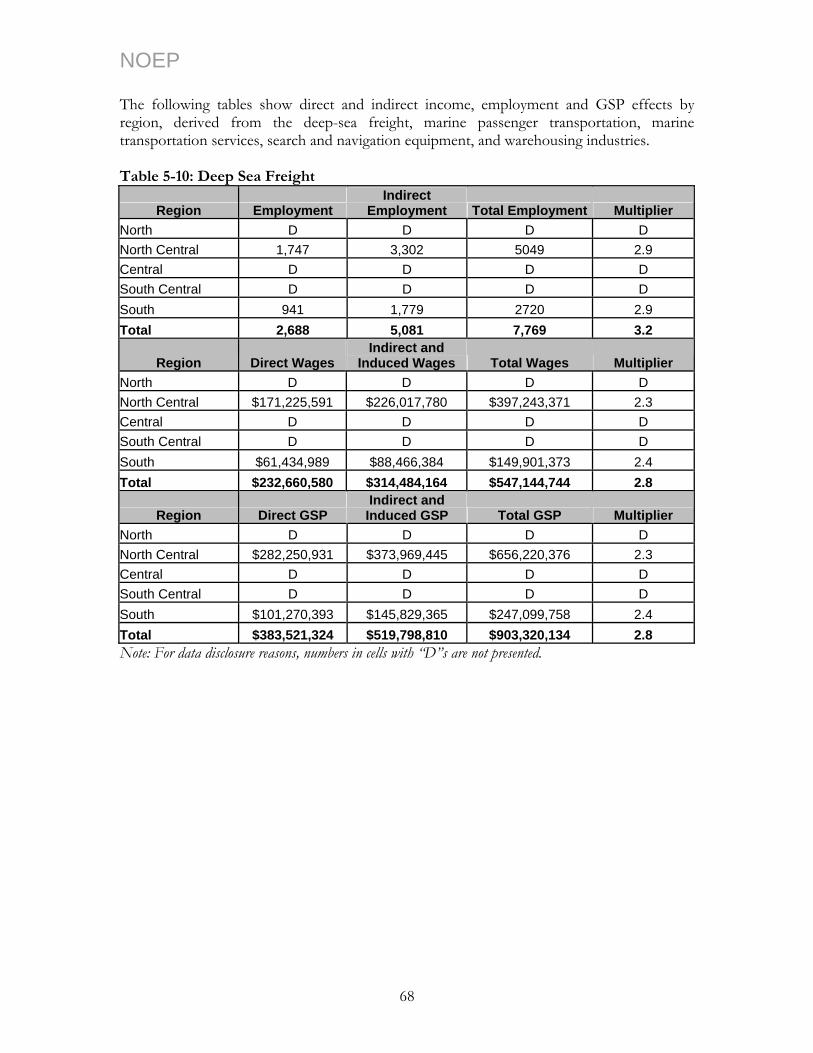
NOEP The following tables show direct and indirect income, employment and GSP effects by region, derived from the deep-sea freight, marine passenger transportation, marine transportation services, search and navigation equipment, and warehousing industries. Table 5-10: Deep Sea Freight
Region Employment Indirect
Employment Total Employment Multiplier North D D D D North Central 1,747 3,302 5049 2.9 Central D D D D South Central D D D D South 941 1,779 2720 2.9 Total 2,688 5,081 7,769 3.2
Region Direct Wages Indirect and
Induced Wages Total Wages Multiplier North D D D D North Central $171,225,591 $226,017,780 $397,243,371 2.3 Central D D D D South Central D D D D South $61,434,989 $88,466,384 $149,901,373 2.4 Total $232,660,580 $314,484,164 $547,144,744 2.8
Region Direct GSP Indirect and Induced GSP Total GSP Multiplier
North D D D D North Central $282,250,931 $373,969,445 $656,220,376 2.3 Central D D D D South Central D D D D South $101,270,393 $145,829,365 $247,099,758 2.4 Total $383,521,324 $519,798,810 $903,320,134 2.8 Note: For data disclosure reasons, numbers in cells with “D”s are not presented.
68
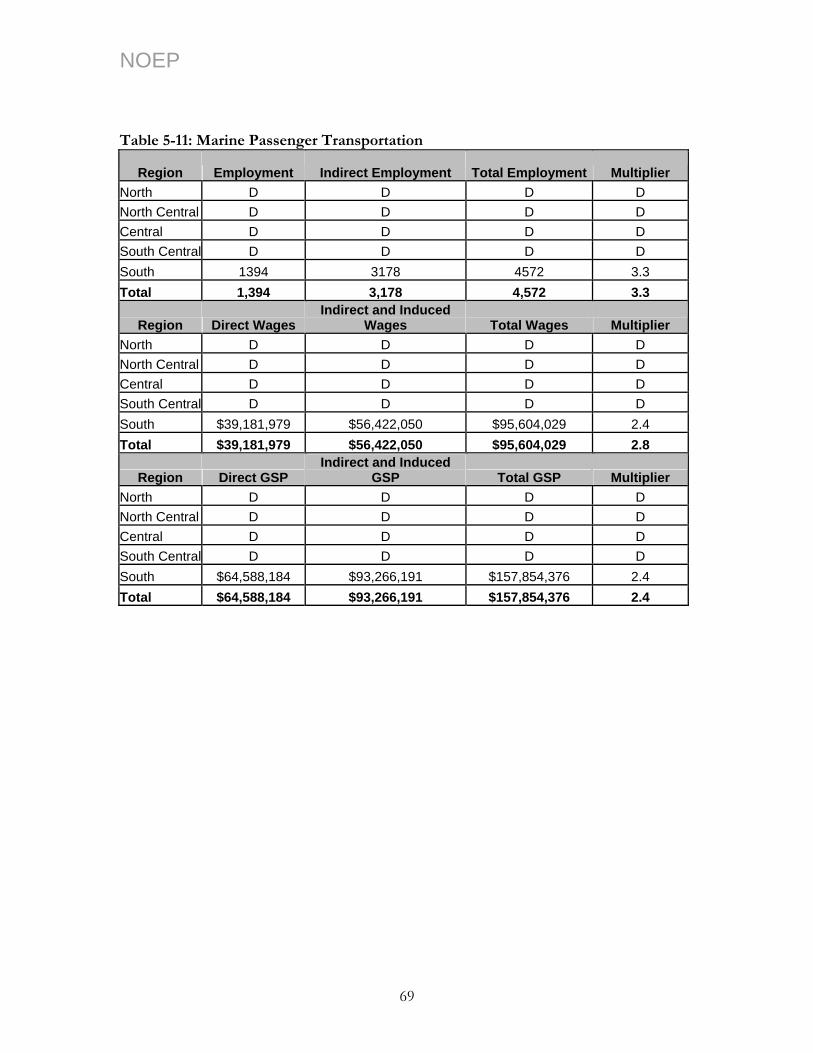
NOEP Table 5-11: Marine Passenger Transportation
Region Employment Indirect Employment Total Employment Multiplier North D D D D North Central D D D D Central D D D D South Central D D D D South 1394 3178 4572 3.3 Total 1,394 3,178 4,572 3.3
Region Direct Wages Indirect and Induced
Wages Total Wages Multiplier North D D D D North Central D D D D Central D D D D South Central D D D D South $39,181,979 $56,422,050 $95,604,029 2.4 Total $39,181,979 $56,422,050 $95,604,029 2.8
Region Direct GSP Indirect and Induced
GSP Total GSP Multiplier North D D D D North Central D D D D Central D D D D South Central D D D D South $64,588,184 $93,266,191 $157,854,376 2.4 Total $64,588,184 $93,266,191 $157,854,376 2.4
69
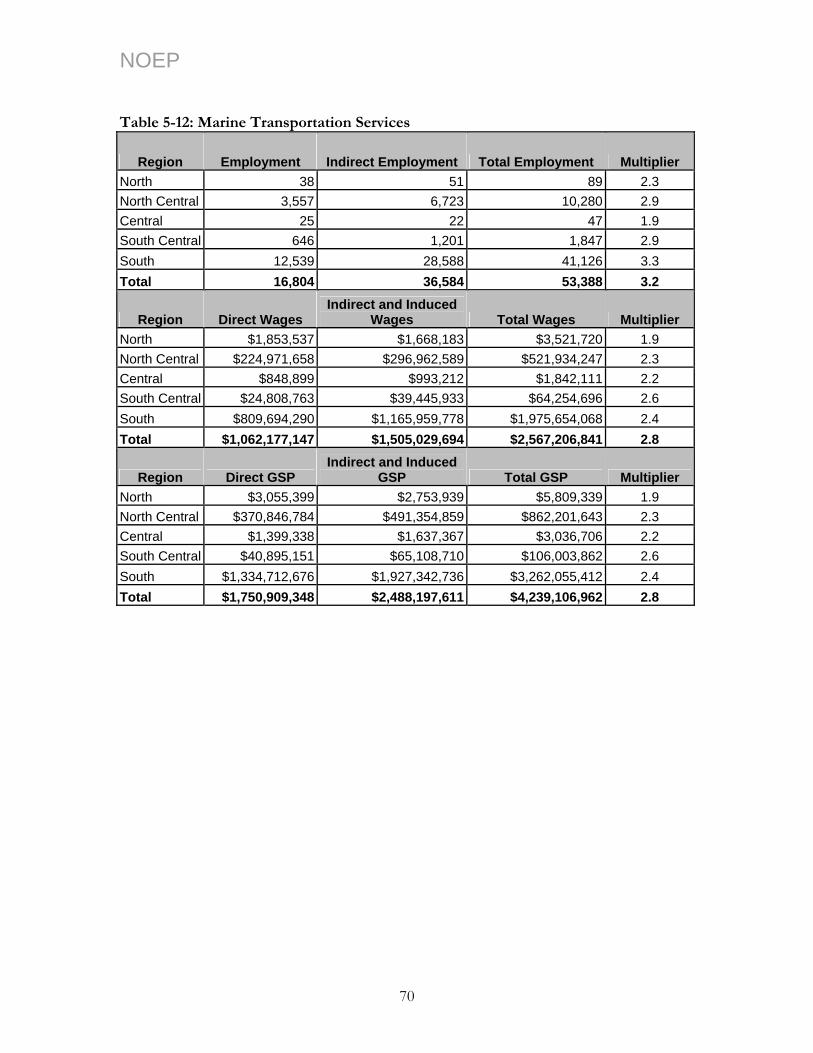
NOEP Table 5-12: Marine Transportation Services
Region Employment Indirect Employment Total Employment Multiplier North 38 51 89 2.3 North Central 3,557 6,723 10,280 2.9 Central 25 22 47 1.9 South Central 646 1,201 1,847 2.9 South 12,539 28,588 41,126 3.3 Total 16,804 36,584 53,388 3.2
Region Direct Wages Indirect and Induced
Wages Total Wages Multiplier North $1,853,537 $1,668,183 $3,521,720 1.9 North Central $224,971,658 $296,962,589 $521,934,247 2.3 Central $848,899 $993,212 $1,842,111 2.2 South Central $24,808,763 $39,445,933 $64,254,696 2.6 South $809,694,290 $1,165,959,778 $1,975,654,068 2.4 Total $1,062,177,147 $1,505,029,694 $2,567,206,841 2.8
Region Direct GSP Indirect and Induced
GSP Total GSP Multiplier North $3,055,399 $2,753,939 $5,809,339 1.9 North Central $370,846,784 $491,354,859 $862,201,643 2.3 Central $1,399,338 $1,637,367 $3,036,706 2.2 South Central $40,895,151 $65,108,710 $106,003,862 2.6 South $1,334,712,676 $1,927,342,736 $3,262,055,412 2.4 Total $1,750,909,348 $2,488,197,611 $4,239,106,962 2.8
70
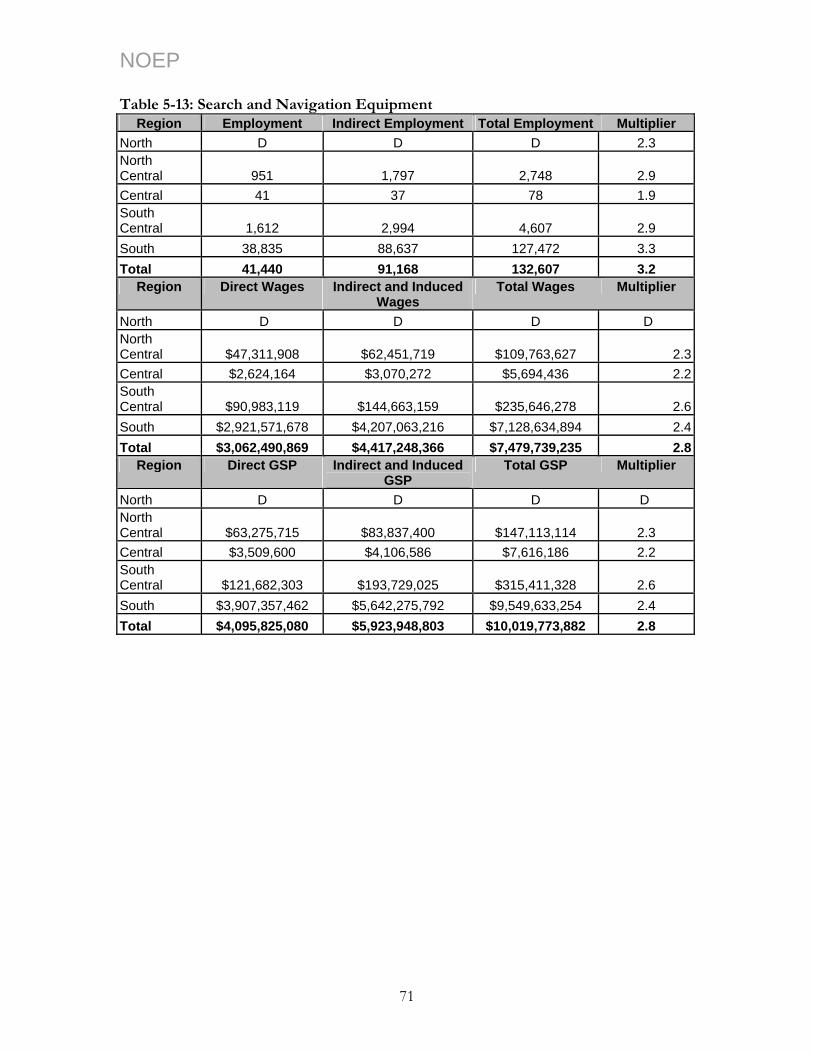
NOEP Table 5-13: Search and Navigation Equipment
Region Employment Indirect Employment Total Employment Multiplier North D D D 2.3 North Central 951 1,797 2,748 2.9 Central 41 37 78 1.9 South Central 1,612 2,994 4,607 2.9 South 38,835 88,637 127,472 3.3 Total 41,440 91,168 132,607 3.2
Region Direct Wages Indirect and Induced Wages
Total Wages Multiplier
North D D D D North Central $47,311,908 $62,451,719 $109,763,627 2.3Central $2,624,164 $3,070,272 $5,694,436 2.2South Central $90,983,119 $144,663,159 $235,646,278 2.6South $2,921,571,678 $4,207,063,216 $7,128,634,894 2.4Total $3,062,490,869 $4,417,248,366 $7,479,739,235 2.8
Region Direct GSP Indirect and Induced GSP
Total GSP Multiplier
North D D D D North Central $63,275,715 $83,837,400 $147,113,114 2.3 Central $3,509,600 $4,106,586 $7,616,186 2.2 South Central $121,682,303 $193,729,025 $315,411,328 2.6 South $3,907,357,462 $5,642,275,792 $9,549,633,254 2.4 Total $4,095,825,080 $5,923,948,803 $10,019,773,882 2.8
71
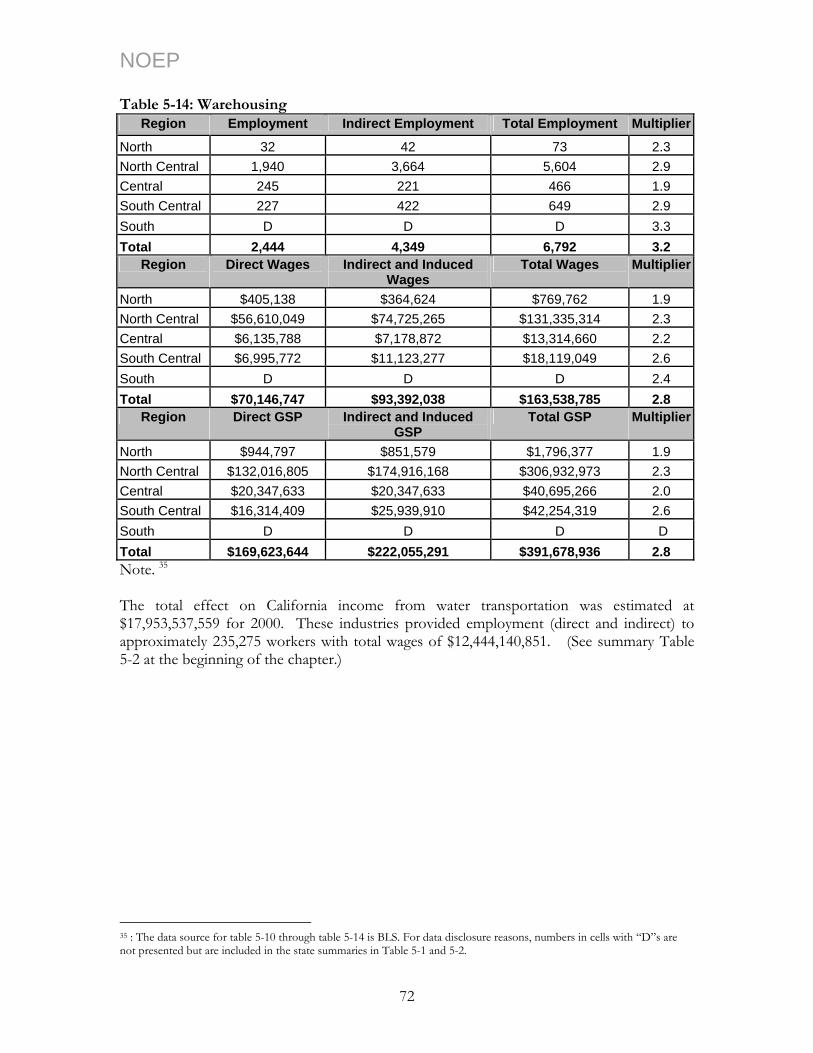
NOEP Table 5-14: Warehousing
Region Employment Indirect Employment Total Employment Multiplier
North 32 42 73 2.3 North Central 1,940 3,664 5,604 2.9 Central 245 221 466 1.9 South Central 227 422 649 2.9 South D D D 3.3 Total 2,444 4,349 6,792 3.2
Region Direct Wages Indirect and Induced Wages
Total Wages Multiplier
North $405,138 $364,624 $769,762 1.9 North Central $56,610,049 $74,725,265 $131,335,314 2.3 Central $6,135,788 $7,178,872 $13,314,660 2.2 South Central $6,995,772 $11,123,277 $18,119,049 2.6 South D D D 2.4 Total $70,146,747 $93,392,038 $163,538,785 2.8
Region Direct GSP Indirect and Induced GSP
Total GSP Multiplier
North $944,797 $851,579 $1,796,377 1.9 North Central $132,016,805 $174,916,168 $306,932,973 2.3 Central $20,347,633 $20,347,633 $40,695,266 2.0 South Central $16,314,409 $25,939,910 $42,254,319 2.6 South D D D D Total $169,623,644 $222,055,291 $391,678,936 2.8 Note. 35
The total effect on California income from water transportation was estimated at $17,953,537,559 for 2000. These industries provided employment (direct and indirect) to approximately 235,275 workers with total wages of $12,444,140,851. (See summary Table 5-2 at the beginning of the chapter.)
35 : The data source for table 5-10 through table 5-14 is BLS. For data disclosure reasons, numbers in cells with “D”s are not presented but are included in the state summaries in Table 5-1 and 5-2.
72
NOEP 5.2 References California Marine and Inter-modal Transportation System Advisory Council, 2001. US Maritime Administration, Department of Transportation, and Army Corps of Engineers,
Waterborne Commerce Statistics Center, State to State and Region to Region Commodity Tonnage, Public Domain database. Available at <http://www.Usacoe.amry.mil>.
Bureau of Labor Statistics, US Department of Labor.
73

NOEP
74
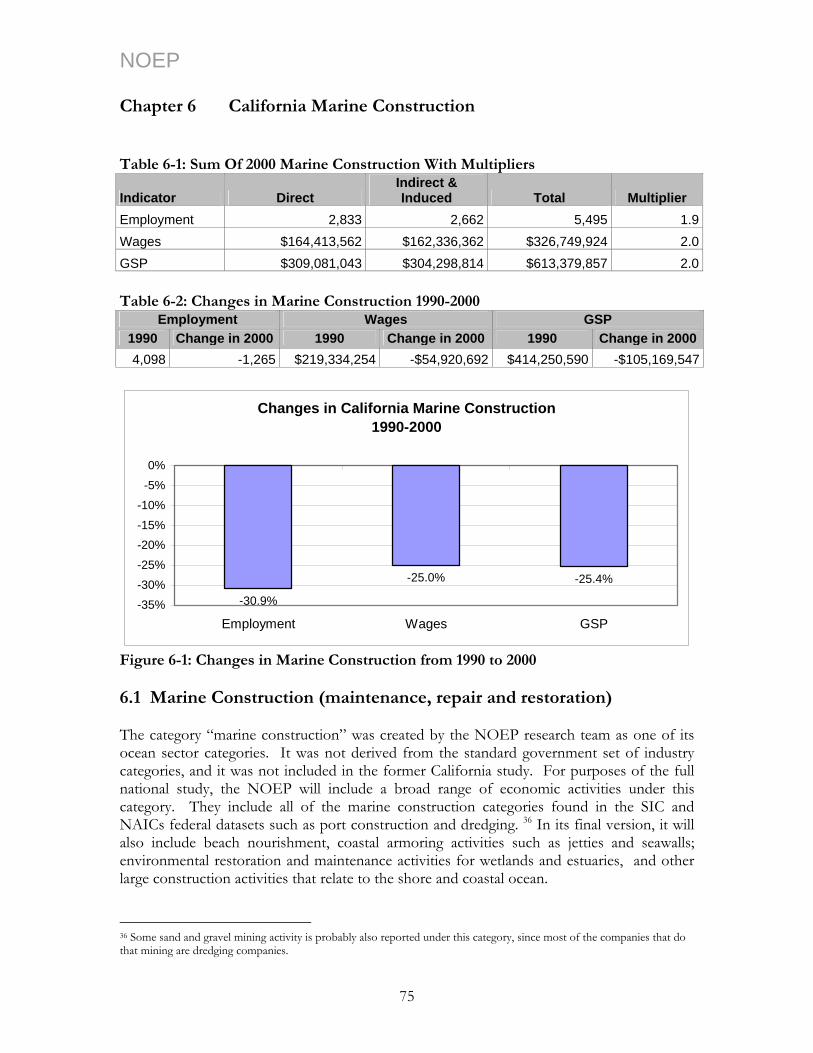
NOEP Chapter 6 California Marine Construction Table 6-1: Sum Of 2000 Marine Construction With Multipliers
Indicator Direct Indirect & Induced Total Multiplier
Employment 2,833 2,662 5,495 1.9Wages $164,413,562 $162,336,362 $326,749,924 2.0GSP $309,081,043 $304,298,814 $613,379,857 2.0 Table 6-2: Changes in Marine Construction 1990-2000
Employment Wages GSP 1990 Change in 2000 1990 Change in 2000 1990 Change in 20004,098 -1,265 $219,334,254 -$54,920,692 $414,250,590 -$105,169,547
Changes in California Marine Construction 1990-2000
-30.9%
-25.0% -25.4%
-35%
-30%
-25%
-20%-15%
-10%
-5%
0%
Employment Wages GSP
Figure 6-1: Changes in Marine Construction from 1990 to 2000 6.1 Marine Construction (maintenance, repair and restoration) The category “marine construction” was created by the NOEP research team as one of its ocean sector categories. It was not derived from the standard government set of industry categories, and it was not included in the former California study. For purposes of the full national study, the NOEP will include a broad range of economic activities under this category. They include all of the marine construction categories found in the SIC and NAICs federal datasets such as port construction and dredging. 36 In its final version, it will also include beach nourishment, coastal armoring activities such as jetties and seawalls; environmental restoration and maintenance activities for wetlands and estuaries, and other large construction activities that relate to the shore and coastal ocean. 36 Some sand and gravel mining activity is probably also reported under this category, since most of the companies that do that mining are dredging companies.
75
NOEP For purposes of this study we include only those categories found in the federal datasets for SIC and NAICs codes, primarily connected to port construction and maintenance. We have also included data from other sources to estimate the values associated with beach nourishment, a significant economic activity in California. Beach nourishment represents a large expenditure by federal, state, and local authorities, which could be interpreted to be a negative payment to compensate for the external costs of beach loss resulting from diversion of water from coastal watersheds or offshore mining of sand and gravel for example. Yet, beach nourishment expenditures also have a positive face. The provide jobs and revenue for local and state entities, in addition to stabilizing California’s valuable beaches, which are themselves a source of much revenue to the state. In most instances the benefits derived from enhancing an eroding beach are far greater than the costs of the enhancement. As for the other activities, which should be included here, but are not because of lack of reliable and consistent data, California has a number of important wetland and estuarine restoration projects underway, which contribute markedly to California’s economy, both through market and non-market values. The data on port developments and beach nourishment follow. 6.2 Port Development Port development includes construction of new facilities, modernization of existing ones, and rehabilitation of old ones. According to the US Port Development Expenditure Report, from 1946 to 2001, a total of more than $23.6 billion were spent in capital improvements to port facilities and related infrastructure across the nation.
76
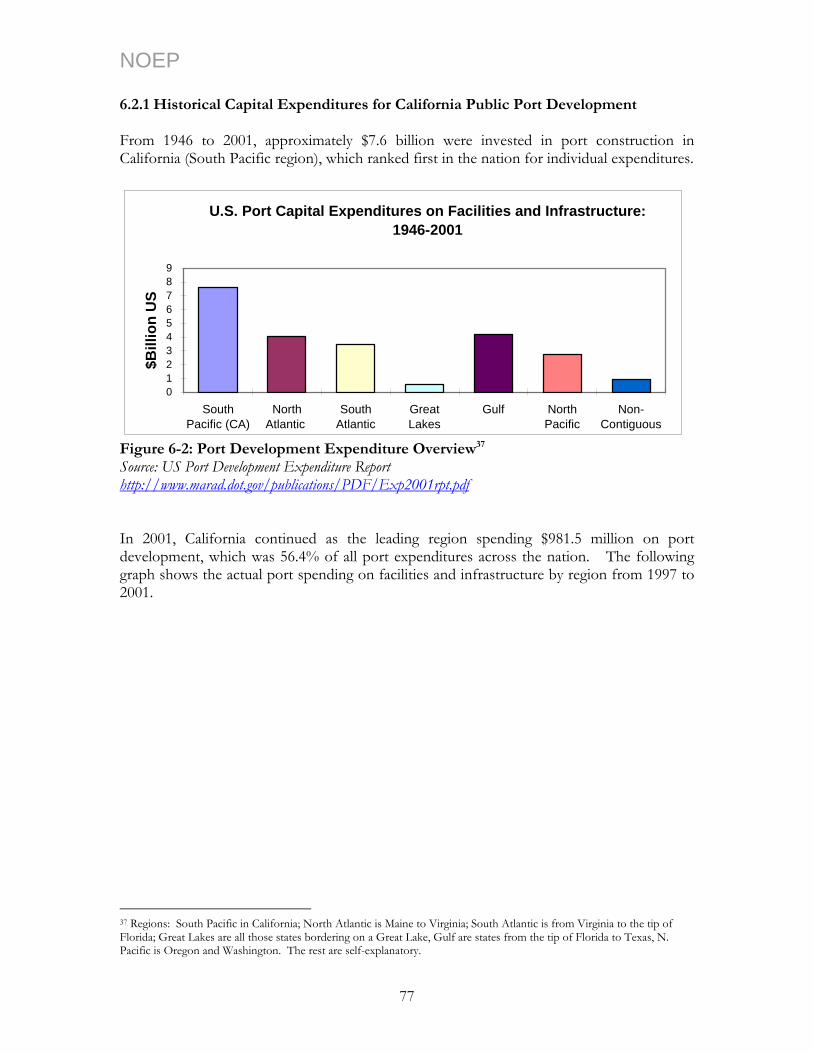
NOEP 6.2.1 Historical Capital Expenditures for California Public Port Development From 1946 to 2001, approximately $7.6 billion were invested in port construction in California (South Pacific region), which ranked first in the nation for individual expenditures.
U.S. Port Capital Expenditures on Facilities and Infrastructure: 1946-2001
0123456789
SouthPacific (CA)
NorthAtlantic
SouthAtlantic
GreatLakes
Gulf NorthPacific
Non-Contiguous
$Bill
ion
US
Figure 6-2: Port Development Expenditure Overview37
Source: US Port Development Expenditure Report http://www.marad.dot.gov/publications/PDF/Exp2001rpt.pdf In 2001, California continued as the leading region spending $981.5 million on port development, which was 56.4% of all port expenditures across the nation. The following graph shows the actual port spending on facilities and infrastructure by region from 1997 to 2001.
37 Regions: South Pacific in California; North Atlantic is Maine to Virginia; South Atlantic is from Virginia to the tip of Florida; Great Lakes are all those states bordering on a Great Lake, Gulf are states from the tip of Florida to Texas, N. Pacific is Oregon and Washington. The rest are self-explanatory.
77

NOEP
U.S. Port Capital Expenditures on Facilities and Infrastructure by Region: 1997-2001 (in Thousands of Dollars)
0
100,000
200,000
300,000
400,000
500,000
600,000
700,000
800,000
900,000
1,000,000
South Pacific (CA) $683,749 $457,309 $454,614 $263,030 $981,534
North Atlantic $95,151 $126,486 $50,893 $233,186 $176,351
South Atlantic $212,721 $306,620 $245,634 $192,567 $220,027
Great Lakes $10,792 $28,871 $4,325 $5,046 $1,000
Gulf $233,462 $193,101 $265,054 $233,160 $169,823
North Pacific $231,937 $244,612 $95,160 $130,461 $117,967
Guam, Saipan $49,113 $7,092 $0 $203 $0
AK, HI, PR, and VI $25,529 $50,306 $0 $0 $73,468
1997 1998 1999 2000 2001
Figure 6-3: Capital Expenditures for US Port Facilities and Infrastructure by Region Source: US Port Development Expenditure Report http://www.marad.dot.gov/publications/PDF/Exp2001rpt.pdf
78

NOEP
California Share of U.S. Total Capital Expenditures for 997-2001Port Development: 1
50.0%
60.0%
0.0%
10.0%
20.0%
30.0%
40.0%
1997 1998 1999 2000 2001
rt Development Expenditures, 1997-2001 Source: US Port Development Expenditure Report http://www.marad.dot.gov/publications/PDF/Exp2001rpt.pdf
Figure 6-4: California’ Share of Po
California has lead in total capital expenditure for port development across the nation. In 2001, the capital expenditure for the Port of Los Angeles alone reached $550 million. Besides Los Angeles, the Port of Long Beach and Port of Oakland invested an estimated $200 million each, which made the three California ports the three leading port authorities in terms of capital expenditure in 2001. Expansion of facilities to accommodate increasing trade with Asia, and advancing technologies to make ports more efficient have been primary drivers for these investments.
Leading Port Authorities by Capital Expenditures, 2001 (US $Millions)
Jacksonville
Tacoma
Maryland
South Carolina
0 100 200 300 400 500 600
Georgia
Houston
New York/New Jersey
Oakland
Long Beach
Los Angeles
Expenditures (Millions)
Figure 6-5: Leading US Port Authorities by Capital Expenditures, 2001 Source: US Port Development Expenditure Report http://www.marad.dot.gov/publications/PDF/Exp2001rpt.pdf
79
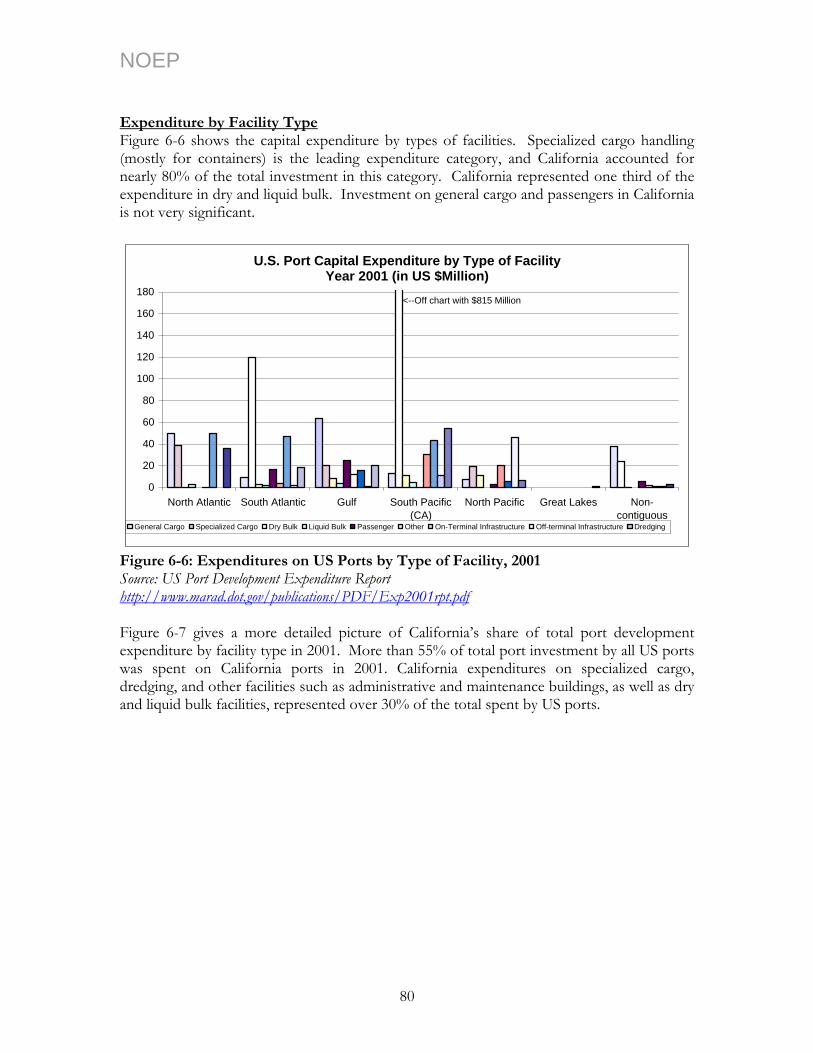
NOEP Expenditure by Facility Type Figure 6-6 shows the capital expenditure by types of facilities. Specialized cargo handling (mostly for containers) is the leading expenditure category, and California accounted for nearly 80% of the total investment in this category. California represented one third of the expenditure in dry and liquid bulk. Investment on general cargo and passengers in California is not very significant.
U.S. Port Capital Expenditure by Type of FacilityYear 2001 (in US $Million)
20
40
60
0North Atlantic South Atlantic Gulf South Pacific
(CA)North Pacific Great Lakes Non-
contiguous
80
100
120
140
160
180
General Cargo Specialized Cargo Dry Bulk Liquid Bulk Passenger Other On-Terminal Infrastructure Off-terminal Infrastructure Dredging
<--Off chart with $815 Million
ource: US Port Development Expenditure Report http://www.marad.dot.gov/publications/PDF/Exp2001rpt.pdf
Figure 6-6: Expenditures on US Ports by Type of Facility, 2001 S
Figure 6-7 gives a more detailed picture of California’s share of total port development expenditure by facility type in 2001. More than 55% of total port investment by all US ports was spent on California ports in 2001. California expenditures on specialized cargo, dredging, and other facilities such as administrative and maintenance buildings, as well as dry and liquid bulk facilities, represented over 30% of the total spent by US ports.
80
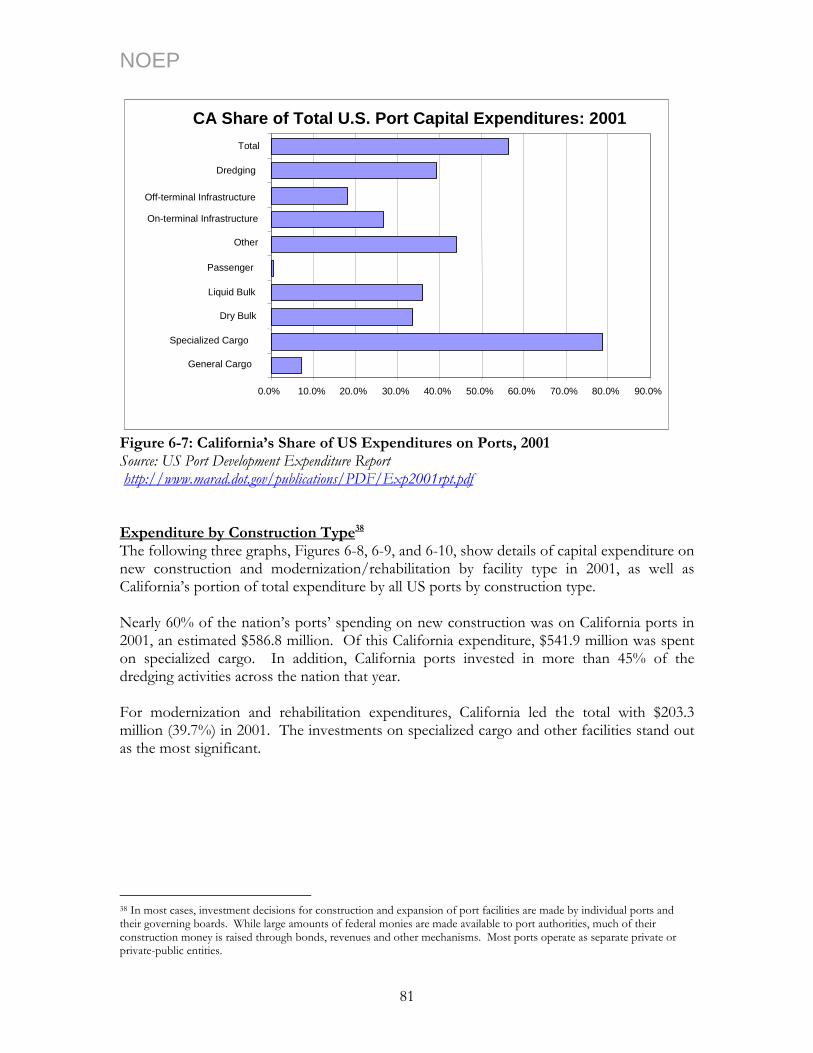
NOEP
CA Share of Total U.S. Port Capital Expenditures: 2001
0.0% 10.0% 20.0% 30.0% 40.0% 50.0% 60.0% 70.0% 80.0% 90.0%
General Cargo Specialized Cargo
Dry Bulk Liquid Bulk Passenger
Other On-terminal Infrastructure Off-terminal Infrastructure
Dredging Total
Figure 6-7: California’s Share of US Expenditures on Ports, 2001 Source: US Port Development Expenditure Report http://www.marad.dot.gov/publications/PDF/Exp2001rpt.pdf Expenditure by Construction Type38
The following three graphs, Figures 6-8, 6-9, and 6-10, show details of capital expenditure on new construction and modernization/rehabilitation by facility type in 2001, as well as California’s portion of total expenditure by all US ports by construction type. Nearly 60% of the nation’s ports’ spending on new construction was on California ports in 2001, an estimated $586.8 million. Of this California expenditure, $541.9 million was spent on specialized cargo. In addition, California ports invested in more than 45% of the dredging activities across the nation that year. For modernization and rehabilitation expenditures, California led the total with $203.3 million (39.7%) in 2001. The investments on specialized cargo and other facilities stand out as the most significant.
38 In most cases, investment decisions for construction and expansion of port facilities are made by individual ports and their governing boards. While large amounts of federal monies are made available to port authorities, much of their construction money is raised through bonds, revenues and other mechanisms. Most ports operate as separate private or private-public entities.
81
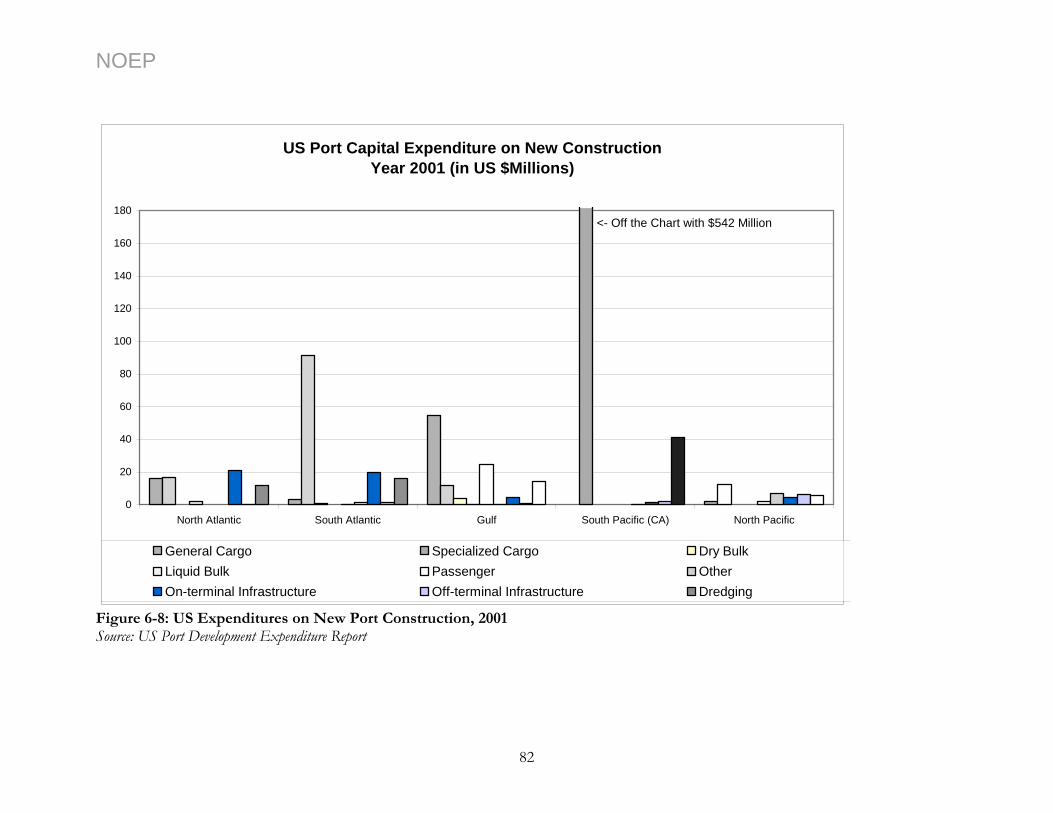
NOEP
US Port Capital Expenditure on New ConstructionYear 2001 (in US $Millions)
0
20
40
60
80
100
120
140
160
180
North Atlantic South Atlantic Gulf South Pacific (CA) North Pacific
General Cargo Specialized Cargo Dry BulkLiquid Bulk Passenger OtherOn-terminal Infrastructure Off-terminal Infrastructure Dredging
<- Off the Chart with $542 Million
Figure 6-8: US Expenditures on New Port Construction, 2001 Source: US Port Development Expenditure Report
82
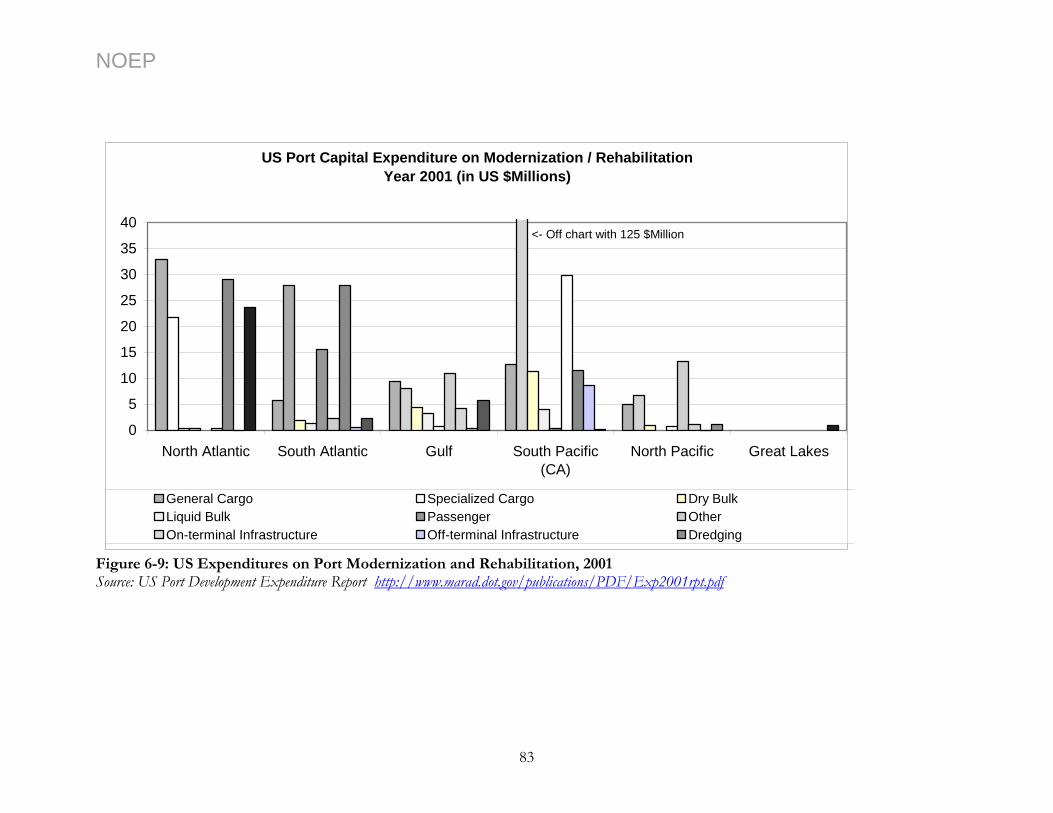
NOEP
US Port Capital Expenditure on Modernization / RehabilitationYear 2001 (in US $Millions)
0
5
10
15
20
25
30
35
40
North Atlantic South Atlantic Gulf South Pacific(CA)
North Pacific Great Lakes
General Cargo Specialized Cargo Dry BulkLiquid Bulk Passenger OtherOn-terminal Infrastructure Off-terminal Infrastructure Dredging
<- Off chart with 125 $Million
Figure 6-9: US Expenditures on Port Modernization and Rehabilitation, 2001 Source: US Port Development Expenditure Report http://www.marad.dot.gov/publications/PDF/Exp2001rpt.pdf
83
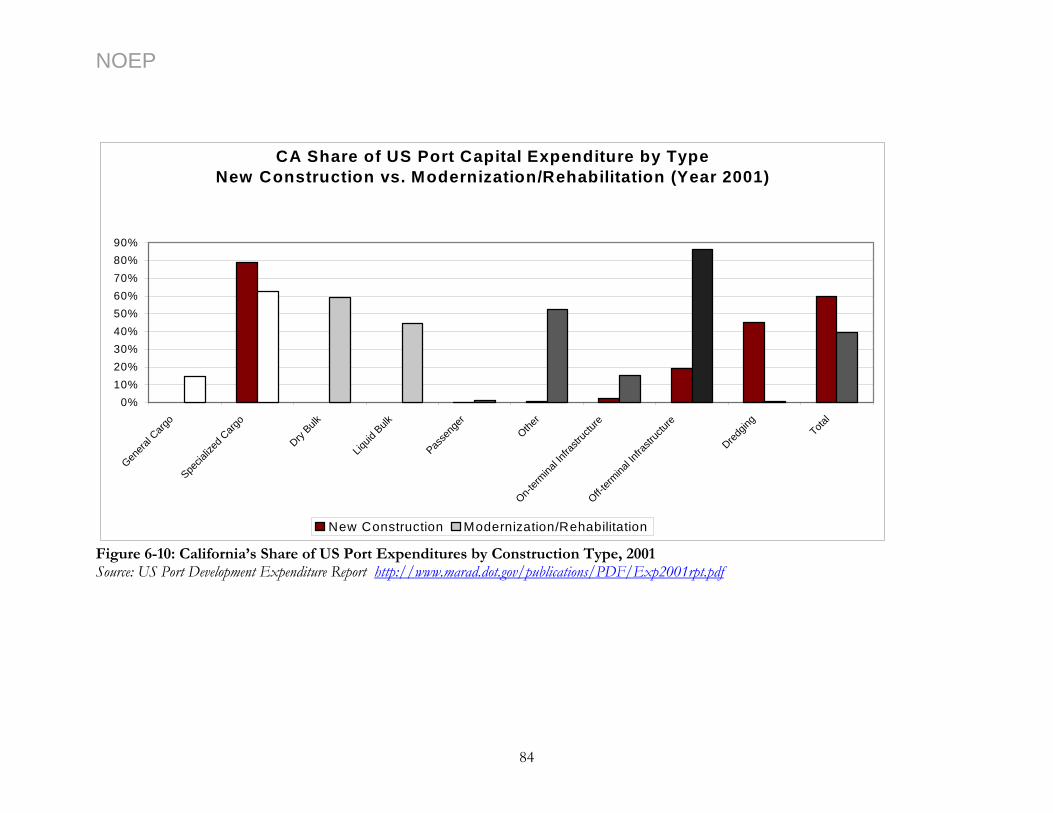
NOEP
CA Share of US Port Capital Expenditure by TypeNew Construction vs. Modernization/Rehabilitation (Year 2001)
0%10%20%30%40%50%60%70%80%90%
Genera
l Carg
oSpe
cializ
ed C
argo
Dry Bulk
Liquid
Bulk
Passe
nger
Other
On-term
inal In
frastr
uctur
eOff-t
ermina
l Infra
struc
ture
Dredgin
g
Total
New Construction Modernization/Rehabilitation
Figure 6-10: California’s Share of US Port Expenditures by Construction Type, 2001 Source: US Port Development Expenditure Report http://www.marad.dot.gov/publications/PDF/Exp2001rpt.pdf
84
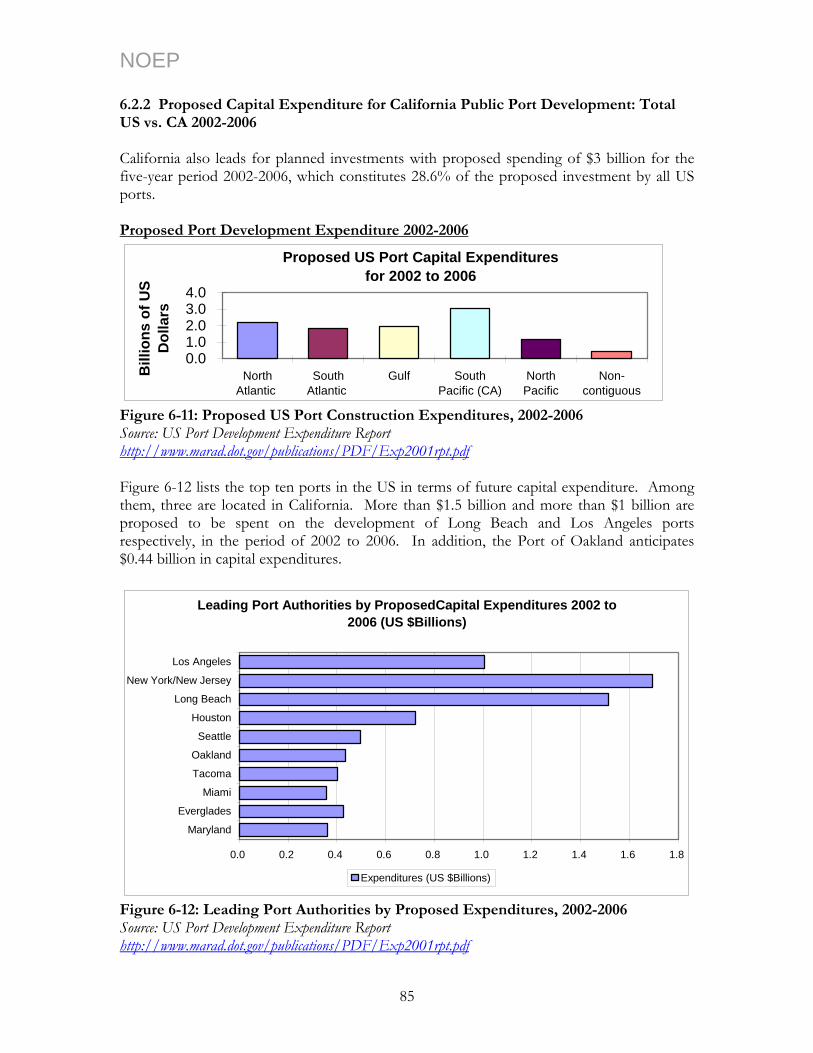
NOEP 6.2.2 Proposed Capital Expenditure for California Public Port Development: Total US vs. CA 2002-2006 California also leads for planned investments with proposed spending of $3 billion for the five-year period 2002-2006, which constitutes 28.6% of the proposed investment by all US ports. Proposed Port Development Expenditure 2002-2006
Proposed US Port Capital Expenditures for 2002 to 2006
0.01.02.03.04.0
NorthAtlantic
SouthAtlantic
Gulf SouthPacific (CA)
NorthPacific
Non-contiguous
Bill
ions
of U
S D
olla
rs
Figure 6-11: Proposed US Port Construction Expenditures, 2002-2006 Source: US Port Development Expenditure Report http://www.marad.dot.gov/publications/PDF/Exp2001rpt.pdf
Figure 6-12 lists the top ten ports in the US in terms of future capital expenditure. Among them, three are located in California. More than $1.5 billion and more than $1 billion are proposed to be spent on the development of Long Beach and Los Angeles ports respectively, in the period of 2002 to 2006. In addition, the Port of Oakland anticipates $0.44 billion in capital expenditures.
Leading Port Authorities by ProposedCapital Expenditures 2002 to 2006 (US $Billions)
0.0 0.2 0.4 0.6 0.8 1.0 1.2 1.4 1.6 1.8
Maryland
Everglades
Miami
Tacoma
Oakland
Seattle
Houston
Long Beach
New York/New Jersey
Los Angeles
Expenditures (US $Billions)
Figure 6-12: Leading Port Authorities by Proposed Expenditures, 2002-2006 Source: US Port Development Expenditure Report http://www.marad.dot.gov/publications/PDF/Exp2001rpt.pdf
85
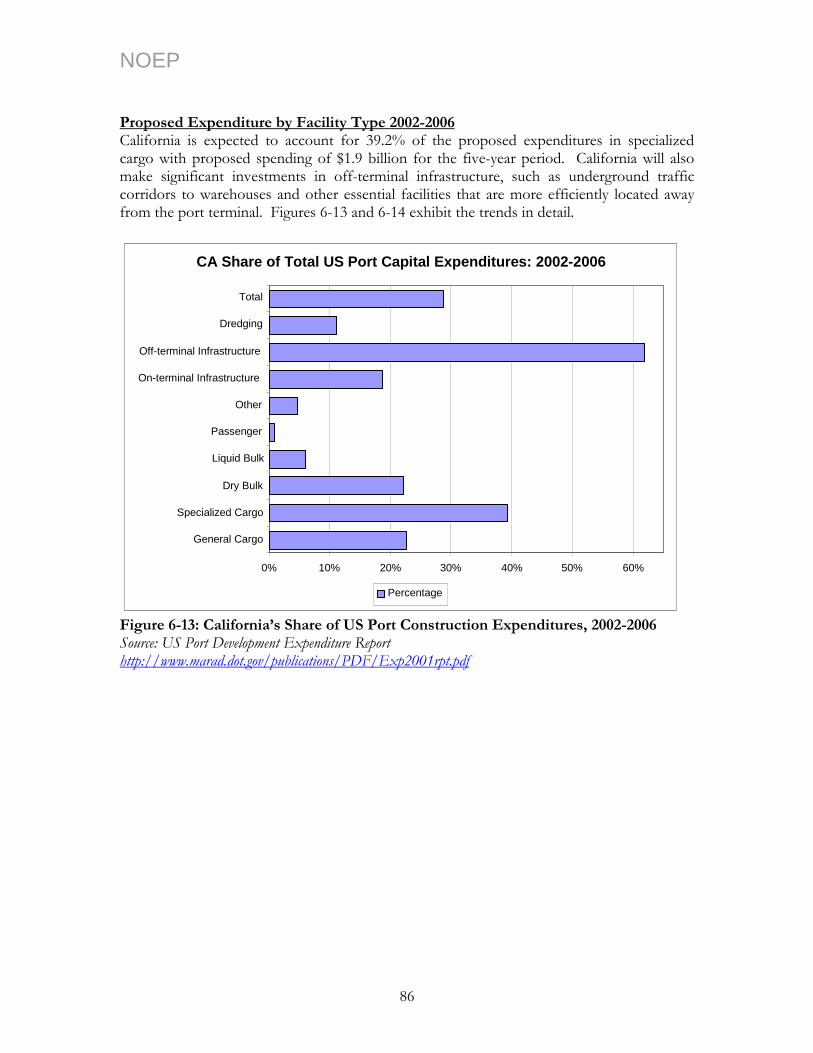
NOEP Proposed Expenditure by Facility Type 2002-2006 California is expected to account for 39.2% of the proposed expenditures in specialized cargo with proposed spending of $1.9 billion for the five-year period. California will also make significant investments in off-terminal infrastructure, such as underground traffic corridors to warehouses and other essential facilities that are more efficiently located away from the port terminal. Figures 6-13 and 6-14 exhibit the trends in detail.
CA Share of Total US Port Capital Expenditures: 2002-2006
0% 10% 20% 30% 40% 50% 60%
General Cargo
Specialized Cargo
Dry Bulk
Liquid Bulk
Passenger
Other
On-terminal Infrastructure
Off-terminal Infrastructure
Dredging
Total
Percentage
Figure 6-13: California’s Share of US Port Construction Expenditures, 2002-2006 Source: US Port Development Expenditure Report http://www.marad.dot.gov/publications/PDF/Exp2001rpt.pdf
86
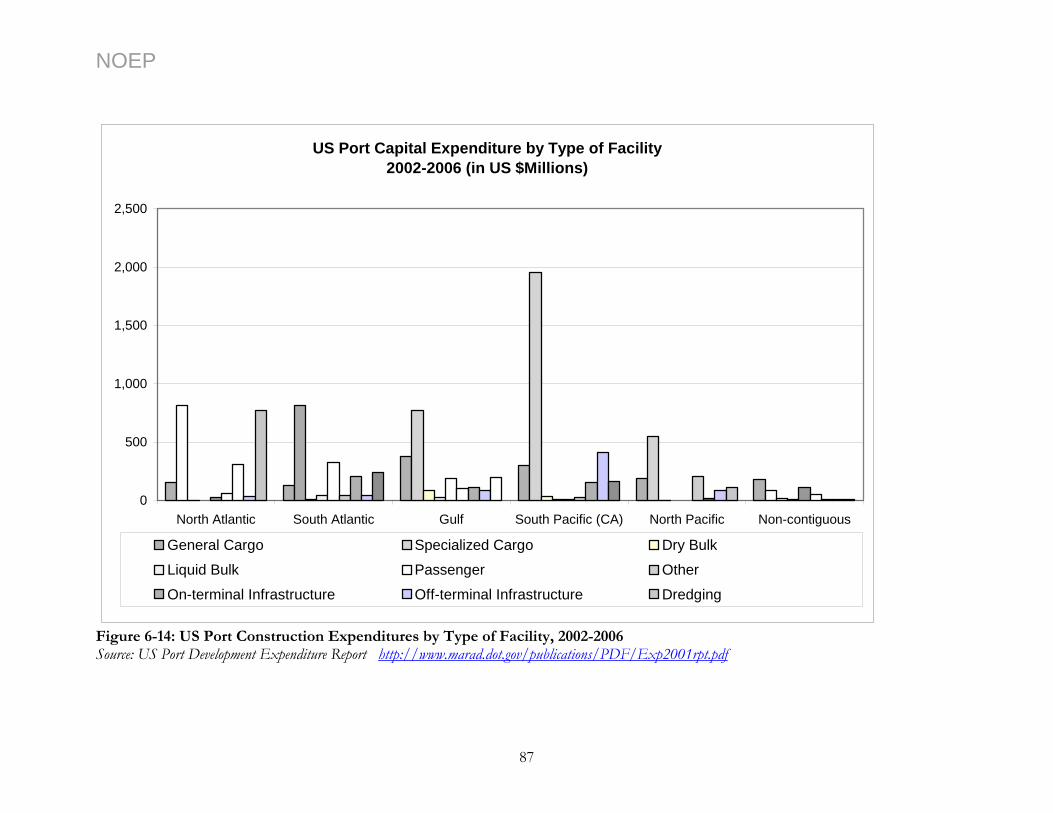
NOEP
US Port Capital Expenditure by Type of Facility2002-2006 (in US $Millions)
0
500
1,000
1,500
2,000
2,500
North Atlantic South Atlantic Gulf South Pacific (CA) North Pacific Non-contiguous
General Cargo Specialized Cargo Dry Bulk
Liquid Bulk Passenger Other
On-terminal Infrastructure Off-terminal Infrastructure Dredging
Figure 6-14: US Port Construction Expenditures by Type of Facility, 2002-2006 Source: US Port Development Expenditure Report http://www.marad.dot.gov/publications/PDF/Exp2001rpt.pdf
87
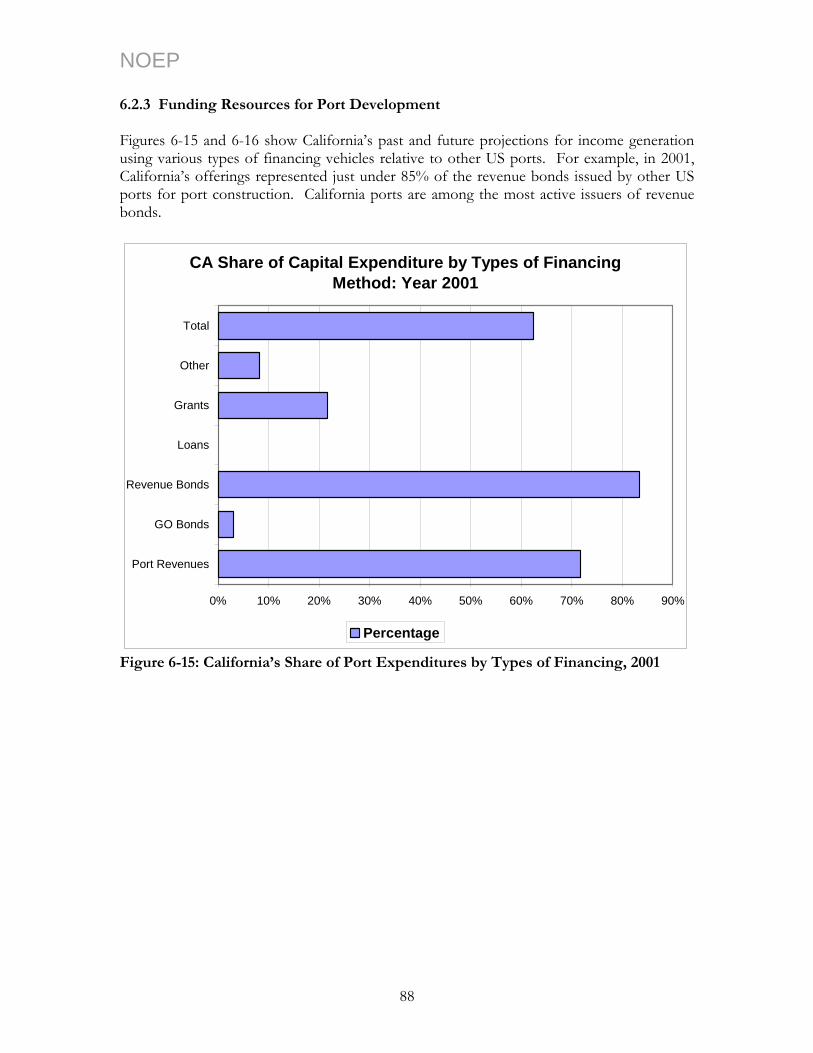
NOEP 6.2.3 Funding Resources for Port Development Figures 6-15 and 6-16 show California’s past and future projections for income generation using various types of financing vehicles relative to other US ports. For example, in 2001, California’s offerings represented just under 85% of the revenue bonds issued by other US ports for port construction. California ports are among the most active issuers of revenue bonds.
CA Share of Capital Expenditure by Types of Financing Method: Year 2001
0% 10% 20% 30% 40% 50% 60% 70% 80% 90%
Port Revenues
GO Bonds
Revenue Bonds
Loans
Grants
Other
Total
Percentage
Figure 6-15: California’s Share of Port Expenditures by Types of Financing, 2001
88
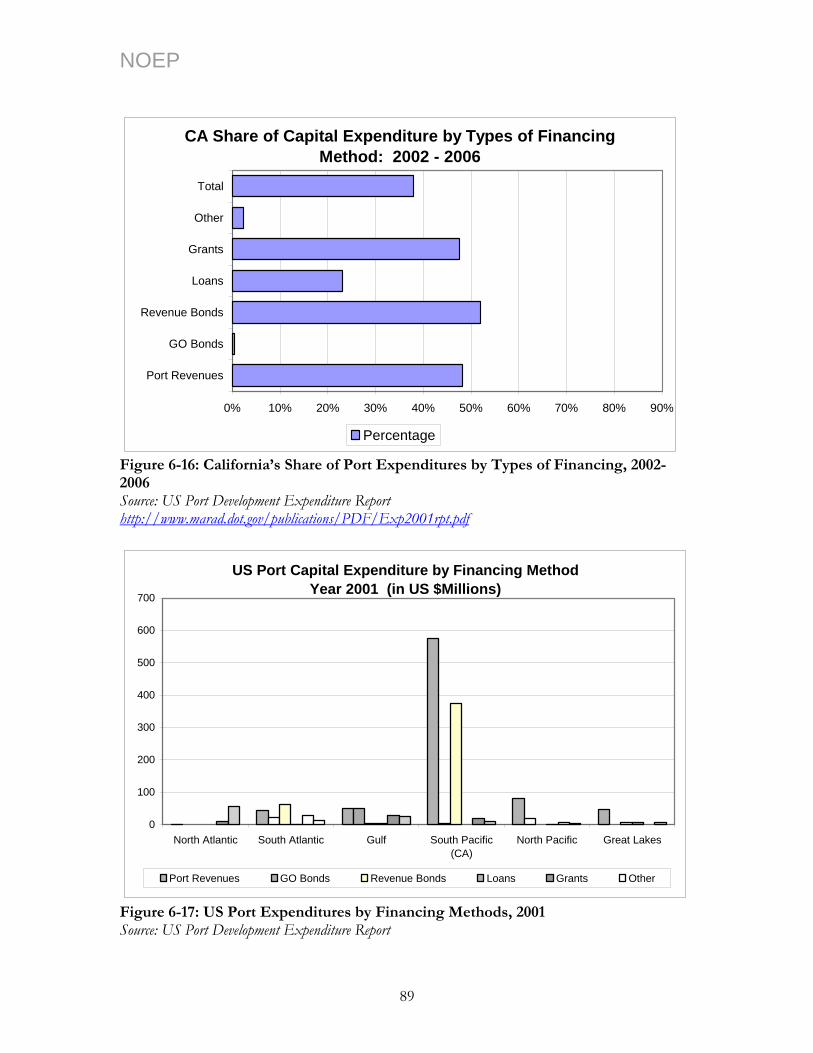
NOEP
CA Share of Capital Expenditure by Types of Financing Method: 2002 - 2006
0% 10% 20% 30% 40% 50% 60% 70% 80% 90%
Port Revenues
GO Bonds
Revenue Bonds
Loans
Grants
Other
Total
Percentage
Figure 6-16: California’s Share of Port Expenditures by Types of Financing, 2002-2006 Source: US Port Development Expenditure Report http://www.marad.dot.gov/publications/PDF/Exp2001rpt.pdf
US Port Capital Expenditure by Financing MethodYear 2001 (in US $Millions)
0
100
200
300
400
500
600
700
North Atlantic South Atlantic Gulf South Pacific(CA)
North Pacific Great Lakes
Port Revenues GO Bonds Revenue Bonds Loans Grants Other
Figure 6-17: US Port Expenditures by Financing Methods, 2001 Source: US Port Development Expenditure Report
89
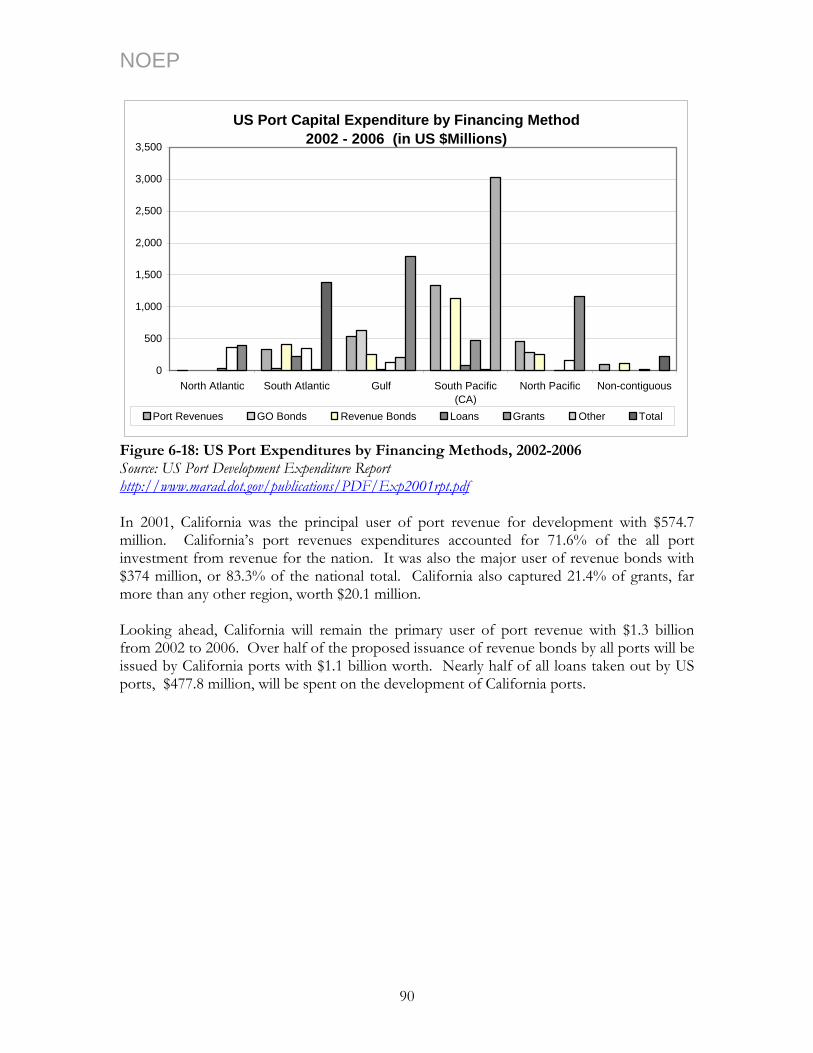
NOEP
US Port Capital Expenditure by Financing Method2002 - 2006 (in US $Millions)
0
500
1,000
1,500
2,000
2,500
3,000
3,500
North Atlantic South Atlantic Gulf South Pacific(CA)
North Pacific Non-contiguous
Port Revenues GO Bonds Revenue Bonds Loans Grants Other Total
Figure 6-18: US Port Expenditures by Financing Methods, 2002-2006 Source: US Port Development Expenditure Report http://www.marad.dot.gov/publications/PDF/Exp2001rpt.pdf In 2001, California was the principal user of port revenue for development with $574.7 million. California’s port revenues expenditures accounted for 71.6% of the all port investment from revenue for the nation. It was also the major user of revenue bonds with $374 million, or 83.3% of the national total. California also captured 21.4% of grants, far more than any other region, worth $20.1 million. Looking ahead, California will remain the primary user of port revenue with $1.3 billion from 2002 to 2006. Over half of the proposed issuance of revenue bonds by all ports will be issued by California ports with $1.1 billion worth. Nearly half of all loans taken out by US ports, $477.8 million, will be spent on the development of California ports.
90
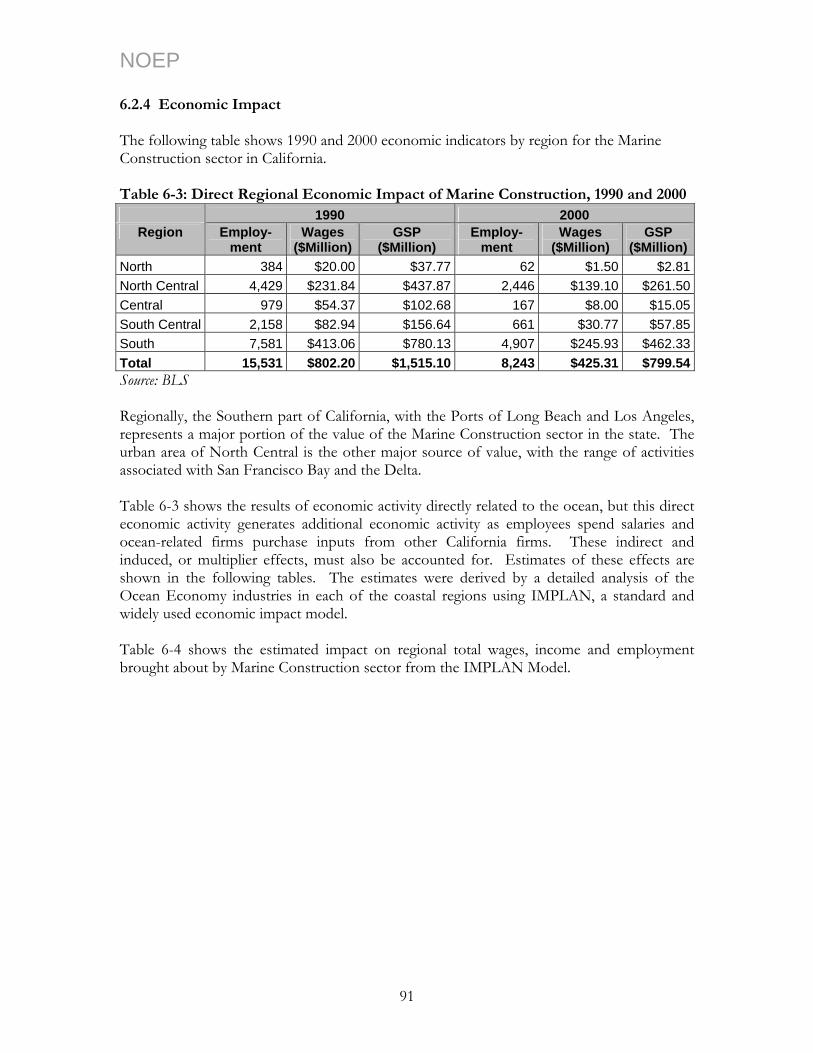
NOEP 6.2.4 Economic Impact The following table shows 1990 and 2000 economic indicators by region for the Marine Construction sector in California. Table 6-3: Direct Regional Economic Impact of Marine Construction, 1990 and 2000 1990 2000
Region Employ-ment
Wages ($Million)
GSP ($Million)
Employ-ment
Wages ($Million)
GSP ($Million)
North 384 $20.00 $37.77 62 $1.50 $2.81North Central 4,429 $231.84 $437.87 2,446 $139.10 $261.50Central 979 $54.37 $102.68 167 $8.00 $15.05South Central 2,158 $82.94 $156.64 661 $30.77 $57.85South 7,581 $413.06 $780.13 4,907 $245.93 $462.33Total 15,531 $802.20 $1,515.10 8,243 $425.31 $799.54Source: BLS Regionally, the Southern part of California, with the Ports of Long Beach and Los Angeles, represents a major portion of the value of the Marine Construction sector in the state. The urban area of North Central is the other major source of value, with the range of activities associated with San Francisco Bay and the Delta. Table 6-3 shows the results of economic activity directly related to the ocean, but this direct economic activity generates additional economic activity as employees spend salaries and ocean-related firms purchase inputs from other California firms. These indirect and induced, or multiplier effects, must also be accounted for. Estimates of these effects are shown in the following tables. The estimates were derived by a detailed analysis of the Ocean Economy industries in each of the coastal regions using IMPLAN, a standard and widely used economic impact model. Table 6-4 shows the estimated impact on regional total wages, income and employment brought about by Marine Construction sector from the IMPLAN Model.
91
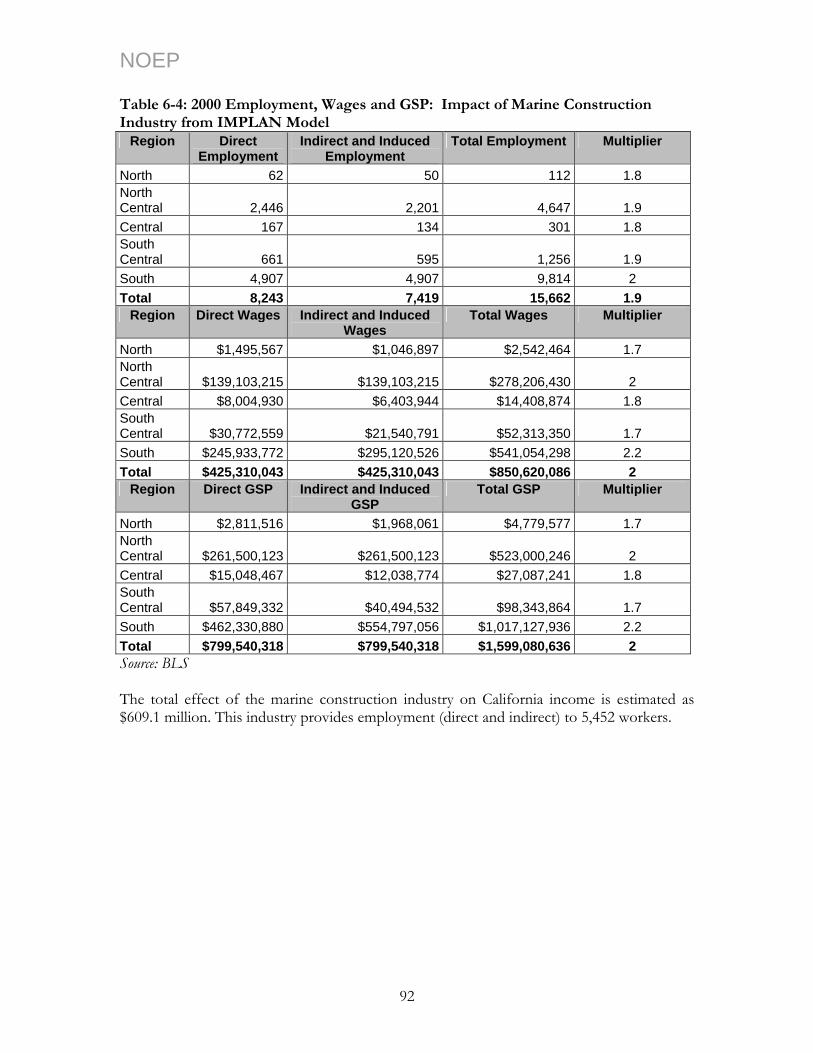
NOEP Table 6-4: 2000 Employment, Wages and GSP: Impact of Marine Construction Industry from IMPLAN Model
Region Direct Employment
Indirect and Induced Employment
Total Employment Multiplier
North 62 50 112 1.8 North Central 2,446 2,201 4,647 1.9 Central 167 134 301 1.8 South Central 661 595 1,256 1.9 South 4,907 4,907 9,814 2 Total 8,243 7,419 15,662 1.9
Region Direct Wages Indirect and Induced Wages
Total Wages Multiplier
North $1,495,567 $1,046,897 $2,542,464 1.7 North Central $139,103,215 $139,103,215 $278,206,430 2 Central $8,004,930 $6,403,944 $14,408,874 1.8 South Central $30,772,559 $21,540,791 $52,313,350 1.7 South $245,933,772 $295,120,526 $541,054,298 2.2 Total $425,310,043 $425,310,043 $850,620,086 2
Region Direct GSP Indirect and Induced GSP
Total GSP Multiplier
North $2,811,516 $1,968,061 $4,779,577 1.7 North Central $261,500,123 $261,500,123 $523,000,246 2 Central $15,048,467 $12,038,774 $27,087,241 1.8 South Central $57,849,332 $40,494,532 $98,343,864 1.7 South $462,330,880 $554,797,056 $1,017,127,936 2.2 Total $799,540,318 $799,540,318 $1,599,080,636 2 Source: BLS The total effect of the marine construction industry on California income is estimated as $609.1 million. This industry provides employment (direct and indirect) to 5,452 workers.
92
NOEP 6.3 Beach Nourishment39
In California, both intense use of coastal resources and near-shore development have significantly impacted the state’s beaches. Some beaches naturally erode, but many public beaches erode due to human activities that affect sediment supply. Dams, construction of harbor structures, coastal armoring, and offshore sand and gravel mining are among the human activities that impact sediment supply to beaches. The loss of public beaches will continue without beach restoration efforts. Environmentally, beach nourishment preserves both certain animal species and threatened plants by restoring and enhancing habitat. It also provides public safety benefits to residents and visitors by providing safer access to the water, especially for recreational swimmers and surfers. In 2000, a study of the economic benefit of specific beach projects across California was released by the Department of Boating and Waterways and the State Coastal Conservancy. A survey was conducted to collect information in the following categories: • attendance numbers and corresponding methodology used to estimate; • characteristics and duration of trips; • recreational activities and amenities involved in trips; • assessment of coastal protection and estimate of erosion and damages; • assessment of public infrastructure threatened and likelihood of damages. A summary of the costs and benefits estimated for a number of beach projects in California by the California Department of Boating and Waterways is shown in Table 6-5. The data indicate that there is substantial variation in the benefits and costs of such projects, but that benefits based on the basis of beach visits and visitor expenditures often substantially exceed costs.
39.. The process of replenishing a beach by artificial means; e.g., by the depositions of dredged materials, also called beach replenishment or beach feeding. For this study, we also include additional activities for stabilization of beaches and natural beach systems.
93
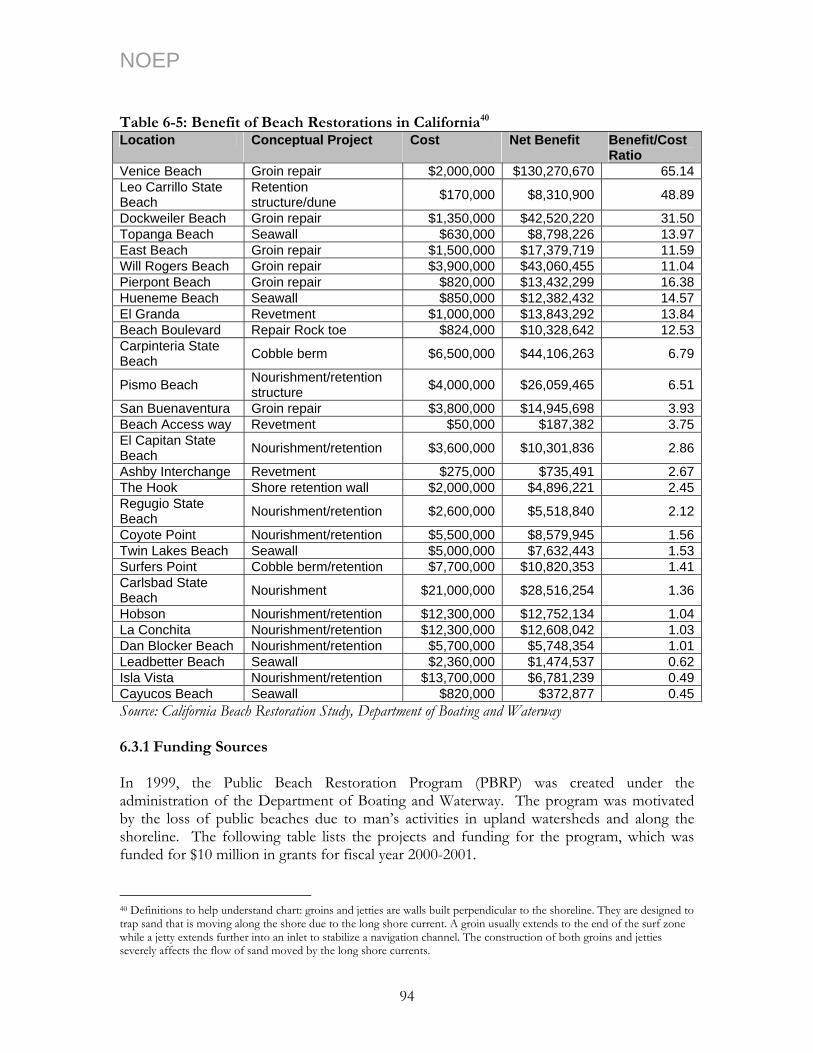
NOEP Table 6-5: Benefit of Beach Restorations in California40
Location Conceptual Project Cost Net Benefit Benefit/Cost Ratio
Venice Beach Groin repair $2,000,000 $130,270,670 65.14Leo Carrillo State Beach
Retention structure/dune $170,000 $8,310,900 48.89
Dockweiler Beach Groin repair $1,350,000 $42,520,220 31.50Topanga Beach Seawall $630,000 $8,798,226 13.97East Beach Groin repair $1,500,000 $17,379,719 11.59Will Rogers Beach Groin repair $3,900,000 $43,060,455 11.04Pierpont Beach Groin repair $820,000 $13,432,299 16.38Hueneme Beach Seawall $850,000 $12,382,432 14.57El Granda Revetment $1,000,000 $13,843,292 13.84Beach Boulevard Repair Rock toe $824,000 $10,328,642 12.53Carpinteria State Beach Cobble berm $6,500,000 $44,106,263 6.79
Pismo Beach Nourishment/retention structure $4,000,000 $26,059,465 6.51
San Buenaventura Groin repair $3,800,000 $14,945,698 3.93Beach Access way Revetment $50,000 $187,382 3.75El Capitan State Beach Nourishment/retention $3,600,000 $10,301,836 2.86
Ashby Interchange Revetment $275,000 $735,491 2.67The Hook Shore retention wall $2,000,000 $4,896,221 2.45Regugio State Beach Nourishment/retention $2,600,000 $5,518,840 2.12
Coyote Point Nourishment/retention $5,500,000 $8,579,945 1.56Twin Lakes Beach Seawall $5,000,000 $7,632,443 1.53Surfers Point Cobble berm/retention $7,700,000 $10,820,353 1.41Carlsbad State Beach Nourishment $21,000,000 $28,516,254 1.36
Hobson Nourishment/retention $12,300,000 $12,752,134 1.04La Conchita Nourishment/retention $12,300,000 $12,608,042 1.03Dan Blocker Beach Nourishment/retention $5,700,000 $5,748,354 1.01Leadbetter Beach Seawall $2,360,000 $1,474,537 0.62Isla Vista Nourishment/retention $13,700,000 $6,781,239 0.49Cayucos Beach Seawall $820,000 $372,877 0.45Source: California Beach Restoration Study, Department of Boating and Waterway 6.3.1 Funding Sources In 1999, the Public Beach Restoration Program (PBRP) was created under the administration of the Department of Boating and Waterway. The program was motivated by the loss of public beaches due to man’s activities in upland watersheds and along the shoreline. The following table lists the projects and funding for the program, which was funded for $10 million in grants for fiscal year 2000-2001. 40 Definitions to help understand chart: groins and jetties are walls built perpendicular to the shoreline. They are designed to trap sand that is moving along the shore due to the long shore current. A groin usually extends to the end of the surf zone while a jetty extends further into an inlet to stabilize a navigation channel. The construction of both groins and jetties severely affects the flow of sand moved by the long shore currents.
94
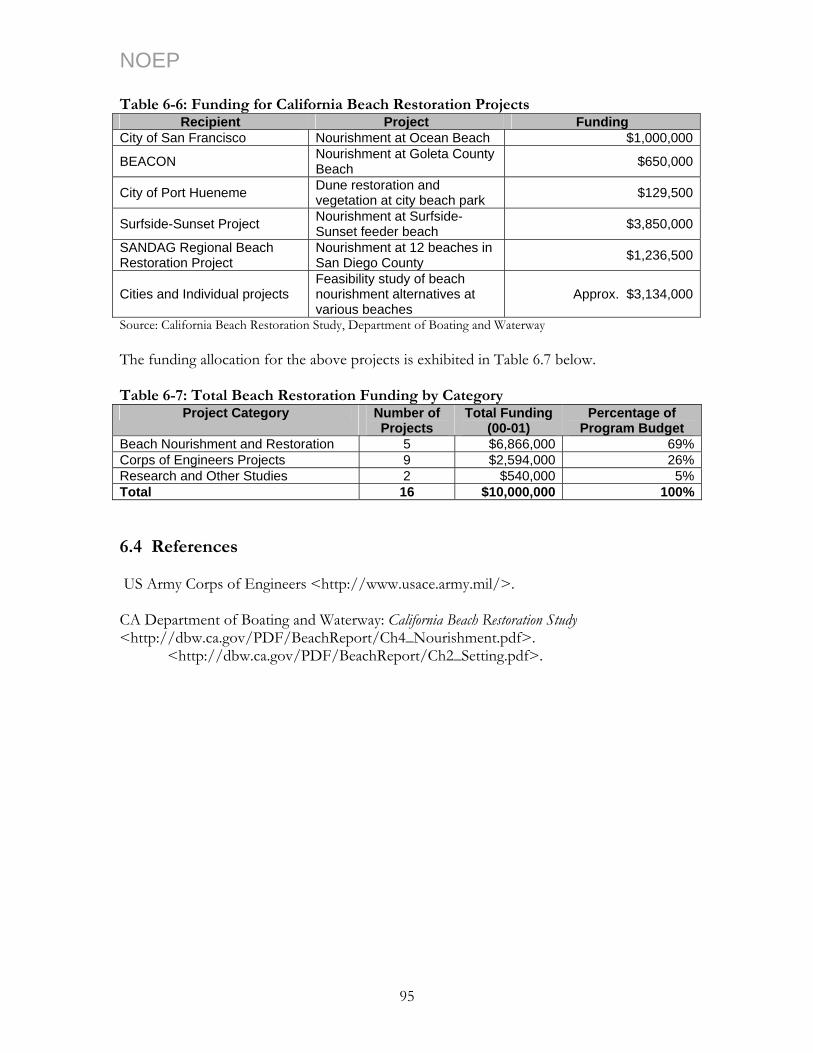
NOEP Table 6-6: Funding for California Beach Restoration Projects
Recipient Project Funding City of San Francisco Nourishment at Ocean Beach $1,000,000
BEACON Nourishment at Goleta County Beach $650,000
City of Port Hueneme Dune restoration and vegetation at city beach park $129,500
Surfside-Sunset Project Nourishment at Surfside-Sunset feeder beach $3,850,000
SANDAG Regional Beach Restoration Project
Nourishment at 12 beaches in San Diego County $1,236,500
Cities and Individual projects Feasibility study of beach nourishment alternatives at various beaches
Approx. $3,134,000
Source: California Beach Restoration Study, Department of Boating and Waterway The funding allocation for the above projects is exhibited in Table 6.7 below. Table 6-7: Total Beach Restoration Funding by Category
Project Category Number of Projects
Total Funding (00-01)
Percentage of Program Budget
Beach Nourishment and Restoration 5 $6,866,000 69%Corps of Engineers Projects 9 $2,594,000 26%Research and Other Studies 2 $540,000 5%Total 16 $10,000,000 100% 6.4 References US Army Corps of Engineers <http://www.usace.army.mil/>. CA Department of Boating and Waterway: California Beach Restoration Study <http://dbw.ca.gov/PDF/BeachReport/Ch4_Nourishment.pdf>.
<http://dbw.ca.gov/PDF/BeachReport/Ch2_Setting.pdf>.
95

NOEP
96

NOEP Chapter 7: California Ship & Boat Building Table 7-1 Summary of California Ship & Boat Building and Repair Industry in 2000
Industry Employment Wages GSP Boat Building & Repair 4,033 $126,378,329 $165,028,160Ship Building & Repair 6,523 $251,264,488 $328,107,805Total 10,557 $377,642,817 $493,135,966 Table 7-2 Summary of Ship and Boat Building & Repair with Multipliers for 2000
Indicator Direct Indirect & Induced Total Multiplier
Employment 10,557 8,639 19,196 1.8Wages $377,642,817 $308,890,473 $686,533,290 1.8GSP $493,135,966 $403,357,340 $896,493,306 1.8 Table 7-3: Changes in Direct Economy of California Ship & Boat Building and Repair 1990-2000
Employment Wages (millions) GSP (millions)
Industry 1990 Change in 2000
1990 Change in 2000
1990 Change in 2000
Boat Building and Repair 3,256 777 $97.71 $28.67 $116.68 $48.34Ship Building and Repair 22,593 -16,070 $975.73 -$724.46 $1,165.27 -$837.16Total 25,849 -15,292 $1,073.43 -$695.79 $1,281.95 -$788.81
Changes in California Ship and Boat Building & Repair 1990-2000
23.9%
-59.2%
41.4%
-61.5%
-71.1%
-64.8%-74.3%
29.4%
-71.8%
-100%
-80%
-60%
-40%
-20%
0%
20%
40%
60%
Boat Building & Repair Ship Building & Repair Total
Industry
Employ-mentWages
GSP
Figure 7-1: Change in Ship & Boat Building and Repair from 1990 to 2000
97
NOEP 7.1 Ship & Boat Building and Repair: Description of the Sector The shipbuilding and repair industry builds and repairs ships, barges and other large vessels, whether self-propelled or towed by other craft. This industry also includes the conversion and alteration of ships and a portion of the manufacture of offshore oil and gas drilling and production platforms. The boat building and repair industry is engaged in the manufacturing and repairing of smaller non-ocean going vessels primarily used for recreation, fishing, and personal transport Unlike most other industries, only a small number of orders for large ships are received each year, and these often take years to fill. The orders for shipbuilding and repairs are primarily placed by large shipping, passenger and cruise, ferry, petrochemical, commercial fishing, and towing and tugboat companies, or the federal government. The principal federal government agencies placing ship building and repair orders include the Naval Sea System Command, the Military Sealift Command, the Army Corps of Engineers, the US Coast Guard, the National Oceanic and Atmospheric Administration, the National Science Foundation and the Maritime Administration. The boat building and repair industry is almost entirely privately owned and is characterized by a very large number of buyers with varied tastes and a larger number of producers with varied product ranges. The US ship building and repair industry is primarily devoted to building ships for the US Navy and a small number of commercial shipping companies. The industry reached its peak output in the mid-1970s, when it held a significant portion of the international commercial market while maintaining its ability to supply military orders. Since then, new ship construction, the number of ship building and repair yards, and overall industry employment have decreased sharply, particularly since the end of the major naval buildup of the 1980’s. This decline came on top of a severe drop in the construction of new vessels, which fell from about 77 ships (1,000 gross tons or more) per year in the mid-1970s to only about eight ships through the late 1980s and 1990s. Smaller shipyards have been able to keep much of their mainly commercial market share, since these shipyards build vessels used on the inland and coastal waterways, which, by law, must be built in the US. 7.2 Ship & Boat Building in California
California was a major ship builder during World War II, when the Richmond and other shipyards were flourishing.41 The ship building industry in California is heavily dependent on the federal government as its primary market. The Navy’s new ship procurement has declined since the accelerated Navy ship construction in the 1980s. First tier shipyards may face the possibility of closure. The General Dynamics National Steel and Shipbuilding Co. (NASSCO) in San Diego CA is the biggest private shipyard on the West coast and employed more than 3000 people in 2000. Over the last four decades, NASSCO has delivered over 100 ships to the world's fleets -- 53 ships to commercial customers, becoming America's leading commercial shipbuilder during that period; and 53 auxiliary and support ships for the US Navy. These have included oil tankers, ferries, containerships, and oceanographic
41 Comments by G. Pontecorvo for review of this document.
98
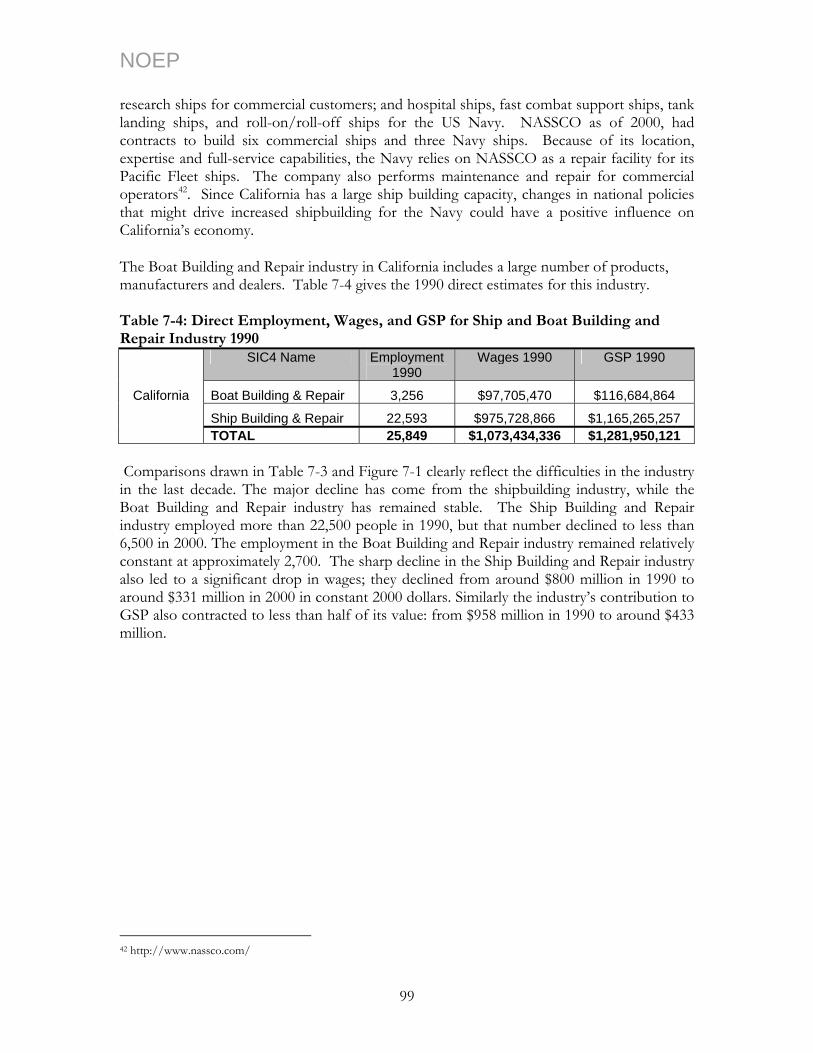
NOEP research ships for commercial customers; and hospital ships, fast combat support ships, tank landing ships, and roll-on/roll-off ships for the US Navy. NASSCO as of 2000, had contracts to build six commercial ships and three Navy ships. Because of its location, expertise and full-service capabilities, the Navy relies on NASSCO as a repair facility for its Pacific Fleet ships. The company also performs maintenance and repair for commercial operators42. Since California has a large ship building capacity, changes in national policies that might drive increased shipbuilding for the Navy could have a positive influence on California’s economy.
The Boat Building and Repair industry in California includes a large number of products, manufacturers and dealers. Table 7-4 gives the 1990 direct estimates for this industry. Table 7-4: Direct Employment, Wages, and GSP for Ship and Boat Building and Repair Industry 1990
SIC4 Name Employment 1990
Wages 1990 GSP 1990
Boat Building & Repair 3,256 $97,705,470 $116,684,864
Ship Building & Repair 22,593 $975,728,866 $1,165,265,257
California
TOTAL 25,849 $1,073,434,336 $1,281,950,121
Comparisons drawn in Table 7-3 and Figure 7-1 clearly reflect the difficulties in the industry in the last decade. The major decline has come from the shipbuilding industry, while the Boat Building and Repair industry has remained stable. The Ship Building and Repair industry employed more than 22,500 people in 1990, but that number declined to less than 6,500 in 2000. The employment in the Boat Building and Repair industry remained relatively constant at approximately 2,700. The sharp decline in the Ship Building and Repair industry also led to a significant drop in wages; they declined from around $800 million in 1990 to around $331 million in 2000 in constant 2000 dollars. Similarly the industry’s contribution to GSP also contracted to less than half of its value: from $958 million in 1990 to around $433 million.
42 http://www.nassco.com/
99
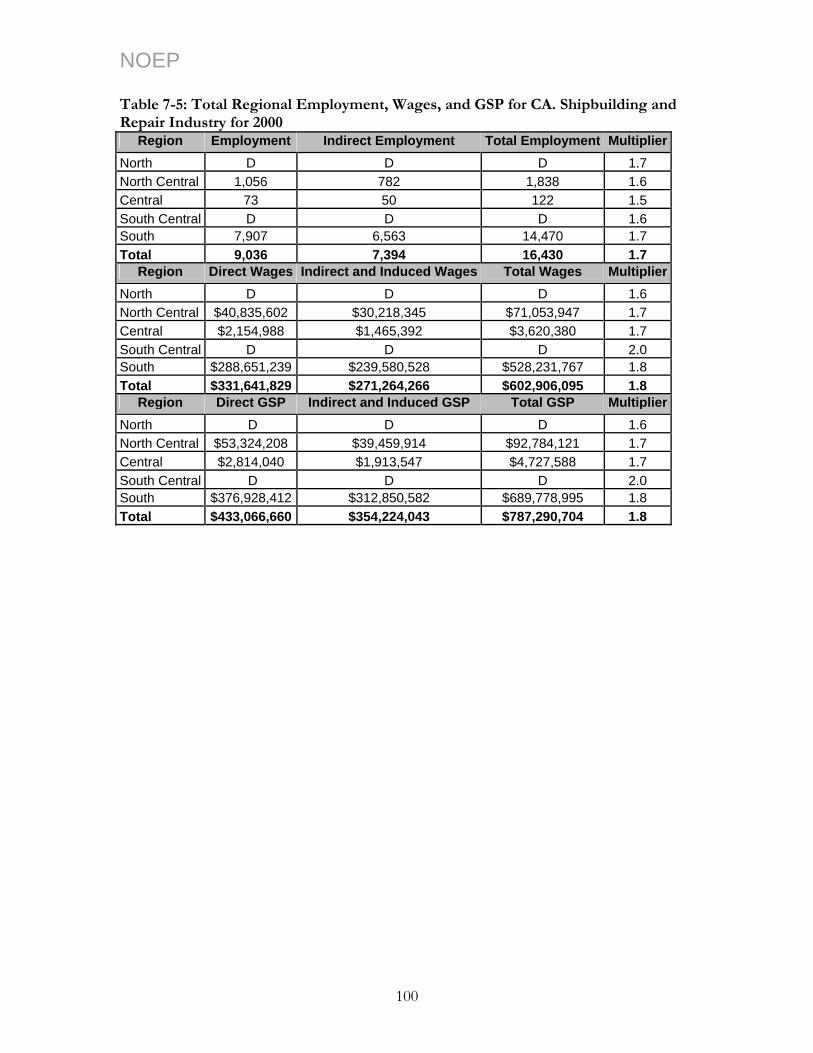
NOEP Table 7-5: Total Regional Employment, Wages, and GSP for CA. Shipbuilding and Repair Industry for 2000
Region Employment Indirect Employment Total Employment MultiplierNorth D D D 1.7 North Central 1,056 782 1,838 1.6 Central 73 50 122 1.5 South Central D D D 1.6 South 7,907 6,563 14,470 1.7 Total 9,036 7,394 16,430 1.7
Region Direct Wages Indirect and Induced Wages Total Wages MultiplierNorth D D D 1.6 North Central $40,835,602 $30,218,345 $71,053,947 1.7 Central $2,154,988 $1,465,392 $3,620,380 1.7 South Central D D D 2.0 South $288,651,239 $239,580,528 $528,231,767 1.8 Total $331,641,829 $271,264,266 $602,906,095 1.8
Region Direct GSP Indirect and Induced GSP Total GSP MultiplierNorth D D D 1.6 North Central $53,324,208 $39,459,914 $92,784,121 1.7 Central $2,814,040 $1,913,547 $4,727,588 1.7 South Central D D D 2.0 South $376,928,412 $312,850,582 $689,778,995 1.8 Total $433,066,660 $354,224,043 $787,290,704 1.8
100
NOEP 7.3 References CA Employment Development Department http://www.calmis.ca.gov/
CA Department of Boating and Waterway http://dbw.ca.gov/PDF/BeachReport/Ch4_Nourishment.pdf
Maritime Administration, US Department of Transportation
<http://www.marad.dot.gov/publications/index.html>. National Steel and Shipbuilding Co <http://www.nassco.com/>. US Army Corps of Engineers, Navigation Data Center
<http://www.iwr.usace.army.mil/ndc/wcsc/wcsc.htm>. California Research Bureau 1994 Report: Economic Assessment of Ocean-Dependent
Activities.
101

NOEP
102
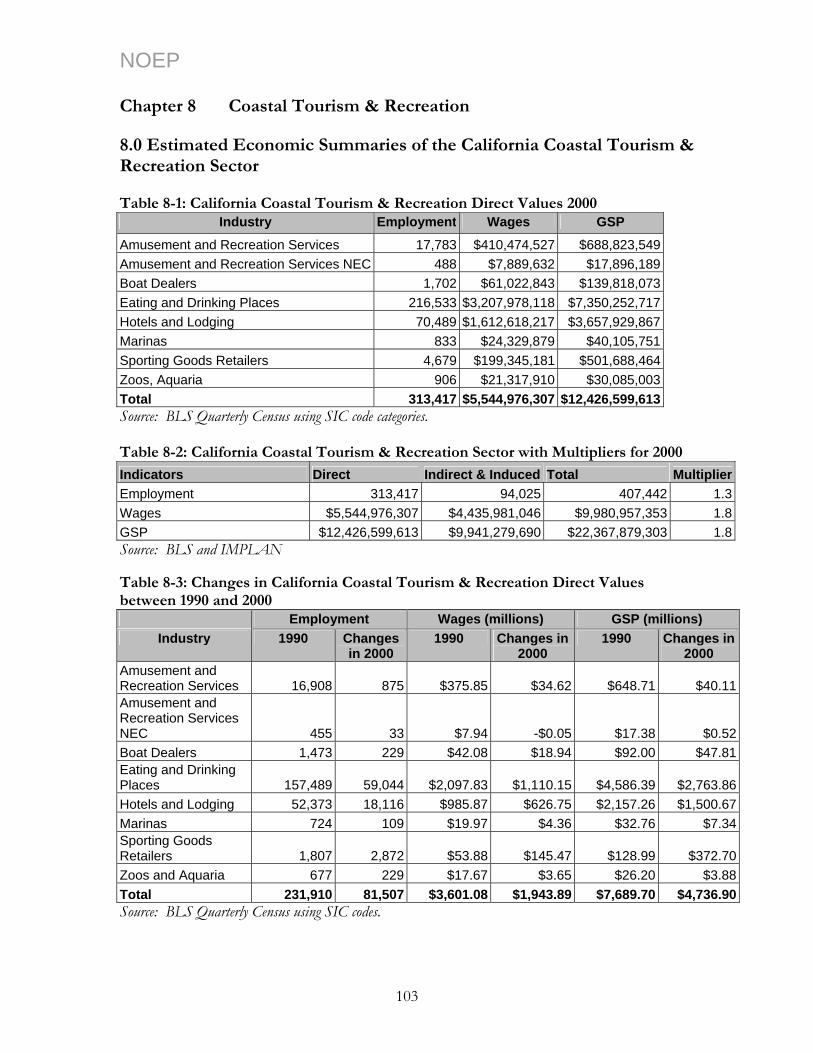
NOEP Chapter 8 Coastal Tourism & Recreation
8.0 Estimated Economic Summaries of the California Coastal Tourism & Recreation Sector Table 8-1: California Coastal Tourism & Recreation Direct Values 2000
Industry Employment Wages GSP Amusement and Recreation Services 17,783 $410,474,527 $688,823,549Amusement and Recreation Services NEC 488 $7,889,632 $17,896,189Boat Dealers 1,702 $61,022,843 $139,818,073Eating and Drinking Places 216,533 $3,207,978,118 $7,350,252,717Hotels and Lodging 70,489 $1,612,618,217 $3,657,929,867Marinas 833 $24,329,879 $40,105,751Sporting Goods Retailers 4,679 $199,345,181 $501,688,464Zoos, Aquaria 906 $21,317,910 $30,085,003Total 313,417 $5,544,976,307 $12,426,599,613Source: BLS Quarterly Census using SIC code categories. Table 8-2: California Coastal Tourism & Recreation Sector with Multipliers for 2000
Indicators Direct Indirect & Induced Total MultiplierEmployment 313,417 94,025 407,442 1.3Wages $5,544,976,307 $4,435,981,046 $9,980,957,353 1.8GSP $12,426,599,613 $9,941,279,690 $22,367,879,303 1.8Source: BLS and IMPLAN Table 8-3: Changes in California Coastal Tourism & Recreation Direct Values between 1990 and 2000
Employment Wages (millions) GSP (millions) Industry 1990 Changes
in 2000 1990 Changes in
2000 1990 Changes in
2000 Amusement and Recreation Services 16,908 875 $375.85 $34.62 $648.71 $40.11Amusement and Recreation Services NEC 455 33 $7.94 -$0.05 $17.38 $0.52Boat Dealers 1,473 229 $42.08 $18.94 $92.00 $47.81Eating and Drinking Places 157,489 59,044 $2,097.83 $1,110.15 $4,586.39 $2,763.86Hotels and Lodging 52,373 18,116 $985.87 $626.75 $2,157.26 $1,500.67Marinas 724 109 $19.97 $4.36 $32.76 $7.34Sporting Goods Retailers 1,807 2,872 $53.88 $145.47 $128.99 $372.70Zoos and Aquaria 677 229 $17.67 $3.65 $26.20 $3.88Total 231,910 81,507 $3,601.08 $1,943.89 $7,689.70 $4,736.90Source: BLS Quarterly Census using SIC codes.
103

NOEP
Changes in California Tourism & Recreation 1990-2000
-0.7%
63.6%
35.2%33.8%
158.9%
15.1%34.6%37.5%15.6%7.3%
5.2%
270.0%
54.0%20.7%21.8%
52.9%45.0%
9.2%
61.6%
288.9%
22.4%
69.6%60.3%52.0%
3.0%6.2% 14.8%
-50%
0%
50%
100%
150%
200%
250%
300%
350%
Amusementand Recreation
Services
Amusementand RecreationServices NEC
Boat Dealers Eating andDrinkingPlaces
Hotels andLodging
Marinas SportingGoods
Retailers
Zoos andAquaria
Total
IndustryEmployment Wages GSP
Figure 8-1: Changes in California Coastal Tourism & Recreation from 1990 to 2000 Source: BLS 8.1 California Coastal Tourism & Recreation: Scope, Scale and Definition In this report, the “Coastal Tourism & Recreation” sector includes the full range of tourism, leisure, and recreational activities that take place in coastal areas and in offshore coastal waters. These include the hotel and restaurant industry, marinas, the coastal water sports industry, recreational boating harbors, recreational fishing facilities and stores, beaches, and retail businesses. We also include ecotourism and recreational activities such as recreational boating, swimming, recreational fishing, surfing, kayaking, diving and snorkeling. This chapter reveals estimates of the market and non-market use value of ocean related tourism and recreational activities in California. (See Appendix A, “Methodology” non-market section for more detail on the methodology used to derive market and non-market values.) California is the number one travel destination in the US. The total California tourism industry annually generates more than $75 billion in direct travel spending for the state economy, and supports more than 1 million jobs, which makes it the 3rd largest employer and 5th largest contributor to the state’s GSP43. World famous sandy beaches and favorable weather conditions of Southern California make Coastal Tourism & Recreation an important component of California’s economy in general, and the overall tourism industry of the state in particular. Coastal Tourism & Recreation has been the fastest growing activity, both in
43 California Tourism’s Contribution to the California Economy: 1998-2002, <http://www.gocalif.gov/state/tourism/tour_html>
104
NOEP volume and diversity, along the coastal zone44. As of 2000, it was one of the major growth engines not only for the coastal counties, but also for the entire state. Tourism and recreation-related economic activities are shaping development patterns in the coastal zone, which account for a major share of population and economic activities. 45 Coastal tourism also makes California’s position competitive in international tourism as studies have shown that beaches are the leading international tourist destination. 46
Summary Tables 8-1, 8-2, and 8-3 show what a large influence California’s Coastal Tourism & Recreation sector has had on the state. While its economic contribution was quite significant in 2000, its growth in the decade 1990-2000 was even more significant - far larger than any other Ocean Economy sector in California with a GSP increase of almost 62%, a wage increase of 55%, and an employment increase of more than 35%. In fact, its decadal growth kept the California Ocean Economy sector in positive numbers during that decade. Without Tourism & Recreation, there would have been a large net loss in all columns. Understanding the role that California’s ocean and coasts play in Tourism & Recreation, and estimating its value to the state is not a simple task. The NOEP has divided this chapter into three sections to untangle some of this complexity. First, we define coastal recreation and its scope and scale. This data is not captured in the market data, and so could be added with some degree of reliability. Within this section, the reader will find a brief paper estimating both market and non-market values for all of California’s beaches, a number that is as high as $5 billion a year, again measured in a different way and so cannot be added directly to the market data, but in many ways is added value to the estimated market totals. Second, travel spending is defined, described, and estimated for both California and the coast, since economic data for tourism is not easily separated, except by coastal counties. The travel spending data is actually included in the market data. Finally, we provide regional estimates of market values for employment, wages, and GSP to show geographic areas of largest and slowest sector growth between 1990-2000. California Coastal Recreation - Definition and Measurement Coastal recreation is undertaken by local residents, by residents of California who travel to the coast, and by residents of other states and countries. Recreation may impact the California economy by as much as spending at a luxury hotel in Santa Barbara or as little as a hot dog on the beach in Santa Monica. Data is not available for all expenditures by those who recreate along the California shore, but a comprehensive national survey undertaken in 2000 does measure the number of people and activity levels involved in California ocean recreation.47 This data, combined with state data on use of key coastal recreation resources, provide a picture of the magnitude of coastal recreation resource use. This data is presented in the next part of this chapter. Travel in California Coastal Counties - Definition, Description and Spending Estimates
44 1998 Year of the Ocean: Coastal Tourism and Recreation. http://www.yoto98.noaa.gov/yoto/meeting/tour_rec_316.html 45 C. Cunningham, and Walker, K. 1996. “Enhancing Public Access to the Coast through the CZMA.” The Journal of Marine Education, Volume 14, No.1. pp 8-11. 46 J.R. Houston, 1996. “International Tourism and U.S. beaches”. Shore and Beach. 47 National Survey on Recreation and Environment, 2000.
105
NOEP The travel economy is generally defined as activity associated with travel away from home. Travel may be undertaken for many purposes, including business, visiting friends and relatives, and for recreation. Trips may be single or multi-purpose. Travel to coastal counties in California may include coastal recreation or use of a coastal facility in whole or part. To get a sense of the entire travel industry affecting coastal California, we examined travel and tourism in the state as a whole and in the coastal counties. A portion of the economic value reported under travel and tourism is ocean related, but we do not know what that portion is precisely. Regional Estimates of Economic Impact of California Tourism and Recreation The NOEP team separated employment, wages, and contribution to GSP for those establishments located in shore-adjacent zip codes and defined this as ocean-related tourism and recreation. This is a smaller proportion of total travel activity in coastal counties, but it includes those activities most likely to be affected by ocean and coastal resources. It also includes the activities of both those who travel or spend money for recreation and for other purposes such as business. The next sections of this chapter present data for each of these aspects of Tourism & Recreation in coastal California. 8.2 Coastal Recreational Activities All economic activities relating to coastal recreation are affected by the quality of the environment. Coastal land, beaches, watersheds, and coastal waters each provide a link between the travel and tourism industry and coastal recreational industries such as swimming, surfing, boating and fishing. The level of participation in coastal water/nature-related industries affects several other industries and sectors of the economy. Increased demand for coastal recreation will result in increased demand for the hotel, restaurant, and service industry. This will also, indirectly, increase the construction activity along the coast as more hotels and vacation homes are built. For example, an increase in water-skiing will increase the manufacture and sale of boats used for these activities. Similarly, an improvement in a beach will lead to more beach visitors leading to increased beach-wear demand, which will lead to increased manufacturing and retailing business. Increased demand will also affect infrastructure construction activities. Roads, parking lots, water and waste water systems and the like will also be necessary. Therefore, it is important to define and measure the scale and scope of coastal recreational activities along the California coast before estimating market or non-market values for coastal tourism.
The National Survey of Recreation and Environment (NSRE) in 2000 was the first national survey that included an assessment of public participation in marine recreation. This survey defined nineteen activities as part of marine recreation. These nineteen activities can be divided into four major subgroups: beach activities, recreational fishing, recreational boating, and other marine recreational activities. Table 8-4 provides the estimates for California48 for each of these subgroups. Figure 8-2 depicts the proportion of different marine recreational activities. The NRSE estimation method captures the number of California residents who 48 Source NSRE 2000.
106
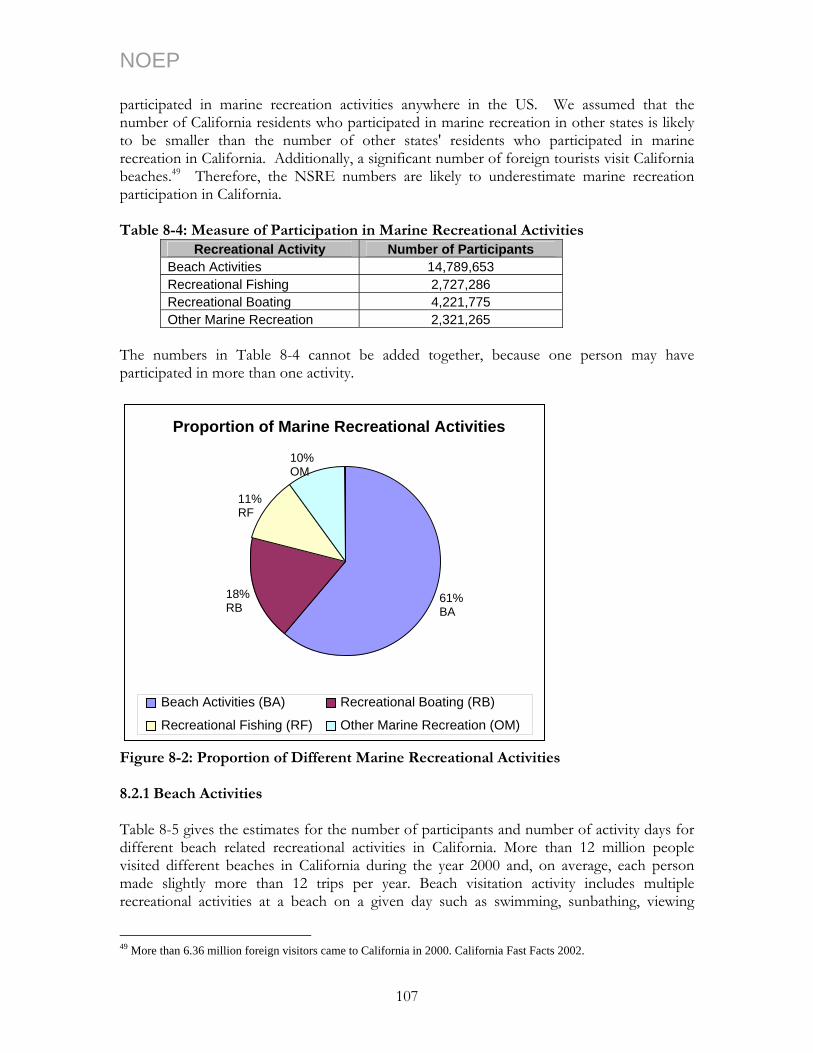
NOEP participated in marine recreation activities anywhere in the US. We assumed that the number of California residents who participated in marine recreation in other states is likely to be smaller than the number of other states' residents who participated in marine recreation in California. Additionally, a significant number of foreign tourists visit California beaches.49 Therefore, the NSRE numbers are likely to underestimate marine recreation participation in California.
Table 8-4: Measure of Participation in Marine Recreational Activities
Recreational Activity Number of Participants Beach Activities 14,789,653 Recreational Fishing 2,727,286 Recreational Boating 4,221,775 Other Marine Recreation 2,321,265
The numbers in Table 8-4 cannot be added together, because one person may have participated in more than one activity.
Proportion of Marine Recreational Activities
10% OM
18% RB
11% RF
61%BA
Beach Activities (BA) Recreational Boating (RB)
Recreational Fishing (RF) Other Marine Recreation (OM)
F oportion of D arine Rec ctivities 8
able 8-5 gives the estimates for the number of participants and number of activity days for
recreational activities at a beach on a given day such as swimming, sunbathing, viewing
igure 8-2: Pr ifferent M rea al Ation
.2.1 Beach Activities
Tdifferent beach related recreational activities in California. More than 12 million people visited different beaches in California during the year 2000 and, on average, each person made slightly more than 12 trips per year. Beach visitation activity includes multiple
49 More than 6.36 million foreign visitors came to California in 2000. California Fast Facts 2002.
107
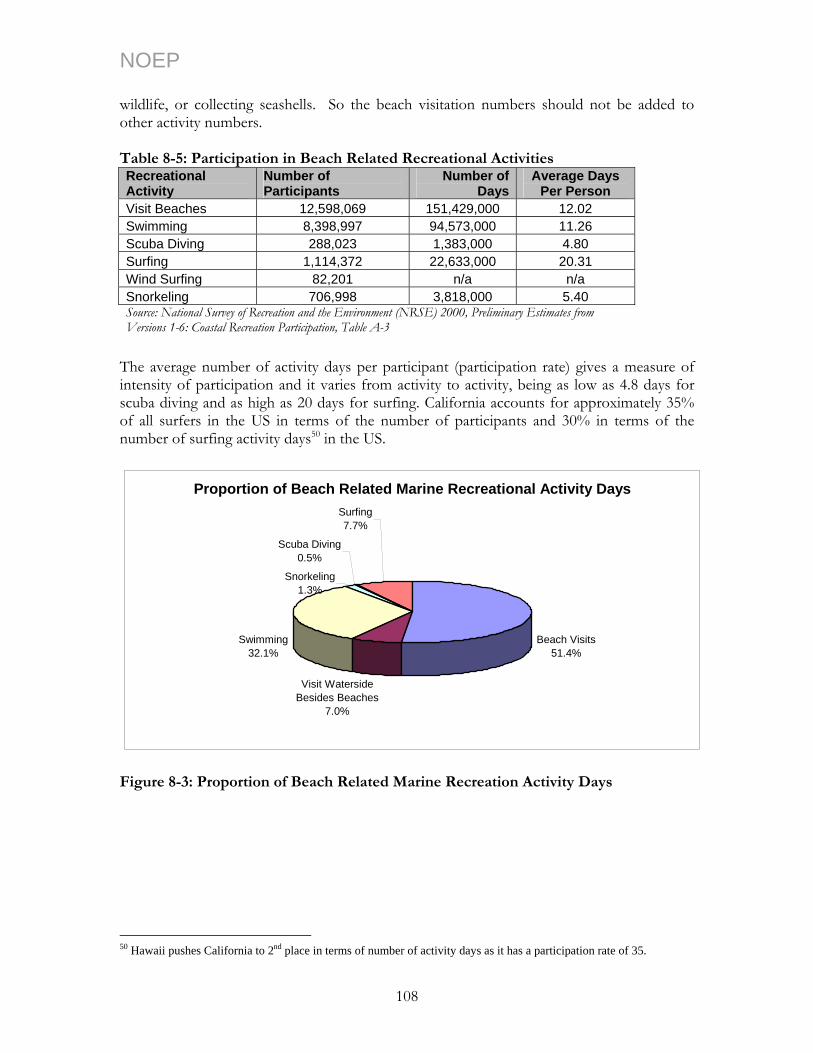
NOEP wildlife, or collecting seashells. So the beach visitation numbers should not be added to other activity numbers. Table 8-5: Participation in Beach Related Recreational Activities Recreational Activity
Number of Participants
Number of Days
Average Days Per Person
Visit Beaches 12,598,069 151,429,000 12.02 Swimming 8,398,997 94,573,000 11.26 Scuba Diving 288,023 1,383,000 4.80 Surfing 1,114,372 22,633,000 20.31 Wind Surfing 82,201 n/a n/a Snorkeling 706,998 3,818,000 5.40 Source: National Survey of Recreation and the Environment (NRSE) 2000, Preliminary Estimates from Versions 1-6: Coastal Recreation Participation, Table A-3
The average number of activity days per participant (participation rate) gives a measure of intensity of participation and it varies from activity to activity, being as low as 4.8 days for scuba diving and as high as 20 days for surfing. California accounts for approximately 35% of all surfers in the US in terms of the number of participants and 30% in terms of the
umber of surfing activity days50 in the US. n
Proportion of Beach Related Marine Recreational Activity Days
Beach Visits51.4%
Visit Waterside Besides Beaches
7.0%
Swimming32.1%
Snorkeling1.3%
Scuba Diving0.5%
Surfing7.7%
Figure 8-3: Proportion of Beach Related Marine Recreation Activity Days
50 Hawaii pushes California to 2nd place in terms of number of activity days as it has a participation rate of 35.
108
NOEP 8.2.2 California Beach Valuation: The Non-market Value of California Beaches51
Beach recreation is a cornerstone of the California coastal economy and even California culture. For at least four decades, Hollywood has carefully documented the California beach life. A more complete and accurate assessment of the number of actual beach users and the economic value of beach use, however, has only just begun. Nevertheless, the emerging picture of beach visitation and the potential value of market and non-market economic impacts of beach use in California corroborate the obvious importance of beach visitation for the California coastal economy. The California Coastal Act protects access to public beaches throughout California. As a result, beaches are an important source of recreational open space for Californians with as many as 63.4% of all Californians making at least one visit to a California beach each year – 2.5 times the national average (California Department of Boating and Waterways, CDBW, 2002). Day trips to beaches generate two distinct sources of economic value for the Coastal and Ocean Economy: market expenditures and non-market consumer surplus values. To begin, day visitors to beaches spend money locally on food, beverages, parking, and beach-related activities and rentals (e.g., body boards, umbrellas, etc.). These expenditures partially represent a transfer of expenditures that may have been made elsewhere in the state (e.g., gas and auto), but are largely expenditures that would not have been made in the absence of the beach trip. King (1999) estimated the fiscal impact of beaches in California and reported that in 1998, California’s beaches generated $14 billion dollars in direct revenue (King, 1999).52 In two other studies, the average expenditures per person per day trip ($/trip/person) were estimated for visits to California beaches. A survey of beach goers in Southern California (Hanemann et al. 2002) found that per person per trip expenditures on beach related items and services were $23.19 for beach goers that took at least one trip in the summer of 2000. In another study by King (California Department of Boating and Waterways 2002), average beach related expenditures (excluding gas and automobile costs) were $29.66. Visitors to beaches also place a value on beach visits above and beyond what they spend at the beach – the consumer surplus of beach visits. Unlike many marketed goods, access to the beach is largely free (aside from parking fees) in California. Because of the low cost of beach access and the importance of beach recreation to Californians, numerous studies have estimated the consumer surplus of beach going in California to better measure the true value of beaches and beach management in the state. Yet, no study has attempted to compile these values to find an estimate for the total non-market value of beaches in California. As we show below, the value of non-market beach uses is substantial and may even be within an order of magnitude of the market values of beach recreation. Failure to fully account for both the market and non-market values of beaches in California could lead to explicit and implicit benefit-cost assessments of beach policies that significantly undervalue beach recreation.
51 Linwood Pendleton, Judith Kildow, and S. Shivendu authored this section on beaches. 52 Direct Revenue is the direct expenditure from people making beach trips for items such as gas and parking, food and drinks from stores, restaurants, equipment rentals, beach sporting goods, beach related lodging and incidentals.
109

NOEP 8.2.2.1 Methodology The total non-market value of beaches in California was estimated using a two-step process. First, we estimated the total beach visitation activity days. This is the total number of days people spent on the beaches of California in one year. If a visitor went to the same beach or different California beaches ten times in one year then it was counted as ten beach visitation activity days. Second, we drew from the literature to find what we believed to be the most appropriate estimate of value for one day of beach visitation to find the total non-market value of beach visitation for California. The people who visit a beach on a given day may engage in multiple outdoor recreation activities. They swim, sunbath, walk, jog, view birds/wildlife, or just watch sunsets. Our estimates included beach visits for any recreational activity. 8.2.2.2 Estimating Total Beach Visitation Days A number of different sources estimate beach visitation days for California. Philip King of the San Francisco State University estimates that as many as 378.5 million day trips were made to California beaches by Californians in 2001 (CDBW 2002, Chapter 3). Leeworthy (2001) uses data from the National Survey on Recreation and the Environment to estimate that 151,429,000 beach visits were made to California beaches in 2000. The United States Life Saving Association estimates that as many as 146 million visitor days were made to Southern California beaches alone (USLA 2002). In another study, Morton and Pendleton (2001) estimate that total beach attendance in Los Angeles and Orange County in 2000 exceeded 79 million visits. Morton and Pendleton’s estimates, detailed in a report to the State Water Resources Control Board, are taken directly from lifeguard records. Kildow and Shivendu (2001), use data from the US Environmental Protection Agency’s BEACH Watch Program (EPA BEACH)53 to estimate beach visitation in California. The authors estimate the attendance per mile of beach using US EPA’s BEACH attendance estimates for four different regions of California, i.e., Northern California, North Central (San Francisco Bay area), Central California and Southern California and then extrapolate to get the estimates of attendance for those beaches for which only length is known. The EPA BEACH covers only 224 beaches, but the authors supplement the data with other sources including guidebooks and the Coastal Commission’s Beach Access Guide. In all, the authors identify at least 417 California beaches (see Appendix D for a complete list of beaches) and estimate the attendance at these beaches to be 153.1 million activity days. The estimates of Kildow and Shivendu are in line with those of the NSRE (2000) estimates, the United States Lifeguard Agency (2002) data, and the estimates for beach attendance given by Morton and Pendleton (2001), but are significantly lower than those of King’s estimates for the California Department of Boating and Waterways (2001). 8.2.2.3 Estimating the Value of a Day at the Beach
53 This data collection has been discontinued because data methods were non-uniform.
110
NOEP No attempt has been made to estimate the aggregate non-market value of beaches for large areas, in general, and for California in particular. Aggregating non-market values studies can be complicated if the studies examined estimate the value of different types of uses (e.g. surfing, swimming, or just sunbathing) and the value of uses at different seasons. Fortunately, most studies that have estimated non-market values for beach use in California have estimated the value of a general beach day, usually during the summer. Unfortunately, nearly all of the studies cited estimate values for Southern California beaches. As a result, the potential for extrapolation error in our estimates lies in the degree to which non-market beach values for Southern California beaches may not be representative of the values placed on beaches elsewhere in California. Nevertheless, because more than 85% of all beach visits in California are made to beaches in Los Angeles, Orange, and San Diego Counties, the sensitivity of our results to this geographical extrapolation error are likely to be relatively small. Two primary methods have been used to value consumer surplus estimates: the travel cost method and the contingent valuation method. Chapman and Hanemann (2001) argue that to date contingent valuation estimates of California beach visits have been flawed and generate unreliable estimates of beach values, largely because the contingent valuation surveys often are not site specific and fail to account for varying travel costs to beaches around the state. We employed travel cost estimates of consumer surplus for beach visits to estimate the value of visits to beaches, largely along the Central and Southern California coast. Table 8-6 provides estimates of consumer surplus values for visits to beaches in California. Consumer surplus estimates range from a low of $10.98 (in 2001 dollars) for visits to Cabrillo Beach in Los Angeles County (Leeworthy and Wiley 1993) to a high of greater than $70 (in 2001 dollars) per person per trip for visits to San Diego beaches (Lew 2002). In 1997, Michael Hanemann estimated the value of the consumer surplus of beach visits to Huntington Beach at $15/visit (Hanemann 1997). Hanemann’s estimate of beach-related consumer surplus was later discounted by ten percent and used as the basis for a jury award regarding lost beach recreation due to the American Trader oil spill (Chapman and Hanemann 2001). Hanemann’s conservative estimate of the value of a beach day ($15) is used to find the total non-market value of beach days in all of California. Based on a conservative estimate of beach attendance of 150 million beach days annually, we estimate the non-market value of beach visits in California to be approximately $2.25 billion dollars annually. (Using similar attendance figures and the expenditure results reported earlier, we estimate that beach-related expenditures, i.e. the market value of beach going, would be $3.75 billion.)
111
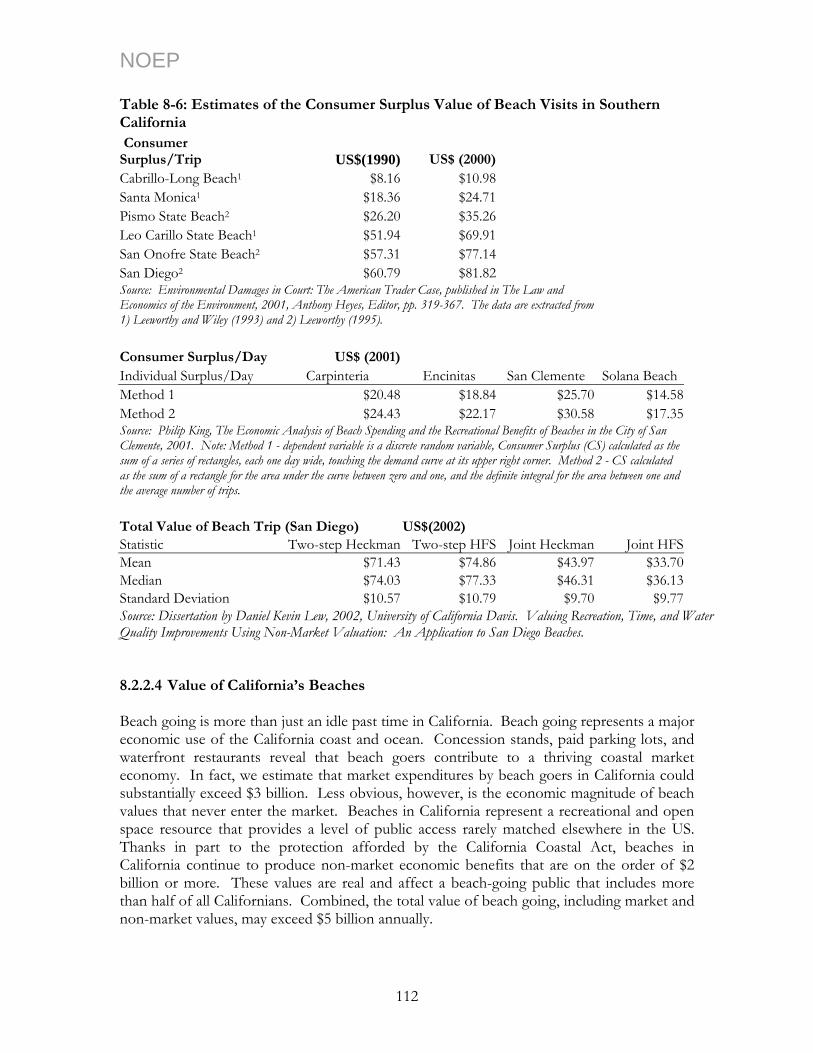
NOEP Table 8-6: Estimates of the Consumer Surplus Value of Beach Visits in Southern California Consumer Surplus/Trip US$(1990) US$ (2000) Cabrillo-Long Beach1 $8.16 $10.98 Santa Monica1 $18.36 $24.71 Pismo State Beach2 $26.20 $35.26 Leo Carillo State Beach1 $51.94 $69.91 San Onofre State Beach2 $57.31 $77.14 San Diego2 $60.79 $81.82 Source: Environmental Damages in Court: The American Trader Case, published in The Law and Economics of the Environment, 2001, Anthony Heyes, Editor, pp. 319-367. The data are extracted from 1) Leeworthy and Wiley (1993) and 2) Leeworthy (1995). Consumer Surplus/Day US$ (2001) Individual Surplus/Day Carpinteria Encinitas San Clemente Solana Beach Method 1 $20.48 $18.84 $25.70 $14.58 Method 2 $24.43 $22.17 $30.58 $17.35 Source: Philip King, The Economic Analysis of Beach Spending and the Recreational Benefits of Beaches in the City of San Clemente, 2001. Note: Method 1 - dependent variable is a discrete random variable, Consumer Surplus (CS) calculated as the sum of a series of rectangles, each one day wide, touching the demand curve at its upper right corner. Method 2 - CS calculated as the sum of a rectangle for the area under the curve between zero and one, and the definite integral for the area between one and the average number of trips. Total Value of Beach Trip (San Diego) US$(2002) Statistic Two-step Heckman Two-step HFS Joint Heckman Joint HFS Mean $71.43 $74.86 $43.97 $33.70 Median $74.03 $77.33 $46.31 $36.13 Standard Deviation $10.57 $10.79 $9.70 $9.77 Source: Dissertation by Daniel Kevin Lew, 2002, University of California Davis. Valuing Recreation, Time, and Water Quality Improvements Using Non-Market Valuation: An Application to San Diego Beaches. 8.2.2.4 Value of California’s Beaches Beach going is more than just an idle past time in California. Beach going represents a major economic use of the California coast and ocean. Concession stands, paid parking lots, and waterfront restaurants reveal that beach goers contribute to a thriving coastal market economy. In fact, we estimate that market expenditures by beach goers in California could substantially exceed $3 billion. Less obvious, however, is the economic magnitude of beach values that never enter the market. Beaches in California represent a recreational and open space resource that provides a level of public access rarely matched elsewhere in the US. Thanks in part to the protection afforded by the California Coastal Act, beaches in California continue to produce non-market economic benefits that are on the order of $2 billion or more. These values are real and affect a beach-going public that includes more than half of all Californians. Combined, the total value of beach going, including market and non-market values, may exceed $5 billion annually.
112
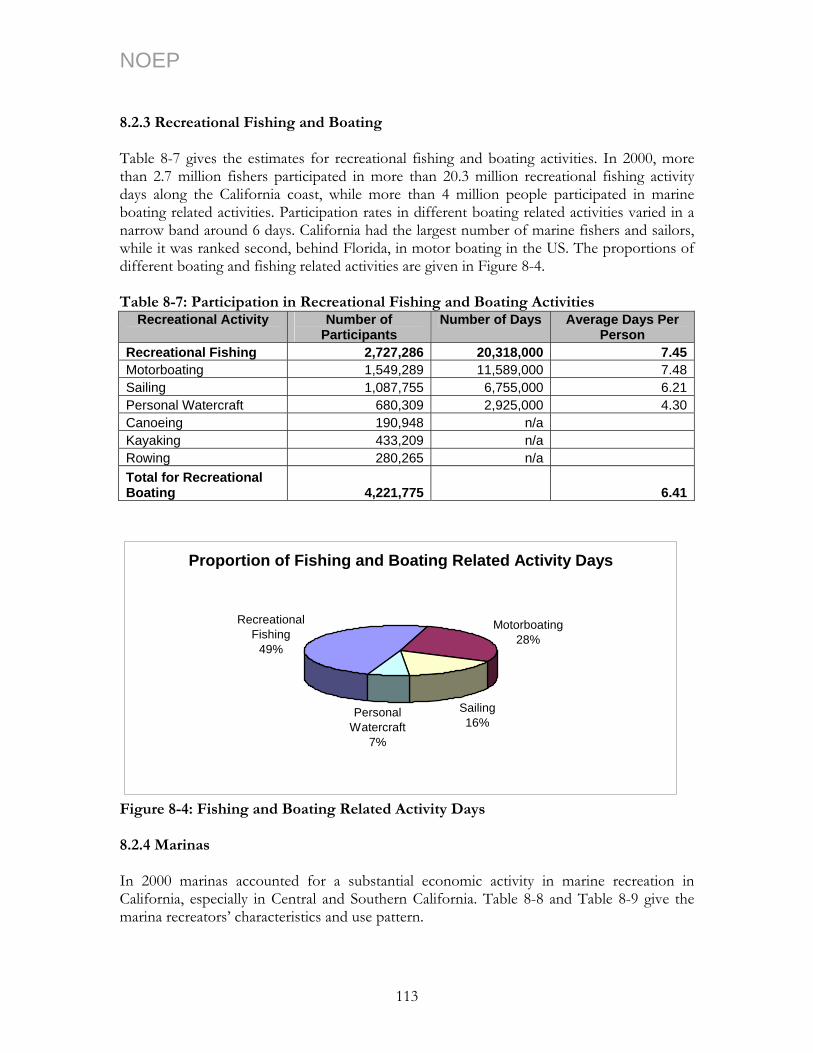
NOEP 8.2.3 Recreational Fishing and Boating Table 8-7 gives the estimates for recreational fishing and boating activities. In 2000, more than 2.7 million fishers participated in more than 20.3 million recreational fishing activity days along the California coast, while more than 4 million people participated in marine boating related activities. Participation rates in different boating related activities varied in a narrow band around 6 days. California had the largest number of marine fishers and sailors, while it was ranked second, behind Florida, in motor boating in the US. The proportions of different boating and fishing related activities are given in Figure 8-4. Table 8-7: Participation in Recreational Fishing and Boating Activities
Recreational Activity Number of Participants
Number of Days Average Days Per Person
Recreational Fishing 2,727,286 20,318,000 7.45Motorboating 1,549,289 11,589,000 7.48Sailing 1,087,755 6,755,000 6.21Personal Watercraft 680,309 2,925,000 4.30Canoeing 190,948 n/a Kayaking 433,209 n/a Rowing 280,265 n/a Total for Recreational Boating 4,221,775 6.41
Proportion of Fishing and Boating Related Activity Days
Recreational Fishing
49%
Motorboating28%
Sailing16%
Personal Watercraft
7%
Figure 8-4: Fishing and Boating Related Activity Days 8.2.4 Marinas In 2000 marinas accounted for a substantial economic activity in marine recreation in California, especially in Central and Southern California. Table 8-8 and Table 8-9 give the marina recreators’ characteristics and use pattern.
113
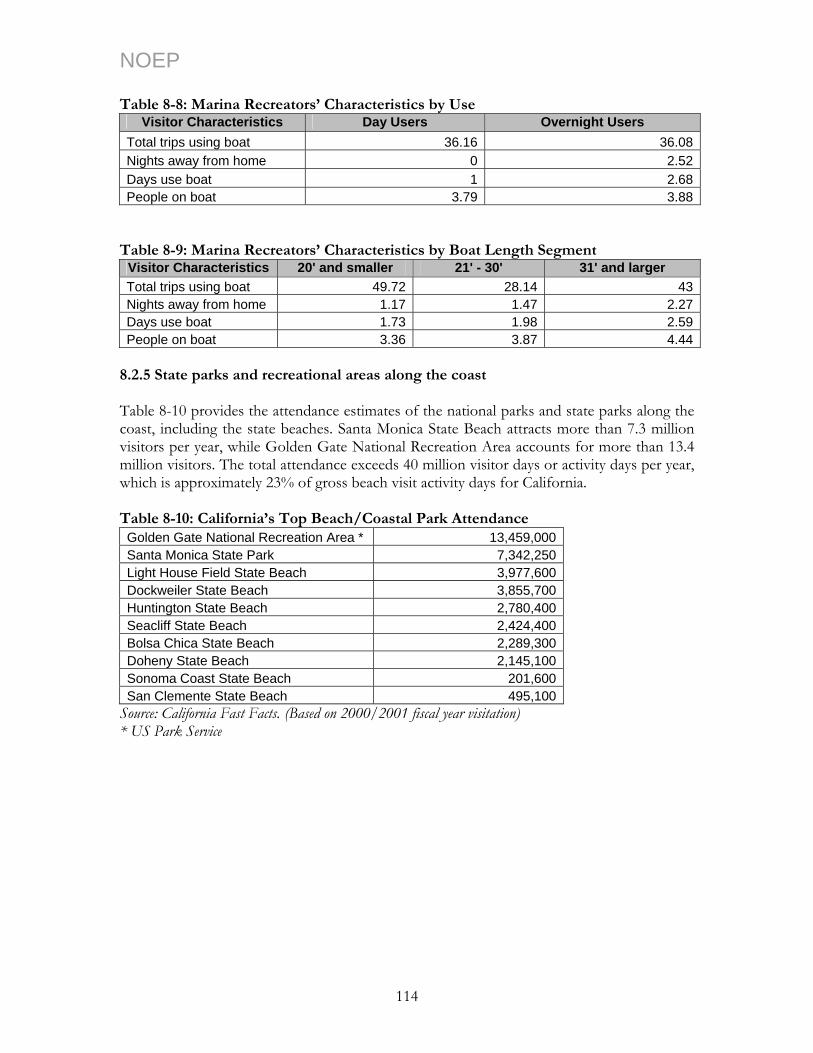
NOEP Table 8-8: Marina Recreators’ Characteristics by Use
Visitor Characteristics Day Users Overnight Users Total trips using boat 36.16 36.08Nights away from home 0 2.52Days use boat 1 2.68People on boat 3.79 3.88
Table 8-9: Marina Recreators’ Characteristics by Boat Length Segment Visitor Characteristics 20' and smaller 21' - 30' 31' and larger Total trips using boat 49.72 28.14 43Nights away from home 1.17 1.47 2.27Days use boat 1.73 1.98 2.59People on boat 3.36 3.87 4.44
8.2.5 State parks and recreational areas along the coast Table 8-10 provides the attendance estimates of the national parks and state parks along the coast, including the state beaches. Santa Monica State Beach attracts more than 7.3 million visitors per year, while Golden Gate National Recreation Area accounts for more than 13.4 million visitors. The total attendance exceeds 40 million visitor days or activity days per year, which is approximately 23% of gross beach visit activity days for California. Table 8-10: California’s Top Beach/Coastal Park Attendance Golden Gate National Recreation Area * 13,459,000Santa Monica State Park 7,342,250Light House Field State Beach 3,977,600Dockweiler State Beach 3,855,700Huntington State Beach 2,780,400Seacliff State Beach 2,424,400Bolsa Chica State Beach 2,289,300Doheny State Beach 2,145,100Sonoma Coast State Beach 201,600San Clemente State Beach 495,100
Source: California Fast Facts. (Based on 2000/2001 fiscal year visitation) * US Park Service
114
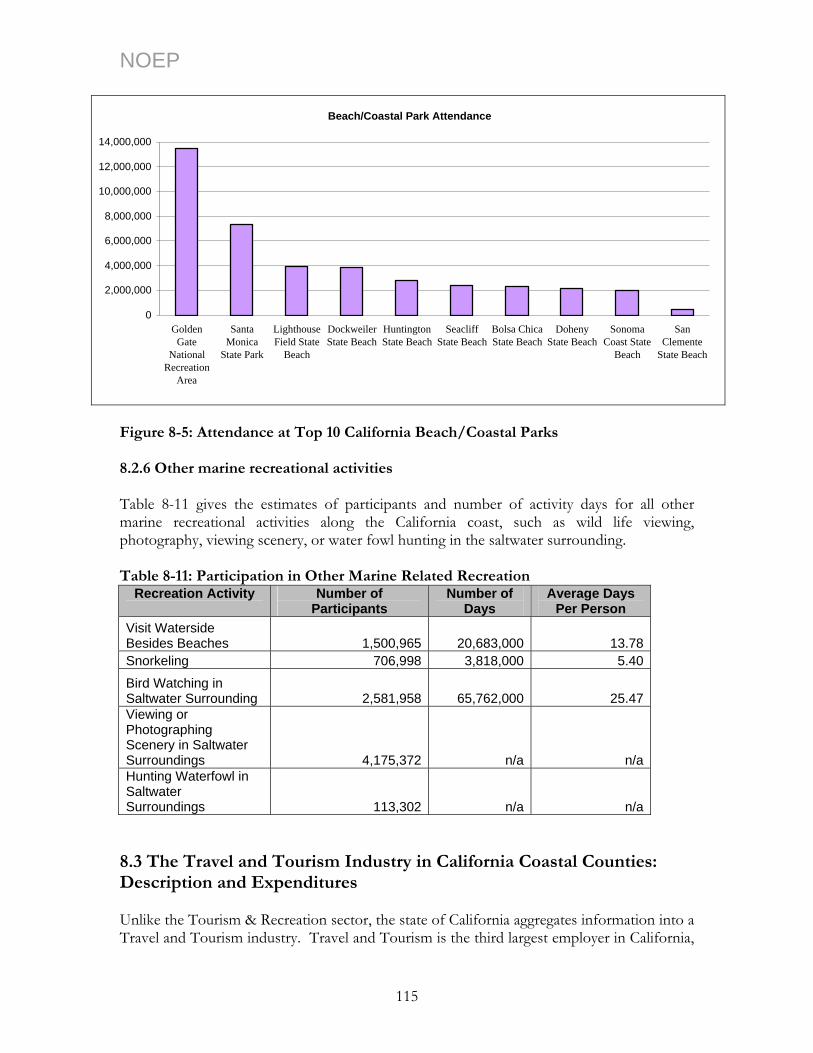
NOEP
Beach/Coastal Park Attendance
0
2,000,000
4,000,000
6,000,000
8,000,000
10,000,000
12,000,000
14,000,000
GoldenGate
NationalRecreation
Area
SantaMonica
State Park
LighthouseField State
Beach
DockweilerState Beach
HuntingtonState Beach
SeacliffState Beach
Bolsa ChicaState Beach
DohenyState Beach
SonomaCoast State
Beach
SanClemente
State Beach
Figure 8-5: Attendance at Top 10 California Beach/Coastal Parks 8.2.6 Other marine recreational activities Table 8-11 gives the estimates of participants and number of activity days for all other marine recreational activities along the California coast, such as wild life viewing, photography, viewing scenery, or water fowl hunting in the saltwater surrounding. Table 8-11: Participation in Other Marine Related Recreation
Recreation Activity Number of Participants
Number of Days
Average Days Per Person
Visit Waterside Besides Beaches 1,500,965 20,683,000 13.78 Snorkeling 706,998 3,818,000 5.40
Bird Watching in Saltwater Surrounding 2,581,958 65,762,000 25.47 Viewing or Photographing Scenery in Saltwater Surroundings 4,175,372 n/a n/a Hunting Waterfowl in Saltwater Surroundings 113,302 n/a n/a
8.3 The Travel and Tourism Industry in California Coastal Counties: Description and Expenditures Unlike the Tourism & Recreation sector, the state of California aggregates information into a Travel and Tourism industry. Travel and Tourism is the third largest employer in California,
115

NOEP following business and health services.54 Beach and waterfront activities are the second most popular recreational pursuits of travelers to California. Coastal tourism plays an important role in attracting recreators to California and generating significant economic. The California Travel and Tourism industry reflected the following highlights for the entire state for 2001.55
• The destination for an estimated 287 million domestic travelers and approximately 9
million international travelers. • The most visited state with an 11.1% share of the domestic travel market. • Expenditures amounted to $75.4 billion, or 6% of California’s GSP. 56 • Los Angeles County received the most domestic tourists in California. More than 45
million person-trips took place in and through Los Angeles County. • Generated over $4.8 billion in tax revenues in 2001. 8.3.1 Travel Spending Estimates The Travel and Tourism industry is a major part of California’s economy and is a primary industry in many local communities. Travel spending by domestic and international travelers generates sales and employment for many different types of businesses in the state. Table 8-12 provides the estimates of the economic impact of the California travel industry from 1991 to 2001. Table 8-12: Economic Impact of the Travel Industry of California
Year Destination Spending ($Billion)
Total Travel Spending ($Billion)
Employment (1,000 jobs)
Wages ($Billion)
Tax Receipts ($Billion)
1991 37.9 44.6 852 15.2 2.61992 40.1 47.1 878 16.0 2.91993 40.9 48.4 882 16.2 3.01994 42.2 50.0 914 16.8 3.11995 44.2 52.7 935 17.5 3.21996 48.6 57.6 990 19.0 3.61997 53.7 62.6 1,054 20.8 3.91998 56.5 64.9 1,045 21.9 4.11999 61.1 69.8 1,087 23.4 4.52000 66.0 75.4 1,100 24.9 4.8
2001p* 66.1 75.4 1,051 25.0 4.8**Annual Change 2000-2001p 0.2% 0.0% -4.4% 0.2% -0.6%1991-2001p 5.7% 5.4% 2.1% 5.1% 6.2%
Source: California Fast Facts 2002. * 2001 numbers are provisional. ** Annual Change for 1991-2001p is the average annual percentage change. 54 California fast Facts 2002. 55 California Fast Facts 2002. 56 Expenditure includes accommodations, meals, ground and air transportation, travel arrangements by travel agents, spending in retail stores while on the trip, and the recreational spending such as equipment rental or admissions to amusement parks. The Office of Tourism defines travel as either spending at least one night away from home or traveling at least 50 miles from home.
116
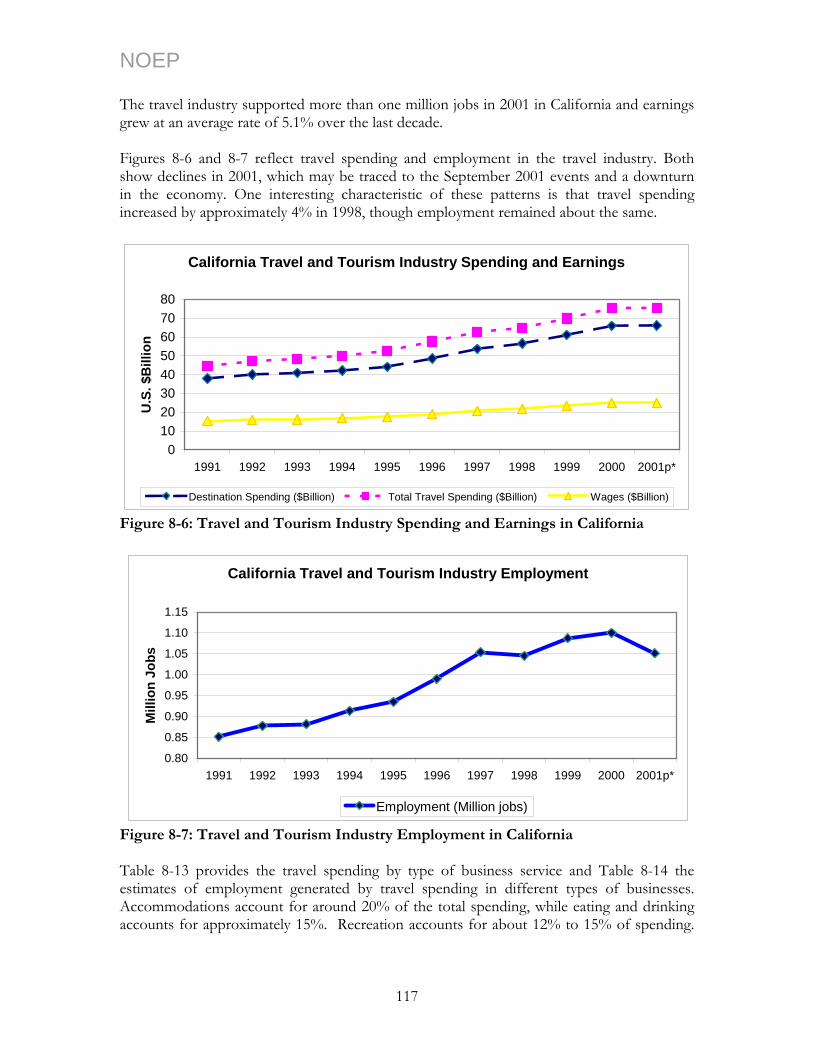
NOEP The travel industry supported more than one million jobs in 2001 in California and earnings grew at an average rate of 5.1% over the last decade. Figures 8-6 and 8-7 reflect travel spending and employment in the travel industry. Both show declines in 2001, which may be traced to the September 2001 events and a downturn in the economy. One interesting characteristic of these patterns is that travel spending increased by approximately 4% in 1998, though employment remained about the same.
California Travel and Tourism Industry Spending and Earnings
01020304050607080
1991 1992 1993 1994 1995 1996 1997 1998 1999 2000 2001p*
U.S
. $B
illio
n
Destination Spending ($Billion) Total Travel Spending ($Billion) Wages ($Billion)
Figure 8-6: Travel and Tourism Industry Spending and Earnings in California
California Travel and Tourism Industry Employment
0.80
0.85
0.90
0.95
1.00
1.05
1.10
1.15
1991 1992 1993 1994 1995 1996 1997 1998 1999 2000 2001p*
Mill
ion
Jobs
Employment (Million jobs)
Figure 8-7: Travel and Tourism Industry Employment in California Table 8-13 provides the travel spending by type of business service and Table 8-14 the estimates of employment generated by travel spending in different types of businesses. Accommodations account for around 20% of the total spending, while eating and drinking accounts for approximately 15%. Recreation accounts for about 12% to 15% of spending.
117

NOEP In terms of employment, recreation accounts for from 22% to 25% of the total employment generated by the travel industry in California. Table 8-13: Travel Spending by Type of Business Service ($ Billion)
Type of Business 1991 1992 1993 1994 1995 1996 1997 1998 1999 2000 2001Destination Spending 37.9 40.1 40.9 42.2 44.2 48.6 53.7 56.7 61.1 66.0 66.1 Accommodations 6.8 7.0 7.2 7.4 7.9 8.9 10.0 10.7 11.7 12.9 12.7 Eating, Drinking 9.9 10.2 10.3 10.6 11.1 12.0 13.4 14.3 15.3 16.0 16.2 Food Stores 1.4 1.4 1.4 1.5 1.6 1.7 1.9 2.0 2.1 2.2 2.3 Ground Transport 5.1 5.4 5.4 5.5 5.7 6.3 6.8 6.5 7.4 8.8 8.6 Recreation 6.8 7.4 7.6 7.9 8.3 9.1 10.0 10.7 11.5 12.1 12.2 Retail Sales 7.9 8.7 8.9 9.2 9.7 10.6 11.6 12.3 13.2 13.9 14.1Air Transportation 6.4 6.7 7.2 7.5 8.0 8.6 8.5 7.9 8.2 8.8 8.7Travel Arrangement 0.4 0.5 0.4 0.4 0.4 0.4 0.4 0.4 0.5 0.6 0.5Total Spending 44.6 47.1 48.4 50.0 52.7 57.6 62.6 64.9 69.8 75.4 75.4
Table 8-14: Employment Generated by Travel Spending (1,000 Jobs) 1991 1992 1993 1994 1995 1996 1997 1998 1999 2000 2001
Accommodations 141 144 142 150 154 165 183 181 194 201 187Eating, Drinking 324 322 328 332 341 362 379 181 393 398 387Food Stores 11 10 10 11 11 12 13 12 12 12 12Ground Transport 35 34 34 37 38 41 44 40 43 47 45Recreation 171 195 194 206 210 222 241 236 248 248 236Retail Sales 92 95 97 99 103 111 116 117 118 114 106Air Transportation 52 51 51 51 5250 51 51 50 51 51Travel Arrangement 27 27 26 28 28 27 28 28 28 28 27Total Employment 852 878 882 914 935 990 1,054 1,045 1,087 1,100 1,051Source: “California Travel Impacts by County, 1992-2000,” California Travel and Tourism Commission and Division of Tourism, 2002.
118
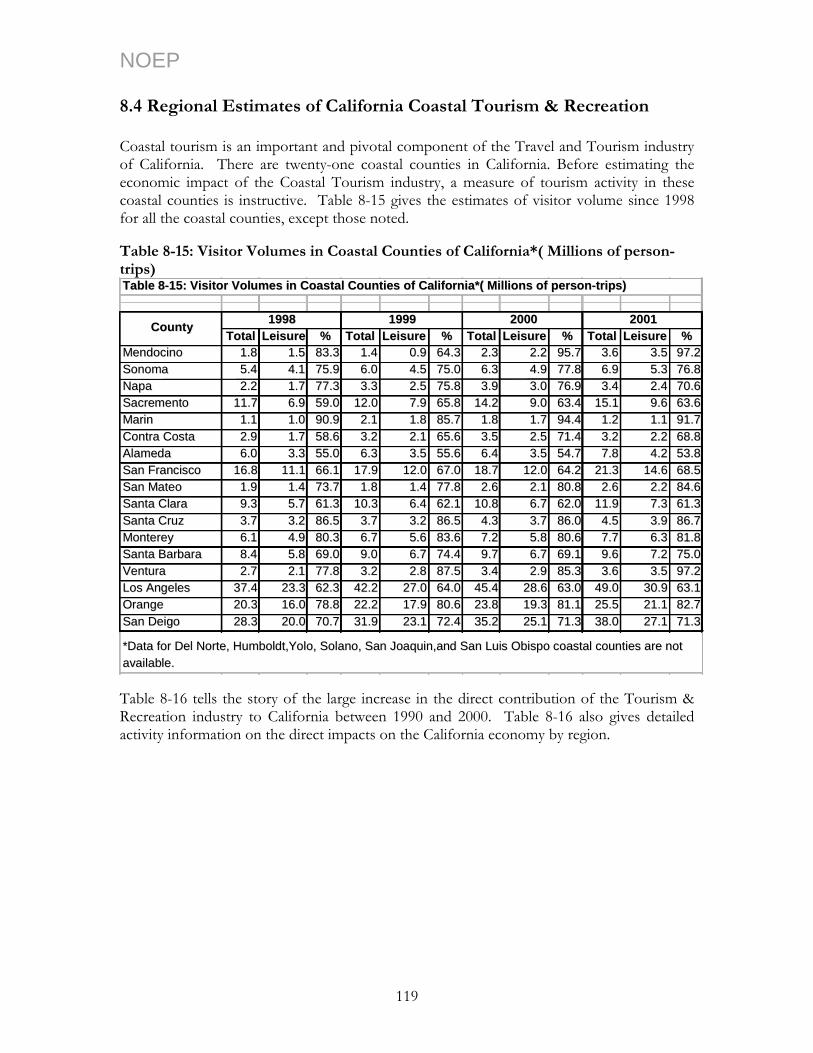
NOEP 8.4 Regional Estimates of California Coastal Tourism & Recreation Coastal tourism is an important and pivotal component of the Travel and Tourism industry of California. There are twenty-one coastal counties in California. Before estimating the economic impact of the Coastal Tourism industry, a measure of tourism activity in these coastal counties is instructive. Table 8-15 gives the estimates of visitor volume since 1998 for all the coastal counties, except those noted. Table 8-15: Visitor Volumes in Coastal Counties of California*( Millions of person-trips)
TToottaall LLeeiissuurree %% TToottaall LLeeiissuurree %% TToottaall LLeeiissuurree %% TToottaall LLeeiissuurree %%MMeennddoocciinnoo 11..88 11..55 8833..33 11..44 00..99 6644..33 22..33 22..22 9955..77 33..66 33..55 9977..22SSoonnoommaa 55..44 44..11 7755..99 66..00 44..55 7755..00 66..33 44..99 7777..88 66..99 55..33 7766..88NNaappaa 22..22 11..77 7777..33 33..33 22..55 7755..88 33..99 33..00 7766..99 33..44 22..44 7700..66SSaaccrreemmeennttoo 1111..77 66..99 5599..00 1122..00 77..99 6655..88 1144..22 99..00 6633..44 1155..11 99..66 6633..66MMaarriinn 11..11 11..00 9900..99 22..11 11..88 8855..77 11..88 11..77 9944..44 11..22 11..11 9911..77CCoonnttrraa CCoossttaa 22..99 11..77 5588..66 33..22 22..11 6655..66 33..55 22..55 7711..44 33..22 22..22 6688..88AAllaammeeddaa 66..00 33..33 5555..00 66..33 33..55 5555..66 66..44 33..55 5544..77 77..88 44..22 5533..88SSaann FFrraanncciissccoo 1166..88 1111..11 6666..11 1177..99 1122..00 6677..00 1188..77 1122..00 6644..22 2211..33 1144..66 6688..55SSaann MMaatteeoo 11..99 11..44 7733..77 11..88 11..44 7777..88 22..66 22..11 8800..88 22..66 22..22 8844..66SSaannttaa CCllaarraa 99..33 55..77 6611..33 1100..33 66..44 6622..11 1100..88 66..77 6622..00 1111..99 77..33 6611..33SSaannttaa CCrruuzz 33..77 33..22 8866..55 33..77 33..22 8866..55 44..33 33..77 8866..00 44..55 33..99 8866..77MMoonntteerreeyy 66..11 44..99 8800..33 66..77 55..66 8833..66 77..22 55..88 8800..66 77..77 66..33 8811..88SSaannttaa BBaarrbbaarraa 88..44 55..88 6699..00 99..00 66..77 7744..44 99..77 66..77 6699..11 99..66 77..22 7755..00VVeennttuurraa 22..77 22..11 7777..88 33..22 22..88 8877..55 33..44 22..99 8855..33 33..66 33..55 9977..22LLooss AAnnggeelleess 3377..44 2233..33 6622..33 4422..22 2277..00 6644..00 4455..44 2288..66 6633..00 4499..00 3300..99 6633..11OOrraannggee 2200..33 1166..00 7788..88 2222..22 1177..99 8800..66 2233..88 1199..33 8811..11 2255..55 2211..11 8822..77SSaann DDeeiiggoo 2288..33 2200..00 7700..77 3311..99 2233..11 7722..44 3355..22 2255..11 7711..33 3388..00 2277..11 7711..33
2200001111999988 CCoouunnttyy 11999999 22000000
TTaabbllee 88--1155:: VViissiittoorr VVoolluummeess iinn CCooaassttaall CCoouunnttiieess ooff CCaalliiffoorrnniiaa**(( MMiilllliioonnss ooff ppeerrssoonn--ttrriippss))
**DDaattaa ffoorr DDeell NNoorrttee,, HHuummbboollddtt,,YYoolloo,, SSoollaannoo,, SSaann JJooaaqquuiinn,,aanndd SSaann LLuuiiss OObbiissppoo ccooaassttaall ccoouunnttiieess aarree nnoott aavvaaiillaabbllee..
Table 8-16 tells the story of the large increase in the direct contribution of the Tourism & Recreation industry to California between 1990 and 2000. Table 8-16 also gives detailed activity information on the direct impacts on the California economy by region.
119
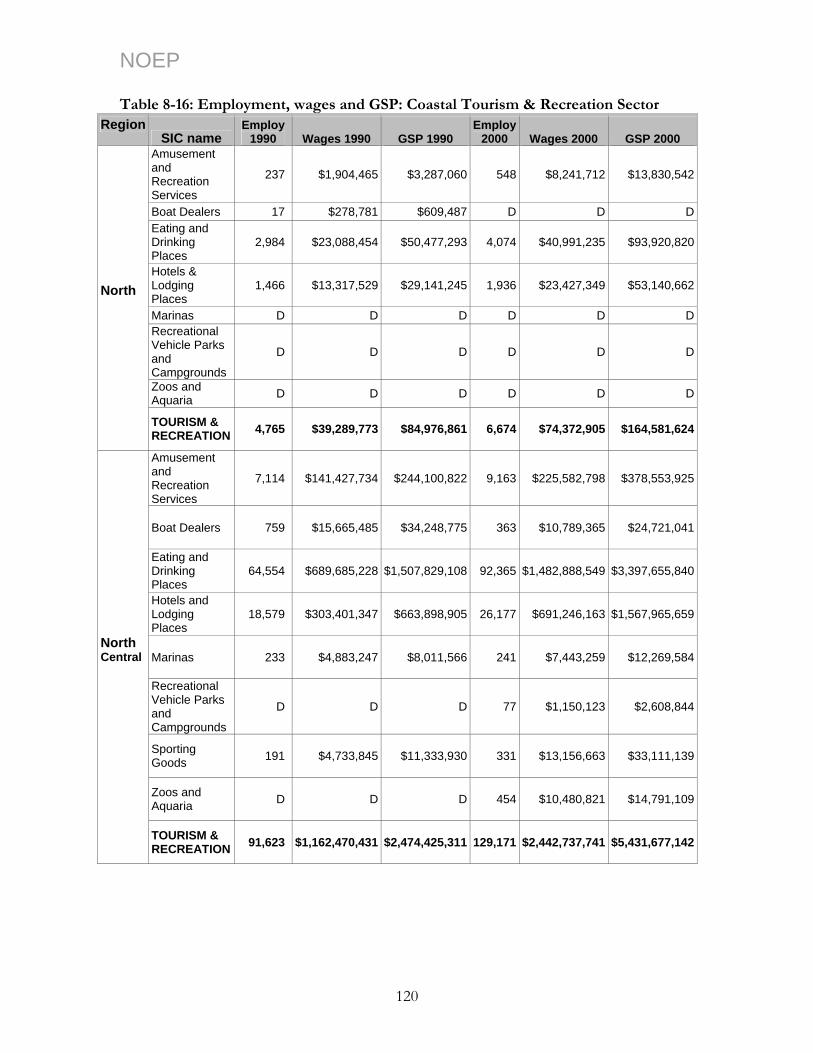
NOEP Table 8-16: Employment, wages and GSP: Coastal Tourism & Recreation Sector
Region SIC name
Employ 1990 Wages 1990 GSP 1990
Employ 2000 Wages 2000 GSP 2000
Amusement and Recreation Services
237 $1,904,465 $3,287,060 548 $8,241,712 $13,830,542
Boat Dealers 17 $278,781 $609,487 D D DEating and Drinking Places
2,984 $23,088,454 $50,477,293 4,074 $40,991,235 $93,920,820
Hotels & Lodging Places
1,466 $13,317,529 $29,141,245 1,936 $23,427,349 $53,140,662
Marinas D D D D D DRecreational Vehicle Parks and Campgrounds
D D D D D D
Zoos and Aquaria D D D D D D
North
TOURISM & RECREATION 4,765 $39,289,773 $84,976,861 6,674 $74,372,905 $164,581,624
Amusement and Recreation Services
7,114 $141,427,734 $244,100,822 9,163 $225,582,798 $378,553,925
Boat Dealers 759 $15,665,485 $34,248,775 363 $10,789,365 $24,721,041
Eating and Drinking Places
64,554 $689,685,228 $1,507,829,108 92,365 $1,482,888,549 $3,397,655,840
Hotels and Lodging Places
18,579 $303,401,347 $663,898,905 26,177 $691,246,163 $1,567,965,659
Marinas 233 $4,883,247 $8,011,566 241 $7,443,259 $12,269,584
Recreational Vehicle Parks and Campgrounds
D D D 77 $1,150,123 $2,608,844
Sporting Goods 191 $4,733,845 $11,333,930 331 $13,156,663 $33,111,139
Zoos and Aquaria D D D 454 $10,480,821 $14,791,109
North Central
TOURISM & RECREATION 91,623 $1,162,470,431 $2,474,425,311 129,171 $2,442,737,741 $5,431,677,142
120
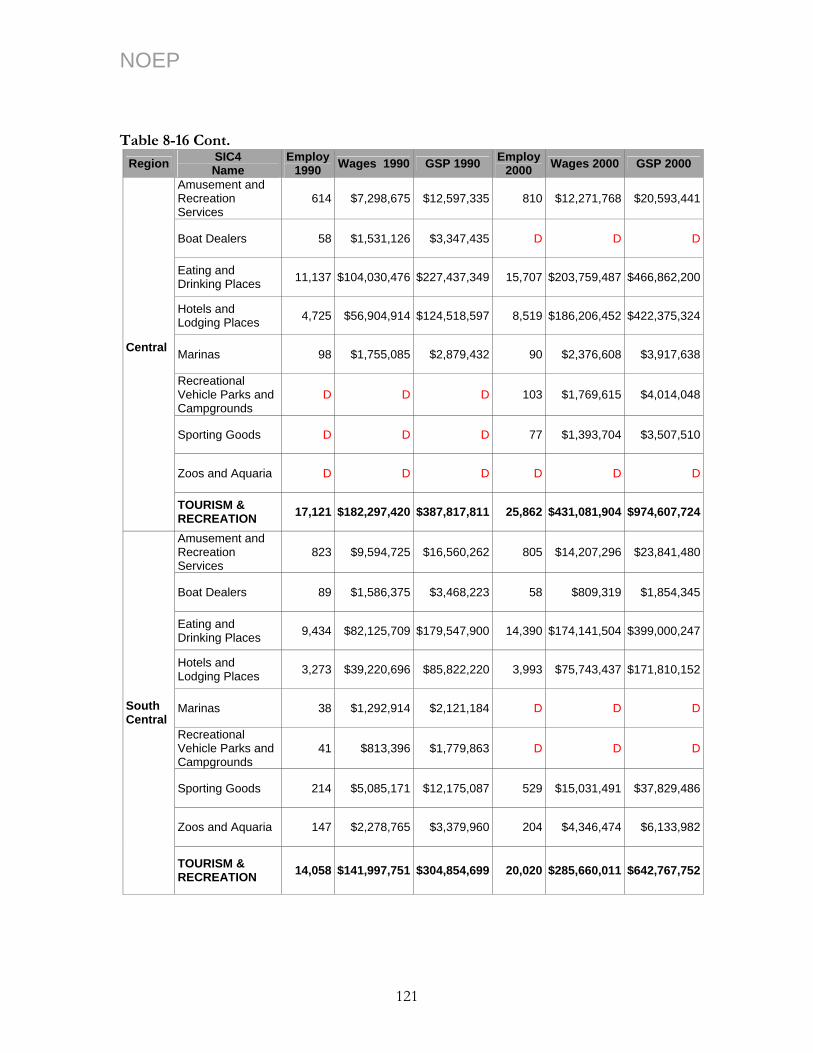
NOEP Table 8-16 Cont.
Region SIC4 Name
Employ 1990 Wages 1990 GSP 1990 Employ
2000 Wages 2000 GSP 2000
Amusement and Recreation Services
614 $7,298,675 $12,597,335 810 $12,271,768 $20,593,441
Boat Dealers 58 $1,531,126 $3,347,435 D D D
Eating and Drinking Places 11,137 $104,030,476 $227,437,349 15,707 $203,759,487 $466,862,200
Hotels and Lodging Places 4,725 $56,904,914 $124,518,597 8,519 $186,206,452 $422,375,324
Marinas 98 $1,755,085 $2,879,432 90 $2,376,608 $3,917,638
Recreational Vehicle Parks and Campgrounds
D D D 103 $1,769,615 $4,014,048
Sporting Goods D D D 77 $1,393,704 $3,507,510
Zoos and Aquaria D D D D D D
Central
TOURISM & RECREATION 17,121 $182,297,420 $387,817,811 25,862 $431,081,904 $974,607,724
Amusement and Recreation Services
823 $9,594,725 $16,560,262 805 $14,207,296 $23,841,480
Boat Dealers 89 $1,586,375 $3,468,223 58 $809,319 $1,854,345
Eating and Drinking Places 9,434 $82,125,709 $179,547,900 14,390 $174,141,504 $399,000,247
Hotels and Lodging Places 3,273 $39,220,696 $85,822,220 3,993 $75,743,437 $171,810,152
Marinas 38 $1,292,914 $2,121,184 D D D
Recreational Vehicle Parks and Campgrounds
41 $813,396 $1,779,863 D D D
Sporting Goods 214 $5,085,171 $12,175,087 529 $15,031,491 $37,829,486
Zoos and Aquaria 147 $2,278,765 $3,379,960 204 $4,346,474 $6,133,982
South Central
TOURISM & RECREATION 14,058 $141,997,751 $304,854,699 20,020 $285,660,011 $642,767,752
121
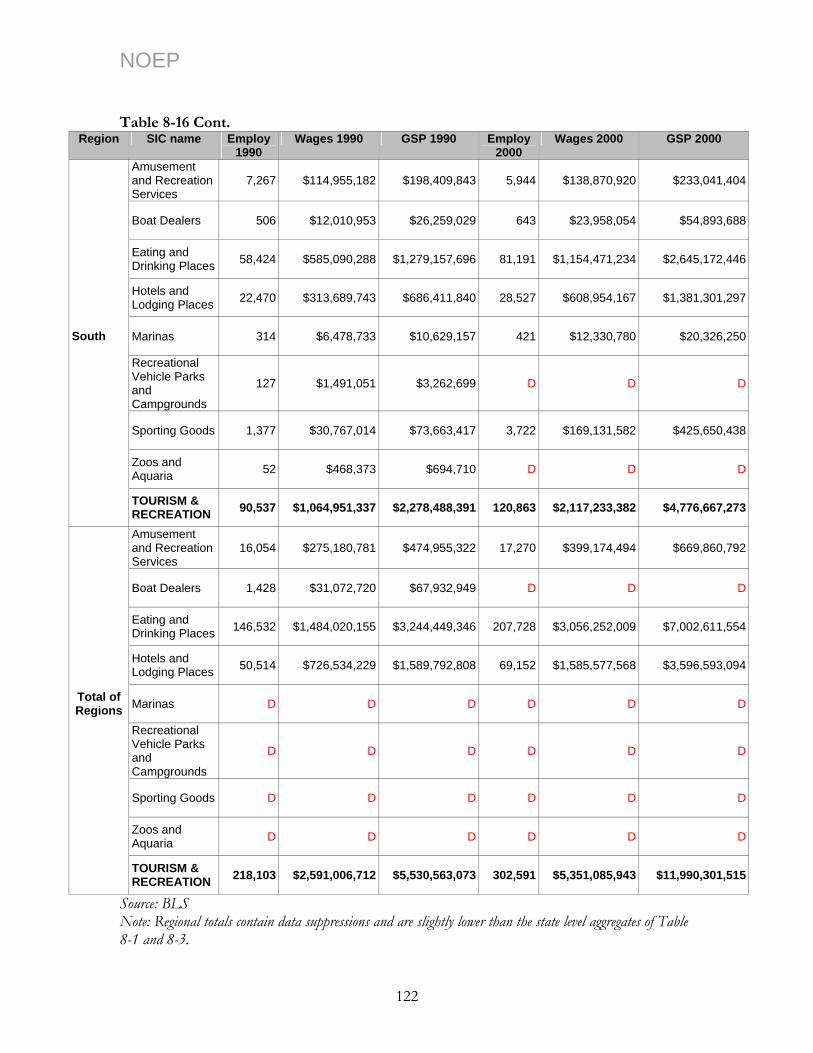
NOEP Table 8-16 Cont.
Region SIC name Employ 1990
Wages 1990 GSP 1990 Employ 2000
Wages 2000 GSP 2000
Amusement and Recreation Services
7,267 $114,955,182 $198,409,843 5,944 $138,870,920 $233,041,404
Boat Dealers 506 $12,010,953 $26,259,029 643 $23,958,054 $54,893,688
Eating and Drinking Places 58,424 $585,090,288 $1,279,157,696 81,191 $1,154,471,234 $2,645,172,446
Hotels and Lodging Places 22,470 $313,689,743 $686,411,840 28,527 $608,954,167 $1,381,301,297
Marinas 314 $6,478,733 $10,629,157 421 $12,330,780 $20,326,250
Recreational Vehicle Parks and Campgrounds
127 $1,491,051 $3,262,699 D D D
Sporting Goods 1,377 $30,767,014 $73,663,417 3,722 $169,131,582 $425,650,438
Zoos and Aquaria 52 $468,373 $694,710 D D D
South
TOURISM & RECREATION 90,537 $1,064,951,337 $2,278,488,391 120,863 $2,117,233,382 $4,776,667,273
Amusement and Recreation Services
16,054 $275,180,781 $474,955,322 17,270 $399,174,494 $669,860,792
Boat Dealers 1,428 $31,072,720 $67,932,949 D D D
Eating and Drinking Places 146,532 $1,484,020,155 $3,244,449,346 207,728 $3,056,252,009 $7,002,611,554
Hotels and Lodging Places 50,514 $726,534,229 $1,589,792,808 69,152 $1,585,577,568 $3,596,593,094
Marinas D D D D D D
Recreational Vehicle Parks and Campgrounds
Total of Regions
D D D D D D
Sporting Goods D
D D D D D
Zoos and Aquaria D D D D D D
TOURISM & RECREATION 218,103 $2,591,006,712 $5,530,563,073 302,591 $5,351,085,943 $11,990,301,515
Source: BLS Note: Regional totals contain data suppressions and are slightly lower than the state level aggregates of Table 8-1 and 8-3.
122
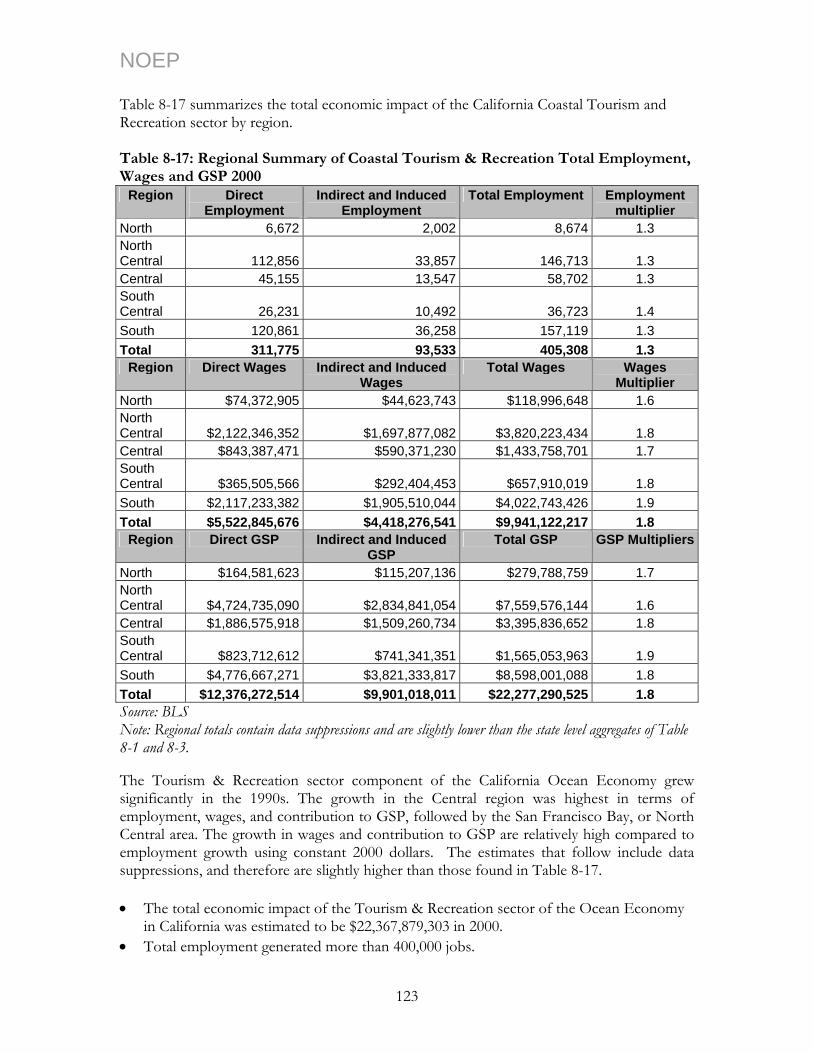
NOEP Table 8-17 summarizes the total economic impact of the California Coastal Tourism and Recreation sector by region. Table 8-17: Regional Summary of Coastal Tourism & Recreation Total Employment, Wages and GSP 2000
Region Direct Employment
Indirect and Induced Employment
Total Employment Employment multiplier
North 6,672 2,002 8,674 1.3 North Central 112,856 33,857 146,713 1.3 Central 45,155 13,547 58,702 1.3 South Central 26,231 10,492 36,723 1.4 South 120,861 36,258 157,119 1.3 Total 311,775 93,533 405,308 1.3
Region Direct Wages Indirect and Induced Wages
Total Wages Wages Multiplier
North $74,372,905 $44,623,743 $118,996,648 1.6 North Central $2,122,346,352 $1,697,877,082 $3,820,223,434 1.8 Central $843,387,471 $590,371,230 $1,433,758,701 1.7 South Central $365,505,566 $292,404,453 $657,910,019 1.8 South $2,117,233,382 $1,905,510,044 $4,022,743,426 1.9 Total $5,522,845,676 $4,418,276,541 $9,941,122,217 1.8
Region Direct GSP Indirect and Induced GSP
Total GSP GSP Multipliers
North $164,581,623 $115,207,136 $279,788,759 1.7 North Central $4,724,735,090 $2,834,841,054 $7,559,576,144 1.6 Central $1,886,575,918 $1,509,260,734 $3,395,836,652 1.8 South Central $823,712,612 $741,341,351 $1,565,053,963 1.9 South $4,776,667,271 $3,821,333,817 $8,598,001,088 1.8 Total $12,376,272,514 $9,901,018,011 $22,277,290,525 1.8 Source: BLS Note: Regional totals contain data suppressions and are slightly lower than the state level aggregates of Table 8-1 and 8-3.
The Tourism & Recreation sector component of the California Ocean Economy grew significantly in the 1990s. The growth in the Central region was highest in terms of employment, wages, and contribution to GSP, followed by the San Francisco Bay, or North Central area. The growth in wages and contribution to GSP are relatively high compared to employment growth using constant 2000 dollars. The estimates that follow include data suppressions, and therefore are slightly higher than those found in Table 8-17. • The total economic impact of the Tourism & Recreation sector of the Ocean Economy
in California was estimated to be $22,367,879,303 in 2000. • Total employment generated more than 400,000 jobs.
123

NOEP • Direct wages were estimated at $5,544,976,307. Including indirect estimates, wages
totaled $9,980,957,353. • The Coastal Tourism & Recreation sector accounts for around 72% of the jobs that can
be attributed to the Ocean Economy and approximately 55% in terms of wages and contribution to GSP.
124
NOEP 8.5 References California Fast Facts 2002. “California Travel Impacts by County, 1992-2000,” California Travel and Tourism Commission
and Division of Tourism, 2002. Cunningham, C. and Walker, K. 1996. “Enhancing Public Access to the Coast through the
CZMA.” The Journal of Marine Education, Volume 14, No.1. pp 8-11. Houston, J.R. 1996. “International Tourism and US beaches”. Shore and Beach. US Department of Interior, US Department of Commerce, NOAA. National Survey on
Recreation and Environment, 2000. US Department of Labor, Bureau of Labor Statistics. 8.5.1 References for Beach Valuation Section
California Coastal Commission, Beach Access Guide California Department of Boating and Waterways (CDBW) and State Coastal Conservancy,
2002, California Beach Restoration Study. Sacramento California (references in the text as CDBW 2002)
Chapman, David and Michael Hanemann. 2001. Environmental damages in court: the American Trader case, in The Law and Economics of the Environment, Anthony Heyes, Editor, pp. 319-367
Deacon, R.T. and Kolstad, C. D., 2000. “Valuing Beach Recreation Lost in Environmental Accidents”, Journal of Water Resources Planning and Management, 126: 374-81.
Hanemann, M. 1997. “ Final Conclusions of Professor Michael Hanemann Regarding Lost Recreational Damages Resulting from the American Trader Oil Spill”
Hanemann, M., Pendleton, L., Hilger, J., and D. Layton. 2002. Expenditure Report for the Southern California Beach Valuation Project. Prepared for the National Ocean and Atmospheric Administration, Minerals Management Service (Department of the Interior), The California State Water Resources Control Board, and The California Department of Fish and Game.
Hanemann, M., Pendleton, L., Mohn, C., Hilger, J., Kurisawa, K., Layton, D. and Felipe Vasquez. 2003. Interim Report on the Southern California Beach Valuation Project. Prepared for the National Ocean and Atmospheric Administration, Minerals Management Service (Department of the Interior), The California State Water Resources Control Board, and The California Department of Fish and Game.
Hanemann, M., Pendleton, L., Mohn, C., Hilger, J., Kurisawa, K., Layton, D. and Felipe Vasquez. 2004. Using revealed preference models to estimate the affect of coastal water quality on beach choice in Southern California. Prepared for the National Ocean and Atmospheric Administration, Minerals Management Service (Department of the Interior), The California State Water Resources Control Board, and The California Department of Fish and Game.
125
NOEP Hanemann, W. Michael. 1997. Final conclusions of Professor Michael Hanemann regarding
lost recreational damages resulting from the American Trader Oil Spill. Report submitted to the State of California Attorney General’s Office. August 15, 1997.
Kildow, J. and S. Shivendu. 2001. Valuing California Beaches. Presented at the Beach Economics Workshop, University of Southern California.
King, Philip. 1999. “The Fiscal Impact of Beaches in California.” Public Research Institute, San Francisco University, Report Commissioned by California Department of Boating and Waterways.
King, Philip. 2001. The Economic Analysis of Beach Spending and the Recreational Benefits of Beaches in the City of San Clemente, mimeo, San Francisco State University.
Leeworthy, V. R. and Wiley, P. C. 1993. “Recreational Use Value for Three Southern California Beaches.” Strategic Environmental Assessments Division, Office of Ocean Resource Conservation and Assessment, National Oceanic and Atmospheric Administration, Rockville Maryland.
Leeworthy, Vernon R. 1995. Transferability of Bell and Leeworthy Beach study to Southern California Beaches. Memo to David Chapman, June 22 (Exhibited 939) reported in Chapman, David and Michael Hanemann 2001. Environmental damages in court: the American Trader case, in The Law and Economics of the Environment, Anthony Heyes, Editor, pp. 319-367.
Leeworthy, Vernon R. and Peter C. Wiley. 1993. Recreational use value for three southern California beaches. Rockville, MD. NOAA Strategic Environmental Assessments Division. Office of Ocean Resources and Conservation, March.
Leeworthy, V. R. and P.C. Wiley. 2001. Current Participation Patterns in Marine Recreation. National Oceanic and Atmospheric Administration.
Lew, Daniel Kevin. 2002. Valuing recreation, time, and water quality improvements using non-market valuation: an application to San Diego beaches. Doctoral Dissertation. University of California Davis.
Morton, J. and L. Pendleton. 2001. A Database of Beach Closures and Historical Water Quality. Prepared for the State Water Resources Control Board. Sacramento, California.
Pendleton, L., Martin, N. and D.G. Webster. 2001. “Public Perceptions of Environmental Quality: A Survey Study of Beach Use and Perceptions in Los Angeles County.” Marine Pollution Bulletin 42: 1155-1160.
Report on Phase I Beach Valuation Analysis. Southern California Beach Valuation Project: http://marineeconomics.noaa.gov/SCBeach/welcome.html#background
United States Lifesaving Association, 2002, (USLA) http://www.usla.org/PublicInfo/ United States EPA BEACH Watch,
http://www.epa.gov/waterscience/beaches/2001surveyfs.pdf
126
NOEP PART III CONCLUSION Future Directions in Understanding the Ocean Economy of California This report has provided a detailed overview of important trends in the California Ocean Economy. It has relied on both published data sources and analysis of unpublished data undertaken specifically for analysis of the Ocean Economy. The ocean and coast make vital contributions to the welfare and economy of Californians, but it also is clear that the nature of those contributions is changing over time, as the ocean and coast become more and more a center of tourism and recreation. This analysis is incomplete due to inadequate time and resources and because multiple aspects of the California Ocean Economy data are unavailable. Given the importance of the Ocean Economy, additional investments are warranted in improving the measurement and tracking of this segment of California’s overall economy. We suggest the following: 1. The Government Sector of the Ocean Economy: This report has concentrated on the
private sector Ocean Economy because the relationship to the ocean can be directly or indirectly inferred from industrial definitions and geographic locations. Federal, state, and local governments also are a key part of the Ocean Economy and provide a variety of services such as parks and resource management, as well as key roles in defense and homeland security. Because data sources do not permit a separation of function and geography for government activities, it is difficult to determine the employment levels needed to maintain the federal, state, and local parks along the ocean, or the size of the US Navy’s presence in California. Determining the employment levels needed requires detailed analysis of budgetary and other internal government documents and specific surveys of local and county governments. The addition of these data would provide a more complete picture of the Ocean Economy.
2. Improved measurement of ocean recreation values: The Tourism & Recreation sector
now is the single most important part of the Ocean Economy in California. However, as the analysis in this report shows, the measurement of this key sector is still imprecise. It is possible to measure the activity that takes place near the shore in industries such as hotels or restaurants, a large (but unknown) portion of which is related directly to the use of ocean resources like beaches, boating, or whale watching. There also is a large (and also unknown) portion of the activity in hotels away from the shore that uses the ocean resources for at least some portion of recreational activity. Measurement of the number of people who use beaches (whether tourists or residents) in California is best at state parks and very uneven through the rest of the coast. There is little measurement at all of recreational boating except for counting the number of boats. Moreover, these limitations apply only to market-related economic activity. While studies of the non-market values of California’s beaches have been undertaken, little has been done with the non-market values of other ocean related resources, such as wildlife viewing. For all the data available, ocean-based tourism and recreation in California remains a poorly understood activity from an economic perspective.
127
NOEP 3. Employment in fisheries harvesting: A major gap in the measurement of the Ocean
Economy in the US and in California is the absence of reliable, consistent figures on employment in the fisheries harvesting sector. By law this sector is exempt from the unemployment insurance laws that require reporting by almost all other industries (including all governments). However, the use of license data for commercial fish harvesters does provide a means to measure employment. Because it is possible to hold multiple licenses, changes in the licensing system are required to add statistical measurement capabilities to what is fundamentally an administrative system designed for other purposes. It is not clear the extent to which such changes are feasible in California, but a review of procedures to assess feasibility might lead to an important addition to the capacity to measure this important industry.
For all these reasons, the data in this report represent an under estimate of the value of the ocean to California. However, the size of the ocean’s contribution documented here should spur additional efforts to measure more accurately both that contribution and its change over time.
128

NOEP PART IV APPENDIX
Appendix A: The NOEP Ocean Economy: The Methodology The NOEP is sponsored by NOAA to develop new methods to measure the Ocean Economy of the US in a way that is consistent across the entire country. A.1 Market Data
The methodology developed to estimate market values is based on using the ES-202 employment data, which are collected monthly by each state’s department of labor and reported to the US Department of Labor. The ES-202 data are used as the basis for administering the nation’s unemployment insurance laws, and covers about 90 percent of all employees. The data series excludes farm and self-employment.
A.1.1 NOEP Methodology ES-202 data are at the establishment level. Any single place of business is an establishment, regardless of who owns it. A business firm may have many establishments or only one. Nonprofit organizations and government also report its employment through this system. For purposes of the NOEP methodology, establishments (see table A-2) are defined as ocean-related based on SIC codes and, for certain industries, by the location of a given establishment in a zip code adjacent to the shore. Most of the industries defined in this table are single 4-digit SIC codes. Some 4-digit SIC industries have been combined to create the industries as shown in order to minimize the disclosure of data for single firms, which is prohibited. Table A-1 shows the industries and corresponding SIC codes (1987 Revision)
129
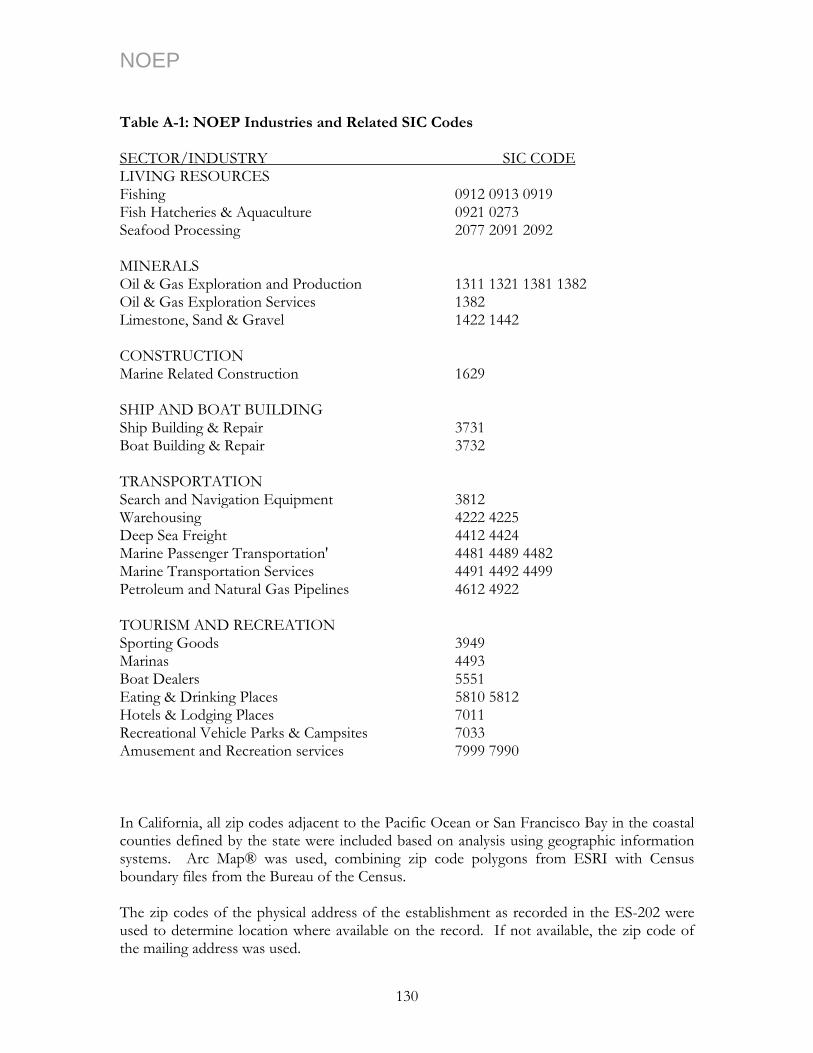
NOEP Table A-1: NOEP Industries and Related SIC Codes SECTOR/INDUSTRY SIC CODE LIVING RESOURCES Fishing 0912 0913 0919 Fish Hatcheries & Aquaculture 0921 0273 Seafood Processing 2077 2091 2092 MINERALS Oil & Gas Exploration and Production 1311 1321 1381 1382 Oil & Gas Exploration Services 1382 Limestone, Sand & Gravel 1422 1442 CONSTRUCTION Marine Related Construction 1629 SHIP AND BOAT BUILDING Ship Building & Repair 3731 Boat Building & Repair 3732 TRANSPORTATION Search and Navigation Equipment 3812 Warehousing 4222 4225 Deep Sea Freight 4412 4424 Marine Passenger Transportation' 4481 4489 4482 Marine Transportation Services 4491 4492 4499 Petroleum and Natural Gas Pipelines 4612 4922 TOURISM AND RECREATION Sporting Goods 3949 Marinas 4493 Boat Dealers 5551 Eating & Drinking Places 5810 5812 Hotels & Lodging Places 7011 Recreational Vehicle Parks & Campsites 7033 Amusement and Recreation services 7999 7990 In California, all zip codes adjacent to the Pacific Ocean or San Francisco Bay in the coastal counties defined by the state were included based on analysis using geographic information systems. Arc Map® was used, combining zip code polygons from ESRI with Census boundary files from the Bureau of the Census. The zip codes of the physical address of the establishment as recorded in the ES-202 were used to determine location where available on the record. If not available, the zip code of the mailing address was used.
130

NOEP All ES-202 data are reported to the Bureau of Labor Statistics of the US Department of Labor, which compiles the state reports into a longitudinal database (LDB) of all reporting establishments in the US. This database was used to access California’s information. Because of differences in revisions of the data between the LDB and California’s own records, there may be minor differences between totals reported here and those available from the California Employment Development Department.
Except where noted, all reported data are annual average data from monthly reports. All wage data are annual totals from monthly reports. ES-202 data include only wage and salary employment. It excludes self-employment and farm employment. While the latter is not relevant to the Ocean Economy, self-employment can be significant in the tourism and recreation sector. Thus the figures reported here understate employment and wages in that sector. Fisheries harvesting employment is also excluded from this analysis, since the fish harvesting industry is not covered by the federal law requiring reporting of employment. Estimates of fisheries harvesting derived using IMPLAN are included in the living resources sector for 2000. These should be treated cautiously as they are derived, not reported data.
All data derived from the ES-202 data series are subject to confidentiality screening. Federal law prohibits the release of data at any level of aggregation, which could reveal the employment or wages of a single firm. The estimates for employment and wages were developed using the original non-public data series, which includes all establishments. However, all reported data in this report were screened for confidentiality by the Bureau of Labor Statistics before being released. This screening included comparing the released data with other published data sources to be certain that no confidential data could be imputed based on combining this data series with any other data. In all tables, totals of the sectors, regions, and the state include all data from all establishments selected as above. Industry level totals are suppressed to prevent disclosure of confidential data. In any sector where one industry’s data is suppressed, a second industry’s data also are suppressed to prevent complimentary disclosure. The ES-202 data are the basis for all information regarding employment, wages, and the number of establishments in this report. GSP for each sector is estimated using Equation A-1*, which states that an establishment’s share of the state’s GSP is based on the establishment’s share of the 2-digit SIC code’s wages as reported by the Bureau of Economic Analysis multiplied by the GSP for that two digit industry, and then summed across all establishments in that industry. This method assures that the sum of wages and GSP for the ocean sector is consistent with the total GSP as reported by BEA. Wage percentages were also cross-checked against the totals reported in the BLS LDB for the state to assure consistency in proportions.
131
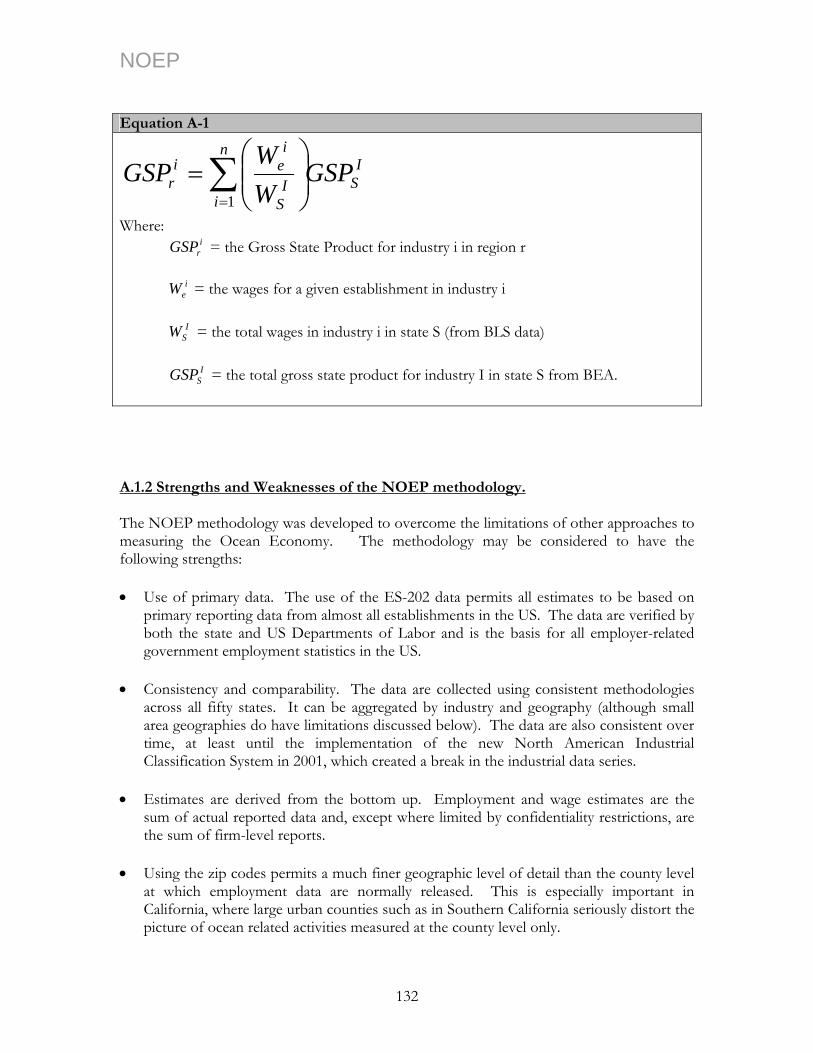
NOEP Equation A-1
IS
n
iI
S
iei
r GSPWW
GSP ∑=
⎟⎟⎠
⎞⎜⎜⎝
⎛=
1
Where: i
rGSP = the Gross State Product for industry i in region r
ieW = the wages for a given establishment in industry i
I
SW = the total wages in industry i in state S (from BLS data)
ISGSP = the total gross state product for industry I in state S from BEA.
A.1.2 Strengths and Weaknesses of the NOEP methodology. The NOEP methodology was developed to overcome the limitations of other approaches to measuring the Ocean Economy. The methodology may be considered to have the following strengths: • Use of primary data. The use of the ES-202 data permits all estimates to be based on
primary reporting data from almost all establishments in the US. The data are verified by both the state and US Departments of Labor and is the basis for all employer-related government employment statistics in the US.
• Consistency and comparability. The data are collected using consistent methodologies
across all fifty states. It can be aggregated by industry and geography (although small area geographies do have limitations discussed below). The data are also consistent over time, at least until the implementation of the new North American Industrial Classification System in 2001, which created a break in the industrial data series.
• Estimates are derived from the bottom up. Employment and wage estimates are the
sum of actual reported data and, except where limited by confidentiality restrictions, are the sum of firm-level reports.
• Using the zip codes permits a much finer geographic level of detail than the county level
at which employment data are normally released. This is especially important in California, where large urban counties such as in Southern California seriously distort the picture of ocean related activities measured at the county level only.
132
NOEP At the same time, this data series does have some weaknesses: • Zip code geography is imperfect. Zip codes change over time, and available GIS files on
zip codes (from Environmental Systems Research Institute) do not always contain correct historical or recent revisions. The zip code data used here are for 1999. It matches very closely with 2000 data, but there may be unknown errors in the 1990 data since zip code information in GIS format for that year was not available.
• There are errors in the original employment reports. Firms make errors in reporting SIC
codes and may make errors in reporting addresses. For example, while required to give the physical location of each establishment, not every record contains this information. In such cases, alternative mailing addresses on the record were used. If no address was given, the record was omitted. These reporting errors introduce biases in the data of unknown directions and sizes that may be amplified in the fine-level geographic detail examined here.
• Industry definitions related to the ocean are imperfect. Some industries, such as those in
SIC 44 (Water Transportation) are reasonably well related to the oceans. Others such as restaurants and hotels always will present problems in determining the degree to which they are related to the ocean.
• Still others, such as SIC 1629 (Heavy Construction) and SIC 3999 (Sporting Goods not
elsewhere classified) do not separate a marine from a non-marine component. In these cases, the assumption is that the marine component (dredging and pier construction companies or surfboard manufacturers) are most likely located near the shore and so may be captured in a shore-adjacent zip code. But in both cases it is likely that other non-marine related firms may be located in a near shore zip code and thus over-counted in the data.
• A somewhat similar problem occurs with search and navigation equipment. This
industry produces primarily electronic equipment such as radar, sonar, geographic positioning systems, etc. These products all have applications in marine transportation (and increasingly in recreational boating) but also in aviation. No information exists to separate the applications to which the products of this industry may be put. All of the output is counted in marine transportation, which probably overstates the actual marine component of the output.
• Industries might be included in more than one ocean sector. The example of search and
navigation equipment just discussed indicates that the products of the industry may be used both in marine transportation of goods and people but also in recreational boating. It has been assigned to transportation since the largest dollar volume of marine related products is in the commercial side of the business.
• Marinas are another example of possible sectoral confusion. Marinas are the home to
both recreational boats and some commercial boats, primarily in the fishing industry. However, the vast majority of boats in marinas are recreational boats and so this sector is assigned to tourism and recreation.
133
NOEP • Where data for the individual industries are available, users may adjust the sector totals
to suit specific preferences, if desired. On balance, the strengths of the methodology outweigh the weaknesses. For the most part, the weaknesses are inherent to either the original data sources used or to the nature of any taxonomic process or to data availability limitations that cannot easily be overcome. The NOEP methodology is still under development, and ways must be found to control for both the upward and downward biases in the data in order to improve the estimates. A.2 Market and Non-Market Valuation The ocean, like other environmental assets, may be viewed as a set of natural resources that provide a stream of valuable services over a period of time (Freeman, 2003). These services can be direct, like swimming or sunbathing on a beach, boating or recreational fishing. Or they can be indirect, like ecological preservation or influencing climates. Moreover, these services may be traded in markets with prices, like overnight camping fees, or fishing permits. These services can also be available outside traditional markets, like the recreational value of a day at the beach, or day of recreational fishing. Much of what a beach visitor values in a “day at a beach” or a surfer values in a “day of surfing” is not bought and sold in markets, and therefore, the value of these added services is often omitted in traditional economic valuation/impact studies, or is not directly linked to the natural asset that provides these services. The process of determining the economic value of those activities that are not traded in the market is not the same as calculating the value of something that is traded in the market place such as purchasing a boat or buying a swim suit. These activities have non-market use values to those who partake in them, which must be estimated indirectly and somewhat less precisely than a market activity. Non-market valuation methods have been increasingly used to estimate that “value “of recreational activities that are not captured by market transactions, although the methods for determining these values are less precise and still becoming more sophisticated. Non-market valuation methods can be broadly divided into two groups: surrogate market techniques and simulated market techniques. Surrogate market techniques attempt to estimate implicit (substitute) values for environmental goods and services by means of the price of another good or service that is marketed. These techniques use actual market prices to value an environmental quality or resource that is not marketed. The idea behind these methods is that prices for many marketed goods and services differ across seemingly equal units due to different environmental qualities, scale or setting, and these price differentials reflect a purchaser’s valuation of the environmental effects associated with any particular unit. Hedonic Pricing and Travel Cost are the two most widely used methods under this category. Simulated market techniques are not based on observed behavior, but on a user’s responses to survey questions, which try to mimic the actual market. These experimental situations ask users to choose between things, to give information about the value they place on certain costs or benefits. Contingent Valuation methods are the most commonly used simulated market techniques. Estimates of non-market values of ocean-related recreational activities in California are imprecise and subject to a range of biases. The users’ valuation of beaches, recreational
134
NOEP fishing, or boating will not only depend on the ocean/water/beach/fish stock characteristics, it will also be a function of the users’ characteristics and situation. Even assuming that the appropriate non-market valuation methods were available to determine the exact price which the users would be willing to pay for the use of these ocean-related environmental assets, each recreational activity in each area will have different dollar values. For example, while a surfer may value a beach by its surf, a sunbather may value it by the quality of the sand. In order to get willingness to pay for a day at a particular beach, the valuation of these different uses is aggregated, which may create aggregation error. To get the overall non-market value of ocean-related recreational activities in California, gross aggregations were used to get the total number of users and then again aggregated different types of uses in three broad categories, namely, beach visitation, recreational fishing and recreational boating; leading to additional estimation errors. Therefore, the reader must keep in mind, that the estimated non-market values are not precise, but only give gross estimates.
135
NOEP Appendix B: Fishing Industry Data 2001 Employment And Payroll By NAICS Codes
Until 2001, the Federal Government used SIC codes to classify the range of industries for which data was compiled. As of 2001, they system changed to the NAICS system, which provided a more detailed breakdown of industry sectors, giving a better picture of our Ocean Sectors. Past information has now been reconfigured to allow back year comparisons according to these new NAICS categories. The California Economic Development Department provides the record of employment and wages for workers covered by unemployment insurance programs from 1997 to 2001. Although these data are not the official estimates, they offer a benchmark for future research analysis. Additionally, some of the data are at the county level, which make detailed analysis possible. Table B-1 through B--3 present the results of commercial fisheries, seafood preparation and packaging, and aquaculture industries by county and by NAICS codes.57
57 After 2000, all industries are classified by BLS using the North American Industry Classification System (NAICS) rather than the Standard Industrial Classification (SIC). NAICS uses a production-oriented approach to categorize economic units with similar production processes. NAICS focuses on how products and services are created, as opposed to SIC which focuses on what is produced. Using NAICS yields significantly different industry groupings from those produced using SIC. Due to these differences in NAICS and SIC structures, NAICS data will not be directly comparable to the SIC-based data for earlier years. BLS is currently in the process of transferring the previous SIC-based employment and payroll data to the new NAICS-based data. During this transitional period, we are not able to present historical employment and payroll data by NAICS codes. However, it does not affect our analysis in the previous sections since we compared historical data of 1990 and 2000 based on SIC industries. 2001 employment and payroll data are available by NAICS code.
136
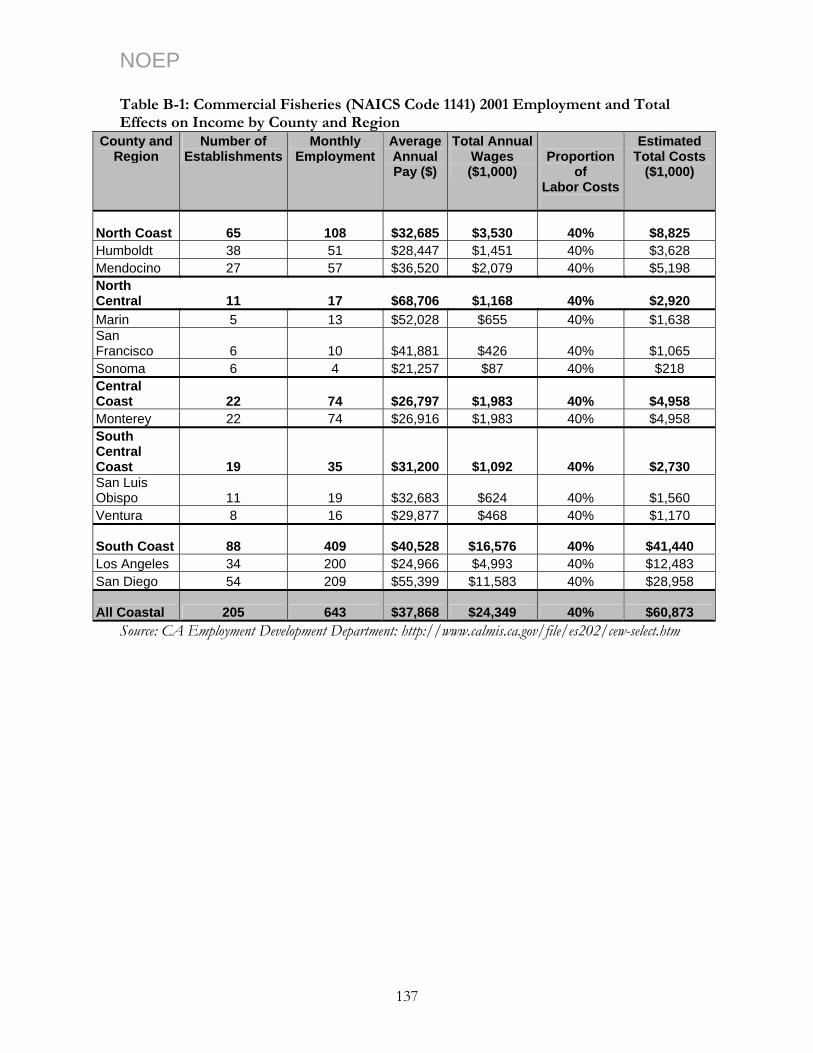
NOEP Table B-1: Commercial Fisheries (NAICS Code 1141) 2001 Employment and Total Effects on Income by County and Region
County and Region
Number of Establishments
Monthly Employment
Average Annual Pay ($)
Total Annual Wages ($1,000)
Proportion
of Labor Costs
Estimated Total Costs
($1,000)
North Coast 65 108 $32,685 $3,530 40% $8,825 Humboldt 38 51 $28,447 $1,451 40% $3,628 Mendocino 27 57 $36,520 $2,079 40% $5,198 North Central 11 17 $68,706 $1,168 40% $2,920 Marin 5 13 $52,028 $655 40% $1,638 San Francisco 6 10 $41,881 $426 40% $1,065 Sonoma 6 4 $21,257 $87 40% $218 Central Coast 22 74 $26,797 $1,983 40% $4,958 Monterey 22 74 $26,916 $1,983 40% $4,958 South Central Coast 19 35 $31,200 $1,092 40% $2,730 San Luis Obispo 11 19 $32,683 $624 40% $1,560 Ventura 8 16 $29,877 $468 40% $1,170
South Coast 88 409 $40,528 $16,576 40% $41,440 Los Angeles 34 200 $24,966 $4,993 40% $12,483 San Diego 54 209 $55,399 $11,583 40% $28,958
All Coastal 205 643 $37,868 $24,349 40% $60,873 Source: CA Employment Development Department: http://www.calmis.ca.gov/file/es202/cew-select.htm
137

NOEP Table B-2: California’s Seafood Product Preparation and Packaging (NAICS Code 3117) 2001 Employment and Total Effects on Income by County and Region
County and Region
Number of Establishments
Average Monthly
Employment
Average Annual Pay ($)
Total Annual Payroll ($1,000)
Proportion of Labor Costs in
Total Costs
Estimated Total Costs
($1,000) North Coast Mendocino 5 204 $14,129 $2,875 40% $7,188 North Central San Francisco 4 26 $34,837 $906 40% $2,265 South Central Coast Ventura 4 52 $14,737 $766 40% $1,915
South Coast Los Angeles 31 1,468 $24,310 $35,688 40% $89,220 All Coastal 44 1750 $22,991 $40,235 40% $100,588 Source: CA Employment Development Department: http://www.calmis.ca.gov/file/es202/cew-select.htm Table B-3: Aquaculture (NAICS Code 11251) 2001 Employment and Total Effects on Income in California. NAICS Codes
Detailed Industry
Title
Number of Establishments
Average Monthly
Employment
Average Annual
Pay
Total Annual Payroll ($1,000)
Proportion of Labor Costs in
Total Costs
Estimated Total Costs
($1,000)
11251
Total Animal aquaculture 84 564 $26,534 $14,965 40% $37,413
112511
Finfish farming and fish hatcheries 64 415 $25,068 $10,405 40% $26,013
112512 farming Shellfish
14 135 $31,951 $4,303 40% $10,758
112519 Other animal aquaculture 7 14 $18,024 $257 40% $643
Source: CA Employment Development Department: http://www.calmis.ca.gov/file/es202/cew-select.htm
138

NOEP Appendix C: California Marine Research Institutions Telonicher Marine Laboratory (Humboldt State University) Trinidad, CA 95570 < http://www.humboldt.edu/~marinelb/> Bodega Marine Laboratory (cooperative program UC Davis and UC Berkeley) Bodega Bay, CA 94923-0247 < http://www-bml.ucdavis.edu/> Romberg Tiburon Center (San Francisco State University) Tiburon, CA 94920 < http://www.rtc.sfsu.edu/> Institute of Marine Science (UC Santa Cruz) Long Marine Lab (UC Santa Cruz) Santa Cruz, CA 95064 < http://ims.ucsc.edu/> Elkhorn Slough National Estuarine Research Reserve Moss Landing, CA 95039 <http://www.elkhornslough.org/> Moss Landing Marine Laboratories (California State University) Moss Landing, CA 95039 < http://arkeia.mlml.calstate.edu/> Monterey Bay Aquarium Research Institute (MBARI) Moss Landing, CA 95039-9644 < http://www.mbari.org/default.htm> Naval Postgraduate School Monterey, CA 93943 < http://www.nps.navy.mil/> Hopkins Marine Station (Stanford University) Pacific Grove, CA 93950-3094< http://www.marine.stanford.edu/> Santa Barbara Marine Science Institute (UC Santa Barbara) < http://www.msi.ucsb.edu/> Santa Barbara, CA 93106-6150 Santa Cruz Laboratory Santa Cruz, CA 95060 < http://santacruz.nmfs.noaa.gov/index.php>
139
NOEP Wrigley Institute for Environmental Studies (University of Southern California) Los Angeles, California 90089-0371 < http://wrigley.usc.edu/> and Wrigley Marine Science Center Avalon, California 90704 Marine Science Center (UC Los Angeles) Los Angeles, CA 90095-1606 < http://www.msc.ucla.edu/> Southern California Marine Institute in Long Beach (cooperative program California State University, University of Southern California, and Occidental College) Long Beach, CA 90803 <http://www.longbeachmarineinst.com/> Marine Conservation Research Institute (MCRI) (Aquarium of the Pacific) Long Beach, CA 90802 < http://www.aquariumofpacific.org/MCRI/> Kerckhoff Marine Lab, California Institute of Technology Corona Del Mar, CA 92625 <http://www.cco.caltech.edu/~mirsky/kml.htm> Pacific Marine Mammal Center Laguna Beach, CA 92651 http://www.pacificmmc.org/ The Ocean Institute Dana Point, CA 92629 < http://www.ocean-institute.org/> Scripps Institution of Oceanography-UC San Diego La Jolla, CA 92093-0233 < http://sio.ucsd.edu/>
Hubbs Sea World Research Institute (San Diego State University) San Diego, CA 92109 < http://www.hswri.org/> Cetacean Behavior Laboratory (San Diego State University) San Diego, CA 92182 < http://www.sci.sdsu.edu/CBL/CBLHome.html>
140
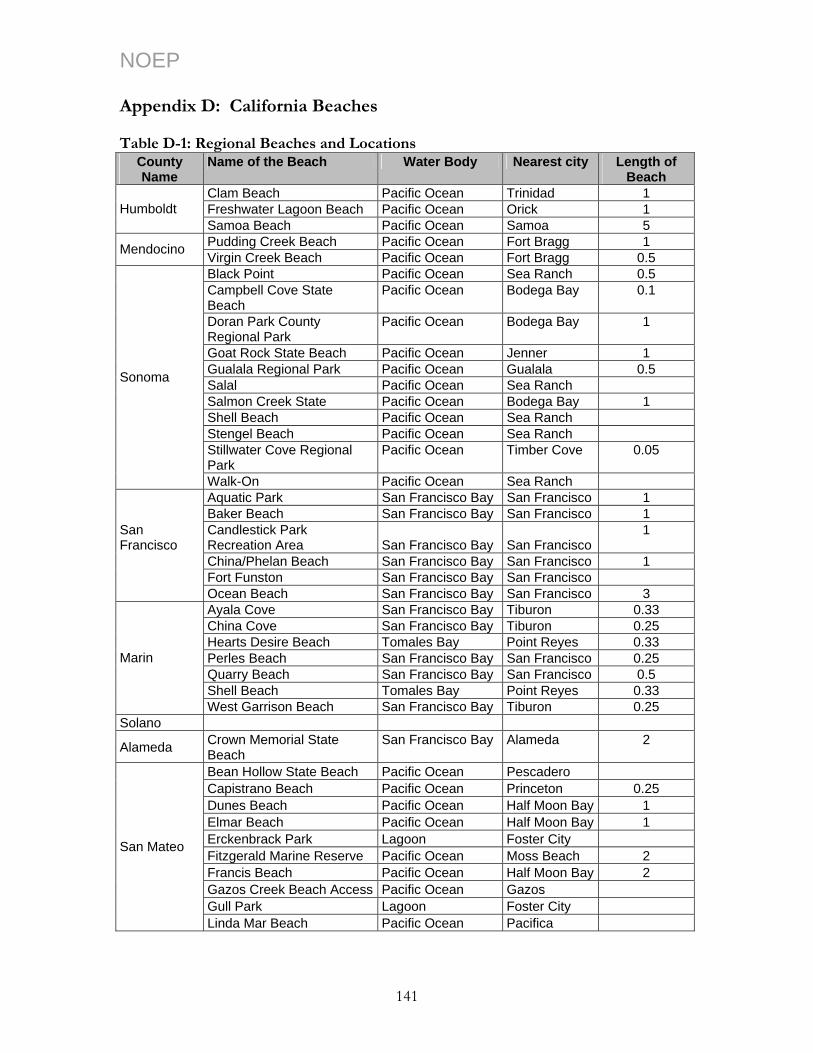
NOEP Appendix D: California Beaches Table D-1: Regional Beaches and Locations
County Name
Name of the Beach Water Body Nearest city Length of Beach
Clam Beach Pacific Ocean Trinidad 1 Freshwater Lagoon Beach Pacific Ocean Orick 1 Humboldt Samoa Beach Pacific Ocean Samoa 5 Pudding Creek Beach Pacific Ocean Fort Bragg 1 Mendocino Virgin Creek Beach Pacific Ocean Fort Bragg 0.5 Black Point Pacific Ocean Sea Ranch 0.5 Campbell Cove State Beach
Pacific Ocean Bodega Bay 0.1
Doran Park County Regional Park
Pacific Ocean Bodega Bay 1
Goat Rock State Beach Pacific Ocean Jenner 1 Gualala Regional Park Pacific Ocean Gualala 0.5 Salal Pacific Ocean Sea Ranch Salmon Creek State Pacific Ocean Bodega Bay 1 Shell Beach Pacific Ocean Sea Ranch Stengel Beach Pacific Ocean Sea Ranch Stillwater Cove Regional Park
Pacific Ocean Timber Cove 0.05
Sonoma
Walk-On Pacific Ocean Sea Ranch Aquatic Park San Francisco Bay San Francisco 1 Baker Beach San Francisco Bay San Francisco 1 Candlestick Park Recreation Area San Francisco Bay San Francisco
1
China/Phelan Beach San Francisco Bay San Francisco 1 Fort Funston San Francisco Bay San Francisco
San Francisco
Ocean Beach San Francisco Bay San Francisco 3 Ayala Cove San Francisco Bay Tiburon 0.33 China Cove San Francisco Bay Tiburon 0.25 Hearts Desire Beach Tomales Bay Point Reyes 0.33 Perles Beach San Francisco Bay San Francisco 0.25 Quarry Beach San Francisco Bay San Francisco 0.5 Shell Beach Tomales Bay Point Reyes 0.33
Marin
West Garrison Beach San Francisco Bay Tiburon 0.25 Solano
Alameda Crown Memorial State Beach
San Francisco Bay Alameda 2
Bean Hollow State Beach Pacific Ocean Pescadero Capistrano Beach Pacific Ocean Princeton 0.25 Dunes Beach Pacific Ocean Half Moon Bay 1 Elmar Beach Pacific Ocean Half Moon Bay 1 Erckenbrack Park Lagoon Foster City Fitzgerald Marine Reserve Pacific Ocean Moss Beach 2 Francis Beach Pacific Ocean Half Moon Bay 2 Gazos Creek Beach Access Pacific Ocean Gazos Gull Park Lagoon Foster City
San Mateo
Linda Mar Beach Pacific Ocean Pacifica
141
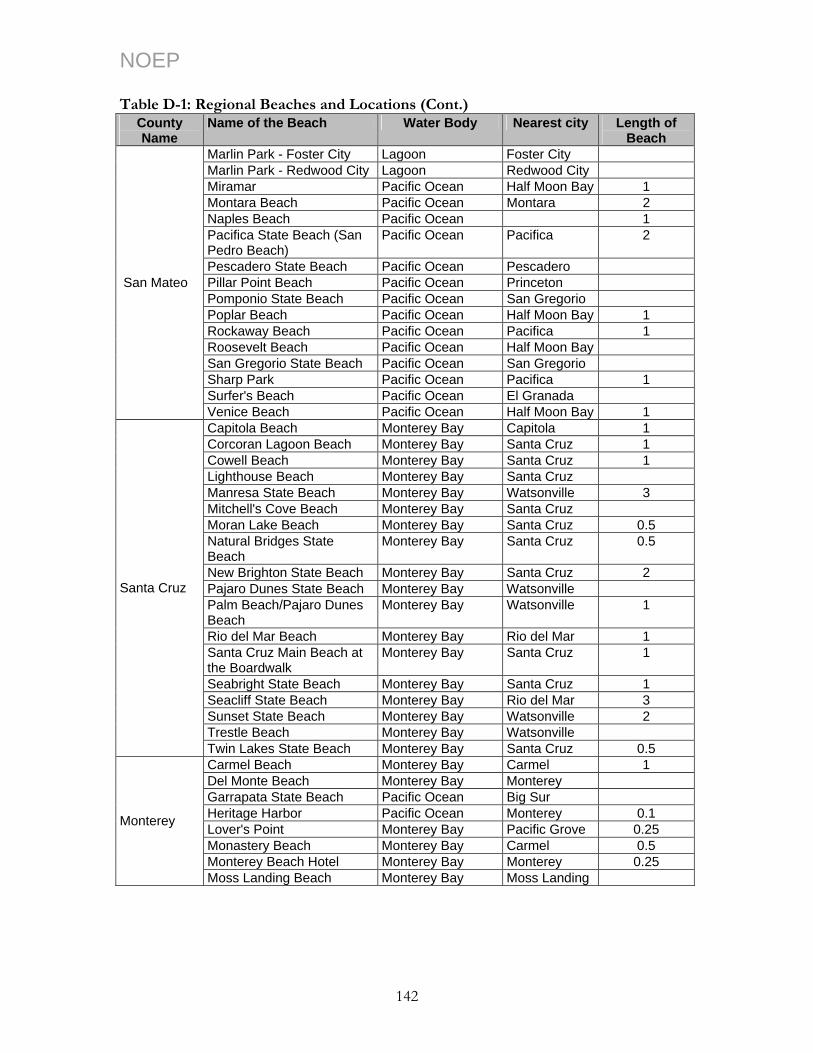
NOEP Table D-1: Regional Beaches and Locations (Cont.)
County Name
Name of the Beach Water Body Nearest city Length of Beach
Marlin Park - Foster City Lagoon Foster City Marlin Park - Redwood City Lagoon Redwood City Miramar Pacific Ocean Half Moon Bay 1 Montara Beach Pacific Ocean Montara 2 Naples Beach Pacific Ocean 1 Pacifica State Beach (San Pedro Beach)
Pacific Ocean Pacifica 2
Pescadero State Beach Pacific Ocean Pescadero Pillar Point Beach Pacific Ocean Princeton Pomponio State Beach Pacific Ocean San Gregorio Poplar Beach Pacific Ocean Half Moon Bay 1 Rockaway Beach Pacific Ocean Pacifica 1 Roosevelt Beach Pacific Ocean Half Moon Bay San Gregorio State Beach Pacific Ocean San Gregorio Sharp Park Pacific Ocean Pacifica 1 Surfer's Beach Pacific Ocean El Granada
San Mateo
Venice Beach Pacific Ocean Half Moon Bay 1 Capitola Beach Monterey Bay Capitola 1 Corcoran Lagoon Beach Monterey Bay Santa Cruz 1 Cowell Beach Monterey Bay Santa Cruz 1 Lighthouse Beach Monterey Bay Santa Cruz Manresa State Beach Monterey Bay Watsonville 3 Mitchell's Cove Beach Monterey Bay Santa Cruz Moran Lake Beach Monterey Bay Santa Cruz 0.5 Natural Bridges State Beach
Monterey Bay Santa Cruz 0.5
New Brighton State Beach Monterey Bay Santa Cruz 2 Pajaro Dunes State Beach Monterey Bay Watsonville Palm Beach/Pajaro Dunes Beach
Monterey Bay Watsonville 1
Rio del Mar Beach Monterey Bay Rio del Mar 1 Santa Cruz Main Beach at the Boardwalk
Monterey Bay Santa Cruz 1
Seabright State Beach Monterey Bay Santa Cruz 1 Seacliff State Beach Monterey Bay Rio del Mar 3 Sunset State Beach Monterey Bay Watsonville 2 Trestle Beach Monterey Bay Watsonville
Santa Cruz
Twin Lakes State Beach Monterey Bay Santa Cruz 0.5 Carmel Beach Monterey Bay Carmel 1 Del Monte Beach Monterey Bay Monterey Garrapata State Beach Pacific Ocean Big Sur Heritage Harbor Pacific Ocean Monterey 0.1 Lover's Point Monterey Bay Pacific Grove 0.25 Monastery Beach Monterey Bay Carmel 0.5 Monterey Beach Hotel Monterey Bay Monterey 0.25
Monterey
Moss Landing Beach Monterey Bay Moss Landing
142
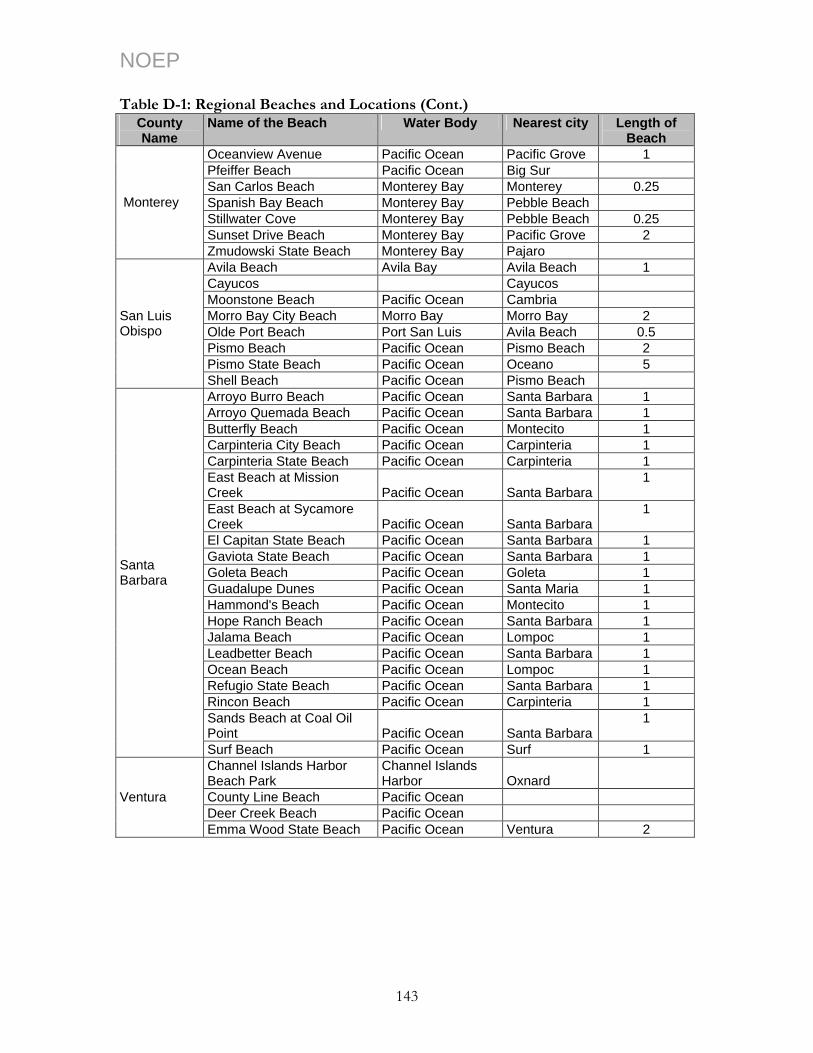
NOEP Table D-1: Regional Beaches and Locations (Cont.)
County Name
Name of the Beach Water Body Nearest city Length of Beach
Oceanview Avenue Pacific Ocean Pacific Grove 1 Pfeiffer Beach Pacific Ocean Big Sur San Carlos Beach Monterey Bay Monterey 0.25 Spanish Bay Beach Monterey Bay Pebble Beach Stillwater Cove Monterey Bay Pebble Beach 0.25 Sunset Drive Beach Monterey Bay Pacific Grove 2
Monterey
Zmudowski State Beach Monterey Bay Pajaro Avila Beach Avila Bay Avila Beach 1 Cayucos Cayucos Moonstone Beach Pacific Ocean Cambria Morro Bay City Beach Morro Bay Morro Bay 2 Olde Port Beach Port San Luis Avila Beach 0.5 Pismo Beach Pacific Ocean Pismo Beach 2 Pismo State Beach Pacific Ocean Oceano 5
San Luis Obispo
Shell Beach Pacific Ocean Pismo Beach Arroyo Burro Beach Pacific Ocean Santa Barbara 1 Arroyo Quemada Beach Pacific Ocean Santa Barbara 1 Butterfly Beach Pacific Ocean Montecito 1 Carpinteria City Beach Pacific Ocean Carpinteria 1 Carpinteria State Beach Pacific Ocean Carpinteria 1 East Beach at Mission Creek Pacific Ocean Santa Barbara
1
East Beach at Sycamore Creek Pacific Ocean Santa Barbara
1
El Capitan State Beach Pacific Ocean Santa Barbara 1 Gaviota State Beach Pacific Ocean Santa Barbara 1 Goleta Beach Pacific Ocean Goleta 1 Guadalupe Dunes Pacific Ocean Santa Maria 1 Hammond's Beach Pacific Ocean Montecito 1 Hope Ranch Beach Pacific Ocean Santa Barbara 1 Jalama Beach Pacific Ocean Lompoc 1 Leadbetter Beach Pacific Ocean Santa Barbara 1 Ocean Beach Pacific Ocean Lompoc 1 Refugio State Beach Pacific Ocean Santa Barbara 1 Rincon Beach Pacific Ocean Carpinteria 1 Sands Beach at Coal Oil Point Pacific Ocean Santa Barbara
1
Santa Barbara
Surf Beach Pacific Ocean Surf 1 Channel Islands Harbor Beach Park
Channel Islands Harbor Oxnard
County Line Beach Pacific Ocean Deer Creek Beach Pacific Ocean
Ventura
Emma Wood State Beach Pacific Ocean Ventura 2
143
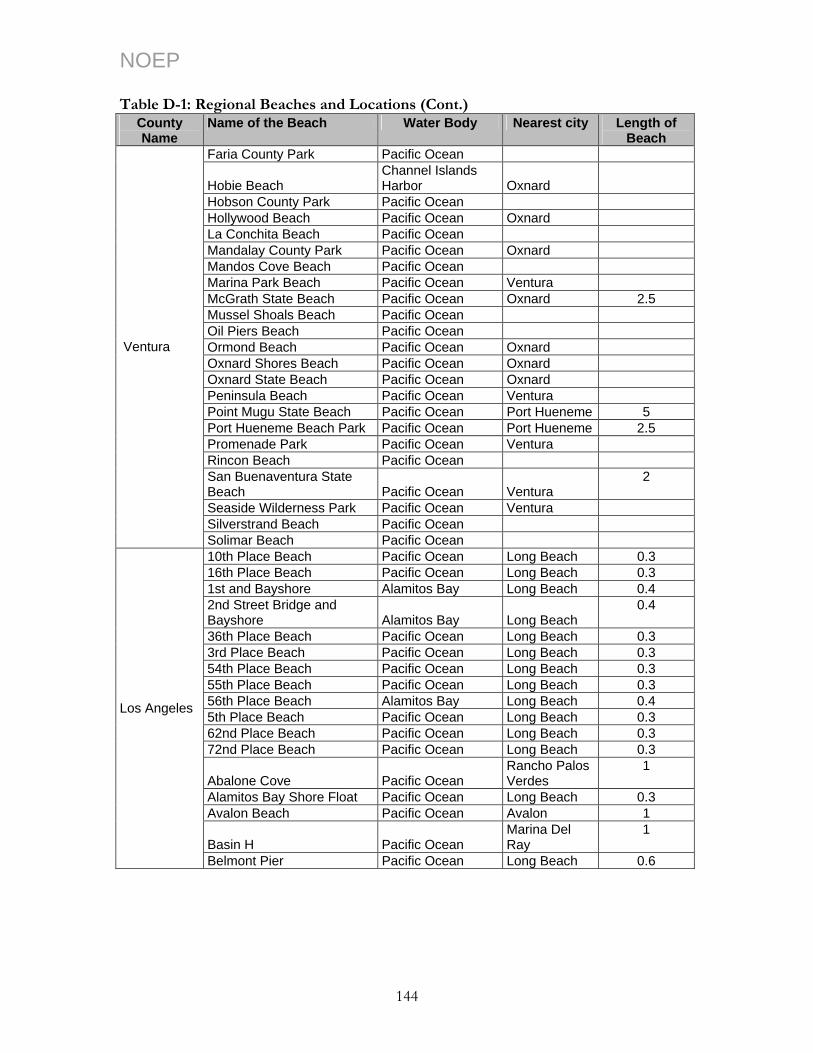
NOEP Table D-1: Regional Beaches and Locations (Cont.)
County Name
Name of the Beach Water Body Nearest city Length of Beach
Faria County Park Pacific Ocean
Hobie Beach Channel Islands Harbor Oxnard
Hobson County Park Pacific Ocean Hollywood Beach Pacific Ocean Oxnard La Conchita Beach Pacific Ocean Mandalay County Park Pacific Ocean Oxnard Mandos Cove Beach Pacific Ocean Marina Park Beach Pacific Ocean Ventura McGrath State Beach Pacific Ocean Oxnard 2.5 Mussel Shoals Beach Pacific Ocean Oil Piers Beach Pacific Ocean Ormond Beach Pacific Ocean Oxnard Oxnard Shores Beach Pacific Ocean Oxnard Oxnard State Beach Pacific Ocean Oxnard Peninsula Beach Pacific Ocean Ventura Point Mugu State Beach Pacific Ocean Port Hueneme 5 Port Hueneme Beach Park Pacific Ocean Port Hueneme 2.5 Promenade Park Pacific Ocean Ventura Rincon Beach Pacific Ocean San Buenaventura State Beach Pacific Ocean Ventura
2
Seaside Wilderness Park Pacific Ocean Ventura Silverstrand Beach Pacific Ocean
Ventura
Solimar Beach Pacific Ocean 10th Place Beach Pacific Ocean Long Beach 0.3 16th Place Beach Pacific Ocean Long Beach 0.3 1st and Bayshore Alamitos Bay Long Beach 0.4 2nd Street Bridge and Bayshore Alamitos Bay Long Beach
0.4
36th Place Beach Pacific Ocean Long Beach 0.3 3rd Place Beach Pacific Ocean Long Beach 0.3 54th Place Beach Pacific Ocean Long Beach 0.3 55th Place Beach Pacific Ocean Long Beach 0.3 56th Place Beach Alamitos Bay Long Beach 0.4 5th Place Beach Pacific Ocean Long Beach 0.3 62nd Place Beach Pacific Ocean Long Beach 0.3 72nd Place Beach Pacific Ocean Long Beach 0.3
Abalone Cove Pacific Ocean Rancho Palos Verdes
1
Alamitos Bay Shore Float Pacific Ocean Long Beach 0.3 Avalon Beach Pacific Ocean Avalon 1
Basin H Pacific Ocean Marina Del Ray
1
Los Angeles
Belmont Pier Pacific Ocean Long Beach 0.6
144

NOEP Table D-1: Regional Beaches and Locations (Cont.)
County Name
Name of the Beach Water Body Nearest city Length of Beach
Big Rock Beach Pacific Ocean Malibu 0.3
Bluff Cove Pacific Ocean Palos Verde Estates
Broad Beach Pacific Ocean Malibu 1 Cabrillo Beach Pacific Ocean Los Angeles 1 Colorado Lagoon-Center Alamitos Bay Los Angeles 0.4 Colorado Lagoon-North Alamitos Bay Los Angeles 0.4 Colorado Lagoon-South Alamitos Bay Los Angeles 0.4 Coronado Avenue Beach Pacific Ocean Los Angeles 0.3 Corral Beach Pacific Ocean Malibu 1
Los Angeles
Dan Blocker Beach Pacific Ocean Malibu 1 Aliso County Beach Park Pacific Ocean Laguna Beach Bolsa Chica State Beach Park Pacific Ocean
Huntington Beach
3
Capistrano Bay District Pacific Ocean Dana Point 1 Capistrano County Beach Pacific Ocean Dana Point 1 Corona Del Mar State Beach Pacific Ocean
Newport Beach
0.5
Crystal Cove State Beach Park Pacific Ocean
Newport Beach
3.2
Dana Point Harbor Pacific Ocean Dana Point 3 Doheny State Beach Park Pacific Ocean Dana Point 1 Emerald Bay Pacific Ocean Laguna Beach 0.4
Huntington City Beach Pacific Ocean Huntington Beach
2
Huntington Harbour Pacific Ocean Huntington Beach
38??
Huntington State Beach Pacific Ocean Huntington Beach
2
Laguna Beach Pacific Ocean Laguna Beach 4 Little Corona - Cameo Shores Pacific Ocean
Newport Beach
0.5
Monarch Beach Pacific Ocean Dana Point 1
Newport Bay Pacific Ocean Newport Beach
39??
Newport Beach Pacific Ocean Newport Beach
6
Poche County Beach Pacific Ocean San Clemente 0.2 Salt Creek Beach Park Pacific Ocean Dana Point 0.2 San Clemente City Beach Pacific Ocean San Clemente 2 San Clemente State Beach Pacific Ocean San Clemente 1 Seal Beach Pacific Ocean Seal Beach South Laguna Beach Pacific Ocean Laguna Beach Sunset Beach Pacific Ocean Sunset Beach 1
Orange
Surfside Pacific Ocean Seal Beach
145
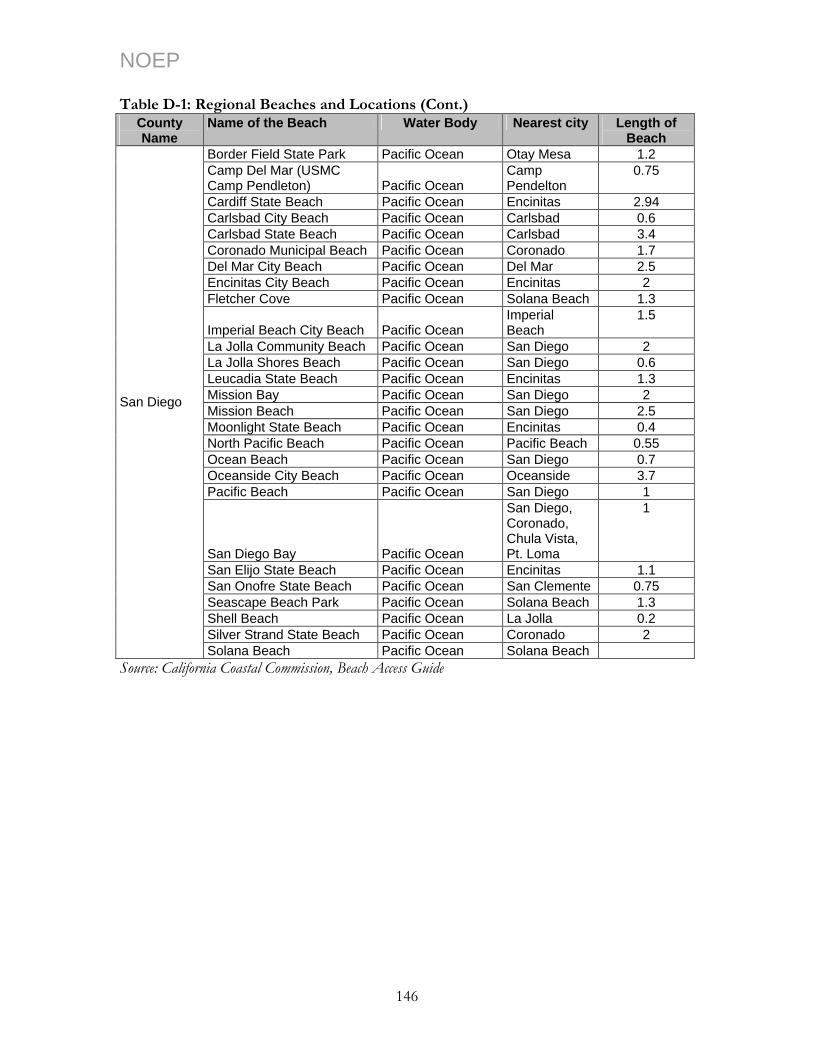
NOEP Table D-1: Regional Beaches and Locations (Cont.)
County Name
Name of the Beach Water Body Nearest city Length of Beach
Border Field State Park Pacific Ocean Otay Mesa 1.2 Camp Del Mar (USMC Camp Pendleton) Pacific Ocean
Camp Pendelton
0.75
Cardiff State Beach Pacific Ocean Encinitas 2.94 Carlsbad City Beach Pacific Ocean Carlsbad 0.6 Carlsbad State Beach Pacific Ocean Carlsbad 3.4 Coronado Municipal Beach Pacific Ocean Coronado 1.7 Del Mar City Beach Pacific Ocean Del Mar 2.5 Encinitas City Beach Pacific Ocean Encinitas 2 Fletcher Cove Pacific Ocean Solana Beach 1.3
Imperial Beach City Beach Pacific Ocean Imperial Beach
1.5
La Jolla Community Beach Pacific Ocean San Diego 2 La Jolla Shores Beach Pacific Ocean San Diego 0.6 Leucadia State Beach Pacific Ocean Encinitas 1.3 Mission Bay Pacific Ocean San Diego 2 Mission Beach Pacific Ocean San Diego 2.5 Moonlight State Beach Pacific Ocean Encinitas 0.4 North Pacific Beach Pacific Ocean Pacific Beach 0.55 Ocean Beach Pacific Ocean San Diego 0.7 Oceanside City Beach Pacific Ocean Oceanside 3.7 Pacific Beach Pacific Ocean San Diego 1
San Diego Bay Pacific Ocean
San Diego, Coronado, Chula Vista, Pt. Loma
1
San Elijo State Beach Pacific Ocean Encinitas 1.1 San Onofre State Beach Pacific Ocean San Clemente 0.75 Seascape Beach Park Pacific Ocean Solana Beach 1.3 Shell Beach Pacific Ocean La Jolla 0.2 Silver Strand State Beach Pacific Ocean Coronado 2
San Diego
Solana Beach Pacific Ocean Solana Beach Source: California Coastal Commission, Beach Access Guide
146
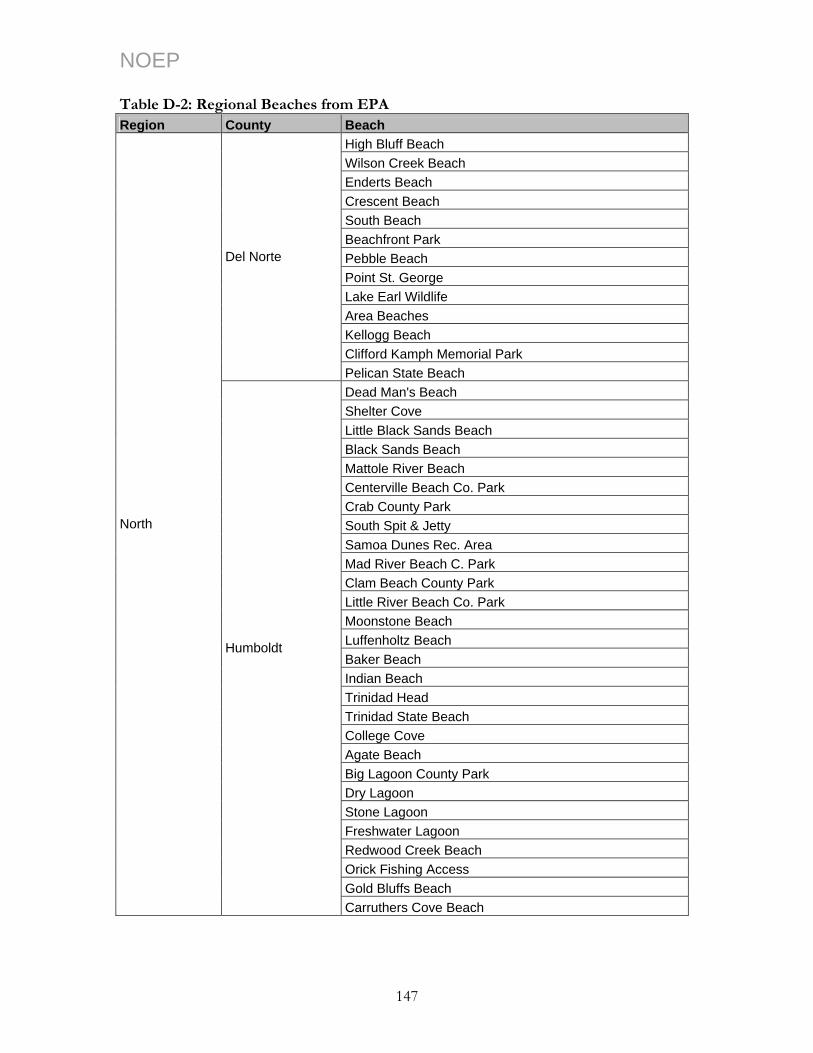
NOEP Table D-2: Regional Beaches from EPA Region County Beach
High Bluff Beach Wilson Creek Beach Enderts Beach Crescent Beach South Beach Beachfront Park Pebble Beach Point St. George Lake Earl Wildlife Area Beaches Kellogg Beach Clifford Kamph Memorial Park
Del Norte
Pelican State Beach Dead Man's Beach Shelter Cove Little Black Sands Beach Black Sands Beach Mattole River Beach Centerville Beach Co. Park Crab County Park South Spit & Jetty Samoa Dunes Rec. Area Mad River Beach C. Park Clam Beach County Park Little River Beach Co. Park Moonstone Beach Luffenholtz Beach Baker Beach Indian Beach Trinidad Head Trinidad State Beach College Cove Agate Beach Big Lagoon County Park Dry Lagoon Stone Lagoon Freshwater Lagoon Redwood Creek Beach Orick Fishing Access Gold Bluffs Beach
North
Humboldt
Carruthers Cove Beach
147
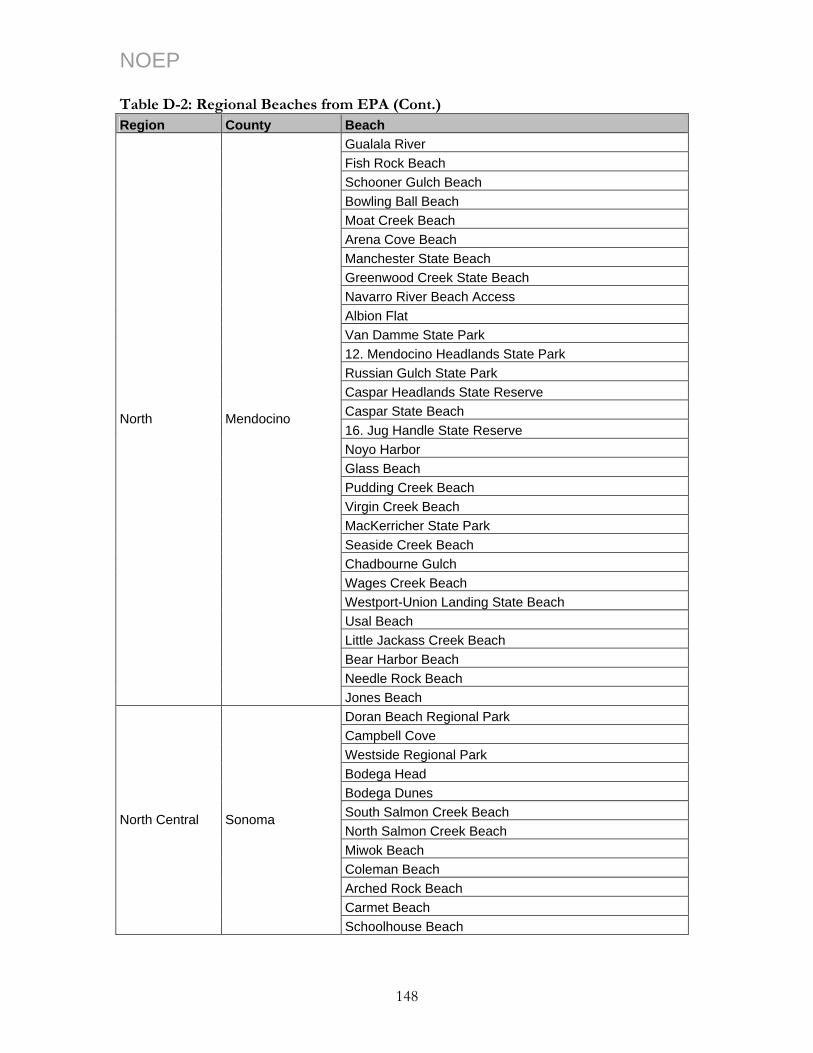
NOEP Table D-2: Regional Beaches from EPA (Cont.) Region County Beach
Gualala River Fish Rock Beach Schooner Gulch Beach Bowling Ball Beach Moat Creek Beach Arena Cove Beach Manchester State Beach Greenwood Creek State Beach Navarro River Beach Access Albion Flat Van Damme State Park 12. Mendocino Headlands State Park Russian Gulch State Park Caspar Headlands State Reserve Caspar State Beach 16. Jug Handle State Reserve Noyo Harbor Glass Beach Pudding Creek Beach Virgin Creek Beach MacKerricher State Park Seaside Creek Beach Chadbourne Gulch Wages Creek Beach Westport-Union Landing State Beach Usal Beach Little Jackass Creek Beach Bear Harbor Beach Needle Rock Beach
North Mendocino
Jones Beach Doran Beach Regional Park Campbell Cove Westside Regional Park Bodega Head Bodega Dunes South Salmon Creek Beach North Salmon Creek Beach Miwok Beach Coleman Beach Arched Rock Beach Carmet Beach
North Central Sonoma
Schoolhouse Beach
148

NOEP Table D-2: Regional Beaches from EPA (Cont.) Region County Beach
Portuguese Beach Gleason Beach Duncan's Landing Wright's Beach Shell Beach Blind Beach Goat Rock Beach North Jenner Beaches Russian Gulch Vista Point Fort Ross Reef Fort Ross Cove Timber Cove Stillwater Cove Regional Park Ocean Cove Gerstle Cove Stump Beach Fisk Mill Cove North Horseshoe Cove Black Point Beach Pebble Beach Stengel Beach Shell Beach Walk-On Beach
Sonoma
Gualala Point Regional Park Kirby Cove Bonita Cove Rodeo Beach Tennessee Cove Muir Beach Steep Ravine Beach Red Rock Beach Stinson Beach Bolinas Beach Agate Beach Palomarin Beach Wildcat Beach Kelham Beach Sculptured Beach Santa Maria Beach Limantour Beach Drakes Beach
North Central
Marin
Point Reyes Beach South
149

NOEP Table D-2: Regional Beaches from EPA (Cont.) Region County Beach
19. Point Reyes Beach North 20. Abbotts Lagoon Kehoe Beach McClures Beach Marshall Beach Hearts Desire Beach Shell Beach Alan Sieroty Beach Lawson's Landing
Marin
Dillon Beach Burton Memorial Beach Fort Funston Beach Ocean Beach Lands End Beach China Beach 6. Baker Beach 7. North Baker Beach 8. Crissy Field 9. Marina Green
North Central
San Francisco
Aquatic Park Ano Nuevo State Reserve The Fist Gazos Creek Access Pigeon Point Bean Hollow State Beach Pebble Beach Pescadero State Beach The Gulch Pomponio State Beach San Gregorio State Beach San Gregorio Private Beach Martin's Beach Cowell Ranch Beach Pelican Point Beach Francis Beach Venice Beach Dunes Beach Miramar Beach El Granada Beach Pillar Point Harbor Mavericks James V. Fitzgerald Marine Reserve
Central San Mateo
Montara State Beach
150
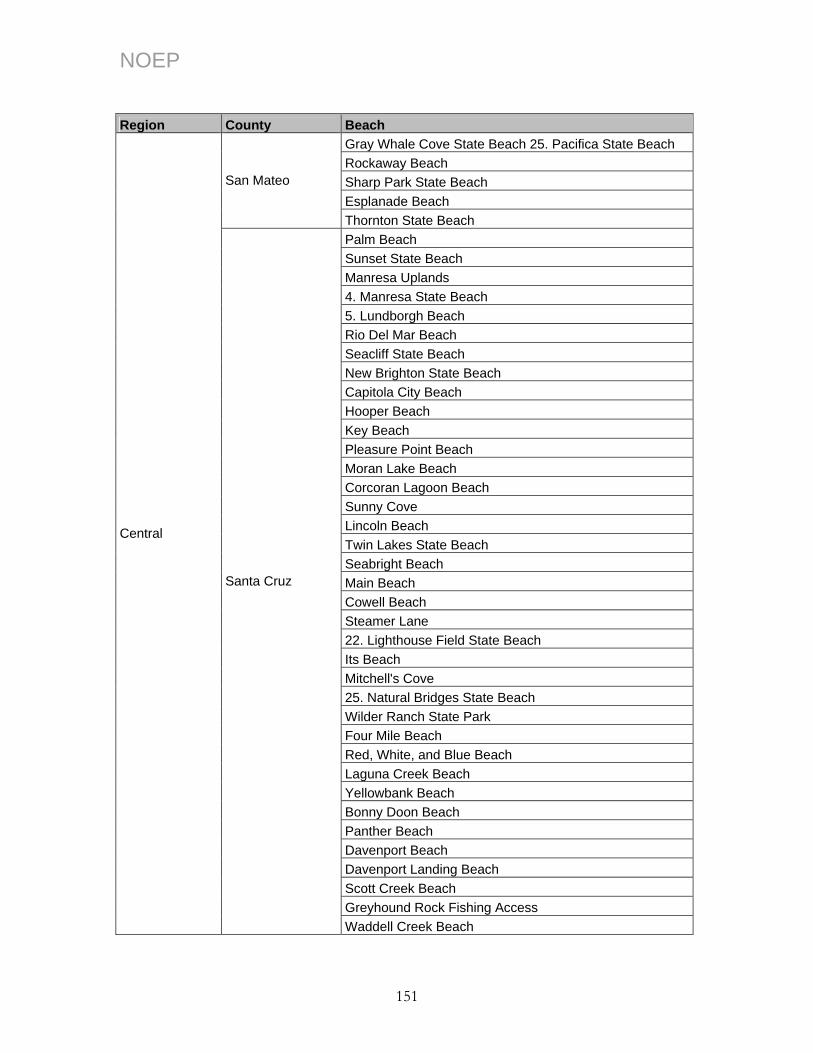
NOEP Region County Beach
Gray Whale Cove State Beach 25. Pacifica State Beach Rockaway Beach Sharp Park State Beach Esplanade Beach
San Mateo
Thornton State Beach Palm Beach Sunset State Beach Manresa Uplands 4. Manresa State Beach 5. Lundborgh Beach Rio Del Mar Beach Seacliff State Beach New Brighton State Beach Capitola City Beach Hooper Beach Key Beach Pleasure Point Beach Moran Lake Beach Corcoran Lagoon Beach Sunny Cove Lincoln Beach Twin Lakes State Beach Seabright Beach Main Beach Cowell Beach Steamer Lane 22. Lighthouse Field State Beach Its Beach Mitchell's Cove 25. Natural Bridges State Beach Wilder Ranch State Park Four Mile Beach Red, White, and Blue Beach Laguna Creek Beach Yellowbank Beach Bonny Doon Beach Panther Beach Davenport Beach Davenport Landing Beach Scott Creek Beach Greyhound Rock Fishing Access
Central
Santa Cruz
Waddell Creek Beach
151
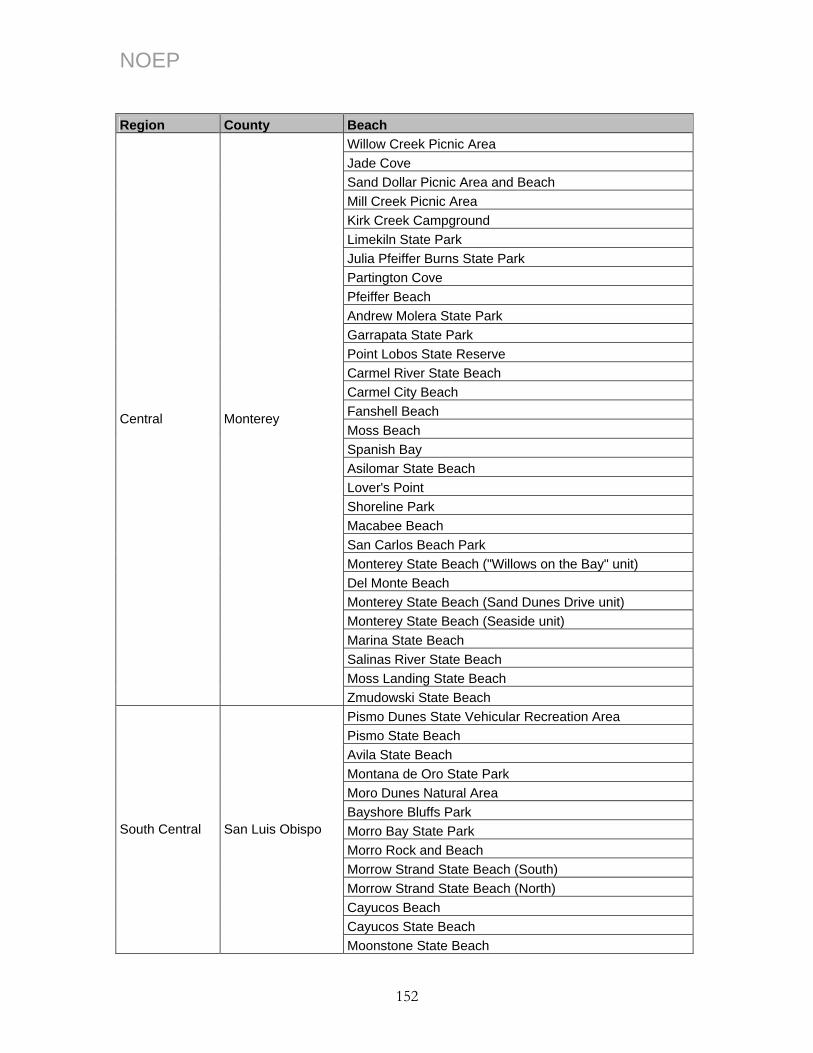
NOEP Region County Beach
Willow Creek Picnic Area Jade Cove Sand Dollar Picnic Area and Beach Mill Creek Picnic Area Kirk Creek Campground Limekiln State Park Julia Pfeiffer Burns State Park Partington Cove Pfeiffer Beach Andrew Molera State Park Garrapata State Park Point Lobos State Reserve Carmel River State Beach Carmel City Beach Fanshell Beach Moss Beach Spanish Bay Asilomar State Beach Lover's Point Shoreline Park Macabee Beach San Carlos Beach Park Monterey State Beach ("Willows on the Bay" unit) Del Monte Beach Monterey State Beach (Sand Dunes Drive unit) Monterey State Beach (Seaside unit) Marina State Beach Salinas River State Beach Moss Landing State Beach
Central Monterey
Zmudowski State Beach Pismo Dunes State Vehicular Recreation Area Pismo State Beach Avila State Beach Montana de Oro State Park Moro Dunes Natural Area Bayshore Bluffs Park Morro Bay State Park Morro Rock and Beach Morrow Strand State Beach (South) Morrow Strand State Beach (North) Cayucos Beach Cayucos State Beach
South Central San Luis Obispo
Moonstone State Beach
152
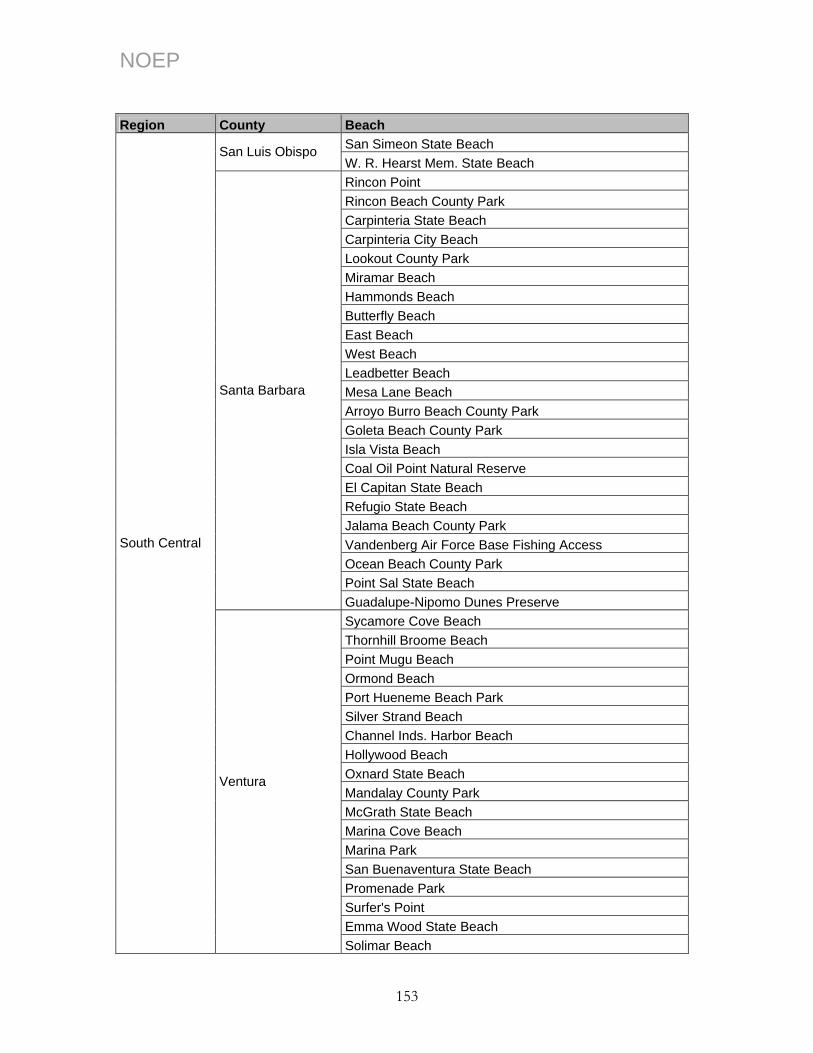
NOEP Region County Beach
San Simeon State Beach San Luis Obispo W. R. Hearst Mem. State Beach Rincon Point Rincon Beach County Park Carpinteria State Beach Carpinteria City Beach Lookout County Park Miramar Beach Hammonds Beach Butterfly Beach East Beach West Beach Leadbetter Beach Mesa Lane Beach Arroyo Burro Beach County Park Goleta Beach County Park Isla Vista Beach Coal Oil Point Natural Reserve El Capitan State Beach Refugio State Beach Jalama Beach County Park Vandenberg Air Force Base Fishing Access Ocean Beach County Park Point Sal State Beach
Santa Barbara
Guadalupe-Nipomo Dunes Preserve Sycamore Cove Beach Thornhill Broome Beach Point Mugu Beach Ormond Beach Port Hueneme Beach Park Silver Strand Beach Channel Inds. Harbor Beach Hollywood Beach Oxnard State Beach Mandalay County Park McGrath State Beach Marina Cove Beach Marina Park San Buenaventura State Beach Promenade Park Surfer's Point Emma Wood State Beach
South Central
Ventura
Solimar Beach
153
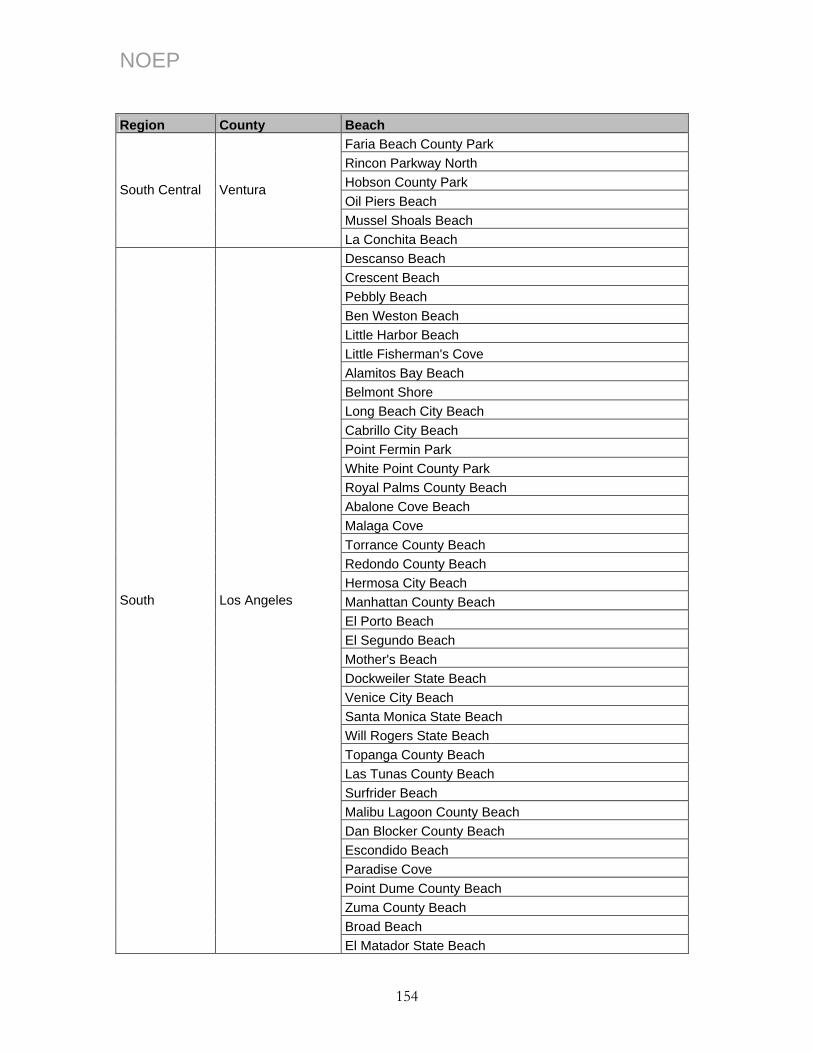
NOEP Region County Beach
Faria Beach County Park Rincon Parkway North Hobson County Park Oil Piers Beach Mussel Shoals Beach
South Central Ventura
La Conchita Beach Descanso Beach Crescent Beach Pebbly Beach Ben Weston Beach Little Harbor Beach Little Fisherman's Cove Alamitos Bay Beach Belmont Shore Long Beach City Beach Cabrillo City Beach Point Fermin Park White Point County Park Royal Palms County Beach Abalone Cove Beach Malaga Cove Torrance County Beach Redondo County Beach Hermosa City Beach Manhattan County Beach El Porto Beach El Segundo Beach Mother's Beach Dockweiler State Beach Venice City Beach Santa Monica State Beach Will Rogers State Beach Topanga County Beach Las Tunas County Beach Surfrider Beach Malibu Lagoon County Beach Dan Blocker County Beach Escondido Beach Paradise Cove Point Dume County Beach Zuma County Beach Broad Beach
South Los Angeles
El Matador State Beach
154

NOEP Region County Beach
La Piedra State Beach El Pescador State Beach Nicholas Canyon County Beach Leo Carillo State Beach
Los Angeles
County Line Beach San Clemente State Beach San Clemente City Beach Poche Beach Capistrano Beach Doheny State Beach Salt Creek County Beach 1,000 Steps Beach West Street Beach Aliso Creek County Beach Victoria Beach Brooks Beach Main Beach Picnic Beach Rockpile Beach Diver's Cove Shaw's Cove Crescent Bay Point Park Crystal Cove State Park Little Corona del Mar Beach Corona del Mar State Beach Rocky Point China Cove Beach Bayside Drive County Beach West Jetty View Park Balboa Beach Newport Beach Municipal Beach Santa Ana River County Beach Huntington State Beach Huntington City Beach Bolsa Chica State Beach Sunset Beach Surfside Beach
Orange
Seal Beach Border Field State Park Imperial Beach Silver Strand State Beach Coronado Shores Beach
South
San Diego
Corondao City Beach
155
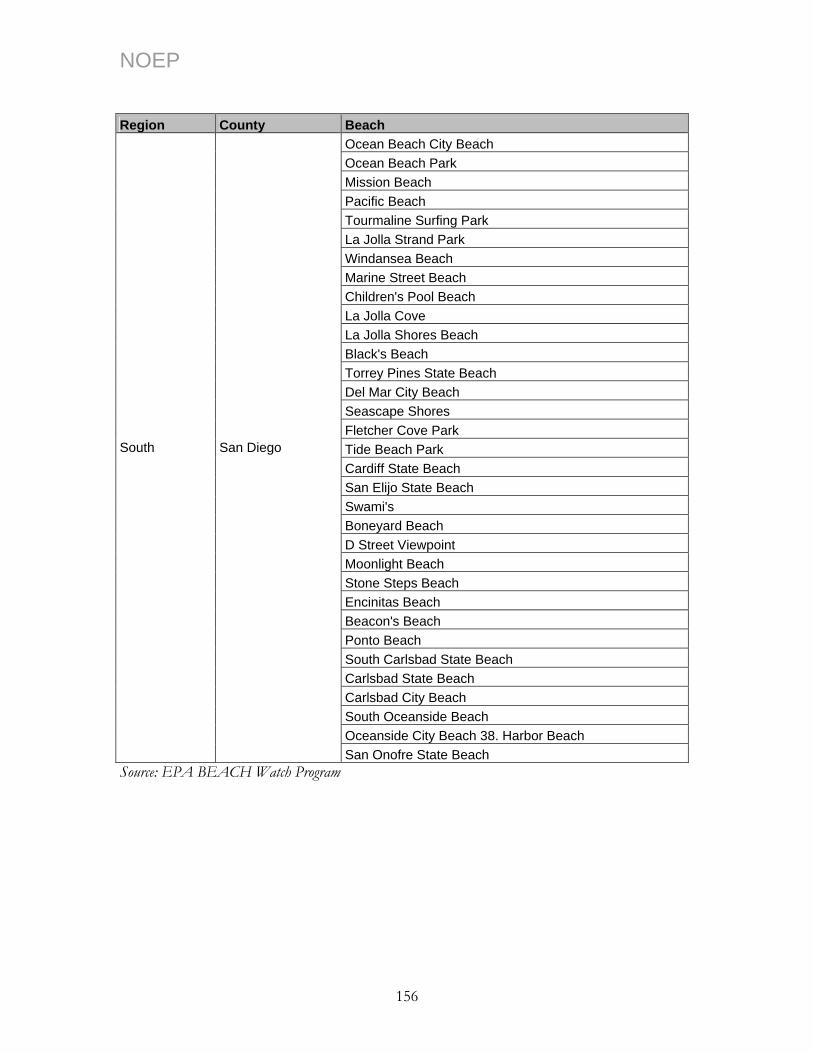
NOEP Region County Beach
Ocean Beach City Beach Ocean Beach Park Mission Beach Pacific Beach Tourmaline Surfing Park La Jolla Strand Park Windansea Beach Marine Street Beach Children's Pool Beach La Jolla Cove La Jolla Shores Beach Black's Beach Torrey Pines State Beach Del Mar City Beach Seascape Shores Fletcher Cove Park Tide Beach Park Cardiff State Beach San Elijo State Beach Swami's Boneyard Beach D Street Viewpoint Moonlight Beach Stone Steps Beach Encinitas Beach Beacon's Beach Ponto Beach South Carlsbad State Beach Carlsbad State Beach Carlsbad City Beach South Oceanside Beach Oceanside City Beach 38. Harbor Beach
South San Diego
San Onofre State Beach Source: EPA BEACH Watch Program
156