Embed Size (px)
Citation preview

BOE
California’s Foreign Language Speakers and Business Owners Not Proficient in English -
2005 Estimates
By
Beth L. Lindley Research and Statistics Section
California State Board of Equalization
for
Equal Employment Opportunity Office (EEO) California State Board of Equalization
April 2007
This report provides contextual information to supplement the BOE’s 2005-06 biennial language survey.

California’s Foreign Language Speakers and Business Owners Not Proficient in English – 2005 Estimates 2
TABLE OF CONTENTS I. Executive Summary 5
Chart 1. California’s Population 5+ Years by Language Category – 2005 American Community Survey 5
Chart 2. Percent Californians Who Are Not English Proficient, Ages 18 - 64 Years by Language Category – 2005 American Community Survey 6
Chart 3. California’s Self-Employed Owners of Non-Incorporated Businesses by Language Category – Census 2000 6
Chart 4. California’s Foreign Language Speakers Who Own a Non-Incorporated Business by Language Category – Census 2000 6
Table 1. California’s 2005 Not-English Proficient Business Owners – 3,000 and Over 7 Table 2. California’s 2005 Not-English Proficient Business Owners – 1,000 to 1,999 8
II. Purpose 9 III. Background 9
California’s Foreign Language Speakers 9 Chart 5. California’s Foreign Language Speakers 5+ Years by Language Category – 2005
American Community Survey 9 Chart 6. Percent Californians Who Are Not English Proficient, Ages 18 - 64 Years by
Language Category – 2005 American Community Survey (same as Chart 2) 9 Chart 7. Percent of Californians 25 Years and Over By Education Completed and English
Proficiency – 2000 Census 10 Chart 8. California’s Self-Employed Owners of Non-Incorporated Businesses by Language
Category – Census 2000 (same as Chart 3) 10 Chart 9. California’s Foreign Language Speakers by Language Category – 2000 Census 11 Chart 10. California’s Self-Employed Business Owners Speaking a Foreign Language by
Language Category – 2000 Census 11 Chart 11. Percent Californians Who Are Not English Proficient Among 18 - 64 Year Olds
Vs. Self-Employed by Language Category –2000 Census 11 Characteristics of Minority Owned Businesses 12 Creation of New Businesses Among Minorities and Immigrants 12 Immigrant Businesses 12
IV. Government Policy & Standards 13
Federal 13 California State and Local 14 Language Services Thresholds 14
Table 3. Thresholds for Providing Language Services to LEP Language Groups 15 V. Data Sources 15
Survey of Business Owners (SBO) 15 American Community Survey (ACS) 16 California Department of Education (CDE) Language Census 16
VI. Method 16
Calculating Business Density by Language Category 16 Chart 12. California’s Business Density Per 1,000 Persons 5+ Years by Race and Ethnicity 16 Chart 13. California’s Spanish Speakers by Race 17
California’s Foreign Language Speakers and Business Owners Not Proficient in English – 2005 Estimates 3
TABLE OF CONTENTS (Cont.)
Chart 14. California’s Speakers of Indo-European Languages Other than English and Spanish by Race 17
Chart 15. California’s Speakers of Asian or Pacific Island Languages by Race 17 Chart 16. California’s Speakers of Languages Other Than Indo-European, Asian, or Pacific
Island Languages by Race 17 Chart 17. California’s Speakers of Spanish by Ethnicity 18 Chart 18. California’s Speakers of Indo-European Other than English and Spanish by
Ethnicity 18 Chart 19. California’s Speakers of Asian or Pacific Island Languages by Ethnicity 18 Chart 20. California’s Speakers of Languages Other Than Indo-European, Asian, or Pacific
Island Languages by Ethnicity 18 Chart 21. California’s Business Density Per 1,000 Persons 5+ Years by Language Category 18
Estimating Population of Language Speakers 5+ Years from CDE Data Using ACS Percents 19 Table 4. Classification of CDE-Covered Languages Not Covered by the ACS 19 Chart 22. Percent of Californians Ages 5 - 17 Years from the Population 5+ Years by
Language Category – 2005 American Community Survey 20 Estimating California Business Owners Not Proficient in English 20
Chart 23. Percent of California’s Foreign Language Speakers Not Proficient in English by Language Spoken at Home – 2005 American Community Survey 21
VII. Results 21
Chart 24. Estimated California Business Owners, 500+ Speakers, Excluding Spanish Speakers, Not Proficient in English in 2005 – ACS Based Estimate 22
Chart 25. Estimated California Business Owners, 500+ Speakers, Excluding Spanish Speakers, Not Proficient in English in 2005 – CDE Based Estimate 23
Table 5. Alameda County Estimated NEP Business Owners in 2005 24 Table 6. Contra Costa County Estimated NEP Business Owners in 2005 24 Table 7. Fresno County Estimated NEP Business Owners in 2005 25 Table 8. Los Angeles County Estimated NEP Business Owners in 2005 25 Table 9. Orange County Estimated NEP Business Owners in 2005 26 Table 10. Riverside County Estimated NEP Business Owners in 2005 26 Table 11. Sacramento County Estimated NEP Business Owners in 2005 26 Table 12. San Bernardino County Estimated NEP Business Owners in 2005 27 Table 13. San Diego County Estimated NEP Business Owners in 2005 27 Table 14. San Francisco County Estimated NEP Business Owners in 2005 27 Table 15. San Joaquin County Estimated NEP Business Owners in 2005 28 Table 16. San Mateo County Estimated NEP Business Owners in 2005 28 Table 17. Santa Clara County Estimated NEP Business Owners in 2005 28 Table 18. Ventura County Estimated NEP Business Owners in 2005 29
VIII. California’s Foreign Language Communities 29
Arabic Speakers 29 Chart 26. California’s 127,603 Arabic Speakers: 2005 American Community Survey 29
Armenian Speakers 30 Chart 27. California’s 161,221 Armenian Speakers: 2005 American Community Survey 30
California’s Foreign Language Speakers and Business Owners Not Proficient in English – 2005 Estimates 4
TABLE OF CONTENTS (Cont.)
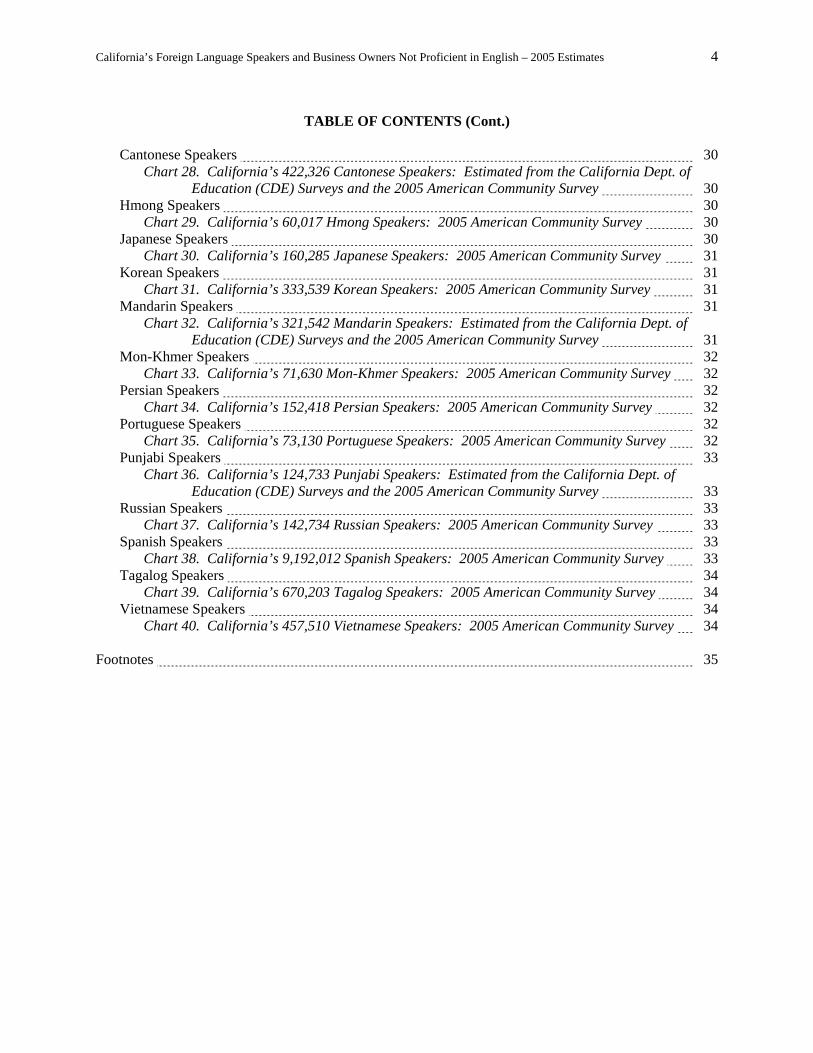
Cantonese Speakers 30
Chart 28. California’s 422,326 Cantonese Speakers: Estimated from the California Dept. of Education (CDE) Surveys and the 2005 American Community Survey 30
Hmong Speakers 30 Chart 29. California’s 60,017 Hmong Speakers: 2005 American Community Survey 30
Japanese Speakers 30 Chart 30. California’s 160,285 Japanese Speakers: 2005 American Community Survey 31
Korean Speakers 31 Chart 31. California’s 333,539 Korean Speakers: 2005 American Community Survey 31
Mandarin Speakers 31 Chart 32. California’s 321,542 Mandarin Speakers: Estimated from the California Dept. of
Education (CDE) Surveys and the 2005 American Community Survey 31 Mon-Khmer Speakers 32
Chart 33. California’s 71,630 Mon-Khmer Speakers: 2005 American Community Survey 32 Persian Speakers 32
Chart 34. California’s 152,418 Persian Speakers: 2005 American Community Survey 32 Portuguese Speakers 32
Chart 35. California’s 73,130 Portuguese Speakers: 2005 American Community Survey 32 Punjabi Speakers 33
Chart 36. California’s 124,733 Punjabi Speakers: Estimated from the California Dept. of Education (CDE) Surveys and the 2005 American Community Survey 33
Russian Speakers 33 Chart 37. California’s 142,734 Russian Speakers: 2005 American Community Survey 33
Spanish Speakers 33 Chart 38. California’s 9,192,012 Spanish Speakers: 2005 American Community Survey 33
Tagalog Speakers 34 Chart 39. California’s 670,203 Tagalog Speakers: 2005 American Community Survey 34
Vietnamese Speakers 34 Chart 40. California’s 457,510 Vietnamese Speakers: 2005 American Community Survey 34
Footnotes 35

California’s Foreign Language Speakers and Business Owners Not Proficient in English – 2005 Estimates 5
I. EXCUTIVE SUMMARY This study was done at the behest of the Equal Employment Opportunity Office (EEO) of the California State Board of Equalization (the Board). The Board’s Executive Director had requested contextual information to supplement the results from the 2005-06 biennial language survey. This report provides estimates of California’s not-English proficient (NEP) business owners that may help:
• identify languages for which written translations of Board materials may be made available and • provide guidance for bilingual staffing of district offices serving 14 counties.
The biennial survey is required by the Dymally-Alatorre Bilingual Services Act (GC Sec 7290-7299.8). It also requires any state agency serving a “substantial number” of non-English-speaking people to employ bilingual staff and to provide translated materials explaining agency services and translations of any documents the agency requires them to submit. With respect to State agencies, the act defines the term, “substantial number,” as “…a group whose members are not proficient in English and that comprise 5 percent of the people served by any local office or facility.” There are similar requirements of local governments, but the act lets them define the term, “substantial number.” Programs that receive Federal funds must also comply with Title VI of the 1964 Civil Rights Act and Executive Order 13166 which requires recipients to provide “meaningful access” to Limited-English-Proficient (LEP) persons. The Dymally-Alatorre Bilingual Services Act is more specific about criteria to use in providing language services. Some California State agencies have set numeric thresholds, in addition to the 5 percent mandate, for providing language services to persons that belong to a LEP language group. Healthy Families1 provides written translation when there are 3,000 enrollees or more statewide. Medi-Cal uses a written translation threshold of 3,000 eligible persons in a county or 1,000 in a zip code or 1,500 in two contiguous zip codes. Law enforcement agencies that receive Department of Justice (DOJ) funding must provide written translation when a foreign language population is 1,000 or more of the service population. On the local level, San Francisco and Oakland use a resident population threshold of 10,000. An estimated 13.8 million Californians five years and older spoke a foreign language in 2005, just over 2 in 5 residents. This is up 11.2 percent from the Census 2000 estimate of 12.4 million and about three times faster than the growth rate for the whole population five years and older of 3.8 percent. About half of foreign language speakers were not English proficient in both years.2 and 3
Chart 1
California's Population 5+ Years by Language Category - 2005 American Community Survey
English only, 57.7
Spanish, 28.2
Other Indo-European
languages, 4.2
Asian and Pacif ic Island
languages, 9.0
All other languages, 0.8
As shown in Chart 1, the most common foreign language is Spanish. In 2005, nearly 1 in 3 Californians spoke Spanish, 28 percent. However, over 2 in 3 foreign language speakers, 67 percent, spoke Spanish. Nearly 1 in 10 Californians spoke an Asian or Pacific Island Language. Among foreign language speakers, 1 in 5 did, 21 percent. About 1 in 25 California residents spoke an Indo-European language other than English or Spanish. The proportion was 1 in 10 among speakers of foreign languages. Less than 1 in 100 California residents spoke

California’s Foreign Language Speakers and Business Owners Not Proficient in English – 2005 Estimates 6
all other languages, about 2 percent of foreign languages speakers, or 1 in 50. English proficiency among foreign language speakers aged 18 - 64 years old differed by language category as seen in Chart 2. Nearly 57 percent, or about 3 in 5 Spanish speakers in this age group, were not proficient in English. Around 1 in 2 speakers of Asian and Pacific Island languages were not proficient, 51 percent. About 1 in 3 speakers of other Indo-European languages were not proficient, 32 percent. Nearly 3 in 10 speakers of all other languages were not proficient, 29 percent. A newly released U.S. Census 2000 report4 estimated that 1.2 million Californians were self-employed workers in their own non-incorporated business. Chart 3 shows that about 17 percent spoke Spanish. Around 8 percent spoke an Asian or Pacific Island Language. Nearly 6 percent spoke another Indo-European language. Just 1 percent spoke another language.
Chart 3 California's Self-Employed Owners of Non-Incorporated Businesses by
Language Category - 2000 Census
English only, 68.7
Spanish, 16.7
Other Indo-European, 5.7
Asian and Pacif ic Island, 7.7
All other languages, 1.1
Chart 4
California's Foreign Language Speakers Who Own a Non-Incorporated Business by Language Category - Census 2000
31.2
15.65.8
1.1
22.1
9.1
12.5
2.60
10
20
30
40
50
60
Spanish Asian and Pacif icIsland
Other Indo-European
All otherlanguages
Perc
ent F
orei
gn L
angu
age
Ow
ners Not English Proficient English Proficient
Chart 2 Percent Californians Who Are not English Proficient, Ages 18 - 64 Years
by Language Category - 2005 American Community Survey
28.7
31.7
50.8
56.9
0.0 10.0 20.0 30.0 40.0 50.0 60.0
All other languages
Other Indo-European
Asian and Pacif icIsland
Spanish
Chart 4 compares the share of non-incorporated businesses owned by foreign language speakers by language category and the portions in each category not proficient in English. Among Spanish speaking business owners, 59 percent (31.2% of all foreign language owners) were not proficient in English. About 63 percent of business owners that spoke an Asian or Pacific Island language (15.6% of total) were not proficient. The figures were 32 percent for business owners speaking another Indo-European language and 30 percent for business owners that speak all other languages. Evidence suggests that immigrants start businesses at a higher rate than natives. They are more likely to start rather than purchase a business. Most use their own funds to cover start-up costs. According to the 2005 Kauffman Index of Entrepreneurial Activity, 350 out of every 100,000 immigrants started a business compared to 280 per 100,000 native born persons.5 A 2004 University of Iowa study of immigrant business owners found that more than one-third began operating out of their homes or cars.6 Start-up

California’s Foreign Language Speakers and Business Owners Not Proficient in English – 2005 Estimates 7
costs ranged from $450 to $70,000. The mean was $24,789 and the median $18,000. Most relied on their own funds to start their businesses. In a 1994 study of business owners in a Chicago neighborhood with many immigrant businesses,7 over 60 percent of minority ethnic owners started their own businesses compared to just 29 percent of non-Hispanic white owners. Korean owners had more prior entrepreneurial experience and the strongest capital position. However, they were the least likely to be English-proficient. Just 4.4 percent were “very proficient” compared to 21.4 percent of Hispanic foreign-born, 64.5 percent of Hispanic native-born, and 28.1 percent of Middle-Eastern and South-Asian owners. Owners preferred using service providers, including accountants, of their own ethnicity. We calculated two sets of estimates of the number of NEP business owners in California in 2005 by language spoken. We decided to produce two sets of estimates because they were based on population estimates that covered different groupings of languages. For calculation details see the Methods section of this report. One set of estimates was based on California population estimates of persons aged five and older produced by the 2005 American Community Survey (ACS). The ACS is a continual survey which has replaced the decennial census long-form. The other set was based on an annual language census conducted by the California Department of Education (CDE). We used an average of 0405-0506 fiscal-year counts to approximate calendar year 2005. We applied percentages we calculated from the 2005 ACS data to estimate for each CDE-covered language the total number of speakers aged five and older. The CDE data covered 30 more languages than did the 2005 ACS data. We applied to our ACS-based and CDE-based California population estimates computed California business densities (estimated number of businesses per 1,000 persons aged 5 years and older) for each of four language categories. These calculations produced estimates of the total number of California business owners that spoke each language. We computed the business densities based on 2002 ACS data and the 2002 Economic Census Survey of Small Business Owners (SBO). Finally we applied to the estimated number of business owners speaking each language the proportions of California’s foreign language speakers that spoke English “less than very well” calculated from the 2005 ACS data. These calculations yielded the estimated number of business owners that were not proficient in English. Table 1 shows each language that met a statewide threshold of 3,000 NEP business owners.
Table 1
California’s 2005 Not-English Proficient (NEP) Business Owners - 3,000 and Over Language Language Category ACS-Based Est. CDE-Based Est. Spanish or Spanish Creole Spanish 202,838 177,552 Chinese Asian or Pacific Island 50,266 -- Vietnamese Asian or Pacific Island 26,949 32,130 Cantonese Asian or Pacific Island -- 23,440 Tagalog (Filipino) Asian or Pacific Island 22,735 13,995 Korean Asian or Pacific Island 20,360 20,158 Mandarin (Putonghua) Asian or Pacific Island -- 17,846 Armenian Other Indo-European 8,624 8,069 Russian Other Indo-European 7,790 6,374 Japanese Asian or Pacific Island 7,525 3,642 Persian (Farsi) Other Indo-European 6,499 5,303 Punjabi (Panjabi) Other Indo-European -- 4,981 Arabic Other 4,499 3,238 Mon-Khmer (Cambodian) Asian or Pacific Island 3,836 7,085 Hmong Asian or Pacific Island 3,034 11,304

California’s Foreign Language Speakers and Business Owners Not Proficient in English – 2005 Estimates 8
Differences in the ACS-based and CDE-based estimates are due to differences in population estimates. There are at least several reasons for these differences: differing data collection methods and periods and data limitations. The ACS foreign language population estimates are based on monthly samples taken over a calendar year; the CDE data are based on an annual language census. ACS data estimate total populations of 5 to 17 year-olds; CDE data do not include counts of un-enrolled 5 – 17 year-olds. We averaged CDE’s fiscal year data to approximate calendar year 2005 so we could apply percentages calculated from the 2005 ACS. We used a “broad brush”—age group by language category percentages—to estimate CDE-implied language populations 5 years and older because it was the smallest unit by which the ACS provided both language and age data. The two sets of estimates have 11 languages in-common above the 3,000 threshold: Arabic, Armenian, Hmong, Japanese, Korean, Mon-Khmer, Persian (Farsi), Russian, Spanish, Tagalog (Filipino), and Vietnamese. 8 There are three languages in the CDE-based estimates above the 3,000 threshold that are not ACS-covered languages: Cantonese, Mandarin, and Punjabi. The ACS classifies Cantonese and Mandarin speakers as Chinese. Chinese is above the 3,000 threshold in the ACS-based estimates. There are five other CDE-covered languages that the ACS classifies as Chinese. Table 2 shows the languages that fell in the 1,000 to 2,999 range of NEP business owners. Languages in common on the two sets of estimates are Hindi, Laotian, Portuguese, Thai, and Urdu. Other CDE-covered languages in this range that are not ACS-covered languages are Mien (Yao) and Ukrainian.
Table 2
California’s 2005 Not-English Proficient (NEP) Business Owners - 1,000 to 1,999 Language Language Category ACS-Based Est. CDE-Based Est. Portuguese Other Indo-European 2,730 1,331 Thai Asian or Pacific Island 2,462 1,507 French Other Indo-European 2,214 410 Hindi Other Indo-European 2,200 1,440 Laotian (Lao) Asian or Pacific Island 2,119 2,928 German Other Indo-European 1,796 322 Mien (Yao) Asian or Pacific Island -- 1,625 Italian Other Indo-European 1,566 196 Ukrainian Other Indo-European -- 1,481 Urdu Other Indo-European 1,382 1,767
Californians who belong to a foreign language group are concentrated in various areas throughout the state. A language group’s share living in each community is often disproportional to the share of total Californians living in each community.9 County shares of population for each of the 15 languages (excluding Chinese) that fell above the 3,000 threshold in either set of state estimates appear in this report in the section titled California’s Foreign Language Communities. While concentrations of foreign language speakers are informative, it is important to have county level estimates of the number of NEP business owners by foreign language group. They would provide another source of data that the Board’s local offices could use to staff adequate numbers of bilingual employees. We estimated counts of NEP business owners by language for each of the 14 counties for which the 2005 ACS provided population estimates by language. Our county estimates appear in the Results section of this report.

California’s Foreign Language Speakers and Business Owners Not Proficient in English – 2005 Estimates 9
II. PURPOSE The Equal Employment Opportunity (EEO) Office asked the Research and Statistics (R&S) Section to provide contextual information to supplement the results from the 2005-06 biennial language survey. We were asked to provide information on language communities in California, their English proficiency, and demographic information about their businesses. EEO staff also asked us to differentiate between Cantonese and Mandarin. III. BACKGROUND California’s Foreign Language Speakers: California is home to a large population of foreign language speakers. According to the U.S. Census Bureau’s American Community Survey (ACS), a continuous survey that has replaced the decennial census long form,10 there were an estimated 13.8 million California residents who spoke a foreign language in 2005. Chart 5
California's Foreign Language Speakers 5+ Years by Language Category - 2005 American Community Survey
Spanish66.6%
Asian and Pacif ic Island
21.4%
Other Indo-European
10.0%
All other2.0%
Based on calculations from the 2005 ACS, about two in five residents spoke a foreign language, 42 percent. Around one in five spoke English less than very well, 20 percent. As shown in Chart 5, Spanish was the language of two out of three foreign language speakers. Just over one in five spoke an Asian or Pacific Island language. One in ten spoke some other Indo-European language. All other language speakers comprised 2 percent of foreign language speakers. Some groups of foreign language speakers are less proficient in English than others. Speakers of Spanish and Asian and Pacific Island languages are less English proficient than speakers of other Indo-European and all other foreign languages. Chart 6 shows these differences in the age group most likely to own a business (people aged 18 - 64). Among Spanish speakers, 57 percent were not proficient in English. One in two people who spoke Asian and Pacific Island languages in this age group were not proficient. About 32 percent of people who spoke other Indo-European languages were not proficient. Non-proficiency was lowest in this age group of people who spoke all other languages, 29 percent.
Chart 6
Percent Californians Who Are not English Proficient, Ages 18 - 64 Years by Language Category - 2005 American Community Survey
28.7
31.7
50.8
56.9
0.0 10.0 20.0 30.0 40.0 50.0 60.0
All other languages
Other Indo-European
Asian and Pacif icIsland
Spanish

California’s Foreign Language Speakers and Business Owners Not Proficient in English – 2005 Estimates 10
In 2005, about 9.5 million California residents, 29 percent, were foreign born. Nearly 59 percent were not proficient in English. An estimated 2.8 million California residents entered the U.S. during the last decade, a monthly average of 23,303. An estimated 1.7 million foreign-born California residents entered the U.S. in the last six years, 2000 to 2005. At 23,031, the monthly average is virtually unchanged. The U.S. Census just released a demographic profile of the nation’s foreign language speakers in 2000.11 Based on calculations from the count estimates, Californians who were not proficient in English were more likely to be less educated. A larger percentage of not-English-proficient (NEP) Californians never graduated from high school compared to the total California population. As shown in Chart 7, about 58 percent of NEP residents never graduated compared to the 23 percent rate in the total population. Fewer NEP persons had some college education or greater compared to the total population. While 30 percent of Californians had some college or an associate degree, just 14 percent of NEP people did so.
Chart 7
Percent of Californians 25 Years and Over by Education Completed and English Proficiency - 2000 Census
23.220.1
30.026.6
58.2
16.4 13.9 11.6
0.0
10.0
20.0
30.0
40.0
50.0
60.0
70.0
Less than HighSchool
High SchoolDiploma
Some college orassoc degree
Bachelor'sdegree or higher
Total Not English Proficient
The 2000 Census demographic profile of foreign language speakers provides counts on self-employed workers in their own non-incorporated businesses. We calculated percentages based on these counts. Chart 8 shows that over 2 in 3 non-incorporated businesses were owned by California residents who spoke English only. This is slightly higher than the proportion of the English-only speaking population of 61 percent. Over 3 in 20 of these businesses were owned by Spanish speakers. Speakers of Asian and Pacific Island languages owned about 8 percent of non-incorporated businesses. About 1 in 20 was owned by persons who spoke other Indo-European languages. Just 1 percent was owned by speakers of all other languages.
Chart 8 California's Self-Employed Owners of Non-Incorporated Businesses by
Language Category - 2000 Census
English only, 68.7
Spanish, 16.7
Other Indo-European, 5.7
Asian and Pacif ic Island, 7.7
All other languages, 1.1

California’s Foreign Language Speakers and Business Owners Not Proficient in English – 2005 Estimates 11
Foreign language speakers do not own businesses in proportion to the size of their total population proportions. Calculations from the Census 2000 demographic profile data show these differences. Chart 9 shows foreign language speakers’ population proportions. Chart 10 shows the proportions of non-incorporated business owned by foreign language speakers. Spanish speakers own a smaller share of businesses compared to their share of the foreign language speaking population. While about two in three foreign language speakers were Spanish speaking, closer to one in two Spanish speakers owned non-incorporated businesses. The opposite was true of the three other language categories. About one in ten foreign language speakers spoke other Indo-European languages, but their proportion among foreign language business owners was closer to two in ten (11 percent vs. 18 percent). These differences were smaller in the other two categories. With one exception, the proportions of NEP non-incorporated business owners were similar to proportions among adults aged 18 to 64 years. As shown in Chart 11, the proportion of NEP persons who spoke Asian and Pacific Island languages was higher among non-incorporated business owners than among 18 to 64 year-olds. The NEP rate among Spanish-speaking owners was 59 percent. It was 63 percent among owners speaking Asian and Pacific Island languages. About one-third of owners speaking other Indo-European languages (32 percent) and all other languages (30 percent) were not proficient in English.
Chart 11
Percent Californians Who Are Not English Proficient Among 18 - 64 Year Olds Vs. Self-Employed by Language Category - 2000 Census
57.653.3
32.6 31.7
58.663.2
31.5 30.3
0
10
20
30
40
50
60
70
Spanish Asian and PacificIsland
Other Indo-European
All other languages
18-64 Years Self-Employed
Chart 10
California's Self-Employed Business Owners Speaking a Foreign Language by Language Category - 2000 Census
Spanish, 53.3
Asian and Pacif ic Island, 24.7
Other Indo-European, 18.3
All other languages, 3.7
Chart 9
California's Foreign Language Speakers by Language Category - 2000 Census
Spanish65.4%
Asian and Pacif ic Island
21.8%
Other Indo-European
10.8%
All other2.0%
California’s Foreign Language Speakers and Business Owners Not Proficient in English – 2005 Estimates 12
Characteristics of Minority-Owned Businesses: The Small Business Administration (SBA) publishes reports on minority-owned businesses, but not businesses owned by those whose speak a primary language other than English. However, a portion of speakers of other languages do fall in minority categories. Therefore, a summary of SBA findings is included here. 12, 13, and 14
• Share of total businesses: The share of minority-owned businesses increased from 6.8 percent in 1982 to 15.1 percent in 1997. During this same period, the number of Hispanic owned businesses quadrupled. The Hispanic-owned share increased from 2.4 percent in 1982 to 6.1 percent. The Asian/Pacific Islander share grew from 2.0 percent to 4.3 percent. In 2000, Hispanic ownership dropped to 5.8 percent of U.S. businesses and Asian ownership was about the same, 4.4 percent.
• Ethnicity composition: In 1997, the largest share of Asian/Pacific Islander businesses, 27.7 percent, was owned by Chinese. Indians owned 18.3 percent, Koreans 14.9 percent, and Vietnamese 10.7 percent. At 9.4 percent and 9.3 percent, Japanese and Filipinos respectively owned about the same share.
• Share of group’s labor force: The proportion of the Latino labor force that owned businesses increased from 5.9 percent in 2000 to 7.0 in 2003. Asian ownership in the Asian labor force increased from 9.4 percent to 10.4 percent. Immigrant ownership increased from 9.1 percent to 9.9 percent in the immigrant labor force.
• Business density: Among non-minorities there was one business for every 10.1 non-minority persons in 2000. For Asians density was slightly lower, one business for every 11.7 Asians. Hispanics had just one business per 29.4 persons.
• Business survival, expansion, and contraction: Compared to the 72.6 percent four-year survival rate of non-minority-owned businesses (1997-2001), Asian and Pacific Islander-owned business had a 72.1 percent survival rate. Hispanic-owned business had a 68.6 percent survival rate. However, minority owned businesses had higher expansion rates and lower contraction rates than non-minority businesses.
Creation of New Businesses Among Minorities and Immigrants: In 2005, the Kauffman Foundation introduced the Kauffman Index of Entrepreneurial Activity, defined as “the percent of the population of non-business-owning adults who start a business each month.”15 The index is based on monthly survey data obtained from the Current Population Survey (CPS) micro data conducted by the U.S. Census Bureau and Bureau of Labor Statistics. In 2005, the rate of adults (ages 20 to 64) starting a new business was 0.29 percent. During a 10 year period, 1996 to 2005, it has ranged between 0.27 percent and 0.32 percent. At 0.32 percent, Latinos had the highest 10-year average. Asians averaged 0.27 percent. Immigrants consistently had a higher index than native born. In 2005, immigrants started businesses at a rate of 0.35 percent while the native born rate was 0.28 percent. This means that 350 out of every 100,000 immigrants started a business. Immigrant Businesses: The University of Northern Iowa surveyed immigrant owned businesses in Northeast Iowa from December 2003 to July 2004.16 The 109 businesses surveyed represented a census of businesses in a 17-county area during the survey period. Of these, 51 participated in interviews. Some had more than one type of business. One-fifth owned restaurants. Around one-fourth, including one restaurateur, owned business that sold groceries. Nearly as many (22 percent) owned retail establishments. Bar owners were 8 percent of total. Auto repair owners made up 6 percent. Interviewees were all first-time business owners. More than one-third began operating out of their homes or cars. Of those interviewed, 31 disclosed their start-up costs which ranged from $450 to $70,000. The mean was $24,789 and the median $18,000. Most relied on their own funds. Just six received a bank loan, one of which was a Small Business Administration loan.

California’s Foreign Language Speakers and Business Owners Not Proficient in English – 2005 Estimates 13
The University of Massachusetts, Lowell, surveyed immigrant owned businesses in the Lowell area in 1998.17 Of the over 300 business owners eligible, 63 participated. Retail/service, convenience store/markets, and restaurants comprised four of five (79%) of the businesses surveyed: 46 percent, 17 percent, and 17 percent respectively. Manufacturing, health care, and education claimed a 2 percent share each. Just over half employed between 1 and 3 people. Around 1 in 10 (11%) sold products or services to other businesses. The Illinois Coalition for Immigrant and Refugee Rights commissioned a study conducted by Marta Tienda of Princeton University.18 The Little Village study took place in 1994 in a Chicago neighborhood (62,895 residences) that is home to the largest Mexican community in the Midwest. Business owners were selected via stratified random sample by type of business. A total of 244 interviews were conducted. Three quarters of the owners were Hispanic and of those, 96 percent were immigrants. Half of the remaining owners were Korean. The rest consisted of Middle-Eastern, Indian, Pakistani, and non-Hispanic white owners. While just 29 percent of non-Hispanic whites started their own business, over 60 percent of other ethnic owners started their own businesses. Koreans had more prior entrepreneurial experience and the strongest capital position. Most Koreans, 67 percent, had acquired business skills in prior jobs. Just 38 percent of Middle-Eastern and South-Asian owners compared to 54 percent of foreign-born Hispanics had acquired business skills in their previous jobs. Tienda claimed that the study, consistent with prior studies, suggested that “Korean ethnic enterprises serve as training platforms for future self employment in ways that are not replicated by other ethnic groups.” Interestingly, Korean owners were the least likely to be “very proficient” in English, 4.4 percent. This compares to 21.4 percent of Hispanic foreign-born, 64.5 percent of Hispanic native-born, and 28.1 percent of Middle-Eastern and South-Asian owners. Most owners used service providers from their ethnic groups: 89 percent of Koreans, 73 percent of Hispanics, 67 percent of Middle-Eastern and South Asian, and 57 percent of non-Hispanic whites. Just over 85 percent of Koreans used accountants, and all were Korean accountants. Nearly 87 percent of Hispanics used accountants, and nearly three-quarters were Hispanic accountants. Among the 58 percent of Middle-Eastern and South-Asian owners who used accountants, only 43 percent used accountants of the same ethnicity. IV. GOVERNMENT POLICY & STANDARDS Federal: Title VI of the 1964 Civil Rights Act prohibits service providers who receive federal funds from excluding, denying, or discriminating against persons on the basis of race, color, or national origin. The Supreme Court, in Lau v. Nichols 414 U.S. 563 (1974), held that Title VI prohibits conduct that has a disproportionate effect on Limited-English-Proficient (LEP) persons because such conduct constitutes national-origin discrimination. On August 11, 2000, President Clinton issued Executive Order 13166, “Improving Access to Services for Persons with Limited English Proficiency,” 65 FR 50121. The order reaffirmed the Title VI prohibition and required federal agencies to publish guidance on how service providers who receive federal funds can provide meaningful access to LEP persons. On that same day the U.S. Department of Justice (DOJ) issued a guidance document to federal agencies.19 It directed them to consider four factors in developing their LEP guidance publications:
1. the number of LEP persons in the eligible service population or likely to be encountered in recipient activities and programs,
2. the frequency with which LEP individuals come into contact with the program, 3. the importance of the service or information provided by the program, and 4. the resources available to the recipient of federal funds.
On October 26, 2000, the DOJ issued a clarifying memorandum to agency heads reaffirming a policy that requires “meaningful access.” The Federal Government has made available on-line a “Language

California’s Foreign Language Speakers and Business Owners Not Proficient in English – 2005 Estimates 14
Assistance Self-Assessment and Planning Tool for Recipients of Federal Financial Assistance.”20 It explains how to do the four-factor analysis and how to develop an implementation plan. The elements of an effective implementation plan include:
1. identifying LEP individuals who need assistance,
2. identifying language assistance measures including a. types of language services available, b. how staff can obtain those services, c. how to respond to LEP callers, d. how to respond to written communications from LEP persons, e. how to respond to LEP individuals who have in-person contact with staff, and f. how to ensure competency of interpreters and translation services,
3. training staff members about their obligations to provide meaningful access so they
a. know about LEP policies and procedures and b. work effectively with in-person and telephone interpreters,
4. providing notice to LEP persons of the availability of language assistance services by
a. posting signs in intake and entry areas, b. stating so in outreach documents written in appropriate languages, c. working with community-based organizations, d. using a telephone voice mail menu in the most common languages encountered, e. including notices in local, non-English newspapers, f. providing non-English notices to radio and television stations, g. making presentations or noticing schools and religious organizations, and
5. monitoring and updating the plan.
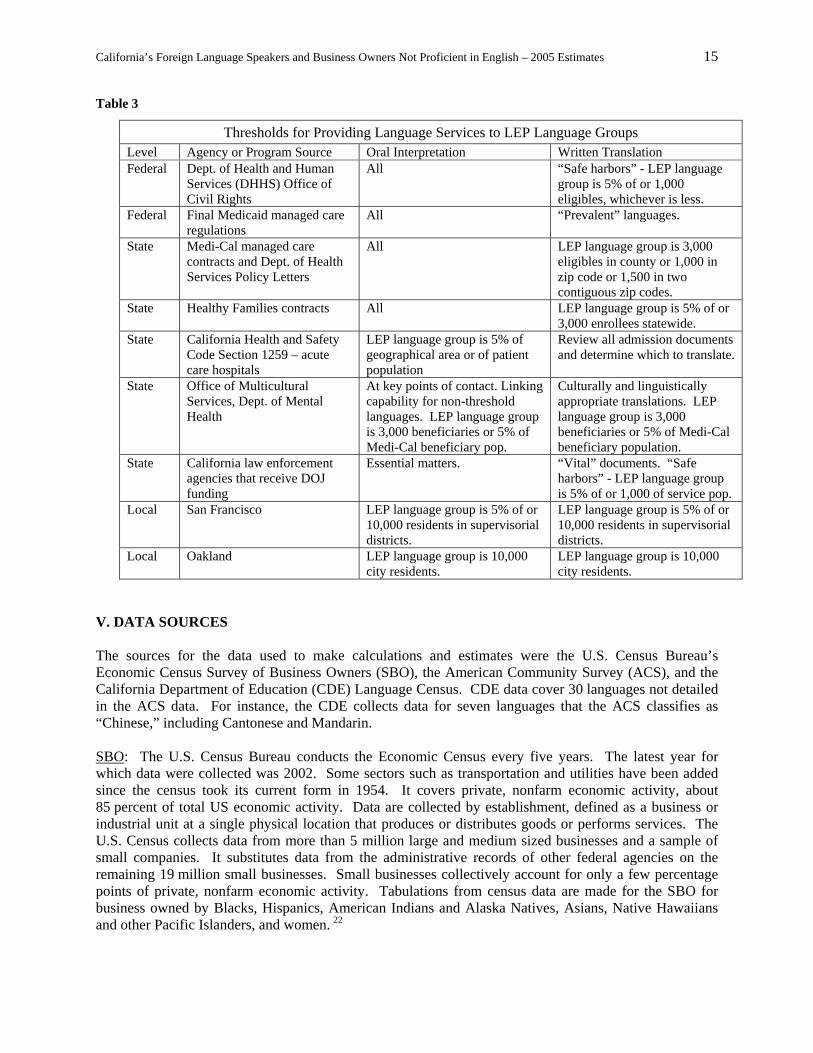
California State and Local: The Dymally-Alatorre Bilingual Services Act (GC Sec 7290-7299.8) requires state agencies serving a “substantial number” of “non-English-speaking people” to employ “qualified bilingual persons in public contact positions….” This requirement also applies to local public agencies. Agencies must use the “substantial number” criteria in providing translated materials that explain agency services. State agencies must also use it to provide translated materials or language assistance to persons who are required to furnish written information that may affect their rights, duties, or privileges with respect to agency services or benefits. Local agencies, and in some cases state agencies, may determine what constitutes a “substantial number.” With respect to state agencies’ providing bilingual staff or translated material explaining agency services, “substantial number” means a group whose members are not proficient in English and that comprise 5 percent of the people served by any local office or facility. The Act also requires state agencies to conduct biennial language surveys and to develop and update an implementation plan. Survey and plan requirements are detailed in GC Section 7299.4. Language Services Thresholds: Federal, state, and local agencies have established numeric or qualitative thresholds for providing language services to persons who speak the same language and who are Limited-English Proficient (i.e., a LEP language group). These thresholds are based on legal mandates. They differ depending on the type of agency, its funding sources or grant recipients’ funding sources, and types of service provided. Many were summarized in a document prepared for the Asian and Pacific Islander American Health Forum.21 They appear in Table 3 and are supplemented by other information we found online.
California’s Foreign Language Speakers and Business Owners Not Proficient in English – 2005 Estimates 15
Table 3
Thresholds for Providing Language Services to LEP Language Groups Level Agency or Program Source Oral Interpretation Written Translation Federal Dept. of Health and Human
Services (DHHS) Office of Civil Rights
All “Safe harbors” - LEP language group is 5% of or 1,000 eligibles, whichever is less.
Federal Final Medicaid managed care regulations
All “Prevalent” languages.
State Medi-Cal managed care contracts and Dept. of Health Services Policy Letters
All LEP language group is 3,000 eligibles in county or 1,000 in zip code or 1,500 in two contiguous zip codes.
State Healthy Families contracts All LEP language group is 5% of or 3,000 enrollees statewide.
State California Health and Safety Code Section 1259 – acute care hospitals
LEP language group is 5% of geographical area or of patient population
Review all admission documents and determine which to translate.
State Office of Multicultural Services, Dept. of Mental Health
At key points of contact. Linking capability for non-threshold languages. LEP language group is 3,000 beneficiaries or 5% of Medi-Cal beneficiary pop.
Culturally and linguistically appropriate translations. LEP language group is 3,000 beneficiaries or 5% of Medi-Cal beneficiary population.
State California law enforcement agencies that receive DOJ funding
Essential matters. “Vital” documents. “Safe harbors” - LEP language group is 5% of or 1,000 of service pop.
Local San Francisco LEP language group is 5% of or 10,000 residents in supervisorial districts.
LEP language group is 5% of or 10,000 residents in supervisorial districts.
Local Oakland LEP language group is 10,000 city residents.
LEP language group is 10,000 city residents.
V. DATA SOURCES The sources for the data used to make calculations and estimates were the U.S. Census Bureau’s Economic Census Survey of Business Owners (SBO), the American Community Survey (ACS), and the California Department of Education (CDE) Language Census. CDE data cover 30 languages not detailed in the ACS data. For instance, the CDE collects data for seven languages that the ACS classifies as “Chinese,” including Cantonese and Mandarin. SBO: The U.S. Census Bureau conducts the Economic Census every five years. The latest year for which data were collected was 2002. Some sectors such as transportation and utilities have been added since the census took its current form in 1954. It covers private, nonfarm economic activity, about 85 percent of total US economic activity. Data are collected by establishment, defined as a business or industrial unit at a single physical location that produces or distributes goods or performs services. The U.S. Census collects data from more than 5 million large and medium sized businesses and a sample of small companies. It substitutes data from the administrative records of other federal agencies on the remaining 19 million small businesses. Small businesses collectively account for only a few percentage points of private, nonfarm economic activity. Tabulations from census data are made for the SBO for business owned by Blacks, Hispanics, American Indians and Alaska Natives, Asians, Native Hawaiians and other Pacific Islanders, and women. 22

California’s Foreign Language Speakers and Business Owners Not Proficient in English – 2005 Estimates 16
ACS: The U.S. Census Bureau developed the ACS to provide demographic, economic, and housing data on America’s communities. It will replace the long form used in the decennial census starting in 2010. Testing began in 1996. In 2005, the Census Bureau transitioned the ACS from a demonstration program to full sampling. Each year, 3 million addresses (1 in 40) are sampled. Annual data are now available for geographic areas over 65,000 in population. Starting in 2008, three-year averages will be available for areas 20,000 to 65,000. With the year 2010, five-year averages will be available for areas under 20,000. Data most pertinent to this study include population estimates of persons five years and older by language spoken at home. Other variables by which these data are presented (either in detail or aggregated into four language categories) include ability to speak English, age, nativity, race, and ethnicity. 23 CDE Language Census: In March of each year, the CDE Educational Demographics Unit conducts a Language Census of grades K – 12 students in California. It provides data on students whose primary language is not English. Data include counts of English learner (EL) and fluent-English-proficient (FEP) students by grade and primary language. EL students are defined as those “…for whom there is a report of a primary language other than English on the state-approved “Home Language Survey” and who, on the basis of the state-approved California English Language Development Test (CELDT), have been determined to lack the clearly defined English language skills of listening comprehension, speaking, reading, and writing necessary to succeed in the school's regular instructional programs.” FEP students are defined as those “…whose primary language is something other than English and who have met the district criteria of proficient in English….”24 VI. METHOD Calculating Business Density by Language Category: For this paper, business density is defined as the number of firms per 1,000 persons five years of age and over. Due to ACS data limitations, we used a 5+ years population subset. Ying Lowrey used a similar definition in a study investigating whether the prevalence of business ownership plays a role in economic well being.25 The SBO provides data on businesses owned by non-minority and minority groups, but not by language spoken. Thus, the first step was to calculate a business density for each non-minority and minority group for the State of California. We used the 2002 SBO and 2002 ACS data.26 We subtracted the group’s population under five years of age from its total population to obtain its population five years of age and older. Next we divided this population subset by 1,000. The resulting number was in turn divided into the number of businesses owned by persons in that group. The results are shown in Chart 12. For estimating purposes, we assumed that California’s business densities were unchanged from 2002 to 2005. Chart 12
California's Business Density Per 1,000 Persons 5+ Years by Race and Ethnicity
91.6
114.6
58.7
160.6
97.5
68.2
41.0
0.0 20.0 40.0 60.0 80.0 100.0 120.0 140.0 160.0 180.0
Total:
White alone (Includes White Hispanic)
Black or African American alone
American Indian and Alaska Native alone
Asian alone
Native Haw aiian and Other Pacif ic Islander alone
Hispanic or Latino (Includes White Hispanic)
California’s Foreign Language Speakers and Business Owners Not Proficient in English – 2005 Estimates 17
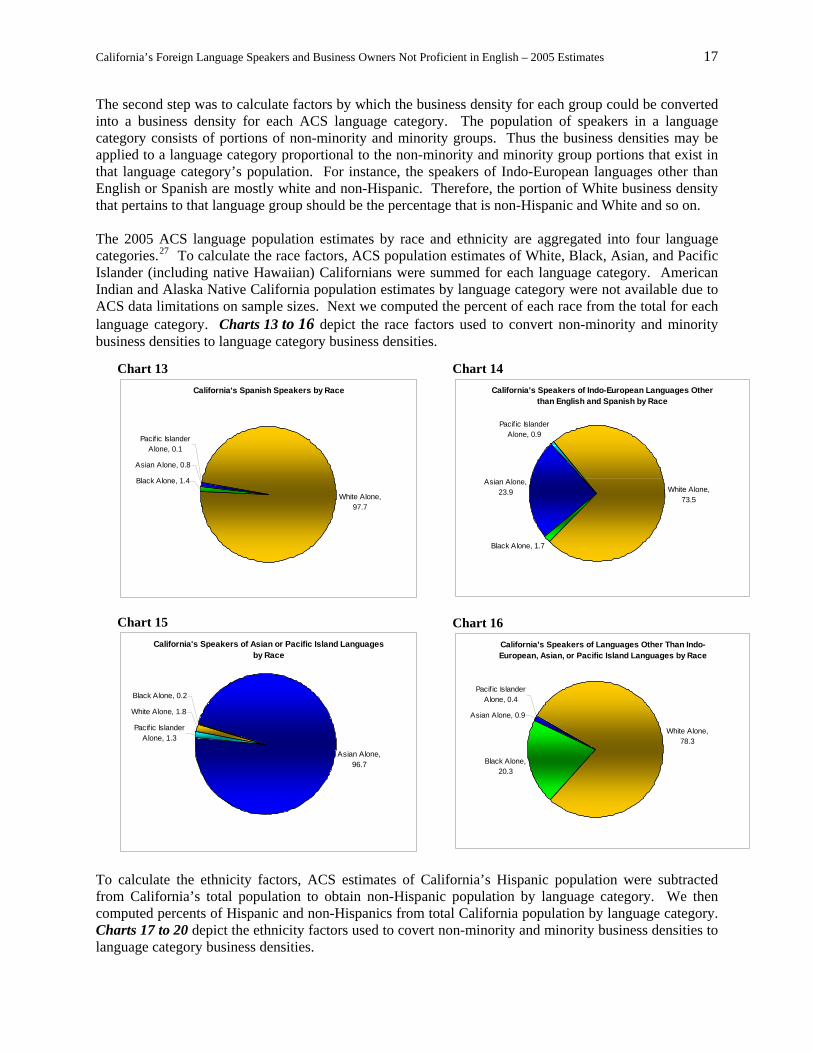
The second step was to calculate factors by which the business density for each group could be converted into a business density for each ACS language category. The population of speakers in a language category consists of portions of non-minority and minority groups. Thus the business densities may be applied to a language category proportional to the non-minority and minority group portions that exist in that language category’s population. For instance, the speakers of Indo-European languages other than English or Spanish are mostly white and non-Hispanic. Therefore, the portion of White business density that pertains to that language group should be the percentage that is non-Hispanic and White and so on. The 2005 ACS language population estimates by race and ethnicity are aggregated into four language categories.27 To calculate the race factors, ACS population estimates of White, Black, Asian, and Pacific Islander (including native Hawaiian) Californians were summed for each language category. American Indian and Alaska Native California population estimates by language category were not available due to ACS data limitations on sample sizes. Next we computed the percent of each race from the total for each language category. Charts 13 to 16 depict the race factors used to convert non-minority and minority business densities to language category business densities.
Chart 15 California's Speakers of Asian or Pacific Island Languages
by Race
White Alone, 1.8
Black Alone, 0.2
Asian Alone, 96.7
Pacif ic Islander Alone, 1.3
Chart 13 California's Spanish Speakers by Race
White Alone, 97.7
Black Alone, 1.4
Asian Alone, 0.8
Pacific Islander Alone, 0.1
Chart 16 California's Speakers of Languages Other Than Indo-European, Asian, or Pacific Island Languages by Race
White Alone, 78.3
Black Alone, 20.3
Asian Alone, 0.9
Pacif ic Islander Alone, 0.4
Chart 14 California's Speakers of Indo-European Languages Other
than English and Spanish by Race
White Alone, 73.5
Black Alone, 1.7
Asian Alone, 23.9
Pacif ic Islander Alone, 0.9
To calculate the ethnicity factors, ACS estimates of California’s Hispanic population were subtracted from California’s total population to obtain non-Hispanic population by language category. We then computed percents of Hispanic and non-Hispanics from total California population by language category. Charts 17 to 20 depict the ethnicity factors used to covert non-minority and minority business densities to language category business densities.

California’s Foreign Language Speakers and Business Owners Not Proficient in English – 2005 Estimates 18
Chart 17
California's Speakers of Spanish by Ethnicity
Hispanic, 95.3Not Hispanic, 4.7
Chart 18 California's Speakers of Indo-European Languages Other
than English and Spanish by Ethnicity
Hispanic, 1.0Not Hispanic,
99.0
Chart 19 California's Speakers of Asian or Pacific Island Languages
by Ethnicity
Hispanic, 0.4Not Hispanic,
99.6
Chart 20 California's Speakers of Languages Other Than Indo-
European, Asian, or Pacific Island Languages by Ethnicity
Hispanic, 1.6
Not Hispanic, 98.4
Next we applied the factors (i.e. percents) to the non-minority and minority business densities to obtain five partial business densities for each language category. The sum of a language category’s five partial business densities is its business density. These language category business densities are depicted in Chart 21. The calculation of partial business densities (BD) for each language category (LC) is:
LC partial BD1 = White BD * (Pct non-Hispanic of LC /100 * Pct White of LC /100) LC partial BD2 = Black BD * (Pct non-Hispanic of LC /100 * Pct Black of LC /100) LC partial BD3 = Asian BD * (Pct non-Hispanic of LC /100 * Pct Asian of LC /100) LC partial BD4 = Pacific Islander BD * (Pct non-Hispanic of LC /100 * Pct Pacific Islander of LC /100) LC partial BD5 = Hispanic BD * Pct Hispanic of LC /100
Chart 21
California's Business Density Per 1,000 Persons 5+ Years by Language Category
101.9
97.2
108.5
44.4
Other Languages
Asian or Pacif ic IslandLanguages
Other Indo-EuropeanLanguages
Spanish
0.0 20.0 40.0 60.0 80.0 100.0 120.0

California’s Foreign Language Speakers and Business Owners Not Proficient in English – 2005 Estimates 19
Estimating Population of Language Speakers 5+ Years from CDE Data Using ACS Percents: This section explains how we estimated populations of speakers of CDE-covered languages. In short, we used 2005 ACS population estimates by four language categories and three age groups to calculate the percent of each language category population aged 5 to 17 years. We applied them to the CDE data to estimate the total population 5 years of age and older for each foreign language. Because the CDE covers 30 languages not covered by the ACS, we chose to impute ACS percentages for these 30 languages. We used the website Ethnologue.com to compare CDE and ACS languages. If a CDE language was not covered by the ACS, we placed it in one of the four ACS language categories and determined which ACS language was most similar and/or geographically proximal to it. The language’s “family tree” and countries where it is primarily spoken were used to classify them. Thus we could apply percentages calculated from ACS data to all CDE languages, not just the ones CDE and ACS have in common. Table 4 shows how we classified these CDE languages. The CDE and ACS may refer to the same language by different names. For instance, Farsi is Persian and Filipino is Tagalog.
Table 4
Classification of CDE-Covered Languages Not Covered by the ACS CDE Language ACS Language ACS Language Category Burmese Chinese Asian or Pacific Island Cantonese Chinese Asian or Pacific Island Chaozhou (Chiuchow) Chinese Asian or Pacific Island Lahu Chinese Asian or Pacific Island Mandarin (Putonghua) Chinese Asian or Pacific Island Taiwanese Chinese Asian or Pacific Island Toishanese Chinese Asian or Pacific Island Cebuano (Visayan) Tagalog Asian or Pacific Island Chamorro (Guamanian) Tagalog Asian or Pacific Island Ilocano Tagalog Asian or Pacific Island Indonesian Tagalog Asian or Pacific Island Marshallese Tagalog Asian or Pacific Island Samoan Tagalog Asian or Pacific Island Tongan Tagalog Asian or Pacific Island Mien (Yao) Hmong Asian or Pacific Island Khmu Mon-Khmer Asian or Pacific Island Assyrian Arabic Other Chaldean Arabic Other Somali Arabic Other Turkish Arabic Other Tigrinya Hebrew Other Kurdish (Kurdi, Kurmanji) Persian Other Indo-European Pashto Persian Other Indo-European Dutch German Other Indo-European Albanian Greek Other Indo-European Bengali Gujarati Other Indo-European Rumanian (Romanian) Italian Other Indo-European Ukrainian Russian Other Indo-European Punjabi (Panjabi) Urdu Other Indo-European Miexteco* Spanish* Other (use Spanish)*
* Although Mixteco is in its own unique language family, it is primarily spoken in Mexico. We properly classified it as “Other.” However, we chose to impute ACS Spanish language group percentages.

California’s Foreign Language Speakers and Business Owners Not Proficient in English – 2005 Estimates 20
CDE data are published by fiscal year. To approximate calendar year 2005, we used the average of fiscal years 2004-05 and 2005-06 statewide counts of students totaled for grades K – 12 for each foreign language (FL). We computed the averages for EL students and FEP students separately and then added them, yielding an estimate of the total number of K – 12 students for each FL. We applied percentages of populations aged 5 – 17 years calculated from ACS estimates of the number of speakers in each of four language categories (LC). 28 The four LC percentages are shown in Chart 22. ACS percentages were imputed for CDE-ACS matched languages and categories per Table 4. The calculation for each FL is:
FL speakers grades K-12 in 2005 = [(K-12 EL in 2004-05) + (K-12 EL in 2005-06)]/2 + [(K-12 FEP in 2004-05) + (K-12 FEP in 2006-06)]/2 Pct pop 5-17 years in LC in 2005 = LC pop 5-17 yrs / [(LC pop 5 – 17 yrs) + (LC pop 18 – 64 yrs) + (LC pop 65+yrs)] * 100 FL speakers 5+ years in 2005 = (FL speakers grades K-12 in 2005) / (Pct pop 5-17 years in LC in 2005 / 100)
Chart 22
Percent of Californians Ages 5 - 17 Years from the Population 5+ Years by Language Category - 2005 American Community Survey
18.4
14.4
14.6
26.1
0.0 5.0 10.0 15.0 20.0 25.0 30.0
Speak other languages
Speak Asian and Pacif icIsland languages
Speak other Indo-European languages
Speak Spanish
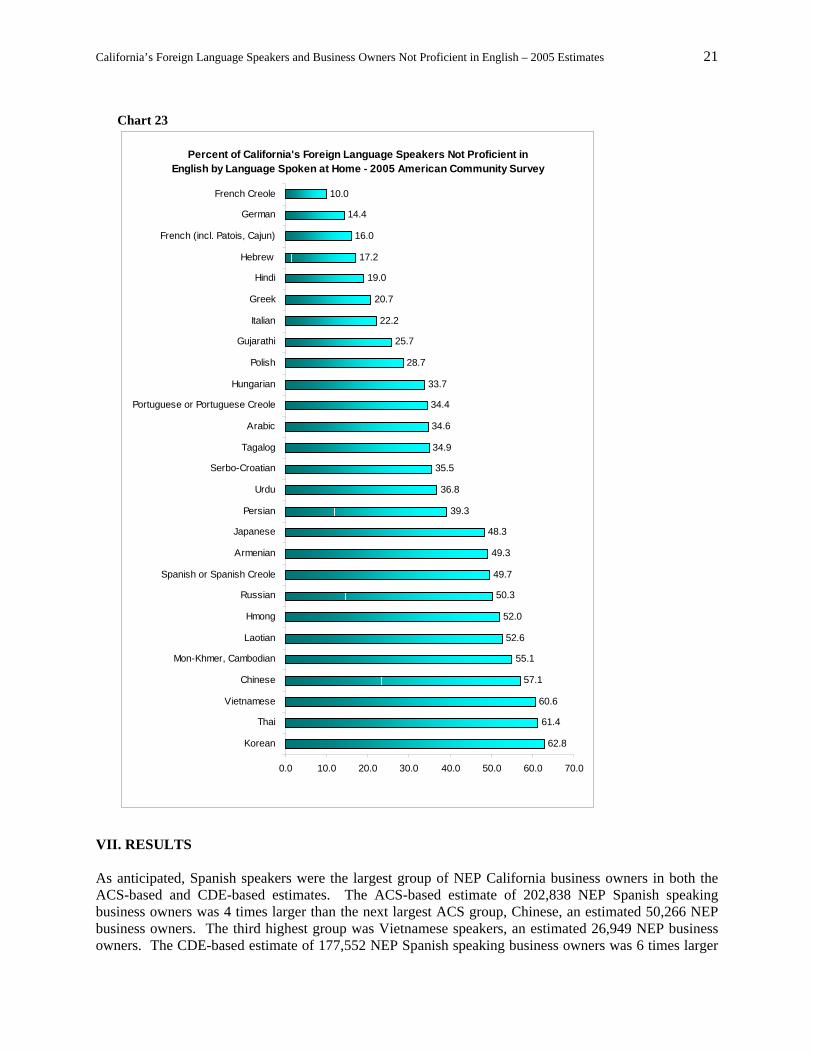
Differences and percent differences between our CDE-based population estimates and ACS population estimates were calculated for in-common languages. The overall difference was -4.4 percent. Percent differences ranged from -87.4 (Italian) to 272.6 (Hmong). The percent difference for Spanish—the only ACS language that was both a language category and a language group and thus not affected by the broad brush—was -12.5. About 81 percent of our estimates (21 languages) were lower than ACS estimates, and 19 percent (5 languages) were higher. Estimating California Business Owners Not Proficient in English: First, we estimated the number of California business owners that spoke each foreign language. To do so, we multiplied the estimated California population 5 years and older that spoke a foreign language by its language category business density (LCBD) divided by 1,000.29 To estimate the number of California’s not-English-proficient (NEP) business owners, we multiplied the estimated number of California business owners that spoke each foreign language by the 2005 ACS percent that reported speaking English less than “very well.”30 These percentages appear in Chart 23. Calculations were repeated at the county level where ACS data were available (14 counties). For our CDE-based estimates, we imputed ACS percentages for CDE-ACS matched languages and categories per Table 4. The calculation for each foreign language (FL) is:
FL speaking business owners = (Population of speakers 5+ years) * (LCBD /1,000) NEP business owners = (FL speaking business owners) * (Pct pop NEP / 100)
California’s Foreign Language Speakers and Business Owners Not Proficient in English – 2005 Estimates 21
Chart 23
Percent of California's Foreign Language Speakers Not Proficient in English by Language Spoken at Home - 2005 American Community Survey
62.8
61.4
60.6
57.1
55.1
52.6
52.0
50.3
49.7
49.3
48.3
39.3
36.8
35.5
34.9
34.6
34.4
33.7
28.7
25.7
22.2
20.7
19.0
17.2
16.0
14.4
10.0
0.0 10.0 20.0 30.0 40.0 50.0 60.0 70.0
Korean
Thai
Vietnamese
Chinese
Mon-Khmer, Cambodian
Laotian
Hmong
Russian
Spanish or Spanish Creole
Armenian
Japanese
Persian
Urdu
Serbo-Croatian
Tagalog
Arabic
Portuguese or Portuguese Creole
Hungarian
Polish
Gujarathi
Italian
Greek
Hindi
Hebrew
French (incl. Patois, Cajun)
German
French Creole
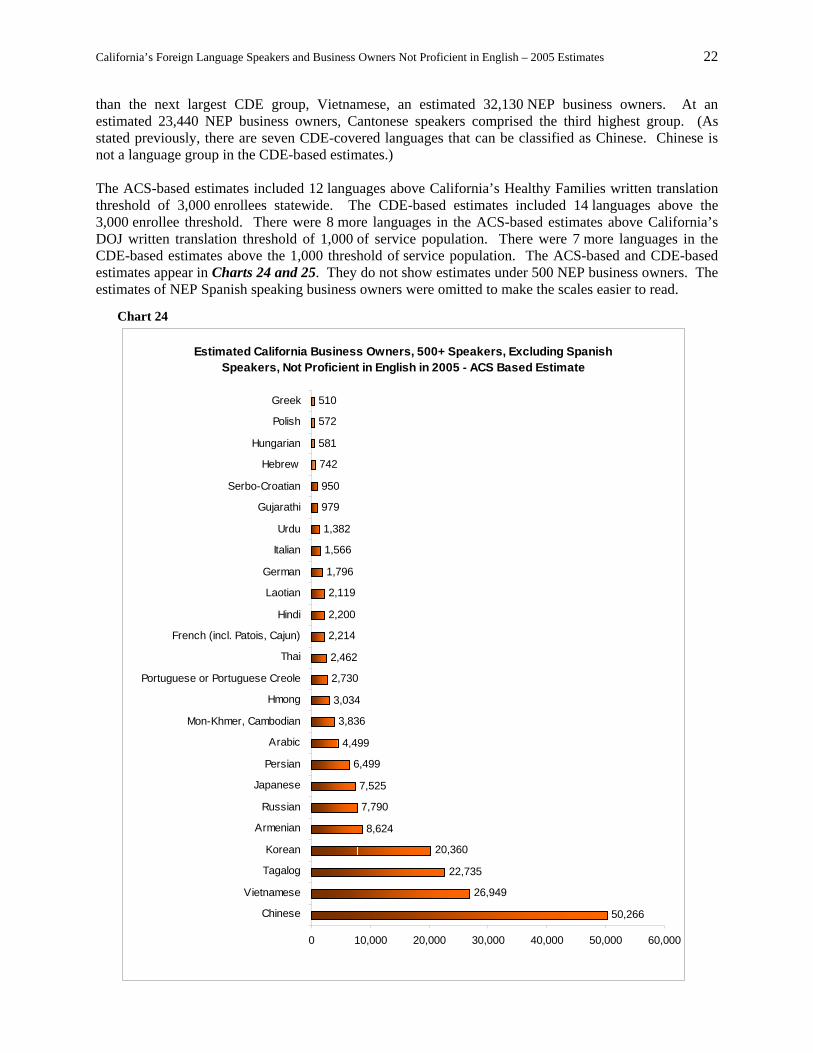
VII. RESULTS As anticipated, Spanish speakers were the largest group of NEP California business owners in both the ACS-based and CDE-based estimates. The ACS-based estimate of 202,838 NEP Spanish speaking business owners was 4 times larger than the next largest ACS group, Chinese, an estimated 50,266 NEP business owners. The third highest group was Vietnamese speakers, an estimated 26,949 NEP business owners. The CDE-based estimate of 177,552 NEP Spanish speaking business owners was 6 times larger
California’s Foreign Language Speakers and Business Owners Not Proficient in English – 2005 Estimates 22
than the next largest CDE group, Vietnamese, an estimated 32,130 NEP business owners. At an estimated 23,440 NEP business owners, Cantonese speakers comprised the third highest group. (As stated previously, there are seven CDE-covered languages that can be classified as Chinese. Chinese is not a language group in the CDE-based estimates.) The ACS-based estimates included 12 languages above California’s Healthy Families written translation threshold of 3,000 enrollees statewide. The CDE-based estimates included 14 languages above the 3,000 enrollee threshold. There were 8 more languages in the ACS-based estimates above California’s DOJ written translation threshold of 1,000 of service population. There were 7 more languages in the CDE-based estimates above the 1,000 threshold of service population. The ACS-based and CDE-based estimates appear in Charts 24 and 25. They do not show estimates under 500 NEP business owners. The estimates of NEP Spanish speaking business owners were omitted to make the scales easier to read.
Chart 24
Estimated California Business Owners, 500+ Speakers, Excluding Spanish Speakers, Not Proficient in English in 2005 - ACS Based Estimate
50,266
26,949
22,735
20,360
8,624
7,790
7,525
6,499
4,499
3,836
3,034
2,730
2,462
2,214
2,200
2,119
1,796
1,566
1,382
979
950
742
581
572
510
0 10,000 20,000 30,000 40,000 50,000 60,000
Chinese
Vietnamese
Tagalog
Korean
Armenian
Russian
Japanese
Persian
Arabic
Mon-Khmer, Cambodian
Hmong
Portuguese or Portuguese Creole
Thai
French (incl. Patois, Cajun)
Hindi
Laotian
German
Italian
Urdu
Gujarathi
Serbo-Croatian
Hebrew
Hungarian
Polish
Greek

California’s Foreign Language Speakers and Business Owners Not Proficient in English – 2005 Estimates 23
Chart 25
Estimated California Business Owners, 500+ Speakers, Excluding Spanish Speakers, Not Proficient in English in 2005 - CDE Based Estimate
32,130
23,440
20,158
17,846
13,995
11,304
8,069
7,085
6,374
5,303
4,981
3,642
3,238
2,928
1,767
1,625
1,507
1,481
1,440
1,331
820
732
714
691
682
679
530
0 5,000 10,000 15,000 20,000 25,000 30,000 35,000
Vietnamese
Cantonese
Korean
Mandarin (Putonghua)
Filipino (Pilipino or Tagalog)
Hmong
Armenian
Khmer (Cambodian)
Russian
Farsi (Persian)
Punjabi
Japanese
Arabic
Lao
Urdu
Mien (Yao)
Thai
Ukrainian
Hindi
Portuguese
Gujarati
Ilocano
Chaozhou (Chiuchow )
Tongan
Indonesian
Samoan
Taiw anese
The two sets of estimates have 11 languages in-common above the 3,000 threshold: Arabic, Armenian, Hmong, Japanese, Korean, Mon-Khmer, Persian (Farsi), Russian, Spanish, Tagalog (Filipino), and Vietnamese. There are three languages in the CDE-based estimates above the 3,000 threshold that are not ACS-covered languages: Cantonese, Mandarin, and Punjabi. (The ACS classifies Cantonese and Mandarin speakers as Chinese.) Chinese is above the 3,000 threshold in the ACS-based estimates. In the 1,000 to 2,999 range, languages in common on the two sets of estimates are Hindi, Laotian, Portuguese, Thai, and Urdu. Other languages in this range in the ACS-based estimates are French, German, and

California’s Foreign Language Speakers and Business Owners Not Proficient in English – 2005 Estimates 24
Italian. Other CDE-covered languages in this range that are not ACS-covered languages are Mien (Yao) and Ukrainian. We estimated the number of NEP business owners that spoke ACS-covered foreign languages in the 14 counties for which 2005 ACS population estimates were available. The ACS did not provide detailed language data for the remaining 44 counties because the number of sample cases was too small. Our county estimates are presented in Tables 5 to 18. Results are presented in descending order of estimated NEP business owners. This ordering may differ from ordering by the total ACS-estimated population of foreign language speakers or our estimated total number of business owners that speak each foreign language. This is because estimated business densities differ by language category and proportions of English-proficient differ by foreign language spoken. Not presented here are estimated NEP business owners in county-level language groups numbering under 100.
Table 5
Alameda County Estimated NEP Business Owners in 2005
Language Population 5+ Years
All Businesses
NEP Businesses
Chinese 113,035 10,987 6,274 Spanish or Spanish Creole 207,854 9,229 4,587 Tagalog 43,542 4,232 1,477 Vietnamese 17,694 1,720 1,042 Korean 8,468 823 517 Persian 9,062 983 386 Japanese 7,322 712 344 Hindi 14,785 1,604 305 Portuguese or Portuguese Creole 7,915 859 295 Russian 4,196 455 229 Arabic 5,412 551 191 Laotian 2,853 277 146 French (incl. Patois, Cajun) 7,385 801 128 Mon-Khmer, Cambodian 2,320 226 125
Table 6
Contra Costa County Estimated NEP Business Owners in 2005
Language Population 5+ Years
All Businesses
NEP Businesses
Spanish or Spanish Creole 155,170 6,890 3,424 Chinese 22,683 2,205 1,259 Tagalog 29,836 2,900 1,012 Persian 8,670 941 370 Korean 5,661 550 345 Russian 3,815 414 208 Portuguese or Portuguese Creole 5,143 558 192 Japanese 3,756 365 176 Vietnamese 2,683 261 158 Laotian 2,524 245 129 Urdu 2,634 286 105 Hindi 5,040 547 104
California’s Foreign Language Speakers and Business Owners Not Proficient in English – 2005 Estimates 25
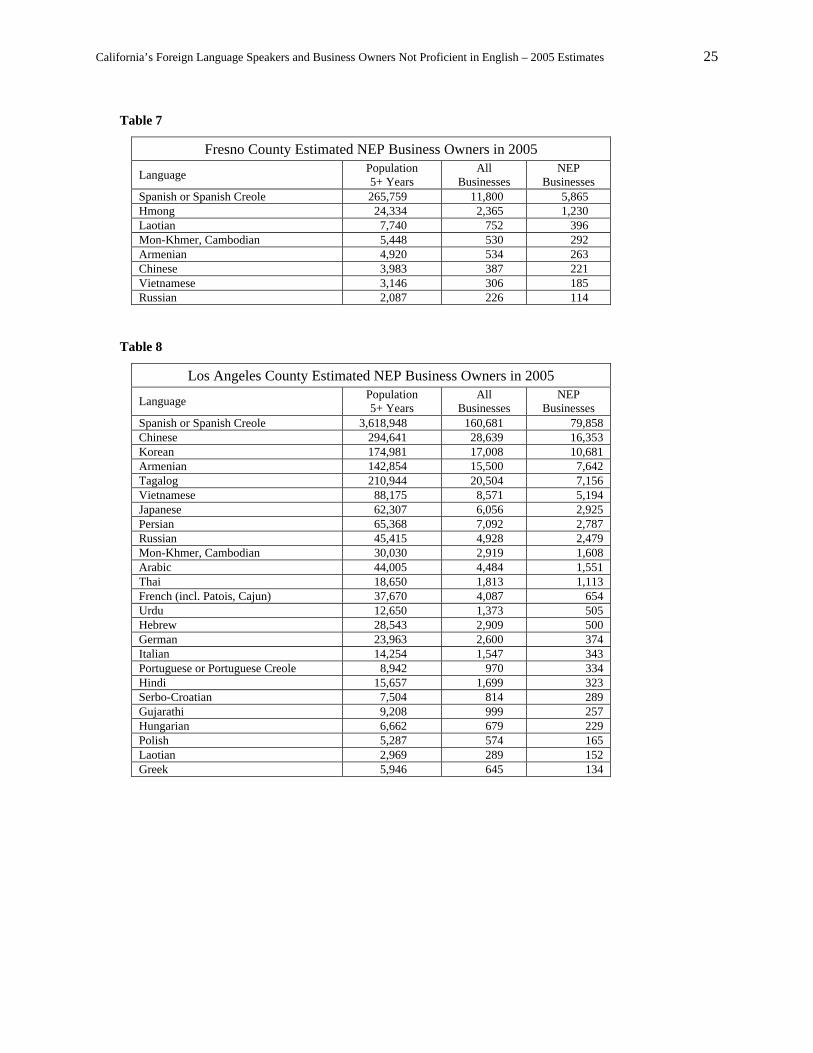
Table 7
Fresno County Estimated NEP Business Owners in 2005
Language Population 5+ Years
All Businesses
NEP Businesses
Spanish or Spanish Creole 265,759 11,800 5,865 Hmong 24,334 2,365 1,230 Laotian 7,740 752 396 Mon-Khmer, Cambodian 5,448 530 292 Armenian 4,920 534 263 Chinese 3,983 387 221 Vietnamese 3,146 306 185 Russian 2,087 226 114
Table 8
Los Angeles County Estimated NEP Business Owners in 2005
Language Population 5+ Years
All Businesses
NEP Businesses
Spanish or Spanish Creole 3,618,948 160,681 79,858 Chinese 294,641 28,639 16,353 Korean 174,981 17,008 10,681 Armenian 142,854 15,500 7,642 Tagalog 210,944 20,504 7,156 Vietnamese 88,175 8,571 5,194 Japanese 62,307 6,056 2,925 Persian 65,368 7,092 2,787 Russian 45,415 4,928 2,479 Mon-Khmer, Cambodian 30,030 2,919 1,608 Arabic 44,005 4,484 1,551 Thai 18,650 1,813 1,113 French (incl. Patois, Cajun) 37,670 4,087 654 Urdu 12,650 1,373 505 Hebrew 28,543 2,909 500 German 23,963 2,600 374 Italian 14,254 1,547 343 Portuguese or Portuguese Creole 8,942 970 334 Hindi 15,657 1,699 323 Serbo-Croatian 7,504 814 289 Gujarathi 9,208 999 257 Hungarian 6,662 679 229 Polish 5,287 574 165 Laotian 2,969 289 152 Greek 5,946 645 134

California’s Foreign Language Speakers and Business Owners Not Proficient in English – 2005 Estimates 26
Table 9
Orange County Estimated NEP Business Owners in 2005
Language Population 5+ Years
All Businesses
NEP Businesses
Spanish or Spanish Creole 721,937 32,054 15,931 Vietnamese 140,137 13,621 8,254 Korean 63,969 6,218 3,905 Chinese 60,754 5,905 3,372 Tagalog 40,032 3,891 1,358 Persian 23,329 2,531 995 Japanese 14,496 1,409 681 Arabic 15,778 1,608 556 Mon-Khmer, Cambodian 4,720 459 253 Hindi 10,414 1,130 215 Thai 3,521 342 210 German 10,427 1,131 163 Urdu 3,899 423 156 Gujarathi 5,490 596 153 Armenian 2,702 293 144 Russian 2,558 278 140 French (incl. Patois, Cajun) 7,462 810 130
Table 10
Riverside County Estimated NEP Business Owners in 2005
Language Population 5+ Years
All Businesses
NEP Businesses
Spanish or Spanish Creole 565,822 25,122 12,486 Tagalog 19,507 1,896 662 Vietnamese 8,434 820 497 Chinese 7,420 721 412 Korean 6,367 619 389 Arabic 7,097 723 250 Japanese 3,896 379 183 Persian 3,626 393 154 Laotian 1,980 192 101
Table 11
Sacramento County Estimated NEP Business Owners in 2005
Language Population 5+ Years
All Businesses
NEP Businesses
Spanish or Spanish Creole 141,829 6,297 3,130 Russian 27,138 2,944 1,481 Chinese 26,166 2,543 1,452 Vietnamese 23,754 2,309 1,399 Tagalog 23,847 2,318 809 Hmong 15,400 1,497 778 Japanese 5,591 543 262 Hindi 10,487 1,138 216 Persian 5,036 546 215 Korean 3,446 335 210 Laotian 3,915 381 200

California’s Foreign Language Speakers and Business Owners Not Proficient in English – 2005 Estimates 27
Table 12
San Bernardino County Estimated NEP Business Owners in 2005
Language Population 5+ Years
All Businesses
NEP Businesses
Spanish or Spanish Creole 577,365 25,635 12,741 Chinese 15,290 1,486 849 Korean 12,893 1,253 787 Tagalog 19,663 1,911 667 Vietnamese 8,377 814 493 Arabic 6,066 618 214 Thai 3,471 337 207 Japanese 2,222 216 104
Table 13
San Diego County Estimated NEP Business Owners in 2005
Language Population 5+ Years
All Businesses
NEP Businesses
Spanish or Spanish Creole 636,529 28,262 14,046 Tagalog 74,910 7,281 2,541 Vietnamese 32,801 3,188 1,932 Chinese 32,134 3,123 1,783 Japanese 12,246 1,190 575 Korean 8,959 871 547 Arabic 13,083 1,333 461 Persian 10,357 1,124 442 Russian 7,110 771 388 Laotian 6,485 630 331 German 14,939 1,621 233 Mon-Khmer, Cambodian 4,170 405 223 French (incl. Patois, Cajun) 9,835 1,067 171 Italian 7,000 760 169 Portuguese or Portuguese Creole 3,866 419 144 Serbo-Croatian 3,280 356 126 Thai 1,742 169 104
Table 14
San Francisco County Estimated NEP Business Owners in 2005
Language Population 5+ Years
All Businesses
NEP Businesses
Chinese 127,163 12,360 7,058 Spanish or Spanish Creole 79,857 3,546 1,762 Tagalog 24,994 2,429 848 Russian 14,349 1,557 783 Vietnamese 11,957 1,162 704 Japanese 7,877 766 370 Korean 5,803 564 354 French (incl. Patois, Cajun) 7,202 781 125 Thai 1,891 184 113

California’s Foreign Language Speakers and Business Owners Not Proficient in English – 2005 Estimates 28
Table 15
San Joaquin County Estimated NEP Business Owners in 2005
Language Population 5+ Years
All Businesses
NEP Businesses
Spanish or Spanish Creole 139,021 6,173 3,068 Mon-Khmer, Cambodian 10,401 1,011 557 Tagalog 16,002 1,555 543 Vietnamese 7,217 701 425 Hmong 5,656 550 286 Chinese 4,751 462 264 Portuguese or Portuguese Creole 3,745 406 140
Table 16
San Mateo County Estimated NEP Business Owners in 2005
Language Population 5+ Years
All Businesses
NEP Businesses
Spanish or Spanish Creole 123,337 5,476 2,722 Chinese 41,201 4,005 2,287 Tagalog 42,756 4,156 1,450 Korean 5,799 564 354 Japanese 6,977 678 327 Arabic 8,592 876 303 Russian 5,108 554 279 Vietnamese 2,854 277 168 Hindi 7,042 764 145 Portuguese or Portuguese Creole 3,649 396 136 Italian 4,947 537 119 Armenian 2,104 228 112 French (incl. Patois, Cajun) 5,815 631 101
Table 17
Santa Clara County Estimated NEP Business Owners in 2005
Language Population 5+ Years
All Businesses
NEP Businesses
Chinese 120,392 11,702 6,682 Spanish or Spanish Creole 279,517 12,411 6,168 Vietnamese 93,044 9,044 5,481 Tagalog 48,574 4,721 1,648 Korean 19,721 1,917 1,204 Japanese 15,619 1,518 733 Persian 13,681 1,484 583 Russian 9,197 998 502 Hindi 20,936 2,272 432 Portuguese or Portuguese Creole 8,878 963 331 Serbo-Croatian 4,919 534 190 Mon-Khmer, Cambodian 3,425 333 183 French (incl. Patois, Cajun) 9,879 1,072 172 Gujarathi 5,341 579 149 Arabic 4,215 430 149 German 8,962 972 140 Urdu 3,473 377 139 Thai 1,828 178 109 Italian 4,446 482 107 Armenian 1,906 207 102
California’s Foreign Language Speakers and Business Owners Not Proficient in English – 2005 Estimates 29
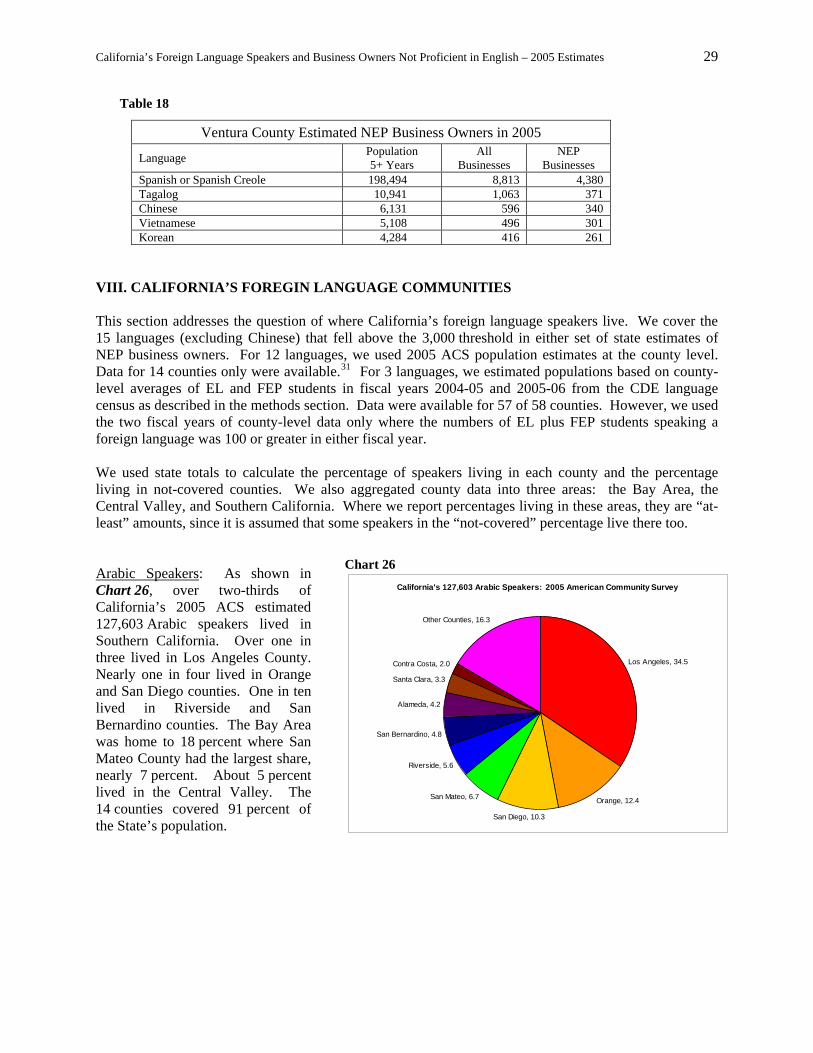
Table 18
Ventura County Estimated NEP Business Owners in 2005
Language Population 5+ Years
All Businesses
NEP Businesses
Spanish or Spanish Creole 198,494 8,813 4,380 Tagalog 10,941 1,063 371 Chinese 6,131 596 340 Vietnamese 5,108 496 301 Korean 4,284 416 261
VIII. CALIFORNIA’S FOREGIN LANGUAGE COMMUNITIES This section addresses the question of where California’s foreign language speakers live. We cover the 15 languages (excluding Chinese) that fell above the 3,000 threshold in either set of state estimates of NEP business owners. For 12 languages, we used 2005 ACS population estimates at the county level. Data for 14 counties only were available.31 For 3 languages, we estimated populations based on county-level averages of EL and FEP students in fiscal years 2004-05 and 2005-06 from the CDE language census as described in the methods section. Data were available for 57 of 58 counties. However, we used the two fiscal years of county-level data only where the numbers of EL plus FEP students speaking a foreign language was 100 or greater in either fiscal year. We used state totals to calculate the percentage of speakers living in each county and the percentage living in not-covered counties. We also aggregated county data into three areas: the Bay Area, the Central Valley, and Southern California. Where we report percentages living in these areas, they are “at-least” amounts, since it is assumed that some speakers in the “not-covered” percentage live there too. Chart 26
California's 127,603 Arabic Speakers: 2005 American Community Survey
Los Angeles, 34.5
Orange, 12.4
San Diego, 10.3
San Mateo, 6.7
Riverside, 5.6
San Bernardino, 4.8
Alameda, 4.2
Santa Clara, 3.3
Contra Costa, 2.0
Other Counties, 16.3
Arabic Speakers: As shown in Chart 26, over two-thirds of California’s 2005 ACS estimated 127,603 Arabic speakers lived in Southern California. Over one in three lived in Los Angeles County. Nearly one in four lived in Orange and San Diego counties. One in ten lived in Riverside and San Bernardino counties. The Bay Area was home to 18 percent where San Mateo County had the largest share, nearly 7 percent. About 5 percent lived in the Central Valley. The 14 counties covered 91 percent of the State’s population.

California’s Foreign Language Speakers and Business Owners Not Proficient in English – 2005 Estimates 30
Armenian Speakers: California was home to a 2005 ACS estimated 161,221 speakers of Armenian. Over 9 in 10 Armenian speakers lived in Southern California, most in Los Angeles County which was home to 89 percent. At 3 percent, Fresno was the county with the next largest population, as shown in Chart 27. Around 4 percent each lived in the Bay Area and the Central Valley. The county-level data accounted for 99 percent of the State’s population. Cantonese Speakers: Just over one in two of our CDE-based estimated 422,326 Cantonese speakers in California lived in the Bay Area. As seen in Chart 28, San Francisco County was home to 24 percent. About 25 percent lived in Alameda, Santa Clara, and San Mateo counties. Just over one in three lived in Los Angeles County. About 6 percent lived in other counties in Southern California. In the Central Valley, Sacramento County was home to most, almost 6 percent. Nearly 99 percent lived in the 18 counties that met our inclusion criterion. Hmong Speakers: California was home to a 2005 ACS estimated 60,017 Hmong speakers. Three in four lived in the Central Valley. Fresno County was home to the largest group, around 41 Percent, as revealed in Chart 29. Sacramento County had the second largest population, 26 percent. In Southern California, Los Angeles, San Diego, and Orange counties were home to nearly 6 percent. Nearly 82 percent of the State’s population was covered by the 14 counties. Japanese Speakers: According to the 2005 ACS, an estimated 160,285 Japanese speakers lived in
Chart 28
California's 422,326 Cantonese Speakers: Estimated from the California Dept of Education (CDE) Surveys and the 2005 American Community Survey
Los Angeles, 34.0
San Francisco, 24.1Alameda, 14.0
Santa Clara, 7.0
Sacramento, 5.9
San Mateo, 3.9
Orange, 2.3
San Diego, 2.0
Other Counties, 6.8
Chart 29 California's 60,017 Hmong Speakers: 2005 American Community Survey
Fresno, 40.5
Sacramento, 25.7
San Joaquin, 9.4
Los Angeles, 3.1
San Diego, 1.6
Other Counties, 19.7
Chart 27 California's 161,221 Armenian Speakers: 2005 American Community Survey
Los Angeles, 88.6Fresno, 3.1
Orange, 1.7
San Mateo, 1.3
Santa Clara, 1.2
Other Counties, 4.2

California’s Foreign Language Speakers and Business Owners Not Proficient in English – 2005 Estimates 31
California. Southern California was home to 61 percent. As shown in Chart 30, Los Angeles County had the largest share, 39 percent. The counties of Orange, San Diego, and Riverside, were home to another 19 percent. About 26 percent lived in the Bay Area where Santa Clara County boasted one in ten. San Francisco, Alameda, and San Mateo counties were home to 14 percent. In the Central Valley, about 4 percent lived in Sacramento County. The 14 counties covered 92 percent of total.
Chart 32 California's 321,542 Mandarin Speakers: Estimated from the California Dept of
Education (CDE) Surveys and the 2005 American Community Survey
Los Angeles, 40.4
Santa Clara, 21.9Alameda, 10.1
Orange, 8.5
San Diego, 4.6
San Francisco, 3.4
San Mateo, 2.5
San Bernardino, 2.1
Other Counties, 6.5
Chart 30 California's 160,285 Japanese Speakers: 2005 American Community Survey
Los Angeles, 38.9
Santa Clara, 9.7Orange, 9.0
San Diego, 7.6
San Francisco, 4.9
Alameda, 4.6
San Mateo, 4.4
Sacramento, 3.5
Riverside, 2.4
Other Counties, 14.9
Chart 31 California's 333,539 Korean Speakers: 2005 American Community Survey
Los Angeles, 52.5
Orange, 19.2
Santa Clara, 5.9
San Bernardino, 3.9
San Diego, 2.7
Alameda, 2.5
Other Counties, 13.4
Korean Speakers: California was home to an ACS-estimated 333,539 people who spoke Korean. Over four in five lived in Southern California where Los Angeles County was home to over one in two, as seen in Chart 31. Just over one in four lived in Orange, San Bernardino, and San Diego counties. About 14 percent lived in the Bay Area where Santa Clara County was home to 6 percent. At 2.5 percent, the county of Alameda had the second largest Bay Area population. Less than 2 percent lived in the Central Valley. About 97 percent lived in the 14 counties. Mandarin Speakers: Our CDE-based estimate showed 321,542 speakers of Mandarin living in California. Nearly 57 percent lived in Southern California. Chart 32 shows that Los Angeles County boasted the largest contingent at 40 percent. Orange, San Diego, and San Bernardino counties were home to another 15 percent. About 40 percent lived in the Bay Area where Santa Clara and Alameda counties were home to most, 32 percent. The Central Valley was home to about 2 percent. Nearly 99 percent lived in the 15 counties that met our inclusion criterion.

California’s Foreign Language Speakers and Business Owners Not Proficient in English – 2005 Estimates 32
Chart 33 California's 71,630 Mon-Khmer Speakers: 2005 American Community Survey
Los Angeles, 41.9
San Joaquin, 14.5
Fresno, 7.6
Orange, 6.6
San Diego, 5.8
Santa Clara, 4.8
Alameda, 3.2
Riverside, 2.1
Sacramento, 2.1
Other Counties, 11.3
Mon-Khmer Speakers: According to the ACS estimates, 71,630 speakers of Mon-Khmer lived in California. Southern California was home to 59 percent where Los Angeles County had the largest contingent, 42 percent. Chart 33 shows that Orange and San Diego counties had another 12 percent. Nearly one in four lived in the Central Valley. About 15 percent lived in San Joaquin County. Nearly half as many, 8 percent, lived in Fresno County. One in ten lived in the Bay Area, most in Santa Clara and Alameda counties. Around 93 percent lived in the 14 counties. Chart 34
California's 152,418 Persian Speakers: 2005 American Community Survey
Los Angeles, 42.9
Orange, 15.3
Santa Clara, 9.0
San Diego, 6.8
Alameda, 5.9
Contra Costa, 5.7
Sacramento, 3.3
Riverside, 2.4
Other Counties, 8.7
Chart 35 California's 73,130 Portuguese Speakers: 2005 American Community Survey
Los Angeles, 12.2
Santa Clara, 12.1
Alameda, 10.8
Contra Costa, 7.0
San Diego, 5.3San Joaquin, 5.1San Mateo, 5.0
Sacramento, 2.4Orange, 2.1
Other Counties, 37.8
Persian Speakers: An ACS-estimated 152,418 Persian speakers lived in California. Southern California was home to nearly 70 percent. As revealed in Chart 34, most lived in Los Angeles County, 43 percent. Another 15 percent lived in Orange County. San Diego and Riverside counties were home to 9 percent. Nearly one in four, 23 percent, lived in the Bay Area, with Santa Clara, Alameda, and Contra Costa counties housing most. The Central Valley had about 5 percent where most lived in the county of Sacramento, 3 percent. Over 97 percent lived in the 14 counties. Portuguese Speakers: California was home to an ACS-estimated 73,130 Portuguese speakers. The Bay Area boasted over one-third, 37 percent. As shown in Chart 35, Santa Clara and Alameda counties were home to 23 percent. The two counties with the next largest proportions, Contra Costa and San Mateo, were home to 12 percent. About one in four lived in Southern California, 23 percent. Most lived

California’s Foreign Language Speakers and Business Owners Not Proficient in English – 2005 Estimates 33
in Los Angeles County, 12 percent. San Diego was home to 1 in 20. Nearly 9 percent lived in the Central Valley where San Joaquin County had the largest population. The 14 counties covered just 68 percent of total.
Chart 36 California's 124,733 Punjabi Speakers: Estimated from the California Dept of
Education (CDE) Surveys and the 2005 American Community SurveySanta Clara, 11.2
Alameda, 11.2
Sacramento, 10.7
Fresno, 10.7
Sutter, 8.5San Joaquin, 7.9
Los Angeles, 6.3
Stanislaus, 4.8
Kern, 4.0
Contra Costa, 3.9
Merced, 3.4
Placer, 2.3
Orange, 2.0
Other Counties, 13.0
Punjabi Speakers: Our CDE-based estimate showed that California was home to 124,733 Punjabi speakers. The Central Valley was home to just over half the population. Chart 36 shows that Sacramento, Fresno, Sutter, and San Joaquin counties were home to 38 percent. Around 29 percent lived in the Bay Area. Santa Clara and Alameda counties were home to 22 percent. In Southern California where about 16 percent lived, Los Angeles County was home to around 6 percent. About 96 percent lived in the 22 counties that met our inclusion criterion.
Chart 37
California's 142,734 Russian Speakers: 2005 American Community Survey
Los Angeles, 31.8
Sacramento, 19.0San Francisco, 10.1
Santa Clara, 6.4
San Diego, 5.0
San Mateo, 3.6
Alameda, 2.9
Contra Costa, 2.7
Other Counties, 18.5
Russian Speakers: The ACS estimate showed 142,734 speakers of Russian living in California. Southern California was home to about 41 percent. Chart 37 shows Los Angeles County had the largest population in the State, 32 percent. The Bay Area was home to one in four. One in ten lived in the county of San Francisco which had the largest contingent in the Bay Area. The Central Valley was home to just over one in five. Most lived in Sacramento County, 19 percent. About 88 percent lived in the 14 counties.
Chart 38 California's 9,192,012 Spanish Speakers: 2005 American Community Survey
Los Angeles, 39.4
Riverside, 6.2
Santa Clara, 3.0
Fresno, 2.9
Alameda, 2.3
Ventura, 2.2
Other Counties, 23.1
Orange, 7.9San Diego, 6.9
San Bernardino, 6.3
Spanish Speakers: An ACS-estimated 9.2 million people in California spoke Spanish. Southern California was home to over two in three, 69 percent. As revealed in Chart 38, about 40 percent lived in Los Angeles County. Orange and San Diego counties were home to

California’s Foreign Language Speakers and Business Owners Not Proficient in English – 2005 Estimates 34
15 percent; San Bernardino and Riverside counties were home to another 13 percent. In the Bay Area where just over 9 percent lived, Santa Clara and Alameda counties were home to 5 percent. The Central Valley was home to about 6 percent. The 14 counties covered 84 percent of California’s Spanish speakers. Chart 39
California's 670,203 Tagalog Speakers: 2005 American Community Survey
Los Angeles, 31.5
San Diego, 11.2
Santa Clara, 7.2Alameda, 6.5
San Mateo, 6.4
Orange, 6.0
Contra Costa, 4.5
San Francisco, 3.7
Sacramento, 3.6
San Bernardino, 2.9
Riverside, 2.9
San Joaquin, 2.4
Other Counties, 11.3
Tagalog Speakers: According to the ACS data, an estimated 670,203 speakers of Tagalog (Filipino) lived in California. Southern California was home to over half, 56 percent. As seen in Chart 39, about 43 percent lived in Los Angeles and San Diego counties. The Bay Area was home to 28 percent. The counties of Santa Clara, Alameda, and San Mateo were home to one in five. Around 6 percent lived in the Central Valley where Sacramento County had the largest contingent. The 14 counties accounted for 91 percent of the State’s population.
Chart 40 California's 457,510 Vietnamese Speakers: 2005 American Community
Survey
Orange, 30.6
Santa Clara, 20.3Los Angeles, 19.3
San Diego, 7.2
Sacramento, 5.2
Alameda, 3.9
San Francisco, 2.6
Other Counties, 10.9
Vietnamese Speakers: California was home to an ACS-estimated 457,510 speakers of Vietnamese. Southern California was home to 62 percent. Chart 40 shows that Orange County was home to the largest portion, 31 percent. Another 27 percent lived in Los Angeles and San Diego counties. Over one in four lived in the Bay Area, 28 percent. Santa Clara County was home to most, 20 percent. About 4 percent lived in Alameda County. Just 8 percent lived in the Central Valley where the county of Sacramento was home to 5 percent. Around 97 percent lived in the 14 counties.

California’s Foreign Language Speakers and Business Owners Not Proficient in English – 2005 Estimates 35
FOOTNOTES 1 The Healthy Families Program is a low-cost insurance program that provides health, dental and vision coverage to
children under the age of 19 years with family incomes at or below 250 percent of the federal poverty level. Families who meet the income criteria and whose children do not have insurance or qualify for no-cost Medi-Cal pay a monthly premium of $4 to $15 per child with a maximum of $45 for all children in the family. It is funded by Federal Title XXI State Children’s Health Insurance Program (SCHIP) and administered by the State’s Managed Risk Medical Insurance Board (MRMIB).
2 Calculated from the 2005 ACS, Table B16004, Age by Language Spoken at Home by Ability to Speak English by the Population 5 Years and Over.
3 Calculated from U.S. Census Bureau website: http://www.census.gov/population/www/socdemo/hh-fam/AmSpks.html, America Speaks: A Demographic Profile of Foreign-Language Speakers for the United States: 2000, released November 28, 2006.
4 U.S. Census Bureau website: http://www.census.gov/population/www/socdemo/hh-fam/AmSpks.html, America Speaks: A Demographic Profile of Foreign-Language Speakers for the United States: 2000, released November 28, 2006.
5 Ewing Marion Kauffman Foundation, Kauffman Index of entrepreneurial activity, National Report, 1996-2005. 6 New Iowans, a Program of the University of Northern Iowa, Immigrant and Refugee Small Business Development
in Iowa, November, 2004. 7 Tienda, Marta, Princeton University, Comparative Perspectives on Ethnic and Immigrant Entrepreneurship and
Business Development in Chicago, Revised November 2001. 8 California’s Healthy Families maintains on its website a downloadable application in ten foreign languages. Nine
appear in Table 1 of this report and one appears in Table 2. These are Armenian, Cambodian (Mon-Khmer), Chinese, Farsi, Hmong, Korean, Lao (Laotian), Russian, Spanish, and Vietnamese. While Healthy Families’ downloadable applications may not be an indicator of all language groups that meet its translation threshold of 3,000 LEP enrollees, and shares of a language group’s population enrolled may differ from its shares who own businesses, they are a strong indicator of the prevalence of persons in these language groups.
9 Percent calculations from the ACS 2005 data show that the County of Los Angeles was home to the largest share of Californians, 28 percent. However, much greater proportions of Armenian (89%), Korean (53%), Persian (43%), Mon-Khmer (42%), Mandarin (40%), and Spanish (39%) speaking people resided there. Much smaller proportions of Hmong (3%), Punjabi (6%), Portuguese (12%), and Vietnamese (19%) speaking people lived in the county. While just 2 percent of Californians lived in the county of San Francisco, much larger shares of Cantonese (24%) and Russians (10%) resided there. Fresno County had larger shares of Hmong (41%) and Punjabi (11%) speakers compared to the 2 percent of all Californians who made their homes there. Sacramento County, which was home to 4 percent of Californians, had much larger shares of persons who spoke Hmong (26%) and Russian (19%).
10 American Community Survey (ACS) website: http://www.census.gov/acs/www/index.html. 11 U.S. Census Bureau website: http://www.census.gov/population/www/socdemo/hh-fam/AmSpks.html, America
Speaks: A Demographic Profile of Foreign-Language Speakers for the United States: 2000, released November 28, 2006.
12 SBA Office of Advocacy, Dynamics of Minority-Owned Employer Establishments, 1997-2001: An analysis of employer data from the Survey of Minority-Owned Business Establishments, Small Business Research Summary No. 251, February 2005.
13 SBA Office of Advocacy, Minorities in Business, 2001, November 2001. 14 SBA Office of Advocacy, Self-Employed Business Ownership Rates in the United States: 1979-2003, Small
Business Research Summary No. 243, December 2004. 15 Ewing Marion Kauffman Foundation, Kauffman Index of entrepreneurial activity, National Report, 1996-2005. 16 New Iowans, a Program of the University of Northern Iowa, Immigrant and Refugee Small Business Development
in Iowa, November, 2004. 17 University of Massachusetts Lowell Center for Family, Work, and Community, Business Owner Support Survey:
A Study of Immigrant Owned Businesses in Lowell, 1998. 18 Tienda, Marta, Princeton University, Comparative Perspectives on Ethnic and Immigrant Entrepreneurship and
Business Development in Chicago, Revised November 2001.
California’s Foreign Language Speakers and Business Owners Not Proficient in English – 2005 Estimates 36
19 Guidance to Federal Financial Assistance Recipients Regarding Title VI Prohibition Against National Origin
Discrimination Affecting Limited English Proficient Persons, U.S. Department of Health and Human Services website, http://www.hhs.gov/ocr/lep/revisedlep.html.
20 LEP.gov, a website maintained by the U.S. Department of Justice: http://www.lep.gov/selfassesstool.htm. 21 Bau, Ignatius, J.D., Federal and State Policy Update: Medical Leadership Council on Language Access,
November 2002. 22 U.S. Census Bureau website: http://www.census.gov/econ/census02/. 23 U.S. Census Bureau website: http://www.census.gov/acs/www/. 24 Instructions for the Spring Language Census (Form $30-LC) Reporting Year: 2007, California Department of
Education website: http://www.cde.ca.gov/ds/sd/lc/. 25 Lowery, Ying, Business Density, Entrepreneurship and Economic Well-Being, 2005 American Economic
Association Meeting in Philadelphia. 26 Household Population: 2002 ACS, Table P002, Race and Table P003, Hispanic by Race. Household Population
under 5 years: 2002 ACS, Tables P005, P005A-D, and P005J-K, Sex by Age. Number of Business Firms: 2002 Economic Census Survey of Business Owners (SBO), Company Statistics Series, Statistics for All U.S. Firms by State, Race, and Gender and Table 3, Statistics for Hispanic-Owned Firms by State and Detailed Hispanic or Latino Origin.
27 Language category by race: Calculated from the 2005 ACS, Tables B16005 A-B and D-E, Nativity by Language Spoken at Home by Ability to Speak English for the Population 5 Years and Over. Language category by ethnicity (Hispanic or non-Hispanic): Calculated from the 2005 ACS, Tables B16005 and B16005I, Nativity by Language Spoken at Home by Ability to Speak English for the Population 5 Years and Over.
28 Calculated from the 2005 ACS, Table B16004, Age by Language Spoken at Home by Ability to Speak English for the Population 5 Years and Over.
29 ACS population estimates of speakers of each language appear in the 2005 ACS, Table B16001. The CDE-based population estimates were calculated as described in the methods section of this report. The calculation of language category business densities is also described in the methods section.
30 Calculated from the 2005 ACS, Table B16001, Language Spoken at Home by Ability to Speak English for the Population 5 Years and Over.
31 The California counties are Alameda, Contra Costa, Fresno, Los Angeles, Orange, Riverside, Sacramento, San Bernardino, San Diego, San Francisco, San Joaquin, San Mateo, Santa Clara, and Ventura. The ACS did not provide detailed language data for the remaining 44 counties because the number of sample cases was too small.