Embed Size (px)
Citation preview

CALIFORNIA TAX CREDIT ALLOCATION COMMITTEE
TCAC Geographic Apportionment Update
1

2
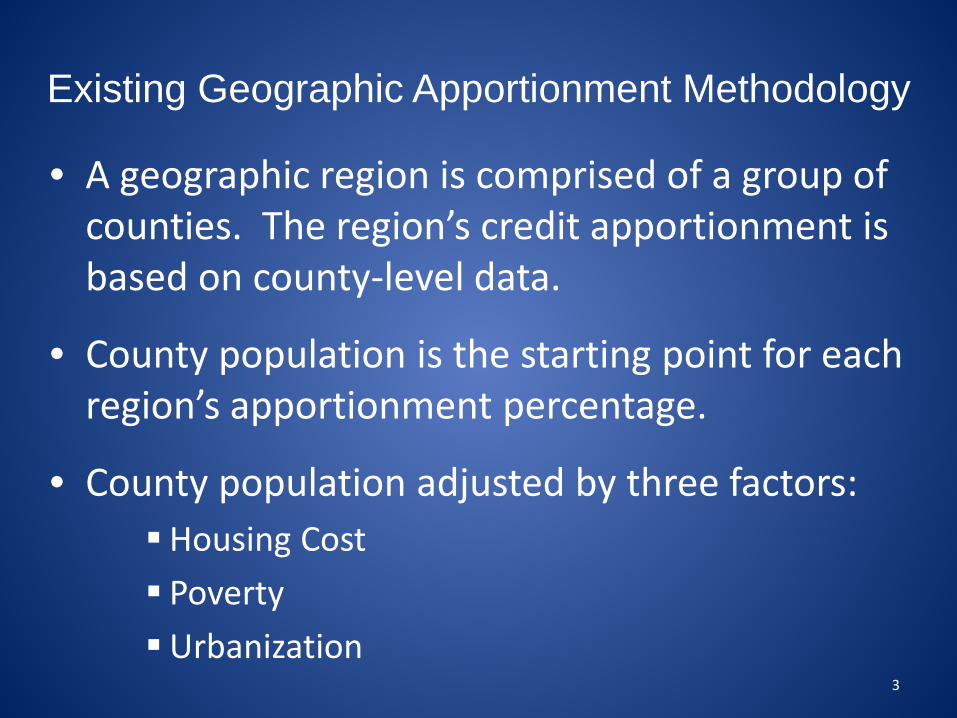
Existing Geographic Apportionment Methodology
• A geographic region is comprised of a group of counties. The region’s credit apportionment is based on county-level data.
• County population is the starting point for each region’s apportionment percentage.
• County population adjusted by three factors: Housing Cost Poverty Urbanization
3

Updated Geographic Apportionment Methodology
• Geographic regions remain comprised of the same group of counties. The City of Los Angeles becomes an 11th region.
• A segment of a county’s population is the starting point for each region’s apportionment percentage.
• This population segment is reduce by an estimate of rural population due to the rural set-aside.
4

Updated Geographic Apportionment Methodology
One factor was considered as an adjustment to the regional apportionments:
Construction Cost
Currently TCAC staff is not recommending a construction cost factor due to lack of applicable data.
5

TCAC Geographic Apportionments
The practical effect of changes in a region’s geographic apportionment:
In 2012, 1% in the geographic apportionment is equal to approximately $550,000 in federal and state tax credits.
6

Updated Geographic Apportionment Methodology
Two datasets are being considered as a replacement of county population:
1. Households with Very Low Income (50% AMI and below) 2. Renters with High Housing Cost Burden
Source data for both datasets is from the U.S. Census Bureau’s American Community Survey, 2006-2010.
7

Updated Geographic Apportionment Methodology
RURAL ADJUSTMENT
• The two datasets are reduced by the percentage of rural population in each county. This results in an adjusted population segment.
• Each county’s adjusted population segment is calculated as a percentage of the total.
8

Very Low Income (50% AMI) and Rent Burdened Region VLI Rent Burdened Current City of Los Angeles 13.7% 17.7% 0%
Los Angeles County 14.9% 17.7% 33%
Central Region 9.1% 8.8% 10%
North and East Bay Region 11.6% 9.9% 10%
San Diego County 8.6% 9.0% 10%
Inland Empire Region 10.3% 8.7% 8%
Orange County 8.1% 7.5% 8%
South and West Bay Region 7.2% 5.6% 6%
Capital and Northern Region 7.4% 6.6% 6%
Central Coast Region 5.7% 5.2% 5%
San Francisco County 3.4 % 3.3% 4% 9

Housing Cost Factor
• TCAC has also considered a housing cost factor to account for the varying costs of construction in the different geographic locations of the state.
• The lack of state- and region-level industry data has created difficulties in applying industry data to geographic apportionment methodology.
• Housing cost factors for two data sources were calculated using available data.
– RS Means City Cost Index
– TCAC Threshold Basis Limit data
10

RS Means Housing Cost Factor
• RS Means City Cost Index calculates a percentage ratio of a city’s cost to the national average.
• The national average is calculated from 30 major U.S. cities. The index includes over 700 cities and there are 35 California cities in the index.
• For example, the city of Santa Barbara has an index of 105.1 in 2012. All cities in California included in the index were above 100.
11

RS Means Housing Cost Factor
• The index represents relative construction factors for material and installation costs.
• Construction costs are not limited to multifamily housing, but include 9 different building types. Apartments are one of the building types, but are limited to 1-3 story buildings.
• Hotels, offices, retail stores, and schools are included in the index.
12

RS Means Housing Cost Factor
• Since the index ratio is tied to a national average, TCAC staff performed calculations to estimate a state number and determine each region’s relation to the state number.
• The state number was calculated using data from all 35 California cities included in the Index. The resulting number was 108.7.
13

RS Means Housing Cost Factor
• Each region was compared to the state number to determine the region’s construction cost in proportion to the state index number.
• The resulting proportion is represented as a percentage. For example, the Central Coast Region’s index was calculated as -1% below the state index number.
• The region’s geographic apportionment was adjusted up or down according to this housing cost factor.
14

Very Low Income with RS Means Housing Cost Factor Region Result Factor Current City of Los Angeles 13.6% -1.7% 0%
Los Angeles County 14.5% -3.9% 33%
Central Region 8.9% -3.2% 10%
North and East Bay Region 12.5% 7.0% 10%
San Diego County 8.2% -5.2% 10%
Inland Empire Region 9.9% -5.2% 8%
Orange County 7.8% -4.4% 8%
South and West Bay Region 7.7% 6.4% 6%
Capital and Northern Region 7.4% -0.5% 6%
Central Coast Region 5.7% -1.0% 5%
San Francisco County 3.8% 13.5% 4% 15

Rent Burdened with RS Means Housing Cost Factor Region Result Factor Current City of Los Angeles 17.6% -1.7% 0%
Los Angeles County 17.2% -3.9% 33%
Central Region 8.6% -3.2% 10%
North and East Bay Region 10.8% 7.0% 10%
San Diego County 8.6% -5.2% 10%
Inland Empire Region 8.3% -5.2% 8%
Orange County 7.3% -4.4% 8%
South and West Bay Region 6.0% 6.4% 6%
Capital and Northern Region 6.7% -0.5% 6%
Central Coast Region 5.2% -1.0% 5%
San Francisco County 3.7% 13.5% 4% 16

TCAC Basis Limit Housing Cost Factor
• TCAC basis limits use historical project-level data from new construction projects to calculate project costs per square foot of all structures.
• A state average is calculated, as well as county-level and regional averages.
17

TCAC Basis Limit Housing Cost Factor
• For the geographic apportionment, a calculation of each region’s average dollar per square foot ($/SF) in proportion to the state average results in a housing cost factor for each region.
• The resulting proportion is represented as a number relative to 1. For example, the Central Coast Region was calculated as 1.01, just above the state average.
18

Very Low Income with TCAC Housing Cost Factor Region Result Factor Current City of Los Angeles 13.6% 0.98 0%
Los Angeles County 14.8% 0.98 33%
Central Region 8.4% 0.92 10%
North and East Bay Region 13.5% 1.15 10%
San Diego County 9.4% 1.08 10%
Inland Empire Region 9.2% 0.89 8%
Orange County 7.1% 0.87 8%
South and West Bay Region 6.7% 0.92 6%
Capital and Northern Region 6.4% 0.86 6%
Central Coast Region 5.8% 1.01 5%
San Francisco County 5.1% 1.51 4% 19

Rent Burdened with TCAC Housing Cost Factor Region Result Factor Current City of Los Angeles 17.5% 0.98 0%
Los Angeles County 17.5% 0.98 33%
Central Region 8.1% 0.92 10%
North and East Bay Region 11.5% 1.15 10%
San Diego County 9.8% 1.08 10%
Inland Empire Region 7.8% 0.89 8%
Orange County 6.6% 0.87 8%
South and West Bay Region 5.1% 0.92 6%
Capital and Northern Region 5.8% 0.86 6%
Central Coast Region 5.3% 1.01 5%
San Francisco County 5.0% 1.51 4% 20

Discussion
21