Embed Size (px)
Citation preview

California Institute of Technology
Pasadena, California 91125
Science Support for the Earth Radiation Budget Sensor
on the Nimbus-7 Spacecraft
Final Technical Report
for the period February 1976 - September 1982
NASA Grant Number HAS 5-22965
Andrew P. Ingersoll, Principal Investigator
Division of Geological and Planetary Sciences
California Institute of Technology
Pasadena, California 91125
Lillian Walker, Code 269, Goddard Space Flight Center, Greenbelt, MD 20771
https://ntrs.nasa.gov/search.jsp?R=19840024877 2018-08-31T04:29:52+00:00Z
The following publications dealing with the earth radiation budget,
climate, clouds, radiation, ice sheets, and Quaternary ice ages were
supported by this grant:
1. Wenkert, D.D., and A.P. Ingersoll. Empirical relations between
radiative flux, cloudiness, and other meteorological parameters. Fifth
Conference on Atmospheric Radiation, 31 October - 4 November, 1983,
Baltimore, Maryland. Published by the American Meteorological Society,
Boston, Mass.
2. Pollard, D., A.P. Ingersoll, and J.G. Lockwood. Response of a zonal
climate-ice sheet model to the orbital perturbations during the
Quaternary ice ages. Tellus. 32. 301-319 (1980).
3. Pollard, D., A simple parameterization for ice sheet ablation rate.
Tellus. 32, 384-388 (1980).

t Tellus(\9SQ),32, 301-319
Response of a zonal climate-ice sheet model to the orbitalperturbations during the Quaternary ice ages1
By DAVID POLLARD and ANDREW P. INGERSOLL, Division of Geological and PlanetarySciences, California Institute of Technology, Pasadena, California 91125, U.SA.
and JOHN G. LOCKWOOD, School of Geography, University of Leeds, Leeds LS2 9JT, England
(Manuscript received October 24 1979; in final form January 8,1980)
.3 ;',. : ABSTRACT
J
The astronomical theory of the ice ages is investigated using a simple climate model whichincludes the ice sheets explicitly. A one-level, zonally averaged, seasonal energy-balance equationis solved numerically for sea-level temperature T as a function of latitude and month (similar toNorth, 1975). Seasonally varying snow cover (which affects planetary albedo) is includeddiagnostically by parameterizing monthly snowfall and snowmelt in simple ways. The net annualaccumulation and ablation on the ice sheet surface at each latitude are computed using the sameparameterizations as for snow cover above (with T corrected for ice sheet height using a lapserate of -6.5°C km"')- Treatment of the ice sheets follows Weertman (1976) with ice flowapproximated as perfect plasticity, which constrains the ice sheet profiles to be parabolic. Thenorthern hemisphere's ice sheet is constrained to extend equatorward from 75 °N (correspondingto the Arctic Ocean shoreline).
Model ice age curves are generated for the last several 100 Kyears by computing the seasonalclimate as above once every 2 Kyears, with insolation calculated from actual Earth orbitperturbations. The change in ice sheet size for each 2 Kyear time step depends only on the netannual, snow budget integrated over the whole ice sheet surface. In these model runs, theequatorward tip of the northern hemisphere's ice sheet oscillates through ~7° in latitude,correctly simulating the phases and approximate amplitude of the higher frequency components(-43 Kyear and 22 Kyear) of the deep-sea core data (Hays et al., 1976). However, the modelfails to simulate the dominant glacial-interglacial cycles (~100 to 120 Kyear) of this data. Thesensitivity of the model ice age curves to various parameter changes is described, but none ofthese changes significantly improve the fit of the model ice age curves to the data. In theconcluding section we generalize about the types of mechanisms that might yield realisticglacial-interglacial cycles.
1. Introduction and summary records of global ice sheet volume have beeninterpreted as showing quasi-periodic glacial-inter-
There is little agreement as yet on the dominant glacial cycles with fast retreats from maximum tocauses of the Quaternary ice ages, although many minimum volumes occurring at intervals of approx-mechanisms have been suggested (described in imately 100 to 120 Kyears; superimposed on theseBeckinsale, 1973; Andrews, 1975, p. 71). Data cycles are secondary oscillations with smallerfrom deep-sea sediment cores provide continuous amplitudes and higher frequencies. Others haverecords of some climatic variables over the last cautioned that some or all of the fluctuations inseveral 100 Kyears (e.g., Broecker and Van Donk, *ese records may not be periodic but essentially1970; Hays et al., 1976; Emiliani, 1978). These random (e.g., Shackieton, 1969, p. 145; Lemke,
1977). In any case, these continuous records are~~~ suitable for comparisons against any simulated
•Contribution number 3344 of the Division of records generated by quantitative models for-Geological and Planetary Sciences, California Institute mulated to test the various suggested ice ageof Technology, Pasadena, California 91125, U.S.A. mechanisms.
Tellus32(1980),4 0040-2826/80/040301-19S02.50/0 © 1980 Munksgaard, Copenhagen

302 D. POLLARD, A. P. INGERSOLL AND J. G. LOCKWOOD
One such mechanism, the "astronomical" or"Milankovitch" theory, involves variations ofincoming solar insolation due to the secularperturbations of the Earth's orbit. These variationsare the only well-known external forcing of climateon ice age time scales. The historical developmentof the astronomical theory is lucidly described inImbrie and Imbrie (1979). Milankovitch estimatedthe sensitivity of climate to this forcing usinginsolation-curve computations (e.g., Milankovitch,1941), and these insolation-curves have beenrefined and extended by Van Woerkom (1953),Vernekar (1972), Berger (1978) and others. Otherrecent investigations have used seasonal climatemodels (Shaw and Donn, 1968; Budyko andVasishcheva, 1971; Saltzman and Vernekar, 1971;Suarez and Held, 1976, 1979; Schneider andThompson, 1979), explicit ice sheet models(Weertman, 1976; Birchfield and Weertman,1978), a combined seasonal climate-ice sheetmodel (Pollard, 1978), and a combined annualmean climate-ice sheet-ocean model (Sergin,1979). Also Calder (1974) and Imbrie and Imbrie(1980) have used single non-explicit "responseequations". Most of these studies have generatedsimulated ice age curves of one sort or another, andcomparisons with deep-sea core records con-sistently indicate that the astronomical forcing canaccount for the observed secondary oscillations;this positive result is consistent with the powerspectrum analyses of Hays et al. (1976) andKominz and Pisias (1979) (but see Evans andFreeland, 1977). However, none of the modelsabove have correctly simulated the dominantglacial-interglacial cycles of the records as aresponse to the astronomical forcing.
This paper reports on a combined seasonalclimate-ice sheet model that was described brieflyin a preliminary paper (Pollard, 1978). We hadhoped that the additional non-linearity due to theinteractions between the ice sheets and the seasonalcycle might be the missing factor required toproduce realistic glacial-interglacial cycles. Withthis motivation we explored the model's sensitivityto a systematic range of parameter variations. InSection 2 below, the model is formulated and itssolution for the present seasonal climate isdescribed. In Section 3, the model's long-termresponse to the orbital perturbations is presented,and in Section 4 we describe the sensitivity of thisresponse to small changes in various parameter
values and types of parameterizations. In the;sections we emphasize some differences betwecthese sensitivities and those of some other clima:models, and suggest which differences in thmodels can account for the different sensitivitieAlthough our parameter changes have relative!slight effects on the fit to the present climate, sonof them have significant effects on the mode!simulated ice age curves, i.e., on its long-tenresponse to the astronomical forcing. Over most cthe parameter ranges these curves retain thsecondary oscillations observed in the deep-secore records; however, with the model in its presenform we are still unable to generate any curveresembling the observed dominant glacial-interglacial cycles.
Therefore, this paper supports the results of thiearlier studies mentioned above. Further, since thipresent model still cannot account for the glacial-interglacial cycles, we suggest in Section 5 that ontor more other long-term mechanisms may b(important.
2. Model formulation and present-dayresults
The model has previously been outlined inPollard (1978). There are two distinct parts corres-ponding to the two distinct time-scales of the globalseasonal climate and the long-term ice sheetresponse. In Sections 2.1, 2.2 and 2.3 the seasonalpart of the model and its solution for the presentclimate are described, and in Section 2.4 the icesheets are incorporated into the model.
2.1. Seasonal energy-balance equationFollowing North (1975), the climate through one
year over a spherical globe is described by azonally averaged, one-level energy-balanceequation for sea-level air temperature T:
8 8— (CT(x,t)]- —Bt 8x
D 8
T2~8x
BT] = Q(x,t)(l - (0
Here x is sin (latitude) and t is time. All dependentvariables are defined as ~1 month running-means,so daily correlations are effectively assumed cons-tant. Boundary conditions are (1 - x2)1'2 STldx =
Tellus32(1980),4

. RESPONSE OF MODEL TO ORBITAL PERTURBATIONS DURING QUATERNARY ICE AGES 303
(1)
>entns,
••ns-
0 at the poles x = ±1 (Mantel, 1972). Othersymbols and their values for our "standard" modelare:
C = 4.6 x 10⁷ J nr2 °C~', a constant seasonalheat capacity of the atmosphere-land-oceansystem (equivalent to a layer of liquid water11 m thick).
D = 0.501 .x 106 m2 s~', a linear diffusioncoefficient acting over the whole thickness ofthe layer represented by C.
R = 6.36 x 10⁶ m, radius of the Earth.A = 201 W m-2, B = 1.9 W m~2 0C~l, net infrared
radiation coefficients.Q = zonal mean insolation at the top of the
atmosphere, computed for any given era fromthe orbital elements in Berger (1976) using asolar constant of 1360 W m~2.
a = rac + (1 - r) a,, earth-atmosphere albedo. ac
= 0.62 represents areas covered by seasonalsnow or ice sheet (see below), and af = 0.31 +0.08 |(3x2 - l)/2] represents areas free ofseasonal snow and ice sheet. We set r = 1north of 75 °N to represent perennial ArcticOcean sea-ice (Ku and Broecker, 1967;Hunkins et al., 1971), and r= 1 south of 70°Sto represent a fixed Antarctic ice sheet (seebelow). At all other latitudes r = 0.6 whencovered by seasonal snow or ice sheet, and r =0 when free of seasonal snow and ice sheet.
S = 1.27 [J m-2 s-'] per [g cm-2 month-'],representing latent heat of fusion released orrequired at each latitude by the varyingamount of seasonal snow cover (see below).The annual mean of S at each latitude is zero.
Most of these parameterizations [discussed forinstance in Coakley (1979)] have found general usein many annual mean energy-balance models andare based on annual mean data. There is currentlysome doubt about the physical basis of the diffusiveheat parameterization (Van Loon, 1979), but itmay be valid for global and seasonal scales(Hartjenstein and Egger, 1979; Lorenz, 1979). Theinfrared radiation and albedo parameterizations arefound to represent seasonal data less accuratelythan annual mean data, possibly due to independ-ently varying cloud cover (White, 1976; Warrenand Schneider, 1979), but we use them here forsimplicity. We also neglect possible variations ofcloud cover in past eras, which might be serious forthe ice age problem. Unfortunately, considerable
uncertainty exists for the prediction of cloudamounts even in much more complex models.
2.2. Seasonal snowmelt and snowfall
Seasonally varying snow cover on land atsea-level is modelled diagnostically by parameter-izing monthly snowmelt and snowfall as functionsof the current air temperature T and insolation Q.We use
Snowmelt (g cm-2 month'1) = max 10; aT(°C)
m-2) + c] (2)
Equation (2) is basically an energy-balanceequation for a melting snow/ice surface withseasonal heat storage neglected, and as such isequivalent to the snowmelt parameterization ofSuarez (1976). Equation (2) is also used below forthe monthly ablation on ice sheet surfaces (Section2.4). For the standard model we use a = 10, b =0.32, c = —47; these values and the adequacy ofthis parameterization for the ice age problem arediscussed in more detail in Pollard (1980).
Whereas snowmelt is a micrometeorologicalprocess, snowfall depends on synoptic-scale pro-cesses and the basic dependence of past andseasonal variations of snowfall on the zonallyaveraged variables T and Q is not nearly soapparent as for snowmelt. For this reason [andfollowing Suarez (1976)] we set
Snowfall (g cm"2 month"')
P(lat.)if7*<0°C
o i f r>o°c (3)
where P is the present observed zonal and annualmean precipitation rate at each latitude. Thenorthern hemispheric data given in Schutz andGates (1971-4) is used for P(lat.) in both modelhemispheres, since the present precipitation insouth polar regions is clearly affected by Antarctictopography. Equation (3) is also used for themonthly accumulation on ice sheet surfaces in thestandard model (Section 2.4), but some effects ofice sheet topography on the local accumulation ratewill be included later.
For simplicity the model neglects variations ofsea-ice. Although this might be serious for the iceage problem, seasonal and past variations of sea-icein the northern hemisphere are somewhat smaller(by factors of ~ 2 to 3) than those of seasonal snow
'.4 Tellus32(1980),4

304 D. POLLARD, A. P. INGERSOLL AND J. G. LOCKWOOD
cover and ice sheets on land (Flint, 1971, figs. 4.8,4.9; Emiliani and Geiss, 1957, table 2; Saltzmanand Vernekar, 1975, table 1).
2.3. Fit to present climateAs in North (1975) and North and Coakley
(1979), the solution of eq. (1) is simplified byexpressing the latitudinal dependences of T and theright-hand forcing in terms of the eigenfunctions ofthe spherical diffusion operator. Only the first threeeigenfunctions are kept [i.e., Legendre polynomials1, x, and (3x2 — l)/2], since any finer latitudinalresolution would probably not be realistic due tothe coarse parameterizations used. However, thediagnostic snow budget parameterizations (2) and(3) prevent a corresponding convenient Fourierexpansion in time / (cf. North and Coakley, 1979).Equation (1) is numerically integrated forward intime-steps of 1 month through consecutive yearsuntil initial transients decay to negligible levels anda repeated seasonal cycle is attained (usually after-10 years).
Fig. 1 shows the sea-level temperature solutionof the standard model, for the present orbitalelements and with no northern hemispheric icesheet. For comparison table la in Warren andSchneider (1979) shows the equivalent data forsurface air temperature. The parameter values ofthe standard model given above were chosen to fitthe present temperature data of the northernhemisphere. With the infrared radiation, albedo andsnow budget parameterizations all fixed (some-what arbitrarily), C was adjusted to yield realisticseasonal amplitudes at mid and high latitudes andD was adjusted to yield realistic latitudinalgradients.
The most obvious discrepancy in Fig. 1 fromreality is the excessive seasonal amplitudes in thesouthern hemisphere due to the uniform value of C;in this respect our climate model is effectively twonorthern hemispheres patched together. Theseasonal snow cover in the model southern hemi-sphere is only a crude analogy for the seasonalvariation of sea-ice around Antarctica. Perhapsmore seriously for the application to the Milan-kovitch theory, the model seasonal cycle in bothhemispheres is lagged ~2 months behind theinsolation cycle, which is about ~1 month morethan observed in the northern hemisphere. Thisexcessive lag has also been found by North andCoakley (1979) and Thompson and Schneider
J F M A M J J A S O N
80
60
_ 20
-20
-40
-60
-80
---(27)-,
J A S N 0
Fig. 1. Zonal mean sea-level temperature vs latitude andmonth for standard model present-day solution. Valuesshown are degrees centigrade. The dashed curve showsthe latitudes of maximum temperature at each month,with maximum temperature values for some months inparentheses. The dotted curves show the latitudinalextents of seasonal snow cover in each hemisphere, forthe months when snow exists equatorward of the limits ofthe Arctic Ocean (75 °N) or Antarctic ice sheet (70°S).
(1979) in their simplest model versions, and isrelated to the lack of any longitudinal contrast inseasonal heat capacity between land and ocean.This excessive lag is reflected in the seasonal snowline shown in Fig. 1; the onset of snow in autumn is~1 month later than observed (Kukla, 1975).
Fig. 2 plots the net annual "potential" snowbudget for the northern hemisphere correspondingto the present-day solution. This shows the netannual snowfall minus snowmelt that would occuron any mountain glacier or ice cap surface at agiven latitude and elevation h, calculated for eachmonth from (2) and (3) but with T corrected to T-6.5(°C km~')-Ji to allow for the atmospheric lapserate. (Of course, snowmelt can continue below thenominal level for these surfaces so that negative netannual budgets are possible.) The zero-budget linegenerally agrees with present data such as the
Tellus 32 (1980), 4

;WOOD RESPONSE OF MODEL TO ORBITAL PERTURBATIONS DURING QUATERNARY ICE AGES 305
IPi' e" S±J|»!- I
sheet (70°S).
'lodel versions, and is
contrast in"een land and oceanJ Mi the seasonal snOw
?Js"owin autumn is(Kukla, 1975).
jaJ "potential" Snow;Pnere correspondingThis shows the nete't that would occur
'•-e cap surface at a- calculated for each' ^corrected to T-• atmospheric lapsecontinue below the
•to that negative net:e zero-budget lineJata such as the
Tellus 32 (1980), 4
3O 40 5OLatitude (°N)
Fig. 2. Net annual snow accumulation minus ablationthat would occur in the model present-day solution onhypothetical ice surfaces at given latitudes andelevations. Values shown are g cm"2 year"1. A model icesheet profile given by (4) roughly representing Greenlandis also shown, although its contribution to the albedo a in(1) was ignored for the present-day solution. The dashedline is the observed "regional snowline" of Paschinger(1912), redrawn from Sugden and John (1975, Fig. 5.5).
generalized "regional snowline" (Paschinger,1912), glacier altitudes in western U.S.A. (Meier,1960), and the altitude of the equilibrium line insouthern Greenland (Schuster, 1954). However, themodel zero-budget line is ~500 m too high in polarlatitudes north of ~70° N. There are few estimatesof the present net annual budget for the entireGreenland ice sheet; approximately half of the totalmass loss is by the calving of icebergs (Paterson,1969, p. 228). The net annual accumulation minusablation for the model Greenland profile in Fig. 1averages to —4 g cm"2 over the southern half and+2 1 g cm"2 over the northern half.
2.4. Ice sheets
Ice sheets are incorporated into the climatemodel following Weertman's (1964, 1976) simpletreatment. Ice sheet flow under its own weight isapproximated to be perfectly plastic, which con-strains the model ice sheet profiles to alwaysremain parabolic:
(4)
sheet surfaceand s is the
center (with sThe ice sheetdepressed to
is a constant
where h is the elevation of the iceabove sea-level, L is the half-widthlatitudinal distance from the ice sheettaken positive towards the equator).base is assumed to be isostaticaUydepths 0.5 h(s) below sea-level. A
Tellus 32 (1980), 4
proportional to the yield stress of ice; for ourstandard model we use A = 10 m, corresponding toa yield stress of ~0.7 bars. This value is slightly lessthan in Weertman (1976) but still gives somewhatgreater central thicknesses (by ~30%) than thosemodelled by Paterson (1972) and those suggestedby Greenland and Antarctica today.
One model ice sheet, representing the Laurentideand Scandinavian ice sheets of past eras, isconstrained to extend equatorward with itsnorthern tip fixed at 75 °N (corresponding to theArctic Ocean shoreline). Where the margins of thereal northern hemispheric ice sheets reachedcontinental coastlines, further advance was pre-vented by rapid iceshelf and iceberg calving into theocean, but their equatorial extent and overallvolume were probably limited more by ablation ontheir southern flanks (cf. Flint, 1971, p. 484, 600).Therefore, as in Weertman (1976), the long-termvariation in the model ice sheet size is controlled bythe net accumulation (snowfall) minus ablation(mostly snowmelt) on its southern half only (i.e., s> 0). Also, since its profile is constrained by (4),any change in size is determined simply by the totalice volume added to or removed from the entiresouthern half. Writing the net annual accumula-tion minus ablation (per unit surface area) as m(s),then the change in ice sheet size per unit long-termtime increment dr is given by:
dV d 1= —U"2L3/2]=-
dr dt p
m(s)L__ _
(1 year)ds (5)
V is the volume of the southern half of the ice sheet(per unit longitudinal distance), related to L from(4). p is the mean ice sheet density, taken as 0.9 gcm-3.
The other model ice sheet representing An-tarctica is circular and centered on the South Pole.The existing Antarctic ice sheet is prevented fromadvancing beyond the continental bedrock by rapidcalving into the southern oceans, so we do notallow this model ice sheet to ever extend equator-ward beyond 70° S. In fact, the ice sheet remains atthis maximum size in all ice age runs shown below,since its net annual budget is always positive.Significant ice age fluctuations in the real Antarcticice sheet might have occurred (e.g., Wilson, 1964),but we defer this possibility to future modeldevelopments.
Model ice age curves are generated by solving(1) for one year's "climate" T(x,t) once at the start

306 D. POLLARD, A. P. INGERSOLL AND J. G. LOCKWOOD
of each long-term time-step dr, using the currentorbital elements. The presence of the ice sheetsinfluences T only through the albedo a. Themonthly snowmelt and snowfall at any point on theice sheet surface is given by (2) and (3) with Tcorrected to T — 6.5(°C krrr')- h and with h givenby (4). These values are integrated to give the netannual snow budget for the northern hemisphericice sheet which is then used in (5) to determine thechange in its size over the next dr years. For all iceage curves below, we used dr = 2 Kyears. Thistype of procedure involving two distinct climatictime scales is described more formally in Hassel-mann (1976), and has been applied to the ice ageproblem by Eriksson (1968) using a generalizedanalytical approach.
3. Ice age results: Standard model
3.1. Ice sheet responseThe ice age simulation produced for the last 400
Kyears by our standard model is compared in Fig.3 with a <518O deep-sea core record from Hays et al.(1976). The model curve of northern hemisphericice sheet volume reflects the forcing of bothobliquity (~41 Kyear period) and precession (~22Kyear period), with obliquity dominating in times
of small eccentricity (e.g., 60 to 0 Kyears BP).response of an ice sheet model to indivijsinusoidal forcings with these periods hasdescribed by Birchfield (1977).] The modellsheet curve closely resembles an equivalent ]sheet curve in Weertman (1976, his fig. 6) and ;the response-curves in Imbrie and Imbrieand coincides both in phase and approximjamplitude with the secondary oscillations of(518O record. The long-term volume inertia of \\ice sheets has produced a phase lag of ~5 toKyears behind the orbital forcing (by visicomparison with various insolation-curves), cojsistent with the measured phase relationshipsHays et al. (1976). But despite its explicit seasoniclimate treatment, our model still lacks the domlnant glacial—interglacial cycles and the drastic iclsheet retreats (e.g., 18 to 0 Kyears BP), in commoifwith Weertman's and Birchfield's models.
In all ice age runs the pattern of net annualaccumulation minus ablation over the ice sheetsremains the same as that shown for Greenland in IFig. 2, i.e., widespread net accumulation over the!central regions and much stronger net ablation over |a relatively narrow strip near the equatorward tip.Therefore, the non-linear possibility suggested byWeertman (1964), of retreating ice sheets becoming
t
400 300 ZOO 100Thousands of years before present
Fig. 3. (a) 8 "O recorded from two combined deep-sea cores (from ~45° S lat.), redrawn from Hays et al. (1976, Fig.9). (b) Ice age curve for standard model, showing northern hemispheric ice sheet volume normalized by its volumewith equatorward tip at 50° N. Right-hand scale shows corresponding latitudes of its equatorward tip. The dashedcurves from 100 to 0 Kyears BP show the effect of choosing different initial ice sheet sizes at 100 Kyears BP. (c)Maximum (monthly mean) sea-level temperature at 55°N (solid curve) and 55°S (dashed curve), corresponding to theice age run in (b).
Tellus32(1980),4

WOODRESPONSE OF MODEL TO ORBITAL PERTURBATIONS DURING QUATERNARY ICE AGES 307
of
-ar ^e equatorward"""'Kay SuEeested
"*'•<* sheets becomi
jiacnant and thus having a shorter shrinkagetime-scale than growth time-scale, does not occur
any of our model runs. Imbrie and Imbrie's11980) "response-equation" does contain such anon-linearity and produces some suggestions ofclacial-imerglacial cycles and drastic ice sheetretreats in response to the eccentricity variations.
[consequently their fit to the Sl'O record is slightly[better than ours, but stills leaves room for
J improvement.10 I The effect of orbital changes on the standard
[ model can be viewed in another way in Fig. 4. Each[ curve shows how the northern hemispheric ice
sheet would grow or recede as a function of its size,for various combinations of the orbital elements.This figure is a development of fig. 7 in Weertman(1961), who analyzed the general shape of thecurves as a simple geometrical consequence of icesheet topography and the typical net snow budgetpattern. As expected (Berger, 1978), the groupingof the curves in Fig. 4 shows that eccentricity plusprecession are most important for large (lowlatitude) ice sheets, whereas obliquity has animportant effect for small (high latitude) ice sheets.For fixed orbital elements, the ice sheet size wouldmove along the relevant curve until it either arrives
ting K at a stable point S or is ablated away to the Arcticshoreline. The ice sheet tip in the ice age run of Fig.
3 (b) varies between ~50°N and ~60°N, and thisis the region in Fig. 4 where approximately half ofthe orbital combinations are enlarging the ice sheettowards stable points S and the other half areablating it toward the Arctic shoreline. However,this potential amplitude of some 30° in latitudeimplied by Fig. 4 is reduced to ~ 10° latitude in Fig.3 (b) by the volume inertia of the ice sheet.
The full amplitude of ~30° in latitude is reflectedin the dashed curves in Fig. 3 (b), which show theeffect of choosing different initial ice sheet sizes at100 Kyears BP. If the initial tip position is north of~61°N, the ice sheet does not return to the solidcurve. Instead it is ablated back to the Arcticshoreline and remains there forever, since themajority of orbital combinations produce negativeregimes for these small ice sheet sizes. This is anexample of an "intransitive" climate system (Lorenz,1970), with two possible stable branches depend-ing on the initial conditions. The orbital forcing byitself is insufficient to produce transitions from onebranch to another, and so we effectively had to"choose" the ice-sheet-free branch for the present-day fit in Section 2.3, and the other branchexhibiting ice sheet oscillations for this section.Some modifications described below will makethese transitions possible (Fig. 10) or will eliminatethe distinction between the two branches (Fig. 8).
a"«aJ. (1976, FigJ^** volume?* f The dashedw Kyears BP (c\
'^ponding to the
-reJJUS32(]9gO),4
Z 70-
/ObliquityI eccentricity\precessioi
ecc=0.05,pfec =160°ecc = 0ecc = 0.05, prec = 0°
i I i
"Vin/
-90 -80 -70 -60 -50 -40 -30 -20 -10 10 20 30
Mean accumulation minus oblation (g cm yea r " ' )
Fig. 4. Curves of net annual northern hemispheric ice sheet budget (averaged over southern half) as functions of itssize, for various combinations of the orbital elements. (Precession is defined here so that it is zero when the northernhemispheric winter solstice coincides with perihelion, and 180° when this solstice coincides with aphelion.) Thesecurves are for the standard model. For fixed orbital elements, "S" are stable equilibrium points, "U" are unstableequilibrium points, and the arrows show directions of ice sheet growth and decay.
Tellus32(1980),4

308 D. POLLARD, A. P. INGERSOLL AND J. G. LOCKWOOD
The time-scale on which the dashed curves inFig. 3 (b) converge onto one branch or another ison the order of ~40 Kyears. This represents theintrinsic time-scale of the quasi-linear ice sheetresponse on either branch, and is roughly con-sistent with the amount of lag (mentioned above) ofthe solid curve in Fig. 3 (b) behind the orbitalforcing. Because the model has only one long-termtime-derivative [in (5)1, there can be no free internaloscillations of the system in the absence of externalforcing, as there are in Sergin's (1979) climate-ocean-ice sheet model.
3.2. Temperature response
Fig. 3 (c) shows the variation of maximumsummer temperature at particular latitudes for thestandard ice age run. The temperature curve for55° N seems (visually) to lag only ~0 to 4 Kyearsbehind the orbital forcing, considerably less thanthe ice sheet volume curve. This summer temper-ature curve has roughly the same phase as variousnorthern hemispheric curves in Shaw and Donn(1968), Suarez and Held (1979) and Schneider andThompson (1979). The higher-frequency compo-nent of the temperature curve for 55° S reflects theforcing of precession, which is 180° out of phasebetween the two hemispheres. The phase of the55° S curve does not agree with that of thesecondary oscillations of the "Ts" deep-sea corerecord for -45° S in Hays et al. (1976); the latter isfound to lead those of the <5>8O core record by ~2
Kyears. This disagreement may be due to thshortcomings in the model formulation for thsouthern hemisphere. [Both Suarez and Held:-(1979) and Schneider and Thompson's (1979models have realistic southern hemisphericseasonal heat capacities, but they appear to yieldsouthern hemispheric temperature phases that areopposite to each other.]
Table 1 summarizes the sensitivity of northernhemispheric temperatures to some particularchanges in the orbit and ice sheet size (analogous toFig. 4). The most extreme orbital variation with nonorthern hemispheric ice sheet (col. 4, Table 1)causes seasonal temperature changes comparableto those caused through the albedo a by a fullglacial-interglacial ice sheet variation at fixed orbit(col. 5, Table 1). However this ice sheet variationcauses annual mean temperature changes at midand high latitudes that are considerably larger thanthose caused by the orbital variations, in agree-ment with the trend in Sergin (1979, fig. 16).
We now compare the sensitivities in Table 1 tothose of other models. The sensitivities of annualmean temperatures to the orbital variations (cols. 2to 4, Table 1) are similar to those of Schneider andThompson's (1979) model, but are generally lessthan 1/4 of those in Suarez and Held (1979). Theextra sensitivity in the latter model is probably dueto greater albedo feedback of seasonal snow. Asdiscussed by Suarez and Held, albedo feedback isgreater for models like theirs having realisticland-ocean longitudinal contrast. However in
Table 1. Differences of sea-level temperatures at particular latitudes between different orbits (as definedin Fig. 4) with no northern hemispheric ice sheet (columns 2 to 4), and between different ice sheet sizeswith the same orbit (column J)
Latitude
89° N
45° N
S orbit
(22. A0 )
~ '
U,1) '••(-!:?) «•<
S orbit 8 orbit/22.A /22.A /24.5\0.05-0.05 0.05 -
\180/ \0 / \180/
/ 2.5\ / 5.8\1-2.4 J-°-4 \-3.l)
(_i;)-o.3 m)-
/22.1\0.05
\0 /
0.7
0.1
S ice sheet tip(73°N-50°N)
(«j) 4.0
(u)2'6
IS) »The values in parentheses are differences in °C for the months of maximum northern hemispheric summertemperatures (upper value) and minimum northern hemispheric winter temperatures (lower value). The other valueoutside the parentheses is the annual mean temperature difference in °C.
Tellus32(1980).4
I

KWOOD
^agreement may be due to thethe model formulation for the
•here. [Both Suarez and Held's'icider and Thompson's (1979)realistic southern hemisphericDeities, but they appear to yield•eric temperature phases that arethen]arizes the sensitivity of northern•peratures to some particular>it and ice sheet size (analogous toextreme orbital variation with noeric ice sheet (col. 4, Table 1)emperature changes comparablethrough the albedo a by a full
.-.1 ice sheet variation at fixed orbitHowever this ice sheet variation
. can temperature changes at midi that are considerably larger thanthe orbital variations, in agree-
ndinSergin(1979,fig. 16)./.are the sensitivities in Table 1 toodels. The sensitivities of annual
•ss to the orbital variations (cols. 2- similar to those of Schneider and•9) model, but are generally less
.- in Suarez and Held (1979). Then the latter model is probably due
••-, feedback of seasonal snow. As.rez and Held, albedo feedback is:;els like theirs having realisticritudinal contrast. However in
ctween different orbits (as defined.1 between different ice sheet sizes
2.1\i.05 5 ice sheet tip
(73°N-50°N)
RESPONSE OF MODEL TO ORBITAL PERTURBATIONS DURING QUATERNARY ICE AGES 309
addition to this effect, Suarez and Held haveadjusted their parameter values so that over nearlythe whole range of orbital variations, their northernhemispheric minimum summer snowline remainsequatorward of the Arctic Ocean; in contrast, ourmodel solutions (for cols. 2 to 4, Table 1) have noseasonal snow (i.e., no albedo feedback) in summerequatorward of our Arctic Ocean shoreline at75° N, as in Fig. 1. The real summer snowlineseems to be roughly intermediate between these twomodel situations (Dickson and Posey, 1967;Kukla, 1975; Williams, 1978).
The reductions of T in summer due to the icesheets (col. 5, Table 1) are comparable to thosefound by CLIMAP (1976) data for sea-surfacetemperatures of the last glacial maximum. Thecorresponding air temperature reductions found bythe more complex zonal model of Saltzman andVernekar (1975) and the GCM of Gates (1976a,b)are generally larger than in col. 5 (by ~100%),whereas the GCM of Williams (1974) has foundmuch larger air temperature reductions (of
ium northern hemispheric summeriiures (lower value). The other value
These differences in the temperature sensitivitiesof the various models lead to some uncertainty inapplications to the Milankovitch theory. Forinstance, it may be that if we replaced our simpleclimate model with Suarez and Held's model, theamplitude of the ice sheet response in Fig. 3 (b) (aswell as the annual mean temperature response)would be increased by a factor of ~4. However,our simple model already realistically simulates thesecondary oscillations of the <518O data, and anylarge alteration of its ice sheet sensitivity woulddestroy this agreement. What is needed is a modelmodification to produce the dominant glacial-interglacial cycles of the data.
4. Ice age results: parameter sensitivity
The aim of this section is to explore the range ofparameter values and parameterizations that stillyield realistic ice age secondary oscillations, andalso to search for a model modification that mayproduce the full glacial-interglacial cycles. We donot concentrate on the sensitivity of particularclimate solutions T(x,t) per se. Most of theparameter changes examined below do slightlyperturb the present-day solution of Section 2.3(e.g-, by <±2°C in Fig. 1, by < ±500 m in thezero-budget line altitude in Fig. 2), but these
perturbations are minor compared to the existingcoarseness of the fit to present data.
4.1. Climate parameter variationsFig. 5 shows the sensitivity of the ice age curve
to small variations in the diffusion parameter D,with all other parameters held constant. Only theresponse for the last 100 Kyears is shown, but thisis sufficient to demonstrate the behavior for anytime period. We have performed the same exercisefor small variations (-2 to 10%) in each one of the"climate parameters" C, B, at, ac, a, b, and c[appearing in (1) and (2)] in turn, all with virtuallythe same result as in Fig. 5.
For parameter changes that have the effect ofreducing the summer temperatures in mid and highlatitudes or reducing ablation for a given temper-ature and insolation, the mean position of the iceage curves move smoothly equatorward. The effectof precession (~22 Kyear period) becomes morepronounced equatorward of ~45°N, as might beexpected from Fig. 4. Apart from this effect, thebasic model response is unchanged and stillresembles the secondary oscillations of the ice agedata. [For larger parameter variations than shownhere, a sudden transition to ice-sheet-coverednorthern hemispheric continents might be expected.In other runs (not shown) investigating solarconstant variations, ice sheets could exist in stableequilibrium down to ~20°N for solar constantreductions of up to ~5%, beyond which they grewdown to the equator.] For parameter changes in theother direction, there is a sudden transition to anice-sheet-free northern hemisphere; there is nostable mean ice sheet tip position between ~55°Nand the Arctic shoreline. Once the minimum size isreached, the ice sheet never grows out again [as inFig. 3 (b)].
The behavior in Fig. 5 can be explained byreferring to Fig. 4. Climate parameter variationsbasically have the effect of shifting the pattern ofcurves in Fig. 4 horizontally relative to the"regime" x-axis. For small shifts toward morenegative regimes, ice sheet sizes in the range ~50°to 60° N begin to lie more on the unstable ablatingbranches of most orbital curves, and so are reducedback to the Arctic shoreline. For relatively largeshifts toward more positive regimes, more orbitalcurves have stable points 5 and the range oflatitudes of these stable points smoothly movesequatorward.
Tellus32(1980),4 Tellus32(1980),4

310 D. POLLARD, A. P. INGERSOLL AND J. G. LOCKWOOD
0
80 60 40Kyeors B.R
20
F(g. 5. Ice age curves for the standard model except:(a) Diffusion coefficient D = (0.31/0.30) x standardmodel value, (b) Diffusion coefficient D = (1) x standardmodel value, (c) Diffusion coefficient D = (0.29/0.30) xstandard model value, (d) Diffusion coefficient D =(0.28/0.30) x standard model value, (e) Diffusioncoefficient D = (0.23/0.30) x standard model value.
If only one climate parameter is varied at a time,the range of interest is limited by the sudden retreatof the ice sheets las in Fig. 5 (a)]. Another commonsensitivity test (Coakley, 1979; Warren andSchneider, 1979) is to vary two or more para-meters simultaneously so that their basic effectspartially cancel each other and the mean ice sheetposition can be held "on scale". Three examples ofthis are shown in Fig. 6. In curves (a) and (b) largevariations in D are compensated by changes in thealbedo contrast to maintain nearly the sametemperature field for a given orbit and ice sheetsize. In curves (c) a low value of the seasonal heatcapacity C (which produces larger seasonal cyclesand higher summer temperatures at high latitudes)is compensated crudely by reducing the ablationrate by a constant factor.
0.5
£ i.oo
o
1.5
75
70
65
60
55 ~o
o.50 -
<u
"545 -J
40
100 80 60 40Kyears B.P.
20
Fig. 6. Ice age curves for the standard model except:(a) Solid curve: Diffusion coefficient D - (0.23/0.30) xstandard model value, and a, = ojs) + 0.017, oc =o£sl — 0.14, where ofs) and o'sl are the standard modelalbedos for snow-ice/free and snow-ice/covered surfacesrespectively, (b) Dashed curves: Diffusion coefficient D- (0.37/0.30) x standard model value, and ar = ofsl
- 0.015, ac = a<s) + 0.134, showing two different choicesof initial ice sheet size, (c) Dotted curves: Seasonalheat capacity C = (7/11) x standard model value, andwith ablation rates (2) reduced by a factor 0.42,showing two different choices of initial ice sheet size.
For the large value of D and the low value of C,two different initial ice sheet sizes are chosen toshow that the lower branch of stable ice sheet tippositions has shifted south to ~40° to 45 °Nlatitude. This is because both these parametervariations favor the net snow budget of large icesheets relative to small ones, due to increased icesheet albedo feedback for large D and due to largersummer temperature increases at higher latitudesfor low C. Consequently the stable points "5" inthe corresponding orbital-curve diagrams (notshown) are located ~10° to 15° further south thanin Fig. 4. This is the only real difference in Fig. 6from the standard model response, and the ampli-tude and phase of the ice sheet oscillations haveremained basically the same.
We have not repeated the exercise in Fig. 6 for
Tellus32(1980),4

KWOOD
75
70
65
60
55 —
o.50 '-
CT
45
40
I60
years40
B.P.20
• es for the standard model except::sion coefficient D = (0.23/0.30) xe, and a, = ofs) + 0.017, ac ='s| and ajsl are the standard modelTree and snow-ice/covered surfaces'led curves: Diffusion coefficient Dndard model value, and at = ofs)
.134, showing two different choicesize. (c) Dotted curves: Seasonal/ l l ) x standard model value, and(2) reduced by a factor 0.42,
choices of initial ice sheet size.
IB of D and the low value of C,ice sheet sizes are chosen to
•r branch of stable ice sheet tip-ed south to ~40° to 45 °N•ecause both these parameter
net snow budget of large icenail ones, due to increased ice•k for large D and due to largere increases at higher latitudes;ently the stable points "5" inorbital-curve diagrams (not
-10° to 15° further south than••• only real difference in Fig. 6•.odel response, and the ampli-•he ice sheet oscillations have' e same.
ited the exercise in Fig. 6 for
Rl-SPONSE OF MODEL TO ORBITAL PERTURBATIONS DURING QUATERNARY ICE AGES 311
all possible combinations of parameter variationslof which there are on the order of 10!, as noted byImbrie and Imbrie (1980)1. In the development ofthis model we experimented relatively unsystem-atically with many (perhaps ~200) combinations ofparameter values that appear in eqs. (1) to (5), andnever found any types of ice age response otherthan those described in this paper.
The constants in the ablation parameterization(2) are not tightly constrained by present glacialdata (Pollard, 1980). We ran several ice age curves(not shown) using widely different values; forinstance (a,b,c) = (20,0,80) respectively so thatablation depended only on temperature, and (a,b,c)= (5,0.32,-68) so that the temperature depen-dence was half that of the standard model. In theseruns, the responses to the orbital perturbationswere basically unchanged from the standard model,producing secondary oscillations of the same phaseand magnitude without any suggestion of fullglacial-interglacial cycles. [The temperature depen-dence in (2) cannot be eliminated completely. Witha = 0, the model yields unrealistic seasonal cycleswith snow-free high latitudes in summer andperennial snow in mid-latitudes, due to thelatitudinal forms of the precipitation rate and theseasonal insolation forcing. In the present model,ablation and seasonal snow cover must be control-led mainly by temperature.]
Henderson-Sellers and Meadows (1979) andCogley (1979) have suggested that variations ofhigh-latitude ice cover have affected the planetaryalbedo to a much lesser degree than in many othermodels. Correspondingly Fig. 7 (a) shows a runwith no albedo feedback at all, neither from theseasonal snow nor from the ice sheets; a is simply aconstant function of latitude. The present-daysolution with this parameterization still fits thepresent data as well as the standard model inSection 2.3. The ice age response in Fig. 7 (a) isbasically unchanged from that of the standardmodel, suggesting that ice-albedo feedback is not asignificant mechanism for the secondary oscil-lations of the ice age records. Fig. 7 (b) showsanother run using an albedo partly dependent onsolar zenith angle, as investigated by Lian and Cess(1977). Again there was no basic change in the iceage response, as might be expected from theindifference of Fig. 7 (a) to the albedo para-meterization.
Fig. 7 (c) shows an ice age run for an annual
§0.5
i.o
100 80 60 40Kyeors B.P.
75
70
65
60
55
50
45
20
Fig. 7. Ice age curves for the standard model except: (a)Solid curve: Using fixed albedos, a = 0.35 + 0.2I(3x2 -l)/2) always, (b) Dashed curve: Using fraction of hourlyinsolation absorbed by the earth-atmosphere system =/(0.35 cos (s) + 0.479], where s is hourly solar zenithangle and / = 1 or 0.6 for snow/ice-free or snow/ice-covered surfaces respectively, (c) Dotted curve: Usingannual mean insolation in eq. (1), and using (a,b,c) =(10,0,122) respectively in eq. (2). Also setting 5 = 0 ineq. (1).
mean version of our model. For this version, thecurrent annual mean insolation at each latitude isused for Q in (1), and ablation depends only on T.The resulting annual mean climate solutions forindividual years are much the same as in North(1975), with a sea-level snowline potentially at~70°N (except that for Fig. 7 (b), this latituderegion is occupied by ice sheet). The peak-to-peakamplitude of the ice sheet tip response of the annualmean version is reduced to ~1.5° in latitude, andtemperature variations at fixed latitudes are all£1 °C. Therefore we find that the seasonal cycle isnecessary for our model to produce realisticsecondary oscillations. We have seen that seasonalalbedo feedback is not necessary for the seasonalmodel's ice age response [Fig. 7 (a)], so seasonalalbedo feedback cannot be the important differencebetween the seasonal and annual mean models. Theimportant difference seems to be due to the factthat the orbital perturbations change the seasonalcycles of temperature (at the latitudes around theice sheet tip) much more than the annual meantemperatures. The ice sheets respond just as much
Tellus32(1980),4 Tellus 32 (1980), 4

312 D. POLLARD, A. P. INGERSOLL AND J. G. LOCKWOOD
to changes in the seasonal cycles as to the annualmean changes, due mostly to the non-linearity inthe ablation parameterization (2), and so theseasonal version of the model produces a muchlarger ice sheet response.
We now compare the sensitivities in Fig. 7 tothose of two other seasonal energy-balance models.North and Coakley's (1979) model has a seasonalsnowline, a perennial "ice line" fixed to the -10°Czonal and annual mean isotherm, and also con-tains longitudinal land-ocean asymmetry. In res-ponse to obliquity changes of 1.2°, their perennialice line changes by 3° in latitude for the seasonalversion and 2° in latitude for the annual meanversion. Presumably for obliquity variations of 2.4°(more representative of the actual orbital pertur-bations) this would imply ice line changes of 6° lat.(seasonal version) and 4° lat. (annual meanversion). In contrast, our model ice sheet tip variesby 7° lat. (seasonal version) and ~1.5° lat. (annualmean version) in response to the actual orbitalperturbations (including precession). This points toan important difference between the two models:their ice line responds only to the mean annualtemperature and so the increased response of theirseasonal version is due to slight variations in theresidual correlation between the seasonal cycles ofalbedo and insolation. However, as discussedabove, our more non-linear ice sheets responddirectly to variations in the seasonal cycles them-selves, resulting in a greater difference in responsebetween seasonal and annual mean versions.
Schneider and Thompson (1979) find that thesensitivity of temperature to the orbital pertur-bations in their seasonal climate model is decreasedby ~30% by using fixed (constant) albedoscompared to using seasonally varying albedos.When our model is run with no ice sheets we findbasically the same result as theirs, and the differentresult implied by Fig. 7 (a) is due to the presence ofthe ice sheets. The albedos in our standard modelcan change only in the winter months when theseasonal snowline extends equatorward beyond theice sheet tip; during the summer months the icesheets prevent any change in albedo and so theseasonal variation of albedo is reduced consider-ably (cf. discussion of Table 1).
North and Coakley (1979) and Thompson andSchneider (1979) both find that the sensitivities oftheir models to 1% solar constant variations arenearly the same for seasonal and annual mean
versions, which at first sight contradicts the rJin Fig. 7 (c). However, solar constant variatjprimarily affect the annual mean insolation andthe seasonal cycles, and so are a fundamenildifferent type of forcing from the orbital perlbations in Fig. 7. [In fact we do find (not sholthat the sensitivities to small solar consilvariations of our seasonal and annual mversions are very nearly the same, with glo|annual mean temperatures changing by 1.8°C1 % change in solar constant.]
We now mention two other modifications to imodel that were tried. In some runs, monthly zoilprecipitation was parameterized as a function [sea-level temperature T and dTVdlatitude,opposed to the fixed precipitation of the standajmodel. Several similar functions were tried,instance
Precip. (g cm~2 month~')
= max [4;l 10 8T(°C)/8 lat. (deg.)l]exp[r(°C)/17]
This is a very rough fit to present seasonal zodata in Schutz and Gates (1971-4); similaparameterizations have been investigatedSchneider and Thompson (1977). The functiorimplies a reduction in precipitation during glaciamaxima associated with lower saturation vapoipressures, which has sometimes been suggested a:a significant ice age factor. However, these parameterizations produced no ice age curves significantly different from those of the standard modelsuggesting that the secondary oscillations of the ic<sheet records have been caused more by ablatiorvariations than accumulation variations. Data irYapp and Epstein (1979) and Ruddiman ancMclntyre (1979) are suggestive of important ic<age precipitation variations due to changinglongitudinal land-ocean temperature contrasts, buithis is outside the scope of the present model.
In several runs (not shown) we crudely attempted to simulate the long-term effect of th<short-term "random" weather variability, asanalyzed by Hasselmann (1976) and Lemkc(1977). In these runs a random term, rectangularl)distributed between ±10 g cnr2 year-' [i.e., ±2 x10⁴ g cm~2 (2 Kyear)-1], was added to the mearice sheet budget at each 2 Kyear time step. Th<resulting ice sheet volume curves were not significantly different from the standard model responsewith no suggestion of any drastic ice sheet retreats.
Tellus32(1980),4

j. LOCKWOOD
hich at first sight contradicts the result.c). However, solar constant variations•Tect the annual mean insolation and notil cycles, and so are a fundamentallype of forcing from the orbital pertur-,7ig. 1. [In fact we do find (not shown)•ensitivities to small solar constantof our seasonal and annual mean2 very nearly the same, with globali temperatures changing by 1.8 °C pern solar constant.]nention two other modifications to theere tried. In some runs, monthly zonalwas parameterized as a function of
nperature T and dr/dlatitude, as•he fixed precipitation of the standard-al similar functions were tried, for
r2 month-')
103r(°C)/dlat.(deg.)l]
RESPONSE OF MODEL TO ORBITAL PERTURBATIONS DURING QUATERNARY ICE AGES 313
y rough fit to present seasonal zonalutz and Gates (1971-4); similar
.ions have been investigated byd Thompson (1977). The functioniction in precipitation during glacial:iated with lower saturation vapor'ch has sometimes been suggested as.-e age factor. However, these para-produced no ice age curves signifi-: from those of the standard model,' the secondary oscillations of the ice'iave been caused more by ablation
•• accumulation variations. Data instein (1979) and Ruddiman and
''9) are suggestive of important ice'on variations due to changing-d-ocean temperature contrasts, but'•e scope of the present model,-uns (not shown) we crudely at-:ulate the long-term effect of thendom" weather variability, as'lasselmann (1976) and Lemkeruns a random term, rectangularly•;en ±10 g cm~J year"1 [i.e., ±2 xlyear)-'], was added to the mean
• at each 2 Kyear time step. The••-t volume curves were not signifi-'-om the standard model response,n of any drastic ice sheet retreats.
Tellus32(1980),4
4.2. Ice sheet parameter variations
No really different ice age responses in either theamplitude or the phase of the secondary oscil-lations have been produced by the climate para-meter variations above. As shown below, para-meter variations concerning the ice sheet can havesomewhat greater effects.
Fig. 8 show ice age runs with the precipitation onall ice sheet surfaces reduced by a factorexp |-A(km)/3] from the zonal mean, where h isthe local ice sheet elevation given by (4). Tobalance this, ablation is also reduced slightly. Thiscrudely models the topographic blocking of stormscarrying precipitation to the ice sheet interiors, asobserved on Antarctica and Greenland today(Mock, 1967; Chorlton and Lister, 1968). Theeffect of slight variations in the weather para-meters in Fig. 8 is similar to Fig. 5, but now there isno sudden transition to an ice-sheet-free northernhemisphere, and stable mean ice sheet tip positionscan exist between ~55°N and the Arctic shoreline.The corresponding orbital-curve diagram is shownin Fig. 9; these curves do not bend back to negativeregimes for small ice sheets nearly so much as inFig. 4, allowing small stable ice sheets. This alsoimplies that ice age runs with different initial icesheet sizes converge to the same curve, as shownby the dashed curve in Fig. 8; the equivalent curvein Fig. 3 (b) retreated to the Arctic shoreline.
9 O.5
o 1.0
55
60 10
Kyeors B. P.
20
Fig. 8. Ice age curves for the standard model except thatprecipitation on ice sheets is reduced by factorexp [—/i(km)/3] from the zonal mean, and: (a) Ablationcoefficient b — 0.30 in eq. (2). (b) Ablation coefficientb = 0.28 in eq. (2). (c) Ablation coefficient b = 0.26 in eq.(2). (d) Ablation coefficient b = 0.24 in eq. (2). (e)Dashed curve is as for curve (c) but with different initialice sheet size, (f) Dotted curve is for standard modelexcept that precipitation on ice sheets is altered by factor2 exp I—/i(km)/3] from the zonal mean.
The change from Fig. 4 to Fig. 9 can beexplained as follows: the reduction in precipitationis greater for large ice sheets than for small ones,whereas the ablation reduction we have used to
70
60
50
O
£40
30
^^
j i i_
•'•;</,-2^(
\l8Q
.0.05
ecc--0.05,prec =180°ecc = 0ecc =0.05, prec = 0°
I I 1_-90 -80 -70 -60 -50 -40 -30 -20 -10 0
Meon occumulotion minus oblotion (g cm year )
10 20 30
Fig. 9. As Fig. 4 except that precipitation on ice sheets is reduced by factor exp I—A(km)/3] from the zonal mean, andb = 0.26 in eq. (2).
Tellus32(1980),4

314 D. POLLARD, A. P. INGERSOLL AND 1. G. LOCKWOOD
balance these reductions affects all ice sheet sizesequally. Any equivalent modification to the model,that favors the net snow budget of small ice sheetsrelative to large ice sheets, produces changes in thesame direction as Fig. 9; for instance, smaller lapserate magnitudes than 16.51 °C km~' in (2), thinnerice sheet profiles, or less ice sheet albedo feedback.(The trend in the opposite direction was describedbriefly in connection with Fig. 6.)
In contrast to the precipitation reductions in icesheet interiors, the steep flanks of ice sheets canlocally increase precipitation on the sides facing theprevailing winds (Mock, 1967). To crudely test thiseffect we ran some ice age curves (not shown) withprecipitation on all ice sheet surfaces increased by afactor of 2 over the zonal mean (and with ablationsimilarly increased by a constant factor). How-ever, the only effect on the response was thepredictable one of doubling the peak-to-peakamplitude of the secondary oscillations to ~15° inlatitude. There were still no suggestions of arealistic glacial-interglacial cycle.
The amplitude of the response can also beincreased by using thinner ice sheets, i.e. byreducing the value of A in eq. (3) below 10 meters.Fig. 10 shows two runs using X w 4 meters, whichlies slightly below the range of values appropriatefor existing ice bodies (Paterson, 1972, table 2).Perhaps more unrealistically, isostatic depressionof the land surface beneath the ice sheet is ignored.These curves show transitions between a mean icesheet position around ~55°N (from 300 to 200and from 100 to 0 Kyears BP), and a much smallermean position trapped near the Arctic shoreline
(from 200 to 100 Kyears BP). This type ofresponse is intermediate between those in Figs. 5and 8; now the increased amplitude of the basicoscillations (forced by obliquity and precession) issufficient to ocassionally bridge the gap betweenthe two stable positions. This new situation mightbe classified as "almost intransitive" (Lorenz, 1970).
We have chosen slightly different minimum icesheet sizes for the two curves in Fig. 10, and thisdifference can occasionally be important in allow-ing an "escape" from the Arctic shoreline or not(e.g., at ~150 Kyears BP). In reality regional landtopography becomes important for these nascentice sheets (Loewe, 1971; Barry et ah, 1975), andthe present model just suggests that such details forsmall ice sheets can sometimes affect the form ofthe subsequent response.
The curves in Fig. 10 are notably similar tomany of the curves produced by the ice sheetmodels of Weertman (1976) and Birchfield andWeertman (1978), and also to the curve producedby Calder's (1974) response equation. The ice sheetthicknesses used by Birchfield and Weertman (A =14 meters) are more similar to our standard modelvalue, and considerably greater than those in Fig.10. Presumably this is compensated by our climatemodel producing smaller net snow budget varia-tions (due to the orbital forcing) than thoseproduced by their more geometrical parameter-ization; the curve in Weertman (1976), Fig. 6) thatis most similar to our standard model curve [Fig. 3(b)l uses accumulation and ablation values that aregenerally -1/2 to ~l/3 of those in our model. Asin their studies, we have also tried using circular
0.5
. 1.0Eo
757065
60
55
50
crO)
300 200 100 0Thousands of years before present
Fig. 10. Ice age curves for standard model except with no isostatic depression below the ice sheets, and: (a) Solidcurve: ). = 4.2 meters in eq. (3), and values of (a,b,c) in eq. (2) are (8,0.234,—39.2) respectively. Also minimum icesheet half-width = 1.5° lat. (b) Dashed curve: i = 3.6 meters in eq. (3), and values of (a,b,c) in eq. (2) are(8,0.226,-39.2) respectively. Minimum ice sheet half-width = 2.0° lat.
Tellus32(1980),4

-ars BP). This type ofoetween those in Figs. 53 amplitude of the basic•iiquity and precession) isbridge the gap between
This new situation mightransitive" (Lorenz, 1970).iy different minimum iceirves in Fig. 10, and this<y be important in allow-- Arctic shoreline or not)- In reality regional land
;jortant for these nascent• Barry et al., 1975), and,gests that such details foretimes affect the form of
3 are notably similar tooduced by the ice sheet976) and Birchfield and!so to the curve producedise equation. The ice sheettfieid and Weertman (/I =lar to our standard modelgreater than those in Fig.
^mpensated by our climate>• net snow budget varia-ital forcing) than thosee geometrical parameter-•rtman (1976), Fig. 6) thatndard model curve [Fig..3
•nd ablation values that areof those in our model. Ass also tried using circular
RESPONSE OF MODEL TO ORBITAL PERTURBATIONS DURING QUATERNARY ICE AGES 315
he ice sheets, and: (a) Solidjectively. Also minimum ice:s of (a,b,c) in eq. (2) are
rather than linear northern hemispheric ice sheets,and have taken the ice sheet budget over the wholesurface and not just the southern half. Howeverthese modifications leave our ice age runs basicallyunchanged. Although their curves and those in Fig.10 might be considered suggestive of possiblelonger-period cycles and their spectra may containsome power at periods > 100 Kyears (Birchfieldand Weertman, 1978), the models still fail toproduce realistic glacial—interglacial cycles. In fact,the "secondary" oscillations in Fig. 10 are muchlarger than those observed in the records.
5. Concluding section
In the various ice age runs above, the ampli-tudes of the northern hemispheric ice sheet volumefluctuations are generally between 20% to 50% ofthe maximum glacial volume, corresponding tobetween ~4° and 10° in the latitude of itsequatorward tip. These fluctuations generally agreeboth in phase and amplitude with the secondaryoscillations of <518O deep-sea core records, at leastto within the small variations from record to recordand within the mixed effects of ice sheet volumeand ocean temperature in the <5UO signal (Emilianiand Shackleton, 1974).
The components of the model that are necessaryto produce this response are the explicit treatmentof ice sheet topography and snow budget, and theseasonal and latitudinal variations of temperature.In fact, given these features we cannot find anyreasonable parameter changes that do not giverealistic secondary oscillations (except for casesgiving an ice-sheet-free northern hemisphere).Using annual mean insolation in (1) reduces the iceage response by a factor of ~4, but eliminatingalbedo feedback has very little effect on the model'sresponse (see Fig. 7). However, albedo feedback ofthe ice sheets might still be important for fullglacial-interglacial cycles. These sensitivities arerelated to the ice sheet and ablation parameteri-zations, as discussed in connection with Fig. 7.
We have not been able to produce realisticglacial-interglacial cycles with the present model.Starting at small ice sheet size, the model canplausibly simulate the relatively slow ~80 Kyeargrowths to glacial maximum [for instance byadjusting the ice sheet precipitation parameteri-zation as in Fig. 8 (f)]; it is the drastic ~20 Kyear
retreats back to interglacials that the model lacks.The estimates of Laurentide ice sheet volumes inPaterson (1972) imply mean ice sheet budgetsaveraging -—50 g cm"2 yr"1 between 14 and 9Kyears BP. (Ice sheet retreat after this point wasprobably accelerated strongly due to being split bymarine waters of Hudson Bay at ~8 Kyears BP.)In our model ice age runs the mean northern icesheet budget varies only between ~ +20 and -20 gcm"2 yr"1, and this range is fairly independent ofmodel ice sheet details (for instance, the full icesheet retreat from 20 to 0 Kyears BP is achievedartificially in Fig. 10 by reducing the ice sheetvolume inertia, but the mean ice sheet budget in thisperiod is still —20 g cm"2 yr"1)- What can changein the ice sheet environment to produce mean.budgets of around —50 g crri"2 yr"1 between 14 and9 Kyears BP, and also produce generally positivebudgets for the same ice sheet sizes at times duringthe previous ~80 Kyears? (cf. Andrews, 1973).
It may be that the seasonal climate part of ourmodel is too simplified. Additional non-linearitiesdue to land-ocean longitudinal asymmetries,realistic atmospheric/oceanic dynamics and struc-ture, day—night cycles, cloudiness and pre-cipitation variations, etc., could possibly alter themodel response to the orbital changes to occasion-ally give net northern ice sheet budgets of —50 gcm-J yr-' (e.g., between 14 and 9 Kyears BP),without increasing the amplitude of the interveningsecondary oscillations of this paper. This possi-bility could perhaps best be tested by a higherpowered GCM, although Hartmann and Short(1979) and North and Coakley (1979) have shownhow longitudinal asymmetry can be includedefficiently in simple climate models. Also Cess andWronka (1979) suggest several new short-termfeedbacks that could make simple climate modelresponse more non-linear.
Alternatively, our seasonal climate model maybe basically correct, and there may be otherlong-term processes in the system (apart from icesheet volume inertia) with time scales of severalKyears or longer, as proposed by Eriksson (1968),Rooth et al. (1978) and others. These processescould result in the ice sheet budget depending notonly on the current ice sheet size but also on itspast sizes in the previous several Kyears, and socould distinguish between the positive and negative(—50 g cm"2 yr"1) budgets at the same ice sheetsize, as discussed above. Specific long-term pro-
Tellus32(1980),4 Tellus32(1980),4

316 D. POLLARD, A. P. INGERSOLL AND J. G. LOCKWOOD
cesses with this property include time-dependentlithospheric depression and/or non-plastic ice sheetflow (Emiliani and Geiss, 1957; Tanner, 1965),sudden jumps in the profiles of northern hemi-spheric and/or Antarctic ice sheets due to basalmelting or sea incursions (Hollin, 1962; Wilson,1964; Hughes, 1977; Thomas and Bentley, 1978),and deep ocean temperatures (Newell, 1974;Lemke, 1977; Saltzman, 1977). The inclusion oftwo or more long-term processes can produce freeinternal oscillations (e.g., Sergin, 1979), and it maybe that such an oscillation is important for thefull glacial-interglacial cycles.
Two other mechanisms related to the rapid icesheet retreats are a possible layer of ice sheetmeltwater covering a substantial part of the oceans(Adam, 1975; Berger et al., 1977; Emiliani et al.,1978), and extensive pro-glacial lakes causing
. calving at the feet of retreating ice sheets (Andrews,1973). Processes such as these are not reallylong-term but through them the amount of ablationin one year can influence the ice sheet budgets inseveral succeeding years. This could cause aclimatic flip-flop whereby once large ice sheets startto retreat, the oceanic meltwater layer and/orproglacial lakes increase and accelerate the retreatin succeeding years.
Before closing, we briefly discuss the relation-ship between Saltzman's (1977) approach and thepresent model. Saltzman shows that the dominantbalance in the long-term global energy equationmust be between three terms: global net radiationto or from space N, latent heat of fusion associatedwith the changing ice sheet mass F, and thermalenergy of the global (~deep) oceans W. Newell(1974) has described a specific ice age mechanisminvolving these three quantities, and Mason (1976)has emphasized the similarity in order of magnitudebetween ice age variations of F and the variation of
N (at mid and high latitudes) caused directly by tin.orbital perturbations. In our model we neglect Hand our standard method of solution also neglectF, so that N = 0 and global and annual meatenergy is exactly conserved in eq. (1). Therefore, al)long-term energy residuals (which are general!much smaller than the seasonal energy terms) artneglected in eq. (1), and the long-term changes areparameterized by other exploratory equations. Thmethod decreases the computer run-time consideably and has allowed a more extensive explorationof diagnostic snow and ice sheet parameterzations. However, during periods of rapid ice sheetretreat the average rate of release of ice sheet latentheat of fusion may be ~l/3 that of the insolationanomaly at mid and high latitudes due to the orbitalperturbations (Mason, 1976), and so F shouldperhaps be included in eq. (1). We did include F in(1) for one run over the last 100 Kyears and foundit caused very little difference in the response [anearly constant 2° lat. equatorward shift from thesolid curve in Fig. 3(b)l. This suggests that the"direct" effects of the orbital perturbations on theice sheet budget (via the seasonal climate) are muchlarger than any "adjustments" required to satisfythe long-term energy equation, at least for thesecondary oscillations.
Relatively simple models such as the present oneare suitable for experimenting with ice age runsincorporating the various mechanisms mentionedabove. The long-term energy residuals (N, F, andW above) • can be explicitly incorporated in themodel, but are not necessarily important for somemechanisms. If any mechanism is found that givesrealistic glacial-interglacial cycles, the individualcomponents and interactions could then be testedeconomically by higher powered GCMs (e.g.,Gates, 1976a,b) and ice sheet models (e.g., Jenssen,1977).
REFERENCES
Adam, D. P. 1975. Ice ages and the thermal equilibriumof the Earth, II. Quat. Res. 5,161-171.
Andrews, J. T. 1973. The Wisconsin Laurentide icesheet: dispersal centers, problems of rates of retreat,and climatic implications. Arctic and Alpine Res. 5,185-199.
Andrews, J. T. 1975. Glacial systems. North Scituate,Mass.: Duxbury Press, 191 pp.
Barry, R. G., Andrews, J. T. and Mahafly, M. A. 1975.Continental ice sheets: conditions for growth. Science790,979-981.
Beckinsale, R. P. 1973. Climatic change: a critique ofmodern theories. In Climate in review (ed. G.McBoyle). Boston: Houghton Mifflin, 132-151.
Berger, A. L. 1976. Obliquity and precession for the last5,000,000 years. Astron. andAstrophys. 51, 127-135.
Tellus 32 (1980), 4

:. LOCKWOOD
•d high latitudes) caused directly by the'rbations. In our model we neglect W,i.dard method of solution also neglects•V = 0 and global and annual meanictly conserved in eq. (1). Therefore, all'iergy residuals (which are generallyT than the seasonal energy terms) areeq. (1), and the long-term changes are
'd by other exploratory equations. This•eases the computer run-time consider-^ allowed a more extensive explorationic snow and ice sheet parameteri--•ever, during periods of rapid ice sheetverage rate of release of ice sheet latent
may be ~l/3 that of the insolation.nid and high latitudes due to the orbital;s (Mason, 1976), and so F shouldincluded in eq. (1). We did include F in•an over the last 100 Kyears and found•ry little difference in the response laant 2° lat. equatorward shift from thein Fig. 3(b)]. This suggests that the
:cts of the orbital perturbations on theget (via the seasonal climate) are muchmy "adjustments" required to satisfy-n energy equation, at least for thedilations.
; simple models such as the present onefor experimenting with ice age runs
2 the various mechanisms mentionedlong-term energy residuals (N, F, and;an be explicitly incorporated in thesre not necessarily important for some.. If any mechanism is found that gives:ial-interglacial cycles, the individualand interactions could then be tested
v by higher powered GCMs (e.g.,:.b) and ice sheet models (e.g., Jenssen,
Andrews, J. T. and Mahaffy, M. A. 1975.ice sheets: conditions for growth. Science
.1.P. 1973. Climatic change: a critique of
ones. In Climate in review (ed. G.iston: Houghton Mifflin, 132-151.
976. Obliquity and precession for the lastars. Astron. and Astrophys. 51, 127-135.
Tellus 32 (1980), 4
RESPONSE OF MODEL TO ORBITAL PERTURBATIONS DURING QUATERNARY ICE AGES 317
Berger, A. L. 1978. Long-term variations of caloricinsolation resulting from the Earth's orbital elements.Quat.Res.9, 139-167.
Berger, W. H., Johnson, R. F. and Killingley, J. S. 1977.'Unmixing' of the deep-sea record and the deglacialmeltwater spike. Nature 269,661-663.
Birchfield, G. E. 1977. A study of the stability of a modelcontinental ice sheet subject to periodic variations inheat input. J. Geophys. Res. 82,4909-4913.
Birchfield, G. E. and Weertman, J. 1978. A note on thespectral response of a model continental ice sheet. J.Geophys. Res. 83,4123-4125.
Broecker, W. S. and Van Donk, J. 1970. Insolationchanges, ice volumes and the O" record in deep-seacores. Rev. Geophys. and Space Phys. 8, 169-198.
Budyko, M. I. and Vasishcheva, M. A. 1971. Effect ofastronomical factors on Quaternary glaciations (inRussian). Meteorologija i Gidrologija 6. 37-47.
Calder, N. 1974. Arithmetic of ice ages. Nature 252,216-218.
Cess, R. D. and Wronka, J. C. 1979. Ice ages and theMilankovitch theory: a study of interactive climatefeedback mechanisms. Tellus 31, 185-192.
Chorlton, J. C. and Lister, H. 1968. Snow accumulationover Antarctica. IA.S.H. 86, 254-263.
CL1MAP Project Members. 1976, The surface of theice-age Earth. Science 191, 1131-1137.
Coakley, Jr., J. A. 1979. A study of climate sensitivityusing a simple energy balance model. J. Atmos. Sci.36, 260-269.
Cogley, J. G. 1979. Albedo constrast and glaciation dueto continental drift. Nature 279, 712-713.
Dickson, R. R. and Posey, J. 1967. Maps of snow-coverprobability for the northern hemisphere. Man. Weath.Rev. 95, 347-353.
Emiliani, C. 1978. The cause of the ice ages. Earth andPlanet. Sci. Lett. 37, 349-354.
Emiliani, C. and Geiss, J. 1957. On glaciations and theircauses. Geologische Rundschau 46, 576-601.
Emiliani, C., Rooth, C. and Stipp, J. J. 1978. The lateWisconsin flood into the Gulf of Mexico. Earth andPlanet. Sci. Lett. 41, 159-162.
Emiliani, C. and Shackleton, N. J. 1974. The Brunhesepoch: isotopic paJeo-temperatures and geo-chronology. Science 'S3, 511-514.
Eriksson, E. 1968. Air-ocean-icecap interactions inrelation to climatic fluctuations and glaciation cycles.Met. Monog. 8,68-92.
Evans, D. L. and Freeland, H. J. 1977. Variations in theEarth's orbit: pacemaker of the ice ages? Science 198,528-530.
Flint, R. F. 1971. Glacial and Quaternary geology. NewYork:J. Wiley, 892pp.
Gates, W. L. 1976a. Modeling the ice-age climate.Science 191, 1138-1144.
Gates, W. L. 1976b. The numerical simulation of ice-age-climate with a global general circulation model. J.Atmos. Sci. 33, 1844-1873.
Hantel, M. 1972. Polar boundary conditions in zonally
Tellus 32 (1980), 4
averaged global climate models. /. Appl. Meteor. 13,752-759.
Hartjenstein, G. and Efger, J. 1979. Linear para-meterization of large-scale eddy transports. Tellus 31,89-101.
Hartmann, D. L. and Short, D. A. 1979. On the role ofzonal asymmetries in climate change. J. Atmos. Sci..J<5, 519-528.
Hasselmann, K. 1976. Stochastic climate models. Part 1.Theory. Tetlus 28,413-485.
Hays, J. D., Imbrie, J. and Shackleton, N. J. 1976.Variations in the Earth's orbit: pacemaker of the iceages. Science 194,1121-1132.
Henderson-Sellers, A. and Meadows, A. J. 1979. Thezonal and global albedos of the Earth. Tellus 31,170-173.
Hollin, J. T. 1962. On the glacial history of Antarctica. /.Glaciol. 4, 173-195.
Hughes, T. 1977. West Antarctic ice streams. Rev.Geoph. and Space Phys. 15, 1-46.
Hunkins, K., Be, A. W. H., Opdyke, N. D. and Mathieu,G. 1971. The late Cenozoic history of the ArcticOcean. In Late Cenozoic glacial ages (ed. K. K.Turekian). New Haven, Conn.: Yale Univ. Press,215-238.
Imbrie, J. and Imbrie, K. P. 1979. Ice ages: solving themystery. Short Hills, New Jersey: Enslow Publ., 224pp.
Imbrie, J. and Imbrie, J. Z. 1980. Modelling the climaticresponse to orbital variations. Science, 207, 943-953.
Jenssen, D. 1977. A three-dimensional polar ice-sheetmodel./. Glaciol. 18, 373-389.
Kominz, M. A. and Pisias, N. G. 1979. Pleistoceneclimate: deterministic or stochastic? Science 204,171-172.
Ku, T. and Broecker, W. S. 1967. Rates of sedimentationin the Arctic Ocean, Prog. Oceanogr. 4, 95-104.
Kukla, G. J. 1975. Missing link between Milankovitchand climate. Nature 253, 600-603.
Lemke, P. 1977. Stochastic climate models, part 3.Application to zonally averaged energy models. Tellus29,385-392.
Lian, M. S. and Cess, R. D. 1977. Energy balanceclimate models: a reappraisal of ice-albedo feedback./. Atmos. Sci. 34, 1058-1062.
Loewe, F. 1971. Considerations on the origin of theQuaternary icesheet of North America. Arctic andAlpine Res. 3, 331-344.
Lorenz, E. N. 1970. Climatic change as a mathematicalproblem. / Appl. Meteor. 9,325-329.
Lorenz, E. N. 1979. Forced and free variations ofweather and climate. /. Atmos. Sci. 36, 1367-1376.
Mason, B. J. 1976. Towards the understanding andprediction of climatic variations. Quart. J. Roy. Met.Soc. 102,413-498.
Meier, M. F. 1960. Distribution and variations of glaciersin the United States exclusive of Alaska. Id.S.H. 54,420-429.

318 D. POLLARD, A. P. INGERSOLL AND J. G. LOCKWOOD
Milankovitch, M. 1941. Canon of insolation and the iceage problem. Belgrade: Royal Serbian Academy,Special Publication 133, 482 pp. Translated by IsraelProgram for Scientific Translation, Jerusalem, 1969.
Mock, S. J. 1967. Calculated patterns of accumulationon the Greenland ice sheet. J. Glacial 6, 795-803.
Newell, R. E. 1974. Changes in the poleward energy fluxby the atmosphere and ocean as a possible cause forice-ages. Quat. Res. 4, 117-127.
North, G. R. 1975. Theory of energy-balance climatemodels. /. Atmos. Sci. 32, 2033-2043.
North, G. R. and Coakley, Jr., J. A. 1979. Differencesbetween seasonal and mean annual energy balancemodel calculations of climate and climate sensitivity.J. Atmos. Sci. 36,1189-1204.
Paschinger, V. 1912. Die schneegrenze in verschiedenenklimaten. Peterm. Georg. MittErganz. 37,93 pp.
Paterson, W. S. B. 1969. The physics of glaciers.Oxford: Pergamon Press, 250pp.
Paterson. W. S. B. 1972. Laurentide icesheet: estimatedvolumes during late Wisconsin. Rev. Geophys. andSpace Phys. JO, 885-917.
Pollard, D. 1978. An investigation of the astronomicaltheory of the ice ages using a simple climate-icesheetmodel. Nature 272, 233-235.
Pollard, D. 1980. A simple parameterization for ice sheetablation rate. Tellus 32, 384-388.
Rooth, C. G. H., Emiliani, C. and Poor, H. W. 1978.Climate response to astronomical forcing. Earth andPlanet. Sci. Lett. 41, 387-394.
Ruddiman, W. F. and Mclntyre, A. 1979. Warmth of thesubpolar north Atlantic Ocean during northern hemi-spheric ice-sheet growth. Science204, 173-175.
Saltzman, B. 1977. Global mass and energy require-ments for glacial oscillations and their implications formean ocean temperature oscillations. Tellus 29,205-212.
Saltzman, B. and Vernekar, A. D. 1971. Note on theeffect of Earth orbital radiation variations on climate.J. Geophys. Res. 76,4195-4197.
Saltzman, B. and Vernekar, A. D. 1975. A solution forthe northern hemispheric climatic zonation during aglacial maximum. Quat. Res. S, 307-320.
Schneider, S. H. and Thompson, S. L. 1977. A surfacetemperature parameterization for zonal precipitation.£0558,1144.
Schneider, S. H. and Thompson, S. L. 1979. Ice ages andorbital variations: some simple theory and modeling.Quat. Res. 12, 188-203.
Schuster, R. L. 1954. Project Mint Julep, part III. U.S.Army Snow Ice and Permafrost Res. Est. Rep. 19, 10pp.
Schutz, C. and Gates, W. L. 1971 to 1974. Globalclimatic data R-915 (1971), R-915/1 (1972), R-1029(1972), R-915/2 (1973), R-1317 (1973), R-1029/1(1974), R-1425 (1974). A.R.P.A., Rand Corp., SantaMonica, Calif.
Sergin, V. Ya. 1979. Numerical modeling of theglaciers-ocean-atmosphere global system. /. Geo-phys.Res.84, 3191-3204.
Shackleton, N. J., 1969. The last interglacial in themarine and terrestrial records. Proc. Roy. Soc.London Ser.B.I74, 135-154.
Shaw, D. M. and Donn, W. L. 1968. Milankovitchradiation variations: a quantitative evaluation. Science162, 1270-1272.
Suarez, M. 1976. An evaluation of the astronomicaltheory of the ice ages. Ph.D. Thesis, Princeton Univ.,108 pp.
Suarez, M. J. and Held, I. M. 1976. Modelling climaticresponse to orbital parameter variations. Nature, 263,46-47.
Suarez, M. J. and Held, I. M. 1979. The sensitivity of anenergy balance climate model to variations in theorbital parameters. /. Geophys. Res. 84,4825-4836.
Sugden, D. E. and John, B. S. 1976. Glaciers andLandscape. New York: J. Wiley, 376 pp.
Tanner, W. F. 1965. Cause and development of an iceage. J. Geol. 73,413-430.
Thomas, R. H. and Bentley, C. R. 1978. A mode! forHolocene retreat of the West Antarctic ice sheet.Quat. Res. 10, 150-170.
Thompson, S. L. and Schneider, S. H. 1979. A seas-onal zonal energy balance climate model with aninteractive lower layer. J. Geophys. Res. 84, 2401-2414.
Van Loon, H. 1979. The association between latitudinaltemperature gradient and eddy transport. Part 1:Transport of sensible heat in winter. Man. Weath.Rev. 107, 525-534.
van Woerkom, A. J. J. 1953. The astronomical theory ofclimate changes. In Climatic change—evidence,causes and effects (ed. H. Shapley). Cambridge,Mass.: Harvard Univ. Press, 147-157.
Vernekar, A. D. 1972. Long-period global variations ofincoming solar radiation. Met. Monog. 12, 1-20.
Warren, S. G. and Schneider, S. H. 1979. Seasonalsimulation as a test for uncertainties in the para-meterizations of a Budyko-Sellers climate model. J.Atmos. Sci. 36, 1377-1391.
Weertman, J. 1961. Stability of ice-age icesheets. J.Geophys. Res. 66, 3783-3792.
Weertman, J. 1964. Rate of growth or shrinkage ofnonequilibrium icesheets. J. Glacial. 5, 145-158.
Weertman, J. 1976. Milankovitch solar radiation varia-tions and ice age ice sheet sizes. Nature 261, 17-20.
White, G. H. 1976. Climatic feedbacks calculated fromsatellite observations. G.F.D. Summer Study Pro-gram, Woods Hole Oceanog. Inst., 168-190.
Williams, J. H. 1974. Simulation of the atmosphericcirculation using the NCAR global circulation modelwith present day and glacial period boundary con- ;ditions. Ph.D. Thesis, Univ. of Colorado, Boulder, 328 :PP- [
Tellus 32 (1980), 4

J. G. LOCK.WOOD
V. Ya. 1979. Numerical modeling of the-s-ocean-atmosphere global system. J. Geo-tes. 84, 3191-3204.in, N. J., 1969. The last interglacial in the- and terrestrial records. Proc. Roy. Soc.nSer.B. 174,135-154.
\ M. and Donn, W. L. 1968. Milankovitchon variations: a quantitative evaluation. ScienceHO-1272.M. 1976. An evaluation of the astronomicalof the ice ages. Ph.D. Thesis, Princeton Univ.,
-i.M. J. and Held, I. M. 1976. Modelling climaticise to orbital parameter variations. Nature, 263,
M. ). and Held, I. M. 1979. The sensitivity of anbalance climate model to variations in the
• parameters. /. Geophys. Res. 84,4825-4836.O. E. and John, B. S. 1976. Glaciers and'•ape. New York: J. Wiley, 376 pp..V. F. 1965. Cause and development of an iceGeo/. 7^,413^*30.R. H. and Bentley, C. R. 1978. A model for•ne retreat of the West Antarctic ice sheet.les.10, 150-170.n, S. L. and Schneider, S. H. 1979. A seas-mal energy balance climate model with anive lower layer. J. Geophys. Res. 84, 2401-
. H. 1979. The association between latitudinaliture gradient and eddy transport. Part 1:ort of sensible heat in winter. Man. Weath.
r.7,525-534.TKom, A. J. J. 1953. The astronomical theory of: changes. In Climatic change—evidence,
and effects (ed. H. Shapley). Cambridge,harvard Univ. Press, 147-157.A. D. 1972. Long-period global variations of
:.g solar radiation. Met. Monog. 12, 1-20.-;. G. and Schneider, S. H. 1979. Seasonalion as a test for uncertainties in the para-•.ations of a Budyko-Sellers climate model. /.Sci.36, 1377-1391.
J. 1961. Stability of ice-age icesheets. J.s. Res. 66, 3783-3792.
J. 1964. Rate of growth or shrinkage of.librium icesheets./. Glacial. 5, 145-158.i, J. 1976. Milankovitch solar radiation varia-J ice age ice sheet sizes. Nature 261, 17-20.H. 1976. Climatic feedbacks calculated fromobservations. G.F.D. Summer Study Pro-oods Hole Oceanog. Inst., 168-190.J. H. 1974. Simulation of the atmosphericon using the NCAR global circulation modelesent day and glacial period boundary con-Ph.D. Thesis, Univ. of Colorado, Boulder, 328
Tellus 32 (1980), 4
RESPONSE OF MODEL TO ORBITAL PERTURBATIONS DURING QUATERNARY ICE AGES 319
Williams, L. D. 1978. Ice-sheet initiation and climaticinfluences of expanded snow cover in Arctic Canada.Quart. Res. 10, 141-149.
Wilson, A. T. 1964. Origin of ice ages: an ice shelf theoryfor Pleistocene glaciation. Nature 201, 147-149.
Yapp, C. J. and Epstein, S. 1977. Climatic implicationsof D/H ratios of meteoric water over North America(9500-22,000 B.P.) as inferred from ancient woodcellulose C-H hydrogen. Earth and Planet. Sci. Lett.34,333-350.
PEAKUM-H 3OHAJIbHOft KJIHMATHHECKOM MOAEJ1H C JIEflHHKOBblMHHA OPEMTAJIbHblE BOaMVIUEHMfl B TE4EHME HETBEPTMHHblX JlEAHMKOBblX
nEPMOflOB
IlpH nOMOIUH npOCTOa KJIHMaTHMeCKOfi MOflBJlH,»BHO ormcbiBaiOLuefi jieflHHKOBbie uiHTbi, HccneflyercsacTpOHOMmecKafl reopHfl jieflHHKOBwx nepnoflos.OflHoypoaeHHaa 3OHam>HO ocpenneHHafl cesoHHaa3Hepro6ajiaHCOBaa MoaeJib peuiaercfl HHCJICHHO conpeaeJieHHeM reMnepaTypw Ha yposHe Mopa KaK4>yHKUHH UIHPOTW H Mecflua (noAo6HO Hopcy, 1975).CneroBoft nOKpos, MCHSHDIUHMCH c CCSOHOM (HTOBJiH»eT na rnianeTapHoe anb6e«o) BK/IKDHBH flHarno-CTHMCCKH nyreM npocjwx napaMerpHaauHfi eKCMe-COHHUX BbinaaeHHfl H TasnmR cnera. IIojiHbierofloBwe HaKoruieHHH H a6^«una na noBepxHoc™jieflHMKOBwx UIHTOB na xaacflofi iimpoTe BbiHHCJWwTCflc TCMH Mce napaMerpHsauHflMH, HTO H fljifl cnera(c TeMnepaiypoM, yHHTbiBawmeft swcoTy mHTa npH
paflHCHie —6,5°C KM~'). POCCMOT-JieflHHKOBMx mHTOB cjienycT Y
(1976), roe TeneHHe Jibfla annpoKCHMnpyercareneHHe imeanbHO njiacTHHHOfi acHflxocrH, HTOorpaHHHHBaeT npo<})HJib iHHia napaSojiofl. JleaaHOflIUHT ceaepHoro nojrymapHH npocTHpaeTCH K 3KBaropyOT 75°c.m. (MTO cooTseTCTByer oeperosofl HHHHHCesepHoro jieflOBHToro oxeana).
MoaejibHwe KpHBbie fljia noc^eflHHx 100 Twc.JierpaccHHTaHu BbiHHCJieHHHMH roAHHHOH «norojibi»,KaK oniicaHo Bbiuie, AJIH Kawflbix 2 rwc.^eT c HHCO-jisuHefl, B3»Toii c ynetOM pea^bHbix BOSMymeHHilnapaMerpOB seMHoii op6HTw. MsMeHeHHfl B pasMepax
mnra ana KaKfloro uiara B 2 rwc.JieTOT e*eroflHoro 6ajiaHca CHera,
npOHHierpHpOBaHHoro no acefl nosepxHOCTH mHTa.B aim pacHCTax K»KHafl rpaHHua ^eaaHoro IUHTBcesepHoro nojiymapH« KOJie6jieTC« B npeaeJiax 7°UIHpOTW, HTO npaBHJTbHO MOflC/lMpyeT ({)a3bl HnpH6jiH3HTejibHwe avmiiHTyflbi BbicoKoyacroTHbixKOMnoHeHT (43 H 22 Twc.^er) aaHHbix rjiy6oKO-BOflHblX OCaaKOB (X3fiC H flp., 1976). OAH3KO MOflCJlbHecnoco6na BOcnpOHsaecTH ocHOBHwe JieflHHKOBbieUHKJlbl (OT 100 flO 120 TblC.^CT) 3THX flaHHWX.OnHCaua HyBCTBHTCJlbHOCTb MOflC^bHblX paCHCTOBK HSMCHeHHSM pa3jlHHHbIX 66 napaMBTpOB, HO HH
OflHO H3 3THX H3M6H6HHH H6 yJiyimaeT CyiUeCTBCHHOCXOflHMOCTH paCH6THb!X KpHBblX K ynOMHHyTWMaaHHbiM. B 3aKJiK)H6HHe MW o6cy»cflaeM rnnbiM6XaHH3MOB, KOTOpblB MOFJ1H 6blCKH6 JieflHHKOBbie UHKJlbl.
Tellus 32 (1980), 4

Tellus (1980) 32. 384-388
SHORT C O N T R I B U T I O N
A simple parameterization for ice sheet ablation rate1
By DAVID POLLARD, Division of Geological and Planetary Sciences, California Institute ofTechnology, Pasadena, California 91125, U.SA.
(Manuscript received January 8, 1980)
ABSTRACT
A parameterization of monthly mean ice sheet ablation as a function only of surface airtemperature and insolation is examined. By considering differences in summer climate betweenthe present and the last ice age, it is suggested that the parameterization adequately describeslong-term changes in ablation. Although significant discrepancies are found between theparameterization and the seasonal variation of ablation observed on present-day glaciers, theseasonal ablation cycle is still predicted accurately enough to maintain the validity of theparameterization for long-term net annual variations.
1. IntroductionSeveral recent models of northern hemispheric
ice sheet fluctuations during the last ^106 yearshave used relatively simple parameterizations ofablation on the ice sheet surfaces (Weertman,1976: Sergin. 1979; Pollard et a!., 1980). Theprocess of ablation is an important part of theclimatic control over the size of present-dayglaciers, and ablation variations in the past couldhave been important in controlling the past icesheet fluctuations. Ablation is used here to mean"the reduction in mass of a vertical ice sheetcolumn due to the removal of H2O out of thecolumn by surface processes"; calving into oceansis excluded. In practice ablation mostly involvesmelting and subsequent runoff in surface or basalstreams during summer, but can also involveevaporation or wind-drifting. The full process iscomplex and is described in Paterson (1969, Ch. 4)and Sugden and John (1976, Ch. 14).
In Pollard et al. (1980) the monthly meanablation, A, at any point on the ice sheet surface isparameterized in the formA = max|0;a7* + bQ + c\ (1)
where T is the monthly mean surface air temper-ature (corrected for ice sheet elevation above
1 Contribution number 3374 of the Division ofGeological and Planetary Sciences, California Instituteof Technology, Pasadena, California 91125, U.S.A.
sea-level using a constant atmospheric lapse rate),Q is the monthly mean insolation at the top of theatmosphere, and a, b, and c are constants. Fornon-zero A, (1) is basically a linearized energy-balance equation for a melting surface with no heatcapacity; somewhat more complex parameteri-zations involving more climatic variables were firstdeveloped in the glaciological literature (e.g.,Sverdrup, 1935). Of course more sophisticatedsnowmelt models are in current use, and a few haverecently been applied to paleoglaciologicalproblems (e.g. Williams, 1979).
This note examines the adequacy of such asimple parameterization as (1) for ice age models.In Section 2 past ablation variations for a givenmonth (July) are considered, and found to beadequately describable in terms of T alone.However ablation typically has a large non-linearseasonal variation and is negligible in winter,making it important to "choose" the right monthsof the year to compare with past eras, i.e., tocorrectly predict the beginning and end of the mainablation season. In Section 3 some discrepanciesare found between present-day seasonal obser-vations and a parameterization of the same type as(1), but the scatter is only equivalent to a relativelysmall error (~±1 month) in the phase of theseasonal ablation cycle. The purpose of including Qin (1) and the numerical values for a, b and c arediscussed in Section 4.
0040-2826/80/040384-05502.50/0 © 1980 Munksgaard. Copenhagen Tellus 32 (1980), 4

A SIMPLE PARAMETERIZATION FOR ICE SHEET ABLATION RATE 385
1
2. Variations in past eras
Ablation depends not only on surface airtemperature and insolation but also on cloud cover,wind speed, relative humidity and on physicalproperties of the surface itself. Each of theseparameters has probably varied systematically oversynoptic scales in past eras and so could potentiallybe important for ice age ablation parameteri-zations. One approach of estimating the relativeimportance of the meteorological parameters (cfCoakley, 1977) is shown in Table 1. The A/7 valuesin column 2 represent differences in the parameterp between the present July and July 18 Kyear BPon continents around ~50°N, estimated from theGCM results of Gates (1976). These summervalues are the most relevant to the net annualablation, since by far the most ablation occurs inthe summer months. The values of the partialderivatives SA/dp in column 3 are estimated fromthe theoretical "free ablation" graphs of Kraus(1975), and represent the regions of these graphs inwhich the bulk of ablation occurs on real glaciers(i.e., by melting with air temperature ^0°C); thesevalues are consistent with earlier semi-empiricalablation formulae (e.g., Sverdrup, 1935). They arecalculated for a standard glacier surface (withalbedo 0.5) in "steady-state" ablation, i.e., with nosensible heat storages and with all ablated waterremoved immediately. [The partial derivatives for T
and Q correspond to a and b in (1), and their valuesare considered further in Sections 3 and 4.]
The magnitudes of the products in column 4indicate that by far the largest ablation ratechanges of past eras have been caused by thechanges in surface air temperature, T. This sug-gests that a parameterization in terms of T alonewould be adequate for an ice age model; (actuallythe next most important variable, surface windspeed, could not realistically be predicted in simpleone-layer climate models).
It should be noted that the Ap values in Table 1are averages over many days, but the steady-statepartial derivatives take no account of the pro-nounced non-linear daily cycles involved in realablation situations. However in situations wheremelting is occurring for a significant fraction / ofeach day, one would expect that the inclusion ofthese day-night effects would reduce the productsin column 4 by factors of between ~-fand -1, andwould not seriously affect their relative magnitudes.
Table 1 also neglects any systematic changes inproperties of the ice sheets themselves. For instancesub-zero internal temperatures can cause melt-water to refreeze elsewhere in the ice sheet and notrun off; the winter cold-wave of seasonal heat innear-surface layers can significantly inhibit ablation(Muller, 1963). There is little or no direct evidenceof such systematic changes as ice sheet size variedin the past, but these properties do vary widely on
Table 1. Effect of past variations A/> of summer climate on ablation rate A
Parameter p
Surface air temperature, 7(°C)Insolation, Q (W m"2)Total cloudiness (area! fraction)
Surface wind speed (m s"1)Relative humidity (%)
Ap (ice age Julyminus present July)
-10±15*+0.2
+ 2+ 10 (at 800 mb level)
dA/8p in (g cm"2 month"1
per units of col. 1)
15(0.8) x (0.4) = 0.3 2tEffect of sunlight absorbed:(0.8) x (-70) = -56fEffect of net IR:(-0.8) x (-80) = 64$151
Ap (8 A /dp) in(g cm"2 month"1)
-150±5
-11
+ 13+30+ 10
* Representative not of July 18 Kyears BP but of the general magnitude of past variations in mean summerinsolation at ~50° N due to the orbital perturbations (e.g., Vernekar, 1972).
t Factor of (0.8) represents ablation per sunlight absorbed by the glacier surface (Kraus, 1975); factors of (0.4) and(—70) represent changes in sunlight absorbed per change in the relevant parameter p as computed by Schneider andDickinson (1976, table 1) allowing for multiple reflections between cloud deck and surface.
t Factor of (-0.8) represents ablation per net infrared radiation lost by the glacier surface to the atmosphere(Kraus, 1975); factor of (-80) represents an average sensitivity of this infrared loss to various types of cloud cover asdetermined by glacial field measurements (Wallen, 1948; Lister and Taylor, 1961).
Te«us32(1980),4

386 D. POLLARD
present glaciers and ice caps (Paterson, 1969, Ch.2). Such properties can be predicted only byrelatively complex ice sheet models, and areeffectively assumed constant in most simple ice agesimulations.
3. Present-day observations
In this century considerable glaciologica) field-work has been devoted to relating the ablation onglaciers and ice caps to the local meteorologicalconditions (e.g., Paterson, 1969, Ch. 4). Schytt(1967) and Loewe (1971) among others havecompiled sets of present-day glacial data andplotted ablation rate, A, against surface air temper-ature, T, averaged through most or all of theablation season, i.e., ~May to ~September. (In-significant ablation occurs in winter months outsideof the ablation season.) For interannual variationson individual glaciers, the relationship is good andshows 8AI8T ~10 (g cm-2 month-') per (°C);however there is considerable scatter betweenglaciers in different types of climates (e.g., con-tinental versus maritime), and also betweenmeasurements averaged only over a few weeks orless on the same glacier. Much of this scatter in therelationship between A and T is probably due toseasonal and latitudinal variations of insolation andalso due to variations in surface albedo, which canchange seasonally from ~0.8 (fresh snow) to ~0.5(melting ice) (e.g., Wallen, 1948). These variationswould correspond to ablation rate variations of~ 100 g cm"2 month "' in column 4 of Table 1.
In Fig. 1 we have attempted to improve theablation parameterization by adding a secondvariable "net radiation absorbed", R, whichprimarily contains the effects of insolation, surfacealbedo and also cloudiness. As far as an accuraterepresentation of this data is concerned, the resultshown is basically negative; the considerablescatter in the relationship between A and T hasbeen reduced only slightly if at all by the additionof the second variable R. The scatter in the figuremust be due to some combination of observationalerror, seasonal and interglacial variability of icebody properties such as seasonal heat storage andrefreezing, and also due to the exaggerated point-to-point variability of surface wind speed andrelative humidity for measurements averaged only
E 100
.9 4°orr
2°a>
79
"53 »77
\IOO
• 23 ^
\DO \
\N50\\
-2 C 2 * c = • <!
Surfoce Air Temperature (°C)
Fig. /. Measurements of present-day ablation vs surfaceair temperature, 7", and net solar and infrared radiationabsorbed, R. Values adjacent to each point are ablationrates. A, in g cm"2 month"1. The measurements areaveraged over a whole number of days during theablation season. The figure contains all the data we foundwhere simultaneous determinations of daily mean A, T,and R were published. The general level of observationalerror for each variable (not often reported) may be< 10% of the total range in the figure. The sources for thevarious points in the figure are: • Karsa Glacier(Wallen, 1948); + Hoffells. Glacier (Ahlmann andThorarinsson, 1938); * Isaschen. Ice Cap (Sverdrup,1935); A Sveanor Snowfield (Sverdrup, 1935); vBritannia Glacier (Lister and Taylor, 1961); x BarnesIce Cap (Ward and Orvig, 1953): D Kessel. Snowfield(Ambach and Hoinkes, 1963). The dashed lines ofconstant ablation rate show a "fit" that corresponds tothe parameterization in the text.
over a few days. Unfortunately even if these effectswere resolvable from the available data, a realistictreatment of these variables (and also of season-ally varying surface albedo contained in thevariable R) is beyond the scope of most simple iceage models.
The level of scatter from the linear fit in Fig. 1 is<±50 g cm"2 month"'. This is equivalent to~±5°C in air temperature, which is much lessthan the full seasonal variation at any one locationand is comparable to the change through onemonth in spring or autumn. Therefore the begin-ning and end of the main ablation season could be
Tellus32(1980).4

A SIMPLE PARAMETERIZATION FOR ICE SHEET ABLATION RATE 387
-, \ «IOI
• Temperature (°c)
Tesent-day ablation vs surface>et solar and infrared radiation"em to each point are ablation•itn . The measurements arenumber of days during thecontains all the data we foundunations of daily mean A, T,general level of observational
not often reported) may be:he figure. The sources for the?ure are: . Karsa Glacier-Us. Glacier (Ahlmann andJschen. Ice Cap (Sverdrup,field (Sverdrup, 1935). v
id Tayior( 1961); x Barnes1953): D Kessd Snowfie|d
.; P6 dashed Unes ofa "fit" that corresponds to
-xt.
ately even if these effectsavailable data, a realistic'es (and also of season->edo contained in thecope of most simple ice
the linear fit in Fig. l is
This is equivalent toe, which is much lession at any one location
change through oneTherefore the begin-
'lation season could be
Tellus32(l980). 4
predicted to within ~1 month by a parameteri-zation in terms of T alone, with a non-linear cutoffbelow F;S—5 °C to represent negligible ablation inwinter.
4. Parameterization
Although the radiative variable R has noteliminated the scatter in Fig. 1, it still seemspreferable to include the seasonal variation of Q inan ablation parameterization for the followingreason: with all other variables held constant, thefull winter-summer variation of Q would certainlyafiect ablation as much as a variation in T of~10°C, and so the inclusion of Q should slightlyimprove the predicted phase of the seasonal cycle.
Numerical values for (1) are chosen below, butone should note that these values are constrainedonly within wide limits by the data in this paper,and the main point is the basic form of (1). As inTable 1, we estimate 8A/8Q ~0.3 (g crrr2
month"1) per (W m~2). (This steady-statederivative should be affected only slightly byday-night effects since the daily cycle of insolationis roughly correlated with that of ablation.) Usingthe value of 8A/8T from present-day interannualvariations (Section 3), this yields the followingequation for monthly mean quantities:
A (g cm-2 month-') x max[0; 107 (°C)
+ 0.3<2(Wm-2)-50] (2)
We have estimated the constant "50" in (2) bycomparison with the data in Fig. 1, using R (Wirr2) = OAQ - 80. [The factor 0.4 allows formultiple reflections off a ~0.3 cloud cover(Schneider and Dickinson, 1976), and 80 W m~2
represents net infrared loss from a melting surfacewith this cloud cover (Lister and Taylor, 1961).]The corresponding linear fit is shown in the figure.This constant "50" in (2) is also consistent with thegeneral observation that significant ablation occursonly where the monthly mean temperature risesmuch above —7°C in summer (e.g., Orvig, 1954;Bull and Carnein, 1968). The non-linear cutoff in(2), basically due to the transition from melting toevaporation, corresponds to the non-linear temper-ature dependence (roughly T2 to T3) suggested byAhlmann (1948).
In summary, one should expect significantdiscrepancies between eq. (2) and present observedseasonal cycles of ablation. Much of this dis-crepancy could be due to seasonal variations ofsurface albedo, but Fig. 1 shows that other factors(e.g., seasonal heat storage) are significant. How-ever, any such seasonal discrepancy should not beserious for the ice age problem as long as thesummer months during which most ablation occursare predicted reasonably well. This is becauseTable 1 shows that for'these months the pastvariations of ablation rate have been controlled bypast variations of surface air temperature, con-sistent with eq. (2).
REFERENCES
Ahlmann, H. W. 1948. Glaciological research on theNorth Atlantic coasts. Roy. Geog. Soc., London. Res.Ser. 1, 83pp.
Ahlmann, H. W. and Thorarinsson, S. 1938. Vatnajokullscientific results of the Swedish Icelandic investi-gations 1936-37-38. Ch. V. Geogr. Annal. 20,171-233.
Ambach, W. and Hoinkes, M. 1963. The heat balance ofan alpine snowfield. IA.S.H. 61, 24-36.
Bull, C. and Carnein, C. R. 1968. The mass balance of acold glacier: Meserve glacier, south Victoria Land,Antarctica. IA.S.H. 86, 429-446.
Coakley, Jr., J. A. 1977. Feedbacks in vertical-columnenergy balance models. J.Atmos. Sci. 34,465-470.
Gates, W. L. 1976. The numerical simulation of ice-ageclimate with a global general circulation model. J.Aimos.Sci.33, 1844-1873.
Kraus, H. 1975. An energy balance model for ablation inmountainous areas. IA.S.H. 104, 74-82.
Tellus32(1980), 4
Lister, H. and Taylor, P. F. 1961. Heat balance andablation of an Arctic glacier. Meddel. om Gronland158, 1-54.
Loewe, F. 1971. Considerations on the origin of theQuaternary icesheet of North America. Arctic andAlpine Res. 3,331-344.
Muller, F. 1963. Englacial temperature measurements onAxel Heiberg Island, Canadian Arctic Archipelago.1A.S.H. 61, 168-180.
Orvig, S. 1954. Glacial-meteorological observations onicecaps in Baffin Island. Geogr. Annal. 36, 193-318.
Paterson, W. S. B. 1969. The physics of glaciers. Oxford:Pergamon Press, 250 pp.
Pollard, D., Ingersoll, A. P. and Lockwood, J. G. 1980.Response of a zonal climate-ice sheet model to theorbital perturbations during the Quaternary ice ages.Tellus 52,301-319.
Schneider, S. H. and Dickinson, R. E. 1976. Para-meterization of fractional cloud amounts in climate
388 D. POLLARD
models: the importance of modeling multiple reflec-tions. /. Appl. Mel. 15, 1050-1056.
Schytt, V. 1967. A study of "ablation gradient". Geogr.Annal. 49A, 327-332.
Sergin, V. Ya. 1979. Numerical modeling of theglaciers-ocean-atmosphere global system. J. Geo-phys. Res. 84, 3191-1204.
Sugden, D. E. and John, B. S. 1976. Glaciers andlandscape. New York: J. Wiley, 376 pp.
Sverdrup, H. U. 1935. Scientific results of the Norwe-gian-Swedish Spitsbergen expedition in 1934. Part IV.Geogr. Annal. J7, 145-166.
Vernekar, A. D. 1972. Long-period global variations ofincoming solar radiation. Met. Monog. 12, 1-20.
Wallen, C. C. 1948. Glacial-meterological investigationson the Karsa glacier in Swedish Lapland. Geogr.Annal. 30,451-672.
Ward, W. H. and Orvig, S. 1953. The glaciologicalstudies of the Baffin Island expedition, 1950. Part IV.J. Glacial. 2, 158-168.
Weertman, I. 1976. Milankovitch solar radiationvariations and ice age ice sheet sizes. Nature 261,17-20.
Williams, L. D. 1979. An energy balance model ofpotential glacierization of northern Canada. Arcticand Alpine Res. 11,443-456.
i
Tellus32(1980),4

Reprinted from Preprint Volume: Fifth Conferencton Atmospheric Radiation. October 31-4 November1983, Baltimore. Maryland. Published by theAmerican Meteorological Society, Boston, Mass.
iOA.29R
EMPIRICAL RELATIONS BETWEEN RADIATIVE FLUX.
CLOUDINESS, AND OTHER METEOROLOGICAL PARAMETERS
D.D. Wenlert tnd A.P. IngersollCalifornia Institute of Technology
Pasadena, California
1. INTRODUCTION
We are analyzing Earth Radiation Budget(ERB) data obtained by the scanning, narrowfield-of-view channels of the ERB instrument onNimbus 7 from the whole Earth for six days inJune 1979. Using meteorological information fromthe FCGE Level Ilib (ECHWF) data set and cloudi-ness information from the THIR instrument onboardNimbus 7, we calculate statistical relationsbetween the angularly resolved radiances measuredby ERB and various meteorological and cloudparameters. These relations are then combined todetermine relations between angularly integratedvisible and infrared npwelling flux (irradiance)and meteorological parameters (includingcloudiness).
We are using the relationships weobtain between radiative flux and other atmos-pheric variables in three ways. The effect ofvarying cloudiness on the net flux at the top ofthe atmosphere is being determined. Various dif-ferent radiation parameterizations, appropriatefor simple climate models, are being developed.Finally, relationships between radiation andother atmospheric variables are being defined,against which the internal statistics of generalcirculation models may be tested. In this paper,we report on some preliminary results orientedprimarily toward solving the first problem.
2. OBSERVATIONS
The radiation data consist of angularlyresolved, broad band measurements of infrared andvisible radiation obtained by the four scanningtelescopes of the ERB instrument on the Nimbus 7satellite, which travels in a sun-synchronousnoon-midnight orbit. At any given time, thescanners were capable of sampling most of theEarth's visible disc with instantaneous fields ofview of 0.2S degrees x 5.12 degrees (Jacobowitzet al., 1978). The data are archived on SubTarget Radiance Tapes (STRT's, see Stowe andFromm, 1983), where they are organized by targetarea (TA, a roughly square region on Earth about500 km on a side; there are 2070 of them), subtarget area (there are nine of these in each TA),time of day, and viewing geometry. Also includedon the STRT are information on the type ofsurface found in each TA and STA, and cloudiness
information for the STA'a (when available)obtained by the THIB instrument on Nimbus 7 (Chenet al.. 1980).
The meteorological information we usecones from the (-hourly global synoptic analyses,produced as a Level Illb data set by the EuropeanCenter for Medium-range Weather Forecasting(ECHWF) for the second Special Observing Periodof FGGE. This data set has space and time reso-lutions that natch quite well those of the ERBdata.
3. STATISTICAL ANALYSIS
In general, the npwelling flux, F, frona region is related to the npwelling radiancefield. R. by
F(ji») - J J R(e,4;|io> cos 8d 6 sin 6 &i.Zn
where |i0 = cosine of solar zenith angle, 6 =zenith angle of observer, 6 = relative azimuthfrom sun to observe. We have divided the upwardhemisphere into 32 discrete angular bins for thevisible radiances and 14 angular bins for theinfrared. Thus the relation between flux andradiance becomes
F(M.)
where u^ c cosine of zenith angle in ith bin,Oj = size of ith angular bin in steradians. Itis simple to show, given any variable x, that
°xF Z "xRi "i
where c^p = covariance of x and F (flux), a Rcovariance of x and Rj (radiance in ith bin).Similarly,
"RiRj
where Op • variance of flux 0giR; = covarianceof radiance in ith bin and radiance in jth bin.
467
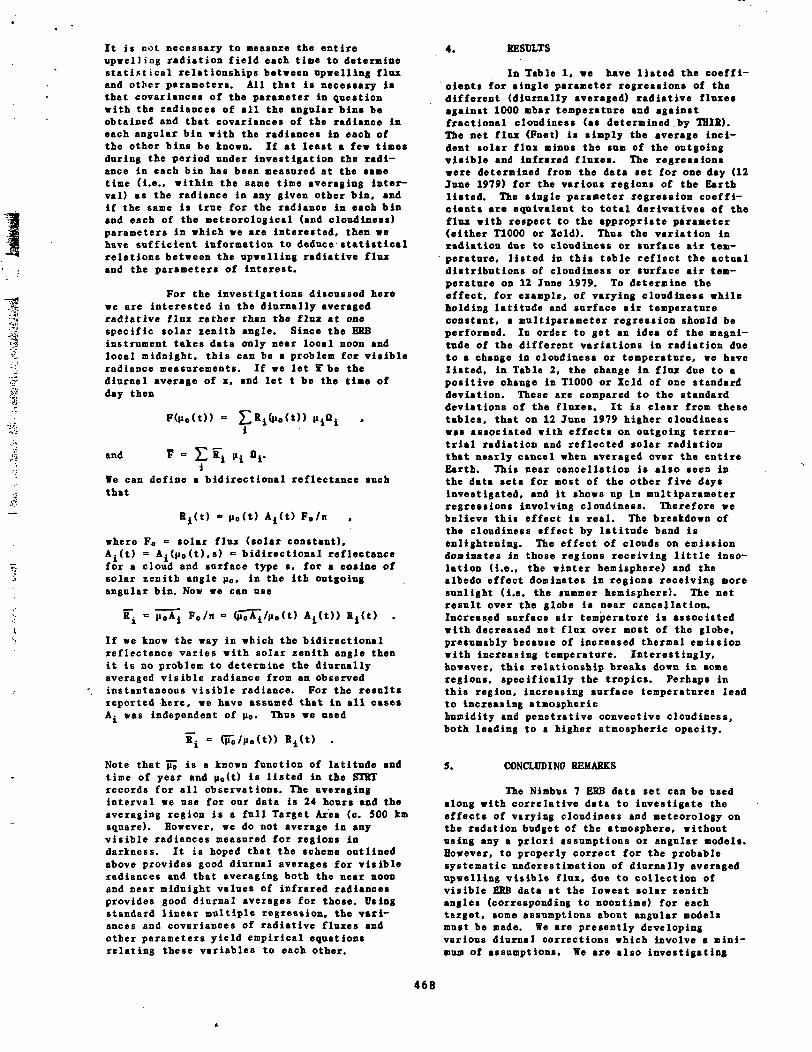
It is rot necessary to measure the entireupwelJing radiation field each tine to determinestatistical relationships between npwelling fluxand other parameters. All that is necessary iathat covariances of the parameter in questionwith the radiances of all the angular bins beobtained and that covariances of the radiance ineach angular bin with the radiances in each ofthe other bins be known. If at least a few timesduring the period under investigation the radi-ance in each bin has been measured at the aametime (i.e., within the same time averaging inter-val) as the radiance in any given other bin, andif the same is true for the radiance in each binand each of the meteorological (and cloudiness)parameters in which we are interested, then wehave sufficient information to deduce statisticalrelations between the up we 11 ing radiative fluand the parameters of interest.
For the investigations discussed herewe are interested in the diurnally averagedradiative flux rather than the flux at onespecific solar zenith angle. Since the ERBinstrument takes data only near local noon andlocal midnight, this can be a problem for visibleradiance measurements. If we let x" be thediurnal average of x, and let t be the time ofday then
and
We can define a bidirectional reflectance suchthat
4. RESULTS
u0(t) F0/n
where F0 = solar flux (solar constant),Ai(t) = Ai(Mo(t),s) •= bidirectional reflectancefor a cloud and surface type s. for a cosine ofsolar zenith angle u0> in the ith outgoingangular bin. Now we can use
Fo/n = Ri(t)
If we know the way in which the bidirectionalreflectance varies with solar zenith angle thenit is no problem to determine the diurnallyaveraged visible radiance from an observedinstantaneous visible radiance. For the resultsreported here, we have assumed that in all casesA£ was independent of u0. Thus we used
R"i = (JTo/Mo(t)) RA(t) .
Note that JiJ is a known function of latitude andtime of year and u0(t) is listed in the STRTrecords for all observations. The averaginginterval we use for our data is 24 hours and theaveraging region is a full Target Area (c. 500 kmsquare). However, we do not average in anyvisible radiances measured for regions indarkness. It is hoped that the scheme outlinedabove provides good diurnal averages for visibleradiances and that averaging both the near noonand near midnight values of infrared radiancesprovides good diurnal averages for those. Usingstandard linear multiple regression, the vari-ances and covariances of radiative fluxes andother parameters yield empirical equationsrelating these variables to each other.
In Table 1, we have listed the eoeffi-' cients for single parameter regressions of thedifferent (dinrnally averaged) radiative fluxes•gainst 1000 nbar temperature and againstfractional cloudiness (as determined .by THIR).The net flux (Fnet) is simply the average inci-dent solar flnx minus the son of the outgoingvisible and infrared flnxes. The regressionswere determined from the data set for one day (12June 1979) for the various regions of the Earthlisted. The single parameter regression coeffi-cients are equivalent to total derivatives of theflux with respect to the appropriate parameter(either T1000 or Xcld). Thus the variation inradiation due to cloudiness or surface air tem-
' perature. listed in this table reflect the actualdistributions of cloudiness or surface air tem-perature on 12 June 1979. To determine theeffect, for example, of varying cloudiness whileholding latitude and surface air temperatureconstant, a multiparameter regression should beperformed. In order to get an idea of the magni-tude of the different variations in radiation dueto a change in cloudiness or temperature, we havelisted, in Table 2, the change in flnx due to apositive change in T1000 or Xcld of one standarddeviation. These are compared to the standarddeviations of the flnxes. It is clear from thesetables, that on 12 June 1979 higher cloudinesswas associated with effects on outgoing terres-trial radiation and reflected solar radiationthat nearly cancel when averaged over the entireEarth. This near cancellation is also seen inthe data sets for most of the other five daysinvestigated, and it shows up in mnltiparameterregressions involving cloudiness. Therefore webelieve this effect is real. The breakdown ofthe cloudiness effect by latitude band isenlightening. The effect of clouds on emissiondominates in those regions receiving little inso-lation (i.e., the winter hemisphere) and thealbedo effect dominates in regions receiving moresunlight (i.e. the summer hemisphere). The netresult over the globe is near cancellation.Increased surface air temperature is associatedwith decreased net flnx over most of the globe,presumably because of increased thermal emissionwith increasing temperature. Interestingly,however, this relationship breaks down in someregions, specifically the tropics. Perhaps inthis region, increasing surface temperatures leadto increasing atmospherichumidity and penetrative convective cloudiness,both leading to a higher atmospheric opacity.
5. CONCLUDING REMARKS
The Nimbus 7 ERB data set can be usedalong with correlative data to investigate theeffects of varying cloudiness and meteorology onthe radation budget of the atmosphere, withoutusing any a priori assumptions or angular models.However, to properly correct for the probablesystematic underestimation of diurnally averagedupwelling visible flux, due to collection ofvisible ERB data at the lowest solar zenithangles (corresponding to noontime) for eachtarget, some assumptions about angular modelsmust be made. We are presently developingvarious diurnal corrections which involve a mini-Bun of assumptions. We are also investigating
468

the effects of different averaging interval* (ofarea and tine) and different divisions of theupward hemisphere into angnlar bin* on our stati-stics. We hope to thereby make nore robust onrfindings on the relationships between cloudiness,meteorology, and atnospheric radiation, includingthe apparently neutral effect of clouds on theEarth's radiation budget.
6. REFERENCES
Chen. T. S.. L. L. Stove. V. R. Taylor, and P. F.Clapp, 1980: Classification of clouds using THISdata from the Niumus-7 satellite. ProceedingsInternational Radiation Symposium, Fort Collins,CO, p.315-317.
Jacobovitz. H., L. L. Stove, and 3. R. Hickey,1978: The earth radiation budget (ERB) experi-ment. The Nimbus 7 User's Guide, NASA GoddardSpace Flight Center, p.33-69.
Stowe. L. L., and H. D. Fromm, 1983: The Ninbns7 ERB Sub Target Radiance Tape (STRT) data base,NOAA Technical Memorandum, in press.
469

Table 1.
Coefficients for single parameter regressions
Region90.0S-67.5S
67.5S-45.0S
45.0S-22.5S
22.5S-0.0
0.0-22.5N
22.5N-45.0N
45.0N-67.5N
67.5N-90.0N
Whole Earth
ParameterT1000XcldT1000XcldT1000XcldT1000XcldT1000XcldT1000XcldT1000XcldT1000XcldT1000Xcld
FvisO.OOOE+00O.OOOE+002.394E+001.552E+015 . 914E-014.608E+011.411E+006.335E+01-9.079E-018.097E+01-2.781E+007.182E+01-7.308E+001.870E+02-4.846E+002.026E+026.241E-018.991E+01
Fir3.205E+00-5.881E-011.4S5E+00-6.315E+012.843E+00-8.768E+01-4.457E+00-6.589E+01-2.590E+00-1.321E+023.571E+00-1.024E+022.204E+00-7.299E+015.602E-01-6.178E+012.552E+00-8.402E+01
Fnet-3.205E+005.881E-01-3.849E+004.763B+01-3.435E+004.160E+013.045E+002.541E+003.498E+005.111E+01-7.902E-013.060E+015.104E+00-1.140E+024.286E+00-1.409E+02-3.176E+00-5.884E+00
Table 2.Effects on radiative fluxes of changingthe regressionparameter by +1 standard deviation from the mean(standard deviations of the flaxes included for comparison)
Region Parameter Fvis Fir Fnet
90
67
45
22
.08-67. 5 S
Standard.58-45. OS
Standard.08-22. 5S
Standard.5S-0.0
Standard0.0-22.5N
22
45
67
Standard.5N-45.0N
Standard.ON-67.5N
Standard.5N-90.0N
StandardWhole Earth
Standard
T1000XcldDeviations:T1000XcldDeviations:T1000XcldDeviations:T1000XcldDeviations:T1000XcldDeviations:T1000XcldDeviations:T1000XcldDeviations:T1000XcldDeviations:T1000XcldDeviations:
000121211312-114-123-345-224626
.OOOE+00
.OOOE+00
.OOOE+00
.320E+01
.611E+00
.476E+01
.614E+00
.201E+01
.853E+01
.250E+00
.777E+01
.591E+01
.790E+00
.676E+01
.186E+01
.OSOE+01
.152E+01
.793E+01
.806E+01
.278E+01
.863E+01
.277E+01
.266E+01
.099E+01
.793E+00
.416E+01
.732E+01
1-128-121-22-1-12-5-241
-331-122-612-24
.570E+01
.907E-01
.503E+01
.026E+00
.062E+01
.138E+01
.257E+01
.285E+01
.775E+01
.026E+01
.849E+01
.513E-I-01
.107E+00
.733E+01
.365E+01
.348E+01
.069E+01
.833E+01
.148E+01
.670E-K)!
.290E+01
.633E+00
.910E+00
.071E+01
.778E+01
.258E+01
.324E+01
-11
-28
-11
77
61
-29
2-2
2-1
-3-1
.570E+01
.907E-01
.123E+01
.010E+00
.518E+01
.084E+01
.012E+00
.128E-01
.897E+00
.058E+01
.983E+00
.169E+00
.658E+01
.608E-K11
.014E+01
.575E+01
.457E+01
.581E+00
470