Embed Size (px)
Citation preview

i
California Bone Health Campaign For Low-Income Latino Mothers
Evaluation of the Pilot Intervention
August – October 2001
Prepared by:
UC Berkeley
May Wang, Dr.P.H., RD
California Project LEAN Elizabeth Moreno, MS, RD, CDE
Karen Black, BA Wendy Shoemaker, Psy.D. Nestor Martinez, MPH, RD
September 2002

ii
Table of Contents
Page Introduction ....................................................................................................................................1 Objective ........................................................................................................................................2 Methodology Overview of evaluation study design .................................................................................3 Description of the study communities................................................................................4 Quantitative Data ...............................................................................................................4 Qualitative Data..................................................................................................................6 Results Knowledge about calcium and its contribution to health ...................................................6 Attitude towards increased consumption of 1% milk.........................................................8 Milk Consumption Behavior ...............................................................................................9 Qualitative assessment: Feedback from promotora session participants ......................12 Discussion....................................................................................................................................17 Conclusion ...................................................................................................................................18 References...................................................................................................................................19 Tables and Figures Table 1: Demographic Profile of Intervention and Control Communities .....................................4 Table 2: Marketing Only Campaign Comparison of Mean Knowledge Scores ............................7 Table 3: Marketing + Promotora Campaign Comparison of Mean Knowledge Scores Q2-6......7 Table 4: Marketing + Promotora Campaign Comparison of Mean Knowledge Scores Q25-31..7 Table 5: Marketing Only Campaign Comparison of Mean Rank Attitude Scores ........................8 Table 6: Marketing + Promotora Campaign Comparison of Mean Rank Attitude Scores............8 Table 7: Marketing Only Campaign Number of Glasses of Milk Consumed................................9 Table 8: Marketing Only Campaign Type of Milk Consumed .....................................................10 Table 9: Promotora Qualitative Assessment “What did you like most about the program?” .....14 Table 10: Promotora Qualitative Assessment “What changes have you made?”......................16 Figure 1: Marketing + Promotora Campaign Number of Glasses of Milk Consumed................11 Figure 2: Marketing + Promotora Campaign Type of Milk Consumed .......................................12 Appendices Appendix A: California Bone Health Campaign Pilot Intervention Questionnaire (English) Appendix A-2: Phone Follow-Up Questions (English) Appendix B: California Bone Health Campaign Pilot Intervention Questionnaire (Spanish) Appendix A-2: Phone Follow-Up Questions (Spanish)

1
INTRODUCTION The mission of California Project LEAN (Leaders Encouraging Activity and Nutrition), a program of the California Department of Health Services and the Public Health Institute, is to promote healthy eating and physical activity in order to reduce the prevalence of chronic disease. California Project LEAN (CPL) was funded by the USDA through the California Nutrition Network to develop, implement, and evaluate a bone health campaign targeting pre-menopausal, Food Stamp-eligible mothers and their families. The objectives were to conduct formative research, develop a social marketing and evaluation plan, and implement and evaluate a bone health campaign. Formative research included several different techniques. First a literature search was conducted to examine osteoporosis, bone health, and the dietary and physical activity factors of this population. Osteoporosis is a serious bone disease characterized by low bone mass, causing bones to become brittle and break easily. Bone health data published in 2002 (National Osteoporosis Foundation, 2002) indicate that almost 30 million women over 50 years old in the United States currently have osteoporosis or are at risk for developing the disease. Although Caucasian and Asian women are estimated to be at greater risk of developing the disease, Hispanic women suffer from osteoporosis in significant numbers. In fact, 49% of Hispanic women are estimated to have low bone mass and 10% are estimated to already have osteoporosis. Increasing calcium and vitamin D intakes as well as weight-bearing physical activity have shown positive effects on bone density and prevention of bone loss in clinical studies. Hispanic and non-white females have the highest mean calcium intake of all Food-Stamp-eligible women, yet still fall well below the recommended level of calcium consumption. Mexican American adult females are approximately 200-300 mg short of the Dietary Reference Intake for calcium (Alaimo et al., 1994). Hispanics consume more milk than other Food Stamp-eligible populations in California (Foerster, Wu, Gregson, Hudes, & Fierro, 1999). Hispanics comprise the largest segment (38%) of California Food Stamp recipients.
Key informant interviews were done with health professionals and marketing experts about the leading issues related to bone health. An environmental scan was completed to determine what other bone health projects existed throughout the nation, who their targeted populations were, and what components their campaigns included. Results showed that most programs focused on changing individual behaviors and were targeting adolescents. Few programs were focused on Latino women using Spanish-language materials.
These primary and secondary data sources helped segment the target audience for the California Bone Health Campaign. The target audience was determined to be low-income Latino mothers with school-aged children at home, who are Spanish-language dominant, and who consume milk. As part of the formative research and to define the behavioral objective of the campaign, nine focus groups with the target audience were completed in three regions of the state to identify barriers and benefits to consuming more calcium. Focus group participants were asked to try one of three behaviors and report on them after one week. The behaviors were to either: add an extra serving of 1% milk, a licuado made with 1% milk, or calcium-fortified juice to their diet as well as their family’s daily diet. Results showed that participants who chose milk were more likely to do the behavior daily and health was the main motivator. Reported barriers to consuming an extra serving of 1% milk included taste and the perception that 1% milk was “watered down” and therefore not as nutritious as whole milk. Benefits to consuming more 1%

2
milk included that the health of the family was most important, milk tastes good with something else (fruit, chocolate, cereal) and that consuming more milk was relatively easy to do. Based on the formative research results, a social marketing plan was developed. According to Alan Andreasen, Ph.D., (Andreasen, 1995), social marketing is “…the application of commercial marketing techniques to the analysis, planning, execution, and evaluation of programs designed to influence the voluntary behavior of target audiences in order to improve their personal welfare and that of their society”. Therefore, for this project the “product” became the behavior of adding one extra 8 ounce serving of 1% milk each day for Spanish-dominant Latino mothers and their school-aged children. The “price” (benefit/cost to the target audience) that the campaign highlighted included the health of the family as worth the extra cost to purchase the additional milk, the nutritious aspect of 1% milk and the great taste of milk with culturally-acceptable foods and drinks. The “place” and “promotion” of the product was highlighted through a paid Spanish-language radio campaign, taste-tests of 1% milk at grocery stores and community events, and use of peer-to-peer communication through a promotora model. The pilot intervention was designed to determine what social marketing approaches worked best to influence positive bone health behaviors in this target audience. The quasi-experimental study design included two control communities and two intervention communities. The intervention communities were chosen from interested CPL regions who could demonstrate that their community met the following criteria: dense Latino, Spanish-language dominant population with low-income households including children ages 5-18. The web-based Project LEAN Geographical Information System (LEAN GIS) was used to target exact zip codes that met this profile. PRIZM data was also obtained from the Center for Disease Control and Prevention and helped to provide media, product purchase and lifestyle habits of the target audience in the targeted zip codes. The University of California at Berkeley (UCB), an outside evaluator, was contracted to develop the evaluation plan and study design, conduct evaluation training, oversee data collection, conduct data entry and analysis and report on the results. OBJECTIVE
This report describes the findings of the evaluation study of California Project LEAN’s pilot intervention, the California Bone Health Campaign (CBHC). The goal of this campaign was to increase 1% (low-fat) milk consumption among Latino families. The Campaign specifically targeted milk consuming, low-income, less acculturated, Spanish-speaking Latino women, aged 25 - 44 years and their children, aged 5-18 years. The intervention took place in two communities (Colton in San Bernardino County and Salinas in Monterey County), and used two strategies:
(1) A marketing only strategy that aimed to disseminate campaign messages through two 60-second radio advertisements, community events, and grocery store events; and
(2) A marketing + promotora strategy that included community health workers who were trained to lead educational sessions, called “Huesos Fuertes, Familia Saludable”, (adapted from the campaign slogan “Mas Leche 1%, Huesos Fuertes, Familia Saludable”) in addition to the marketing components detailed above.
Colton received both interventions (marketing + promotora), while Salinas received only the intervention that implemented a marketing campaign (marketing only).
3
The primary objectives of this study were to evaluate if the CBHC:
a) Improved knowledge about calcium and its contribution to health; b) Improved attitude towards increased consumption of 1% (low-fat) milk; and c) Increased consumption of 1% (low-fat) milk by one additional 8-ounce serving per
day.
A secondary objective was to determine if using a marketing only strategy would be as effective as using a combined marketing + promotora strategy. METHDOLOGY Overview of evaluation study design
Pre- and post-intervention assessments of knowledge, attitudes and behavior relating to milk consumption in the two intervention communities were conducted. To increase chances of isolating the effects of the CBHC from those of other interventions or factors that could have affected milk consumption (e.g. a nation-wide milk campaign) in the intervention communities, similar assessments in two control communities were conducted. Specifically, the two intervention communities, Colton and Salinas, were matched with Escondido and Stockton respectively.
Relevant data were gathered by structured as well as unstructured techniques. Structured and quantitative techniques were used to evaluate the outcome objectives listed above. To evaluate the effectiveness of the marketing aspects of both campaigns, a questionnaire was developed to address these specific objectives. This questionnaire was administered with convenience samples by personal intercept interview in all four communities before the start date of the marketing campaign and after it had ended. The interviews were conducted in specific zip codes identified by local contractors as areas frequented by the target audience (Intercept Survey). In addition, an expanded version of the questionnaire, which included additional questions specific to information disseminated only through the marketing + promotora-based intervention, was administered by telephone to participants of the promotora sessions after they had completed all sessions (Phone Survey). Due to unanticipated time and resource constraints, this questionnaire was not administered to promotora class participants and their controls before the marketing + promotora-based intervention began. This constraint changed the evaluation design for the marketing + promotora from a pre- post- comparison to a post-only design. The sample of women who participated in the promotora classes in both Colton (I) and Escondido (C) are similar to each other in that they met the sample requirement and were interested enough in health issues that they completed health-related classes. Only the women in Colton however, received health classes with a curriculum specific to bone health. Because both groups of women demonstrated their interest in health-related issues, any differences between the groups in the post-comparison may be demonstrating the impact of the bone health curriculum specifically. A copy of the questionnaire is given in Appendix A.
Less structured (i.e., qualitative) data collection efforts were made to help interpret findings and to evaluate the data collection processes that took place. These efforts included:
• Informal interviews with store-owners, conducted by Mariela Communications, to gather information about the amount of milk sold before and after the intervention;
4
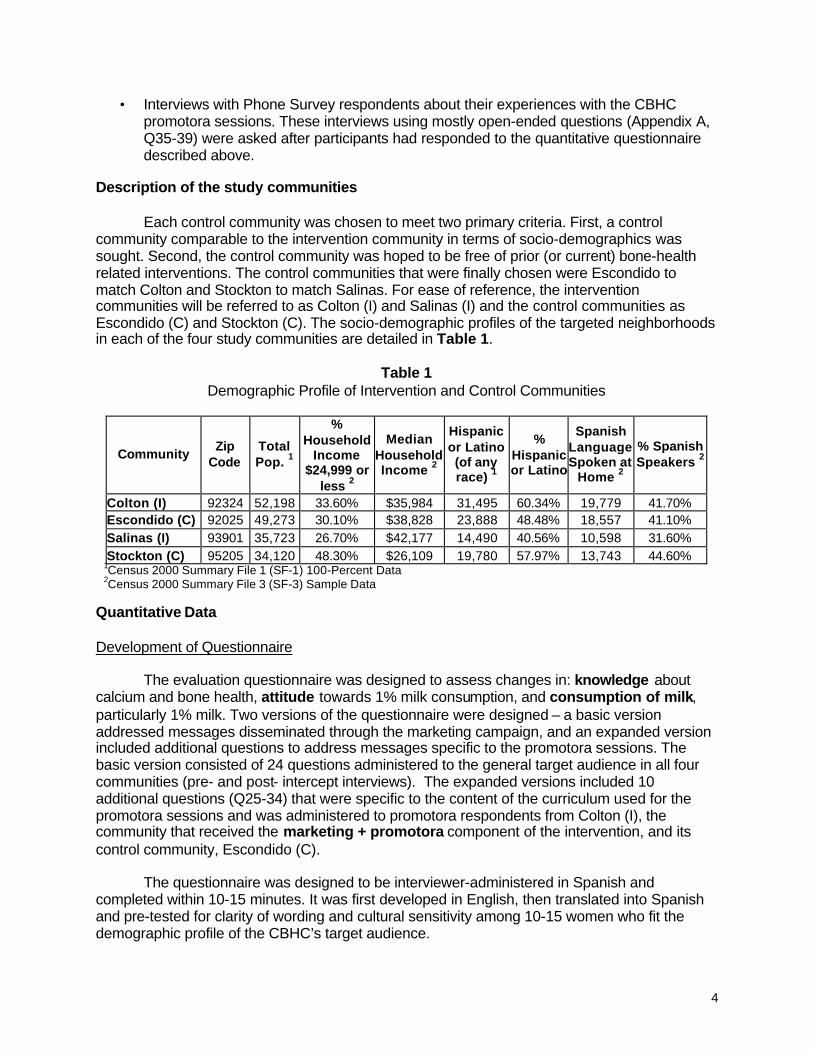
• Interviews with Phone Survey respondents about their experiences with the CBHC promotora sessions. These interviews using mostly open-ended questions (Appendix A, Q35-39) were asked after participants had responded to the quantitative questionnaire described above.
Description of the study communities
Each control community was chosen to meet two primary criteria. First, a control community comparable to the intervention community in terms of socio-demographics was sought. Second, the control community was hoped to be free of prior (or current) bone-health related interventions. The control communities that were finally chosen were Escondido to match Colton and Stockton to match Salinas. For ease of reference, the intervention communities will be referred to as Colton (I) and Salinas (I) and the control communities as Escondido (C) and Stockton (C). The socio-demographic profiles of the targeted neighborhoods in each of the four study communities are detailed in Table 1.
Table 1
Demographic Profile of Intervention and Control Communities
Community Zip
Code Total Pop. 1
% Household
Income $24,999 or
less 2
Median Household Income 2
Hispanic or Latino (of any race) 1
% Hispanic or Latino
Spanish Language Spoken at
Home 2
% Spanish Speakers 2
Colton (I) 92324 52,198 33.60% $35,984 31,495 60.34% 19,779 41.70% Escondido (C) 92025 49,273 30.10% $38,828 23,888 48.48% 18,557 41.10% Salinas (I) 93901 35,723 26.70% $42,177 14,490 40.56% 10,598 31.60% Stockton (C) 95205 34,120 48.30% $26,109 19,780 57.97% 13,743 44.60%
1Census 2000 Summary File 1 (SF-1) 100-Percent Data 2Census 2000 Summary File 3 (SF-3) Sample Data
Quantitative Data Development of Questionnaire
The evaluation questionnaire was designed to assess changes in: knowledge about calcium and bone health, attitude towards 1% milk consumption, and consumption of milk, particularly 1% milk. Two versions of the questionnaire were designed – a basic version addressed messages disseminated through the marketing campaign, and an expanded version included additional questions to address messages specific to the promotora sessions. The basic version consisted of 24 questions administered to the general target audience in all four communities (pre- and post- intercept interviews). The expanded versions included 10 additional questions (Q25-34) that were specific to the content of the curriculum used for the promotora sessions and was administered to promotora respondents from Colton (I), the community that received the marketing + promotora component of the intervention, and its control community, Escondido (C).
The questionnaire was designed to be interviewer-administered in Spanish and completed within 10-15 minutes. It was first developed in English, then translated into Spanish and pre-tested for clarity of wording and cultural sensitivity among 10-15 women who fit the demographic profile of the CBHC’s target audience.

5
Questionnaire administration
To evaluate the effectiveness of the marketing only campaign, pre and post-intervention data were gathered in all intervention and control communities during the months of July 2001 and November 2001 respectively (Intercept Survey). A total of 785 (pre) and 793 (post) women completed the basic questionnaire (Q1-24). These women were recruited from public places within the targeted zip codes identified as areas frequented by the target audience, such as grocery stores, public health clinics, and flea markets. To be eligible for this component of the study, women had to meet the following criteria:
• Aged between 25 and 44 years • Consumed milk as a beverage or in foods • Had children between the ages of 5 and 18 years • Spoke Spanish at home
Interviewers hired by regional health agencies and trained by the evaluation team
administered these intercept questionnaires.
To evaluate the effectiveness of the marketing + promotora intervention, data were gathered between November 2001-January 2002 using the expanded version of the questionnaire from 132 promotora session participants in Colton (I), and 106 controls in Escondido (C) after the marketing + promotora intervention had ended. . The 106 women who acted as controls had not received the intervention but had participated in other promotora-based or health education programs that did not relate to bone health or nutrition. The questionnaire was administered via a telephone interview by two trained, Spanish-speaking interviewers. In these telephone interviews, a sample of Colton (I) respondents were also asked open-ended questions about their experiences with the promotora sessions. (Appendix A, Q35-39). Data management
Data were entered into a Microsoft Access (2000) relational database using customized data entry screens that provided predefined missing data values, and allowed for edit checks to minimize data entry errors.
To quantify knowledge, two sets of questions were asked. Answers to questions 2-6 related to knowledge about calcium, bone health and its contribution to health were summed to come up with a knowledge score (range 0-5). Answers to questions 25-31 were specific to the promotora curriculum and included questions about osteoporosis. These questions were summed to get a promotora curriculum specific knowledge score (range 0-7). Each of the knowledge questions was assigned a score of 1 if answered correctly and 0 if answered incorrectly.
To assess attitude , scaled responses to questions Q7-13 were added together, with higher scores indicating a more positive attitude towards change in milk consumption behavior.
Milk consumption behavior was assessed from questions about the number of cups and the type of milk consumed the day before the interview.

6
Data analysis
To determine if relevant outcome measures were similar between the intervention and control communities, comparisons were made using the t-test, Mann Whitney U and χ2. Statistical analyses were performed using the Statistical Analysis System version 8.2 (SAS Institute, Chicago) and the Statistical Package for the Social Sciences (SPSS) version 10.0. Milk Sales In an effort to quantify milk sales in the intervention communities, Mariela Communications interviewed local store managers to determine the quantity of milk that they had sold before and after the intervention. Unfortunately, this effort was met with strong resistance on the part of many grocery store managers. Most managers viewed their information as proprietary data and were unwilling to risk releasing it because of their concern that competitors could get access. Many also expressed concerns about sharing this data with a marketing organization with which they had no relationship and whom they viewed with suspicion. Those store managers who were convinced to share information provided inconsistent types of data (inventory vs. sales) and incomplete data (only certain milk types and/or sizes). Due to these problems and inconsistencies milk sales data were not formally analyzed and reported. Qualitative Data Promotora session participant feedback
A sample of promotora participants from Colton (I) (N=37), who were interviewed by telephone after the intervention were asked the following open-ended questions in addition to the expanded version of the survey:
(1) What did you like the most about the Huesos Fuertes, Familia Saludable program? (2) What did you like the least about the Huesos Fuertes, Familia Saludable program? (3) What changes have you or your family made as a result of the classes offered by the
promotoras? These questions were analyzed qualitatively to evaluate the experiences of the promotora session participants. RESULTS
The following pages will describe the results of data collection from the marketing only campaign and the marketing + promotora intervention for each of the three outcomes of interest, namely knowledge, attitude and behavior. Knowledge about calcium and its contribution to health Evaluation of the marketing only campaign
Table 2 shows mean knowledge scores for the marketing only messages (Q2-6), pre- and post- intervention for each community. In neither of the intervention communities, did mean knowledge scores show a gain. However, an unexpected gain was observed in the control community of Stockton (C).

7
Table 2
Marketing only Campaign via Intercept Survey Comparison of Mean Knowledge Scores
Sum of Questions 2-6 1
Pre Post Community
N Mean score
Std. Dev. N Mean
score Std. Dev.
t-score
Significance (2-tailed)
Colton (I) 203 3.89 1.00 198 3.86 .98 .334 p =.739 Escondido (C) 194 3.70 1.01 204 3.76 1.01 -.579 p =.563 Salinas (I) 191 3.73 1.04 191 3.80 .90 -.738 p =.461 Stockton (C) 197 2.95 1.48 200 3.57 1.33 -4.368 p =.000
1Range of possible scores 0-5 Evaluation of the marketing + promotora intervention
Table 3 shows the comparison of mean knowledge scores (Q2-6) for the marketing + promotora intervention between Colton (I) and Escondido (C). The mean knowledge score for Colton (I) was significantly higher (p =.000) than Escondido (C).
Table 3 Marketing + Promotora Campaign via Phone Post-only Survey
Comparison of Mean Knowledge Scores
Sum of Questions 2-6 1
Post Only Community
N Mean Score
Std. Dev.
t-score
Significance (2-tailed)
Colton (I) 132 4.61 .60 Escondido (C) 106 3.92 .84
7.464 p =.000 1Range of possible scores 0-5
Table 4 shows the comparison of mean knowledge scores (Q25-31) for the marketing +
promotora intervention in Colton (I) and Escondido (C). Once again, the mean knowledge score was significantly higher (p =.000) in Colton (I) compared to Escondido (C).
Table 4 Marketing + Promotora Campaign via Phone Post-only Survey
Comparison of Mean Knowledge Scores
Sum of Questions 25-31 1
Post Only Community
N Mean Score
Std. Dev.
t-score
Significance (2-tailed)
Colton (I) 132 6.38 .97 Escondido (C) 106 5.48 1.35
5.767 p =.000 1Range of possible scores 0-7

8
Attitude toward increased consumption of 1% milk Evaluation of the marketing only campaign
Table 5 shows mean rank attitude scores pre- and post- intervention for each community. In both intervention communities mean rank attitude scores did not significantly change after the marketing only campaign. However, an unexpected increase was seen in Stockton (C) (p = 004) and a decrease was observed in Escondido (C) (p =. 008).
Table 5 Marketing Only Campaign via Intercept Survey
Comparison of Mean Rank Attitude Scores Survey Questions 7-13
Pre Post
Community N Mean Rank N Mean
Rank
Mann-Whitney
U Z Score Significance
(2-tailed)
Colton (I) 188 192.98 181 176.71 15513.50 -1.489 p =.137 Escondido (C) 168 195.30 191 166.54 13473.00 -2.652 p =.008 Salinas (I) 178 176.86 173 175.12 15244.50 -.163 p =.870 Stockton (C) 179 167.01 186 198.39 13784.00 -2.859 p =.004
Evaluation of the marketing + promotora intervention
Table 6 shows the comparison of mean rank attitude scores for the marketing + promotora intervention between Colton (I) and Escondido (C). The mean rank attitude scores of the intervention community were significantly higher (p = .000) than the control community after the campaign.
Table 6 Marketing + Promotora Campaign via Phone Post-only Survey
Comparison of Mean Rank Attitude Scores Survey Questions 7-13
Post Only
Community N Mean Rank
Mann-Whitney
U Z Score Significance
(2-tailed)
Colton (I) 128 138.36 Escondido (C) 98 81.03
3089.50 -6.681 p =.000

9
Milk Consumption Behavior Evaluation of the marketing only campaign Amount of Milk Consumed
Table 7 shows that the quantity of milk consumed by the general target audience, as measured by the intercept survey, did not significantly change over the intervention period for three of the four communities. The distribution of quantity of milk consumed did change significantly in Colton (I). Colton (I) had an increase in the proportion of respondents who consumed 1 or 1.5 glasses of milk from 24% to 38%, and a decrease in the proportion of respondents who consumed no glasses of milk (from 11% to 7%).
Table 7
Marketing only Campaign via Intercept Survey Distribution by number of glasses of milk consumed yesterday (Q1)
Pre Post
Community (Intervention or Control)
Non
e (%
)
1 gl
ass
(%)
1.5
glas
ses
(%)
2 gl
asse
s (%
)
3 +
glas
ses
(%)
N
Non
e (%
)
1 gl
ass
(%)
1.5
glas
ses
(%)
2 gl
asse
s (%
)
3 +
glas
ses
(%)
N χ2
Deg
rees
of
Free
dom
Sig
nific
ance
Colton (I)
22 (11) 42 (21) 6 (3) 71 (35) 62 (30) 203 13 (7) 67 (34) 8 (4) 60 (30) 50 (25) 198 10.483 4 p =.033
Escondido (C)
24 (12) 56 (29) 17 (9) 68 (35) 29 (15) 194 33 (16) 56 (28) 13 (6) 78 (38) 24 (12) 204 2.862 4 p =.581
Salinas (I)
20 (10) 51 (27) 6 (3) 69 (36) 45 (24) 191 26 (14) 40 (21) 7 (4) 68 (35) 50 (26) 191 2.460 4 p =.652
Stockton (C)
24 (12) 35 (18) 14 (7) 48 (24) 76 (39) 197 11 (5) 33 (16) 9 (5) 51 (26) 96 (48) 200 8.369 4 p =.079

10
Type Of Milk Consumed Changes in the distribution of the type of milk consumed in Colton (I), Escondido (C) and Stockton (C), after the marketing only campaign did not reach statistical significance. Salinas (I) did have a significant change in the distribution of type of milk consumed. Salinas (I) saw a decrease in the proportion of respondents consuming whole milk from 43% to 31%, and corresponding increases in the proportions of respondents consuming 2%, 1%, and non-fat milk, from 57% to 69% (Table 8).
Table 8 Evaluation of the Marketing only Campaign
Intercept Survey Distribution By Type Of Milk Consumed Yesterday (Q1a)
Pre Post
Community (Intervention or Control)
Who
le M
ilk
(%)
2% M
ilk (%
)
1% M
ilk (%
)
No
n-f
at M
ilk
(%)
N
Who
le M
ilk
(%)
2% M
ilk (%
)
1% M
ilk (%
)
No
n-f
at M
ilk
(%)
N χ2
Deg
rees
of
Free
dom
Sig
nific
ance
Colton (I)
105 (58) 46 (25) 21 (12) 8 (5) 180 109 (60) 50 (27) 17 (9) 7 (4) 183 1.019 4 p =.907
Escondido (C)
105 (62) 43 (25) 17 (10) 5 (3) 170 108 (63) 47 (28) 9 (5) 6 (4) 170 3.770 4 p =.438
Salinas (I)
73 (43) 70 (41) 26 (15) 2 (1) 171 50 (31) 73 (45) 30 (19) 9 (5) 162 12.001 4 p =.017
Stockton (C)
94 (55) 42 (24) 25 (14) 10 (7) 171 93 (49) 41 (22) 39 (21) 16 (8) 189 5.769 4 p =.217

11
Evaluation of the marketing + promotora intervention Amount of milk consumed Figure 1 shows the amount of milk consumed (glasses/day) for the marketing + promotora intervention community (Colton) compared to the control community (Escondido) post-campaign. The majority (43%) of the Colton (I) marketing + promotora subjects interviewed consumed 3 or more glasses of milk per day compared to the majority (37%) of the Escondido (C) subjects who consumed only 1 glass of milk per day.
Figure 1 Marketing + Promotora Campaign via Phone Post-only Surveys
Distribution by Number of Glasses of Milk Consumed Yesterday (Q1)
Chi-square = 22.39, df = 4, p = .000
3 or more21.51None
Per
cent
50
40
30
20
10
0
Promotora Site
Colton (I) n=132
Escondido (C) n=106
19
35
4
37
6
43
35
3
15
4

12
Type of milk consumed Figure 2 shows the type of milk subjects of the marketing + promotora intervention reported consuming post-campaign. The majority (54%) of the Colton (I) subjects stated that they drank 1% milk yesterday, whereas the majority (56%) of the Escondido (C) subjects stated that they drank whole milk yesterday.
Figure 2 Marketing + Promotora Campaign via Phone Post-only Surveys
Distribution by Type of Milk Consumed Yesterday (Q1a)
Qualitative assessment: Feedback from promotora session participants
A sample of promotora session participants in Colton (I) who were interviewed by telephone were asked several open-ended questions (Appendix A, Q34-39) to obtain a qualitative assessment of their experiences. Thirty-seven women responded to these questions and their responses are summarized below. What did the respondents like most and least about the Huesos Fuertes, Familia Saludable program?
The Huesos Fuertes, Familia Saludable program was very well received by the participants (Table 9). When asked what they liked least about the program the vast majority of responders (31/37) stated that they “liked everything” and/or disliked nothing. There were several suggestions for improvements, including wanting to have longer classes (2), complaints about participants who spoke loudly and dominated the discussion (1), not liking the taste of 1% milk (1), and not having classes in the afternoon (1).
Chi-square = 89.48, df = 3, p = .000
Nonfat1%2%Whole
Per
cent
60
50
40
30
20
10
0
Promotora Site
Colton (I) n=125
Escondido (C) n=99
7
36
56 54
39
5

13
When asked what they liked best about the program the largest number of responses (44) were concerning dietary related skills and information they received. The “how-to” activities were the most frequently mentioned. The respondents clearly valued learning how to eat and prepare foods (23). They also valued learning more about sources of calcium (13) and the importance of drinking milk and 1% milk in particular (6). Responses indicated that many participants were glad to learn new ways to incorporate milk into recipes as well as new and different sources of calcium—especially alternatives that would appeal to their kids.
Exercise was the second most frequently mentioned topic (21) of what respondents liked the most. Comments tended to be less specific with many respondents (11) just responding with the word “exercise”, “that they taught us about exercise”, “the information about exercise”, etc. A few respondents mentioned that they liked doing the exercises (3) and learning how to do the exercises (4). Three people mentioned that they liked the exercise bands in particular. (Dyna bands were provided to class participants to help them learn and practice several resistance exercises.)
A large portion of the responses (17) referred to “osteoporosis” by name. These individuals mentioned that they valued learning about osteoporosis in general (6 responses) and especially how to improve bone health (6). Fewer mentioned that they like learning about the causes, risks and dangers of osteoporosis.
Eight respondents mentioned specific teaching techniques that they liked, i.e. demonstrations (2), pamphlets (2), sample foods (2), bingo (1), and sharing with other mothers (2). In addition to these eight comments, as mentioned above, the participants also like learning how to prepare foods (23), recipes (5), doing the exercises (3), the exercise bands (2) and exercise sheets (1).
Eighteen respondents made comments about the quality of the instruction. They commented that they liked the way things were explained--very clearly and “nicely” (8). Four respondents mentioned how they appreciated the fact that all their questions were answered and another four liked the way the instructors motivated them.
In summary, when asked what they liked best about the program, most respondents mentioned the topic(s) they liked best. These fell into 3 general categories (in order of frequency): (1) dietary skills and information, (2) exercise skills, and (3) information about osteoporosis. Within these topic areas participants appear to value the practical how-to information the most. Several mentioned learning activities that they enjoyed and a few mentioned the quality of the instruction. The participants clearly valued the participatory, hands-on approach as well as the clarity, congeniality and responsiveness of the instructors to their questions. The comments are all favorable and give the impression that the information was valuable, interesting and relevant to the participants, that they enjoyed the activities, and felt comfortable with the instructors.

14
TABLE 9 What did you like the most about the Huesos Fuertes, Familia Saludable program? (n=37)
Response (# of responses) by category Number of Responses The information...................................................................................................................................................................1 Osteoporosis ......................................................................................................................................................................17
Increased awareness/information/importance of osteoporosis and bone health (6) How to prevent osteoporosis/make bones strong (6) -In general (4) -For kids (1) -That it’s easy (1) Risks/dangers about osteoporosis (3) -In general (1) -Get smaller (2) Causes of osteoporosis (2) -In general (1) -Menopause (1)
Dietary skills and information............................................................................................................................................44 How to eat and/or prepare foods (23) -In general/healthy meals/food pyramid (9)
-Cook/prepare foods with milk (different forms/even if my kids don’t like milk) (6) -Recipes and ideas (5)
-Foods with calcium (yogurt with fruit) (1) -To prevent osteoporosis (1) -Lower in fat (1) Which foods have (13) -(more) calcium (new and other foods like tofu) (9) -that 1 % milk has less fat and/or more calcium (3) -less fat and more calcium (1) Importance of /all about/drink more (6)
-Milk (3) -%1 milk (3)
Learned that one should read labels (1) Need to give more vitamins and calcium to our children (1)
Exercise skills and information.........................................................................................................................................21 Taught us about exercise/information about exercise (11)
How to exercise -in general (3) -at home w/o going to the gym (1) Doing the exercises -in general (2) -with the bands (1) The elastic bands for exercise (2) The sheets about exercise (1)
Teaching Techniques/learning activities*..........................................................................................................................9 Demonstrations (2) Pamphlets (2) Sample foods (juices, tofu, licuados) (2) Playing bingo (1) Sharing ideas with other mothers (2)
Teaching quality/instructor characteristics......................................................................................................................16 Their way of explaining things/communicating/very clear/nice (8) That they answered our questions (4) They motivated us (4)
___________________________________________________________________________________________________________ *Some teaching methods are listed under the exercise and dietary sections, i.e. recipes, exercise bands, doing exercises, etc. -All numbers refer to number of responses in the category indicated. -The number of responses may be greater than the number of respondents because some respondents gave more than one response to a given question. -Numbers in bold are either the sum of the numbers in parentheses within that section or the sum of the non-bolded numbers for each subsection. The number for each subsection is the sum of the numbers in parenthesis within that subsection.

15
What changes did the respondents make as a result of the classes given by the promotoras? When asked what changes they or their families had made as a result of participation in
the promotora-led classes (Table 10), all the respondents mentioned either dietary changes or changes in physical activity. The majority of responses (95) concerned changes in the consumption of foods and beverages, versus 17 comments regarding increases in physical activity.
The majority of the changes reported in dietary intake concerned increases in the consumption of calcium rich foods (52). Twenty respondents mentioned increases in milk consumption in fluid form (15) or as part of a recipe (5). Two respondents mentioned increases in other milk products. Twenty-five specifically mentioned switching to lower fat versions of milk products; sixteen of which switched to 1% milk, 8 of which switched to 2% milk, and 1 of which had switched to lower fat yogurt and cheese. Of the 15 that switched to 1% milk, 5 mentioned switching from whole milk and 3 mentioned switching from 2%.
Comments were also made about increases in vegetable (12) and fruit (5) intake.
Several other comments were made about other healthful dietary changes not specifically related to healthy bones. These included general comments about eating better (8), reading labels (1), reports of reducing intake of fat, sugar, salt and foods high in these nutrients (13), and a few comments about losing weight (1), reducing portion sizes (1), and decreasing bread intake (1). One person stated she is eating more calories as a result of program participation and another started drinking more water.
Of the 17 who mentioned increasing exercise or physical activity, 4 specifically
mentioned walking, and 2 mentioned lifting weights. It is interesting to note that almost all mentioned “exercise” and only a few used the term “physical activity”. Four comments about exercise were a bit ambiguous: the respondents stated they were “going to” exercise, had increased “a little bit”, or were “trying”.
None of the women mentioned problems related to making changes themselves (this
was not specifically asked). The 2 that said they had not made any changes reported that they had not done so because they were already eating well and exercising sufficiently. Four respondents did mention having trouble motivating family members, especially husbands (3) to change. In these instances the husbands did not like the taste of the recommended foods and beverages.
In summary, almost all of the respondents reported that they were able to make positive
changes in eating or physical activity. Only a few mentioned that they were only trying (6) or planning (2) to change, and a couple admitted they hadn’t changed much. The predominant changes made by respondents as a result of this intervention were: an increase in the consumption in milk/milk products and/or calcium rich foods (27); an increase in vegetable intake (12); and switching to lower fat versions of these foods and beverages (24). A variety of other dietary improvements were mentioned (26). Increases in physical activity were mentioned to a much lesser extent (17 responses) compared to the dietary changes.
Although one cannot be sure if the respondents actually made the changes that they reported, their responses suggest that the majority were able to identify positive changes targeted by this program and that increases in calcium rich foods especially, and lower fat versions in particular, were changes they were able to make with the most ease. Although not specifically asked, the information that was volunteered suggests that their husbands’ food preferences may represent a common barrier for healthy dietary change.

16
TABLE 10 What changes have you or your family made as a result of participating in the promotora classes? (n=37)
Response (# of responses) by category Number of Responses 1% milk ................................................................................................................................................................................16
I/we changed to 1% milk (15) -from 2%(3 of 15) -from whole (5 of 15)
Husband changed to 1% milk (1) 2% Milk ................................................................................................................................................................................. 8
I/we changed to 2% milk (8) Changed to another yogurt and cheese ...........................................................................................................................1 Milk & Milk Products...........................................................................................................................................................22
We/I drink more milk (9) Try to drink more milk (1) Push my family and/or children to drink more milk (4) My husband started drinking lactose free once a week (1) Prepare more recipes with milk (4) Eat more yogurt (1) Eat more cheese (1) Make more licuados (1)
Calcium ................................................................................................................................................................................ 5 Eat more (food with) calcium (3) Try to look for/buy food with calcium (2)
Vegetables and fruits .........................................................................................................................................................17 Eat or buy more vegetables/green salads (10) Give more vegetables to my children (1) Make cauliflower salad (1) Eat or buy more fruits (5)
Healthy Eating......................................................................................................................................................................8 More careful about how I/we eat/eat healthy (5) More careful about how my children eat (1) Use the pyramid more (1) We/I check the food labels (1)
Sugar, fat, salt and meat ....................................................................................................................................................13 Eat foods with less sugar (1) Eat or buy less foods with fat (5) Eat foods with less salt (2) Eat or buy less red meats (3) Eat or buy more fish and/or poultry (1)
Calories/weight....................................................................................................................................................................4 Try to eat more calories (1) I have lost weight (1) We watch our portion sizes (1) Eat less bread (1)
Water....................................................................................................................................................................................1 Drink more water (1)
Exercise/physical activity..................................................................................................................................................17 We/I do more exercise (8) I do a little more exercise (1) Try to do exercise (1) Push my family to do more exercise (1) I exercise (more) with weights (2) Will walk 2 hours/day (1) We/I walk more (2) Try to walk more (1)
Barriers to Change ..............................................................................................................................................................4 My husband doesn’t like low fat (1) My husband doesn’t like high calcium food (1) My family did not change to 1% but I did (1) My husband doesn’t like 1% (but changed to 2%) (1)
No changes .........................................................................................................................................................................2 Because we were already drinking low fat milk, Doing exercise and eating vegetables (1) I already had a good diet and drank 1% milk (1)
____________________________________________________________________________________________ -All numbers refer to number of responses in the category indicated. -The number of responses may be greater than the number of respondents because some respondents gave more than one response to a given question. -Numbers in bold are the sum of the numbers in parentheses within that section.

17
DISCUSSION
The California Bone Health Campaign (CBHC) pilot was implemented in the summer of 2001, and used the social marketing model to identify the best strategies to improve bone health for Latino mothers and their families. Formative research indicated that disseminating bone health related messages on the radio to Latino families was one promising strategy. It also indicated a key strategy would be to recruit and train promotoras to conduct educational sessions using a more intensive curriculum des igned to reinforce and supplement the radio messages. Such a model, which incorporates more traditional health education techniques with marketing strategies has been successfully used by others in similar intervention efforts tailored for Latinos (Wechsler & Wernick, 1992; Reger, Wootan & Booth-Butterfield, 1999). Knowledge about calcium and its contribution to health
Evaluation of knowledge shows that the marketing only intervention, comparing pre- and post changes within the intervention and control communities, had no effect on mean knowledge scores (Table 2) for the intervention communities. The significant change observed in the control community of Stockton (C) can be explained by the Stockton WIC agency where many of the respondents had been recruited. Further investigation revealed that this agency had conducted nutrition education classes on 1% milk consumption and calcium requirements for one month during the implementation of the Bone Health campaign.
The evaluation of the marketing + promotora intervention, however, indicates a significant difference for both sets of mean knowledge scores (Tables 3 and 4) when Colton (I) and Escondido (C) post only phone interviews are compared. Attitude towards increased consumption of 1%milk In the community with no intervention, Escondido (C), there was a significant decrease in attitude about 1% milk. In both communities with the marketing only intervention, Colton (I) and Salinas (I), attitude remained the same over the course of the campaign. The significant increase in attitude that was seen in the control community of Stockton, can be explained again by the heavy sampling of WIC participants and the nutrition education class these respondents received about 1% milk and calcium during the campaign.
Evaluation of the marketing + promotora intervention shows that the mean rank post intervention attitude scores of the intervention community, Colton, are significantly higher than the control community, Escondido (Table 6) suggesting that the promotora classes and the marketing efforts may have positively affected the respondents’ attitudes about consuming 1% milk. Milk consumption behavior
In terms of dietary behavior with the marketing only campaign (Table 7), no changes were seen in quantity of milk consumed in Salinas (I) or in either control communities. A significant difference was seen, however, in the intervention community of Colton when the pre and post-campaign distributions of quantity of milk were compared. A greater number of post respondents stated they consumed 1 or 1.5 glasses of milk yesterday, and fewer post respondents stated they consumed no glasses of milk. Evaluation of the type of milk consumed for the marketing only campaign (Table 8), showed that there was a significant change in Salinas, an intervention community, pre compared to post-campaign. A fewer proportion of respondents stated they consumed whole milk and a greater proportion of respondents stated they consumed lower fat milks (2%, 1% or non-fat) after the campaign.
Evaluation of the marketing + promotora intervention shows a significant difference between Colton (I) and Escondido (C) with respect to quantity and type of milk consumed post campaign. The percent of respondents in Colton (I) who stated they drank 3 or more glasses of

18
milk post campaign was two times greater than their controls in Escondido (Figure 1). In addition, the proportion of post campaign respondents in Colton (I) who consumed 1% milk was eight times greater than the control community of Escondido. Moreover, the percent of respondents in Escondido (C) who consumed whole milk was 11 times greater than Colton (I) (Figure 2).
Qualitative Feedback from Promotora Participants A sample of promotora participants were asked a series of opened-end questions during the phone interview to understand what they liked most about the promotora sessions and what changes they had made as a result of participating in the program. The participants clearly valued the participatory hands-on approach of the classes. What they liked best about the program fell into three general categories: dietary skills and information, exercise skills, and information about osteoporosis. The majority of the respondents also self-reported that they were able to make positive changes in eating (52%) or physical activity (46%) as a result of the four bone health educational sessions they attended. The predominant change was a switch from a higher fat milk to a lower fat milk (65%), with 59% responding that they and their families have tried to drink more milk as result of their participation in the promotora sessions. CONCLUSION
Marketing Only Campaign
The marketing only intervention employed by the California Bone Health Campaign (CBHC) appears to be ineffective for improving knowledge about 1% milk and osteoporosis, attitude about 1% milk, and consumption of 1% milk in the intervention communities (pre/post) compared to the marketing + promotora campaign among this population of Latino women. It should be noted however, that survey respondents in the marketing only campaign intervention communities started with high mean knowledge scores at pre test (Colton 3.89 and Salinas 3.73 out of a possible 5). Attitude scores decreased in one control community, remained about the same in the two intervention communities and increased in the control community of Stockton. Respondents in Stockton were heavily sampled from WIC clinics and received a WIC calcium consumption intervention during this campaign.
The effectiveness of the marketing only campaign was more difficult to evaluate due to several factors that compromised the ability to detect effects. These factors included the use of convenience samples, with Stockton’s (C) sample heavily weighted with WIC participants, a lack of coordination in recruiting participants from the same locations at pre- and post-intervention, and the comparability of intervention and control communities. Marketing + Promotora Campaign
The marketing + promotora strategy of the CBHC appears to have been a more effective approach for improving knowledge, attitude, and consumption of 1% milk than the marketing only intervention. While comparisons were made only post intervention, strong, positive differences between Colton (I) and Escondido (C) on knowledge, attitude and behavior suggest the promotora component was a valuable addition to elicit change in the measured outcomes.
The responses of the promotora education session participants in Colton (I) to open-ended questions about their experiences confirmed that the curriculum and the strategies used by the CBHC were well received. Promotora session participants appeared to value the practical how-to information the most, with several participants mentioning specific learning activities that they enjoyed.

19
REFERENCES National Osteoporosis Foundation. (February 2002). America’s Bone Health: the state of osteoporosis and low bone mass in our nation. Washington DC. Alaimo, K., McDowell, M., Briefel, R., Bischof, A., Caughman, C., Loria, C., & Johnson, C. (1994). Dietary intake of vitamins, minerals, and fiber of persons ages 2 months and over in the United States: Third National Health and Nutrition Examination Survey, Phase 1, 1988-91. (Advance Data No. 258). U.S. Department of Health and Human Services, Centers for Disease Control and Prevention, National Center for Health Statistics. Forester, S.B., Wu, S., Gregson, J., Hudes,M., & Fierro, M. P. (1999). California Dietary Practices Survey: Overall trends in healthy eating among adults, 1989-1997, A call to action, Part 2. Sacramento, California: California Department of Health Services. Andreasen, A., R. (1995). Marketing Social Change. p.7. Jossey-Bass: San Francisco. Reger B, Wootan MG, Booth-Butterfield S. (1999). Using mass media to promote healthy eating: A community-based demonstration project. Prev Med 29(5): 414-421. Weschler H, Wernic SM. (1992). A social marketing campaign to promote low-fat milk consumption in an inner-city Latino community. Public Health Reports 107(2): 202-207.

20
APPENDIX A

21
CALIFORNIA BONE HEALTH CAMPAIGN
INTERVENTION QUESTIONNAIRE
Administered in Spanish by telephone interview
INTRODUCTION Hi, My name is ____________________. I work with Professor Patricia Crawford from the Department of Nutritional Sciences at the University of California at Berkeley. I am calling you because you have agreed to take part in an evaluation research study of the California Bone Health Campaign. This study will provide information that will help us determine if the California Department of Health’s California Bone Health Campaign is successful in changing dietary behaviors that promote bone health, among Latino women and their families. This interview will take about 10-15 minutes. Your participation is completely voluntary, and your responses will be kept strictly confidential. As a token of our appreciation for your time and effort, you will receive a small gift for this interview. May we proceed with the interview?

22
1. How many glasses of milk, about this size (SHOW MODEL OF 8-OZ GLASS FOR MARKETING CAMPAIGN RESPONDENTS ONLY), did you consume yesterday (as a beverage; with cereal; in licuado, chocolate milk, café latte; or in any other way)? o None o One o 1.5 o 2.0 o 3 glasses or more
1a. Did you use: o whole milk o 2% milk o 1% milk or o non-fat milk?
Please tell me if you think the following statements are TRUE or FALSE. If you do not know the answer, lease say you “don’t know”
2. Drinking one glass of milk each day gives a woman all the calcium she needs. o True o False o ___________ 3. Milk, cheese and other dairy products are the richest sources of calcium. o True o False o ___________ 4. Corn tortillas and beans are good sources of calcium. o True o False o ___________ 5. Os teoporosis is a condition of weak bones that may break easily. o True o False o ___________ 6. Osteoporosis may be prevented by getting enough calcium early in life. o True o False o ___________
If none, SKIP to Question #2.
INTERVIEWER: PLEASE DO NOT OFFER ‘Maybe’ AND ‘Don’t know’ AS OPTIONS.

23
The following statements refer to you. Please tell me if you agree, somewhat agree or disagree with the following statements: 7. If you were offered a choice of milk or soda, you will usually choose soda. o Agree o Somewhat agree o Disagree 8. Consuming one more glass of 1% everyday milk will help you strengthen your bones and improve your overall health. o Agree o Somewhat agree o Disagree 9. 1% milk is not as nutritious as whole milk. o Agree o Somewhat agree o Disagree 10. The taste of 1% milk is acceptable to you. o Agree o Somewhat agree o Disagree 11. Milk is for everybody, not just for kids. o Agree o Somewhat agree o Disagree 12. There are easy ways to include milk in the daily diet. o Agree o Somewhat agree o Disagree 13. If you were to go to the grocery store today, you would be able to easily recognize 1% milk. o Agree o Somewhat agree o Disagree

24
14. Which type of milk have you been consuming most frequently over the past six months?
o Whole milk ……………………… (GO TO #15a) o 2% (reduced-fat) milk …………… (GO TO #15a) o 1% (low-fat) milk ………………….. (SKIP TO #16) o non-fat milk ……………………….. (SKIP TO #17) o Other (specify): _____________ ….. (GO TO #15a)
Please answer Yes or No to the following questions. 15a. Do you intend to include 1% milk in your diet in the next 30 days or so?
o Yes o No
15b. Would you consider including 1% milk in your diet in the next 6 months?
o Yes o No
16. Have you been consuming 1% milk everyday or nearly everyday for more than six months?
o Yes o No
17. Have you ever participated in the WIC program?
o Yes o No
18. Have you ever attended any nutrition classes offered in your community, other than those offered by WIC?
o Yes o No
If Yes, SKIP to Question
Read responses slowly
Yes or No, SKIP to Question #17

25
19. Have you recently heard any information about:
a) osteoporosis o Yes o No b) consuming more 1% milk o Yes o No c) the importance of calcium o Yes o No
20. Where did you hear or see these messages (this message)? You may choose more than one answer.
o Radio o Brochures o TV o Newspapers o Poster o Church o Friend o Promotora/Consejera o Grocery Store o Other: ________________
21. Over the past 3-4 months, how often have you heard these messages over the radio?
o Never oAlmost every day o 2-3 times a week o Once a week o Less than once a week
If ‘No’ to a, b AND c, SKIP To Question #22
Read each statement one at a time and obtain a response before continuing to the next
Read responses slowly
Read responses slowly

26
22. How many children do you have? _________ (INCLUDE STEP-CHILDREN)
IF ONLY ONE CHILD:
22a. Do you have a girl or a boy?
o F o M
How old is she(he)? ______ years
Does he/she consume milk?
o Yes o No SKIP to Question # 23
IF YES: Please tell me if he/she consumes: o at least 2-3 glasses of milk/day
o 1-1.5 glasses/day o < 1 glass/day
What type of milk does he/she consume most frequently?
o Whole milk o 2% (reduced-fat) milk o 1% (low-fat) milk o non-fat milk o Other (specify): ___________
IF MORE THAN ONE CHILD: 22b. Do any of your children consume milk?
oYes oNo SKIP to Question #23
What are the ages of your children?
For each of your children who consumes milk, please tell me if he/she consumes at least 2-3 glasses each day, 1-1.5 glasses each day or less than one glass each day.
What type of milk does he/she consume most frequently?
__ F years __ M _____
o ≥ 2-3 glasses of milk/day
o 1-1.5 glasses/day
o < 1 glass/day
o Whole milk o 2% milk
o 1% milk o Non-fat milk
o Other: _______________________ __ F years __ M _____
o ≥ 2-3 glasses of milk/day
o 1-1.5 glasses/day
o < 1 glass/day
o Whole milk o 2% milk
o 1% milk o Non-fat milk
o Other: _______________________ __ F years __ M _____
o ≥ 2-3 glasses of milk/day
o 1-1.5 glasses/day
o Whole milk o 2% milk
o 1% milk o Non-fat milk

27
o < 1 glass/day o Other: _______________________ __ F years __ M _____
o ≥ 2-3 glasses of milk/day
o 1-1.5 glasses/day
o < 1 glass/day
o Whole milk o 2% milk
o 1% milk o Non-fat milk
o Other: _______________________ __ F years __ M _____
o ≥ 2-3 glasses of milk/day
o 1-1.5 glasses/day
o < 1 glass/day
o Whole milk o 2% milk
o 1% milk o Non-fat milk
o Other: _______________________ 23. During the past few months, have you made any effort to increase the amount of milk that you usually consume? o Yes o No
23a. Did you make an effort to especially increase your consumption of 1% milk?
oYes o No 23b. Can you tell us if any of the following reasons explained why you increased your intake of 1% milk?
o you have heard messages on the radio about the importance of milk for bones o you have seen educational materials about the importance of milk for bones o you were motivated by promotional activities in a grocery store:
What type of activities? ______________________________________
o you were motivated by promotional events in the community:
Which event? ______________________________________
o you were advised by a doctor/nurse/other health professional o you attended the “Strong Bones, Health Families” classes o some other reason: _______________________________________
23c. What type of milk did you make effort to increase?
o Whole milk o 2% milk o Non fat milk o Just any type of milk
SKIP to Question #24
Read responses one at a time Read all responses

28
24c. Would it be a problem if you had to spend another $4 a week on an extra gallon of milk for your family?
o Probably Yes o Probably No o Maybe

29
Please tell me if you think the following statements are TRUE or FALSE 25. By consuming 2-3 servings of milk, yogurt, and cheese every day, we will get the recommended amount of calcium. o True o False o Maybe o Don’t know 26. A woman with osteoporosis may start to lose height.
o True o False o Maybe o Don’t know
27. The reduction of estrogen during menopause results in bones becoming thinner and weaker in all women.
o True o False o Maybe o Don’t know 28. There is nothing we can do to prevent osteoporosis.
o True o False o Maybe o Don’t know
29. Taking calcium is not important once menopause is reached.
o True o False o Maybe o Don’t know 30. For healthy bones, it is also important to get enough exercise. o True o False o Maybe o Don’t know
31. One way to screen for osteoporosis is to get a bone density test.
o True o False o Maybe o Don’t know 32. Have you increased your physical activity level during the past three months? o Yes o No
33. Compared to others your age, how physically active do you think you are? o Much more active o More active o Same o Less Active o Much less active

30
34. Please tell me if each of the following will increase risk for osteoporosis. Yes No Post-menopausal o o
Sedentary life style o o Smoke cigarettes excessively o o Had a hysterectomy o o
Had both ovaries removed o o Drink alcohol excessively o o Eating lots of sugar o o Diet that is low in calcium o o
Read responses slowly

31
In a few months, you will be invited to participate in a similar interview. May we make an attempt
to reach you by telephone then? YES NO
Name: ____________________________________________________
Address: ________________________________________________________________
City: _______________________________________ Zip Code: _______________
Phone (Day): (____) ___________________ Phone (Eve): (_____) _______________
If YES: Would you mind giving us the name, address and telephone number of someone who would know where you are if you move?
Name: ____________________________________________________
Address:
________________________________________________________________ City: _______________________________________ Zip Code: _______________
Phone (Day): (____) ___________________ Phone (Eve): (_____) _______________
THANK YOU VERY MUCH FOR YOUR TIME AND EFFORT! Again, my name is ________ (interviewer’s name). If you have any questions, please call me
at 510-642-3589. You may also reach Professor Patricia Crawford, the Principal Investigator of this research study at the same number, 510-642-3589.
For interviewer: Interviewer’s Initials: _________ Date of interview: _____/_____/______ Duration of interview: ______ Comments: __________________________________________________________ For data entry assistant: Data entry assistant’s Initials: _______ Date of data entry: _______________________ Problems encountered (please flag questionnaire): ________________________________________

32
APPENDIX A-2
Open-ended questions asked of promotora participants who
responded to the post-intervention phone survey

33
35. How much did you learn about bone health from your classes? Would you say you learned
o a lot
o some
o a little or
o very little
36. What would you say you liked the most about the Huesos Fuertes. Familia Saludable.
program?
37. What would you say you liked the least about the Huesos Fuertes. Familia Saludable.
program?
38. What changes have you and your family made as a result of the classes offered by
Promotoras?
39. Would you recommend this program to your friends, young or old?
o Yes o No