Embed Size (px)
Citation preview

- ~..:1.
A. Hahne, J. Callies, A. Lefebvre & B. ChristensenfRS Project Division, ESTEC, Noordwijk, The Netherlands
R. Hoekstra, L. Fontijn, C. Olij, E. Zoutman & G. NutzelTPD-TNO, De(fr, The Netherlands
Calibration of the GOME Instrument for ERS-2
Abstract The Global Ozone Monitoring Experiment (GOME) is an optical spectrometer tobe flown on the second European Remote-Sensing Satellite. ERS-2 1• Its main taskwill be to measure the ozone content of the atmosphere and to monitor its long-termvariation. Ozone is a trace gas of vital importance to mankind. as it absorbs theharmful ultraviolet radiation emitted by the Sun and prevents it from reachingthe Earth's surface. This absorption occurs in an ozone layer concentrated in thestratosphere. at altitudes of between 18 and 40 km. which is threatened by humanactivities. in particular by the release of Chloro-Fluoro-Carbons (CFCs) used in spraycans. refrigerators and foams. and as a cleaning agent. Ozone depletion is believed tobe taking place at a rate of about 0.3 '7c per year.The reliable measurement of such a small global trend against the background of
normal spatial and temporal variability. places high demands on the instrument'saccuracy and stability. To meet with these requirements. the instrument needs thoroughcalibration and characterisation. both on the ground and in orbit.The breadboard model of the GOME instrument - which is functionally fully
representative including the on-board means of calibration - has been subjected to adry calibration run on the ground. and the test results arc reported here.
ESA Journal 1994 Vol. 18 119

1. Calibrationrequirements and theon-board calibration
concept
* Ideally. the wavelength stability between recor
dings should he 1'100 th of a pixel
Figure I. The spectrometer optics of theGOME instrument
SUN DIFFUSER
CALIBRATIONUNIT
CALIBRATIONLAMP
GRATING #2
GRATING #l
CHANNEL #2
CHANNEL #l
ELECTRONICBOX
The conventional approach for measuring ozone. which is the underlying principleof the American SBUV and TOMS instruments. is the monitoring of upwellingbackscattered radiance at a number of discrete wavelengths. To yield meaningfulresults. the radiometric response of an instrument used in this mode must be knownto better than l 'lc. Because the space environment is known to change the radiometricresponse of the instrument (e.g. by radiation-induced darkening of transmissiveoptics). the means for carrying out on-board calibration with the necessary stahilityhave to be provided to enable re-calibration at regular intervals.
This is normally done by looking at the Sun. which is a rather stable light sourcefor the wavelength range in question. However. because the solar irradiance is severalorders of magnitude higher than the radiance coming from the Earth. the Sun cannotbe used directly. but only via a diffuser. This diffuser attenuates the light to a levelthat falls within the dynamic range of the detection system. and also makes themeasurement path insensitive to the variations in the line-of-sight to the Sun a>function of the seasonal change in the Earth-Sun distance.
As GOME is intended to achieve contin.uity with the long-term records of ozoneconcentrations already accrued by the SBUV and TOMS instruments. this concept hasbeen adopted Ior GOME also. There is. however. an alternative measurement principleknown as 'Differential Optical Absorption Spectroscopy'. which is made possible b)the availability of multi-pixel array detectors capable of recording a continuousspectrum over a large wavelength range. With this technique. a recorded atmosphericspectrum is divided by a solar spectrum. thereby compensating for the Sun's variabilitv(which. of course. also appears in the backscattered light). as well as for the variationsin the optical throughput. To the divided spectrum obtained in this way. the absorptionspectra of ozone and possibly other trace gases arc then fitted. thus providing themeans to retrieve the amounts of the target (absorbing) species.
For this technique to work. the wavelength observations (for both the solar spectrumand the backscattered spectrum from the atmosphere) have to be very accurate .However. launch effects and temperature variations around the orbit prevent thisstability from being achieved. Thus with GOME it is proposed to measure thewavelength shifts with the aid of a calibration lamp. which provides a sufficientnumber of sharp atomic emission lines in each channel to map wavelength -,hiftsaround the orbit and correct for them in the ground processing (Fig. 1r.
NADIR POINT
CHANNELSEPARATOR
GRATING #3
GRATING #4
BEAMSPLITTER
CHANNEL #3
CHANNEL #4
790 NM
120 ESA Journal 1994. Vol. 18

In addition to ihi-, h,1-,ic calibration facility. there arc in-flight provisions for:111casuring the dark current and fixed pattern noise of the detectors and the readoutchaincalibrating the Analogue-to-Digital Converters (ADCs1
- monitoring pixel-to-pixel variabiliry hy illuminating the detectors with LightEmitting Diodes ILED-,1 built into the optical objectives of the four channels
-- monitoring the reflectance of the Sun diffuser. by channelling the light from thewavelength calibration lamp via the diffuser and ratioing the measurements withthe corresponding ones made when the lamp is observed directlyfinally. hy tilting the scan mirror to an angle between 70 and 8.'ic with respectto nadir. it is possible to use the Moon as a calibration target
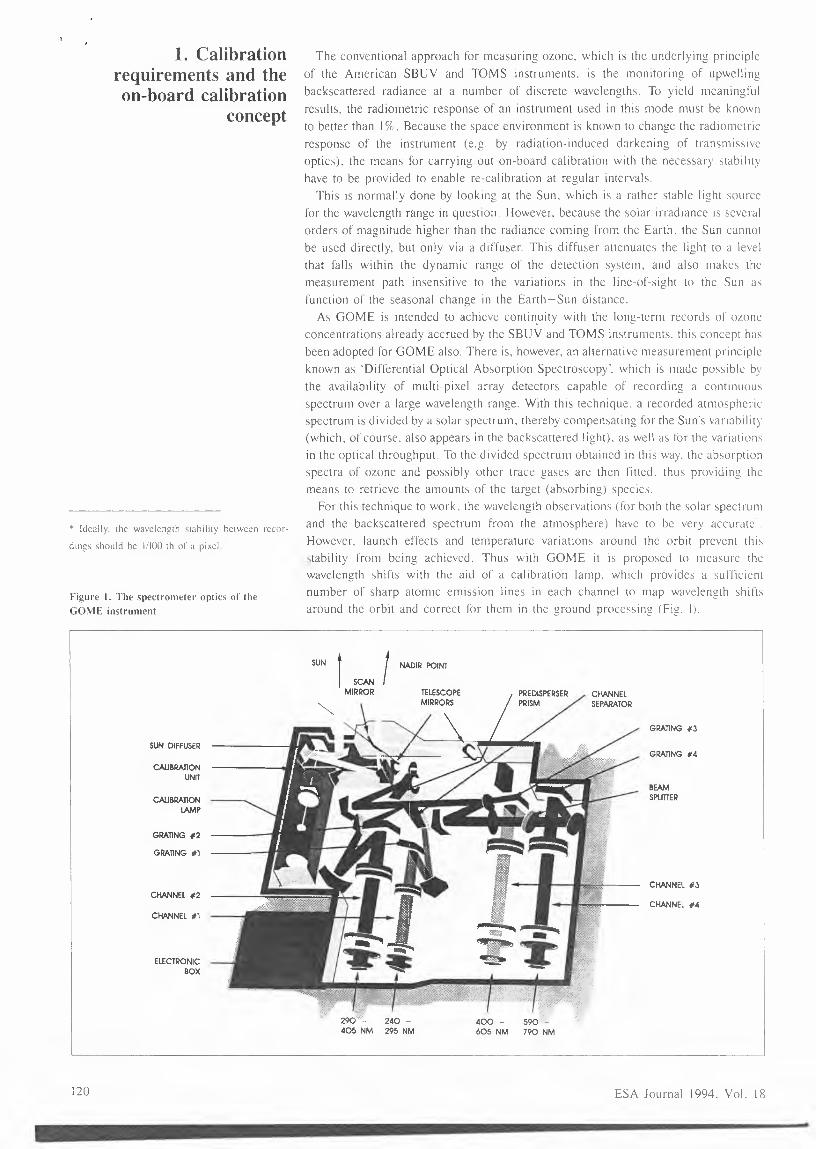
Almost all on-hoard calibration facilities (C\CCpt the LEDs mentioned in the 2. The on-boardprevious section) arc grouped in the Calibration Unit, which is shown in Figure 2. Its calibration unittwo key c lcmcnts arc:
the calibration lamp. and- the Sun diffuser.
2.1. The calibration lampKL'Y requirements for the calibration lamp arc:a number of sharp spectral lines spanning the entire wavelength range observed byGO"v1 E
- a lifetime compatible \\ ith the mission (.'iOO h , with at least 1000 on/off cycles)low power consumption: less than .'i W. including DC/DC conversion lossesa rugged design. as the lamp must be able to withstand both the launch and in-orbitcnv ironmcnts.
The lamp selected i-. a hollow-cathode type. which has already been flown in a similarcontigunuion on several :\ASA missions. The fill-gas is neon. with a platinum cathodewith 10'{ chromium in order to provide some additional lines needed to span theGO'.\IE wavelength range.
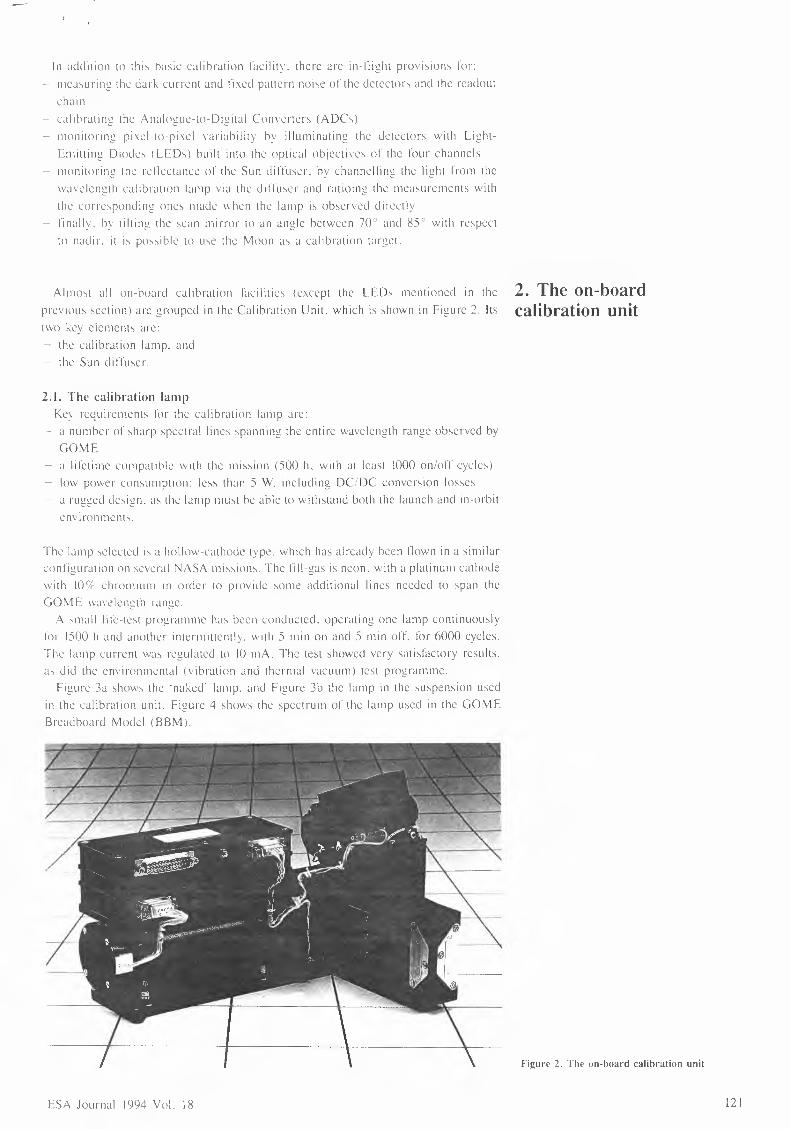
A small life-test programme has been conducted. operating one lamp continuouslytor l.'iOO h and another intermittently. \\ ith .'i min on and .'i min oil. for 6000 cycles.The lamp current was regulated to 10 111A. The test showed very satisfactory results.els did the environmental (\ ibration and thermal vacuum) test programme.
Figure .\a shm\s the 'naked lamp. and Figure .\b the lump in the suspension usedin the calibration unit. Figure -1-shm\s till' spectrum of the lamp used in the GOMEBreadboard '.\1mlel (BBMI.
Figure 2. The on-hoard calibration unit
ESAJournal 199-1-Vol.18 121

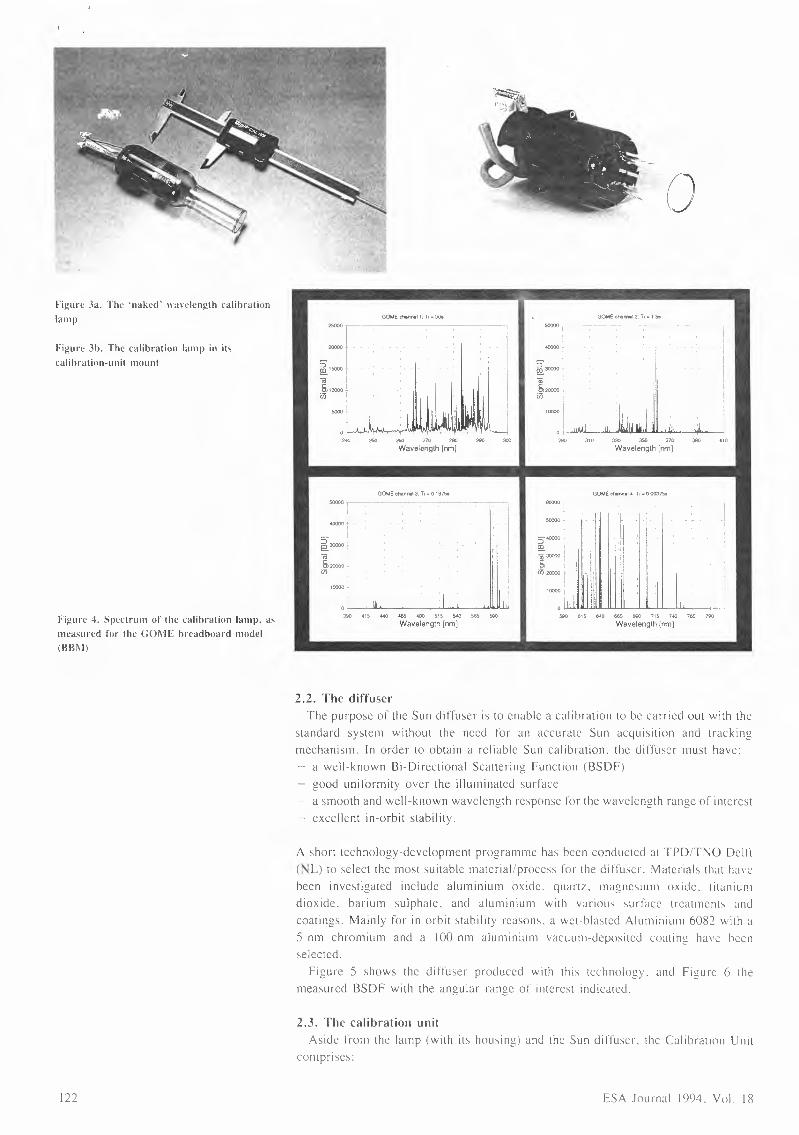
Figure 3a. The 'naked' wavelength calibrationlamp
Figure 3b. The calibration lamp in itscalibration-unit mount
Figure 4. Spectrum of the calibration lamp, asmeasured for the COi\IE breadboard model(BB\I)
122
0
GOMEctwnnet1; 11-:.ius
50000 '
~3'.XJOO: I
i=o:·..~ ··~ ·. 'I~·· •.10000~ ' ' '
~ ' ' ' '0
260 270 200 290 300Wavelength [nm]
310 330 350 370 390Wavelength [nm]
GOME channel 3 T1••0.18756 GOME channel 4• 1r • 0_093Ths50000 -,-----
HJOOO'
50000 '
i1''
t
5'40000
ee.~ 30000 !O>en 20000 •
10000 ;
O·~~~~~~~~~~~~~~~~
390 415 «O -465 "400 515 5-4{) SM 500Wavelength [nm]
590 615 640 665 619() 715 740 765 790
Wavelength [nm]
2.2. The diffuserThe purpose of the Sun diffuser is to enable a calibration to he carried out with the
standard system without the need for an accurate Sun acquisition and trackingmechanism. In order to obtain a reliable Sun calibration. the diffuser must have:
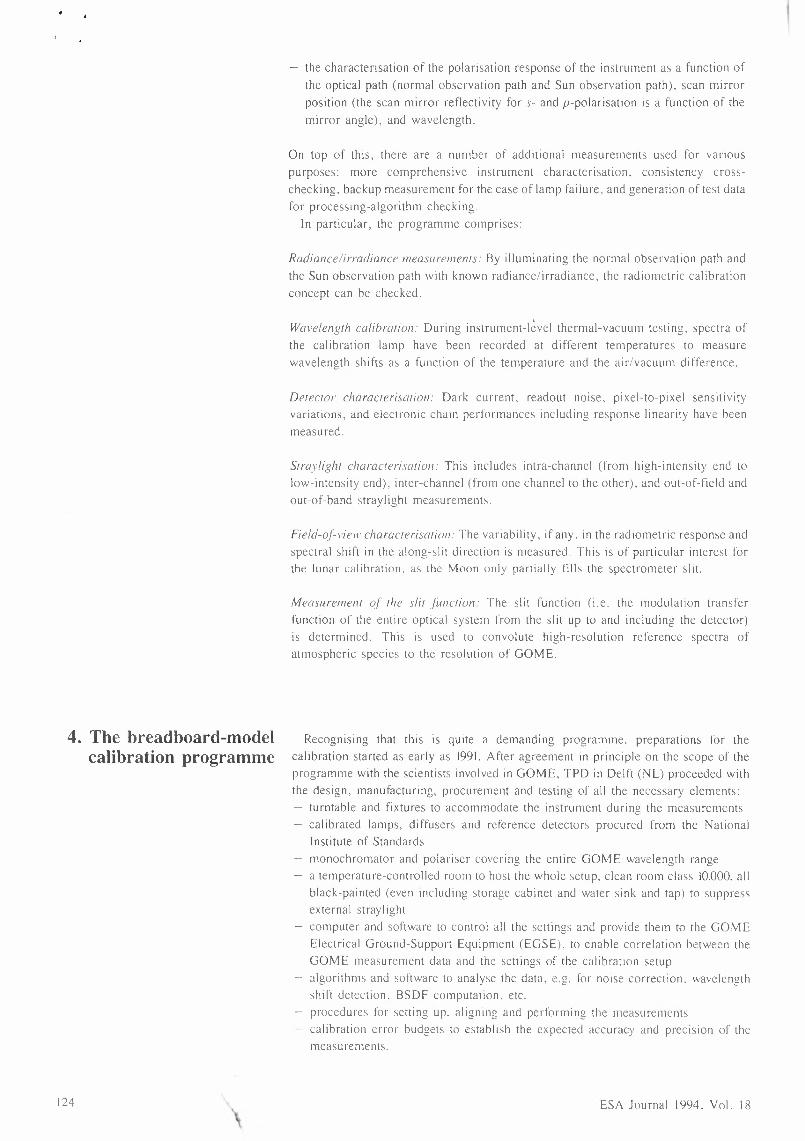
a well-known Bi-Directional Scattering Function (BSDF)good uniformity over the illuminated surfacea smooth and well-known wavelength response for the wavelength range of interestexcellent in-orbit stahility.
A short technology-development programme has been conducted at TPD/TNO Delft(NL) to select the most suitable material/process for the diffuser. Materials that ha\ cbeen investigated include aluminium oxide. quartz. magnesium oxide. titaniumdioxide. barium sulphate. and aluminium with various surface treatments andcoatings. Mainly for in-orbit stability reasons. a wet-blasted Aluminium 6082 with a5 nm chromium and a 100 nm aluminium vacuum-deposited coating have beenselected.
Figure 5 shows the diffuser produced with this technology. and Figure 6 themeasured BSDF with the angular range of interest indicated.
2.3. The calibration unitAside from the lamp (with its housing) and the Sun diffuser. the Calibration Unit
comprises:
ESA Journal 1994. Vol. 18

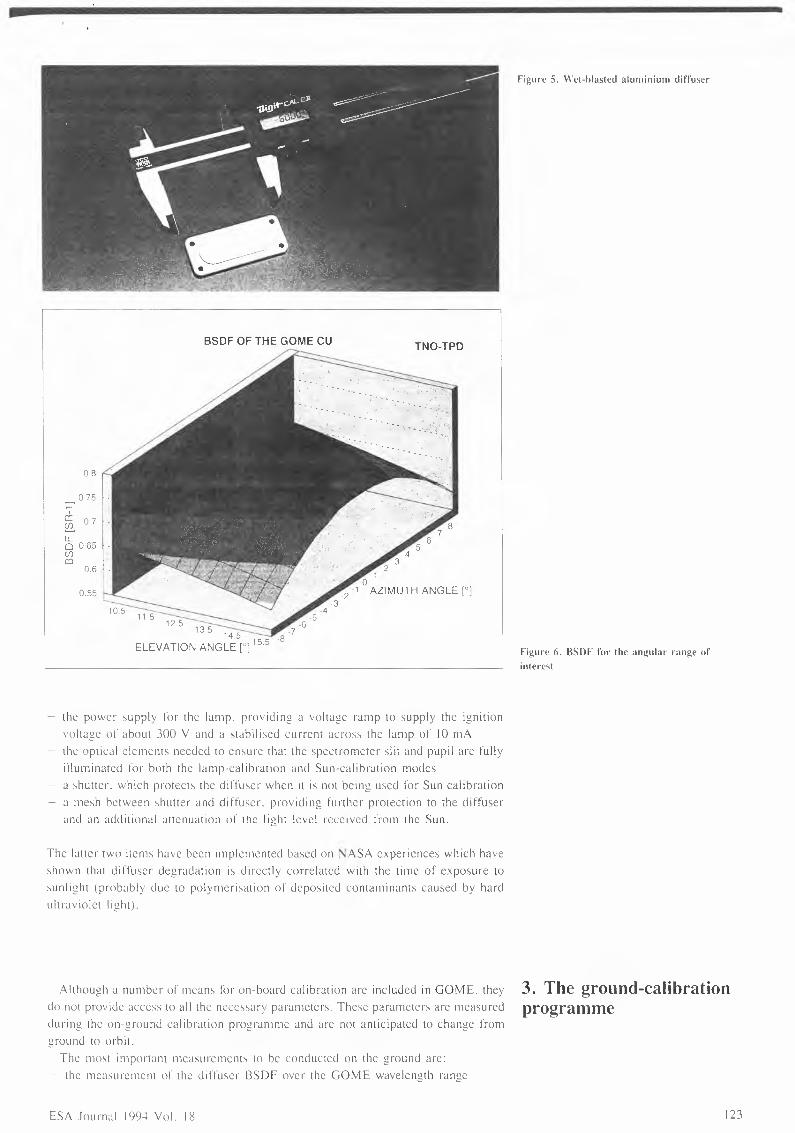
Figure 5. \\ et-blasted aluminium diffuser
BSDF OF THE GOME CU TNO-TPD
I) 6
0.8
0.75
r± 0 7(f)
6 0.65(/)CD
0.550AZIMUTH ANGLE[']
11-5--------~12.5 1-:is------=::::
14 5ELEVATION ANGLE['] 15·5
---·------------_J Figure <1. BSDF for the angular range ofinterest
the power supply for the lamp. providing a voltage ramp to supply the ignitionvoltage of about .\()() V and a stabilised current across the lamp of IO mAthe optical clements needed to ensure that the spectrometer slit and pupil arc fullyilluminated for both the lamp-calibration and Sun-calibration modesa shutter. which protects the diffuser when it is not being used for Sun calibrationa mesh between shutter and diffuser. providing further protection to the diffuserand an additional attenuation of the light level received from the Sun.
The latter two items have been implemented based on :'>JASA experiences which haveshown that diffuser degradation is directly correlated with the time of exposure tosunlight (probabl , due to polymerisation of deposited contaminants caused by hardultraviolet Iight).
Although a number of means for on-hoard calibration arc included in GOME. they 3. The ground-calibrationdo not prm idc access to all the necessary parameters. These parameters arc measured programmeduring the on-ground calibration programme and arc not anticipated to change fromground to orbit.
The most important measurements to he conducted on the ground arc:- the measurement of the diffuser BSDF mer the G0\1E wavelength range
ES.~ Journal IYY.+ \'ol_ IX 123

the characterisation of the polarisation response of the instrument as a function ofthe optical path (normal observation path and Sun observation path). scan mirror
position (the scan mirror reflectivity for s- and p-polarisation is a function of themirror angle). and wavelength.
On top of this. there are a number of additional measurements used for variouspurposes: more comprehensive instrument characterisation. consistency crosschecking. backup measurement for the case of lamp failure. and generation of test datafor processing-algorithm checking.In particular. the programme comprises:
Radiance/irradiancc measurements: By illuminating the normal observation path andthe Sun observation path with known radiance/irradiance, the radiometric calibrationconcept can be checked.
Wavelength calibration: During instrument-l~vel thermal-vacuum testing. spectra ofthe calibration lamp have been recorded at different temperatures to measurewavelength shifts as a function of the temperature and the air/vacuum difference.
Detector characterisation: Dark current. readout noise. pixel-to-pixel sensitivityvariations. and electronic chain performances including response linearity have beenmeasured.
Straylight characterisation: This includes intra-channel (from high-intensity end tolow-intensity end). inter-channel (from one channel to the other). and out-of-field andout-of-band straylight measurements.
Field-of- i·ieH· characterisation:The variability. if any. in the radiometric response andspectral shift in the along-slit direction is measured. This is of particular interest forthe lunar calibration. as the Moon only partially fills the spectrometer slit.
Measurement of the slit [unction: The slit function (i.e. the modulation transferfunction of the entire optical system from the slit up to and including the detector)is determined. This is used to convolute high-resolution reference spectra ofatmospheric species to the resolution of GOME.
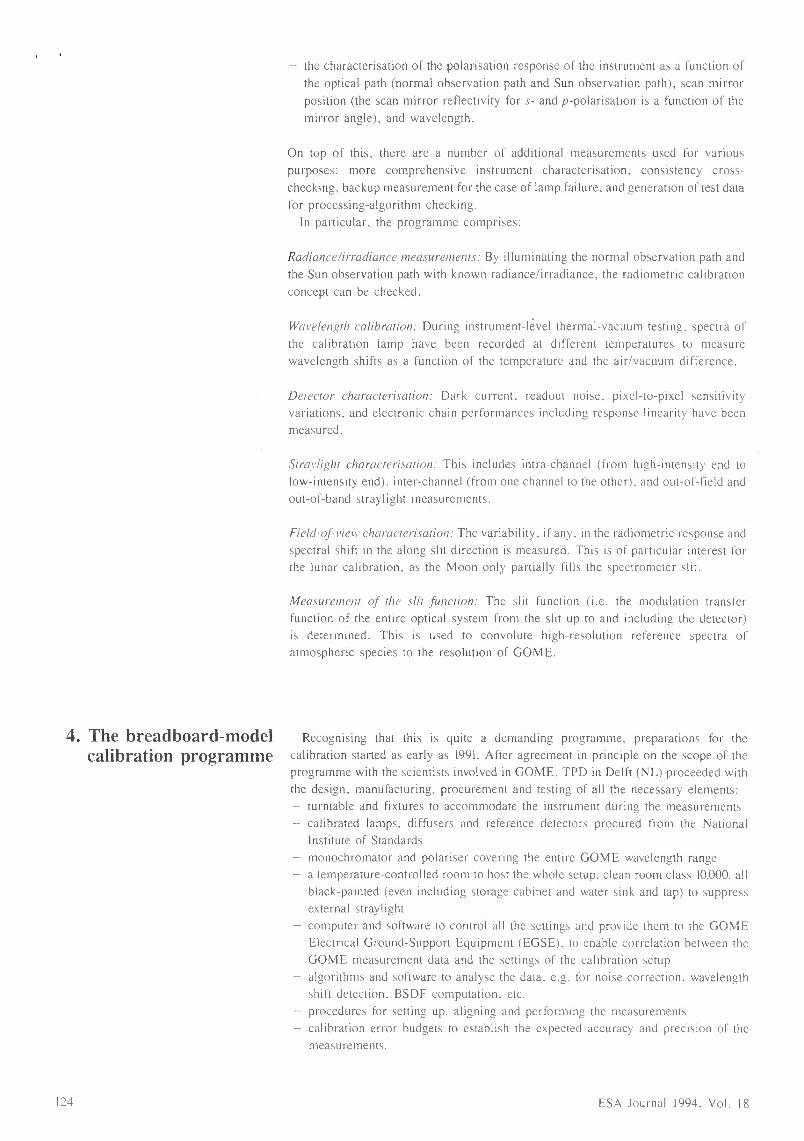
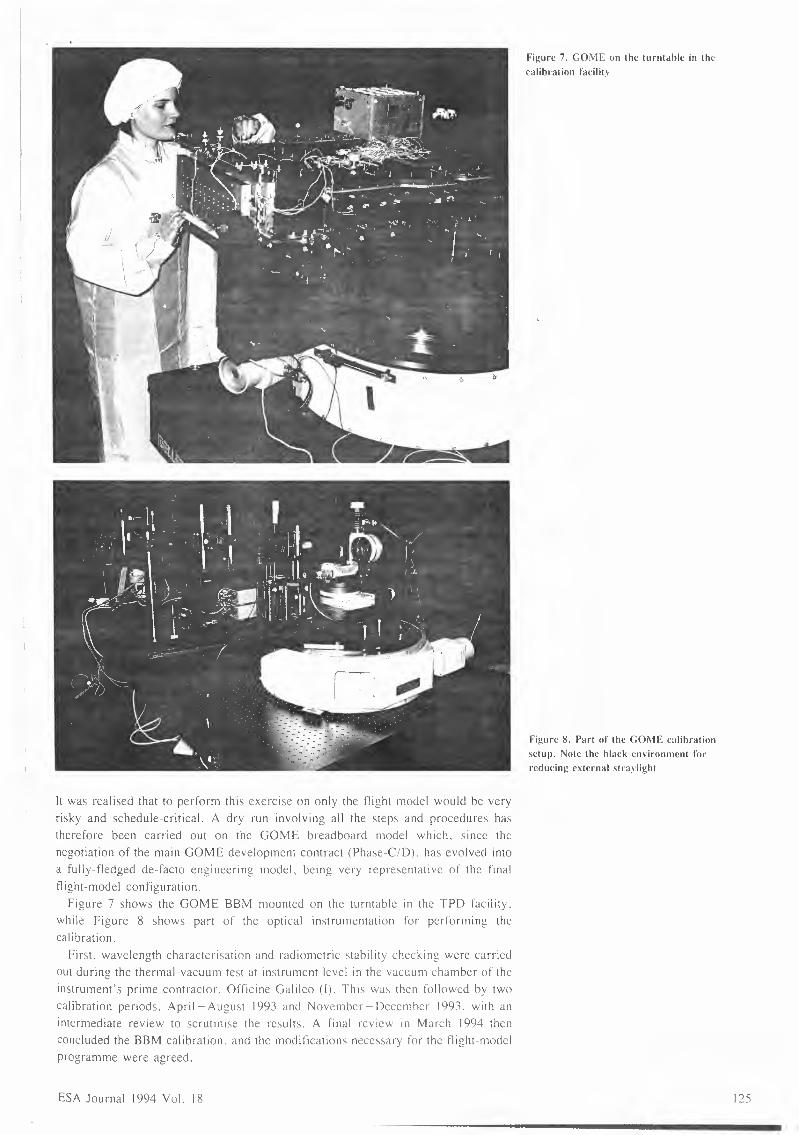
4. The breadboard-model Recognising that this is quite a demanding programme. preparations for thecalibration programme calibration started as early as 1991. After agreement in principle on the scope of the
programme with the scientists involved in GOME. TPD in Delft (NLJ proceeded withthe design. manufacturing. procurement and testing of all the necessary elements:
turntable and fixtures to accommodate the instrument during the measurementscalibrated lamps. diffusers and reference detectors procured from the NationalInstitute of Standardsmonochromator and polariser covering the entire GOME wavelength rangea temperature-controlled room to host the whole setup. clean room class 10.000. allblack-painted (even including storage cabinet and water sink and tap) to suppressexternal straylightcomputer and software to control all the settings and provide them to the GOMEElectrical Ground-Support Equipment <EGSEJ. to enable correlation between theGOME measurement data and the settings of the calibration setupalgorithms and software to analyse the data. e.g. for noise correction. wavelengthshift detection. BSDF computation. etc.procedures fix setting up. aligning and performing the measurementscalibration error budgets to establish the expected accuracy and precision of themeasurements.
124 ESA Journal 1994. Vol. 18

It was realised that to perform this exercise on only the flight model would be veryrisky and schedule-critical. A dry run involving all the steps and procedures hastherefore been carried out on the GOME breadboard model which. since thenegotiation of the main GOME development contract (Phase-CID). has evolved intoa fully-fledged de-facto engineering model. being very representative of the finalflight-model configuration.
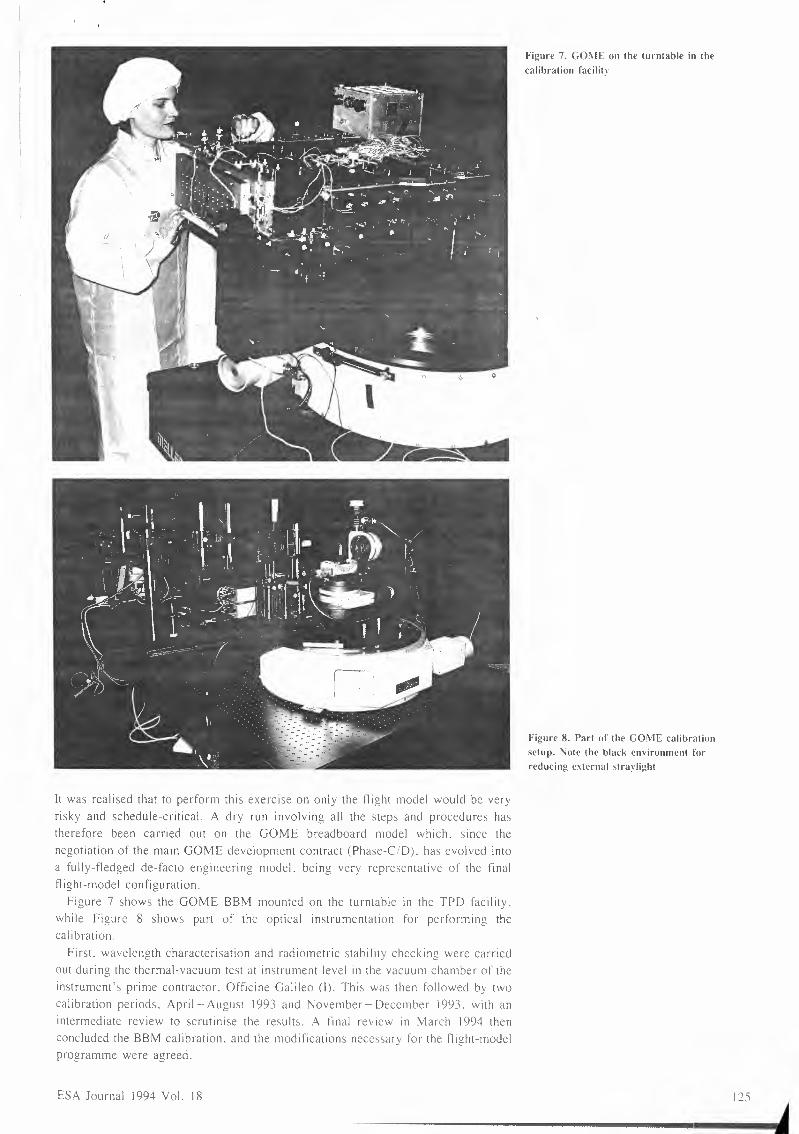
Figure 7 shows the GOME BBM mounted on the turntable in the TPD facility.while Figure 8 shows part of the optical instrumentation for performing thecalibration.
First. wavelength characterisation and radiometric stability checking were carriedout during the thermal-vacuum test at instrument level in the vacuum chamber of theinstrument's prime contractor. Officine Galileo (I). This was then followed by twocalibration periods. April-August 1993 and November- December 1993. with anintermediate review to scrutinise the results. A final review in March 1994 thenconcluded the BBM calibration. and the modifications necessary for the flight-modelprogramme were agreed.
ESA Journal 1994 Vol. 18
Figure 7. GO:\IE on the turntable in thecalihration facility
Figure 8. Part of the C;O:\IE calibrationsetup. '\ote the black environment forreducing external stra~ light

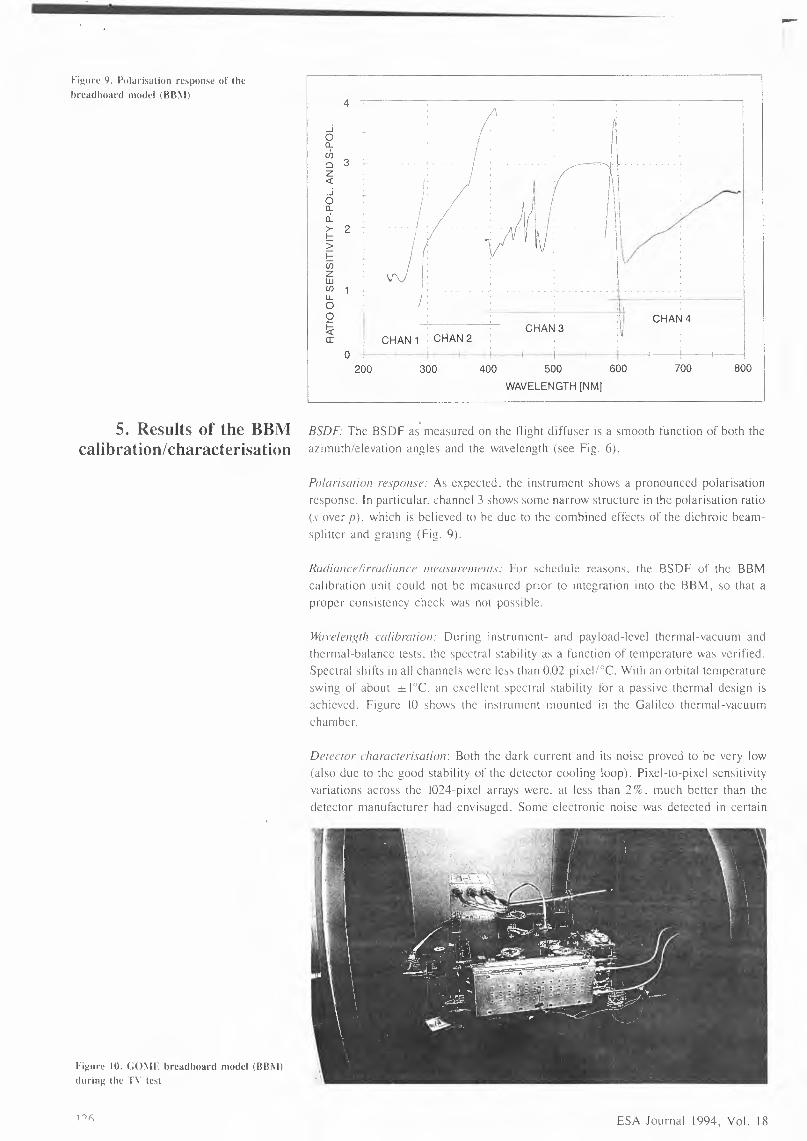
Figure 9. Polarisation response of thehrcadbnard model (BB\I)
4
_J00...ch0 3z<(_j00...c:_~ 2>i==Uizw(/)LL00~a:
II
'vv
CHAN 1 CHAN2-- !0 -+---1 f--
700 800200 300 400 500 600WAVELENGTH[NM]
5. Results of the BBM BSDF The BSDF as measured on the flight diffuser is a smooth function of both thecalibration/characterisation azimuth/elevation angles and the wavelength (sec Fig. 6).
Figure 10. <;O\IE hreadboard model (BB\liduring the TV test
Polarisation response: As expected. the instrument shows a pronounced polarisationresponse. In particular. channel 3 shows some narrow structure in the polarisation ratio(.1 over /1). which is believed to be due to the combined effects of the dichroic beamsplitter and grating (Fig. 9).
Radiancc/irradiancc 111c11stirc11w111.1:For schedule reasons. the BSDF of the BBMcalibration unit could not be measured prior to integration into the BBM. so that aproper consistency check was not possible.
1#11'£'/cngthcalibration: During instrument- and payload-level thermal-vacuum andthermal-balance tests. the spectral stability as a function of temperature was verified.Spectral shifts in all channels wen: less than 0.02 pixel/PC. With an orbital temperatureswing of about ± l0C. an excellent spectral stability for a passive thermal design isachieved. Figure 10 shows the instrument mounted in the Galileo thermal-vacuumchamber.
Detector characterisation: Both the dark current and its noise proved to be very low(also due to the good stability of the detector cooling loop). Pixel-to-pixel sensitivityvariations across the 1024-pixcl arrays were. at less than 2% . much better than thedetector manufacturer had envisaged. Some electronic noise was detected in certain
ESA Journal 1994. Vol. 18


readout situations. This was due to the ringing of the leading edge of the strobe pulseand to interference with the read-out of a temperature sensor. Both problems have
been fed back into the instrument design and should be solved for the flight model.
Straylight characterisation: Quite detailed investigations were necessary to clarify theobserved levels of straylight. A path for external straylight was identified and theproblem solved via more and improved instrument internal baffling. Inter-channelstraylight proved to be low and presented no problem.
More crucial was the intra-channel straylight, particularly that in channel 2. whereat the short-wavelength end a roll-off of the signal level (by three orders of magnitude)presented a significant problem. Multiple reflections between the detector and theobjective lenses and the gratings. respectively. were identified as the major cause. Inchannels 3 and 4 the problem could he resolved by the provision of improved antirctlection coatings on the lenses and by slightly tilting the gratings. For channel 2.this would not have been sufficient and so. in consultation with the GOME scientists.it was decided to move the wavelength split between channels I and 2 to a highervalue. thereby safeguarding the important channel 2. hut sacrificing the performanceof channel I slightly. The problem was alleviated by measuring stray light levels onsome (so far unused) pixels. enabling some correction to be made for straylight in theground processing.
Field-of 1·ie\\· characterisationThe design parameters for the GOME FOY arc 0.14° x 2.8°. Under normal
observational conditions. the entire slit and the entire GOME pupil are illuminated.However. when the Moon is observed. only a fraction of the slit is illuminated. Forthat reason. several scans have been made of the FOY by using collimated light asinput for the GOME telescope. These measurements provide information on:
actual dimensions of the FOYout-of-field scattered Iightinfluence on radiometric response and on wavelength scale when only a fractionof the FOY is illuminated.
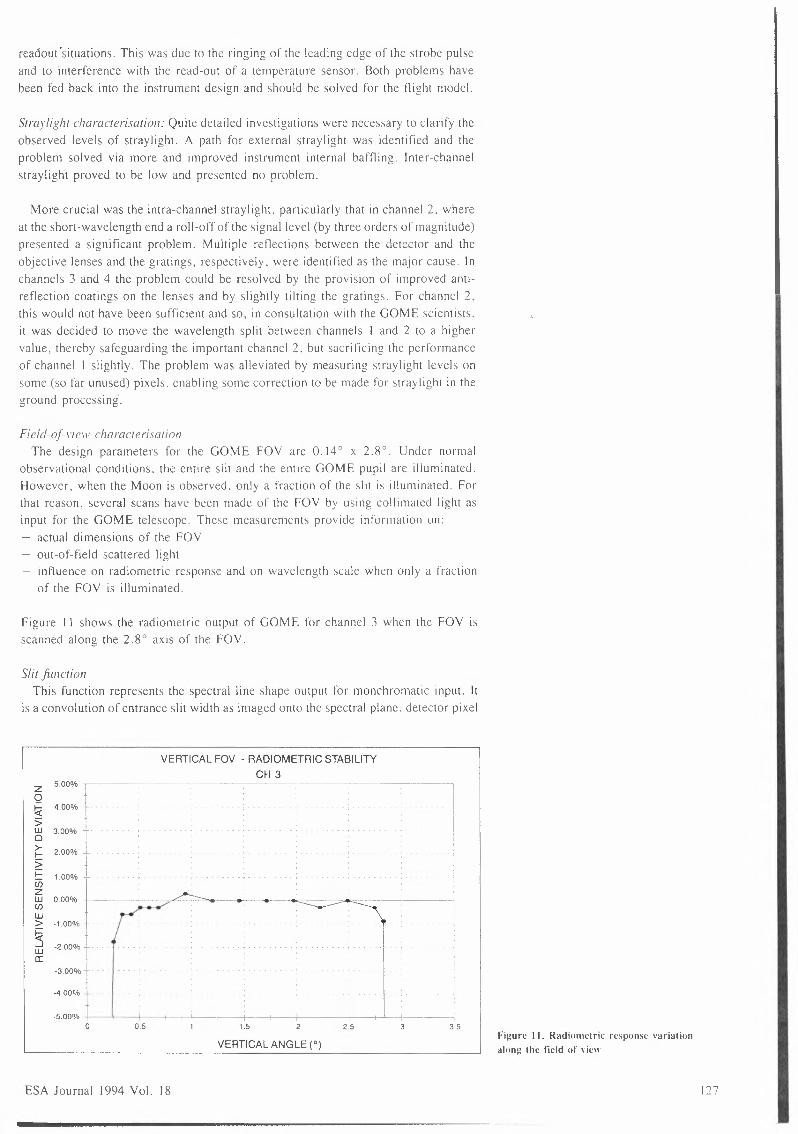
Figure 11 shows the radiometric output of GOME for channel 3 when the FOY tsscanned along the 2.8° axis of the FOY.
Slit functionThis function represents the spectral line shape output for monchromatic input. It
is a convolution of entrance slit width as imaged onto the spectral plane. detector pixel
VERTICAL FOV - RADIOMETRIC STABILITYCH 3
z 5.000/o
0~ 4.000/o
sUJ 3.000/o0>- 2.000/or-si== 1.000/oenzUJ 0.000/o(/)UJ> -1.000/o
~_J -2.000/oUJa:
-3.000/o
-4.000/o
-5.000/o0.5 1.5 2.5 3 3.5
VERTICALANGLE (0)
ESA Journal 1994 Vol. 18
Figure 11. Radiometric response variationalong the field of view
127


Figure 12. Slit function approximation inchannel 4. The thin line is an approximation\I ith a rectangular slit function.the thick line\I ith a sixth-order polynomial
6. Further programme
-APPROXIMATEDSLIT FUNCTION
GOMECHANNEL 4
RECTANGULARAPPR -- ---·
-1 0 2 3
PIXEL NUMBER ON DIODEARRAY
width. optical aberrations and residual effects. superimposed by straylight. Selectedspectral lines from the on-board wavelength calibration lamp can be used as a test casefor different mathematical approximations. In addition. observations have also beenmade using an external mercury lamp. providing spectral lines that are less crowded(and thus better isolated) than the lines of the on-board PtCr/Ne lamp. Two examplesof approximated slit functions arc shown in Figure 12.
Scientists involved with the GOME instrument are presently using the breadboardmodel to measure the reference spectra of ozone. nitrogen dioxide and sulphur dioxide.These spectra will subsequently be used for the retrieval of ozone concentrations.
An irritating feature in atmospheric radiative transfer is the so-called 'ring effect'.which fills in some of the strong Fraunhofer lines in the solar spectrum when it isviewed through the atmosphere. This will be measured as a quasi-absorption spectrumfor use in the ground processing.In consultation with the scientists. priorities have been agreed for the conduct of the
flight-model calibration. which will be performed after GOME has undergonesatellite-level vibration/acoustic testing. in June 1994. Evaluation and processing of theacquired data will then follow. These data will be made available to DLR (0). whichis responsible for the ground processing and the installation and maintenance of thecalibration database.
Reference I. Hahne A. et al. 1993. GOME: A New Instrument for ERS-2. ESA Bulletin No. 73.pp. 22-29.
128
Manuscript received 18 Januarv 1994
ESA Journal 1994. Vol. 18

•
.... ~·A. Hahne, J. Callies, A. Lefebvre & B. ChristensenERS Project Division, ESTEC, Noordwijk, The Netherlands
R. Hoekstra, L. Fontijn, C. Olij, E. Zoutman & G. NiitzelTPD-TNO, De(ft, 77zeNetherlands
Calibration of the GOME Instrument for ERS-2
Abstract The Global Ozone Monitoring Experiment (GOME) is an optical spectrometer tobe flown on the second European Remote-Sensing Satellite. ERS-2 1• Its main taskwill be to measure the ozone content of the atmosphere and to monitor its Jong-termvariation. Ozone is a trace gas of vital importance to mankind. as it absorbs theharmful ultraviolet radiation emitted by the Sun and prevents it from reachingthe Earth's surface. This absorption occurs in an ozone layer concentrated in thestratosphere. at altitudes of between 18 and 40 km, which is threatened by humanactivities, in particular by the release of Chloro-Fluoro-Carbons (CFCs) used in spraycans. refrigerators and foams. and as a cleaning agent. Ozone depletion is believed tohe taking place at a rate of about 0.3'7c per year.The reliable measurement of such a small global trend against the background of
normal spatial and temporal variability. places high demands on the instrument'saccuracy and stability. To meet with these requirements. the instrument needs thoroughcalibration and characterisation. both on the ground and in orbit.The breadboard model of the GOME instrument - which is functionally fully
representative including the on-hoard means of calibration - has been subjected to adry calibration run on the ground. and the test results are reported here.
ESA Journal 1994 Yol. 18 119


1. Calibrationrequirements and theon-board calibration
concept
" Ideally. the wavelength stabilir, between recor
dings should he 1/100 th of a pixel.
Figure I. The spectrometer optics of theGO:\IE instrument
The conventional approach for measuring ozone. which is the underlying principleof the American SBUY and TOMS instruments, is the monitoring of upwellingbackscattered radiance at a number of discrete wavelengths. To yield meaningfulresults, the radiometric response of an instrument used in this mode must be knownto better than l 'lc. Because the space environment is known to change the radiometricresponse of the instrument (c.g. by radiation-induced darkening of transmissiveoptics), the means for carrying out on-board calibration with the necessary stahilityhave to be provided to enable re-calibration at regular intervals.
This is normally done by looking at the Sun. which is a rather stable light sourcefor the wavelength range in question. However. because the solar irradiance is severalorders of magnitude higher than the radiance coming from the Earth. the Sun cannotbe used directly. but only via a diffuser. This diffuser attenuates the light to a levelthat falls within the dynamic range of the detection system, and also makes themeasurement path insensitive to the variations in the line-of-sight to the Sun asfunction of the seasonal change in the Earth-Sun distance.
As GOME is intended to achieve continuity with the Jong-term records of ozoneconcentrations already accrued by the SBUV and TOMS instruments. this concept hasbeen adopted for GOME also. There is. however. an alternative measurement principleknown as 'Differential Optical Absorption Spectroscopy'. which is made possible bythe availability of multi-pixel array detectors capable of recording a continuousspectrum over a large wavelength range. With this technique. a recorded atmosphericspectrum is divided by a solar spectrum, thereby compensating for the Sun's variability(which. of course. also appears in the backscattered light). as well as for the variationsin the optical throughput. To the divided spectrum obtained in this way. the absorptionspectra of ozone and possibly other trace gases arc then fitted. thus providing themeans to retrieve the amounts of the target (absorbing) species.
For this technique to work. the wavelength observations (for both the solar spectrumand the backscattered spectrum from the atmosphere) have to be very accurate .However. launch effects and temperature variations around the orbit prevent thisstability from being achieved. Thus with GOME it is proposed to measure thewavelength shifts with the aid of a calibration lamp. which provides a sufficientnumber of sharp atomic emission lines in each channel to map wavelength shiftsaround the orbit and correct for them in the ground processing <Fig. 1).
SUN DIFFUSER
CALIBRATIONUNIT
CALIBRATIONLAMP
GRATING #2
GRATING #1
CHANNEL #2
CHANNEL #1
ELECTRONICBOX
120
I NADIR POINT
CHANNELSEPARATOR
GRATING #3
GRATING #4
BEAMSPUTTER
CHANNEL #3
CHANNEL #4
605 NM 790 NM
_________j
ESA Journal 1994. Vol. 18
.,


In addition to this basic calibration facility. there arc in-flight prm is ions for:-- measuring the dark current and fixed pattern noise of the detectors and the readout
chain- calibratinp the Analogue-to-Digital Converters (ADCs)- monitoring pixel-to-pixel \ uriahility by illuminating the detectors with Light-
Emitting Diodes (LEDs) built into the optical objectives of the four channels- monitoring the reflectance of the Sun diffuser. by channelling the light from the
wave length calibration lamp via the diffuser and ratioing the measurements withthe corresponding ones made when the lamp is observed directlyfinally. by tilting the scan mirror to an angle between 70' and 8.5" with respectto nadir. it is possible to use the Moon as a calibration target.
Almost all on-hoard calibration facilities (·:\ccpt the LEDs mentioned in the 2. The on-boardprevious section) arc grouped in the Calibration Unit. which is shown in Figure 2. Its calibration unittwo key clements arc:- the calibration lamp. and- the Sun diffuser.
2.1. The calibration lampKey rcquircmcnt-, for the calibration lamp arc:a number of sharp spectral lines spanning the entire wavelength range observed byGO\IEa lifetime compatible with the mission (.500 h. with at least 1000 on/off cycles)low power consumption: less than .5 W. including DC/DC conversion lossesa rugged design. as the lamp must he able to withstand both the launch and in-orbitc 11\ ironmc nts.
The lamp selected i-. a hollow-cathode type. which has already been flown in a similarconfiguration on several '>;ASA mix-.ions. The fill-gas is neon. with a platinum cathode\\ ith JO'; chromium in order to rrm idc some additional lines needed to span theGO\IE wavelength range.
A small lilc-tcxt programme has been conducted. operating one lamp continuouslyfor 1.500 h and another intermittently. with .5 min on and .5 min off. for 6000 cycles.The lamp current was regulated lo 10 mA. The test showed very satisfactory results.as did the cm ironmcntal (vibration and thermal vacuum) test programme.
Figure 3a shows the 'naked Limp. and Figure 3h the lamp in the suspension usedin the calibration unit. Figure-+ shows the spectrum of the lamp used in the GOMEBreadboard \1odcl !BB\1).
Figure 2. The on-hoard calibration unit
ESA Journal 199-+ Vol. 18 121

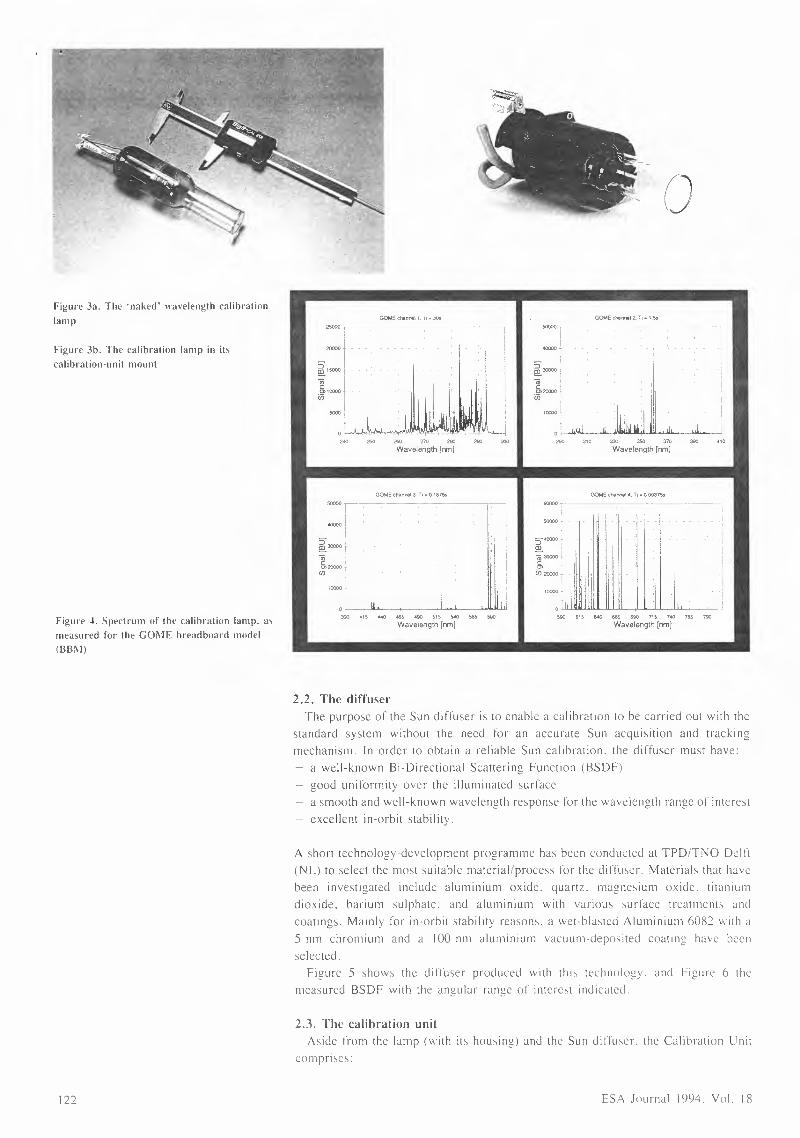
Figure 3a. The 'naked' wavelength calibrationlamp
Figure 3b. The calibration lamp in itscalibration-unit mount
Figure .t. Spectrum of the calibration lamp. asmeasured for the GOME breadboard model(BB:\!)
122
0
GOME chlnn&I 1: 11••;ms25000 -,------- -- - 50000 '
<IOOOO-
240 250 260 270 280 290 300Wavelength [rm]
290 310 330 350 370 390 •10Wavelength [rm]
GOMEchannel3T1.0_1sl56 GOME chaTVlel.4:T1• 0.09375550000
059C· 515 640
50000
S'""'°"[!!.Oi 30000cO>U5 20000
10000
O·~~_,._...,_~~~~~.._....._~~...,._,_..390 415 «e 465 .t9Q 515 SAO 565 500
Wavelength [rm]665 690 715 740 765 79()Wavelength [nm]
2.2. The diffuserThe purpose of the Sun diffuser is to enable a calibration to be carried out with the
standard system without the need for an accurate Sun acquisition and trackingmechanism. In order to obtain a reliable Sun calibration. the diffuser must have:
a well-known Bi-Directional Scattering Function (BSDF)good uniformity over the illuminated surfacea smooth and well-known wavelength response for the wavelength range of interestexcellent in-orbit stahility.
A short technology-development programme has been conducted at TPD/TNO Delft(NL) to select the most suitable material/process for the diffuser. Materials that havebeen investigated include aluminium oxide. quartz. magnesium oxide. titaniumdioxide. barium sulphate. and aluminium with various surface treatments andcoatings. Mainly for in-orbit stability reasons. a wet-blasted Aluminium 6082 with a5 nm chromium and a 100 nm aluminium vacuum-deposited coating have beenselected.
Figure 5 shows the diffuser produced with this technology. and Figure 6 themeasured BSDF with the angular range of interest indicated.
2.3. The calibration unitAside from the lamp (with its housing) and the Sun diffuser. the Calibration Unit
comprises:
ESA Journal 1994. Vol. 18


·------·- ·----. -----·- ------·
E GOME CUBSDFOFTH - =::::::::---.._~ TNO-TPD
a:(f) 7
LL0 0.65(f)co
0.6
i--~----- ~ -b _J1L 1?5 --;:---~;,------.__T_BI
"' '" '5.5 . -ATION ANGLE["]ELEV
the power supply for the lamp. providing a voltage ramp to supply the ignitionvoltage of about 300 V and a stabilised current acros-, the lamp of 10 mAthe optical clements needed to ensure that the spectrometer slit and pupil arc fullyilluminated Ior both the Iamp-calibration and Sun-calibration modesa shutter. which protects the diffuser when it is not being used for Sun calibrationa mesh between shutter and diffuser. providing further protection to the diffuserand an additional attenuation of the light level received from the Sun.
The latter two items have been implemented based on :\ASA experiences which haveshown that diffuser degradation is directly correlated with the time of exposure tosunlight (probably due to polymerisation of deposited contaminants caused by hardultraviolet light).
Figure 5. \\'et-hlastcd aluminium diffuser
Figure (>. BSDF for· the angular range ofinterest
Although a number of means for on-board calibration arc included in GOME. they 3. The ground-calibrationdo not provide access to al I the necessary parameters. These parameters arc measured programmeduring the on-ground calibration programme and arc not anticipated to change fromground to orbit.
The most important measurements to he conducted on the ground arc:- the measurement of the diffuser HSDF mer the GOME wavelength range
ESA Journal I LJ9-I Vol. IX 123

the characterisation of the polarisation response of the instrument as a function of
the optical path (normal observation path and Sun observation path). scan mirrorposition (the scan mirror reflectivity for s- and p-polarisation is a function of themirror angle). and wavelength.
On top of this. there are a number of additional measurements used for variouspurposes: more comprehensive instrument characterisation. consistency crosschecking. backup measurement for the case of lamp failure. and generation of test datafor processing-algorithm checking.In particular. the programme comprises:
Radiance/irradiance measurements: By illuminating the normal observation path andthe Sun observation path with known radiance/irradiance. the radiometric calibrationconcept can be checked.
Wavelength calibration: During instrument-level thermal-vacuum testing. spectra ofthe calibration lamp have been recorded at different temperatures to measurewavelength shifts as a function of the temperature and the air/vacuum difference.
Detector characterisation: Dark current. readout noise. pixel-to-pixel sensitivityvariations. and electronic chain performances including response linearity have beenmeasured.
Stravlight characterisation: This includes intra-channel (from high-intensity end tolow-intensity end). inter-channel (from one channel to the other). and out-of-field andout-of-band stray light measurements.
Field-of-view characterisation: The variability. if any. in the radiometric response andspectral shift in the along-slit direction is measured. This is of particular interest forthe lunar calibration. as the Moon only partially fills the spectrometer slit.
Measurement of"the slit function: The slit function (i.c. the modulation transferfunction of the entire optical system from the slit up to and including the detector)is determined. This is used to convolute high-resolution reference spectra ofatmospheric species to the resolution of GOME.
4. The breadboard-model Recognising that this is quite a demanding programme. preparations for thecalibration programme calibration started as early as 1991. After agreement in principle on the scope of the
programme with the scientists involved in GOME. TPD in Delft (NL) proceeded withthe design. manufacturing. procurement and testing of all the necessary elements:
turntable and fixtures to accommodate the instrument during the measurementscalibrated lamps. diffusers and reference detectors procured from the NationalInstitute of Standardsmonochromator and polariser covering the entire GOME wavelength rangea temperature-controlled room to host the whole setup. clean room class 10.000. allblack-painted (even including storage cabinet and water sink and tap) to suppressexternal stray 1ightcomputer and software to control all the settings and provide them to the GOMEElectrical Ground-Support Equipment (EGSE). to enable correlation between theGOME measurement data and the settings of the calibration setupalgorithms and software to analyse the data. e.g. for noise correction. wavelengthshift detection. BSDF computation. etc.procedures for setting up. aligning and performing the measurementscalibration error budgets to establish the expected accuracy and precision of themeasurements.
124 ESA Journal 1994. Vol. 18

It was realised that to perform this exercise on only the flight model would he veryrisky and schedule-critical. A dry run involving all the steps and procedures hastherefore been carried out on the GOME breadboard model which. since thenegotiation of the main GOME development contract (Phasc-Crfr). has evolved intoa fully-fledged de-facto engineering model. being very representative of the finalflight-model configuration.
Figure 7 shows the GOME BBM mounted on the turntable in the TPD facility.while Figure 8 shows part of the optical instrumentation for performing thecalibration.
First. wavelength characterisation and radiometric stability checking were carriedout during the thermal-vacuum test at instrument level in the \ acuum chamber of theinstrument's prime contractor. Officine Galilco t l). This was then followed hy twocalibration periods. April -August 1991 and November- December 1991. with anintermediate review to scrutinise the results. A final rev icw in March 1994 thenconcluded the BBM calibration. and the modifications necessary for the flight-modelprogramme were agreed.
ESAJournal 1994Yol.18
Figure 7. (;0:\IE on the turntable in thecalibration facilit~
Figure 8. Part of the coxn, calibrationsetup. Note the black environment forreducing external straylight
125


Figurl' 9. Polarisation rc-ponvc of thehrvudhoard model !BB\I)
4
800
_J0a,ch0 3z-c_j0c,ci.~ 2sECJ)zLUCJ)LL00~a:
5. Results of the BBM BSDF The HSDF as measured on the flight diffuser is a smooth function of both thecalibration/characterisation azimuth/elevation angles and the wavelength (sec Fig. 6).
Figurl' 10. GO\IE breadboard model (BB\I)during the TY test
\/'\ j
CHAN 1 CHAN 2CHAN3
0 "t -·-·! I400 500 600
WAVELENGTH[NM]
---+
700200 300
Polarisation response: As expected. the instrument shows a pronounced polarisationresponse. In particular, channel .\ shows some narrow structure in the polarisation ratio(.1 over fi). which is believed to be due to the combined effects of the dichroic beamsplitter and grating (Fig. ')).
Radiance/irradiancc 111co.11m'111c111.1: For schedule reason». the BSDF of the BBMcalibration unit could not be measured prior to integration into the BBM. so that aproper consistency check was not possible.
J#n"l'lrngth calibration: During instrument- and payload-level thermal-vacuum andthermal-balance tests. the spectral stability as a function of temperature was verified.Spectral shifts in all channels were less than 0.02 pixcl10C. With an orbital temperatureswing of about ± l'C. an excellent spectral stability tor a passive thermal design isachieved. Figure 10 shows the instrument mounted in the Galileo thermal-vacuumchamber.
Detector characterisation: Both the dark current and its noise proved to be very low(also due to the good stability of the detector cooling loop). Pixel-to-pixel sensitivityvariations across the 1024-pi xcl arrays were. at less than 2 '/, . much better than thedetector manufacturer had envisaged. Some electronic noise was detected in certain
ESA Journal 1994. Vol. 18

readoutsituations. This was due to the ringing of the leading edge of the strobe pulseand to interference with the read-out of a temperature sensor. Both problems have
been fed back into the instrument design and should he solved for the flight model.
Straylight characterisation: Quite detailed investigations were necessary to clarify theobserved levels of straylight. A path for external straylight was identified and theproblem solved via more and improved instrument internal baffling. Inter-channelstraylight proved to be low and presented no problem.
More crucial was the intra-channel straylight, particularly that in channel 2. whereat the short-wavelength end a roll-off of the signal level (by three orders of magnitude)presented a significant problem. Multiple reflections between the detector and theobjective lenses and the gratings, respectively, were identified as the major cause. Inchannels 3 and 4 the problem could be resolved by the provision of improved antiretlection coatings on the lenses and by slightly tilting the gratings. For channel 2.this would not have been sufficient and so, in consultation with the GOME scientists.it was decided to move the wavelength split between channels I and 2 to a highervalue. thereby safeguarding the important channel 2. hut sacrificing the performanceof channel 1 slightly. The problem was alleviated by measuring stray light levels onsome (so far unused) pixels. enabling some correction to be made for straylight in theground processing".
Field-of 1·iell· characterisationThe design parameters for the GOME FOY arc 0.14 ° x 2.8°. Under normal
observational conditions. the entire slit and the entire GOME pupil arc illuminated.However. when the Moon is observed. only a fraction of the slit is illuminated. Forthat reason, several scans have been made of the FOY by using collimated light asinput for the GOME telescope. These measurements provide information on:
actual dimensions of the FOYout-of-field scattered lightinfluence on radiometric response and on wavelength scale when only a fractionof the FOY is illuminated.
Figure 11 shows the radiometric output of GOME for channel 3 when the FOY 1sscanned along the 2.8° axis of the FOY.
Slit functionThis function represents the spectral line shape output for monchrornatic input. It
is a convolution of entrance slit width as imaged onto the spectral plane. detector pixel
VERTICAL FOV - RADIOMETRIC STABILITYCH 3
z 5.00%
0~ 4.00%
sw 3.00%0>- 2.00%I-si== 1.00%enzw 0.00%(/)w> -1.00%
~....I -2.00%wa:
-3.00%
-4.00%
·5.00%0 0.5 1.5 2 2.5 3 3.5
VERTICALANGLE (0)
ESA Journal 1994 Vol. 18
Figure 11. Radiometric response variationalong the field of view
127

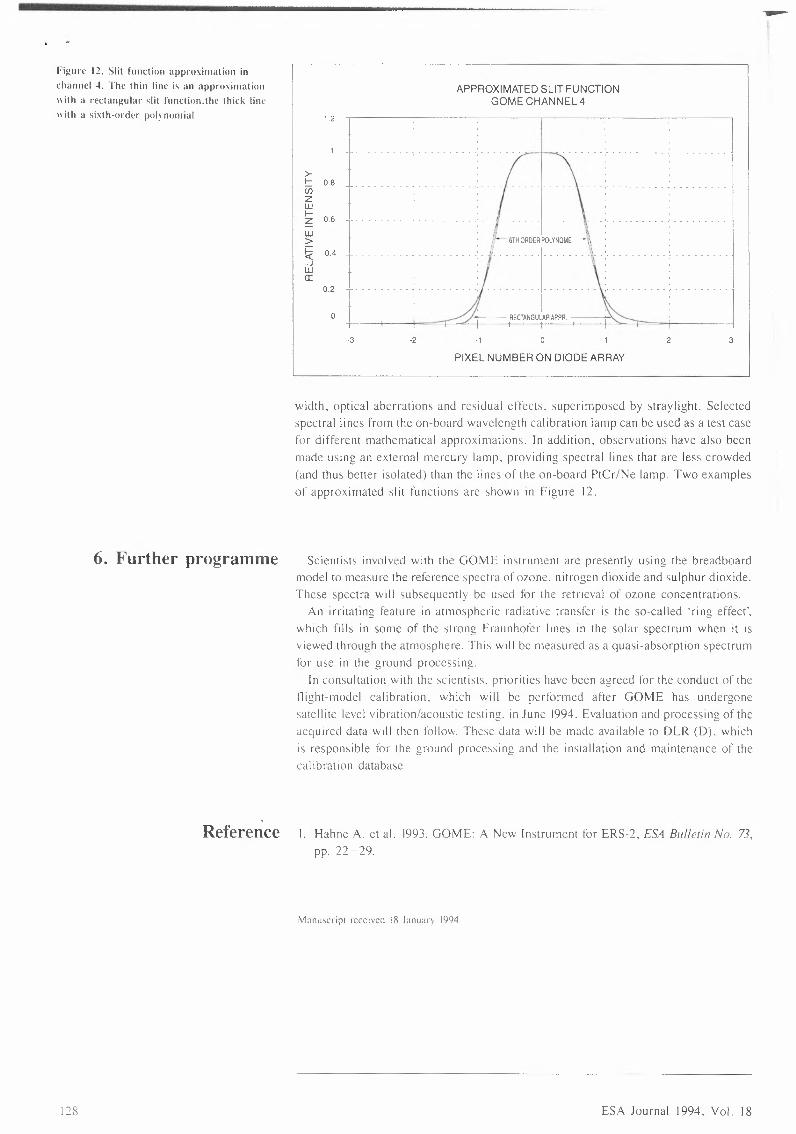
Figure 12. Slit function approximation inchannel ~. The thin line is an approximationwith a rectangular slit function.the thick linewith a sixth-order pol~ nomial
6. Further programme
Reference
128
1.2
~ 0.8 1- I~ tUJ I~ "' 1t:c oA Tuj ta: I,:I
-3
APPROXIMATEDSLIT FUNCTIONGOMECHANNEL 4
··-
6TH ORDER POLYNOME -
-2 -1 3
PIXEL NUMBER ON DIODEARRAY
width, optical aberrations and residual effects. superimposed by straylight. Selectedspectral lines from the on-hoard wavelength calibration lamp can be used as a test casefor different mathematical approximations. In addition. observations have also beenmade using an external mercury lamp. providing spectral lines that are less crowded(and thus better isolated) than the lines of the on-board PtCr/Nc lamp. Two examplesof approximated slit functions arc shown in Figure 12.
Scientists involved with the GOME instrument arc presently using the breadboardmodel to measure the reference spectra of ozone. nitrogen dioxide and sulphur dioxide.These spectra will subsequently be used for the retrieval of ozone concentrations.
An irritating feature in atmospheric radiative transfer is the so-called 'ring effect'.which fills in some of the strong Fraunhofcr lines in the solar spectrum when it isviewed through the atmosphere. This will be measured as a quasi-absorption spectrumfor use in the ground processing.
In consultation with the scientists. priorities have been agreed for the conduct of theflight-model calibration, which will he performed after GOME has undergonesatellite-level vibration/acoustic testing. in June 1994. Evaluation and processing of theacquired data will then follow. These data will be made available to DLR (0). whichis responsible for the ground processing and the installation and maintenance of thecalibration database.
I. Hahne A. et al. 1993. GOME: A New Instrument for ERS-2. ESA Bulletin No. 73.pp. 22-29.
Manuscript received 18 Januarv 199-1
ESA Journal 1994. Vol. 18


european space agency
The European Space Agency was formed out of, andtook over the rights and obligations of, the two earlierEuropean Space Organisations: the European SpaceResearch Organisation (ESRO) and the EuropeanOrganisation for the Development and Construction ofSpace Vehicle Launchers (ELDO). The Member Statesare Austria, Belgium, Denmark, France, Germany,Ireland, Italy, Netherlands, Norway, Spain, Sweden,Switzerland and the United Kingdom. Finland is anAssociate Member of the Agency. Canada is aCooperating State.
In the words of the Convention: The purpose of theAgency shall be to provide for and to promote, forexclusively peaceful purposes, co-operation amongEuropean States in space research and technology andtheir space applications, with a view to their being usedfor scientific purposes and for operational spaceapplications systems.
(a) by elaborating and implementing a long-termEuropean space policy, by recommending spaceobjectives to the Member States,and by concertingthe policies of the Member States with respect toother national and international organisations andinstitutions;
(b) by elaborating and implementing activities andprogrammes in the space field;
(c) by co-ordinating the European space programmeand national programmes, and by integrating thelatter progressively and as completely as possibleinto the Europeanspace programme, in particular asregards the development of applications satellites;
(d) by elaborating and implementing the industrialpolicy appropriate to its programme and byrecommending a coherent industrial policy to theMember States.
The Agency is directed by a Council composed ofrepresentativesof Member States.The Director Generalis the chief executive of the Agency and its legalrepresentative.
The Directorate of the Agency consists of the DirectorGeneral; the Inspector General: the Director of ScientificProgrammes; the Director of Observation of the Earthand its Environment; the Director of the Telecommunications Programme: the Director of Space TransportationSystems; the Director of the Space Station andMicrogravity Programme; the Director of ESTEC; theDirectorof Operations and the Directorof Administration.
The ESAHEADQUARTERSare in Paris.
The major establishments of ESAare:
THE EUROPEAN SPACE RESEARCH ANDTECHNOLOGY CENTRE (ESTEC). Noordwijk,Netherlands.
THE EUROPEAN SPACE OPERATIONS CENTRE(ESOC), Darmstadt, Germany
ESRIN, Frascati, Italy.
Chairman of the Council: PG. Winters
Director General: J.-M. Luton.
agence spatiale europsenne
L'Agence Spatia/e Eutopeenne est issue des deuxOrganisationsspatiales europeetmez qui l'ont otecedee- /'Organisation eutooeenne de recherches spatiales(CERS)et /'Organisation eurooeenne pour la ttuse aupoint et la construction de lanceurs d'engins spatiaux(CECLES)- dont elle a repris /es droits et obligations.Les Etats membres en sont: l'Allemagne, /'Autriche, laBelgique, le Danemark, /'Espagne, la France, /'lrlande,/'ltalie. la Norveqe, /es Pays-Bas, le Royaume-Uni, laSuede et la Suisse.La Finlande estmembre assooe del'Agence. Le Canada beneficie d'un statut d'Etatcooperant.
Se/on /es termes de la Convention: l'Agence a pourmission d'assurer et de devetoppet. a des finsexclusivement pacifiques. la cooperation entre Etatseuropeens dans /es domames de la recherche et de latechnologie spatiales et de leurs applications spatiales.en vue de leur utilisation a des fins scientifiques et pourdes systemesspatiaux operetiormels d'applications.
(a) en elaborant et en mettant en oeuvre une politiquespatiale europeenne a long terme. enrecommandant aux Etatsmembres des objectifs entnstiere spatiale et en concertant /es politiques desEtats membres a reqero d'autres organisations etinstitutions nationales et mternationales;
(b) en eteborent et en mettant en oeuvre des ectivtteeetdes programmes dans le domaine spatial;
(c) en coordonnant le programme spatial euroceen et/es programmes nationaux, et en integrant cesderniers progressivement et aussi comptetementque possible dans le programme spatial europeen.notamment en ce qui concerne le developpemen:de satellites d'applications.
(d) en eteborsnt et en mettant en oeuvre la politiqueindustrielle epproptiee a son programme et enrecommandant aux Etats membres une politiqueindustrielle coberente.
L'Agence est dirigee par un Conseil, compose derepresentants des Etatsmembres. Le Directeur generalest le fonctionnaire executit superieur de l'Agence et larepreseme dans taus ses actes.
Le Directoire de l'Agence est compose du Directeurgeneral; de /'lnspecteur general; du Directeur desProgrammes scientifiques; du Directeur desProgrammes d'Observation de la Terre et de sonEnvironnement; du Directeur du Programme deTelecommunications; du Directeur des Systemes deTransport spatial; du Directeur du Programme Stationspatiale et Microgravite; du Directeur de /'ESTEC,duOirecteur des Operations et du Directeur de/'Administration.
Le SIEGEde l'Agence est a Paris.
Les principaux Etablissementsde l'Agence sont:
LE CENTRE EUROPEEN DE RECHERCHE ET DETECHNOLOGIE SPAT/ALES (ESTEC). Noordwijk,Pays-Bas.
LE CENTRE EUROPEEN D'OPERATIONS SPAT/ALES(ESOC),Darmstadt, Allemagne.
ESRIN,Frascati, ltalie
President du Conseil: PG. Winters
Directeur general. J-M Luton.
esa
Volume 18 Number 2
Cover: Artist ", impression of theHuygens Probe
Editorial OfficeESA Publications Divisionc/o ESTEC, PO Box 2992200 AG NoorclwijkThe NetherlandsTel. (31) 1719-83400Fax. (31) 1719-85433
Publication ManagerBruce Battrick
EditorsBruce ButtrickClare Mattok
LavoutCarel HaakrnanKeith Briddon
AdvertisingBrigitte KaldeichTel. (31) 1719-83794
Copyright l99-l hy European Space AgcnqPrinted in The Ncthcrland-,!SS:\ 031'!-2285
~esaeuropean spaceagence spar I agencyra e europeenne
R.D. Lorenz 93 Huygens Probe ImpactDynamics
A. Hahne et al. 119 Calibration of the GOMEInstrument for ERS-2
M. Schautz et al. 129 Testing of a Buran FlightModel Fuel Cell
O. BaetzE.M. SoopU. Soppa
139 Inter-Satellite Tracking forCo-Location
M.N. De Parolis 147 A Controlled PumpAssembly for SpacecraftCooling Loops
163 ESA Publications
181:3®1 SPACEFLIGHT DATA RECORDER
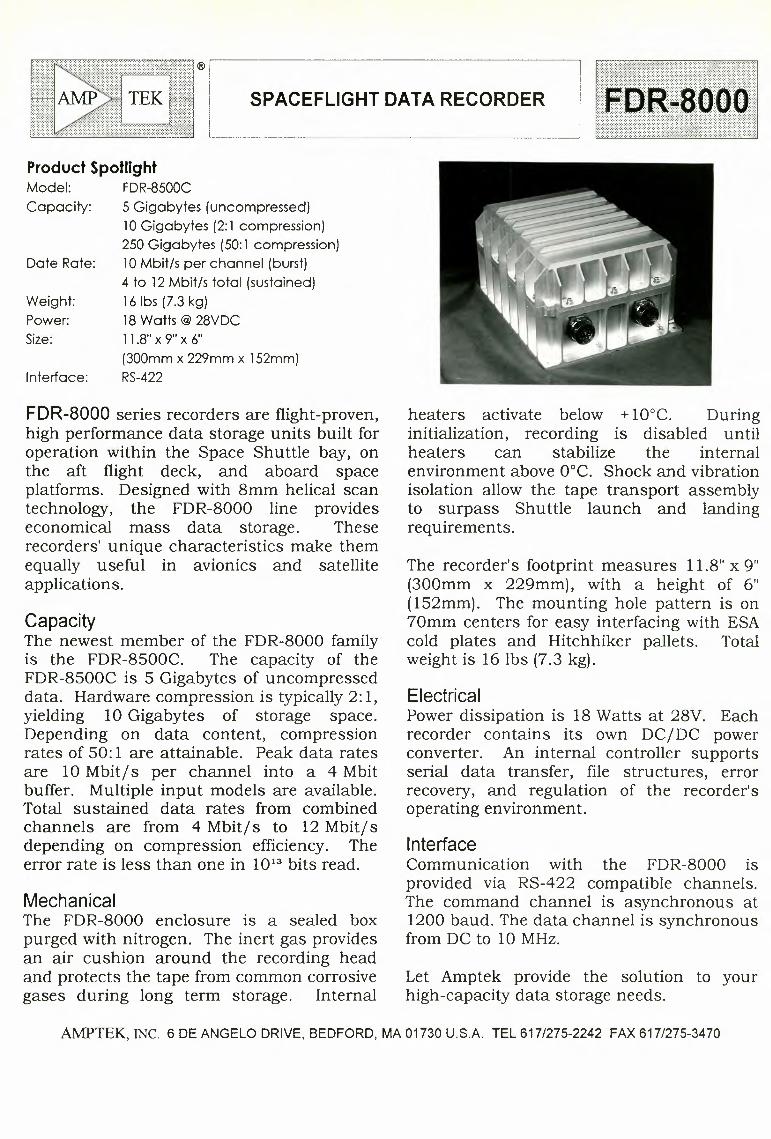
Product SpotlightModel: FDR-8500CCapacity: 5 Gigabytes (uncompressed)
10Gigabytes (2:1 compression)250 Gigabytes (50:1 compression)10Mbit/s per channel (burst)4 to 12Mbit/s total (sustained)16 lbs (7.3 kg)18Watts@ 28VDC11.8'' x 9" x 6"(300mm x 229mm x 152mm)RS-422
Date Rate:
Weight:Power:Size:
Interface:
FDR-8000 series recorders are flight-proven,high performance data storage units built foroperation within the Space Shuttle bay, onthe aft flight deck, and aboard spaceplatforms. Designed with 8mm helical scantechnology, the FDR-8000 line provideseconomical mass data storage. Theserecorders' unique characteristics make themequally useful in avionics and satelliteapplications.
CapacityThe newest member of the FDR-8000 familyis the FDR-8500C. The capacity of theFDR-8500C is 5 Gigabytes of uncompresseddata. Hardware compression is typically 2:1,yielding 10 Gigabytes of storage space.Depending on data content, compressionrates of 50: 1 are attainable. Peak data ratesare 10 Mbit/s per channel into a 4 Mbitbuffer. Multiple input models are available.Total sustained data rates from combinedchannels are from 4 Mbit/ s to 12Mbit/ sdepending on compression efficiency. Theerror rate is less than one in 1013 bits read.
MechanicalThe FDR-8000 enclosure is a sealed boxpurged with nitrogen. The inert gas providesan air cushion around the recording headand protects the tape from common corrosivegases during long term storage. Internal
heaters activate below + l0°C. Duringinitialization, recording is disabled untilheaters can stabilize the internalenvironment above 0°C. Shock and vibrationisolation allow the tape transport assemblyto surpass Shuttle launch and landingrequirements.
The recorder's footprint measures 11.8"x 9"(300mm x 229mm), with a height of 6"(152mm). The mounting hole pattern is on70mm centers for easy interfacing with ESAcold plates and Hitchhiker pallets. Totalweight is 16 lbs (7.3 kg).
ElectricalPower dissipation is 18Watts at 28V. Eachrecorder contains its own DC/DC powerconverter. An internal controller supportsserial data transfer, file structures, errorrecovery, and regulation of the recorder'soperating environment.
InterfaceCommunication with the FDR-8000 isprovided via RS-422 compatible channels.The command channel is asynchronous at1200 baud. The data channel is synchronousfrom DC to 10 MHz.
Let Amptek provide the solution to yourhigh-capacity data storage needs.
AMPTEK, INC. 6 DE ANGELO DRIVE, BEDFORD, MA 01730 U.S.A. TEL 617/275-2242 FAX 617/275-3470

R.D. LorenzUnit for Space Sciences, University of Kent, Canterbury, UK
Huygens Probe Impact Dynamics
Abstract The ESA Huygens Probe is due for launch as part of the NASA/ESA Cassinimission in 1997, to arrive at Titan in late 2004, and will make a 2~2.5 h exploratorydescent to the surface. However. the state of Titan's surface is largely unknown andit may be at least partially covered in liquid hydrocarbons. With such ignorance ofthe surface state. and the limited financial envelope of the project. it is not practicableto design the Probe to ·soft-land'. Survival may, nevertheless. be possible and thispaper presents various impact-dynamics analysis methods and assesses the likelyimpact scenarios and their survivability.It is concluded that the Probe has a good chance of surviving to continue its
scientific mission from the surface. The scientific information about the surface thatcould be gathered from impact-dynamics measurements is also discussed.
ESA Journal 1994 Vol. 18 93
1. Introduction
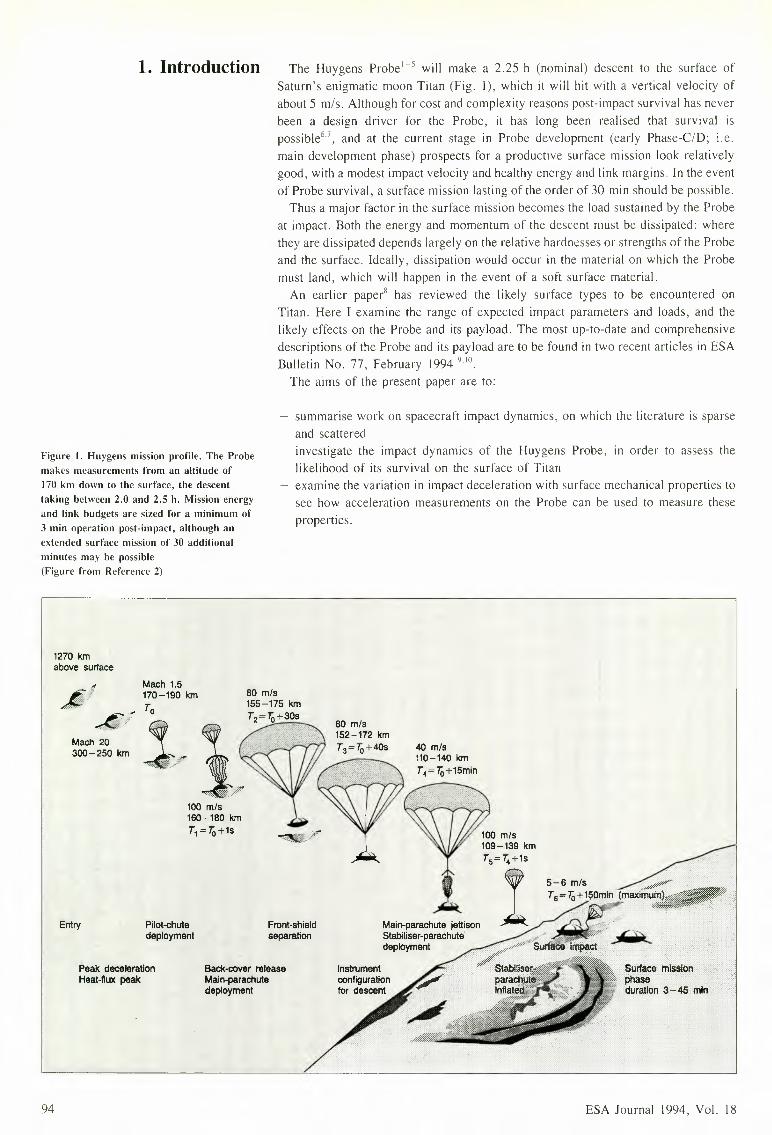
Figure I. Huygens mission profile. The Probemakes measurements from an altitude of170 km down to the surface, the descenttaking between 2.0 and 2.5 h. Mission energyand link budgets are sized for a minimum of3 min operation post-impact, although anextended surface mission of 30 additionalminutes may he possible(Figure from Reference 2)
The Huygens Probe1 5 will make a 2.25 h (nominal) descent to the surface ofSaturn's enigmatic moon Titan (Fig. I), which it will hit with a vertical velocity ofabout 5 m/s. Although for cost and complexity reasons post-impact survival has neverbeen a design driver for the Probe, it has Jong been realised that survival ispossible?", and at the current stage in Probe development (early Phase-CID; i.e.main development phase) prospects for a productive surface mission look relativelygood, with a modest impact velocity and healthy energy and link margins. In the eventof Probe survival, a surface mission lasting of the order of 30 min should be possible.Thus a major factor in the surface mission becomes the load sustained by the Probe
at impact. Both the energy and momentum of the descent must be dissipated: wherethey are dissipated depends largely on the relative hardnesses or strengths of the Probeand the surface. Ideally. dissipation would occur in the material on which the Probemust land, which will happen in the event of a soft surface material.An earlier paper" has reviewed the likely surface types to be encountered on
Titan. Here I examine the range of expected impact parameters and loads. and thelikely effects on the Probe and its payload. The most up-to-date and comprehensivedescriptions of the Probe and its payload are to be found in two recent articles in ESABulletin No. 77. February 1994 9·10.
The aims of the present paper are to:
summarise work on spacecraft impact dynamics. on which the literature is sparseand scatteredinvestigate the impact dynamics of the Huygens Probe. in order to assess thelikelihood of its survival on the surface of Titanexamine the variation in impact deceleration with surface mechanical properties tosee how acceleration measurements on the Probe can be used to measure theseproperties.
1270 kmabove surface
Mach 1.5170-190 km 80 m/slf \,~:~
100 mis160-180 kmT1=7Q+1s
Mach 20300-250 km
Entry Pilot-chutedeployment
Peak decelerationHeat-flux peak
Back-cover releaseMaln-parachutedeployment
40 m/s110-140 km
Front-shieldseparation
Main-parachute jettisonStabiliser-parachutedeployment
94 ESA Journal 1994, Vol. 18

Some useful comparisons may be drawn with previous planetary missions to put the 2. Comparisons withHuygens landing scenario in context. A convenient summary of planetary missions previous missionsis that by Wilson11•
Luna 9. the first man-made object to have survived on the lunar surface. hit atapprox. 6 ms - 1• Its internal equipment was 'protected by shock-absorbers". It had amass of about 100 kg. Luna 16 (an automatic sample return) and its successors wereconsiderably larger. and soft-landed at about 2 .5 ms - I.The Surveyor spacecraft had shock-absorbing legs and a propulsion system for soft
landing on the Moon; at touchdown they weighed just under 300 kg. and had verticalvelocities of the order of 3 ms - I. The main-structure loads were 8-20 g. althoughload-amplification effects on the spidery lander led to loads on the antenna and solararray (mounted on a mast) of the order of 90 g. The Viking landers on Mars (equippedwith a throttlablc hydrazine retro-rocket system. and shock-absorbing legs for softlanding) touched down at about 2 .5 ms - I.The Pioneer Venus (PY) probes have many similarities with the Huygens Probe.
and a detailed comparison is given in a following section. They. and the RussianVenera probes. hit the surface of Vcnus at about 9 ms - I. relying only onaerodynamic drag to brake their descent. and weighed between 93 kg (PV smallprobes) and 700 kg (Venera). The pictures sent back by the Vcncras suggest theylanded on rock slabs (possibly covered with some dust): these probes recorded landingloads" of up to 75 g.Of the 30 or so missions described above. only Luna 18. Mars 2. and three of the
four Pioneer Venus probes failed completely at impact (Table I). Vcncras 11 and 12appear to have suffered extensive instrument failures on landing: Mars 3 sent back20 s of (blank) TV signals before failing. and the sampler of Luna 23 was damagedby a rough landing. It is noteworthy that if spacecraft survived for a few seconds onthe surface. they generally continued to function up to and often beyond their designlife. with some missions being terminated either by command from Earth. or by relayspacecraft passing out of sight.The impact velocity of the Huygens Probe is only slightly higher than that of 'true·
soft-landers. and rather less than for several previous 'hard' or 'semi-hard landerson the Moon and Venus. Thus. in relative terms. prospects for Huygens survival seemquite good. even though it has not been designed with impact survival in mind.
The NASA Pioneer Venus multi-probe mission is perhaps the most useful analogue 3. Comparions withfor the Huygens impact: in part because the masses and velocities arc comparable Pioneer Venus(Pioneer Venus. though robust. was not designed to survive impact). and because(unlike the Russian Mars and Venus missions) it is relatively well-documented in theopen literature':' 1'.
Four Pioneer Venus probes (three small and one large) were sent to Venus. Thelarge probe was spherical (73 cm diameter) and had a mass of 310 kg (including its1.4 m diameter heat shield. which it released after deploying a parachute). The smallprobes (50 cm diameter; 90 kg) descended without parachutes and kept their 76 cmdiameter. 45 ° half-angle entry protection shields attached throughout their descent.The probes all transmitted directly to Earth using antennas with approximately
hemispherical coverage.". The dispersion of the probes over the surface of Venuswas such that the Earth (where the signals were received) was about 30° above thehorizon over each landing site (except. significantly. for the day probe. where theEarth elevation was about 40°).The probes impacted the surface at velocities of approximately 9 - 10 mis. impact
being indicated by a sudden change in the Doppler shift of the received radiofrequency. Signals from two of them (the large probe and the north probe) were lostat impact. Signals were received from the night probe for 2 s after impact. hut theclay probe continued to transmit for 67 min. at which time its internal temperaturereached 126° C. Telemetry suggests that the signal was lost at this pointnot due to battery exhaustion. hut due to thermal failure of a power-amplifiercomponent 14•
ESA Journal 1994 Vol. 18 95
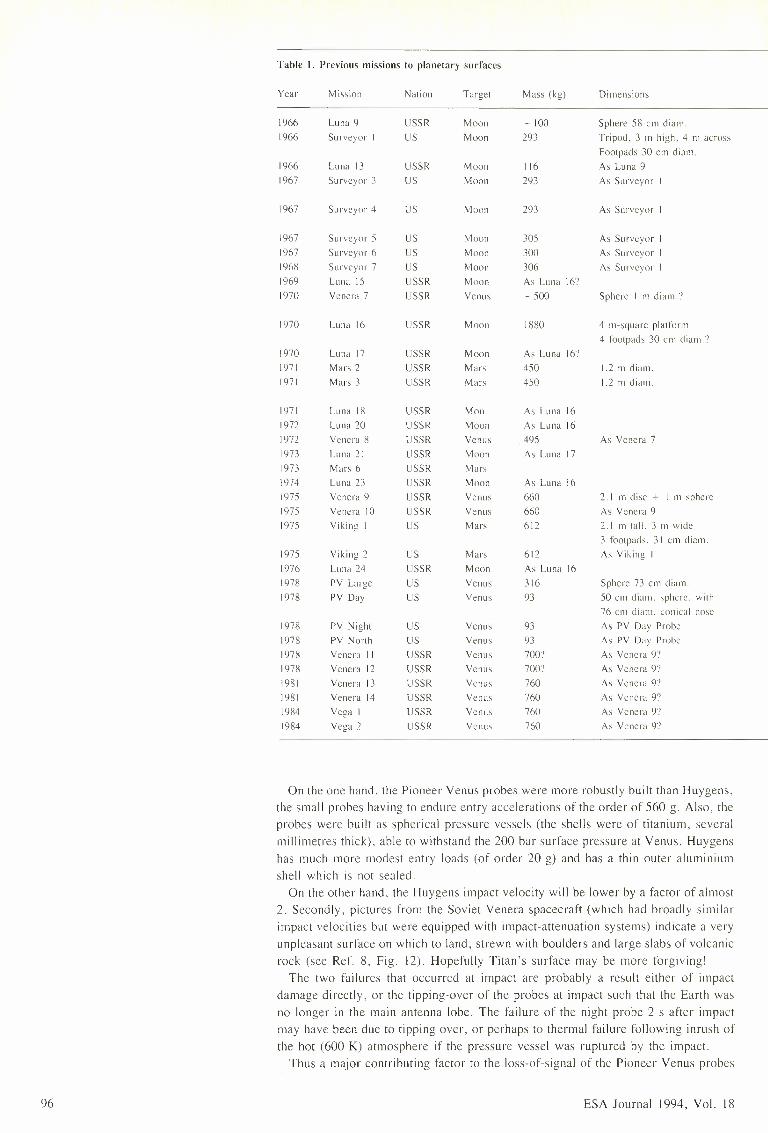
Table I. Previous missions to planetary surfaces
Year Mission Nation Target Mass (kg) Dimensions
1966 Luna 9 USSR Moon -100 Sphere 58 cm diam.1966 Surveyor I us Moon 293 Tripod. 3 111high. 4 m across
Footpads 30 cm diam.1966 Luna 13 USSR Moon 116 As Luna 91967 Surveyor 3 us Moon 293 As Surveyor I
1967 Surveyor 4 LS Moon 293 As Surveyor
1967 Surveyor 5 us Moon 305 As Surveyor1967 Surveyor 6 us Moon 300 As Surveyor I1968 Surveyor 7 us Moon 306 As Surveyor I1969 Luna 15 USSR Moon As Luna 16.'1970 Veneta 7 USSR Venus -500 Sphere I m diam."
1970 Luna 16 USSR Moon 1880 4 m-square platform4 footpads 30 c111diarn.?
1970 Luna 17 USSR Moon As Luna 16''1971 Mars 2 USSR Mars 450 1.2 111diam.1971 Mars 3 USSR Mars 450 1.2 m diam.
1971 Luna 18 USSR Mon As Luna 161972 Luna 20 LSSR Moon As Luna 161972 Vcnera 8 USSR Venus 495 As Venera 71973 Luna 21 USSR Moon As Luna 171973 Mars 6 USSR Mars1974 Luna 2J USSR Moon As Luna 161975 Venera 9 USSR Venus 660 2.1 rn disc + I 111sphere1975 Venera I0 USSR Venus 660 As Vencra 91975 Viking I us Mars 612 2.1mtall.3111 wide
3 footpads. 31 c111diam.1975 Viking 2 us Mars 612 As Viking I1976 Luna 24 USSR Moon As Luna 161978 PY Large us Venus 316 Sphere 73 cm d ia111.1978 PY Day us Venus 93 50 cm-diam. sphere. with
76 cm diam. conical nose1978 PY Night us Venus 93 As PY Day Probe1978 PY North us Venus 93 As PY Day Probe1978 Venera 11 USSR Venus 700-' As Veneta 9.,
1978 Vcnera 12 USSR Venus 700-' As Vencra 9·>1981 Vencra 13 USSR Venus 760 As Vencra 9''1981 Venera 14 USSR Venus 760 As Ven era 9''1984 Vega I USSR Venus 760 As Vcnera 9»1984 Vega 2 USSR Venus 760 As Venera 9»
On the one hand. the Pioneer Venus probes were more robustly built than Huygens,the small probes having to endure entry accelerations of the order of 560 g. Also. theprobes were built as spherical pressure vessels (the shells were of titanium. severalmillimetres thick). able to withstand the 200 bar surface pressure at Venus. Huygenshas much more modest entry loads (of order 20 g) and has a thin outer aluminiumshell which is not sealed.On the other hand, the Huygens impact velocity will be lower by a factor of almost
2. Secondly. pictures from the Soviet Venera spacecraft (which had broadly similarimpact velocities but were equipped with impact-attenuation systems) indicate a veryunpleasant surface on which to land. strewn with boulders and large slabs of volcanicrock (see Ref. 8. Fig. 12). Hopefully Titan's surface may be more forgiving!The two failures that occurred at impact are probably a result either of impact
damage directly, or the tipping-over of the probes at impact such that the Earth wasno longer in the main antenna lobe. The failure of the night probe 2 s after impactmay have been due to tipping over. or perhaps to thermal failure following inrush ofthe hot (600 K) atmosphere if the pressure vessel was ruptured by the impact.Thus a major contributing factor to the loss-of-signal of the Pioneer Venus probes
96 ESA Journal 1994, Vol. 18

Speed 1111\1 Conuncnt-,
Le"" than > x h or contact over _I dTrue soft-landing. Operated for (J 1110111hs
x _I
Less than 2lmpact accclcromctrv recorded soil structure to depth of 20- 30 cmBounced _,()cm al Ltnding (engines on): OK after engines turned off bygn)und commandContact lost 2.:' 111in before landing. although automatic landing may havebeen ..,llCL'("•,-..fu]
Prcx-ur.mt leak forced late retro sequence
Lnknown
-L2
3.Xl .'OIO!
Crashc·dTclcmctrx multiplexer failure - onl: temperature data 123 111in) from-urtucc. Bad .utitudc caused 20 dB signal loss lrollcd in wind")Sample return mission
., Rover mission
Crashed Idust storm? I
Transmissions discontinued after 20 <: high winds. or failure of relaxorbiter?Crashed "due to ruggL·d tcrruin
21
10.' OpcTall'd for )() min2
8x2.-+
Contact lost hdore landingRough landing damaged drillFirst pictures trom Venus: lasted )_I minOperated for al least h) 111i11Irelay passed out of sight!Operated until l 1JX2
Shut down 1980
l)
10Failed al imp.urOperated for h7 min on surface: thermal failure"
11110v-:n.
x·'
Operated for 2 slailcd al impactlnslr11111e111failures on landing: operated 1J) 111i11Instrument failures on landing: operated 110 111inOperated for 127 minOperated for :'7 minDrill \L'L!lll'tll'L' ...,tartL'd prcm.nurcly: nu ....urtucc ....cicnccOperated for )7 min
8!8!W'X"
may well have been the presence of the entry shields on the small probes causmgantenna depointing at impact. Indeed. Venus surface data was recovered from whatwas originally thought 11 to be noise. when the Vcnera 7 lander's telemetry signalfell to 1 '7c of its nominal value at impact. Because Huygens is a relatively flat and softbottomed spacecraft. we might expect that (except in the case of extremely steep orrocky surfaces) such antenna dcpointing is unlikely. Further. since the cold Titanatmosphere is much less harsh than the dense. scorching atmosphere on Venus,thermal failure should be at least slower. and perhaps less likely. to occur onHuygens.
A substantial amount of work has been performed on impact dynamics for militaryapplications. Most civil work is in connection with safety engineering. foraircraft" 17 and automotive crushes" '".and the accidental dropping of flasks used totransport radioactive waste": Comparatively little work is reported in the openliterature in the West on the impact dynamics of spacecraft (Ref. 22 gives somegeneral information: sec references hereafter for particular cases).
ESA Journal 1994 Vol. 18
4. Spacecraft impactdynamics
97
The bulk of the available work was performed in connection with the US Mercury,Apollo and Surveyor programmmes, although some recent ESA-sponsored studieshave been performed on Mars penetrator/landers". For the Mercury and laterApollo programmes, the work was focussed on estimating impact loads to ensure crewsurvival, both for the nominal sea landing and for possible impact on land in the eventof a launch abort.As part of the Apollo Programme, models of the mechanical properties of the lunar
surface had to be developed (there were initial fears that the surface might be so softthat a spacecraft, or astronauts not equipped with snowshoes, might sink into it24)and the Surveyor series of soft-lander missions was designed to assess the lunarsurface in preparation for the manned Apollo landings. Some instrumentation (straingauges on the landing legs and accelerometers on the main body) was devoted tomeasuring landing loads to assess the bearing strength of the surface". Furtherindications of soil physical properties were obtained by photographing the 'feet' ofthe landing legs to measure foot penetration and ejecta throwout, and by measuringmotor currents on the sampling arm.Most of the Apollo and Mercury work was devoted to liquid landings (which were,
of course, the nominal mode of ending their missions). Analytic simulation of suchlandings became well-developed and predictions for Huygens are made in a followingsection.Simulation of landings on solid surfaces is rather more difficult and available data
is more scarce. First, since the 'hardness' of the surface is comparable with that ofthe spacecraft, the partitioning of energy and momentum dissipation between thevehicle and the surface becomes complex, so analytical treatment is extremelydifficult (although Ref. 26 provides an instructive analysis of a simple case).Secondly, the higher impact loads generally cause damage to the spacecraft, such thateven for small-scale models, large series of tests are prohibitively expensive, so thereis relatively little available experimental data. Modern finite-element techniques allowthe detailed investigation of impact dynamics and structural response, but are alsoexpensive.In the following sections, relatively simple methods of estimating the loads and
response of an impacting spacecraft are presented, with Huygens as the example.While relatively simple, these methods offer useful insight into what may occur at theclimax of the Huygens mission.
5. Impact conditions The Huygens Probe (Figs. 2-4), during most of its descent, is suspended beneatha stabilising drogue parachute (a polyester/kevlar disk-gap-band chute with areference diameter of 2.45 m)27• The terminal velocity of the Probe with parachuteat the surface of Titan, with a surface gravity of 1.35 ms -2 and an atmosphericdensity of 5.3 kgm -3, is 5.2 ms -I (approximately the velocity attained on Earth byan object dropped from a height of 130 cm, which is convenient for impact testing').This is about half of the impact velocity of the Apollo capsules and the Pioneer Venusspacecraft.There is some uncertainty in the radio-occultation data from the Voyager encounter,
and a consequent uncertainty in the knowledge of the atmospheric density", whichcould be 4.57-6.01 kgm ":'. Similarly, there is a 10% uncertainty in the dragperformance of the parachute, and so combining these uncertainties gives the terminalvelocity of the Probe at the surface between 4.6 and 5.8 ms-1•The horizontal velocity of the Probe is unlikely to be exactly zero as parachutes tend
to have a slight 'gliding' action, but certainly the sideways component will be small(say < 1 ms -1). The Probe will be moving along with any winds at the surface, butthese (e.g. Ref. 29) are likely to be very small (again < 1 ms -1). The specificationon the stabiliser requires it to have pendulum-type oscillations of less than 10°amplitude. Should a wind gust cause a swing greater than this, it should return towithin 10° of vertical within about JO s. Wind gusts near the surface are unlikelyanyhow, so for the purposes of this study it is assumed that the impact attitude isvertical, and the corresponding horizontal velocity component is zero.The Probe mass at impact is expected to be about 207 kg, and its transverse moment
of inertia is about 20 kgm 2.
98 ESA Journal 1994, Vol. 18
S.E.D.
EXPERIMENTPLATFORM
BACKCOVER
AFTER CONE ---
FORE--DOME
FRONTSHIELD
ESA Journal 1994 Vol. 18
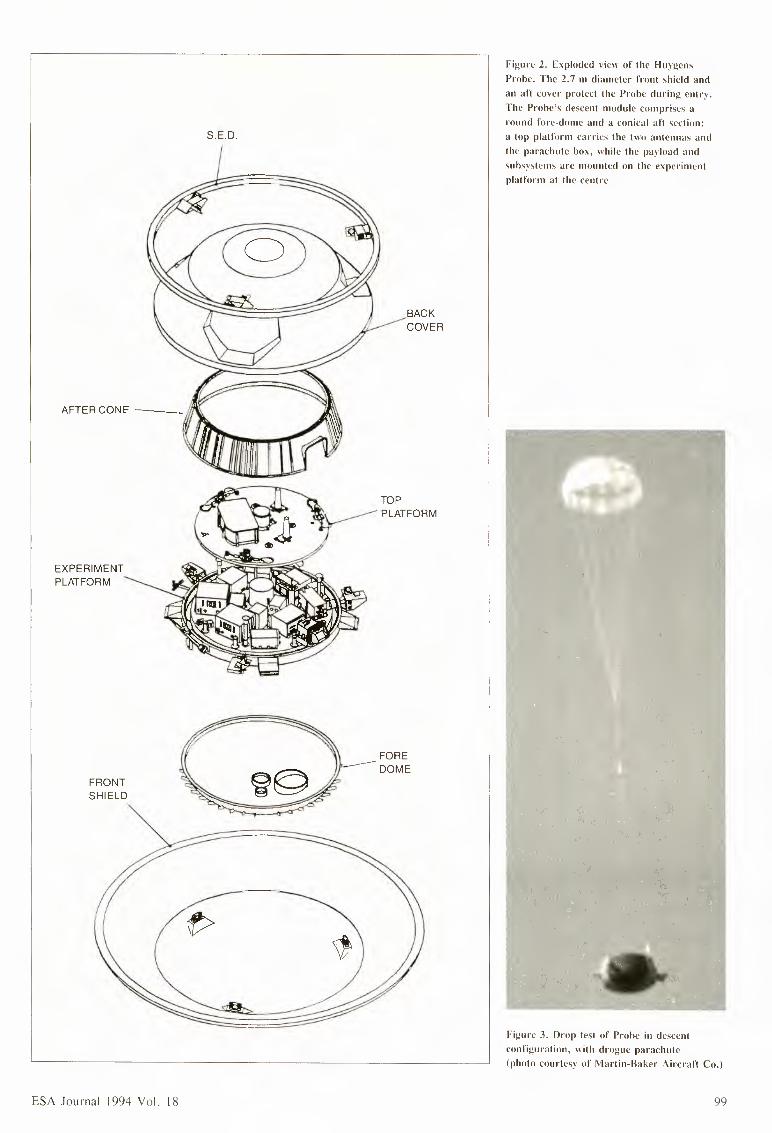
Figure 2. Exploded view of the HuygensProbe. The 2.7 m diameter front shield andan aft cover protect the Probe during entry.The Probe's descent module comprises around fore-dome and a conical aft section:a top platform carries the two antennas andthe parachute box, while the payload andsubsystems are mounted on the experimentplatform at the centre
Figure 3. Drop test of Probe in descentconfiguration, with drogue parachute(photo courtesy of Martin-Baker Aircraft Co.)
99
.•. : + BATTERIES
SSP
RADAR
GCMS
0 • ACP.a o PCDUa
"':t:_."- PCDUb
f
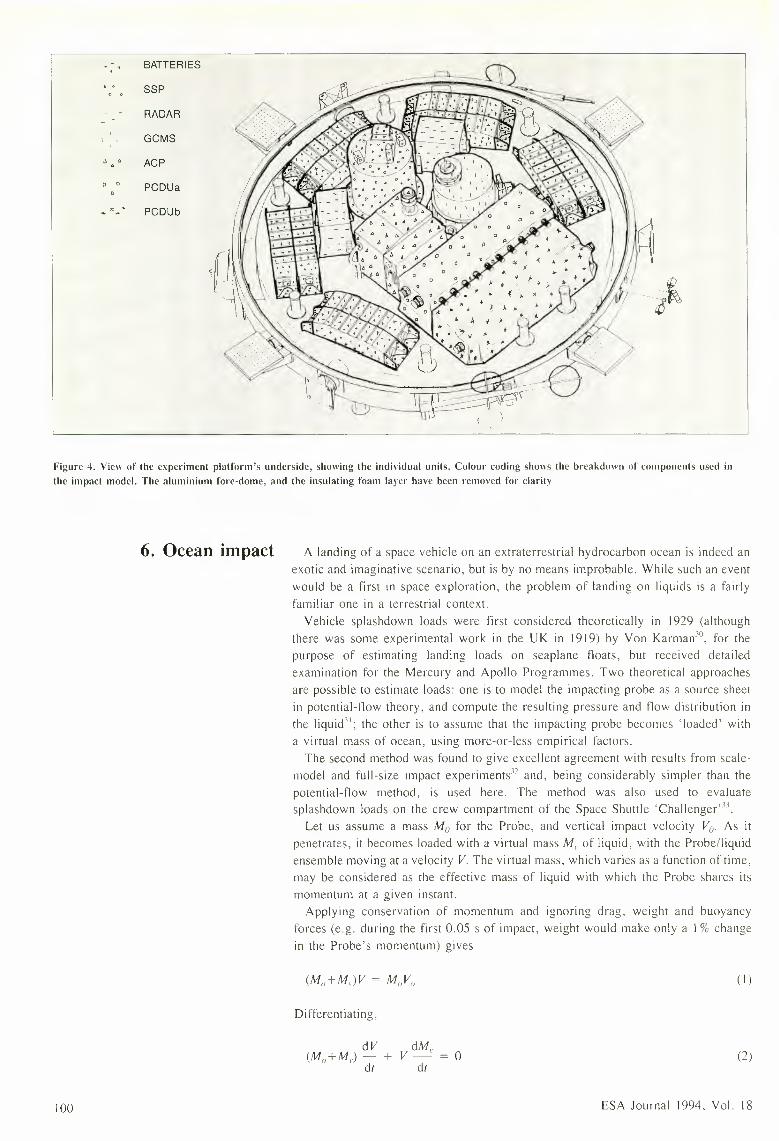
Figure 4. View of the experiment platform's underside, showing the individual units. Colour coding shows the breakdown of components used inthe impact model. The aluminium fore-dome, and the insulating foam layer have been removed for clarit~
6. Ocean impact A landing of a space vehicle on an extraterrestrial hydrocarbon ocean is indeed anexotic and imaginative scenario, but is by no means improbable. While such an eventwould be a first in space exploration. the problem of landing on liquids is a fairlyfamiliar one in a terrestrial context.Vehicle splashdown loads were first considered theoretically in 1929 (although
there was some experimental work in the UK in 1919) by Von Karman:", for thepurpose of estimating landing loads on seaplane floats. but received detailedexamination for the Mercury and Apollo Programmes. Two theoretical approachesarc possible to estimate loads: one is to model the impacting probe as a source sheetin potential-flow theory. and compute the resulting pressure and flow distribution inthe liquid": the other is to assume that the impacting probe becomes 'loaded· witha virtual mass of ocean, using more-or-less empirical factors.The second method was found to give excellent agreement with results from scale
model and full-size impact experiments" and. being considerably simpler than thepotential-flow method. is used here. The method was also used to evaluatesplashdown loads on the crew compartment of the Space Shuttle 'Challenger' ".
Let us assume a mass M0 for the Probe. and vertical impact velocity V11• As itpenetrates. it becomes loaded with a virtual mass M, of liquid. with the Probe/liquidensemble moving at a velocity V. The virtual mass. which varies as a function of time.may be considered as the effective mass of liquid with which the Probe shares itsmomentum at a given instant.
Applying conservation of momentum and ignoring drag. weight and buoyancyforces (e.g. during the first 0.05 s of impact. weight would make only a I% changein the Probes momentum) gives
(I)
Differentiating.
0 (2)
100 ESA Journal 1994. Vol. 18
The virtual mass M, is usually taken as a fraction k (0.75 in Ref. 32 and 2/7r (=0.64)in Ref. 34: here k =0. 75 is used) of the mass of a hemisphere of liquid with a radiusR equal to that of the (assumed axisyrnmctric) body at the plane of the undisturbedliquid surface (Fig. 5). Thus. for a liquid of density o , the virtual mass is
For a general axisymmctric shape Rr=jtlt}, where h is the penetration distance. it 1seasy to show that
dM,
dh2hp R2 dR
dh
dhnoting that -
~ citdV
V and --- = adi
we obtain
(/ -- V2(27rkpR 2) dR
(M0+M,.) dh
These equations arc easy to solve numerically (indeed in the early days" thenumerical computation was performed manually). Terms for drag. weight andbuoyancy could be added. but do not significantly affect the peak loads.
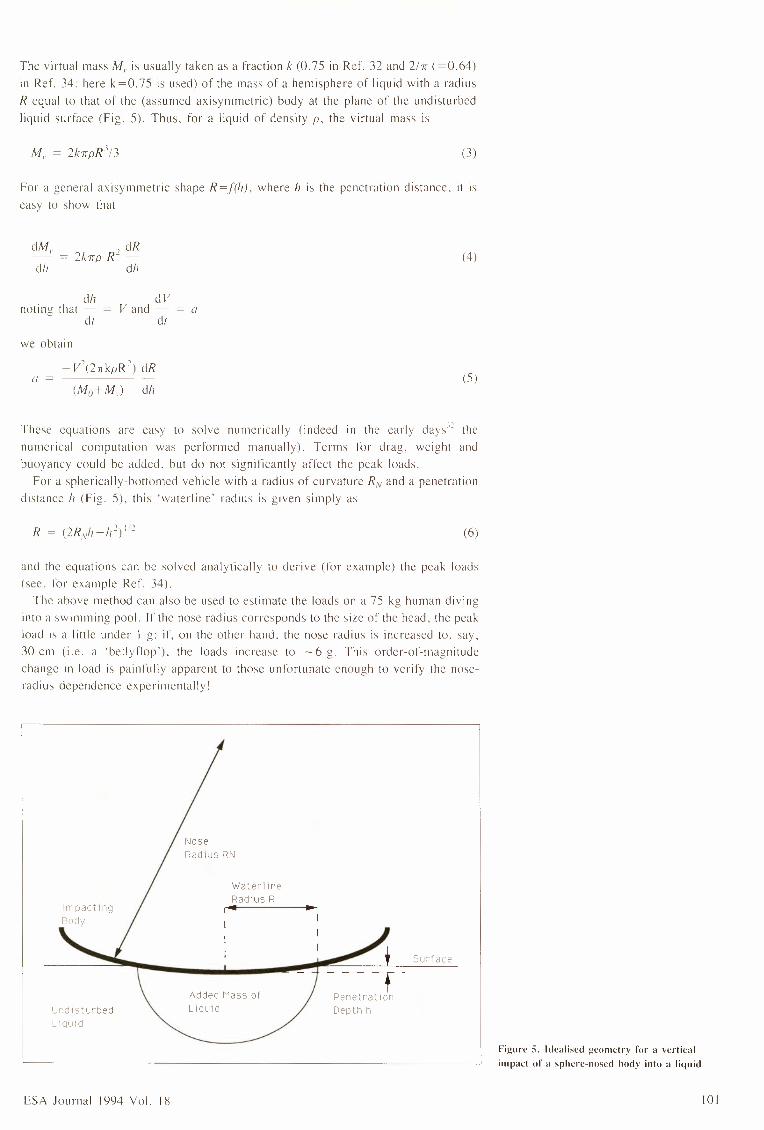
For a spherically-bottomed vehicle with a radius of curvature R, and a penetrationdistance h (Fig. 5). this 'waterline radius is given simply as
and the equations can be solved analytically to derive (for example) the peak loads(sec. for example Ref. 34).
The above method can also be used to estimate the loads on a 75 kg human divinginto a swimming pool. If the nose radius corresponds to the size of the head. the peakload is a little under I g: if. on the other hand. the nose radius is increased to. say.30 cm (i.c. a 'bcllyflop"). the loads increase to - 6 g. This order-of-magnitudechange in load is painfully apparent to those unfortunate enough to verify the noseradius dependence experimentally!
Radius RN
Added Mass ofL rouo1sturbed
cl IdDeoU-1 11
ESA Journal 1994 Vol. 18
(3)
(4)
(5)
(6)
Figure 5. Idealised geometry for a verticalimpact of a sphere-nosed body into a liquid
101

Deceleration (g)
6
5
4
2
0 L____.__O.O 0.01 0.02 0.()3 0.04
Time (seconds)
It is tempting to approximate the shape of the Probe with a sphere of 650 mm but,due to the sensitivity to nose radius. this might lead to underestimation of the peakloads. Figure 6 shows the acceleration versus time and speed versus time profiles fora 207 kg Probe splashing into liquid of density 600 kgm -3 for the actual HuygensProbe shape (see Appendix). A corresponding profile assuming a sphere of 650 mmradius is shown for comparison. It is apparent that the peak load is reached after about0.01 s, after the Probe has penetrated to a depth of about 5 cm. After the peak. theloads decay away: after this. drag. buoyancy and weight begin to significantly modifythe Probes motion. but this is not evaluated here.
(Note that there should be a slight jump in the acceleration level at about t=O. l sas the bulky attachment mechanisms used to hold the front shield during entry hit theliquid, but this has not been modelled here).The peak impact loads are shown in Figure 7 for the actual Huygens Probe shape
with mass 207 kg for various impact velocities and ocean densities (pure liquidmethane has a density of about 450 kgm -3• ethane about 600 kgm -3 and liquidnitrogen about 800 kgm -3). The ocean compositions suggested in Reference 35indicate the most likely density range as 600-650 kgm -3.A method similar to that above can be used to estimate the loads on appendages.
such as the booms of the Huygens Atmospheric Structure Instrument (HASI). Firstestimates suggest that the splash loads should generate bending moments at the boomroots of the order of 10 Nm. and so. provided the boom hinge attachments do not actas stress concentrators, the booms should survive.
It was found during tests on a 1/4-scale model of the Apollo Capsule" that verticallanding loads are virtually independent of any impact-velocity component parallel tothe surface. Additionally. impacts with the axis of the Capsule in a non-verticalorientation had lower accelerations (e.g. 60% of normal load for a 10° pitch atimpact) than the nominal vertical case (intuitively we might expect this. as theinterface of the spheroidal bottom of Apollo with the upper conical structure makesa 'sharp' corner which penetrates the ocean more easily than the 'blunt' bottom).Thus. loads along the main axis of the Probe at impact are highest for vertical
impact (the nominal case). The worst-case loads occur for a light Probe. high impactvelocity. and dense ocean. These worst-case loads arc about 13 g. assuming the Probeto be rigid: nominal loads are of the order of 9 g.Tests on the Apollo Module." showed that vehicles with non-rigid bottoms (such
as Huygens) may experience peak loads approximately 50% in excess of those~oo 500 Goo zoo 800 encountered with a rigid bottom. so perhaps a margin should be added to the above
figures (in Ref. 36. for example. accelerations of 38 g were measured whencalculations indicated a rigid-body value of 22 g). An estimate of the impact pressureon the Probe can be made by dividing the impact force (equals Probe mass timesinstantaneous acceleration) by the wetted surface area of the Probe. Ignoring the
Figure 6a. Deceleration and velocity profile forthe nominal impact case, assuming the Probeshape as described in the Appendix to beperfectly· rigid (drag and buoyancy notmodelled)
Figure 6b. Deceleration profile for the sameimpact case, but also showing the profilefor a spherical nose radius of 650 nun forcomparison (drag and buoyancy not modelled)
14 - V=S.8:§ ~yc: 12
- V=4.6 ..Q10:;;
~
Qi 10oQ)
0
-"'"' 8Q)a.
Ocean Density (kg/m3)
Figure 7. Peak impact decelerations for a207 kg Probe (assuming rigid 'real' shape)in various ocean densities at various speeds
102
Velocity (m/s)
0.05 0.o70.06
Probe shape
650mm sphere
()0.00.08 0.02 0.0.3 (I0-1 0.05
Time (s)().()7 0.080.01 0.06
ESA Journal 1994. Vol. 18
singularity at the instant of impact, this pressure is of the order of 10-20 Nlcm2.
Comparing this with the strengths of Probe elements (see Section 9 and the Appendix)indicates that the Probe will indeed deform, modifying the deceleration history givenin Figure 6. No attempt is made here. however, to model the coupled flow/structuraleffects.
Since the Huygens Probe is designed for (axial) entry loads of the order of 20 g inany case, the axial loads for liquid impact should be perfectly survivable. even witha margin for non-rigid effects imposed on the splash load predictions. Note. however.that the entry loads are conducted to the experiment platform via a different load path.leading to compressive stress on underside units.Should there be a sideways velocity component at impact. there will naturally be
a sideways (radial) acceleration. This will be small, however. compared with the axialloads (in Ref. 36. for example. an impact with an 11° pitch angle. a 7 ms - J verticalvelocity. and a 3 ms - 1 horizontal velocity had an axial load of 30 g. with a sidewaysload of only 2. 9 g). The radial loads on the Probe are in effect in the same directionas the launch loads (the Probe is attached sideways to the Cassin: Orbiter at launch).so that, given the anticipated impact conditions. sideways loads should not causedamage to the Probe. A sideways impact will also produce an angular accelerationpulse. but this is not considered further here.
After the initial acceleration pulse. the acceleration decays until the Probc 's entirelower surface is immersed. There will be a slight pulse due to liquid inertia loads onthe radar altimeter antennae and the appendages used to attach the Probe to its entryshield. After this. however, the inertia loads are minimal and the forces ofhydrodynamic drag and buoyancy are the most important. For the nominal(5.2 ms - J) vertical impact with an ethane ocean (600 kgm -1)_ the Probe will havebeen decelerated to about 2 .5 ms - J by the time its lower surface is completelyimmersed. Rough estimates suggest that the Probe will continue moving for anotherI s to a depth of about I m, with the top platform a few tens of centimetres belowthe depth of the ocean (the antennas should be submerged only momentarily. if at all).Buoyancy brings the Probe bobbing back up to the surface about 1.5 s after firstcontact. Note that the slightly lower impact loads and deeper penetration reported inReference 7 were computed for a somewhat narrower Probe shape. before the currentdesign had evolved.
In the event of a landing in a lake or sea. the subsequent dynamics and flotation 7. Post-impact dynamicscharacteristics of the Probe arc of interest. since these will affect the post-impact for liquid landingscienti fie measurements.A key question is naturally whether the Probe will float at all. Since the bulk density
of the Probe is of the order of 200-300 kgm -i. while that of the ocean (assumingit is free of bubbles) is about 600 kgm -i. the answer is that it will. However. thelevel at which it floats is also of interest, to determine whether the Descent Imagerand Spectral Radiometer (DISR) is above the 'waterline", and to verify that themeasurement cavity of the Surface Science Package (SSP) is below it. so that itstransducers are in contact with the liquid.
In order to determine the flotation level, a simple model (Fig. 8) has been set upto calculate the force and moment due to buoyancy for the Probe at any immersiondepth and orientation. This is done simply by assuming that the Probe isaxisyrnrnetric. and breaking it down into small clements. Simple geometry determineswhether each element is submerged or not: if submerged. it has a buoyant force equalto the weight of the displaced liquid. This force also has a moment arm associatedwith it. Summing these forces and moments allows the overall upthrust and torqueto be determined. These quantities are given in Figures 9 and 10 for a nominal oceandensity of 600 kgm -.i; the forces and moments scale directly with ocean density.
It is seen. by comparing the upthrusts with the Probe weight (Fig. 9), that the Probeshould float with the 'waterline· almost at the level of the Probe centre-of-gravity.Thus. happily. the DISR is above the surface. and the SSP cavity is filled.
ESA Journal 1994 Vol. 18 103
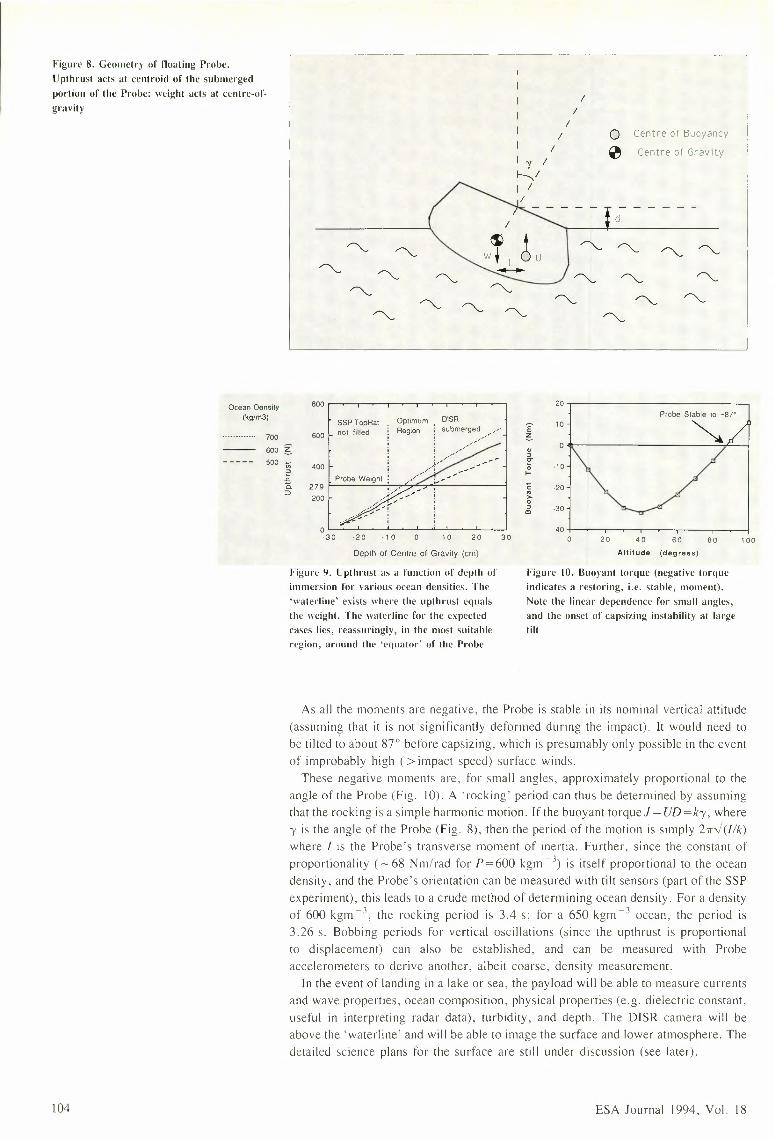
Figure 8. Ceometry of floating Probe.Upthrust acts at centroid of the submergedportion of the Probe: weight acts at centre-ofgravity
- - - - -I ~ • d
~ ~ ~\"- ~ ~ ~~ ~ ~ ~ ~ ~
~ ~~~ ~~ ~ ~~ ~
Ocean Density 800
(kg/m3) lSSP TopHat Optimum , DISR
700 600 not filled ! Region i submerge~........··
600 ~
500 ~ 400"..cc. 279:::i
200
104
Depth of Centre of Gravity (cm)
Figure 9. Upthrust as a function of depth ofimmersion for various ocean densities. The'wuterhne' exists where the upthrust equalsthe weight. The waterline for the expectedcases lies, rcassurlnglv, in the most suitableregion, around the 'equator' of the Probe
IIII O Centre or Buoyancy
~ Centre of Gr·avltyI
20
'E 10
~•• 0
"""0 -10,_c: -20~,..0
" -30<I)
-4030 0 20 40 60 80 100
Attitude (degrees)
Figure JO. Buoyant torque (negative torqueindicates a restoring, i.e. stable, moment).Xote the linear dependence for small angles.and the onset of capsizing instability at largetilt
As all the moments arc negative. the Probe is stable in its nominal vertical attitude(assuming that it is not significantly deformed during the impact). It would need tobe tilted to about 87° before capsizing, which is presumably only possible in the eventof improbably high (>impact speed) surface winds.These negative moments are. for small angles. approximately proportional to the
angle of the Probe (Fig. 10). A 'rocking.' period can thus be determined by assumingthat the rocking is a simple harmonic motion. If the buoyant torque J =VD =k-v . where'Yis the angle of the Probe (Fig. 8). then the period of the motion is simply 27r)(//k)where I is the Probe 's transverse moment of inertia. Further. since the constant ofproportionality ( - 68 Nm/rad for P=600 kgm -3) is itself proportional to the oceandensity, and the Probe 's orientation can be measured with tilt sensors (part of the SSPexperiment), this leads to a crude method of determining ocean density. For a densityof 600 kgm -1• the rocking period is 3.4 s; for a 650 kgm -3 ocean. the period is3.26 s. Bobbing periods for vertical oscillations (since the upthrust is proportionalto displacement) can also be established. and can be measured with Probeaccelerometers to derive another, albeit coarse. density measurement.
In the event of landing in a lake or sea. the payload will be able to measure currentsand wave properties. ocean composition. physical properties (c.g. dielectric constant.useful in interpreting radar data). turbidity. and depth. The DISR camera will beabove the 'waterline' and will be able to image the surface and lower atmosphere. Thedetailed science plans for the surface are still under discussion (see later).
ESA Journal 1994. Vol. 18
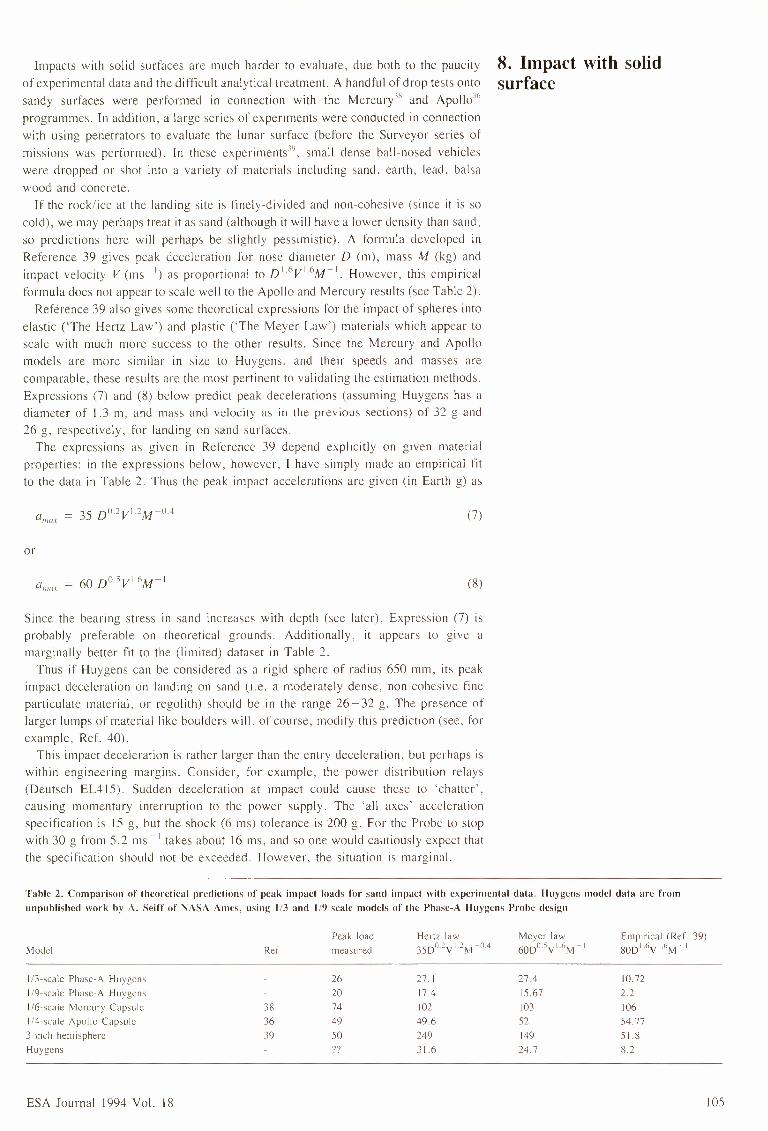
Impacts with solid surfaces arc much harder to evaluate, due both to the paucity
of experimental data and the difficult analytical treatment. A handful of drop tests ontosandy surfaces were performed in connection with the Mercury" and Apollo"programmes. In addition, a large series of experiments were conducted in connectionwith using penetrators to evaluate the lunar surface (before the Surveyor series ofmissions was performed). In these experiments:", small dense ball-nosed vehicleswere dropped or shot into a variety of materials including sand, earth, lead, balsawood and concrete.If the rock/ice at the landing site is finely-divided and non-cohesive (since it is so
cold), we may perhaps treat it as sand (although it will have a lower density than sand,so predictions here will perhaps be slightly pessimistic). A formula developed inReference 39 gives peak deceleration for nose diameter D (m), mass M (kg) and. I . V( -I) . 1 D16V16M-1 H hi . . IImpact ve ocity ms as proportrona to · · . owcver, t IS empmcaformula does not appear to scale well to the Apollo and Mercury results (see Table 2).Reference 39 also gives some theoretical expressions for the impact of spheres into
elastic ('The Hertz Law') and plastic ('The Meyer Law') materials which appear toscale with much more success to the other results. Since the Mercury and Apollomodels are more similar in size to Huygens, and their speeds and masses arccomparable, these results are the most pertinent to validating the estimation methods.Expressions (7) and (8) below predict peak decelerations (assuming Huygens has adiameter of 1.3 m, and mass and velocity as in the previous sections) of 32 g and26 g. respectively, for landing on sand surfaces.
The expressions as given in Reference 39 depend exp Iicitly on given materialproperties: in the expressions below, however, I have simply made an empirical fitto the data in Table 2. Thus the peak impact accelerations arc given (in Earth g) as
or
Since the bearing stress in sand increases with depth (see later), Expression (7) Isprobably preferable on theoretical grounds. Additionally, it appears to give amarginally better fit to the (limited) dataset in Table 2.Thus if Huygens can be considered as a rigid sphere of radius 650 mm, its peak
impact deceleration on landing on sand (i.e. a moderately dense, non-cohesive fineparticulate material, or rcgolith) should be in the range 26-32 g. The presence oflarger lumps of material like boulders will, of course, modify this prediction (sec, forexample, Ref. 40).
This impact deceleration is rather larger than the entry deceleration, but perhaps iswithin engineering margins. Consider, for example, the power distribution relays(Deutsch EL4 l5). Sudden deceleration at impact could cause these to 'chatter',causing momentary interruption to the power supply. The 'all axes' accelerationspecification is 15 g. but the shock (6 ms) tolerance is 200 g. For the Probe to stopwith 30 g from 5 .2 ms - I takes about 16 ms, and so one would cautiously expect thatthe specification should not be exceeded. However, the situation is marginal.
8. Impact with solidsurface
(7)
(8)
Table 2. Comparison of theoretical predictions of peak impact loads for sand impact with experimental data. Huygens model data arc fromunpublished work by A. Seiff of NASA Ames, using 1/3 and 1/9 scale models of the Phase-A Huygens Probe design
Peak load Hertz law Meyer law Empirical (Ref. 39)measured 35002y12M o4 60Dooyl6M-1 80016yl hM-1
26 27.1 27.4 10.7220 17.4 15.67 ' '74 102 103 10649 49.6 52 54.7750 249 149 51.8')') 31.6 24.7 8.2
Model Ref
1/3-scale Phase-A HuygensI/9-scalc Phase-A Huygens116-scalc Mercury CapsuleI/4-scale Apollo Capsule3-inch hemisphereHuygens
383639
ESA Journal 1994 Vol. 18 10.'i
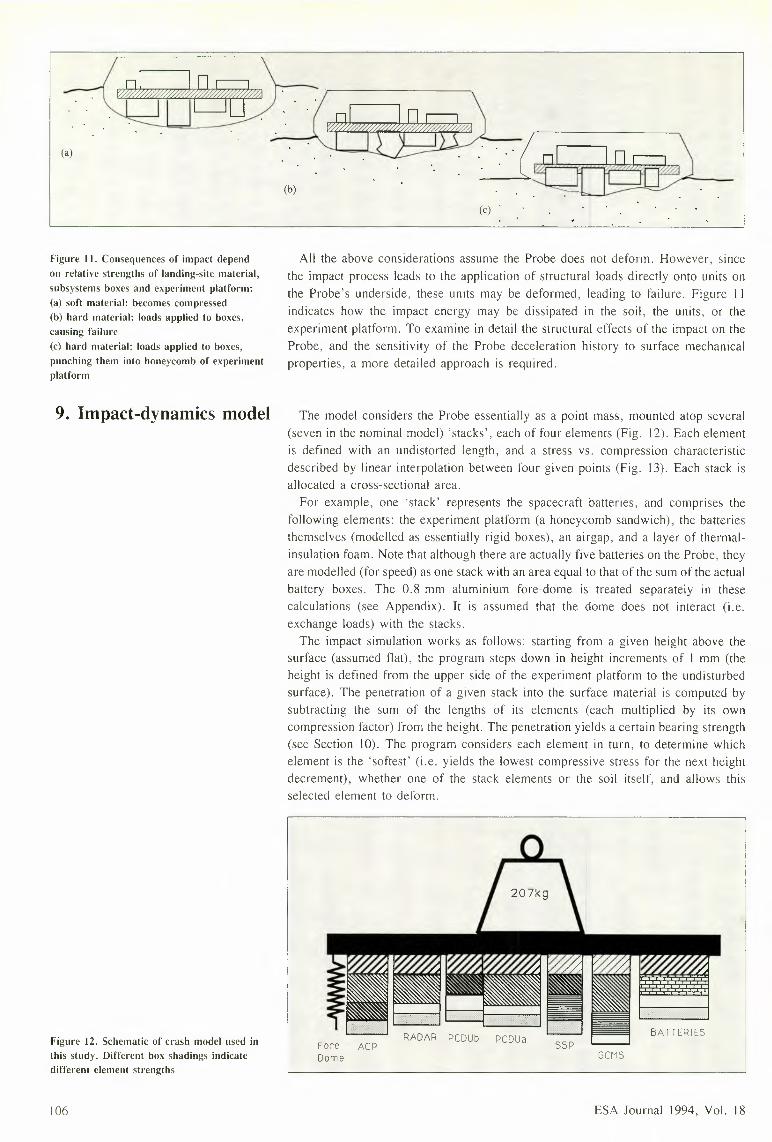
(a)_(f~~-
·.. ·.·.··.·.·.~-(b)
(c)
Figure 11. Consequences of impact dependon relative strengths of landing-site material,subsystems boxes and experiment platform:(a) soft material: becomes compressed(b) hard material: loads applied to boxes,causing failure(c) hard material: loads applied to boxes,punching them into honeycomb of experimentplatform
9. Impact-dynamics model
Figure 12. Schematic of crash model used inthis study. Different box shadings indicatedifferent clement strengths
106
All the above considerations assume the Probe does not deform. However. sincethe impact process leads to the application of structural loads directly onto units onthe Probes underside. these units may be deformed, leading to failure. Figure 11indicates how the impact energy may be dissipated in the soil, the units, or theexperiment platform. To examine in detail the structural effects of the impact on theProbe, and the sensitivity of the Probe deceleration history to surface mechanicalproperties. a more detailed approach is required.
The model considers the Probe essentially as a point mass, mounted atop several(seven in the nominal model) 'stacks', each of four elements (Fig. 12). Each elementis defined with an undistorted length. and a stress vs. compression characteristicdescribed by linear interpolation between four given points (Fig. 13). Each stack isallocated a cross-sectional area.
For example. one 'stack' represents the spacecraft batteries. and comprises thefollowing clements: the experiment platform (a honeycomb sandwich), the batteriesthemselves (modelled as essentially rigid boxes), an airgap, and a layer of thermalinsulation foam. Note that although there arc actually five batteries on the Probe, theyare modelled (for speed) as one stack with an area equal to that of the sum of the actualbattery boxes. The 0.8 mm aluminium fore-dome is treated separately in thesecalculations (see Appendix). It is assumed that the dome does not interact (i.e.exchange loads) with the stacks.The impact simulation works as follows: starting from a given height above the
surface (assumed flat). the program steps down in height increments of I mm (theheight is defined from the upper side of the experiment platform to the undisturbedsurface). The penetration of a given stack into the surface material is computed bysubtracting the sum of the lengths of its elements (each multiplied by its owncompression factor) from the height. The penetration yields a certain bearing strength(see Section 10). The program considers each element in turn, to determine whichelement is the 'softest' (i.e. yields the lowest compressive stress for the next heightdecrement). whether one of the stack elements or the soil itself, and allows thisselected element to deform.
ESA Journal 1994, Vol. 18
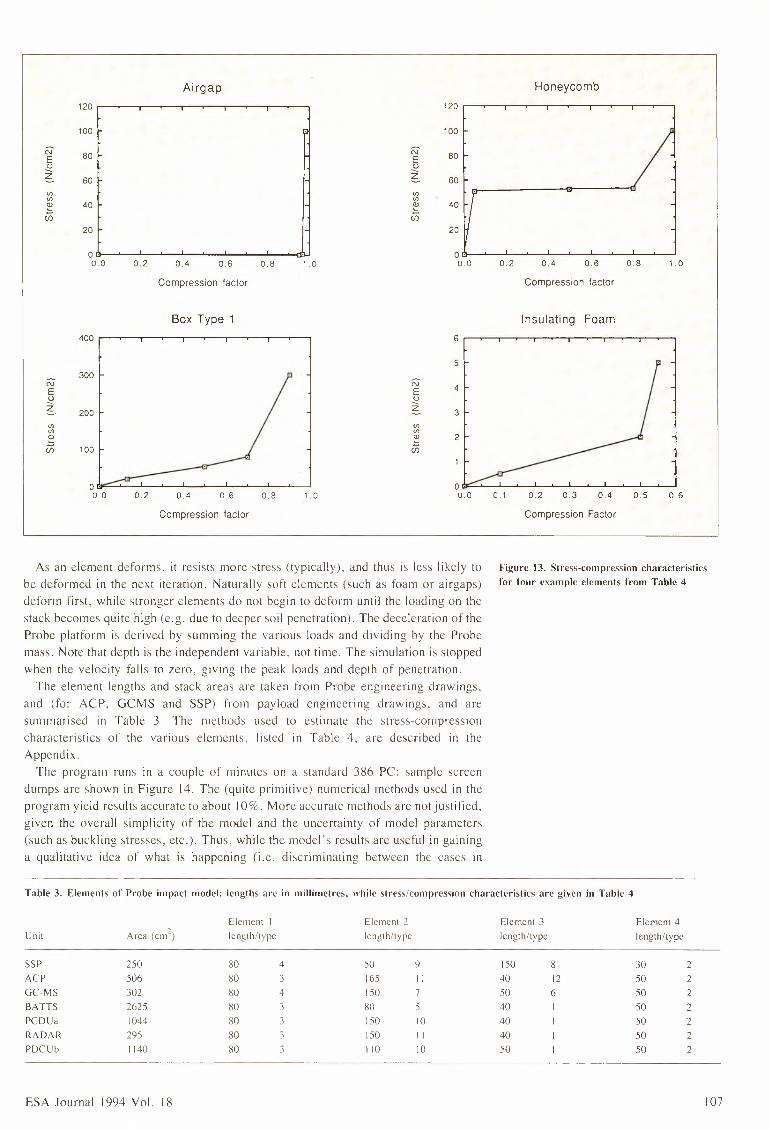
Airgap Honeycomb
120 120
100 100
C\J 80 C\J 80E E() oz 60 z 60<J) <J)<J) <J)
~ 40 e 40en en
20 20
O· o"u.o 0.2 0.4 0.6 0.8 1 .0 U.0 0.2 0.4 0.6 0.8 1.0
Compression factor Compression factor
Box Type 1 Insulating Foam400 6
5300
C\J C\J 4E Eo oz 200 z 3<J) <J)<J) <J)
~ ~ 2en 100 en :k::::
0.2 0.4 0.6 0.8 1.0 u.o 0.1 0.2 0.3 0.4 0.5 0.6
Compression factor Compression Factor
As an element deforms. it resists more stress (typically). and thus is less likely tobe deformed in the next iteration. Naturally soft clements (such as foam or airgaps)deform first. while stronger elements do not begin to deform until the loading on thestack becomes quite high (e.g. due to deeper soil penetration). The deceleration of theProbe platform is derived by summing the various loads and dividing by the Probemass. Note that depth is the independent variable. not time. The simulation is stoppedwhen the velocity falls to zero. giving the peak loads and depth of penetration.The element lengths and stack areas arc taken from Probe engineering drawings.
and (for ACP. GCMS and SSP) from payload engineering drawings. and aresummarised in Table 3. The methods used to estimate the stress-compressioncharacteristics of the various clements. listed in Table 4. arc described in theAppendix.The program runs in a couple of minutes on a standard 386 PC: sample screen
dumps are shown in Figure 14. The (quite primitive) numerical methods used in theprogram yield results accurate to about 10%. More accurate methods arc not justified.given the overall simplicity of the model and the uncertainty of model parameters(such as buckling stresses. etc.). Thus. while the model's results arc useful in gaininga qualitative idea of what is happening (i.c. discriminating between the cases in
Figure 13. Stress-compression characteristicsfor four example clements from Table 4
Table 3. Elements of Probe impact model: lengths arc in millimetres. while stress/compression characteristics are given in Table 4
l-Icmcnt I Element 2 Element 3 Element 4Unit Area (cm") length/type length/type length/type length/type
SSP 250 80 4 50 9 150 8 30 2ACP 506 80 3 1()5 11 40 12 50 2GC-MS 302 80 4 150 7 50 6 50 2BATTS 2625 80 3 80 5 40 I 50 2PCDUa 1044 80 .\ 150 10 40 I 50 2RADAR 295 80 .\ l'iO 11 40 I 50 2PDCL:h 1140 80 .\ 110 10 50 I 50 2
ESA Journal 1994 Vol. 18 107
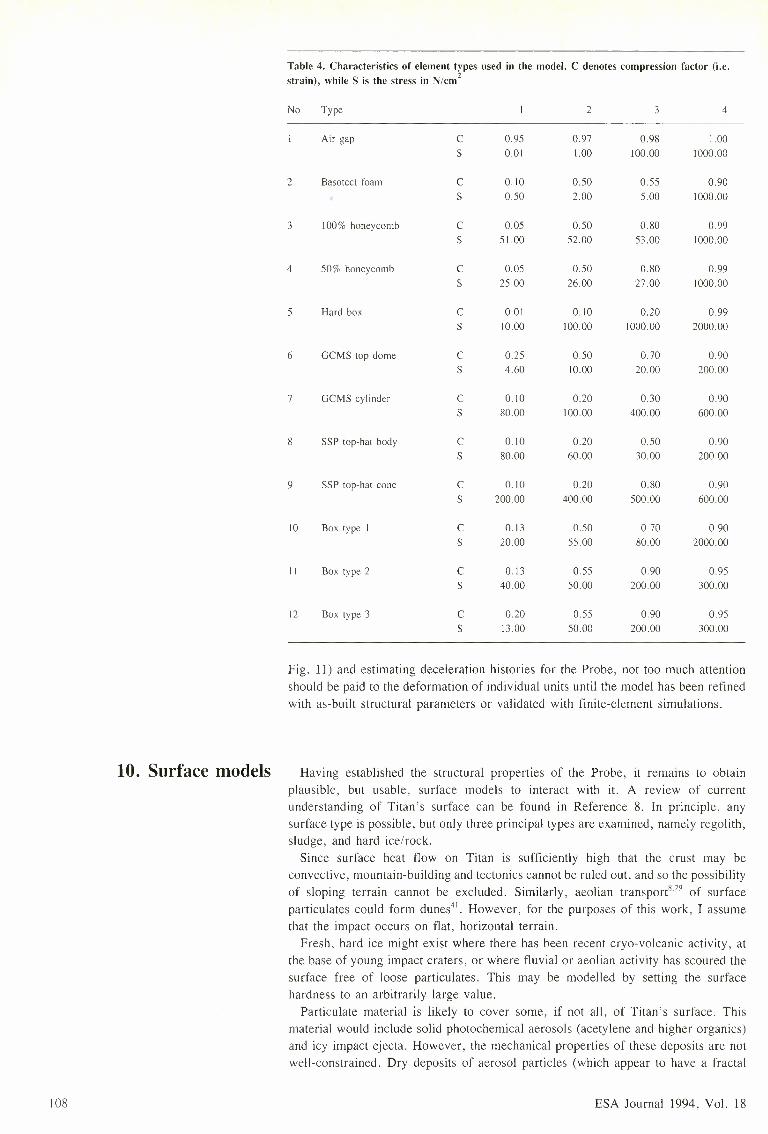
Table 4. Characteristics of element types used in the model. C denotes compression factor (i.e.strain), while S is the stress in N/cm2
No Type I 2 3 4
Air gap c 0.95 0.97 0.98 l.00s 0.01 l.00 100.00 1000.00
2 Basotect foam c 0.10 0.50 0.55 0.90s 0.50 2.00 5.00 1000.00
3 100% honeycomb c 0.05 0.50 0.80 0.99s 51.00 52.00 53.00 1000.00
4 50% honeycomb c 0.05 0.50 0.80 0.99s 25.00 26.00 27.00 1000.00
5 Hard box c O.Ol 0.10 0.20 0.99s 10.00 100.00 1000.00 2000.00
6 GCMS top dome c 0.25 0.50 0.70 0.90s 4.60 I0.00 20.00 200.00
7 GCMS cylinder c 0.10 0.20 0.30 0.90s 80.00 100.00 400.00 600.00
8 SSP top-hat body c 0.10 0.20 0.50 0.90s 80.00 60.00 30.00 200.00
9 SSP top-hat cone c 0.10 0.20 0.80 0.90s 200.00 400.00 500.00 600.00
IO Box type I c 0.13 0.50 0.70 0.90s 20.00 55.00 80.00 2000.00
II Box type 2 c 0.13 0.55 0.90 0.95s 40.00 50.00 200.00 300.00
12 Box type 3 c 0.20 0.55 0.90 0.95s 13.00 50.00 200.00 300.00
Fig. 11) and estimating deceleration histories for the Probe, not too much attentionshould be paid to the deformation of individual units until the model has been refinedwith as-built structural parameters or validated with finite-element simulations.
10. Surface models Having established the structural properties of the Probe, it remains to obtainplausible, but usable, surface models to interact with it. A review of currentunderstanding of Titan's surface can be found in Reference 8. In principle, anysurface type is possible, but only three principal types are examined, namely regolith,sludge, and hard ice/rock.Since surface heat flow on Titan is sufficiently high that the crust may be
convective, mountain-building and tectonics cannot be ruled out, and so the possibilityof sloping terrain cannot be excluded. Similarly, aeolian transport'':" of surfaceparticulates could form dunes". However, for the purposes of this work, I assumethat the impact occurs on flat, horizontal terrain.Fresh, hard ice might exist where there has been recent cryo-volcanic activity, at
the base of young impact craters, or where fluvial or aeolian activity has scoured thesurface free of loose particulates. This may be modelled by setting the surfacehardness to an arbitrarily large value.Particulate material is likely to cover some, if not all, of Titan's surface. This
material would include solid photochemical aerosols (acetylene and higher organics)and icy impact ejecta. However, the mechanical properties of these deposits are notwell-constrained. Dry deposits of aerosol particles (which appear to have a fractal
108 ESA Journal 1994, Vol. 18
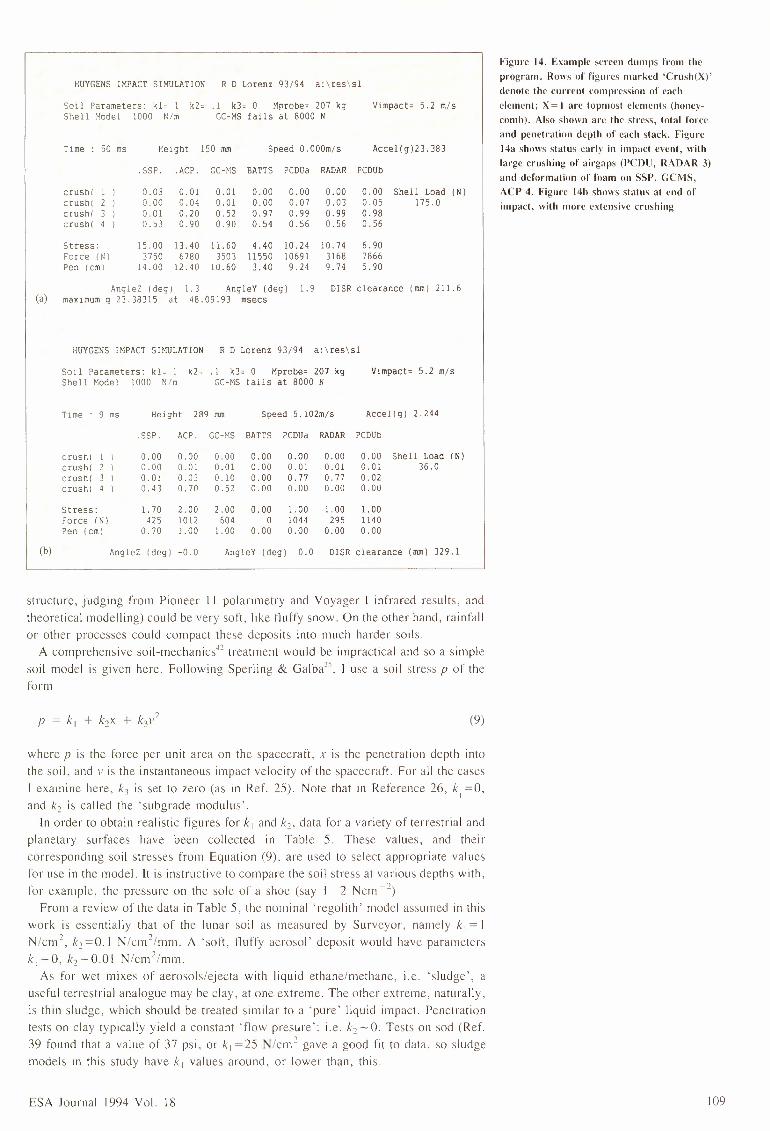
HUYGENS n!PACT SIMULATION RD Lorenz 93/94 a:\res\sl
Soil P3rameters: kl= I k2= .: k3= 0 Mprobe= 207 kgShell ~odel :ooo Nim GC-MS fails at 8000 N
Vimpact= 5.2 mis
Time 50 ms Height 150 mm Speed O.OOOm/s Accel(g)23.383
.SSP. .ACP. GC-"lS BATTS PCDUa RADAR PCDUb
crushl 1 I 0.03 0.01 0.01 0.00 0.00 0.00 0.00 Shell Load (N)crush( 2 I 0.00 0.04 0.01 0.00 0.07 0.03 0.05 175.0crushl 3 I 0.01 0.20 0.52 0.97 0.99 0.99 0.98c rusht 4 I 0.53 0.90 0.90 0.54 0.56 0.56 0.56
Stress: 15.00 13.40 11.60 4.40 10.24 10.74 6.90Force 1); l 3750 6780 3503 11550 10691 3168 7866Pen lcml 14.00 12.40 10.60 3.40 9.24 9.74 5.90
AngleZ ldegJ -1.3 AngleY (deg) 1.9 DISR clearance (mm) 211.6(a) maximum g 23.38315 at 48.09193 msecs
HUYGENS IMPACT SIMULATION RD Lorenz 93/94 a:\res\sl
Soil Parameters: kl= 1 k2= .1 k3= 0 Mprobe= 207 kgShell Model 1000 Nim GC-MS fails at 8000 N
Vimpact= 5.2 m/s
Time 9 ms Height 289 mm Speed 5.102m/s Accel(g) 2.244
.SSP. .ACP. GC-''.SBATTS PCDUa RADAR PCDUb
0.000.010.770.00
0.000.010.770.00
0.00 Shell Load (N)0.01 36.00.020.00
0.000.000.010.43
0.000.010.030.70
0.000.010.100.52
0.000.000.000.00
c rusru 1 )crushIcrush(crushI
1.0010440.00
1.00295
0.00
1.0011400.00
1.70425
0.70
2.0010121.00
2.006041.00
0.000
0.00
Stress:?orce INIPen lcml
(b) AngieZ (deg) -0.0 AngleY (deg) 0.0 DISR clearance (mm) 329.1
structure. judging from Pioneer 11 polarimetry and Voyager I infrared results. andtheoretical modelling) could be very soft, like fluffy snow. On the other hand. rainfallor other processes could compact these deposits into much harder soils.
A comprehensive soil-mechanics" treatment would be impractical and so a simplesoil model is given here. Following Sperling & Galba", I use a soil stress P of theform
where p is the force per unit area on the spacecraft. x is the penetration depth intothe soil. and 1· is the instantaneous impact velocity of the spacecraft. For all the casesI examine here. k3 is set to zero (as in Ref. 25). Note that in Reference 26, k1 =0,and k2 is called the 'subgrade modulus'.
In order to obtain realistic figures for k 1 and k 2• data for a variety of terrestrial andplanetary surfaces have been collected in Table 5. These values. and theircorresponding soil stresses from Equation (9). arc used to select appropriate valuesfor use in the model. It is instructive to compare the soil stress at various depths with.for example. the pressure on the sole of a shoe (say I~ 2 Nern -c.)
From a review of the data in Table 5. the nominal ·regolith · model assumed in thiswork is essentially that of the lunar soil as measured by Surveyor. namely k1=1Nzcm ', k2=0.l N/cm2/mm. A 'soft. fluffy aerosol' deposit would have parametersk , -0. k2-0.0l N/crn2/mm.
As for wet mixes of aerosols/ejecta with liquid ethane/methane, i.c. 'sludge'. auseful terrestrial analogue may be clay. at one extreme. The other extreme. naturally.is thin sludge. which should be treated similar to a 'pure' liquid impact. Penetrationtests on clay typically yield a constant 'flow prcsure ': i.e. k2-0. Tests on sod (Ref.39 found that a value of 37 psi. or k , =25 N/cm2 gave a good fit to data. so sludgemodels in this study have k , values around. or lower than. this.
ESA Journal 1994 Vol. 18
Figure 14. Example screen dumps from theprogram. Rems of figures marked 'CrushC\)'denote the current compression of eachelement; X=I are topmost elements (honeycomb). Also shown are the stress, total forceand penetration depth of each stack. Figure14a shows status early in impact event, withlarge crushing of airgaps (PCDU, RADAR 3)and deformation of foam on SSP, GCMS,ACP 4. Figure 14h shows status at end ofimpact, with more extensive crushing
(9)
109
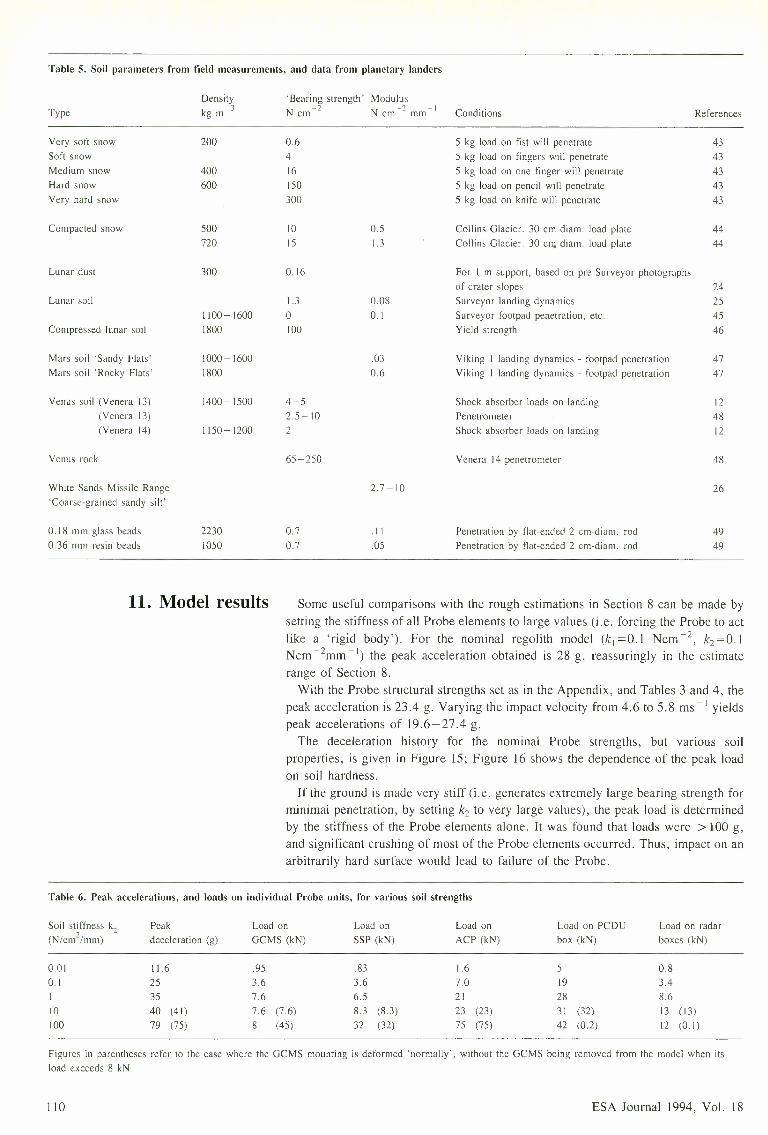
Table 5. Soil parameters from field measurements, and data from planetary landers
Density 'Bearing strength· Modulus-3 _, _, -I Conditions ReferencesType kg m N cm - N cm - mm
Vcry soft snow 200 0.6 5 kg load on fist will penetrate 43Soft snow 4 5 kg load on fingers will penetrate 43Medium snow 400 16 5 kg load on one finger will penetrate 43Hard snow 600 150 5 kg load on pencil will penetrate 43Very hard snow 300 5 kg load on knife will penetrate 43
Compacted snow 500 IO 0.5 Collins Glacier. 30 cm diam. load plate 44720 15 1.3 Collins Glacier. 30 cm diam. load plate 44
Lunar dust 300 0.16 For I m support, based on pre-Surveyor photographsof crater slopes 24
Lunar soil 1.3 0.08 Surveyor landing dynamics 251100-1600 0 0.1 Surveyor footpad penetration, etc. 45
Compressed lunar soil 1800 100 Yield strength 46
Mars soil 'Sandy Flats' 1000-1600 .03 Viking I landing dynamics - footpad penetration 47Mars soil 'Rocky Flats· 1800 0.6 Viking I landing dynamics - footpad penetration 47
Venus soil (Veneta 13) 1400-1500 4-5 Shock absorber loads on landing 12(Venera 13) 2.5-10 Penetrometer 48(Venera 14) 1150-1200 2 Shock absorber loads on landing 12
Venus rock 65-250 Venera 14 penetrometer 48
White Sands Missile Range 2.7-10 26'Coarse-grained sandy silt'
0. 18 mm glass beads 2230 0.7 .II Penetration by flat-ended 2 cm-diam. rod 490.36 mm resin beads 1050 0.7 .OS Penetration by flat-ended 2 cm-diam. rod 49
11. Model results Some useful comparisons with the rough estimations in Section 8 can be made bysetting the stiffness of all Probe elements to large values (i.e. forcing the Probe to actlike a 'rigid body'). For the nominal regolith model (k1=0.1 Ncm-2, k2=0.INern-2mm - I) the peak acceleration obtained is 28 g, reassuringly in the estimaterange of Section 8.With the Probe structural strengths set as in the Appendix, and Tables 3 and 4, the
peak acceleration is 23.4 g. Varying the impact velocity from 4.6 to 5.8 ms -l yieldspeak accelerations of 19.6-27.4 g.The deceleration history for the nominal Probe strengths, but various soil
properties, is given in Figure 15; Figure 16 shows the dependence of the peak loadon soil hardness.If the ground is made very stiff (i.e. generates extremely large bearing strength for
minimal penetration, by setting k2 to very large values), the peak load is determinedby the stiffness of the Probe elements alone. It was found that loads were > 100 g,and significant crushing of most of the Probe elements occurred. Thus, impact on anarbitrarily hard surface would lead to failure of the Probe.
Table 6. Peak accelerations, and loads on individual Probe units, for various soil strengths
Soil stiffness k., Peak Load on Load on Load on Load on PCDU Load on radar(N/cnhmm)
-deceleration (g) GCMS (kN) SSP (kN) ACP (kN) box (kN) boxes (kN)
0.01 11.6 .95 .83 1.6 5 0.8O.l 25 3.6 3.6 7.0 19 3.4
35 7.6 6.5 21 28 8.610 40 (41) 7.6 (7.6) 8.3 (8.3) 23 (23) 31 (32) 13 (13)100 79 (75) 8 (45) 32 (32) 75 (75) 42 (0.2) 12 (0 1)
Figures in parentheses refer to the case where the GCMS mounting is deformed 'normally', without the GCMS being removed from the model when itsload exceeds 8 kN
110 ESA Journal 1994, Vol. 18

40 60
:§c 50
:§ 30
r! ty--a-- k1=1,k2=0.1 .Q
c -----+-- k1= 1,k2=0.2 (ii.Q -"! 40iii ------ k1=1,k2=0.5 Q)
20 0a; Q)--0-- k1=1,k2=1 0Qi 300 ------ k1=1 O,k2=0 EQ)0 ::J
10 --0-- k1=20,k2=0 E')( 20
"':::?10
10 20 30 40 50 -1 0 1 2 3Time (ms) log (k1 +50k2)
For the nominal Probe model, landing onto rcgolith, the peak deceleration ismarginally above the entry g-load. Some slight deformation of the GCMS and PCDUoccurs, and the experiment platform above the SSP and GCMS is somewhatdeformed. Nevertheless, at least partial Probe operation after such an impact seemslikely.For heavy sludge impact, the partitioning of loads is less effective than for rcgolith
and so the GMCS and its attachment to the experiment platform would be damaged,with the ACP and SSP also receiving large loads. However. the Probe stopssufficiently quickly that loads arc not applied to the PCDU box. so that survival ofthe Probe (and topside experiments such as the DISR) is still probable.
Landing on fluffy aerosols (/..:1=0. /..:2=0.01) leads to modest g-loads, and verylittle deformation of the Probe. However. the Probe docs penetrate deep enough forthe sensor head of the DISR to be buried. compromising post-impact imaging.The caveat mentioned in Section 9 is repeated: while the depth of penetration and
deceleration histories predicted by the model arc probably representative. thestructural results for individual units should be trusted only qualitatively.
--a-- k1=0-----+-- k1=1
------ k1=5--0-- k1=10
------ k1=50
Figure 15. Deceleration profiles for varioussoil parameters
Figure 16. Correlation of peak g-load withaverage strength of top 10 cm of soil
For a scientific data return post-impact, one or more of the experiments must 12. Probe survival andsurvive the impact. the power system must remain operational. and at least one of the post-impact scienceredundant data-handling and transmission chains must function. An additional aspectis that the attitude of the Probe must be such as to keep the orbiter spacecraft withinthe antenna lobe to keep the radio link open. As the Huygens Probe is relatively flat-bottomed, this is quite probable. Furthermore, the link is guaranteed for Probeattitudes up to 10° from normal. so for shallow slopes at least (and surfaces with'boulders' of the order of 20 cm) the attitude of the Probe should not be sufficientlyperturbed to break the link: without knowledge of Titan's topography, it is impossibleto assign probabilities to this (see Ref. 50 for an approach where topography isknown). Should there be a significant horizontal velocity component at impact. theProbe could also roll".Other aspects vital to Probe survival (e.g. thermal environment) arc unlikely to be
dramatically altered at impact (although the performance of the insulating foam willbe degraded by crushing). The mission energy and link budgets are guaranteed fora minimum of 3 min after impact but. depending on the exact descent location (whichaffects the time-above-horizon and link margin of the radio link to the Cassini SaturnOrbiter) and spacecraft performance in terms of energy utilisation, could permit asomewhat longer surface mission. of perhaps 30 min or more. Thus impact damageis probably the main constraint on surface operation.As for the experiment payload. the Ultra-Stable Oscillator for the Doppler Wind
Experiment. the Huygens Atmospheric Structure Instrument. and the Descent
ESA Journal 1994 Vol. 18 111

13. Impact-dynamicsmeasurements
112
Imager/Spectral Radiometer are all on the upper side of the experiment platform, asare the electronics for the Surface Science Package. These elements (including theaccelerometers which will measure the impact accelerations, and may subsequentlysearch for seismic activity) should be safe from impact damage by crush loading.The Aerosol Collector/Pyrolyser (ACP) is mounted on the lower surface, but has
completed its mission well before impact. The 'TopHat' sensor accommodationstructure of the Surface Science Package is made of glass-fibre panels and insulatingfoam. In the event of an impact with a hard surface, the TopHat will probably break,although the individual sensor subsystems may still function (in any case, most ofthese sensors are optimised for liquid surfaces, so the science loss in this scenario issmall). The Gas Chromatograph/Mass Spectrometer is a long cylindrical instrumentand projects from the base of the Probe through the experiment platform. A hardimpact will probably crush the inlets of the instrument, although some instrumentoperation may still be possible (the inlets are heated to volatilise surface material foranalysis); extreme loading would punch the GCMS through the experiment platform.Thus a reasonable portion of the payload should remain operational after impact on
a solid surface, in particular the Descent Imager/Spectral Radiometer, on the upperpart of the spacecraft. which will be able to return images (using its side-lookingimager) and spectra from the surface. Additionally, upward-looking photometricsensors on this instrument will be able to measure any impact-generated dust cloud(see later). A group has been set up within the Huygens Science Working Team(HSWT) to consider the measurements that are expected (or should be aimed for)post-impact.
The impact decelerations of Huygens will be recorded by the accelerometers of theHASI experiment (three-axis piezoresistive, with a force-balance ('servo')accelerometer along the vertical axis, all mounted near the Probe centre of gravity,and by a piezoelectric accelerometer in the SSP electronics box, about 20 cm fromthe Probe axis. Since both the SSP and HASI are on the upper side of the experimentplatform, they should measure accelerations similar to those predicted by the model(i.e. they are in the same location as the 207 kg mass in Figure 12). Combining thedata from both sensors should allow the elimination of structural oscillationsgenerated by the impact.
As seen from Figure 7, the peak deceleration is a possible way of measuring oceandensity. However, given the uncertainty in Probe structural effects and the presenceof various appendages, etc., on the fore-dome, it should probably not be relied upon.The bobbing/rocking periods described in Section 7 may be better in this respect. Inany case, ocean composition will be measured directly by the GCMS, and byinference from physical-properties measurements (refractive index, speed of sound,density, etc.) on the SSP.The impact deceleration for landing on solid surfaces is strongly dependent on soil
hardness. From the peak load alone it is not possible to discriminate between high-z.and high-z, materials, although the combination of the two (e.g. k, +50 k2 is ameasure of the average bearing strength in the top I0 cm of soil) does show a broadcorrelation with peak load (Fig. 16) for weaker soils. However, examining theacceleration-time profiles (Fig. 15) shows that high-x, materials (sludge) have amuch faster rise-time than high-e. materials. It is possible to discriminate sludgefrom liquids because, although their rise times are similar, the peak load for sludgeis higher. Further investigations with the model will explore the sensitivity ofacceleration profiles to surface properties, and variation of the stiffness of Probestructural elements.It is probably impossible to discriminate from accelerometry between coarse and
fine-grained soil deposits and, for that matter, determine soil stiffness for hard soils.However, there is a small impact sensor or 'penetrometerf that forms part of theUniversity of Kent's Surface Science Package (SSP), comprising a small ( 14 mmdiameter) force transducer mounted on a short mast projecting from the bottom of theProbe. The force profile measured by this instrument (over a much shorter time scale,
ESA Journal 1994, Vol. 18

and thus corresponding to a much smaller spatial scale) should give an indication of
particle size in the range 4-25 mm. discriminate between cohesive and non-cohesivesurface materials. and give a better indication of soil stiffness for regolith and hardersoils.Identification of particle size would provide an indication as to whether the surface
materials at the landing site had been sorted by aeolian or tluvial processes. Forexample. pyroclastic fall deposits (tephra) from terrestrial volcanoes often display astrong central peak in a grain-size histogram" due to 'winnowing' by wind as theerupted material falls back to Earth.
Following the landing of spacecraft on Ven us and Mars. optical measurements haveindicated the generation of dust clouds. These have been thrown up owing to theinteraction of the aerodynamic wakes of the Venera and Pioneer Venus probes andthe retro-rockets on the Viking spacecraft". Calculations of the mass andmomentum in the aerodynamic wake of Huygens. and a comparison of the terminaldescent velocity of dust particles on Mars. Venus and Titan61• suggests that a similarphenomenon may occur at the Huygens impact.Generation of a dust cloud implies that material at the landing site is fine and non
cohesive. Efforts'''57 to measure the particle size on the basis of the opacity history(i.e. decay time) of the dust cloud have been relatively unsatisfactory. as theinteraction of the wake with the ground is complex. However. recent theoretical andexperimental investigations'f'" of the associated fluid-dynamics processes (e.g. thewake of a decelerating disk is of interest for the sometimes catastrophic 'wakerecontact' problem in parachute dynamics where the wake catches up with adecelerating parachute and causes it to deflate) show promise that. by the timeHuygens reaches Titan, interpretation of dust-cloud data should yield better results.A significant complication for Huygens is the fact that the parachute is still attached:
it may he difficult to discriminate a drop in ambient light due to a dust cloud fromthat due to the parachute'",
14. Impact-induced dustclouds
Simple analytical expressions have been presented for estimating the impact 15. Conclusionsdecelerations when landing space probes onto liquid and solid (particulate) surfaces.While necessarily limited in utility. these expressions are convenient 'rules of thumb'.
A modest numerical model has been presented to make more accurate predictionsof the Huygens impact-deceleration history for impacts onto solid surfaces. Thismodel has enabled the investigation of the sensitivity of impact deceleration to surfacemechanical properties. and the estimation of the Probe 's deformation during theimpact.These studies. and analogy with the Pioneer Venus and other missions. lead us to
be cautiously optimistic about the prospects for a productive scientific return from thesurface of Titan. Additionally, measurements of the impact deceleration and anyimpact-induced dust cloud will make modest. but useful. contributions to ourknowledge of the physical state of Titan's surface.
The author acknowledges the support of the ESA Huygens Project. and a Acknowledgementspostgraduate research grant from the UK SERC/PPARC. Some early parts or thework reported here were conducted while the author was a Young Graduate Traineein the Huygens Project Team (PYP) at ESTEC in 1990/91.
Useful insights into crash-dynamics analysis techniques for aerospace vehicles weregained hy a visit to the Cranfield Impact Centre Ltd .• and fruitful discussions therewith Dr Sadeghi and his colleagues. 8. Stcckcmetz, of OHB System (Germany)helpfully provided details of the ESA Mars Lander study.A. Seiff of San Jose State University (USA) is thanked for providing unpublished
model impact data. J. Underwood of Martin Baker Aircraft (UK) is thanked forproviding Figure 3.
ESA Journal 1994 Vol. 18 113
References
The review of an early version of the paper by J-P. Lebreton of ESA Space ScienceDepartment is gratefully acknowledged, as are useful discussions with members of theHuygens Science Working Team, in particular T. Owen and J. Lunine.The author thanks the following individuals for their cooperation in providing
information on the Huygens Probe, payload and components: D. Wyn-Roberts(ESTEC, NL), M. Bannister (RAL, UK), J-F. Brun and M. Tintignac (CNRS,France), A. Nairn (ETCA, Belgium), C. Lewis and S. Way (GSFC, USA) andJ. Underwood (Martin Baker, UK).
I. Kohhase C. 1993, Meeting with a Majestic Giant: The Cassini Mission toSaturn, The Planetary Report, Vol. 13, No. 4, pp. 5-10.
2. Lebreton J-P. & Matson D. 1992, An Overview of the Cassini Mission,II Nuovo Cimento. Vol. 15C, pp. 1137-1147.
3. Lebreton J-P. & Matson D. 1990, Cassini - A Mission to Saturn and Titan,Proc. 24th ESLAB Symposium on the Formation of Stars and Planets and theEvolution of the Solar System, Freidrichshafen, September 1990, ESA SP-315,November 1990, pp. 7-12.
4. Lebreton J-P. 1992, The Huygens Probe, Proc. Symposium on Titan,Toulouse, 9-12 September 1991, ESA SP-338, April 1992, pp. 287-292.
5. Mooij E. 1992, De Cassini-missie, Ruimtevaart , June 1992, pp. 2-8.6. NASA/ESA Cassini Phase-A Study, ESA/SCI 88(5).7. Lorenz R. 1992, Huygens Probe - The Surface Mission, Proc. Symposium on
Titan, Toulouse, 9-12 September 1991, ESA SP-338, April 1992, pp.359-364.
8. Lorenz R. 1993, The Surface of Titan in the Context of ESA's Huygens Probe,ESA Journal, Vol. 17. pp. 275-292.
9. Lebreton J-P .. Verdant M. & Wills R. 1994, Huygens: The Science, Payloadand Mission Profile, ESA Bulletin No. 77, February 1994, pp. 31-41.
10. Hassan H., McCarthy C. & Wyn-Roberts D., Huygens - A Technical andProgrammatic Overview, ESA Bulletin No. 77, February 1994, pp. 21-30.
11. Wilson A. 1987, Solar System Log, Janes Publishing Company 1987.12. Arduevsky V.S. et al. 1983, Physico-Mechanical Characteristics of the
Venusian Surface by Measuring Shock-Worker at Landing of AutomaticStations Venera 13and Venera 14 (in Russian), Kosmicheski Issledovania, Vol.21, pp. 331-339.
13. Fimmel R.O., Colin L. & Burgess E. 1983, Pioneer Venus, NASA SP-461.14. Brodsky R.F. (Ed.) 1985. Pioneer Venus Case Study in Spacecraft Design,
AIAA Professional Study Series.15. Hanson A.H. 1978, Antenna Design for Pioneer Venus Probes, IEEE
International Symposium Digest - Antennas and Propagation, 15-19 May1978, Washington DC.
16. Melosh R.J. & Karat M.F. 1977, Computer Simulation of Light-AircraftCrash, J. Aircraft, Vol. 14, No. 10, pp. 1009-1014.
17. Fasanella E.L., Widmeyer E. & Robinson M.P. 1986, Structural Analysis ofthe Controlled Impact Demonstration of a Jet Transport Plane, AIAA-86-0939,27th Structures, Structural Dynamics and Materials Conference, San Antonio,Texas, May 1986.
18. Argyris J., Balmer H.A., Doltsinis I.S. & Kurz A. 1986, ComputerSimulations of Crash Phenomena, Int. J. Numerical Methods in Engineering,Vol. 22. pp. 497-519.
19. Argyris J.. Balmer H. & Doltsinis I.S. 1988. Some Thoughts on ShellModelling for Crash Analysis, Computer Methods in Applied Mechanics andEngineering, Vol. 71, pp. 341-365.
20. Hagiwara I., Satoh Y. & Tsuda M. 1990, Study of an analytical technique andsystem for conducting vehicle crash simulations. Int. J. Vehicle Design, Vol.II, pp. 564-577.
21. Miller G.K. 1993, Calculation of Impact Loads for High-Energy Drops ofCylindrical Containers, Int. J. Impact Engineering, Vol. 13, pp. 511-526.
114 ESA Journal 1994, Vol. 18
22. Thomson R.P. 1966, The Practical Problem of Landing on Mars, Aeronautics& Astronautics, July 1966, pp. 66-73.
23. Steckemetz B., Wienss W., Bradbury B.. Pickett A .. Natcnbruck P. &Roumeas R. 1993, Flight and Impact Dynamics of Landers for MarsExploration, IAF-93-Q. l .379, Presented at the 44th International AstronauticalFederation, Graz , Austria, October 1993.
24. Jaffe L.D. 1965, Strength of the Lunar Dust, 1. Geophys. Res., Vol. 70, pp.6139-6146.
25. Sperling F. & Garba J. 1967, Treatise on the Surveyor Lunar LandingDynamics and an Evaluation of Pertinent Telemetry Data Returned by Surveyor1, Technical Report 32-1035. Jet Propulsion Laboratory. Pasadena. USA.
26. Mironet A .. Urquhart R. & Walters R. 1983, Limiting Payload Decelerationduring Ground Impact. 1. Spacecraft & Rockets. Vol. 20, pp. 193 - 194.
27. Neal M.F. & Wellings P.J. 1993. Descent Control System for the HuygensProbe, AIAA 93-1221 RAeS/ AIAA 12th Aerodynamic Decelerator SystemsTechnology Conference, London, 10-13 May 1993.
28. Lellouch E. & Hunten D.M. 1989, Titan Atmosphere Engineering Model.ESLAB 87/199 (sec also Lcllouch ct al. 1989, Titan's Atmosphere and Ocean:A re-analysis of the Voyager l IRIS 7.7 micron data, Icarus, Vol. 79, pp.328-349).
29. Allison M. 1992, An Assessment of Titan's Boundary Layer, Symposium onTitan. Toulouse, September 1991, ESA SP-338, pp. 113-118.
30. Von Karman T. 1929. The Impact of Seaplane Floats during Landing, NACATN-321, October 1929.
31. Parr W.E. 1966, Water Entry. Proc. Seminar on Theoretical Inviscid FluidMechanics NOL TR 66-19 l,US Naval Ordnance Laboratory, September 1966.
32. McGehee R .. Hathaway M.E. & Vaughan V.L. Jr. 1959, Water-LandingCharacteristics of a Reentry Capsule, NASA Memorandum 5-23-59L.
33. Wierzbicki T. & Yue D.Y. 1986. Impact Damage of the Challenger CrewCompartment. 1. Spacecraft & Rockets, Vol. 32. pp. 646-654.
34. Hirano Y. & Miura K. 1970. Water Impact Accelerations of Axially SymmetricBodies, J. Spacecraft & Rockets, Vol. 7. pp. 762-764.
35. Dubouloz N .. Raulin F .. Lcllouch E. & Gautier D. 1989, Titan's HypothesizedOcean Properties: The influence of Surface Temperature and AtmosphericComposition Uncertainties. Icarus . Vol. 82, pp. 81-96.
36. Stubbs S.M. 1967, Dynamic Model Investigation of Water Pressures andAccelerations Encountered during Landings of the Apollo Spacecraft, NASATN D-3980.
37. Stubbs S.M. & Hathaway M.E. 1967, Effects of Bottom-Structure Flexibilityon Water Landing Loads of Apollo Spacecraft Models, NASA TN D-5108.
38. Vaughan V. L. 1961, Landing Characteristics and Flotation Properties of aReentry Capsule, NASA TN D-655.
39. McCarty J.L. & Carden H.D. 1962. Impact Characteristics of VariousMaterials Obtained by an Acceleration-Time-History Technique Applicable toEvaluating Remote Targets, NASA TN D-1269.
40. McCarty J.L. & Howlett J.T. 1969, Protuberance Effects on Limiter-EquippedHard Landing Payloads. Shock & Vibration Bulletin 40, pp. 183- 191.
41. Grier J.A. & Lunine J.I. 1993. Speculation into Possible Aeolian and FluvialDunc Deposits on Titan, Bull. Amer. Astron. Soc., Vol. 25. p. 1105.
42. Scott R.F. 1963, Principles of Soil Mechanics. Addison-Wesley, Reading.Massachusetts.
43. Perla R.I. & Martinelli M. 1976, Avalanche Handbook, Agriculture Handbook489, US Department of Agriculture, Forestry Service.
44. Rctamal E. 1983, Some Experimental Results on Snow Compaction, Proc. 5thInternational Conference on Permafrost. Fairbanks. Alaska. pp. l054- 1059.
45. Jaffe L.D. 1969, Lunar Surface Material: Spacecraft Measurements of Densityand Strength, Science, Vol. 164, pp. 1514-1516.
46. Jaffe L.D. 1971, Bearing Strength of Lunar Soil, The Moon. Vol. 3. pp.337-345.
ESA Journal 1994 Vol. 18 115
47. Shorthill R.W., Moore H.J., Scott R.F., Hutton R.E., Liebes S. & SpitzerC.R. 1976, The 'Soil' of Mars (Viking 1) Science, Vol. 194, pp. 91-97.
48. Kemurdzan A.L. et al. 1983, Preliminary Results of the Determination ofPhysico-Mechanical Properties of Venusian Ground by Soviet AutomaticStations Venera-13 and Venera-14 (in Russian), Kosmicheski Issledovania,Vol. 21, pp. 323-330.
49. Yamashiro M. & Yuasa M. 1983, A Penetration Test for Granular Materialsusing Various Tip Angles and Penetrometer Shapes, Powder Technology, Vol.34, pp. 99-103.
50. Chenoweth H.B. 1971. Monte Carlo Simulation of the Apollo CommandModule Land Landing. J. Spacecraft & Rockets, Vol. 8. pp. 1074-1078.
51. Perminov V .G. 1990, Dynamics of Soft Landing of Spherically-Shaped Probes,Cosmic Research. Vol. 28, pp. 960-965 (translated from KosmicheskieIssledovaniya, Vol. 28, pp. 539-544, 1990).
52. Lorenz R. et al. 1994, An Impact Penetrometer for a Landing Spacecraft, tobe published in Measurement Science & Technology.
53. Francis P. 1993, Volcanoes: A Planetary Perspective, Oxford University Press.54. Garvin J.B. 1981, Landing Induced Dust Clouds on Venus and Mars. Proc.
Lunar and Planetary Science Conference l 2B, pp. 1493-1505.55. Lorenz R. 1993, Wake-Induced Dust Cloud Formation following Impact of
Planetary Landers, Icarus. Vol. 101, pp. 165-167.56. Moshkin B.E., Ekonomov A.P. & Golovin Yu.M. 1979, Dust on the Surface
of Venus, Cosmic Research, Vol. 17, pp. 232-237 (translated fromKosmicheskii Issiedovania, Vol. 17, pp. 280-285, 1979).
57. Ragent B. & Blamont J. 1979, Preliminary Results of the Pioneer VenusNephelometer Experiment, Science, Vol. 203, pp. 790-792.
58. Balligand H. A. & Higuchi H. 1993, Wake of a Decelerating Disk,AIAA-93-1218, Proc. 12th RAeS/AIAA Aerodynamic Decelerator SystemsTechnology Conference, London, May 1993.
59. Walker J.D.A., Smith C.R., Cerra A.W. & Doligalski T.L. 1987, The Impactof a Vortex Ring on a Wall, J. Fluid Mechanics, Vol. 181, pp. 99-140.
60. Lorenz R.D. 1993, Scientific Implications of the Huygens Parachute System,AIAA-93-1215, Proc. 12th RAeS/AIAA Aerodynamic Decelerator SystemsTechnology Conference, London, May 1993.
61. Timoshenko S. 1940, Theory of Plates and Shells, McGraw-Hill, New York.62. Weber H. & Krueckau F. 1985, New Melamine-based Elastic Foam, translated
from Kunstoffe, Vol. 75, pp. 843-848.
Appendix Shape and Strength of Probe ShellThe Probe shape used in this study for the liquid-impact and post-impact dynamics
is that of the outer aluminium shell, and is taken from Aerospatiale drawings.Essentially it is a dome with radius of curvature 1.25 m, until 15 cm along the Probe 'scentral axis, when it becomes 15 cm, to meet a short cylindrical section (height- 7 cm, diameter 1.3 m) which corresponds to the location of the experimentplatform. For about 30 cm above this, the shell is conical, meeting the flat topplatform of 1. I m diameter.The various appendages (attach mechanisms, HASI booms, radar-altimeter
antennae and the DISR) are not considered.For the impacts with a solid surface, the contact area with the soil is computed by
assuming the fore dome is an ellipsoid of revolution, with major and minor axes equalto the diameter and height of the actual shell.Calculation of the force/deformation characteristics of even a simple shell is
difficult (see, for example, Ref. 61) and so it has been assumed here that the shellobeys a linear force/deformation law. Thus, the force on the shell is directlyproportional to the distance between the surface and where the shell's apex would behad it not been deformed, except where this force is more than the surface bearingstrength multiplied by the contact area, in which case the shell force is set to be thelatter.
116 ESA Journal 1994, Vol. 18
In the nominal model, a shell force constant of IOOO Nim has been used.Investigation of various impact cases suggests that the impact deceleration history isrelatively insensitive to variations of one order of magnitude in this parameter. In thiscase, the work done in deforming the shell is only about 2% of the impact kineticenergy.
Estimation of Structural Characteristics of Probe Underside UnitsDetailed study of each individual unit could yield accurate stress/compression
relations. However, this would be impractably labour-intensive. and difficult tojustify given the uncertainties elsewhere (e.g. in the soil models, impact orientation.etc.). Thus what follows is a set of engineering estimates, using rules-of-thumb. toderive first-order guesses for the response of individual clements. The loads andaccelerations calculated by the model arc only modestly sensitive to variations inindividual clement properties: the aggregate validity of the 28 elements should beadequate. Consequently. it is hoped that the results of the model arc believable.Only the aluminium fore-dome. parts of the insulating foam. and exposed
experiment components will he chilled to ambient temperature (94 K). and so theengineering properties assumed here arc the room-temperature values. obtained fromstandard data books. except where indicated otherwise.Air gaps have essentially zero bearing strength until their compression exceeds
95 % , when the strength is increased to transfer loads to other elements.Foam layers have a modest initial stiffness. readily deforming to about 50%
compression. and then bearing strength rises sharply. The points used to define thestress-compression characteristic (Fig. 13) were taken from Figure 8 in Reference 62.The honeycomb sandwich of the experiment platform takes a fairly large loading.
until the 'punch-through' threshold of 51 Nlcm2 is exceeded. This value wassupplied by CASA, contractor for the Probcs inner structure susbsystem, viaAerospatiale and the ESA Project Team. The overall response shape (Fig. 13) wasset to resemble that of the aluminium footpads of the Surveyor spacecraft".Note that for some units (SSP and GCMS) the platform area that supports the unit
is smaller than the area used to compute the soil loads: e.g. the GCMS is a 9-inchdiameter cylinder, with an effective soil penetration area of 300 crn ' (its end isdomed and has a circular inlet flange), but is only held by a support ring of area- 160 cm ' bolted to inserts in the platform. Consequently. the failure stress used inthe model for the honeycomb clement in these stacks is modified by the ratio of thetwo areas.
Unit boxes arc assumed to be relatively rigid, with a slight deformation due to theinward bending of the loaded face (using relations from Ref. 61 ). until a fail stressis reached, estimated by multiplying the yield stress of the box material (assumedglass-fibre-reinforced plastic for SSP, magnesium alloy for the PCDU box. andaluminium elsewhere) by the cross-sectional area of the box walls (and anyreinforcement pillars). Note that all the box units arc sufficiently squat that yieldfailure occurs before an Euler buckling stress is reached. Additional justification forthis approach is the equivalence of experimental loads measured during the collisionalcrushing of a box-beam section. finite-element analysis of the same case.", and theyield load computed as above. Since the boxes arc not empty. however. a change ofstress is assumed to occur as compression continues and the internal components arecrushed together.
Some elements (e.g. the batteries) are considered rigid (i.e. their stiffness isconsiderably larger than that of the other elements).
Manuscript received 22 April 1994
ESA Journal 1994 Vol. 18 117

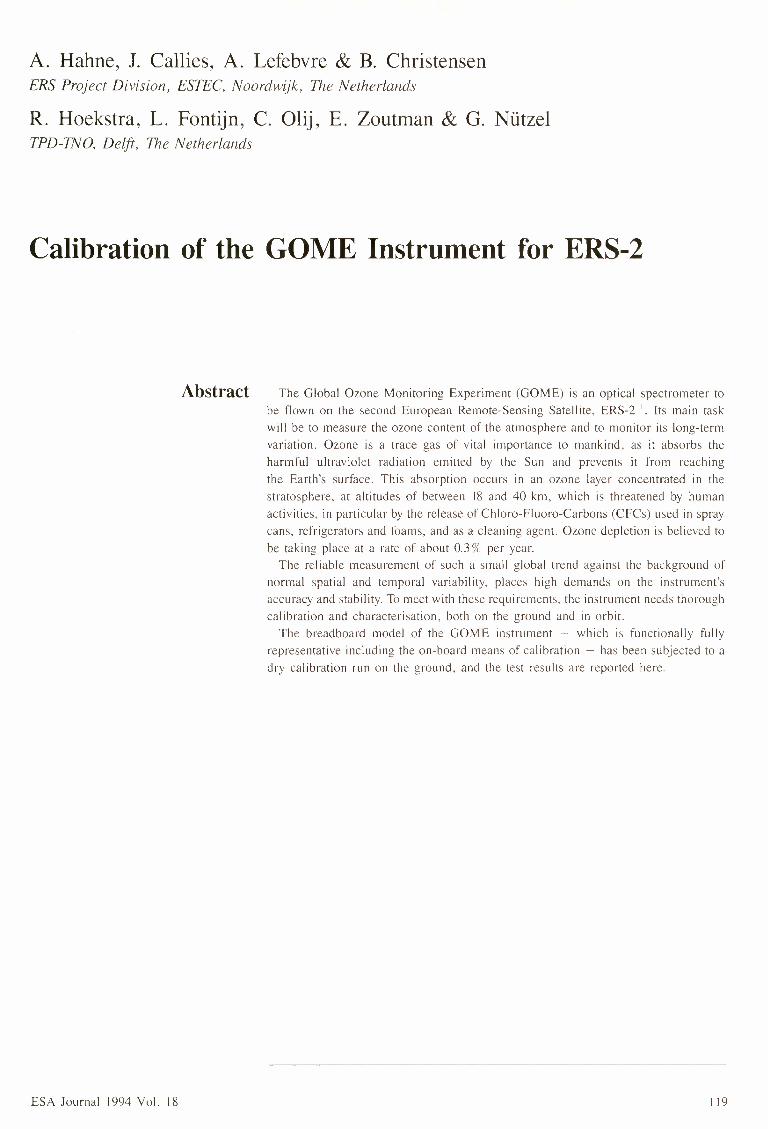
A. Hahne, J. Callies, A. Lefebvre & B. ChristensenERS Project Division, ESTEC, Noordwijk, The Netherlands
R. Hoekstra, L. Fontijn, C. Olij, E. Zoutman & G. NutzelTPD-TNO, Delft, The Netherlands
Calibration of the GOME Instrument for ERS-2
Abstract The Global Ozone Monitoring Experiment (GOME) is an optical spectrometer tobe flown on the second European Remote-Sensing Satellite, ERS-2 1• Its main taskwill be to measure the ozone content of the atmosphere and to monitor its long-termvariation. Ozone is a trace gas of vital importance to mankind. as it absorbs theharmful ultraviolet radiation emitted by the Sun and prevents it from reachingthe Earth's surface. This absorption occurs in an ozone layer concentrated in thestratosphere, at altitudes of between 18 and 40 km. which is threatened by humanactivities. in particular by the release of Chloro-Fluoro-Carbons (CFCs) used in spraycans, refrigerators and foams, and as a cleaning agent. Ozone depletion is believed tobe taking place at a rate of about 0.3 % per year.The reliable measurement of such a small global trend against the background of
normal spatial and temporal variability. places high demands on the instrument'saccuracy and stability. To meet with these requirements, the instrument needs thoroughcalibration and characterisation. both on the ground and in orbit.The breadboard model of the GOME instrument - which is functionally fully
representative including the on-hoard means of calibration - has been subjected to adry calibration run on the ground. and the test results arc reported here.
ESA Journal 1994 Vol. 18 119

1. Calibrationrequirements and theon-board calibration
concept
* Ideally. the wavelength stability between recor
dings should be 11100th of a pixel.
Figure 1. The spectrometer optics of theGOME instrument
The conventional approach for measuring ozone, which is the underlying principleof the American SBUV and TOMS instruments, is the monitoring of upwellingbackscattered radiance at a number of discrete wavelengths. To yield meaningfulresults, the radiometric response of an instrument used in this mode must be knownto better than I%. Because the space environment is known to change the radiometricresponse of the instrument (e.g. by radiation-induced darkening of transmissiveoptics), the means for carrying out on-board calibration with the necessary stabilityhave to be provided to enable re-calibration at regular intervals.This is normally done by looking at the Sun, which is a rather stable light source
for the wavelength range in question. However, because the solar irradiance is severalorders of magnitude higher than the radiance coming from the Earth, the Sun cannotbe used directly, but only via a diffuser. This diffuser attenuates the light to a levelthat falls within the dynamic range of the detection system, and also makes themeasurement path insensitive to the variations in the line-of-sight to the Sun asfunction of the seasonal change in the Earth-Sun distance.As GOME is intended to achieve continuity with the long-term records of ozone
concentrations already accrued by the SBUV and TOMS instruments, this concept hasbeen adopted for GOME also. There is, however, an alternative measurement principleknown as 'Differential Optical Absorption Spectroscopy', which is made possible bythe availability of multi-pixel array detectors capable of recording a continuousspectrum over a large wavelength range. With this technique, a recorded atmosphericspectrum is divided by a solar spectrum, thereby compensating for the Sun's variability(which, of course, also appears in the backscattered light), as well as for the variationsin the optical throughput. To the divided spectrum obtained in this way, the absorptionspectra of ozone and possibly other trace gases are then fitted, thus providing themeans to retrieve the amounts of the target (absorbing) species.For this technique to work, the wavelength observations (for both the solar spectrum
and the backscattered spectrum from the atmosphere) have to be very accurate'.However. launch effects and temperature variations around the orbit prevent thisstability from being achieved. Thus with GOME it is proposed to measure thewavelength shifts with the aid of a calibration lamp, which provides a sufficientnumber of sharp atomic emission lines in each channel to map wavelength shiftsaround the orbit and correct for them in the ground processing (Fig. 1).
SUN DIFFUSER
CALIBRATIONUNIT
CALIBRATIONLAMP
GRATING #2
GRATING #1
CHANNEL #2
CHANNEL #1
ELECTRONICBOX
120
SUN NADIR POINT
CHANNELSEPARATOR
GRATING #3
GRATING #4
BEAMSPLITTER
CHANNEL #3
CHANNEL #4
405 NM
ESA Journal 1994, Vol. 18

In addition to this basic calibration facility. there arc in-llight provisions for:measuring the dark current and fixed pattern noise of the detectors and the readoutchaincalibrating the Analogue-to-Digital Converters (ADCs)monitoring pixel-to-pixel variability by illuminating the detectors with LightEmitting Diodes (LEDs) built into the optical objectives of the four channelsmonitoring the reflectance of the Sun diffuser. by channelling the light from thewavelength calibration lamp via the diffuser and ratioing the measurements withthe corresponding ones made when the lamp is observed directlyfinally. by tilting the scan mirror to an angle between 70° and 85° with respectto nadir. it is possible to use the Moon as a calibration target.
Almost all on-board calibration facilities (except the LEDs mentioned in the 2. The on-boardprevious section) arc grouped in the Calibration Unit. which is shown in Figure 2. Its calibration unittwo key clements arc:
the calibration lamp. and- the Sun di ffuscr.
2.1. The calibration lampKey requirements for the calibration lamp arc:a number of sharp spectral lines spanning the entire wavelength range observed byGOMEa lifetime compatible with the mission (500 h. with at least 1000 on/off cycles)low power consumption: less than 5 W. including DC/DC conversion lossesa rugged design. as the lamp must be able to withstand both the launch and in-orbitenvironments.
The lamp selected is a hollow-cathode type. which has already been flown in a similarconfiguration on several NASA missions. The fill-gas is neon. with a platinum cathodewith 10% chromium in order to provide some additional lines needed to span theGOME wavelength range.
A small lite-test programme has been conducted. operating one lamp continuouslyfor 1500 h and another intermittently. with 5 min on and 5 min oil. for 6000 cycles.The lamp current was regulated to 10 mA. The test showed very satisfactory results.as did the environmental (vibration and thermal vacuum) test programme.
Figure 3a shows the 'naked' lamp. and Figure 3b the lamp in the suspension usedin the calibration unit. Figure 4 shows the spectrum or the lamp used in the GOMEBreadboard Model (88M).
Figure 2. The on-hoard calibration unit
ESA Journal 1994 Vol. 18 121

Figure 3a. The 'naked' wavelength calibrationlamp
Figure 3h. The calibration lamp in itscalibration-unit mount
Figure 4. Spectrum of the calibration lamp, asmeasured for the GOME hreadhoard model(BBM)
122
0
2.2. The diffuserThe purpose of the Sun diffuser is to enable a calibration to be carried out with the
standard system without the need for an accurate Sun acquisition and trackingmechanism. In order to obtain a reliable Sun calibration. the diffuser must have:
a well-known Bi-Directional Scattering Function (BSDF)good uniformity over the illuminated surfacea smooth and well-known wavelength response for the wavelength range of interestexcellent in-orbit stability.
GOME channel 1: 11• 308 GOME channel 2; Ti. 1.Ss
A short technology-development programme has been conducted at TPD/TNO Delft(NL) to select the most suitable material/process for the diffuser. Materials that havebeen investigated include aluminium oxide, quartz, magnesium oxide. titaniumdioxide, barium sulphate. and aluminium with various surface treatments andcoatings. Mainly for in-orbit stability reasons. a wet-blasted Aluminium 6082 with a5 nm chromium and a 100 nm aluminium vacuum-deposited coating have beenselected.
Figure 5 shows the diffuser produced with this technology. and Figure 6 themeasured BSDF with the angular range of interest indicated.
240 250 260 270 2SO 290 300
Wavelength [nm]290 310 330 350 370 300
Wavelength [nm]
2.3. The calibration unitAside from the lamp (with its housing) and the Sun diffuser. the Calibration Unit
compnses:
GOME channel 3: Ti •• 0.18756 GOME channel 4; Ti• 0.09375s_:r~ 30000 t~ I~200JO r
10000 +
o~'~-+-- .••.•+---~1---<--+~-+'~..,_~~....,......,~~ ill - ~ - N ~ ™ ~
Wavelength [nm]~ m • ~ ~ m m • m
Wavelength [nm]
ESA Journal 1994. Vol. 18
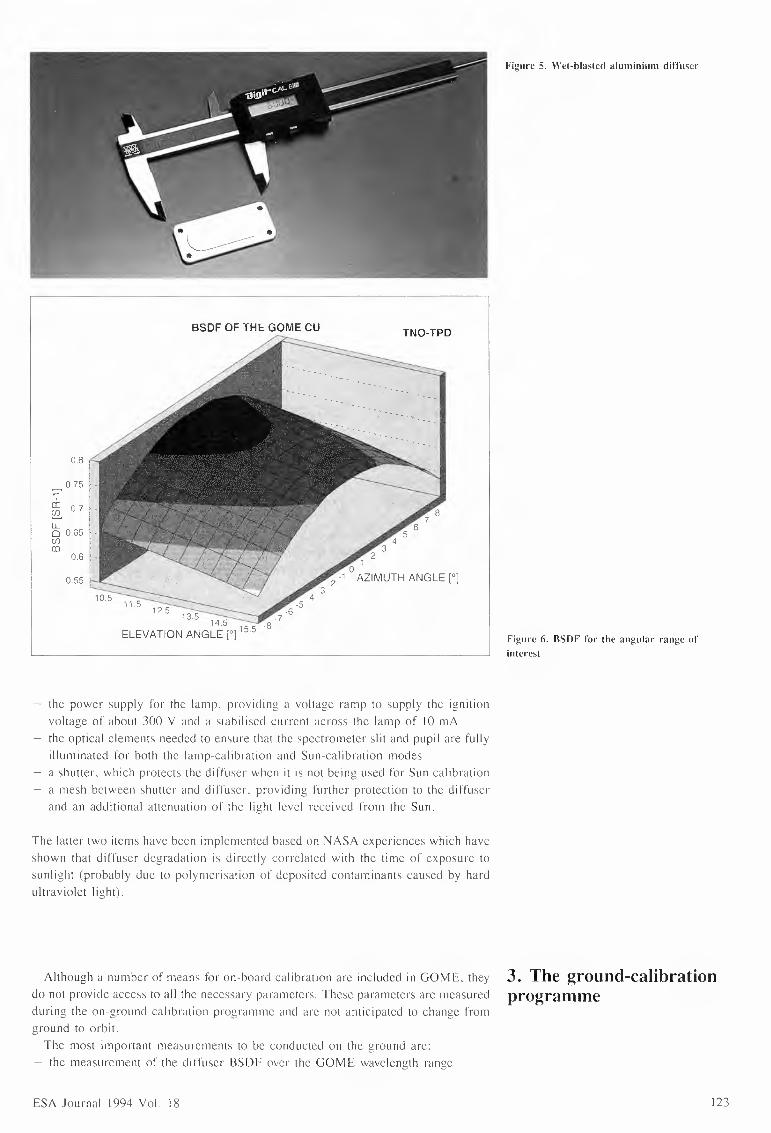
Figure 5. Wet-blasted aluminium diffuser
BSDF OF THE GOME CU TNO-TPD
0.8
0.75
r±~ 0.7u,0 0.65(j)CD
0.6
0.550
_2 -1 AZIMUTH ANGLE["].3
·4.5-6
711.5 12.5 13.5
14.5ELEVATION ANGLE["] 15·5
the power supply for the lamp. providing a voltage ramp to supply the ignitionvoltage of about 300 V and a stabilised current across the lamp of 10 mAthe optical clements needed to ensure that the spectrometer slit and pupil arc fullyilluminated for both the lamp-calibration and Sun-calibration modesa shutter. which protects the diffuser when it is not being used for Sun calibrationa mesh between shutter and diffuser. providing further protection to the diffuserand an additional attenuation of the light level received from the Sun.
Figure 6. BSDF for the angular range ofinterest
The latter two items have been implemented based on NASA experiences which haveshown that diffuser degradation is directly correlated with the time of exposure tosunlight (probably due to polymerisation of deposited contaminants caused by hardultraviolet light).
Although a number of means for on-board calibration arc included in GOME. they 3. The ground-calibrationdo not provide access to all the necessary parameters. These parameters arc measured programmeduring the on-ground calibration programme and arc not anticipated to change fromground to orbit.The most important measurements to be conducted on the ground arc:
- the measurement of the diffuser BSDF over the GOME wavelength range
ESA Journal 1994 Vol. 18 123

the characterisation of the polarisation response of the instrument as a function ofthe optical path (normal observation path and Sun observation path), scan mirrorposition (the scan mirror reflectivity for s- and p-polarisation is a function of themirror angle), and wavelength.
On top of this, there are a number of additional measurements used for vanouspurposes: more comprehensive instrument characterisation, consistency crosschecking, backup measurement for the case oflamp failure, and generation oftest datafor processing-algorithm checking.In particular, the programme comprises:
Radiance/irradiance measurements: By illuminating the normal observation path andthe Sun observation path with known radiance/irradiance, the radiometric calibrationconcept can be checked.
Wavelength calibration: During instrument-level thermal-vacuum testing, spectra ofthe calibration lamp have been recorded at different temperatures to measurewavelength shifts as a function of the temperature and the air/vacuum difference.
Detector characterisation: Dark current, readout noise, pixel-to-pixel sensitivityvariations, and electronic chain performances including response linearity have beenmeasured.
Straylight characterisation: This includes intra-channel (from high-intensity end tolow-intensity end), inter-channel (from one channel to the other), and out-of-field andout-of-band straylight measurements.
Field-of-view characterisation: The variability, if any, in the radiometric response andspectral shift in the along-slit direction is measured. This is of particular interest forthe lunar calibration, as the Moon only partially fills the spectrometer slit.
Measurement of the slit function: The slit function (i.e. the modulation transferfunction of the entire optical system from the slit up to and including the detector)is determined. This is used to convolute high-resolution reference spectra ofatmospheric species to the resolution of GOME.
4. The breadboard-model Recognising that this is quite a demanding programme, preparations for thecalibration programme calibration started as early as 1991. After agreement in principle on the scope of the
programme with the scientists involved in GOME, TPD in Delft (NL) proceeded withthe design, manufacturing, procurement and testing of all the necessary elements:
turntable and fixtures to accommodate the instrument during the measurementscalibrated lamps, diffusers and reference detectors procured from the NationalInstitute of Standardsmonochromator and polariser covering the entire GOME wavelength rangea temperature-controlled room to host the whole setup, clean room class 10.000, allblack-painted (even including storage cabinet and water sink and tap) to suppressexternal straylightcomputer and software to control all the settings and provide them to the GOMEElectrical Ground-Support Equipment (EGSE), to enable correlation between theGOME measurement data and the settings of the calibration setupalgorithms and software to analyse the data, e.g. for noise correction, wavelengthshift detection, BSDF computation, etc.procedures for setting up, aligning and performing the measurementscalibration error budgets to establish the expected accuracy and precision of themeasurements.
124 ESA Journal 1994, Vol. 18
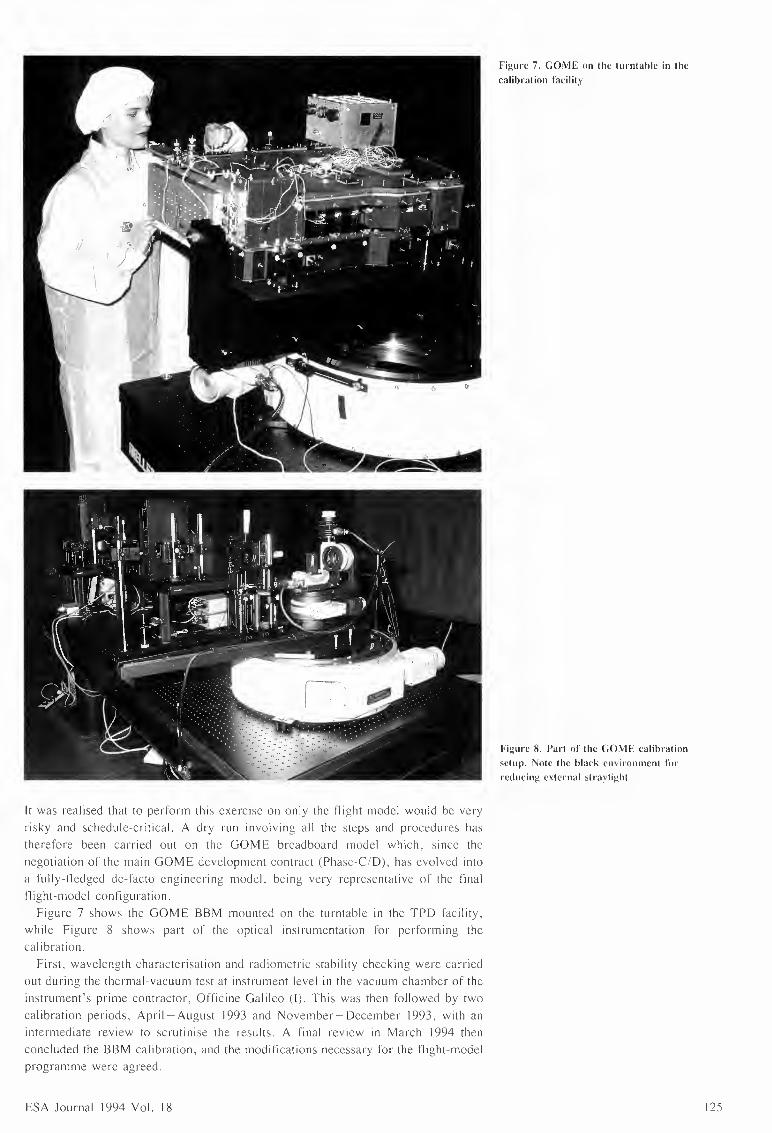
It was realised that to perform this exercise on only the !light model would he veryrisky and schedule-critical. A dry run involving all the steps and procedures hastherefore been carried out on the GOME breadboard model which. since thenegotiation of the main GOME development contract (Phasc-Crfr). has evolved intoa fully-fledged de-facto engineering model. being very representative of the finalflight-model configuration.
Figure 7 shows the GOME HBM mounted on the turntable in the TPD facility.while Figure 8 shows part of the optical instrumentation for performing thecalibration.
First. wavelength characterisation and radiometric stability checking were carriedout during the thermal-vacuum test at instrument level in the vacuum chamber of theinstrumcnts prime contractor. Otficinc Galileo (I). This was then followed by twocalibration periods. April-August 1993 and :\member-December 199.l. with anintermediate review to scrutinise the results. A final rev ie\\ in March 1994 thenconcluded the BBM calibration. and the modifications necessary for the flight-modelprogramme were agreed.
ESA Journal 1994 Vol. 18
Figure 7. GOME on the turntable in thecalibration Iacilitv
Figun· 8. Part of' till' (;Ol\H: calibrationsetup. 'oil' the black l'll\ ironmcnt forreducing cvtcrnul stra.' light
12'i
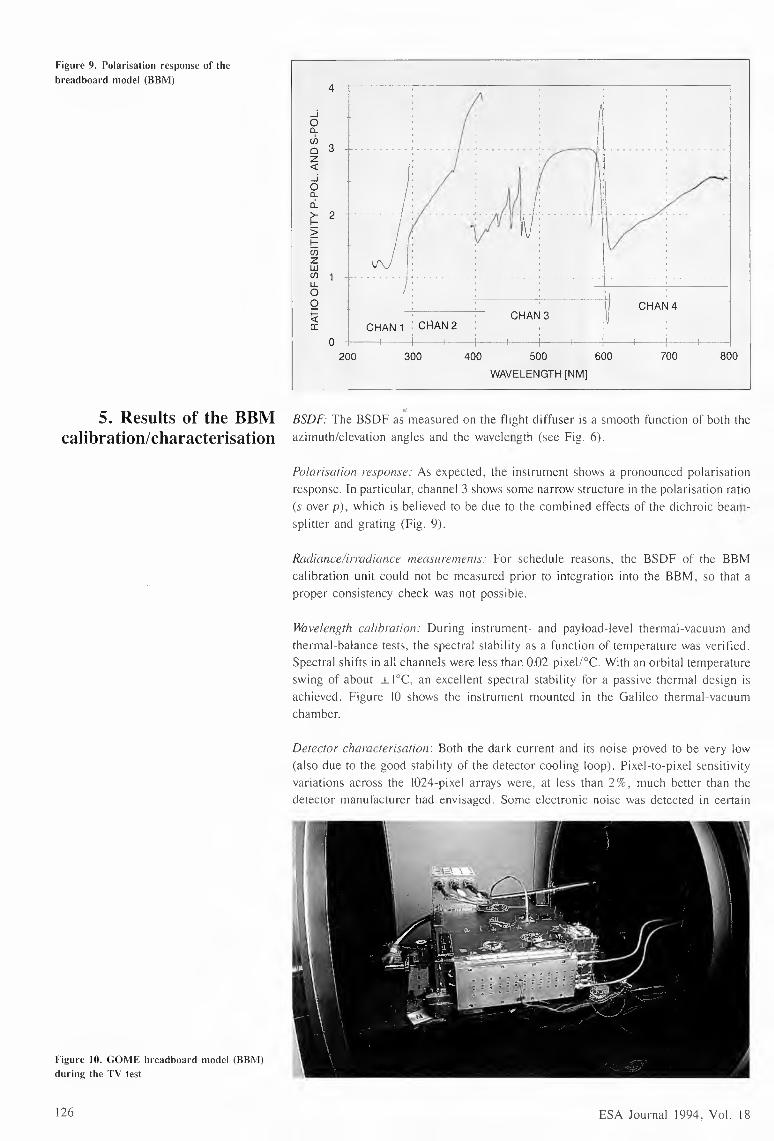
Figure 9. Polarisation response of thebreadboard model (BBl\I)
_j0a..rh0 3z<(_j0a..ri.>- 2~>f==Uizw(/)LL00~cc
4
700 800
CHAN 1 . CHAN 2CHAN3
0 ----+---------+--
5. Results of the BBM BSDF: The BSDF as measured on the flight diffuser is a smooth function of both thecalibration/characterisation azimuth/elevation angles and the wavelength (see Fig. 6).
Figure 10. (;()!VIE breadboard model (BBM)during the TV test
126
200 300 600
Polarisation response: As expected, the instrument shows a pronounced polarisationresponse. In particular. channel 3 shows some narrow structure in the polarisation ratio(s over p). which is believed to be due to the combined effects of the dichroic bean>splitter and grating (Fig. 9).
400 500
WAVELENGTH[NM]
Radiance/irradiance measurements: For schedule reasons. the BSDF of the BBMcalibration unit could not be measured prior to integration into the BBM. so that aproper consistency check was not possible.
Wo\'e/ength calibration: During instrument- and payload-level thermal-vacuum andthermal-balance tests, the spectral stability as a function of temperature was verified.Spectral shifts in all channels were less than 0.02 pixel/0C. With an orbital temperatureswing of about ±I0C. an excellent spectral stability for a passive thermal design isachieved. Figure IO shows the instrument mounted in the Galileo thermal-vacuumchamber.
Detector characterisation: Both the dark current and its noise proved to be very low(also due to the good stability of the detector cooling loop). Pixel-to-pixel sensitivityvariations across the 1024-pixel arrays were. at less than 2% . much better than thedetector manufacturer had envisaged. Some electronic noise was detected in ccrtam
ESA Journal 1994. Vol. 18

readout situations. This was due to the ringing of the leading edge of the strobe pulseand to interference with the read-out of a temperature sensor. Both problems have
been fed back into the instrument design and should be solved for the flight model.
Straylight characterisation: Quite detailed investigations were necessary to clarify theobserved levels of straylight. A path for external straylight was identified and theproblem solved via more and improved instrument internal baffling. Inter-channelstraylight proved to be low and presented no problem.
More crucial was the intra-channel straylight. particularly that in channel 2. whereat the short-wavelength end a roll-off of the signal level (by three orders of magnitude)presented a significant problem. Multiple reflections between the detector and theobjective lenses and the gratings. respectively. were identified as the major cause. Inchannels 3 and 4 the problem could be resolved by the provision of improved antiretlection coatings on the lenses and by slightly tilting the gratings. For channel 2.this would not have been sufficient and so, in consultation with the GOME scientists.it was decided to move the wavelength split between channels 1 and 2 to a highervalue. thereby safeguarding the important channel 2. but sacrificing the performanceof channel I slightly. The problem was alleviated by measuring stray light levels onsome (so far unused) pixels. enabling some correction to be made for straylight in theground processing.
Field-oj- 1·ie11• cha racte risationThe design parameters for the GOME FOY arc 0.14° x 2.8°. Under normal
observational conditions. the entire slit and the entire GOME pupil arc illuminated.However. when the Moon is observed, only a fraction of the slit is illuminated. Forthat reason, several scans have been made of the FOY by using collimated light asinput for the GOME telescope. These measurements provide information on:
actual dimensions of the FOYout-of-field scattered lightinfluence on radiometric response and on wavelength scale when only a fractionof the FOY is illuminated.
Figure 11 shows the radiometric output of GOME for channel 3 when the FOY rsscanned along the 2.8° axis of the FOY.
Slit functionThis function represents the spectral line shape output for monchromatic input. It
is a convolution of entrance slit width as imaged onto the spectral plane. detector pixel
VERTICAL FOV - RADIOMETRIC STABILITYCH 3
z 5.00%
0~ 4.00%
slJ.J 3.00%0>- 2.00%I-sj:: 1.00%u;zlJ.J 0.00%(/)lJ.J> -1.00%
~_J -2.00%lJ.Ja:-3.00%
-4.00%
-5.00%0
+---+--0.5
1-----~--2 2.51.5 3 3.5
VERTICALANGLE (0)
ESA Journal 1994 Vol. 18
Fig11rc 11. Radiometric response variationalong the field of' view
127
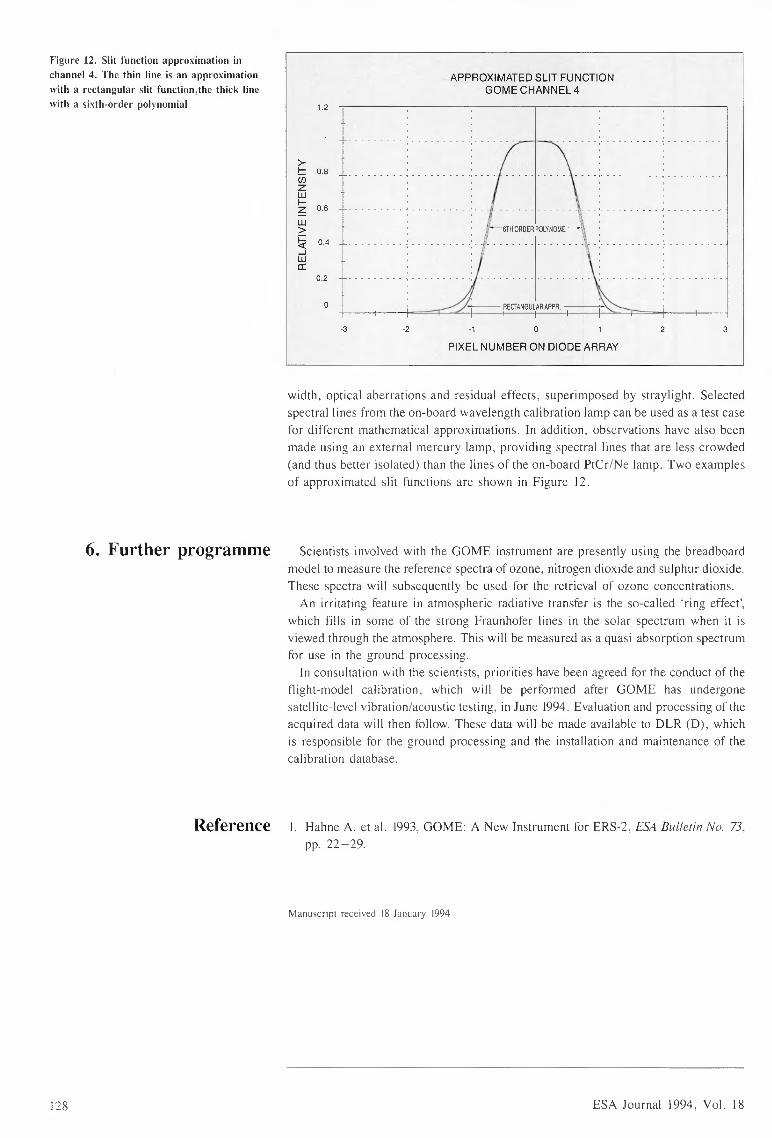
Figure 12. Slit function approximation inchannel 4. The thin line is an approximationwith a rectangular slit function,the thick linewith a sixth-order polynomial
6. Further programme
>-I- 0.8Ci)zUJI-
0.6~UJ>~ 0.4_JUJa:
0.2
0
APPROXIMATEDSLIT FUNCTIONGOMECHANNEL 4
1.2
---------,-------~----------·--------
- - - - - - - --
-3 -2 -1 0 2 3
PIXEL NUMBER ON DIODEARRAY
width, optical aberrations and residual effects, superimposed by straylight. Selectedspectral lines from the on-board wavelength calibration lamp can be used as a test casefor different mathematical approximations. In addition, observations have also beenmade using an external mercury lamp, providing spectral lines that are less crowded(and thus better isolated) than the lines of the on-board PtCr/Ne lamp. Two examplesof approximated slit functions are shown in Figure 12.
Scientists involved with the GOME instrument are presently using the breadboardmodel to measure the reference spectra of ozone, nitrogen dioxide and sulphur dioxide.These spectra will subsequently be used for the retrieval of ozone concentrations.An irritating feature in atmospheric radiative transfer is the so-called 'ring effect',
which fills in some of the strong Fraunhofer lines in the solar spectrum when it isviewed through the atmosphere. This will be measured as a quasi-absorption spectrumfor use in the ground processing.In consultation with the scientists, priorities have been agreed for the conduct of the
flight-model calibration. which will be performed after GOME has undergonesatellite-level vibration/acoustic testing, in June 1994. Evaluation and processing of theacquired data will then follow. These data will be made available to DLR (D), whichis responsible for the ground processing and the installation and maintenance of thecalibration database.
Reference I. Hahne A. et al. 1993, GOME: A New Instrument for ERS-2, ESA Bulletin No. 73,pp. 22-29.
128
Manuscript received 18 January 1994
ESA Journal 1994. Vol. 18
M. Schautz & G. DudleyEnergy Storage Section, European Space Research & Technology Centre (ESTEC).Noordwijk, The Netherlands
F. BaronManned Spaceflight and Microgravity Directorate, ESA. Toulouse, France
V. Popov & B. PospelovUralskii Elektrochimtscheskii Ko111hi11at(UE/P), Ekaterinburg, Russia
Testing of a Buran Flight-Model Fuel Cell
Abstract A demonstration test programme has been performed at ESTEC on a flight-modelRussian 'Photon' fuel cell. The tests, conducted al various power levels up to 23 kW,included current/voltage characteristics. transient behaviour. autothcrrnal startup, andimpedance measurements. In addition. the product water and the purge gas wereanalysed. All test goals were met and no electrochemical limitations were apparent.
ESA Journal 1994 Vol. 18 129
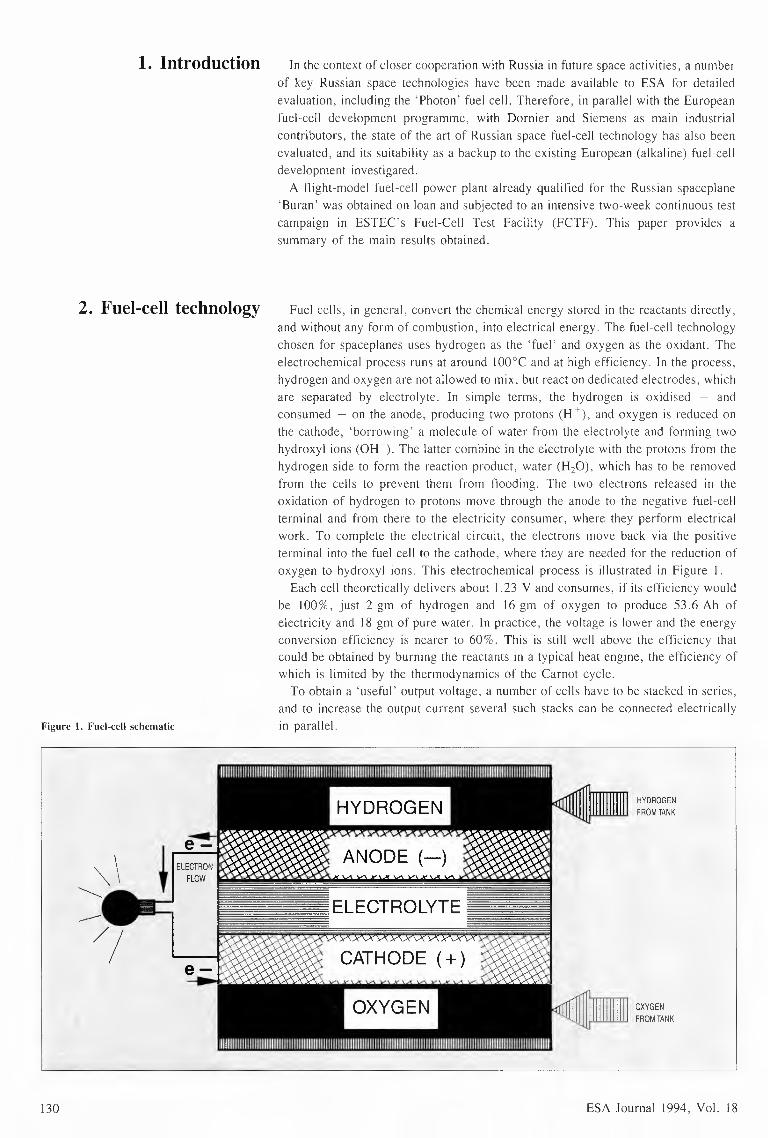
1. Introduction In the context of closer cooperation with Russia in future space activities, a numberof key Russian space technologies have been made available to ESA for detailedevaluation. including the 'Photon· fuel cell. Therefore, in parallel with the Europeanfuel-cell development programme. with Dornier and Siemens as main industrialcontributors. the state of the art of Russian space fuel-cell technology has also beenevaluated, and its suitability as a backup to the existing European (alkaline) fuel-celldevelopment investigated.
A flight-model fuel-cell power plant already qualified for the Russian spaceplanc'Buran' was obtained on loan and subjected to an intensive two-week continuous testcampaign in ESTEC's Fuel-Cell Test Facility (FCTF). This paper provides asummary of the main results obtained.
2. Fuel-cell technology Fuel cells, in general. convert the chemical energy stored in the reactants directly.and without any form of combustion. into electrical energy. The fuel-cell technologychosen for spaceplanes uses hydrogen as the 'fuel' and oxygen as the oxidant. Theelectrochemical process runs at around l00°C and at high efficiency. In the process.hydrogen and oxygen arc not allowed to mix, but react on dedicated electrodes. whichare separated by electrolyte. In simple terms. the hydrogen is oxidised - andconsumed - on the anode. producing two protons (H -). and oxygen is reduced onthe cathode, 'borrowing' a molecule of water from the electrolyte and forming twohydroxyl ions (OH-). The latter combine in the electrolyte with the protons from thehydrogen side to form the reaction product, water (H20). which has to be removedfrom the cells to prevent them from flooding. The two electrons released in theoxidation of hydrogen to protons move through the anode to the negative fuel-cellterminal and from there to the electricity consumer, where they perform electricalwork. To complete the electrical circuit. the electrons move back via the positiveterminal into the fuel cell to the cathode, where they are needed for the reduction ofoxygen to hydroxyl ions. This electrochemical process is illustrated in Figure I.
Each cell theoretically delivers about 1.23 V and consumes. if its efficiency wouldbe lOO% , just 2 gm of hydrogen and 16 gm of oxygen to produce 53 .6 Ah ofelectricity and 18 gm of pure water. In practice. the voltage is lower and the energyconversion efficiency is nearer to 60%. This is still well above the efficiency thatcould be obtained by burning the reactants in a typical heat engine, the efficiency ofwhich is limited by the thermodynamics of the Carnot cycle.To obtain a 'useful' output voltage. a number of cells have to be stacked in series,
and to increase the output current several such stacks can be connected electricallyin parallel.Figure l. Fuel-cell schematic
HYDROGENFROMTANK
//I
OXYGENFROMTANK
130 ESA Journal 1994, Vol. 18

HERMES PROGRAMME(ESATLS, CNES)DIRECTORATE
CUSTOMER
EUROHERMESPACEPRIME CONTRACTOR
CONTRACTOR DORNIER I DASA
ESAFCTF
UEIPFC MF
SUB-CONTRACTOR
3. I. The 'Photon' fuel cellThe 'Photon power generator was developed by UEIP (the 'Ural Electrochemical
Integrated Plant') in Ekatcrinburg. in the Sverdlovsk Region of Russia in the seventiesand eighties. More than 120 complete power units were assembled and tested toachieve fl ight-rnodcl quality qua! ification.
The particular flight-model unit used for testing at ESTEC was manufactured inDecember 1991 and was subjected by the manufacturer to 11ight acceptance testsincluding leak tests. insulation resistance, vibration tests and electrochemicalperformance. It was certified in accordance with Russian standards for application inmanned space transportation.
The 'Photon· power unit consists of the electrochemical generator containing eightfuel-cell stacks. which arc connected in parallel. and a number of peripherals whicharc necessary for the process control. Each cell stack contains 32 cells in series. Theactive cell area is 176 cm '. The electrolyte is potassium-hydroxide solution in anasbestos matrix. The product water is removed by means of excess hydrogen flow.whereby the hydrogen is saturated with water vapour when flowing alongside the hotand wet electrode surface. Further down the 'hydrogen loop'. water is condensed andthen removed in a so-called 'hydrophilic membrane separator".
Figure 3 shows a subs tack assembly. and Figure 4 the complete fuel-cell generatorwith its housing removed.
ESA Jou ma! 1994 Vol. 18
Figure 2. Organigram for the demonstrationtesting
3. The testing
Figure J. 'Photon' suhstack asscmhl~
131
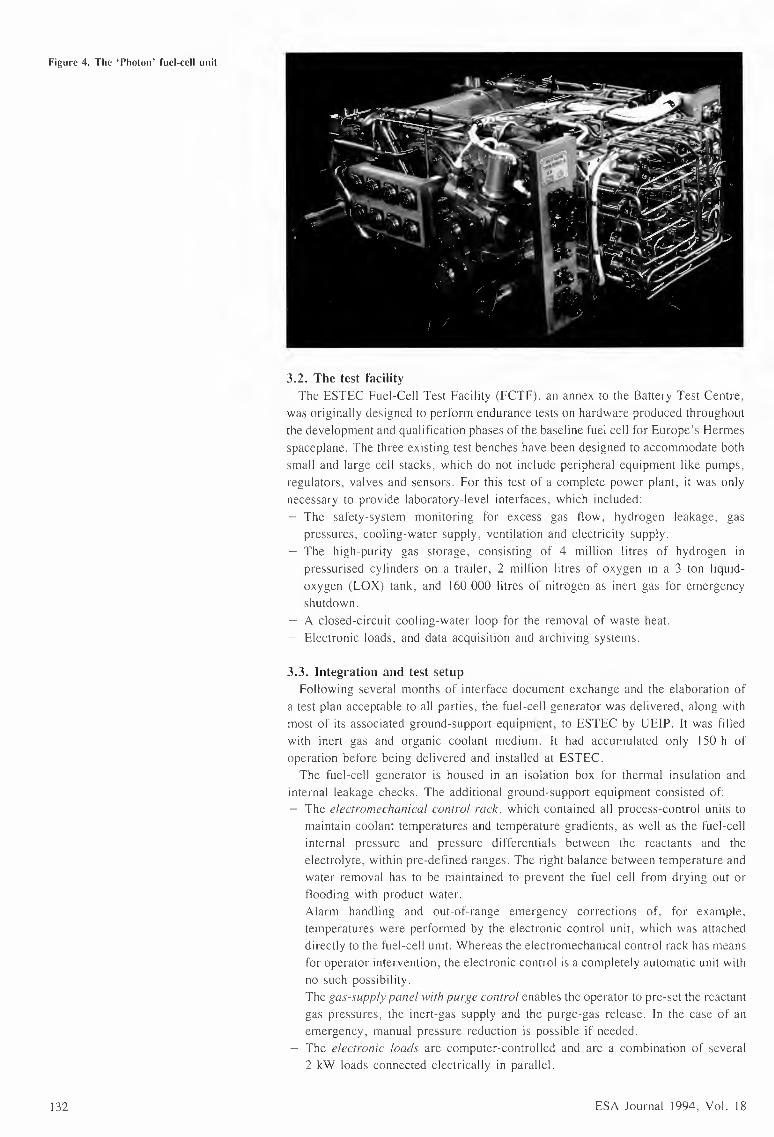
Figure 4. The 'Photon' fuel-cell unit
3.2. The test facilityThe ESTEC Fuel-Cell Test Facility (FCTF). an annex to the Battery Test Centre.
was originally designed to perform endurance tests on hardware produced throughoutthe development and qualification phases of the baseline fuel cell for Europe's Hermesspaccplane. The three existing test benches have been designed to accommodate bothsmall and large cell stacks. which do not include peripheral equipment like pumps.regulators. valves and sensors. For this test of a complete power plant. it was onlynecessary to provide laboratory-level interfaces. which included:
The safety-system monitoring for excess gas flow, hydrogen leakage. gaspressures. cooling-water supply. ventilation and electricity supply.The high-purity gas storage. consisting of 4 million litres of hydrogen inpressurised cylinders on a trailer. 2 million litres of oxygen in a 3 ton liquidoxygen (LOX) tank. and 160 000 litres of nitrogen as inert gas for emergencyshutdown.A closed-circuit cooling-water loop for the removal of waste heat.Electronic loads. and data acquisition and archiving systems.
3.3. Integration and test setupFollowing several months of interface document exchange and the elaboration of
a test plan acceptable to all parties. the fuel-cell generator was delivered. along withmost of its associated ground-support equipment. to ESTEC by UEIP. It was filledwith inert gas and organic coolant medium. It had accumulated only 150 h ofoperation before being delivered and installed at ESTEC.The fuel-cell generator is housed in an isolation box for thermal insulation and
internal leakage checks. The additional ground-support equipment consisted of:The electromechanical control rack. which contained all process-control units tomaintain coolant temperatures and temperature gradients. as well as the fuel-cellinternal pressure and pressure differentials between the reactants and theelectrolyte. within pre-defined ranges. The right balance between temperature andwater removal has to be maintained to prevent the fuel cell from drying out orflooding with product water.Alarm handling and out-of-range emergency corrections of. for example.temperatures were performed by the electronic control unit. which was attacheddirectly to the fuel-cell unit. Whereas the electromechanical control rack has meansfor operator intervention. the electronic control is a completely automatic unit withno such possibility.The gas-supplv pone! with purge control enables the operator to pre-set the reactantgas pressures. the inert-gas supply and the purge-gas release. In the case of anemergency. manual pressure reduction is possible if needed.The electronic foods arc computer-controlled and are a combination of several2 kW loads connected electrically in parallel.
132 ESA Journal 1994. Vol. 18
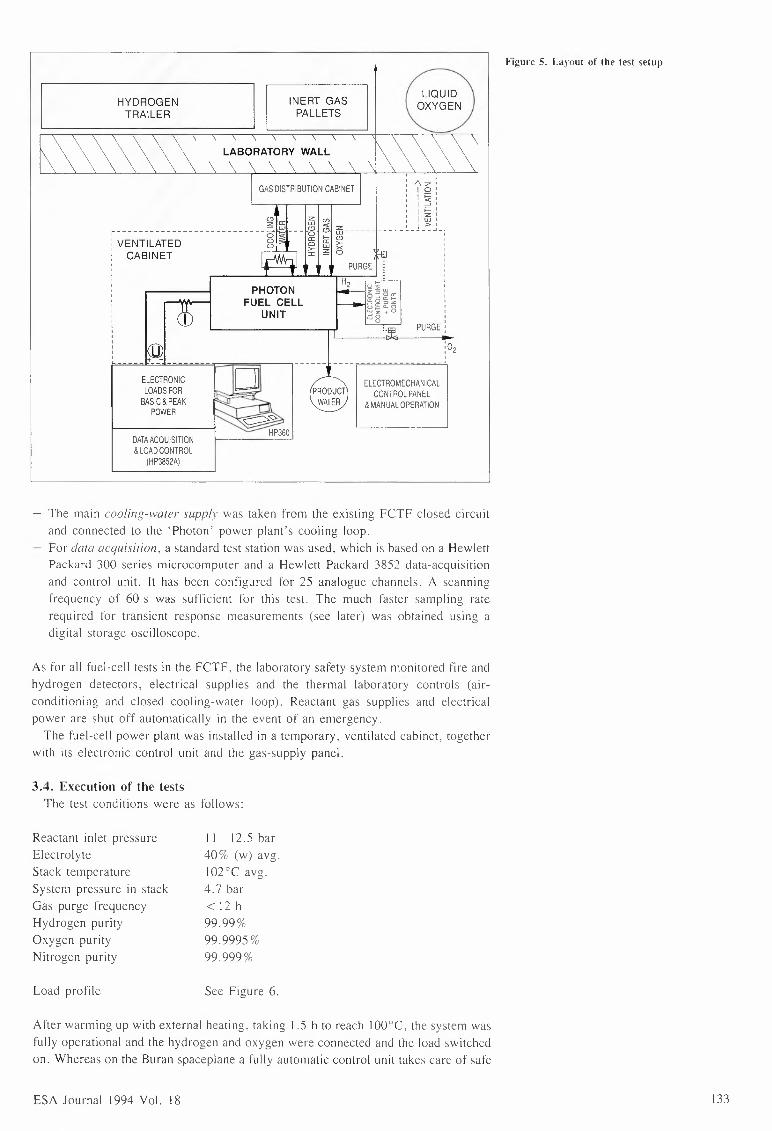
HYDROGENTRAILER
INERT GASPALLETS
@. _ELECTRONICLOADS FOR
BASIC & PEAKPOWER
DATAACQUISITION& LOAD CONTROL
(HP3852A)
:02'-------------'
LABORATORY WALL\
GAS DISTRIBUTION CABINET'I\ z'
1 Q:I !;;,c II::::::! II I- 'Z'I LU '
I>'____+:''''''''''''''''
PURGE :
ELECTROMECHANICALCONTROL PANEL
&MANUAL OPERATION
3.4. Execution of the testsThe test conditions were as follows:
PHOTONFUEL CELL
UNIT
The main cooling-water supply was taken from the existing FCTF closed circuitand connected to the 'Photon· power plant's cooling loop.For data acquisition, a standard test station was used. which is based on a HewlettPackard 300 series microcomputer and a Hewlett Packard 3852 data-acquisitionand control unit. It has been configured for 25 analogue channels. A scanningfrequency of 60 s was sufficient for this test. The much faster sampling raterequired for transient response measurements (see later) was obtained using adigital storage oscilloscope.
As for all fuel-cell tests in the FCTF. the laboratory safety system monitored fire andhydrogen detectors. electrical supplies and the thermal laboratory controls (airconditioning and closed cooling-water loop). Reactant gas supplies and electricalpower are shut off automatically in the event of an emergency.The fuel-cell power plant was installed in a temporary. ventilated cabinet. together
with its electronic control unit and the gas-supply panel.
Reactant inlet pressureElectrolyteStack temperatureSystem pressure in stackGas purge frequencyHydrogen purityOxygen purityNitrogen purity
Load profile
11-12.5 bar40'7c (w) avg.102°C avg.4.7 bar< 12 h99.99'7c99.9995%99.999%
Sec Figure 6.
After warming up with external heating. taking 1.5 h to reach l00°C. the system wasfully operational and the hydrogen and oxygen were connected and the load switchedon. Whereas on the Buran spaceplane a fully automatic control unit takes care of safe
ESA Journal 1994 Vol. 18
Figure 5. Layout of the test setup
133
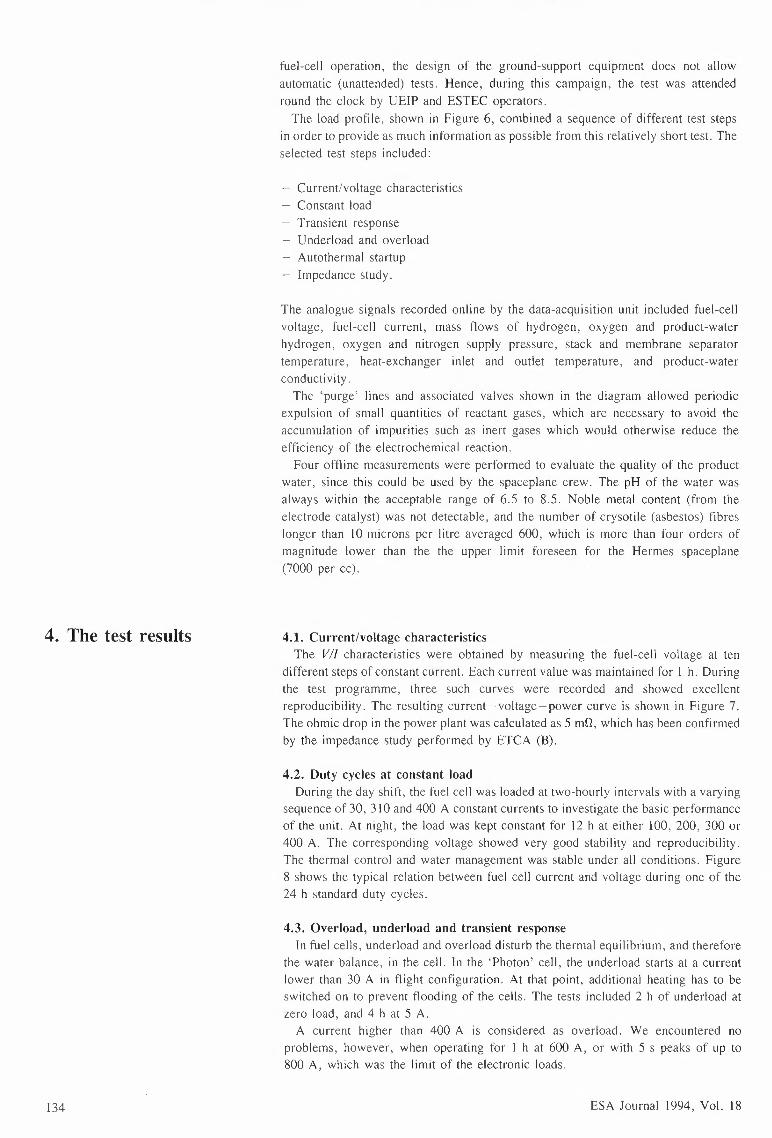
fuel-cell operation, the design of the ground-support equipment does not allowautomatic (unattended) tests. Hence, during this campaign, the test was attendedround the clock by UEIP and ESTEC operators.The load profile, shown in Figure 6, combined a sequence of different test steps
in order to provide as much information as possible from this relatively short test. Theselected test steps included:
Current/voltage characteristicsConstant loadTransient responseUnderload and overloadAutothermal startupImpedance study.
The analogue signals recorded online by the data-acquisition unit included fuel-cellvoltage, fuel-cell current, mass flows of hydrogen, oxygen and product-waterhydrogen, oxygen and nitrogen supply pressure, stack and membrane separatortemperature. heat-exchanger inlet and outlet temperature, and product-waterconductivity.The 'purge' lines and associated valves shown in the diagram allowed periodic
expulsion of small quantities of reactant gases, which are necessary to avoid theaccumulation of impurities such as inert gases which would otherwise reduce theefficiency of the electrochemical reaction.
Four offline measurements were performed to evaluate the quality of the productwater, since this could be used by the spaceplane crew. The pH of the water wasalways within the acceptable range of 6.5 to 8.5. Noble metal content (from theelectrode catalyst) was not detectable, and the number of crysotile (asbestos) fibreslonger than 10 microns per litre averaged 600, which is more than four orders ofmagnitude lower than the the upper limit foreseen for the Hermes spaceplane(7000 per cc).
4. The test results 4.1. Current/voltage characteristicsThe VII characteristics were obtained by measuring the fuel-cell voltage at ten
different steps of constant current. Each current value was maintained for I h. Duringthe test programme, three such curves were recorded and showed excellentreproducibility. The resulting current-voltage-power curve is shown in Figure 7.The ohmic drop in the power plant was calculated as 5 mQ, which has been confirmedby the impedance study performed by ETCA (B).
4.2. Duty cycles at constant loadDuring the day shift, the fuel cell was loaded at two-hourly intervals with a varying
sequence of 30, 310 and 400 A constant currents to investigate the basic performanceof the unit. At night, the load was kept constant for 12 h at either 100, 200, 300 or400 A. The corresponding voltage showed very good stability and reproducibility.The thermal control and water management was stable under all conditions. Figure8 shows the typical relation between fuel cell current and voltage during one of the24 h standard duty cycles.
4.3. Overload, underload and transient responseIn fuel cells, underload and overload disturb the thermal equilibrium, and therefore
the water balance, in the cell. In the 'Photon' cell, the underload starts at a currentlower than 30 A in flight configuration. At that point, additional heating has to beswitched on to prevent flooding of the cells. The tests included 2 h of underload atzero load, and 4 h at 5 A.A current higher than 400 A is considered as overload. We encountered no
problems. however, when operating for 1 h at 600 A, or with 5 s peaks of up to800 A, which was the limit of the electronic loads.
134 ESA Journal 1994, Vol. 18
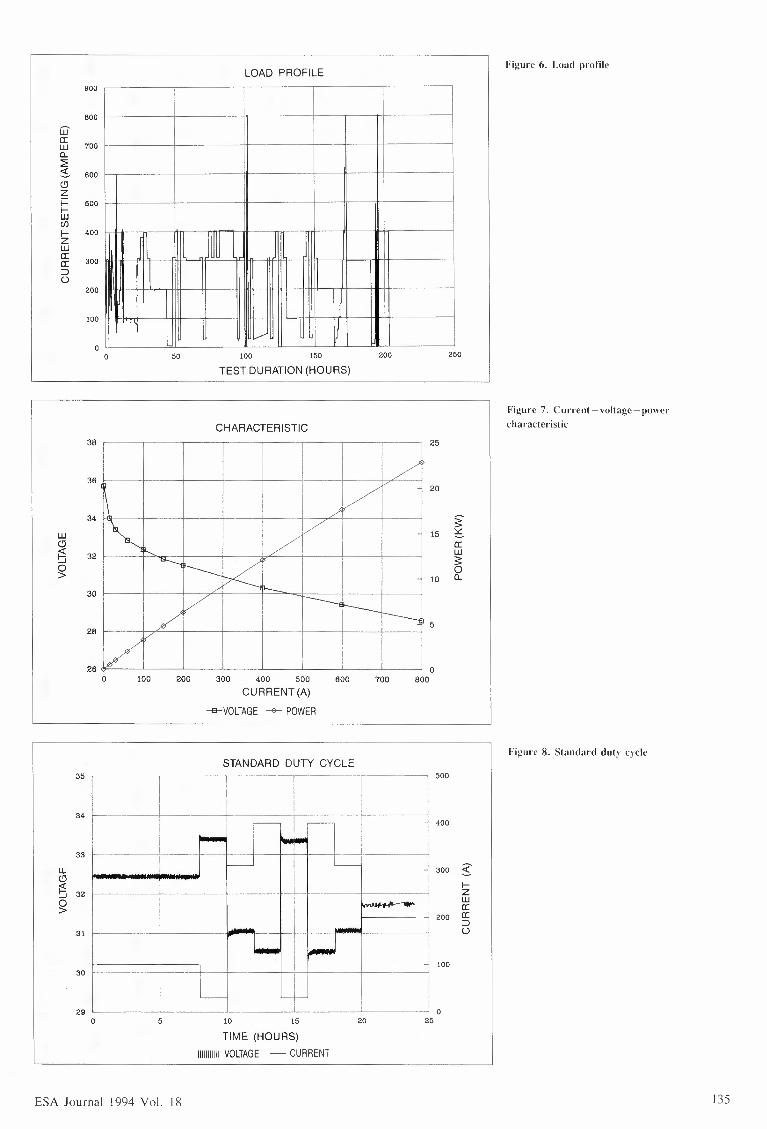
LOAD PROFILE900 . --,-·-
f
600
i!
800 f- ·---- -,- -- ----1, I
700 ---t- ---~I I: ____J
I
500 f-+- -·----- : ------~
I 'I::::~ -~J[-t-tffl------ft--T-m-1-t-
' ---------1
•00 11, ,,,d 1111111 111rn1r~ -- JI I
[jJa:wc,~sCJz
~(/)1-zwa:a::::>o
200 Hlllll I I I I , 1111 II --\Hiit+
0 50 100 150 200
TEST DURATION(HOURS)
CHARACTERISTIC38
~ 25
- --1 20
I [15a:w~0
10 o,
5
+--+--1
36
34
wCJ~ 32:_.i
~30
28
26 <'F-~~-'-~~--'-~~~'--~~-'-~~--'-~~--'~~~_j_~~~700
0BOO0 100 200 300 400 500
CURRENT(A)
--&-VOLTAGE ~ POWER
600
STANDARD DUTY CYCLE' 50035 I -
Ml---"I
- 400
31
- 300 ::.s1-zwa:
- 200 a::::>o
- 10030
2915 20
0250 5 10
TIME (HOURS)11111111111VOLTAGE - CURRENT
ESA Journal 1994 Vol. 18
250
Figure 6. Load profile
Figure 7. Current-voltage-powercharacteristic
Figure 8. Standard duty cycle
135

Figure 9. Voltage transient at a load changefrom 800 to 100 A
Figure 10. Autothermal startup
136
The time taken by the energy source to get back to equilibrium conditions after abig load step is important in the design of a spacecraft power system. To measurerelatively fast changes, a digital storage oscilloscope was used to record the voltagetransient when the load was switched from 800 A to 100 A. The resulting transientcurve (Fig. 9) shows that the fuel cell reacts very quickly to load changes and doesnot show any significant delays in voltage recovery.
4.4. Autothermal startupOn a spaceplane, it is desirable that a fuel cell that has shut down and cooled can
be restarted without needing to apply external power to bring the cell back up toworking temperature ('autothermal startup'). Such a startup was simulated by theapplication of a load of 310 A to the 'cold' fuel cell. At low temperatures, theefficiency is lower and the resulting waste heat causes the temperature to rise. Becauseof time constraints, the starting point was 43 °C (reached after overnight cooling). Asshown in Figure I0, autothermal startup from this temperature presented nodifficulties.
TRANSIENT RESPONSE
M Ff~~ -32 _,_ _
31UJ
~!j 30I------+----
~
4 6TIME (SECONDS)
TRANSITION FROM 800 A DOWNTO 100A
8 102
AUTOTHERMALSTARTUP110
100
~(.!) eoUJe.UJa::J 80ti:a:UJa. 70::z:UJI-~o eo~(/)
50
.:»:
III
I)
"° 0 0.3 O..& 0.6
TIME(HOUR)
ATMARKER CURRENT SWITCHEDTO300 A
0.2 0.7 o.e0.1 0.8
ESA Journal 1994, Vol. 18

This test campaign demonstrated not only the excellent performance of the fuel-cell 5. Conclusionsstacks, but also the maturity of the complete 'Photon' power plant. In so far as sensorscould be attached to or integrated into this sealed system. it showed betterperformance than was called for in the Hermes specification. The temperature controlwas stable and reliable over the whole operating range and, coupled with that, thewater removal system functioned well. The product water is of higher purity thanrequired in the World Health Organisation's drinking-water standards. Although itwas not strictly a life test, there was no measurable electrochemical performancedegradation. even at high loads. during the programme.
The results clearly indicate that the 'Photon' fuel-cell technology. and in particularthe cell stack, would be likely to meet the requirements of future ESA manned (orunmanned) space vehicles if an alternative or backup to a dedicated European fuel-celldevelopment effort is sought.
A notable feature of the novel test campaign that has been described was the Acknowledgementharmonious and enthusiastic manner in which the UEIP and ESTEC (SERCO) teamsworked together. This spirit of international cooperation was much appreciated by thetest organisers.
Manuscript received 27 May 1994
ESA Journal 1994 Vol. 18 137


0. BaetzDeutsche Aerospace, Ottobrunn, Germany
E.M. SoopEuropean Space Operations Centre (ESOC), Darmstadt, Germany
U. SoppaERNO Raumfahrttechnik, Bremen, Germanv
Inter-Satellite Tracking for Co-Location
Abstract The design and performance of systems for inter-satellite tracking betweenco-located satellites in geostationary orbit have been studied. The goal is to improvethe accuracy of the relative satellite-position determination that is necessary to allowdenser packing of satellites within the same latitude and longitude control box.
This paper summarises the results of a 'Study on Inter-Satellite Tracking forCo-Location· performed by ERNO and DASA under ESA Contract 10035/92/D/CS.It was a logical continuation of the 'Study on Station-Keeping Strategies forCo-Located Satellites· carried out by ERNO in 1991 and 1992 under ESA Contract9297 /91/NL/PM.
ESA Journal I994 Vol. 18 139
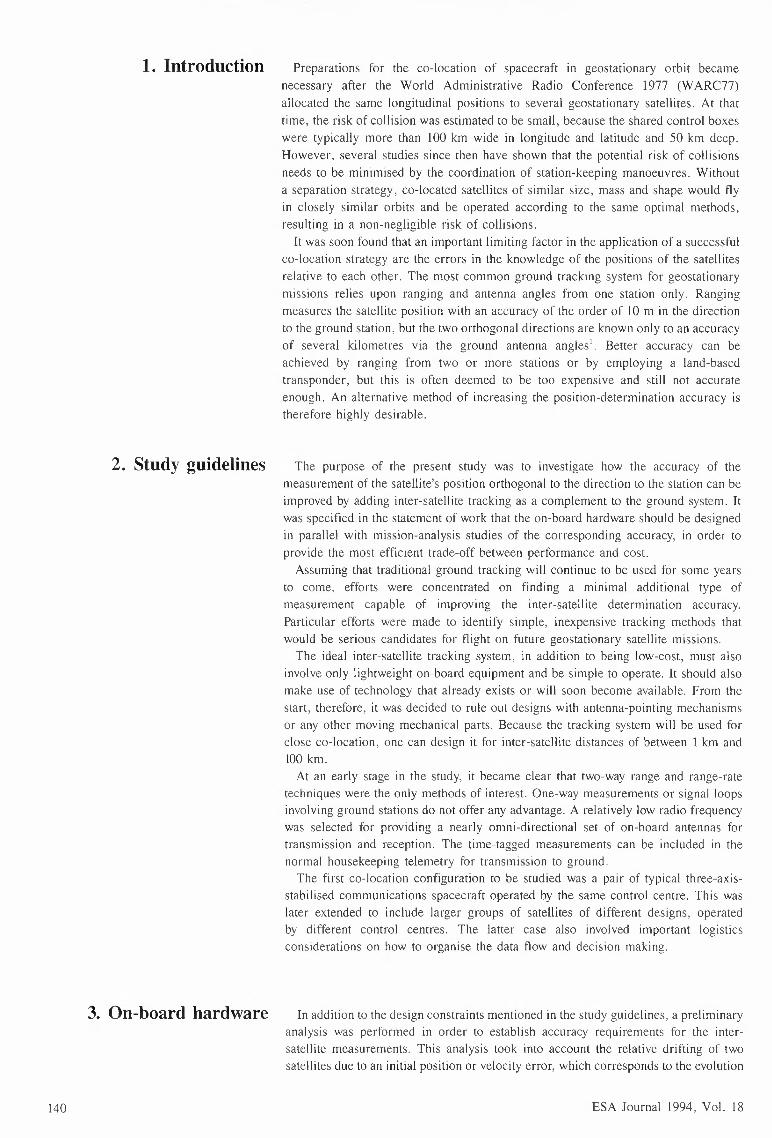
1. Introduction Preparations for the co-location of spacecraft in geostationary orbit becamenecessary after the World Administrative Radio Conference 1977 (WARC77)allocated the same longitudinal positions to several geostationary satellites. At thattime, the risk of collision was estimated to be small, because the shared control boxeswere typically more than 100 km wide in longitude and latitude and 50 km deep.However, several studies since then have shown that the potential risk of collisionsneeds to be minimised by the coordination of station-keeping manoeuvres. Withouta separation strategy, co-located satellites of similar size, mass and shape would flyin closely similar orbits and be operated according to the same optimal methods,resulting in a non-negligible risk of collisions.It was soon found that an important limiting factor in the application of a successful
co-location strategy are the errors in the knowledge of the positions of the satellitesrelative to each other. The most common ground tracking system for geostationarymissions relies upon ranging and antenna angles from one station only. Rangingmeasures the satellite position with an accuracy of the order of 10 m in the directionto the ground station, but the two orthogonal directions are known only to an accuracyof several kilometres via the ground antenna angles 1• Better accuracy can beachieved by ranging from two or more stations or by employing a land-basedtransponder, but this is often deemed to be too expensive and still not accurateenough. An alternative method of increasing the position-determination accuracy istherefore highly desirable.
2. Study guidelines The purpose of the present study was to investigate how the accuracy of themeasurement of the satellite's position orthogonal to the direction to the station can beimproved by adding inter-satellite tracking as a complement to the ground system. Itwas specified in the statement of work that the on-board hardware should be designedin parallel with mission-analysis studies of the corresponding accuracy, in order toprovide the most efficient trade-off between performance and cost.Assuming that traditional ground tracking will continue to be used for some years
to come, efforts were concentrated on finding a minimal additional type ofmeasurement capable of improving the inter-satellite determination accuracy.Particular efforts were made to identify simple, inexpensive tracking methods thatwould be serious candidates for flight on future geostationary satellite missions.The ideal inter-satellite tracking system, in addition to being low-cost, must also
involve only lightweight on-board equipment and be simple to operate. It should alsomake use of technology that already exists or will soon become available. From thestart, therefore, it was decided to rule out designs with antenna-pointing mechanismsor any other moving mechanical parts. Because the tracking system will be used forclose co-location, one can design it for inter-satellite distances of between 1 km and100 km.At an early stage in the study, it became clear that two-way range and range-rate
techniques were the only methods of interest. One-way measurements or signal loopsinvolving ground stations do not offer any advantage. A relatively low radio frequencywas selected for providing a nearly omni-directional set of on-board antennas fortransmission and reception. The time-tagged measurements can be included in thenormal housekeeping telemetry for transmission to ground.The first co-location configuration to be studied was a pair of typical three-axis
stabilised communications spacecraft operated by the same control centre. This waslater extended to include larger groups of satellites of different designs, operatedby different control centres. The latter case also involved important logisticsconsiderations on how to organise the data flow and decision making.
3. On-board hardware In addition to the design constraints mentioned in the study guidelines, a preliminaryanalysis was performed in order to establish accuracy requirements for the intersatellite measurements. This analysis took into account the relative drifting of twosatellites due to an initial position or velocity error, which corresponds to the evolution
140 ESA Journal 1994, Vol. 18

of the residual state estimation uncertainty due to orbital dynamics. Allowing a
maximum admissible drift of about 1 km in 24 h , and assuming the typical manoeuvreerrors observed during geostationary orbit control. a measurement resolution of aboutI0 m for range measurements and 1 mm/s for range-rate measurements (3a) was
derived.Apart from the measurement performance to be achieved. the major problems to
be resolved during the hardware design were the signal interference protection. thesatellite discrimination. and the allocation of a suitable frequency band to the intersatellite tracking (ISTRA) service. Three different interference scenarios wereconsidered:
Interference of the inter-satellite tracking link with any ground-to-satellite signal.and vice versa (c .g. telemetry /tclecornmand). This scenario becomes relevantbecause the ISTRA and the tclccornmand receiver on-hoard the satellite haveapproximately the same sensitivity. which implies that the received field strengthsof the ground-station telecommand uplink signal and of the ISTRA signal arcapproximately equal. The required damping ratio for separation of the competingsignals is significant (> 64 dls) because of the 40 dB dynamic range to be coveredby ISTRA (I - 100 km). and due to the antenna gain variation as a function of RFincidence angle.Interference of inter-satellite tracking signals originating from different satelliteswithin the satellite cluster. This interference scenario will he present for all clustersinvolving more than two satcll itcs and is closely related to the discrimination ofsatellites discussed below.Coupling of the ISTRA signal into the ISTRA receiver on-board the same satellite.which becomes possible due to the application of low-gain antennas with a largecoverage area. The required damping of 190 dB can be achieved by a frequencyturnaround ratio of at least 1.1. low-level out-of-hand spurious signals (<50 dBc).and the application of a transmit filter.
For satellite discrimination, the analysis yielded a preference for time discrimination.i.e. the allocation of time slots for the individual inter-satellite links to be scanned.Compared to the alternatives - namely discrimination either hy frequency separationor code - this design option showed the smallest demands in terms of hardware andfrequency resources. Moreover. modification of the cluster constellation (insertion orremoval of satellites) can be achieved simply by tclccornmand.The only drawback of a limited duty cycle. i.c. the fraction of a given reference
period that is assigned to a particular inter-satellite link. must be seen in relation tothe orbital period of I day. Tracking data should he equally spaced over this time inorder to he able to track the satellite librations caused by the residual eccentricity orinclination. Considering that an inter-satellite link between two arbitrary satellitesyields the same tracking information as the reverse link. the duty cycle for each linkwithin a cluster of eight satellites is still about 3.5'/r. i.e. about 50 min/day which isavailable for tracking. This will he sufficient. taking into account that - as discussedbelow - only about 15 s of integration time arc needed to obtain a set of one rangeand one range-rate measurement.
For the selection of a suitable frequency band for the ISTRA service. availablefrequencies allocated to the 'Space Operation Service· (SOS) have been evaluated withrespect to such trade-off criteria as the complexity of the interference protectionmethods required. the required RF power level. the available bandwidth, the availability of (largely space-qualified) hardware. and the achievable measurementaccuracy. The study has resulted in a recommendation to use the VHF band. whichsupplies sufficient bandwidth for a two-way measurement system with the necessaryturnaround ratio. and has the significant advantage of requiring a very low transmitpower (only 8 mW) in order to meet the receiver acquisition threshold. The intersatellite range information is obtained on the basis of a sine-wave range tone of80 kHz. which is used for phase-modulation of the selected RF carrier. Afterdemodulation, the noise impact has to be reduced by a narrow-band phase-lock loopand an adequate integration time. For the ranging-tone frequency assumed above. thisyields a random error of I0 m (I a).
ESA Journal 1994 Vol. 18 141
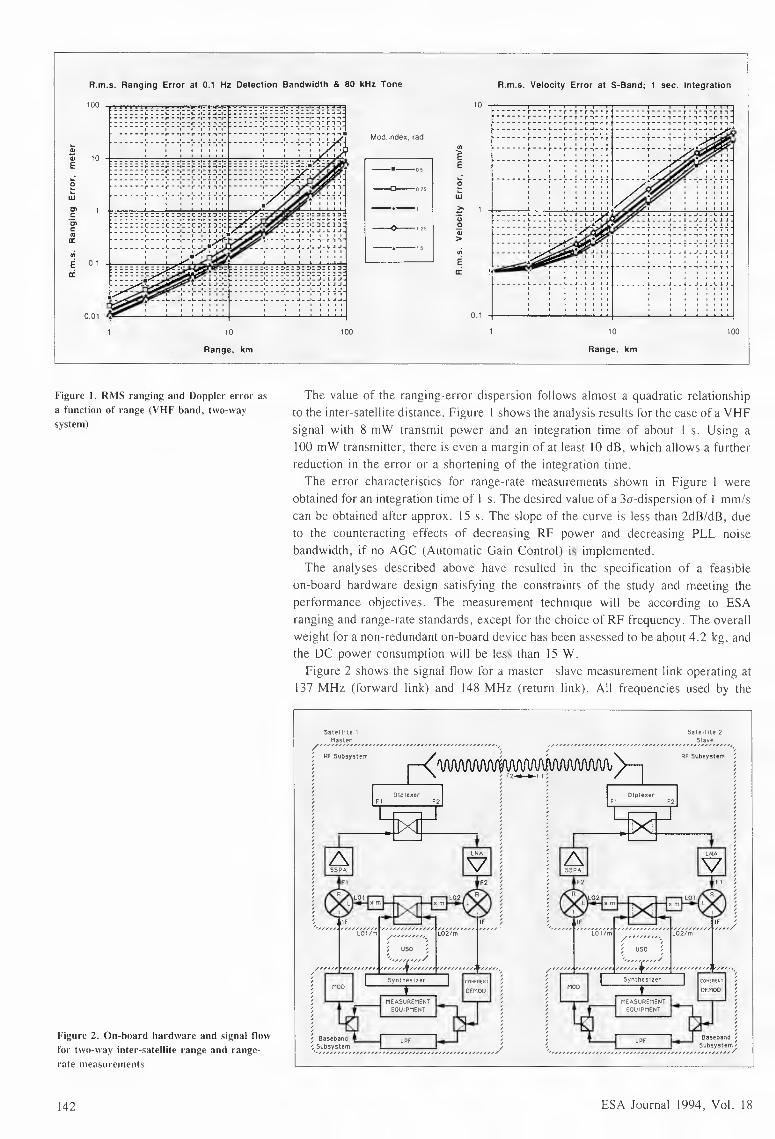
R.m.s. Velocity Error at S-Band; 1 sec. Integration
100
R.m.s. Ranging Error at 0.1 Hz Detection Bandwidth& 80 kHz Tone
Figure I. RMS ranging and Doppler error asa function of range (VHF band, two-waysystem)
Figure 2. On-board hardware and signal flowfor two-way inter-satellite range and rangerate measurements
142
10
I I I I I I I I------r---r-·r-i·r~-riI I I I I I I
I I I I I I
10
::::::~===~==~=~=~~=~~;::::::~===~==~=~=~=~~~------r---r--r-T·r-i-rT••••••L•••L••L.~-L~.L·
I I I I I I I I------r---r--r-r·r,-rT
I I I I I I I I------r---r--r-r·r,-r,Mod.Index, rad
"'c·c;,c••a:
"'eE ------~---~--~-·-~~-~·
I I I I I I I--•--05
--0---125
~~.._..y- ; ; ; 1; 1··••••~---~--T--,-,-,-T.,
~075
- ~=:::~=~~~-·=::i::1: J: c] J- -'· • J. ·'· J. L .JJ
f·-- -:--~--:-~-~~~-- - -:- - - -:- -~- -:-~-~~~
'uie 0.1a:
I I I I I I I I------i·--1--i-~-1-ri1- - - - - .1. - - J - • 1. J. J .L 1.J
I I I I I I I I--·--'5
:::: ::: :::: =·= =·= =·=- -:- -:- -:-- -,- -,- -.-
- - - - - -·- - - _,_ - - -1-
0.1I I. I I
------~---~--~-!-~~-~!f------!---~--f-~-~-~!~' ' '
10 10
Range, km
100 100
Range, km
The value of the ranging-error dispersion follows almost a quadratic relationshipto the inter-satellite distance. Figure 1 shows the analysis results for the case of a VHFsignal with 8 mW transmit power and an integration time of about 1 s. Using a100 mW transmitter, there is even a margin of at least JO dB, which allows a furtherreduction in the error or a shortening of the integration time.The error characteristics for range-rate measurements shown in Figure 1 were
obtained for an integration time of 1 s. The desired value of a 3a-dispersion of I mm/scan be obtained after approx. 15 s. The slope of the curve is less than 2dB/dB, dueto the counteracting effects of decreasing RF power and decreasing PLL noisebandwidth, if no AGC (Automatic Gain Control) is implemented.The analyses described above have resulted in the specification of a feasible
on-board hardware design satisfying the constraints of the study and meeting theperformance objectives. The measurement technique will be according to ESAranging and range-rate standards, except for the choice of RF frequency. The overallweight for a non-redundant on-board device has been assessed to be about 4.2 kg, andthe DC power consumption will be less than 15 W.
Figure 2 shows the signal flow for a master-slave measurement link operating at137 MHz (forward link) and 148 MHz (return link). All frequencies used by the
Satelute 2
RFSubsystem
----I~ ~ s~~~~~~~~~•,,,,,,, ,,,,,,,,,,,,,,,,,,,,,,,,,,,,,,,,,,,,,,,,,,/
ESA Journal 1994, Vol. 18

on-board equipment are derived from the output signal of an ultra-stable oscillatorwith a stability of :::::;0.004 ppm in any 50 x interval. The two-way measurementprinciple distinguishes a master (transmitting the forward signal) and a slave satellite(transmitting the return signal). The operating mode (master or slave) can be selectedvia two transfer switches connecting the diplexer and the local oscillator frequencyto either the transmitter or the receiver. Solid-state switches can be used for selectingbetween the multiplier input signals LOl/m and L02/m. while switching of the RFsignals to the proper diplexer ports must be carried out by low-loss. highly isolatingco-axial switches.
For an assessment of the orbit-determination accuracy that can be obtained by means 4. Orbit accuracyof a combined processing of conventional (ground-based) and inter-satellite trackingdata. a numerical performance analysis has been conducted. This analysis has beenbased on the method of weighted least-squares used for most of today's orbit-determination applications. The covariance analysis was chosen because of the needfor a considerable amount of parameter variations accounting for uncertainties ofmeasurement error parameters (bias uncertainties. noise dispersions). differentscenarios (separation strategy. manoeuvres. tracking schedule). and orbitperturbations (uncertainty regarding solar radiation pressure. manoeuvre errors). Fora given parameter set. the analysis provided an estimate of the uncertainty of an orbit-determination run. which is due to the uncertainty in the system parameters consideredand the tracking conditions. c.g. the geometrical observability of the state-vectorcomponents.
Free-flight orbit determinationThe analysis was carried out first without any system-dynamics biases. i.e. assuming
an error-free state prediction. In this way. the calculated estimation uncertainty wasdue only to the geometrical measurement conditions and to measurement errors. Theresidual estimation uncertainties obtained were rather insensitive to the separationstrategy and small with respect to the errors induced by orbit-prediction uncertainties.A closer co-location enhanced the orbit-determination performance due to the smallermeasurement noise at smaller distances.
Secondly. the effect of system-dynamics biases was taken into account in the stateerror prediction. but not solved for. The results revealed that these effects dominatethe error budget of the orbit determination. overruling the smaller effects of the intersatcll itc measurement types and the separation strategy.
As an example. Figure 3 shows the residual position error after the orbitdetermination as a function of the tracking period and the uncertainty in the area-tomass ratios of the individual satellites (as a percentage of the nominal value of0.03 m2/kg). The curves have been obtained for an eccentricity/inclination separationwithin a 0.1° window. using two-way ranging measurements. One can observe that thesecular growth of the prediction error for the in plane-state components cannot beremoved completely by the estimation. On the contrary. the error in the out-of-planecomponent. which is only slightly affected by the perturbation. decreases due to the Fii:ure ]. Effect of system dynamics biases 011
larger tracking-data sample size. the urbit-determinatiun accuracy
E 30•....0I::~ 20c0·=·c;;0 10p...~;;.·g~ 0~
1 2 3 4Tracking Period (days)
10 10--.---------.10 along track out of plane
8
53
5
36
1 2 31 3 42Tracking Period (days) Tracking Period (days)
ESA Journal 1994 Vol. 18
4
143
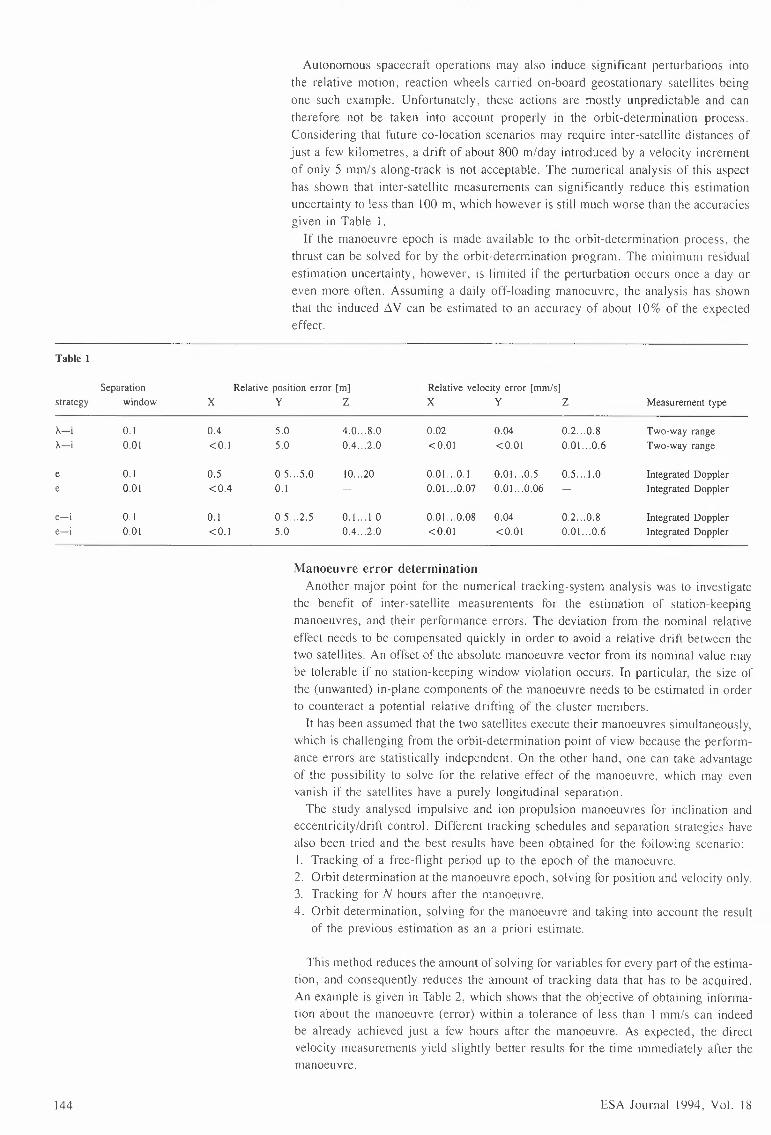
Autonomous spacecraft operations may also induce significant perturbations intothe relative motion. reaction wheels carried on-board geostationary satellites beingone such example. Unfortunately. these actions are mostly unpredictable and cantherefore not be taken into account properly in the orbit-determination process.Considering that future co-location scenarios may require inter-satellite distances ofjust a few kilometres, a drift of about 800 m/day introduced by a velocity incrementof only 5 mm/s along-track is not acceptable. The numerical analysis of this aspecthas shown that inter-satellite measurements can significantly reduce this estimationuncertainty to less than I00 m, which however is still much worse than the accuraciesgiven in Table l.
If the manoeuvre epoch is made available to the orbit-determination process. thethrust can be solved for by the orbit-determination program. The minimum residualestimation uncertainty. however. is limited if the perturbation occurs once a day oreven more often. Assuming a daily off-loading manoeuvre, the analysis has shownthat the induced !:,.V can be estimated to an accuracy of about 10% of the expectedeffect.
Table l
Separationstrategy window--->-.-i 0.1>-.-i 0.01
e 0.1e 0.01
e-i 0.1e-i 0.01
Relative position error [m] Relative velocity error [rnm/s]x y z x y z Measurement type
0.4 5.0 4.0 ... 8.0 0.02 0.04 0.2 ... 0.8 Two-way range<0.1 5.0 0.4 ... 2.0 <0.01 <0.01 0.01 ... 0.6 Two-way range
0.5 0.5 ... 5.0 10... 20 0.01...0.l 0.01...0.5 0.5 ... 1.0 Integrated Doppler<0.4 0.1 0.01. ..0.07 0.01 ... 0.06 - Integrated Doppler
0.1 0.5 ... 2.5 0.1...1.0 0.01...0.08 0.04 0.2 ... 0.8 Integrated Doppler<0.1 5.0 0.4 ... 2.0 <0.01 <0.01 0.01...0.6 Integrated Doppler
Manoeuvre error determinationAnother major point for the numerical tracking-system analysis was to investigate
the benefit of inter-satellite measurements for the estimation of station-keepingmanoeuvres. and their performance errors. The deviation from the nominal relativeeffect needs to be compensated quickly in order to avoid a relative drift between thetwo satellites. An offset of the absolute manoeuvre vector from its nominal value maybe tolerable if no station-keeping window violation occurs. In particular, the size ofthe (unwanted) in-plane components of the manoeuvre needs to be estimated in orderto counteract a potential relative drifting of the cluster members.
It has been assumed that the two satellites execute their manoeuvres simultaneously.which is challenging from the orbit-determination point of view because the performance errors are statistically independent. On the other hand. one can take advantageof the possibility to solve for the relative effect of the manoeuvre. which may evenvanish if the satellites have a purely longitudinal separation.The study analysed impulsive and ion-propulsion manoeuvres for inclination and
eccentricity/drift control. Different tracking schedules and separation strategics havealso been tried and the best results have been obtained for the following scenario:I. Tracking of a free-flight period up to the epoch of the manoeuvre.2. Orbit determination at the manoeuvre epoch. solving for position and velocity only.3. Tracking for N hours after the manoeuvre.4. Orbit determination, solving for the manoeuvre and taking into account the result
of the previous estimation as an a priori estimate.
This method reduces the amount of solving for variables for every part of the estimation. and consequently reduces the amount of tracking data that has to be acquired.An example is given in Table 2, which shows that the objective of obtaining information about the manoeuvre (error) within a tolerance of less than I mm/s can indeedbe already achieved just a few hours after the manoeuvre. As expected. the directvelocity measurements yield slightly better results for the time immediately after themanoeuvre.
144 ESA Journal 1994, Vol. 18
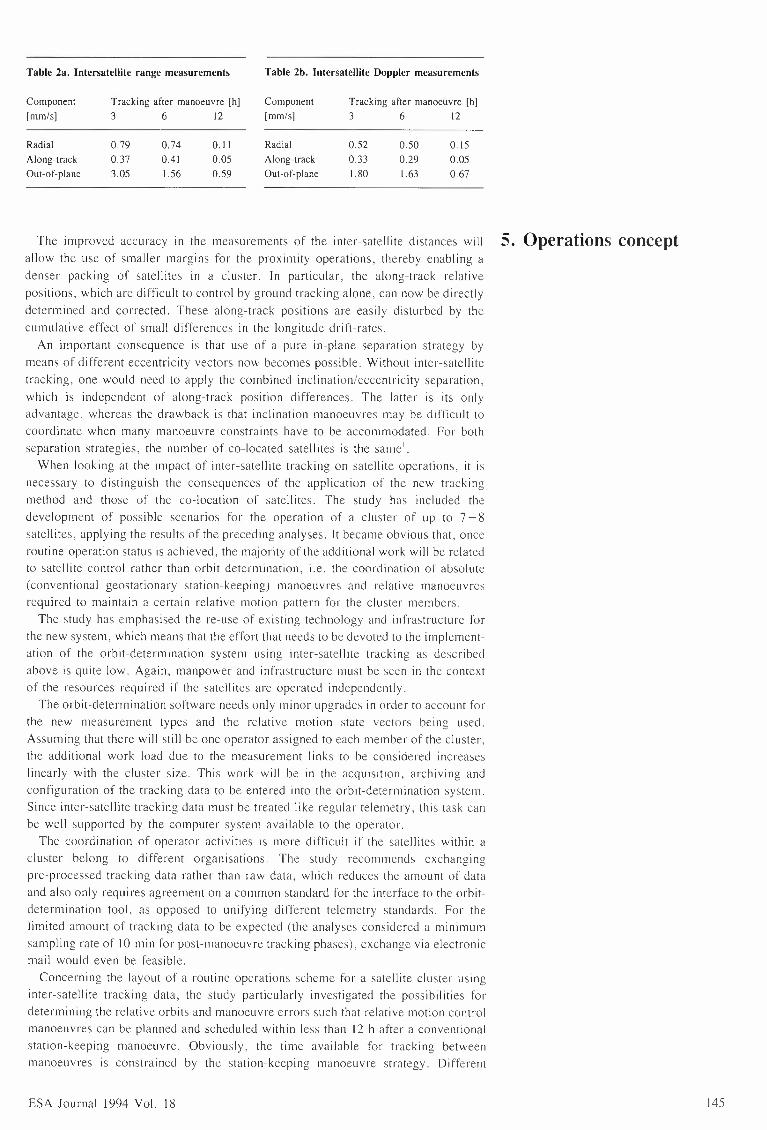
Table 2a. lntersatellite range measurements Table 2b. Intersatellite Doppler measurements
Component Tracking after manoeuvre [h][mm/s] 3 6 12
Radial 0.79 0.74 0.11Along-track 0.37 0.41 0.05Out-of-plane 3.05 1.56 0.59
Component Tracking after manoeuvre [h][mm/s] 3 6 12
Radial 0.52 0.50 0.15Along-track 0.33 0.29 0.05Out-of-plane 1.80 1.63 0.67
The improved accuracy in the measurements of the inter-satellite distances will 5. Operations conceptallow the use of smaller margins for the proximity operations. thereby enabling adenser packing of satellites in a cluster. In particular. the along-track relativepositions. which arc difficult to control by ground tracking alone, can now be directlydetermined and corrected. These along-track positions arc easily disturbed by thecumulative effect of small differences in the longitude drift-rates.
An important consequence is that use of a pure in-plane separation strategy bymeans of different eccentricity vectors now becomes possible. Without inter-satellitetracking, one would need to apply the combined inclination/eccentricity separation.which is independent of along-track position differences. The latter is its onlyadvantage. whereas the drawback is that inclination manoeuvres may be difficult tocoordinate when many manoeuvre constraints have to be accommodated. For bothseparation strategies. the number of co-located satellites is the same'.When looking at the impact of inter-satellite tracking on satellite operations, it is
necessary to distinguish the consequences of the application of the new trackingmethod and those of the co-location of satellites. The study has included thedevelopment of possible scenarios for the operation of a cluster of up to 7 - 8satellites. applying the results of the preceding analyses. It became obvious that. onceroutine-operation status is achieved, the majority of the additional work will be relatedto satellite control rather than orbit determination, i.e. the coordination of absolute(conventional geostationary station-keeping) manoeuvres and relative manoeuvresrequired to maintain a certain relative motion pattern for the cluster members.The study has emphasised the re-use of existing technology and infrastructure for
the new system, which means that the effort that needs to be devoted to the implementation of the orbit-determination system using inter-satellite tracking as describedabove is quite low. Again, manpower and infrastructure must be seen in the contextof the resources required if the satellites arc operated independently.
The orbit-determination software needs only minor upgrades in order to account forthe new measurement types and the relative motion state vectors being used.Assuming that there will still be one operator assigned to each member of the cluster.the additional work load due to the measurement links to be considered increaseslinearly with the cluster size. This work will be in the acquisition. archiving andconfiguration of the tracking data to be entered into the orbit-determination system.Since inter-satellite tracking data must be treated like regular telemetry, this task canbe well supported by the computer system available to the operator.The coordination of operator activities is more difficult if the satellites within a
cluster belong to different organisations. The study recommends exchangingpre-processed tracking data rather than raw data. which reduces the amount of dataand also only requires agreement on a common standard for the interface to the orbitdetermination tool, as opposed to unifying different telemetry standards. For thelimited amount of tracking data to be expected (the analyses considered a minimumsampling rate of I0 min for post-manoeuvre tracking phases). exchange via electronicmail would even be feasible.Concerning the layout of a routine operations scheme for a satellite cluster using
inter-satellite tracking data. the study particularly investigated the possibilities fordetermining the relative orbits and manoeuvre errors such that relative motion controlmanoeuvres can be planned and scheduled within less than 12 h after a conventionalstation-keeping manoeuvre. Obviously. the time available for tracking betweenmanoeuvres is constrained by the station-keeping manoeuvre strategy. Different
ESA Journal 1994 Vol. 18 145

scenarios have been studied using the performance data obtained from the numericalanalyses. Due to the improved accuracy of the orbit determination, especially in thealong-track direction, the appropriate scheduling of relative motion controlmanoeuvres would be possible within the available time, even for the challenging casein which the inclination correction is done with ion propulsion, which results infrequent manoeuvres and consequently short tracking periods.
6. Conclusions The proposed system for performing inter-satellite range or range-rate measurementsin the VHF band has been found to be a promising candidate for providing theimproved inter-satellite determination accuracy that is necessary for closer co-locationof the large clusters of geostationary satellites foreseen for the future. An importantfurther advantage is that the system enables the implementation of purely in-planeeccentricity separation strategies. This removes the need for coordinating inclinationmanoeuvres, which is often difficult in view of the many constraints that have to beconsidered.
References I. Soop E.M. 1994, Handbook of Geostationary Orbits, Space Technology Library,Kluwer Academic Publishers, Dordrecht.
2. Soppa U. et al. 1994, Study on Inter-Satellite Tracking for Co-location, FinalReport, ESA Contract 10035/92/D/CS.
Manuscript received 26 April 1994
146 ESA Journal 1994, Vol. 18
M. N. De ParolisThermal Control and Heat Rejection Section, ESTEC, Noordwijk, The Netherlands
A Controlled Pump Assembly for Spacecraft CoolingLoops
Abstract The role of thermal-control systems is to maintain the temperature of every itemonboard a spacecraft within pre-defined temperature limits, throughout all phases ofa space mission, with a minimum resource allocation. This includes, in particular,efficient management of the power dissipated onboard. The trend with bothapplications spacecraft and space vehicles is one of a continuous increase in theservices offered to the users. This implies both an increase in the power produced anddissipated onboard , and the provision of a high degree of operational flexibility,including the possibility to change the power load distribution on the spacecraftquickly and safely. Furthermore, many payloads require a high degree of uniformityand stability in terms of their temperature, or the temperature of the environment inwhich they operate. All of these requirements point to the use of cooling loops, basedon either single- or two-phase t1uid operation, as the optimum thermal-managementsystem.
ESA Journal 1994 Vol. 18 147
1. Cooling loops 1.1. Single-phase loopsIn single-phase cooling loops, the refrigerating liquid absorbs the heat from the
power-dissipating items, increasing its temperature, and transports it to the heatrejecting devices. There, the heat is released to the heat sink and the fluid is broughtback to a low temperature so as to be ready to begin another cycle. A pump is essentialto provide the fluid with the hydraulic energy needed to perform this task (Fig. la).The advantage of these systems is the relative simplicity of regulation and control
and the lack of sensitivity as regards spatial orientation and the mechanicalenvironment.
1.2. Two-phase loopsTwo-phase cooling loops can be of three kinds:mechanically pumped loops (MPL, in Fig. lb)capillary pumped loops (CPL in Fig. le), orhybrid loops (Fig. Id).
The first type are similar to single-phase loops, except that the fluid changes its state(evaporating while absorbing the heat and condensing in the heat-rejecting devices)instead of just changing its temperature. Consequently, a pump is essential for theseloops also. The advantage that they have compared with the single-phase loops is thelarge reduction in the fluid flow rate needed to manage the same quantity of power,and the accompanying decrease in the level of resources needed for the thermalcontrol system.
For the capillary systems, the driving force is provided by the capillary action ofthe material constituting the wick of the evaporators. Hence, a separate pump is notneeded. There are, however, particular operations or mission phases for which thecapillary actions might reach their limits (e.g. loop start-up, peak power loads, highmechanical loads or ground testing).For these reasons, hybrid loops have been proposed in which the nominal driving
force is provided by the capillary actions with a pump acting during particular missionphases (e.g. launch) and/or operational phases (e.g. peak loads or during groundtesting).To date, only single-phase loops have been flown onboard spacecraft and space
vehicles (e.g. the Apollo missions and the Space Shuttle in the USA; Soyuz capsulesand the Mir Station in the CIS). European spacecraft also have profitted from singlephase loops, including Spacelab and Eureca. In both cases, however, the pumptechnology was based on US components. ESA therefore initiated two technologicalstudies, the first in the framework of the Columbus Preparatory Support TechnologyProgramme (PSTP, 1986), and the second in the framework of the Basic TechnologyResearch Program (TRP). The first study programme was subsequently transformedinto a development programme under the direct responsibility of the ColumbusProject. This paper reports the results of the second study programme within the TRP,which was the subject of a contract (ESTEC/9039/FG/NL) awarded in October 1990.The Prime Contractor was Reusser AG, which was responsible for the assembly andthe hydro-mechanical parts, with Etel SA as a subcontractor responsible for thedevelopment of the electrical and electronic components.
2. Objectives andrequirements
The scope of the technology study was the design, development and qualification-level testing of a pump unit having the following general features:
the ability to maintain or to assist the circulation of the fluid along the loop at therequired flow rate(s) during all mission phases, including launch and re-entrythe facility to be multi-fluid, i.e. to be compatible with a wide range of fluids,including de-mineralised water, ammonia and fluoro-carbons (freon)the ability to be reliable and provide operational flexibilityhave an efficiency as high as possible, to avoid unnecessary power consumption(single-phase loops) or a high heat loads on the fluid (two-phase loops).
148 ESA Journal 1994, Vol. 18

FIG.1d
[] HEAT EXCHANGEROR COLD PLATE
0 HEAT EXCHANGERFIG.1a OR RADIATOR
TEVAPORATOR
uuIr 'I'1111 Ill "Ill Ill "111:! Pl " g"1!11 :!: "'"' CON DEN SORuu B! '"'"
T I I ~'\ bnl I FIG. 1b ~ BY-PASS VALVE
9 PUMP UNIT
Q ACCUMULATORi!
1111•Ill1111nu
!lUll
"'"'"'H 1:1
"LIQUID LINES
- VAPOUR LINES
FIG.1c ¢ FILTER
Requirement
Tahlc 1. :\lain requirements
Nominal value Rungc/not«
Ho« rate Ikg h I..lp 1Pa 10 'FluidTemperature!'"CiEfficiency I 'XI
l'ower(WiProof pressure ll'a 10 'JBuN !Pa 10 ;IMicrogravity disturbance 1'-'Il-uviromucntal temperatureI 'Cil.nvironmcnt.rl pressure !Pa 10 '1l.itctimc
.\l:iI-+lrcon 11-120>30<XO22 .:=i.\00.0120
I :iO t" .\XOIU:i to 2.l:iWater - ammonia
0 to .\0
0.1 to 500 Ht-.\0 t() -10Vacuum t" I. 15
ESA Journal 1994 Vol. 18
:ill 11110h or 15 yrfrom deliver~
Figures la-cl
149
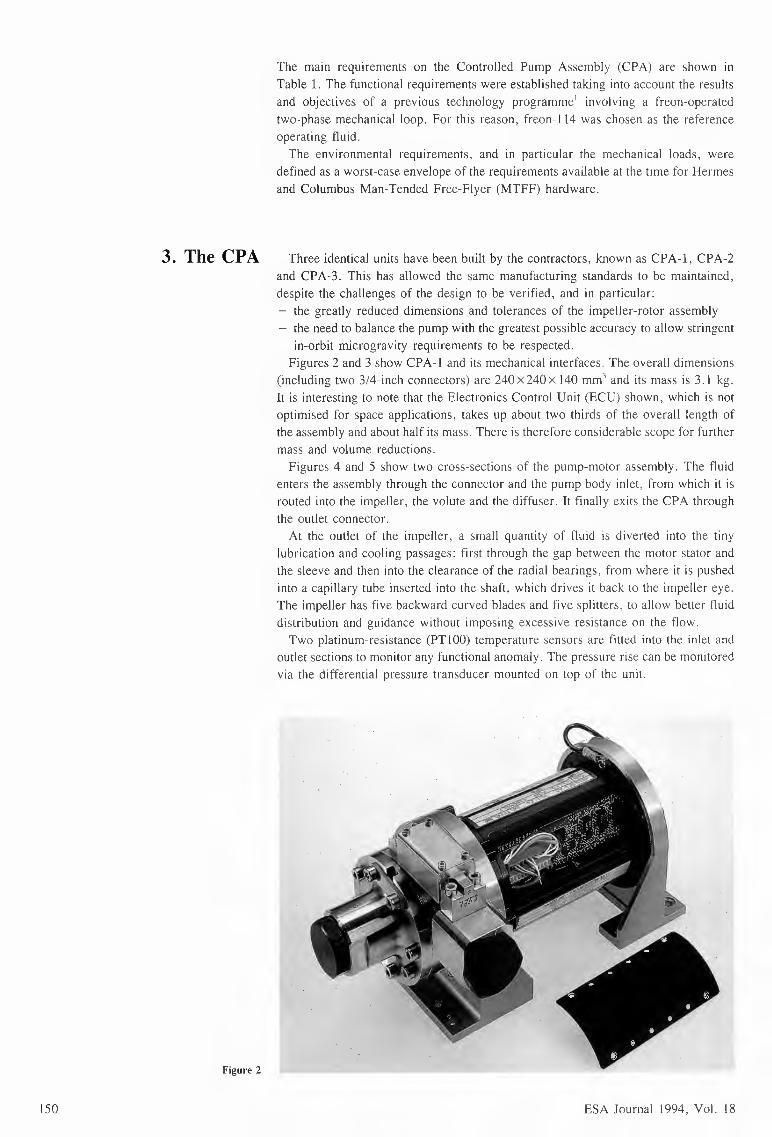
3. The CPA
Figure 2
150
The main requirements on the Controlled Pump Assembly (CPA) are shown inTable 1. The functional requirements were established taking into account the resultsand objectives of a previous technology programme' involving a freon-operatedtwo-phase mechanical loop. For this reason. freon-114 was chosen as the referenceoperating fluid.The environmental requirements, and in particular the mechanical loads, were
defined as a worst-case envelope of the requirements available at the time for Hermesand Columbus Man-Tended Free-Flyer (MTFF) hardware.
Three identical units have been built by the contractors, known as CPA-1, CPA-2and CPA-3. This has allowed the same manufacturing standards to be maintained,despite the challenges of the design to be verified, and in particular:
the greatly reduced dimensions and tolerances of the impeller-rotor assembly- the need to balance the pump with the greatest possible accuracy to allow stringent
in-orbit microgravity requirements to be respected.Figures 2 and 3 show CPA- I and its mechanical interfaces. The overall dimensions
(including two 3/4-inch connectors) are 240X240x 140 mm' and its mass is 3.1 kg.It is interesting to note that the Electronics Control Unit (ECU) shown, which is notoptimised for space applications, takes up about two thirds of the overall length ofthe assembly and about half its mass. There is therefore considerable scope for furthermass and volume reductions.Figures 4 and 5 show two cross-sections of the pump-motor assembly. The fluid
enters the assembly through the connector and the pump body inlet, from which it isrouted into the impeller, the volute and the diffuser. It finally exits the CPA throughthe outlet connector.
At the outlet of the impeller. a small quantity of fluid is diverted into the tinylubrication and cooling passages: first through the gap between the motor stator andthe sleeve and then into the clearance of the radial bearings, from where it is pushedinto a capillary tube inserted into the shaft, which drives it back to the impeller eye.The impeller has five backward curved blades and five splitters, to allow better fluiddistribution and guidance without imposing excessive resistance on the flow.Two platinum-resistance (PT 100) temperature sensors are fitted into the inlet and
outlet sections to monitor any functional anomaly. The pressure rise can be monitoredvia the differential pressure transducer mounted on top of the unit.
ESA Journal 1994, Vol. 18
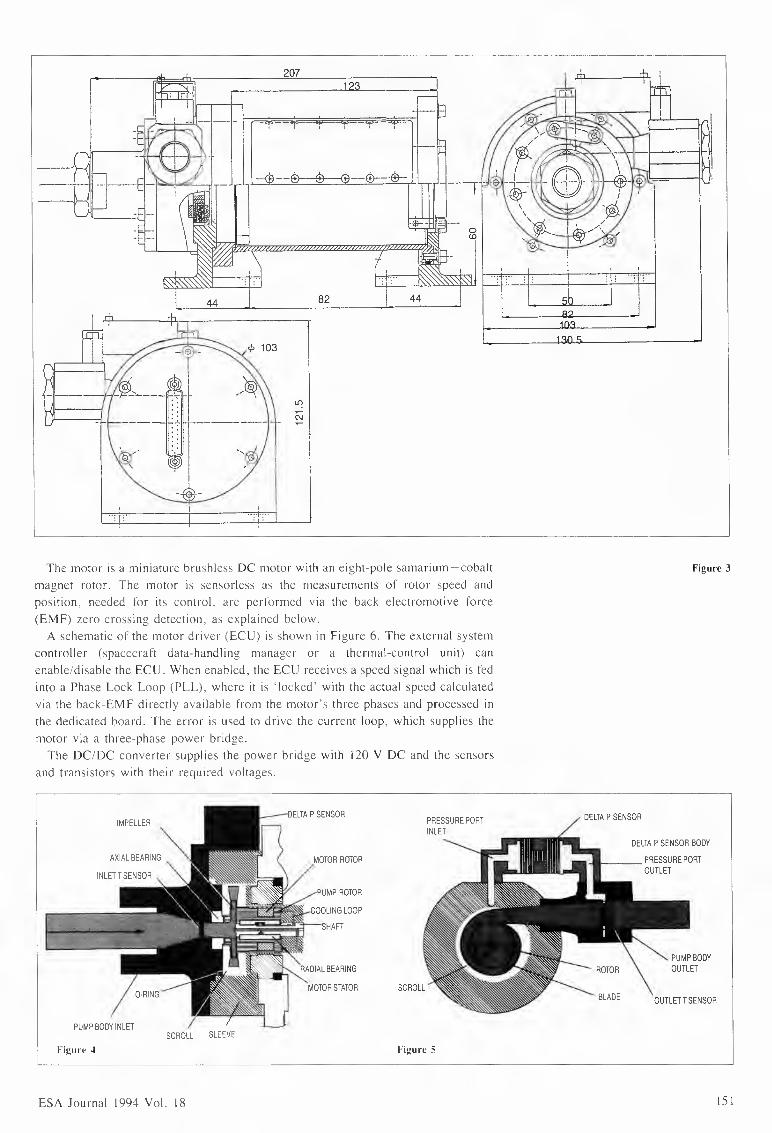
---<B--©--4----<B--©-- -$--
207
44 82 44 ~ J
IMPELLER
AXIAL BEARING
sa
The motor is a miniature brushlcss DC motor with an eight-pole samarium -cohaltmagnet rotor. The motor is scnsorless as the measurements of rotor speed andposition. needed for its control. arc performed via the hack electromotive force(EMF) zero-crossing detection. as explained below.
A schematic of the motor driver (ECU) is shown in Figure 6. The external systemcontroller (spacecraft data-handling manager or a thermal-control unit) canenable/disable the ECU. When enabled, the ECU receives a speed signal which is fedinto a Phase Lock Loop (PLL). where it is 'locked' with the actual speed calculatedvia the back-EMF directly available from the motor's three phases and processed inthe dedicated hoard. The error is used to drive the current loop. which supplies themotor via a three-phase power bridge.The DC/DC converter supplies the power hridge with 120 V DC and the sensors
and transistors with their required voltages.
Figure 3
PUMP BODY INLETSCROLL SLEEVE
DELTAP SENSOR
MOTOR ROTOR
DELTAP SENSOR BODY
• PRESSURE PORTOUTLET
PUMP ROTOR
SHAFT
SCROLLOUTLETT SENSOR
Figure -t Figure 5
ESA Journal 1994 Vol. 18 151
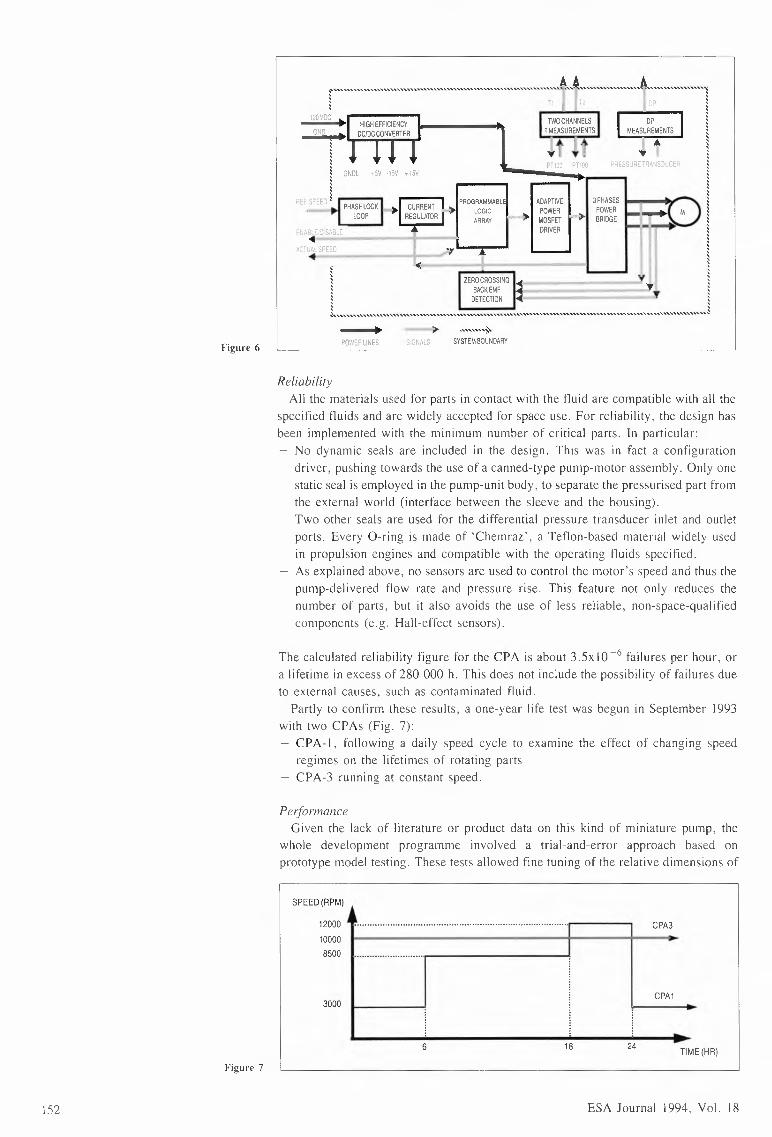
Figure 6
Figure 7
152
,---------------------------------------------------------------------A--~------------------"----------------- ...~ i ~~ ~' ''2C '-"~ ~- TWOCHANNELS
T MEASUREMENTS
t ;~,, "JDP
MEASUREMENTS•
3PHASES~POWER
>I BRIDGE
ADAPTIVEPOWER
>I MDSFETDRIVER
PROGRAMMABLLOGICARRAY
PHASE LOCK I ~:LOOP
.,
SYSTEM BOUNDARY
ReliabilityAll the materials used for parts in contact with the fluid are compatible with all the
specified fluids and are widely accepted for space use. For reliability, the design hasbeen implemented with the minimum number of critical parts. In particular:
No dynamic seals are included in the design. This was in fact a configurationdriver, pushing towards the use of a canned-type pump-motor assembly. Only onestatic seal is employed in the pump-unit body, to separate the pressurised part fromthe external world (interface between the sleeve and the housing).Two other seals are used for the differential pressure transducer inlet and outletports. Every 0-ring is made of 'Chemraz '. a Teflon-based material widely usedin propulsion engines and compatible with the operating fluids specified.As explained above, no sensors are used to control the motor's speed and thus thepump-delivered flow rate and pressure rise. This feature not only reduces thenumber of parts, but it also avoids the use of less reliable, non-space-qualifiedcomponents (e.g. Hall-effect sensors).
The calculated reliability figure for the CPA is about 3.5xl0-6 failures per hour, ora lifetime in excess of 280 000 h. This does not include the possibility of failures dueto external causes, such as contaminated fluid.
Partly to confirm these results, a one-year life test was begun in September 1993with two CPAs (Fig. 7):
CPA- I, following a daily speed cycle to examine the effect of changing speedregimes on the lifetimes of rotating partsCPA-3 running at constant speed.
PerformanceGiven the lack of literature or product data on this kind of miniature pump, the
whole development programme involved a trial-and-error approach based onprototype model testing. These tests allowed fine tuning of the relative dimensions of
SPEED(RPM)
~:: t:::::_:: __:-_:::·-------------- - ---- ---1 I CPA3
CPA13000
24186 TIME(HR)
ESA Journal 1994, Vol. 18
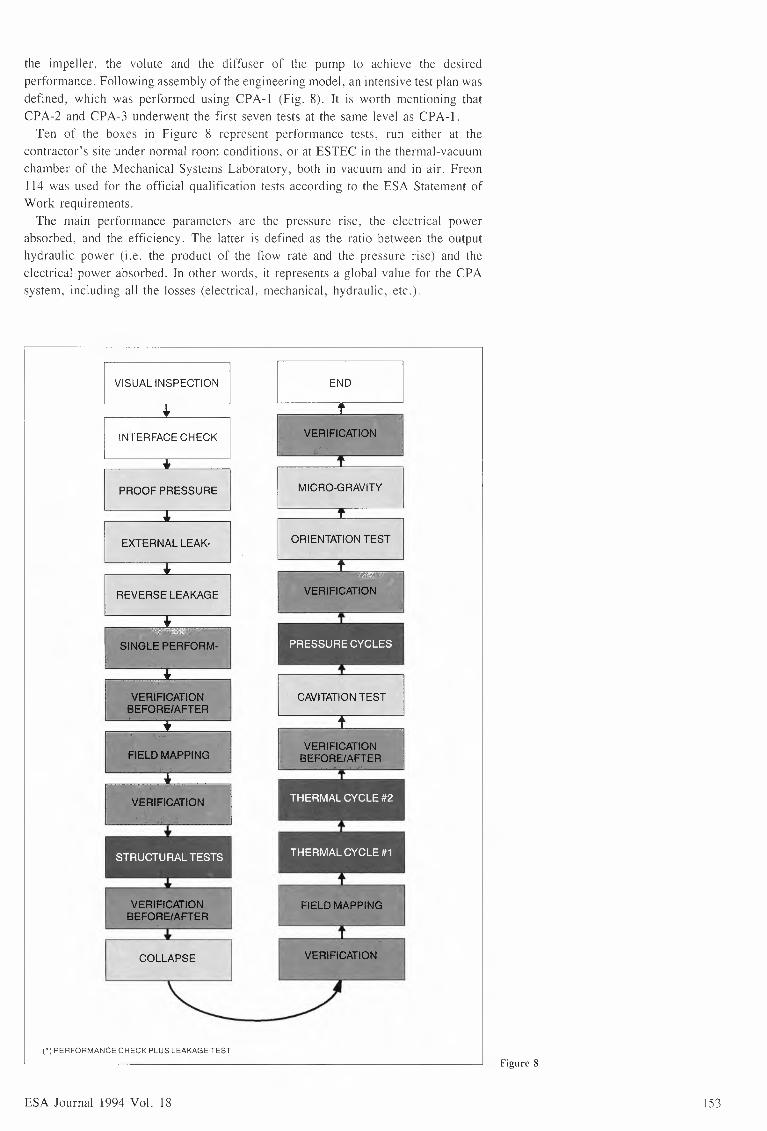
the impeller, the volute and the diffuser of the pump to achieve the desiredperformance. Following assembly of the engineering model, an intensive test plan wasdefined, which was performed using CPA-1 (Fig. 8). It is worth mentioning thatCPA-2 and CPA-3 underwent the first seven tests at the same level as CPA-1.Ten of the boxes in Figure 8 represent performance tests, run either at the
contractor's site under normal room conditions, or at ESTEC in the thermal-vacuumchamber of the Mechanical Systems Laboratory, both in vacuum and in air. Freon114 was used for the official qualification tests according to the ESA Statement ofWork requirements.The main performance parameters are the pressure rise, the electrical power
absorbed, and the efficiency. The latter is defined as the ratio between the outputhydraulic power (i.e. the product of the flow rate and the pressure rise) and theelectrical power absorbed. In other words, it represents a global value for the CPAsystem, including all the losses (electrical, mechanical, hydraulic, etc.).
VISUAL INSPECTION
INTERFACECHECK
(')PERFORMANCECHECKPLUSLEAKAGETEST
ESA Journal 1994 Vol. 18
END
MICRO-GRAVITY
Figure 8
153

The conclusions from the test campaign were as follows:The CPA's performance range is much wider than required. The flow-rate rangeextends up to 800 kg/h and the maximum achievable pressure rise, at that flowrate, is 2.25 bar.The absorbed electrical power, at the design point, turned out to be less thanrequired (about one third). Even under the worst specified operating (reducedvoltage, maximum speed) and environmental (freon temperature - 30°C)conditions, the absorbed power was about 65 % of the maximum specified value.The efficiency at the design point is 33 %, going up to 45 % for the highest flowrates (800 kg/h). In the low-flow-rate range (100 to 150 kg/h), the efficiency isalways higher than 10%.
Figures 9a -c summarise those results, showing the pressure rise, the efficiency andthe absorbed electrical power as a function of flow rate for five selected speeds. Theseplots refer to the field mapping test performed after all of the environmental testing.Comparisons between the test data gathered before and after the environmental testsnever showed performance differences greater than ±5%.
Cavitation behaviourA special performance test was conducted to verify the cavitation resistance of the
pump. Cavitation is a very disturbing phenomenon that can dramatically affect theperformance of pumps, valves and any fluid component in general. When the localfluid pressure falls below the fluid vapour pressure, vapour bubbles can be generated.These bubbles, transported by the fluid stream, can flow to locations where thepressure is higher than the fluid vapour pressure, where they collapse back into theliquid. The process of bubble generation and subsequent collapse is highly dangerousbecause:
it reduces the hydraulic power imparted to the fluid and thus the pump efficiencyit causes vibration and acoustic noise, which would disturb the microgravityenvironmentit can accelerate corrosion and erosion processes in the equipment.
The phenomenon's occurrence is particularly critical for two-phase loops, where thefluid is under saturation conditions all around the loop. Thus, in order to avoidcavitation, the fluid temperature must be reduced just before the pump (sub-cooling)so that the local vapour pressure is lower than the loop pressure. The sub-coolingreduces the efficiency of the two-phase loop action and thus should be kept to aminimum. This value is determined by the pump characteristics (speed, geometricaldimensions of the impeller, shape and number of blades, etc.) and can only be definedvia proper testing.The test consisted of reducing the pump inlet pressure in small steps until the onset
of cavitation, which was signalled by a sudden decrease in the pump pressure rise andflow rate, as well as by the direct observation of small bubbles in the flowmeterwindow. The test was performed at five different operating points and at two differenttemperatures (0° and 28°C).
Under the worst operating and temperature conditions (i.e. highest speed and lowesttemperature), the freon-114-operated CPA required a minimum pressure differential,between the inlet pressure and the saturation pressure, of about 0.22 bar. Thiscorresponds to a freon sub-cooling of about 6°C, well within the actual l0°Cnormally adopted in two-phase loops in order to have correct evaporator operation.
Pressure and leakage testsAs noted above, the specification called for full compatibility of the CPA with a
wide range of fluids, including ammonia. The proof pressure was therefore definedby the worst-case Maximum Operating Pressure (MOP), i.e. the ammonia vapourpressure at 40°C (15 bar). The allowed leak rates were also fixed based on the safetyrules connected with the use of ammonia.
154 ESA Journal 1994, Vol. 18
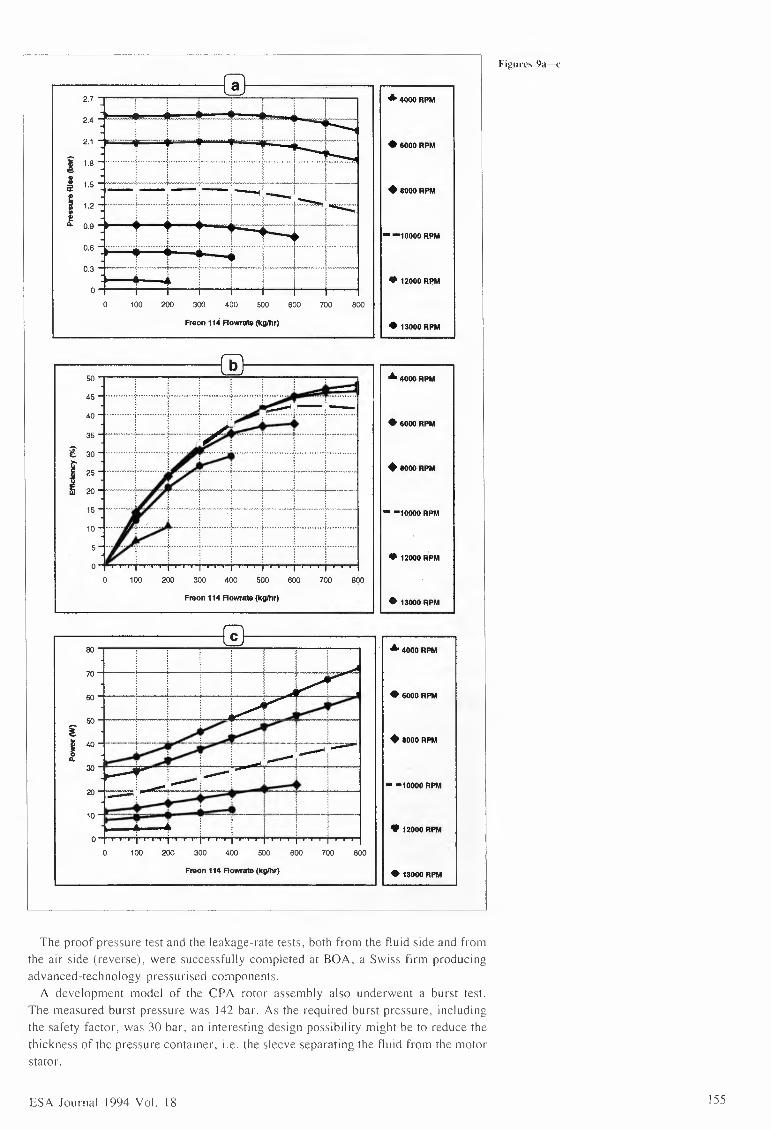
2.7
2.4
2.1
i 1.8
I 1.5ii!
J1.2
0.9
0.6
0.3
0
800
800
800
0 100 200 300 400 500 600 700
••• 4000RPM
•sooORPM
+aoooRPM
--10000RPM
• 12000RPM
• 13000RPM
The proof pressure test and the leakage-rate tests. both from the fluid side and fromthe air side (reverse). were successfully completed at BOA. a Swiss firm producingadvanced-technology pressurised components.
A development model of the CPA rotor assembly also underwent a burst test.The measured burst pressure was 142 bar. As the required burst pressure. includingthe safety factor. was 30 bar. an interesting design possibility might be to reduce thethickness of the pressure container. i.c. the sleeve separating the fluid from the motorstator.
Freon 114Aowralll (kg/hr)
10
5
0 100 200 300 400 500 600 700
Freon 114Aowrale (kg/hr)
100 200 300 400 500 600 7000
Freon 114 Aowrate (kg/hr)
ESA Journal 1994 Vol. 18
••• 4000RPM
•&oOORPM
+aoOORPM
- •10000RPM
• 12000RPM
• 13000RPM
••• 4000RPM
• 6000RPM
+aoooRPM
• •10000RPM
• 12000RPM
• 13000RPM
Fi~11rl's 9a-t
155
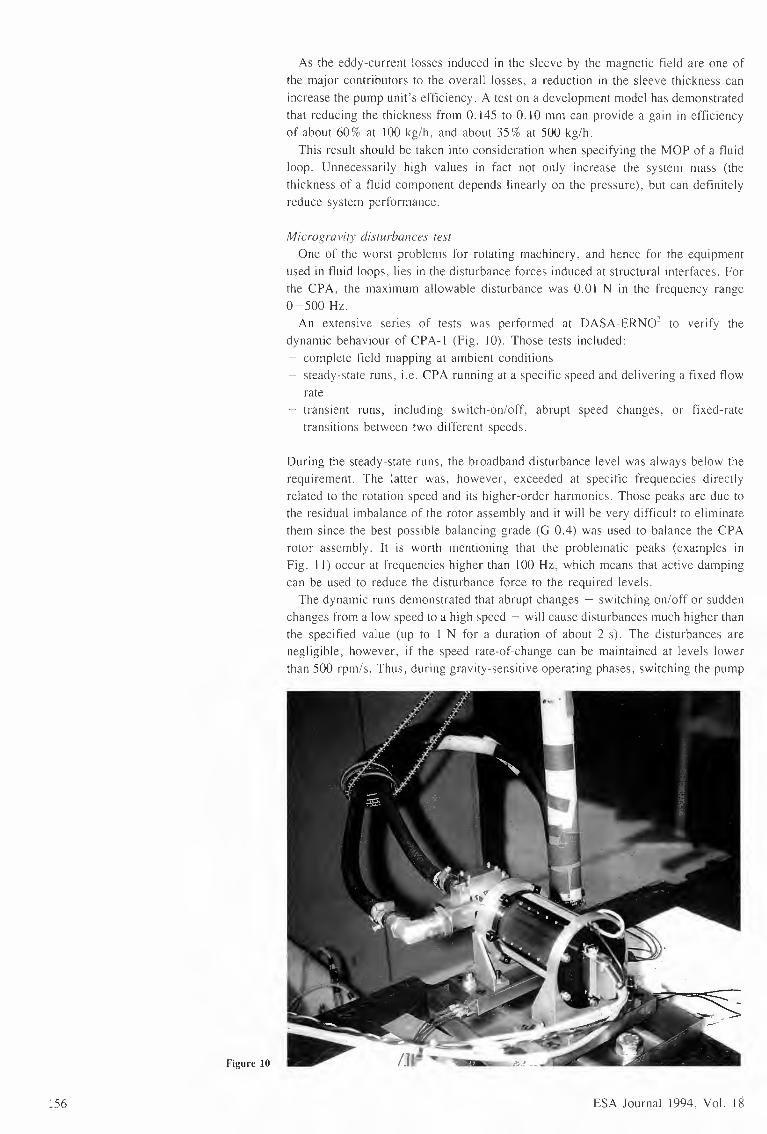
Figure 10
156
As the eddy-current losses induced in the sleeve by the magnetic field are one ofthe major contributors to the overall losses. a reduction in the sleeve thickness canincrease the pump unit's efficiency. A test on a development model has demonstratedthat reducing the thickness from 0.145 to 0.10 mm can provide a gain in efficiencyof about 60% at 100 kg/h, and about 35% at 500 kg/h.This result should be taken into consideration when specifying the MOP of a fluid
loop. Unnecessarily high values in fact not only increase the system mass (thethickness of a fluid component depends linearly on the pressure), but can definitelyreduce system performance.
Microgravity disturbances testOne of the worst problems for rotating machinery, and hence for the equipment
used in fluid loops, lies in the disturbance forces induced at structural interfaces. Forthe CPA. the maximum allowable disturbance was 0.01 N in the frequency range0-500 Hz.
An extensive series of tests was performed at DASA-ERNO' to verify thedynamic behaviour of CPA-I (Fig. 10). Those tests included:
complete field mapping at ambient conditionssteady-state runs. i.e. CPA running at a specific speed and delivering a fixed flowratetransient runs, including switch-on/off. abrupt speed changes. or fixed-ratetransitions between two different speeds.
During the steady-state runs, the broadband disturbance level was always below therequirement. The latter was, however. exceeded at specific frequencies directlyrelated to the rotation speed and its higher-order harmonics. Those peaks are due tothe residual imbalance of the rotor assembly and it will be very difficult to eliminatethem since the best possible balancing grade (G 0.4) was used to balance the CPArotor assembly. It is worth mentioning that the problematic peaks (examples inFig. 11) occur at frequencies higher than 100 Hz, which means that active dampingcan be used to reduce the disturbance force to the required levels.The dynamic runs demonstrated that abrupt changes - switching on/off or sudden
changes from a low speed to a high speed - will cause disturbances much higher thanthe specified value (up to I N for a duration of about 2 s). The disturbances arenegligible. however, if the speed rate-of-change can be maintained at levels lowerthan 500 rpm/s. Thus. during gravity-sensitive operating phases, switching the pump
ESA Journal 1994. Vol. 18
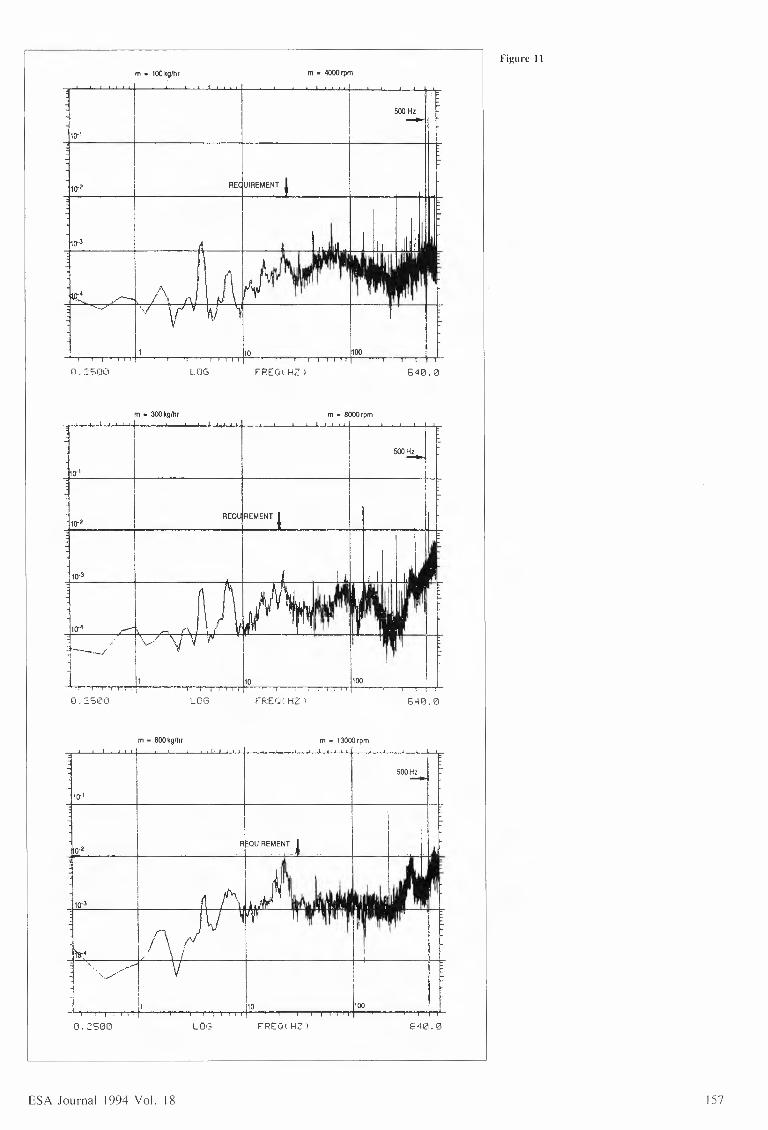
m • 100kg/hr m • 4000rpm
LiJG FREOi: HZ)0. :::c::.oo 540.0
m • 300kglhr
Im • 8000rpm
II
IIlI
I I I, l"~ ~-i1
I
o'
REOlAREMENT
m • 800kglhr m • 13000rpm
II
rrrt1 ~10 r--r r--rr-r-rLOG FRECH HZ.,D. 2500 640.0
ESA Journal 1994 Vol. 18
Figure 11
157
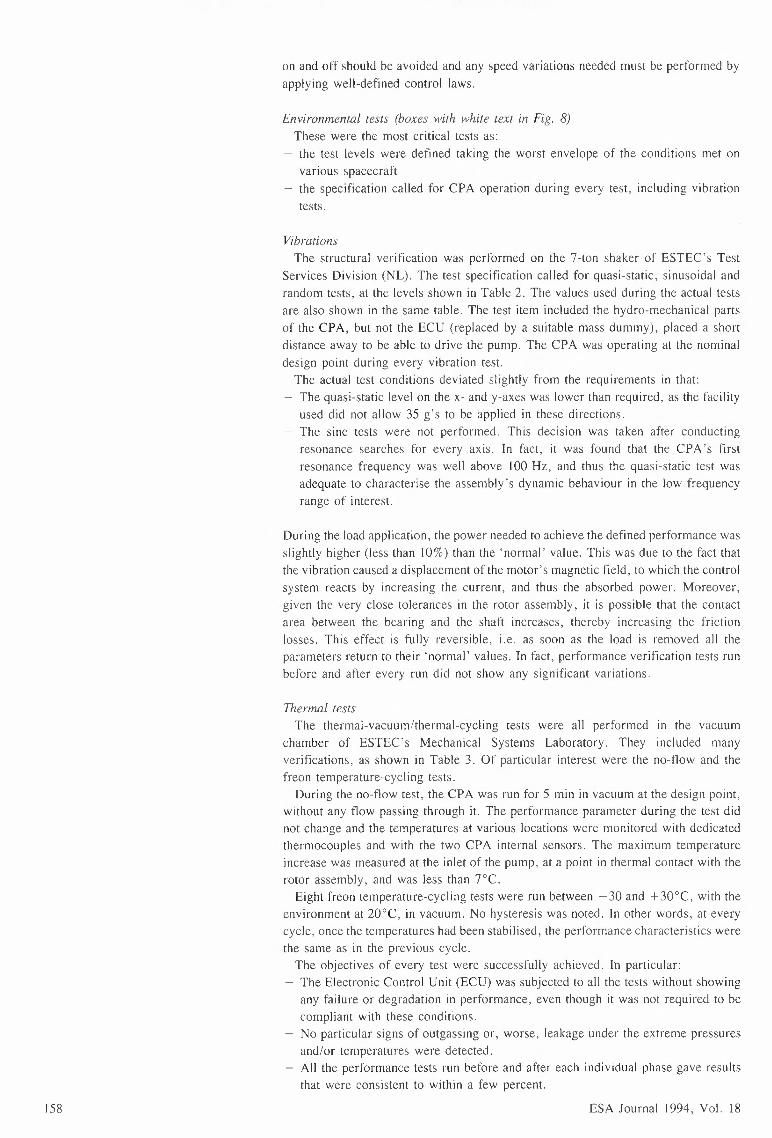
on and off should be avoided and any speed variations needed must be performed byapplying well-defined control laws.
Environmental tests (boxes with white text in Fig. 8)These were the most critical tests as:the test levels were defined taking the worst envelope of the conditions met onvarious spacecraftthe specification called for CPA operation during every test, including vibrationtests.
VibrationsThe structural verification was performed on the 7-ton shaker of ESTEC's Test
Services Division (NL). The test specification called for quasi-static, sinusoidal andrandom tests. at the levels shown in Table 2. The values used during the actual testsare also shown in the same table. The test item included the hydro-mechanical partsof the CPA, but not the ECU (replaced by a suitable mass dummy), placed a shortdistance away to be able to drive the pump. The CPA was operating at the nominaldesign point during every vibration test.The actual test conditions deviated slightly from the requirements in that:The quasi-static level on the x- and y-axes was lower than required, as the facilityused did not allow 35 g's to be applied in these directions.The sine tests were not performed. This decision was taken after conductingresonance searches for every axis. In fact. it was found that the CPA's firstresonance frequency was well above 100 Hz, and thus the quasi-static test wasadequate to characterise the assembly's dynamic behaviour in the low frequencyrange of interest.
During the load application, the power needed to achieve the defined performance wasslightly higher (less than 10%) than the 'normal' value. This was due to the fact thatthe vibration caused a displacement of the motor's magnetic field, to which the controlsystem reacts by increasing the current, and thus the absorbed power. Moreover,given the very close tolerances in the rotor assembly, it is possible that the contactarea between the bearing and the shaft increases, thereby increasing the frictionlosses. This effect is fully reversible, i.e. as soon as the load is removed all theparameters return to their 'normal' values. In fact, performance verification tests runbefore and after every run did not show any significant variations.
Thermal testsThe thermal-vacuum/thermal-cycling tests were all performed in the vacuum
chamber of ESTEC's Mechanical Systems Laboratory. They included manyverifications. as shown in Table 3. Of particular interest were the no-flow and thefreon temperature-cycling tests.During the no-flow test, the CPA was run for 5 min in vacuum at the design point,
without any flow passing through it. The performance parameter during the test didnot change and the temperatures at various locations were monitored with dedicatedthermocouples and with the two CPA internal sensors. The maximum temperatureincrease was measured at the inlet of the pump. at a point in thermal contact with therotor assembly. and was Jess than 7°C.Eight freon temperature-cycling tests were run between -30 and +30°C, with the
environment at 20°C, in vacuum. No hysteresis was noted. In other words, at everycycle, once the temperatures had been stabilised, the performance characteristics werethe same as in the previous cycle.The objectives of every test were successfully achieved. In particular:The Electronic Control Unit (ECU) was subjected to all the tests without showingany failure or degradation in performance, even though it was not required to becompliant with these conditions.No particular signs of outgassing or, worse, leakage under the extreme pressuresand/or temperatures were detected.All the performance tests run before and after each individual phase gave resultsthat were consistent to within a few percent.
158 ESA Journal 1994. Vol. 18
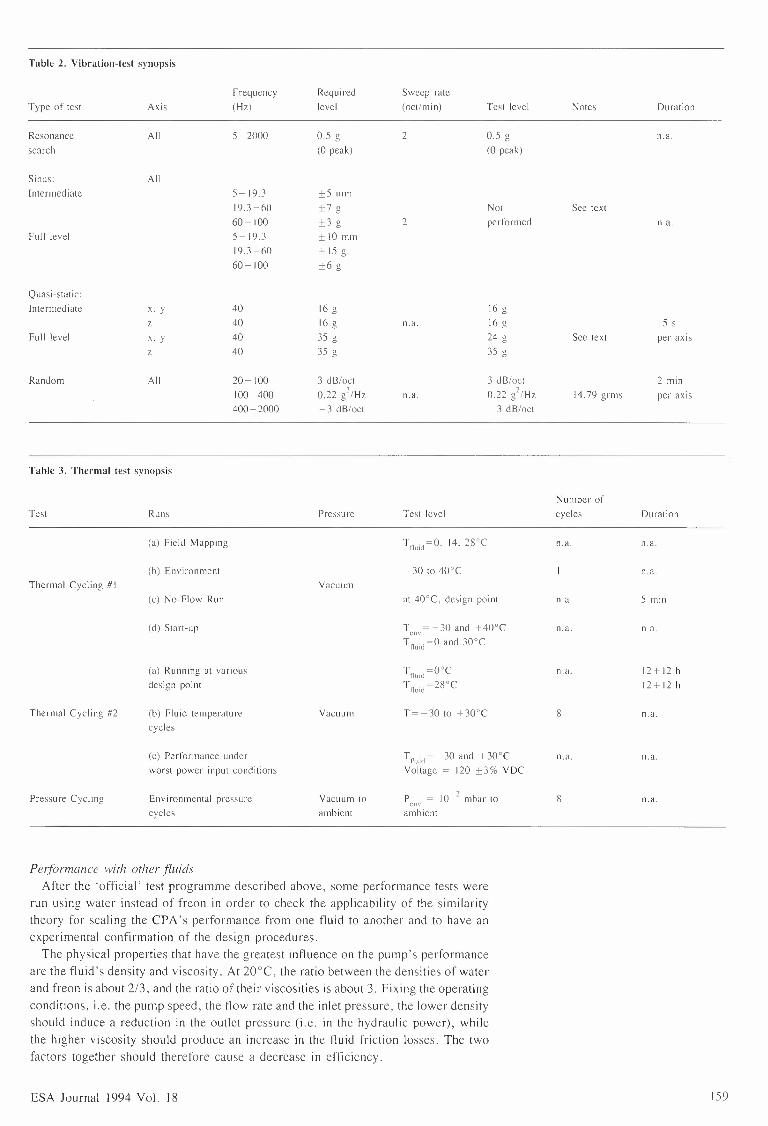
Table 2. Vibration-test synopsis
Frequency Required Sweep rate
Type of test Axis (Hz) level (oct/min) Test level Notes Duration
Resonance All 5-2000 0.5 g 2 0.5 g n.a.search (0-peak) (0-peak)
Sinus: AllIntermediate 5-19.3 ±5 mm
19.3-60 ±7 g Not Sec text60-100 ±3 g 2 performed n.a.
Fnll level 5-19.3 ±10 mm19.3-60 ± 15 g60-100 ±6 g
Quasi-static:Intermediate x , y 40 16 g 16 g
40 16 g n.a. 16 g 15 sFull level x. y 40 35 g 24 g Sec text per axis
40 35 g 35 g
Random All 20-100 3 dB/oct 3 dB/oct 2 min100-400 0.22 /!Hz n.a. 0.22 g2/Hz 14.79 grms per axis400-2000 -3 dB/oct -3 dB/oct
Table 3. Thermal test synopsis
Test Runs Pressure Test levelNumber ofcycles Duration
(a) Field Mapping n.a. n.a.
(b) Environment -30 to 4D°C n.a.
Thermal Cycling #I Vacuum
(c) No-Flow Run at 40°C. design point n.a. 5 min
(d) Start-up T = -30 and +40°CCll\
Tlluid=0 and 3D°C
n.a. n.a.
(a) Running at variousdesign point
Tllu1d=OocTtluid=28oC
n.a. 12+ 12 h12+ 12 h
Thermal Cycling #2 (b) Fluid temperaturecycles
Vacuum T= -30 to +30°C 8 n.a.
(c) Performance underworst power input conditions
T11u1d= -30 and +30°CVoltage = 120 ±3% VDC
n.a. n.a.
Pressure Cycling Environmental pressurecycles
Vacuum to
ambientP = 10 mbur tocuvambient
8 n.a.
Performance with other fluidsAfter the 'official' test programme described above, some performance tests were
run using water instead of freon in order to check the applicability of the similaritytheory for scaling the CPA's performance from one fluid to another and to have anexperimental confirmation of the design procedures.The physical properties that have the greatest influence on the pump's performance
are the fluid's density and viscosity. At 20°C, the ratio between the densities of waterand freon is about 2/3, and the ratio of their viscosities is about 3. Fixing the operatingconditions, i.e. the pump speed. the flow rate and the inlet pressure. the lower densityshould induce a reduction in the outlet pressure (i.e. in the hydraulic power), whilethe higher viscosity should produce an increase in the fluid friction losses. The twofactors together should therefore cause a decrease in efficiency.
ESA Journal 1994 Vol. 18 159
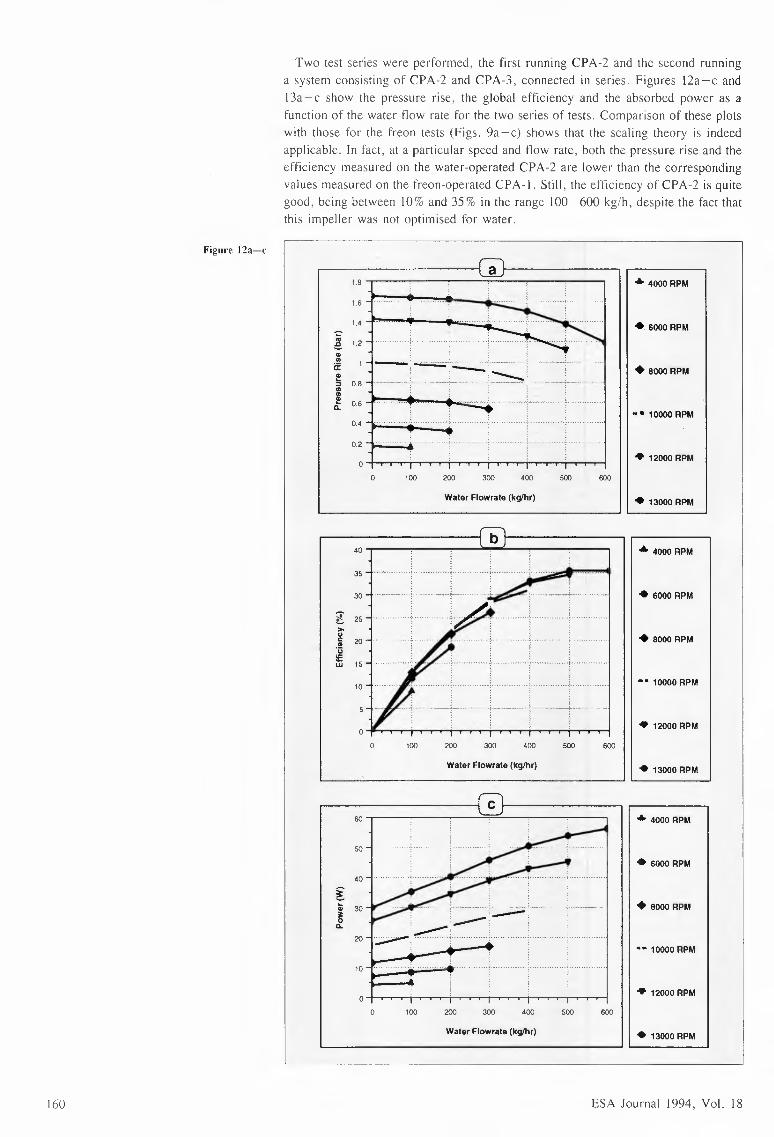
Figure 12a-c
160
Two test series were performed, the first running CPA-2 and the second runninga system consisting of CPA-2 and CPA-3, connected in series. Figures l2a -c and13a-c show the pressure rise, the global efficiency and the absorbed power as afunction of the water flow rate for the two series of tests. Comparison of these plotswith those for the freon tests (Figs. 9a -c) shows that the scaling theory is indeedapplicable. In fact. at a particular speed and flow rate, both the pressure rise and theefficiency measured on the water-operated CPA-2 are lower than the correspondingvalues measured on the freon-operated CPA- I. Still, the efficiency of CPA-2 is quitegood. being between I0% and 35 % in the range I00-600 kg/h, despite the fact thatthis impeller was not optimised for water.
~11 • 4000RPM
1.8
1.6
1.41 . ' ~u ~ I 11 • 6000RPM
! 1.2
•••• I 11 • 8000RPMa: ~ - :----- ---- .........__e::i 0.8••~ 0.6c..1 ..•.. I 1I-· 10000 RPM
0.4
~ I 11 • 12000 RPM01 I I~ I I I I I I I I I I I I I I Ii I I I
0 100 200 300 400 500 600
Water Flowrate (kg/hr) I I • 13000 RPM
::l w •• ~ <OOORPM
30+·······--···;.·· • 6000 RPM
~ 25
g 20..j ) , :. .. 11 +soooRPM••
~::0f··•··+• • w ; ·•• ········~···· • • •• 1 . :::::On11i111i111l111l11'0 100 200 300 400 500 600
Water Flowrate (kg/hr) 11 • 13000 RPM
c ~~~~~~~-,
:i Sl=B"4 .:40
i'';:' L--- .c_~ ••.... ' •..•.... 1 11 • 8000 RPM•• 30-r ··~·
~
•• 10000 RPM
• 12000RPMI I I I I I I I I I
0 100 200 300 400 500
Water Flowrate (kg/hr) I I • 13000 RPM
ESA Journal 1994, Vol. 18

An important lesson learned during this programme was that the critical elementin the design of low-flow-rate (50-1500 kg/h). low-pressure-rise (under 4x IO' Pa)pump units is not the dimensioning of the impeller. which can be done with the usualprocedures. but the choice of configuration for the overall pump assembly. Thus,adapting the actual design to other operating conditions, or to the other fluids normallyused in thermal-control-system loops. will merely require a different dimensioning of
9 12000RPM
0 700
e 13000RPM
A 4000 RPM
• 6000 RPM2.5
!$ii'
*"' 1.5"'~0..
.• 8000 RPM
•••10000 RPM
100 200 300 400 500 600
Water Flowrate (kg/hr)
T. ,r- -~ 0 •~'"30J~--- w--- ~---: N •600oRPM
25~~ I " I II .•8000 RPMa; 20.ii"'
ur ::111...~..'i ••~:. •• ••1 ·::::::0 100 200 300 400 500 600 700
Water Flowrate (kg/hr) I I e t3000 RPM
::1 -i- ~ .:
80
~ ~ ......- ---· I 11 •eoooRPM~ 6000..
........------·' ·····I ·::::::+-•....•-.-.•...•...•.••...•..•...•,.••...•...•...•,.••...•...•...•,...•.•~•...•.•~•...•.•~,...•.•~.'""T"'lj
0 100 200 300 400 500 600 700
Water Flowrate (kg/hr) I I e 13000 RPM
ESA Journal 1994 Vol. 18
Figure 13a-c
161
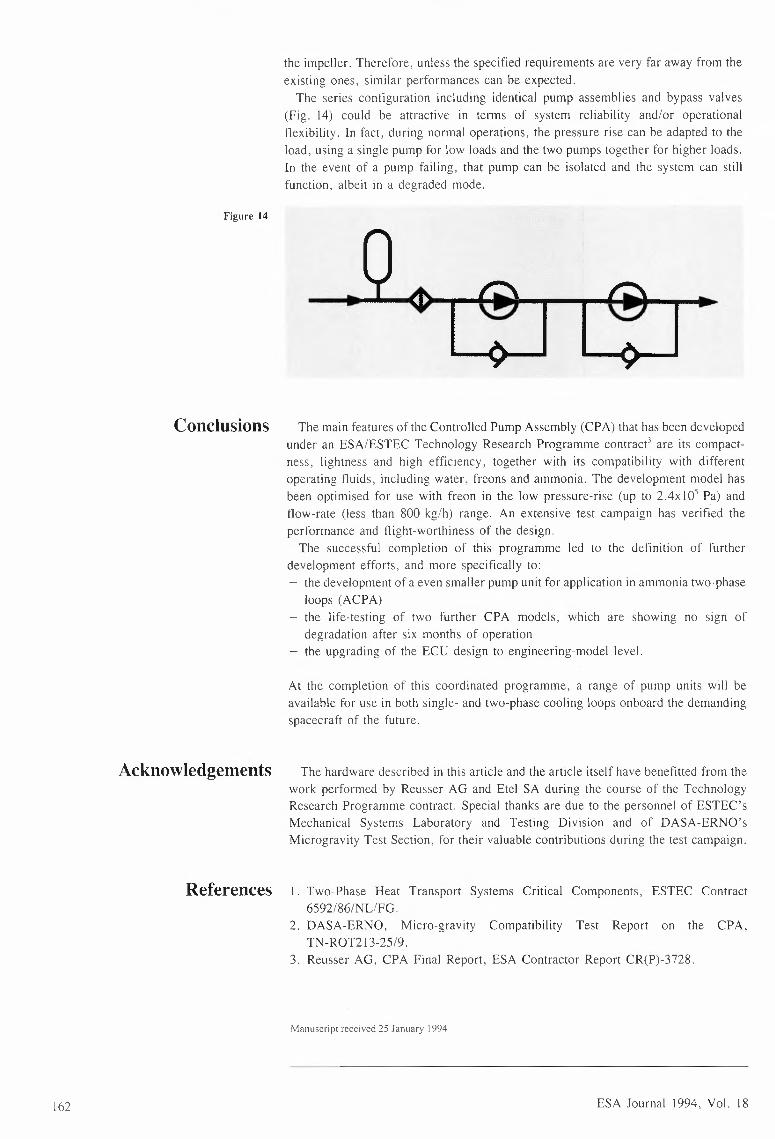
the impeller. Therefore. unless the specified requirements are very far away from theexisting ones. similar performances can be expected.The series configuration including identical pump assemblies and bypass valves
(Fig. 14) could be attractive in terms of system reliability and/or operationalflexibility. In fact. during normal operations, the pressure rise can be adapted to theload, using a single pump for low loads and the two pumps together for higher loads.In the event of a pump failing, that pump can be isolated and the system can stillfunction. albeit in a degraded mode.
Figure 14
Conclusions The main features of the Controlled Pump Assembly (CPA) that has been developedunder an ESA/ESTEC Technology Research Programme contract' are its compactness, lightness and high efficiency, together with its compatibility with differentoperating fluids, including water, freons and ammonia. The development model hasbeen optimised for use with freon in the low pressure-rise (up to 2.4x10⁵ Pa) andflow-rate (less than 800 kg/h) range. An extensive test campaign has verified theperformance and flight-worthiness of the design.The successful completion of this programme led to the definition of further
development efforts. and more specifically to:the development of a even smaller pump unit for application in ammonia two-phaseloops (ACPA)the life-testing of two further CPA models, which are showing no sign ofdegradation after six months of operationthe upgrading of the ECU design to engineering-model level.
At the completion of this coordinated programme, a range of pump units will beavailable for use in both single- and two-phase cooling loops onboard the demandingspacecraft of the future.
Acknowledgements The hardware described in this article and the article itself have benefitted from thework performed by Reusser AG and Etel SA during the course of the TechnologyResearch Programme contract. Special thanks are due to the personnel of ESTEC'sMechanical Systems Laboratory and Testing Division and of DASA-ERNO'sMicrogravity Test Section, for their valuable contributions during the test campaign.
References 1. Two-Phase Heat Transport Systems Critical Components, ESTEC Contract6592/86/NL/FG.
2. DASA-ERNO, Micro-gravity Compatibility Test Report on the CPA,TN-ROT213-25/9.
3. Reusser AG, CPA Final Report, ESA Contractor Report CR(P)-3728.
Manuscript received 25 January 1994
162 ESA Journal 1994. Vol. 18
ESA Publications and Publications by ESA Staff inthe External Literature
The following publications have been recorded by ESAPublications Division since the last issue of the Journal.
Entries are grouped according to Subject Categories: wherea publication could be listed under several categories, onlythe principal category is used.
Where an entry relates to a publication by ESA, the ESAreference of the document is given at item 3 and for thoseESA publications available on sale, item 4 shows either theprice code for a printed copy or 'AV AIL MF' if onlymicrofiche (or photocopy) versions have been made available. Information on the procurement and costs of these
publications can be found inside the back cover of thisJournal. Only complete ESA publications can be supplied(not reprints of individual papers). External publicationscannot be supplied by ESA but in these cases item 3 givessufficient information for retrieval via libraries orbookshops.
The entries presented here are archived for use in theannual ESA Catalogue of Publications (available free fromESA Publications Division). If an author/editor considersthat an entry requires amendment, he should notify ESAPublications Division, quoting the accession number of theentry. i.e. the first five digits in the heading of the entry.
AstronauticsAstronautics (General)
• 940306E CRP 3764 12I EURECA HICROMETEOROTn AND DEBRIS POST FLIGHT INVFSTIGATION
FINAL REPORT CAPRIL 199<'1)Utl!SPACE, UK (COllTR 110. 10335/93/NL/JGJESA CRCPJ 3764 // 15 PP
4 AVAIL MF AND HARD COPY CESA PRICE CODE EOJ
Astrodynamics 13* 940063E CRP 3742 13I STUDY OF POINCARE MAPS FOR ORBITS NEAR LAGRANGIAll POINTS FINAL
REPORT <NOVEMBER 1993 J2 FUNDACIO BOSCH I GIMPERA, SPAIN CCONTR NO 9711/91/D/IMCSCJl3 ESA CRCPJ-3742 // 276 PP4 AVAILABLE MF s HARD COPY CESA PRTCE CODE E3J
* 940319E E B 0078 13I ESA'S PRECISE ORBIT DETERMINATION FACILITY CHAY 1994)2 DOW J.M. ET AL3 ESA BULLETIN NO. 78 I I PP 40-<'+94 SEE ESA BULLETIN NO 78, INDEXED UNDER 99
Ground Support Systems and Facilities (Space)
* 940069E CRP 374r, 141 IGS-TB MANl\GEMENT FJ\CILJTV FIN/\L REPORT AND EXECUTIVE SUMMARY
(JANUARY 1994)ALCATEL, rRANCE CCOtlTR NO 10038/92/D/DK JESA CRCPJ-3744 // 38 PP AND II PP
4 AVAIL MF 8 HARD COPY CESA PRICE CODE ED, EOJ
Launch Vehicles and Space Vehicles
• 940071E CRP 3747 15I STAMP - STUDY ON TECtHIOLOGY OF AEROBRAKING FOR MARS PENETRATORS
FINAL REPORT AND EXECUTIVE SUMMARY <SEPTEMBER 1993)2 DASSAULT AVIATION, FRANCE CCONTR NO 9519/91/llL/FGCSCJJ3 ESA CRCPJ-3747 // 59 PP AND 8 PP4 AVAIL MF 8 HARD COPY CESA PRICE CODE El, EOJ
ESA Journal 1994. Vol. 18
• 940300E CRP 3757 15
12
I STUDY ON THERMAL PROTffTiotl FOR ADVANCED LAIJNCHFRS<DECFMBER 1993)
2 DEUTSCHE AEROSPACE, GERMANY CCONTR NO 9650/91/NL/FGJ
FINAL REPORT
3 ESA CRCPJ-3757 // 91 PP4 AVAIL MF AND HARD COPY ( ESA PRICE CODE El J
• 940308E CRP 3767 15I A PRELIMINARY FEASIBIUTV STUDY OF THE SPACFCAB LOW-COST SPACE
PLAllE AllD OF THE SPACFCAB DEMONSTRATOR FltlAl REPORT <APRIL 1994)2 BSL, U.K CCotlTR NO !Of.Jl/93/F/TBJ
ES.I\ CRCP) 3767 II 4<'t PPAVAIL MF AND HARD COPY CESA PRICE CODE EOl
* 940318E E B 0078 15I SATELLITE SERVICING IN GEO BY A ROBOTIC SERVICE VEHICLE CHAY 1994J2 DE PEUTER W ET Al.3 ESA BULLETIN uo . 78 II PP 33-39
SEE ESA BULLETIN NO. 78, INDEXED UNDER 99
Spacecraft Communications, Command and Tracking 17
* 9f+0062E CRP 3743 17I SOFTWARE TOOL FOR INTERPLANETARY NAVIGATiotl - FINAL REPORT
<DECEMBER 1993 l2 GMV, SPA!tl CCONTR NO. 9715/91/D/!Ml3 ESA CRCPJ 3743 II II'• PP4 AVAILABLE MF s HARD COPY CESA PRICE CODE E2l
144 9r,006SE CRP :)7'10 171 DRAG-rREE Sf\TFI I JTE CotHROI STlJDY rTtlfll RFPORT /\ND FXFCUTIVE
SUMM/\RY CDECEHAFR 1993)
MATRA MARCOtll srACE, FRAtlCF CCOIHR uo 9SS8/9l/tlt/JGCSCJlESfl CR(Pl-37~n // 89 pp AND 12 rr
4 AVAILABLE MF "HARD COPY (FSA PRICE r nnr Fl' FOl
* 940067E CRP 3738 17I AIJ!OllOMOUS Al/O AOVAllCrD llAVIGATIOtl TECHtl!QIJES FINAi. REPORT AtlD
EXECUTIVE SIJMt1APY (APRii 1993)
152 Ml\TR/I. Mll.RCOlll SP/\CF, FRMICE (COfHR no RAOA/90/tll/PMfSC))3 ESA CRCP)-373A // 367 PP l\NO 67 PP4 AVAILABLE MF ~ 11/\RD COPY CFSf\ PRICE CODF E3, Fl)
* 9r,0~98F CRP :>;755 17I AUTOtlDMOUS AllD ADVANCED tlAVIGATIOtl TFCHNIQIJES · "PROBF CONCEPT
AtlALYSIS" - FltlAI REPOR! AllD EXFCUTIVE SUMMARY COCTOBER 1993)Z HMS, FRMlCE CCotlfR NO 8808/90/tlL/PMCSC)J3 FSA CRCPJ-375S // S8 PP AND 16 PPr, AV/\IL MF Atm HAPO COPY CESA PRICE CODF El, EO)
163
* 9<o0320E E B 0078 17us run ADVANCED GRAPllIC MMI TECIUHQllES FOR TELEMETRY MOll!TORING(M/\V l 99ft)DI GIROLAMO G. R PECCIA N.ESA BUI.I ETIN 110. 78 II pp 51-59SFF FSA BULLET!ll 110. 78, INDEXFn 1rnDFR 99
* 9ft0331E X J 1801 17CCSDS PROTOCOL FOR ADVANCED ORBITING SYSTEMS, llETWORK AND DATA LINKS,At/Al.YSIS OF ASYllCHRONOUS TRAFFIC SERVICES CMARCll 199'tlVAi/Gill V.ESA JOURNAi. VOi. 18, 110. I II PP 73-86
<, SEF ESA JOURNAL, ItlDEXED UNDER 99THF CONSULTATIVE COMMITTEE FOR SPACE DATA SYSTEMS CCCSDSJ llASRFCEt/TLY DEVEIOPFD A NUMBER or STANDARDS FOR DATA lfAllDLING ANDTRAt/SMISS!Otl TO RE APPLIED It/ FORTllCOMlllG GENERATIONS OF SPACE DATAllETWDRKS. It/ TlllS COtlTEXT' TlfE ccsns llAS WORKED TOWARD TllE DEF It/IT JONor A DIGITAL SATFLLITE NETWORK OFFERlllG A WIDE VARIETY OF SERVICES.THIS PAPER ANAl.YSES THE PERFORMANCE OF TllE ASYNCHRONOUS SERVICESACROSS TlfE SPACE LINK SUBNETWORK. A MODFI. FOR TllE ASYNCllRONOUS TRAFFICJS DEVELOPED, GEl/ERATlt/G TllE SOLUTIOll FOR PACKET AVERAGE DELAY,FRAME-OCCUPAllCY OISTRIBUT!Otl AtlO FRAMF-1.0SS PROBABILITY AT THETRAl/SMITTER STTF THE RESULTS ARE ALSO USEFUL It/ PROV!Dlt/G At/ UPPERAt/O LOWER BOUllO TO TllE SYSTEM PERFORMANCE ATTAltlABLE UNDER A VARIETYor TRArf!C COJlrTGURAT!OtlS. MOREOVER, A SETTlttG or IMPLEMEllTATIONDEPENDANT PARAMETERS, SUCll AS FRAME COMPl.ETION TIMEOUT PERIOD ANDFRAME SIZE, JS DISCUSSED JN TERMS OF ITS lt/FLUENCE ON SYSTEMPERFORMANCES.
Spacecraft Design, Testing and Performance
w 9ft0048E STH 2f18 18THE EXOSAT OPFRATJONAL EXPERIENCE CJUNF 1993)PARKES A.G ET Al.. KALDEICH B. CED.)ES/\ STM-2ft8 // AA PAGESESA PRICE CODE, ElEXOSA T, A 'FIRS I ' FOR ESA IN MANY WAYS, WAS LAUNCHED ON 26 MAY 1983ANO RE-ENTERrD TlfE EARTH'S ATMOSPHERE 011 6TH MAY 1986, EXCEEDING ITSPl ANNEO LIFETIME OF TWO YEARS. THIS RFPORT REVIEWS CRITICALLY THEFXOSM SYSTEM AllD lllGllLIGHTS I/OT Otll Y TllE SUCCESS OF TllE MISSION, BUTALSO TllOSE AREAS WllICH GAVE RISE TO OPERATIONAL PROBLEMS, AND THEl.ESSONS TO BE LEARNED.
* 9<o0053E CRP 3730 18DESIGN RULES FOR RADIATION TOLERANCE - FINAL REPORT (JULY 1993)MAIRA MARCONI, TRANCE CCONTR NO. 9291190)ESA CRCPJ-3730 II 163 PP
<, AVAILABLE Mf R HARD COPY CESA PRICE CODE E2J
* 9"0072E CRX 3748 18STUDY OF EXPERT TOOLS FOR FLIGHT OPERATIONS PLANS, FDPSETFINAL REPORT COECEMBER 1993!VEGA SPACE SYSTEMS, UK CCONTR NO. 953,,/9llD/IMJESA CRCXJ-37'oR II "O PP
4 AVAIL Hf 8 ftf\RD corv <ESA PRICE CODf FO)
* 9't030ftE CRP 3762MATINGIDEMAT ING MECHANISM STUDY
18EXECUTIVE SUMMARY CNOVEMBER 1993)
SEtlFR, SPAJtl CCOllTR NO. 101551921NL/JGCSC))ESA CRCPJ-3762 II 74 PP
r, AVAIL MF ANn llARO COPY CESA PRICE COOF El J
• 9't0312E CRP 3766AnAPTIVE COtlTROI r ns AOCSIGNC
18fltlAI. REPORT AllO EXECUTIVE SUMMARY
CJANUARY 19914 l2 BAF, U.K. <Cot/JR NO. 9936197/t/LIFMCSClJ
ESA CR(PJ-3766 II 628 PP ANO 103 PPAVAii MF ANO llARO COPY CESA PRICE COOF f'0, E2J
Spacecraft Instrumentation
• 9'10295E CRX 3757. 19DEVEi OPMENT OF llW ANO SW FOR A RAD HARO MICROCOMPUTERCOCTOBFR 1992 lLAREN, ITALY CCONTR NO. 80441BBINLISFJESA CRCXJ-3752 II 55 PP
4 AVAIL MF AND HARD COPY CESA PRICE CODE El)
FINAL REPORT
* 940310E CRP 3751 19FTOBC CARD CRATE - Flt/AL REPORT (JANUARY 1993)SAAR ERICSSON SPACE, SWEDEN CCONTR NO. 71501871NLIPPJESA CRCPJ-3751 II 78 PPAVAIL MF ANO llARO COPY CESA PR!CF CODE Fl J
Spacecraft Propulsion and Power
• 9'10051E CRP 3728CPA - CONTROLLED PUMP ASSEMBLY
20FINAL REPORT (JULY 1993)
REUSSER, GERMANY (CONTR NO 90391901111/FGJESA CRCPJ-3728 II 77 PP
4 AVAJIABLE MF R llARO COPY CESA PRICE CODE Fl J
164
* 940326E E J I BO! 20SPACE POWER ELECTROllJCS - DESIGN DRIVERS <MARCii 1994)O'SULLIVAN D.ESA JOURNAL VOL. 18, NO. l 11 PP 1-23SEE ESA JOURNAL, INDEXED UNDER 99THIS PAPER ADDRESSES THE WIDE RANGING CONSTRAINTS AND REQUIREMENTSTHAT ARE PART OF THE OVERALL DESIGN CRITERIA FOR THE OPTIMAL DESIGNOF SPACECRAFT POWER SYSTEMS AND EQUIPMENT. TOPICS COVERED INCLUDEOPERATIONAL RELIABILITY, MODULARITY, SPACE ENVIRONMENT, PAYLOAD ANDORBIT REQUJREMEllTS, SYSTEM AND EQUIPMENT TOPOLOGIES AND SPECIAL DESIGNTECHNIQUES EMPLOYED IN SPACECRAFT POWER-SYSTEM DESIGNS. IN ORDER TOUNDERSTAND THE KEY DIFFERENCES BETWEEN SPACE AND INDUSTRIAL POWERELECTRONICS, IT IS ESSEllTIAL THAT THOSE FEATURES THAT ARE UNIQUE TOTHE SPACE ENVIRONMENT BE CLEARLY IDENTIFIED. IN THE FIRST PART OFTHIS PAPER THOSE KEV DRIVERS THAT AFFECT THE CHOICE OF DESIGNAPPROACH ARE DESCRIBED AND THE REMAINDER OF THE PAPER ILLUSTRATESHOW THESE DRIVERS AFFECT THE CHOICE OF REGULATOR TOPOLOGIES AND THEOVERALL APPROACH TO POWER-SYSTEM DESIGN.
Material Sciences (General) 21
18
* 94032/E X J 1ROI 21BACTERIORHOOOPS!ll CRYSTAL GROWTll UNDER MICROGRAVITY - RESULTS OFIML-1 AND SPACEllAR-1 EXPER!MEllTS CMARCH 1994)WAGllER G.ESA JOURNAL VOL I B, NO. l 11 PP 25-32SEE ESA JOURNAL, INDEXED UNDER 99TllE REsULTS or TWO CRYSTAL-GROWTH EXPERIMENTS IN MICROGRAVITY WITHTllE MEMRRAllE PROTE!tl BACTERJORlfODOPSJt/ ARE REPORTED, NAMELY THE!Ml -I EXPERJMFllT It/ THE ADVANCED CRYOSTAT WHICll RESULTED IN ASIGNJFJCAtll IMPROVEMEt/T IN TllE COMPACT CRYSTAi. MORPHOLOGY OF THEllEEDLES, At/O TllF SPACElfAR-1 EXPERIMENT Ill TllE AOVAllCED PROTEINCRYSTAl.LIS/\TIOU FACILITY WHICH F.:XTENOF.O HIE IHL-l RESULTSWITll IMPROVED t10RPllOLOGY OF TllE TRICL JNJC llEEDLES. TllE EtlllANCEDD!TFRACTIOllAL POWER or TllESE RACIERIORllOOOPSJtl CRYSTALS GROWN INMJrROGRAVITY llAS EXTEt/OED TllE llITllERTO R AllGSTROM RESOLUTIONLIMIT BY 2 ANGSTROM.
Chemistry and Materials
Nonmetallic Materials 27
• 9'10296E CRX 37S3 27Flt/AL REPORT nu TllE RADIATION llARDFN!llG STIJDY OF DISPLACEMENTDAMAGE It/ Sil Jent/ - FINAL REPORT AND FXFCIJTJVE SUMMARY CFEBRUARY 1994)!MFC, BELGillM (CONTR t/O. 8615190/tlLIPIHSClJESA CR(X)-3753 II 120 pp AND II ppAVAIL MF At/O llARn COPY CESA PRICE cons EZ, EOJ
Propellants and Fuels 28
19
• 9'10329E X J l ROI 28LIQUID GAUGJtlG Ill SPACE, THE G-22 EXPERIMENT CMARCH 1994)MONTI R. g BERRY W.ESA JOURNAL VOL 18, NO I II PP 51-61SEE ESA JOURflAL, INDEXED UNDER 99AS THE LIFE or A SATELLITE IS TERMINATED WHEN ITS otlBOARD PROPELLANTSARE DEPLETED, ACCURATE KNOWLEDGE OF TllOSE REMAJt/JNG PROPELLANTSTHROUGllOUT A MISSION IS ESSENTIAL. WHEREAS THE MEASUREMENT OFPROPELLANT COllTENTS ("LIQUID GAUGING') rs A TRIVIAL MATTER ON THEGROUND, IT IS A MOST 0 I FF ICULT TASK It/ SPACE BECAUSE OF TllEMICROGRAVITY coum t r ous THAT PREVAIL MOTIVATED RY THE NEED TO DEVELOPAN ACCURATE MFTllOD OF LIQUID GAUGING IN SPACE, FSA SPOtJSORED TiffDEVELOPMEl/T AT TFCHl/OSYSTEM (ITALY) or TWO TllFRMODYNAMTC METllOOS OFLIQUID GAUGING: TllE PERTOOTC VOLUME STTMlJUJS m:TJIQ[l crVSH) .l\ND THEFOREJGtl MASS If/.IFCTJON METllOD CFMIM). TllFSE MFTllODS WERESUBSEQUENTLY TESTED !ti SPACE AS THE G 22 GET-AWAY-SPECIAL (GAS)EXPERIMENT ABOARD SlfUTTLE FLIGHT STS-57 IN JUllE 1993 TllE SPACE TESTWAS COMPLETELY SllCCESSFIJL AND SHOWED GOOD CORRELATION WITH THE RESULTSor GROUllO EXPFRIMEllTS. TllE PVSM PROVED TO RE A PRECISE METllOD WITll GOODREPE~TARILITY; TllE FJLl.-TACTnR ERROR COlrTERFllCE BETWEEN ACTUAL ANOMFASURED COllTFIHSJ WAS LESS TllAll 0 6"'· TllF FMTM PROVED TO BE LESSACCURATE, OlJF TO TEMPERATURE EFFECTS MIO PRFSStJRE-TRAt/SDUCERINACCllRACJES. Jt1PROVEMEllTS TO Tiff FMIM llAVE Sit/CE BEEN EVALUATEDTllEDRETICAL LY
Materials Processing 29
* 94005BE CRP 3 735 29
20
AUTOMATED HIGll TEMPERATURE MATERIALS PROCESSING LABORATORY CHTMPLJFOR COLUMBUS - FINAL REPORT (MARCH 1994>DORNIER GMBH, GERMANY (CONTR NO. 99501921NLIJSCJESA CRCP)-3735 II 15 PPAVAILABLE MF R HARD COPY CESA PRICE CODE EOJ
* 9'•030!E CRP 3758INTEGRATED PAYLOAD AUTOMATION(FEBRUARY 1993)TECNOSPAZ!O, SPAIN CCONTR NO. 9829192/NLIJCCSC))ESA CRCPJ-3758 II 58 PP
4 AVAIL MF ANO HARO COPY CESA PRICE CODE El J
29IPA - EXECUTIVE SUMMARY
ESA Journal 1994 Vol. 18

* 94030ZE CRP 3759ItHEGRATED PAYLOAD AUTOMATION
29IPA - FINAL REPORT CSEPTEMBER 1993)
DORNIER, GERMAtlY CCONTR NO. 9830/92/NL/JGCSCllESA CRCPl-3759 // 50 PPAVAIL MF AND llAPO COPY CESA PRICE CODE EOl
Engineering
Communications
* 940297E CRP ~7Sti 32KU- BAtlD DUAL rot AR I SED ARRAY ELEMENTCDC TOBER 1992 lERSA TECHNOLOGY, U.K CCONTR NO. 8715/90/NL/GMCSCl)ESA CRCPl-375'• II 24 PPAVAIL MF AND llARO COPY CESA PRICE CODE EO)
EXECUTIVE SUMMARY
• 940309E CRP 3768 32STATUS OF EUROPEAN R&D PROGRAMMES IN SATELLITE COMMUNICATIONSEARTH SEGMENT FINAL REPORT COECEMBER 19931EUROCONSUL T' FRAtlCE ( cours NO. 9952/92)ESA CRCPl-3768 II 219 PPAVAIL MF AND HARD COPY CESA PRICE CODE E3l
Electronics and Electrical Engineering
* 9ft0054E CRP 3731 33ADVANCED CONVFRTER TOPOLOGY ASSESSMENTSUMMARY CDECEMBFR 1993 l
z DEUTSCHE AEROSPACF, GERMANY ccotnR NO. 9513/91/NL/USCSCll3 ESA CRCP)-3731 II 114 PP AND 10 PP4 AVAILABLE MF 8 HARO COPY CESA PRICE CODE E2, EOl
FINAL REPORT AND EXCUTIVE
* 940056E CRP 3733 33HYBRID CONNECTOR FINAL REPORT COCTOBER 19931FRAMATOME CONNECTORS, FRANCE CCONTR NO. 9838/92/NL/PPlESA CRCPl-3733 II AZ PPAVAILABLE MF 8 llARD COPY CESA PRICE CODE Ell
• 940057E CRP 373'tARC - TRACKING TEST OF WIRES
33FINAL REPORT CJAtlUARV l 99'd
DEUTSCllE AEROSPACE, GERMANY (CON TR NO 9891 /92 lES/\ CR(P)-373f1 II Ilf.1 rrAVAILABLE MF 8 llARO COPY CESA PRICE CODE E2l
• 940073E 33CRP 3 749TEST STRUCTURES roR ASIC TECHNOLOGY ASSESSMENT - FINAL REPORTCOCTOBER 19931CSEM, SWITZERLAND CCONTR NO. 9207/90/tlL/PBCSCll
3 ES/\ CRCP)-37f+9 II 45 PP4 AVAIL MF & llARO COPY CESA PRICE CODE EOl
* 9'10074E CRP 3750 33I APPLICATION OE tlOUVELLES TECHNOLOGIES D'ELECTROOES POUR DES
ACCUMULATEURS NICKEL CADMIUM A HAUTE ENERGIE MASSIQUE TRAVAUXHEM PHASE Z FINAL REPORT CDECEMBER 19931CNES, FRANCE CCOtlTR NO. 9601/91/NL/USCSCll
3 ESA CRCP)-3750 // 25 PP4 AVAIL MF & llARD COPY CESA PRICE CODE EOl
* 940307E CRX 3765 33DEVELOPMENT or A lllGH FREQUENCY DC/DC AUXILIARY CONVERTER - FINALREPORT AND EXECUTIVE SUMMARY CMAV 1994)UN IVERS! TV OF SURREY, U. K CCON TR NO. 8560/89/NL/ JG)ESA CRCXl-3765 II 199 PP AtlD 8 PP
4 AVAIL MF ANO HARO COPY CESA PRICE CODE E2, EOl
Fluid Mechanics and Heat Transfer
* 91f0061E CRP ~7f11l 34TflERHAI COtlTROL JN EXTRATERRESTRIAL rt.AtlETARV EtNIROtlHENTREPORT <OECFHBFR I 993 lDORtHER, GERHAtlV CCOtlTR NO 9512/91/tH/FGl
3 ES!\ CRCP)-37ft6 // f158 PPf1 AV/\ILABLE MF R n/\RD COPY CESA PRICE CODE Eril
FINAL
Mechanical Engineering
lf 940047E BR 9? 37ESTI. KEEPING SP/\CE MOVINGROWtlTREE R., AtlORFWS J., LONGDON N.
3 ES/\ BR-92 // l(, rr
TllE BROCHURE DESCRIBES THE TYPE OF WORK OOtlE AT THF FUROPEAN SPACETRIBOLOGY ll\BORflTORY, 1\110 THE DIFFERF.HT F/\CILITIFS /\VJ\Jt!\BIF TO SPACEAND NON-SPACE IllOUSTRY
* 9r,n293E PSS 03 203 37STRUCTURAL M/\TIPI/\LS 111\NDBOOK CFEBR\JARY 199f+)
VOL 1, POLVt1FPCOHPOSJTFSVOL Z NEW flDVMlCED Mf\TERl/\LS
STRUCTURAL MIO t1FCllANISHS OEVIS!Otl, FSTFCES!\ PSS-03-203 // 514 rr AND ~92 pp
r, ESli PRICE CODF: Fr,, E4Tiff STRUCTURAi t1AIFRIALS tlMIDBOOK srnVES TO COHB!tlf Tiff ESTABLISHED
ESA Journal 1994 Vol. 18
32
33MATERIALS AtlO OES!Gtl INFORMATION Otl TllE CARBON, GLASS MIO ARAHJOFIBRE-REINEORCF!l POLYMER COMPOSITES llAVltlG EITllER CA> THERMOSETTINGRES!tl MATRICES OP \Bl TllFRHOPtASJIC MATRICES WITH PROVISJotlAIItffORHATIOtl 011 tllF EHFRGTUG GROUPS or NEW AOVMICED HATFRIALS ANDTllFIR COHPOSITFS SIGNIFICANT FFrORT llAS BEEtl EXPEtlDFO ON TllEDEVELOPMENT OF HATFRIALS WTTll, OR SEEKJtlG, HIGll-STREllGTH, lllGllSTIFFtlESS AND/OR OIHESIONAL STABILITY FOR APPLICATIONS !ti EUROPEANSPACE PROJECTS tlEW ADVANCED MATERIALS ALSO OFFER HIGllER TEMPERATURECAPABILITIES Tl1F USE OF SUCll MATERIALS AIMS TO CAPITALISE ON TflfJRMASS-SAVING PROPFRTIES OR TllEIR IMPROVED PERFORMANCE WITll RESPECT TOMORE CONVENTIONAi Ml\TERl!\LS THIS Hf\NOBOOK REPRFSENTS /\N EXPMWEDVERSION OF ESA r s s-uv-r iu r . WHJCH IT surERSEOES
Quality Assurance and Reliability 38
* 9t+00'+9E PSS n1 7"16 38GEtlFRAL REQU1Rrt1rt11s roR TltRFAOFO rASTEtlFRS (.JUtlE 1993)PRODUCT ASSURAIJCF R. SArFTY OEPARTHFNT, FSTFC
3 ES/\ PSS Ol-7f16 ISSUE I //VIII + 97 rr4 ESli PRICE COOF F?5 THIS DOCUMEtlT sr r s rnRTH THE FSSEtHJfll RF.QUIRF.MEtlTS Tllfll MUST RF. MET
IN THE MAtlUrliCJllPF /\NO CotlTROL or fASlFNFRS IHTFNDED roR USE JN 111FFABRICATIOtl or FSA srACF SYSTEMS
* 9t1006'1E CRP _)7r,1 3AQUALITY ASSl\RAIHT t FVEI 3 STAtlOAROS CJtlAL RFrORT IDECEMRFR 1993)DEUTSCHE /\EROSP/H":F , GERH/\NY <CONT R NO 9696 /91 /tll /l. C< SC))ESA CR(P)-37''1 II 862 PrAVAILABLE HF \FSA rRICE CODE F'd
* 9'10fl66E CRP 37.)9 38IHPLEHEtHATIOtl or SA CArABILITV !ti EUROPE - FINAL REPORT AtlOEXECUTIVE SUMMARY CNOVEHBER 1993 ll\EROSP/\TIALE, FRAtlCF <COtHR NO 9fdtl/9l/NL/LC>
3 ESA CRIPl-3739 II 85 PP AllD 12 PPtl l\Vtdl/\BLE Mr R. llflRD COPY <FSA PRICE CODE El, EO>
34
* 940Z9t~E PSS 01 70 38MATERIAL, HFCHAtlICAL PART AND PROCESS SELECTION ANO QUALITY CONTROLFOR ESA SPACE SYSTEMS AND ASSOCIATED EQUIPMENT (JANUARY 1994)
2 PRODUCT ASSURMlrF g SAfFTY DEPARTMENT, ESTEC3 ESA PSS-01-70 ISSUE 4 //VI t 27 PP
ESA PRICE CODE FOT\IIS SPECIFICATJON FSTAB\.ISHES TllE REQUIREMENTS FOR A MATERIAL,MECHANIC/\L-P/\RT MIO PROCESS SELECTIOtl AND CONTROL PROGRAMME FORSPACE SYSTEMS Atln ASSOCIATED EQUIPMENT IN WHICtl TllE USE OF CONTROLLEDMATERIALS, Ml:T!ll\fllCl\l PARTS AND PROCFSSFS IS Ml\ND/\TORY
'If 9r,03osE CRP :')763 38EVALUATION MIO TtlTFGRATION OF ISO 9001 Jtl ESA PSS SYSTEMFINAL REPORT IOFCEHBER 1993 lBUREAU VERITAS, rRANCE CPO 123689lESA CRCPl-376'1 II 191 Pr
4 AVAIL HF ANO llARO COPY IESA PRICE CODE EZl
37Geosciences
Earth Resources 43
* 9r,oos2E CRP 3779 t,3s JUDY Oil ADV Atlcr 0 s I GNAI RFCONS TRUCTI ON TECHNIQUE s<APRIL 1993JCSL, BELGIUM CCONTR NO. 92'•9/90/tll/SFCSCll
3 ESI\ CRCP) 3729 // 50 rr4 AVAILABLE HF 8 llARO COPY CESA PRICE CODE EOl
r I ti AL REPORT
* 9f10060E CRP 3737 td1 ST\JDY OF HIE GFOPllVSJCAL IMPACT OF HIGH RESOLUTION EARTH POTENTIAL
FIELDS INFORHATlotl FINAL REPORT (FEBRUARY 199'•)UNIV. OF CAL!rDRtlIA, USA er 0 112540(1991))
3 ESA CRCPl-3737 II 282 PP4 AVAILABLE MF IESA PRICE CODE E3l
16.'i
* 940075E SP 361 43SECOND ERS-1 SYMPOSIUM, SPACE AT THE SERVICE OF OUR ENVIRONMENT(JAtWARY 1994)KALOEICH B.H CEO )ESA SP-361 II 1360 PAGES <2 VOLS.)PRICE OFL 200 00Tiff TWO VOLUMFS rntHAJN THE PROCEEDINGS OF TllE 'SECOND ERS-1SYMPOSIUM, SPACE AT THE SERVICE OF OCJRENVIRONMENT, HELD IN HAMBURG,GERMANY, 11-1'• OCTOBER 1993.THE SYMPOSIUM WAS ORGANISED Itl 24 SESSIOllS DEVOTED TO, ERS-1 DATAASSIMILATION rur o SEA STATE MODELS; AGRICULTURE; GLACIOLOGY;ERS-1 DATA ASSJtlTLATION INTO ATMOSPHERIC CIRCULATION MODELS; WAVEIMAG!tlG; SEA !CF; LARGE SCALE LAtW SURFACE STUDIES; APPLICATIONS OFSAR IMAGERY AT SFA; FOREST MONITORING; OCEAN CIRCULATION; LAND USE,MAPPING AND TOrnGRAPHY; ICE OPERATIONAL APPLICATIONS; INTERFEROMETRY,METIJODOLOGY AtlD TOOLS; ORBIT OETERM!tlATION ANO GEOPHYSICAL MODELS;ATMOSHERIC PARAMETERS AND PROCESSES AS SEEN FROM ERS-1; SOILMOISTURE; GEOLOGY; SHALLOW WATER AND COASTAL ZONE PROCESSES; SNOW;WltlO FIELD RETRIEVAL; MARINE GEOIO AND GEODYNAMICS; WATER SURFACETEMPERATURE; WIND FIELD APPLICATIONS STUDIES; HYDROLOGY, RIVERS ANDLAKES
* 940076E X SP 361 431 APPLICATION OF ERS-1 SAR DATA IN WAVE MODELS - AN OVERVIEW
(JANUARY 1994)HASSELMANN K.ESA SP-361 II P 15 VOL.
5 PAPER IN PROC OF THE 'SECOND ERS-1 SYMPOSIUM, SPACE AT THE SERVICEOF OUR ENVIRONMENT', PROCEEDINGS OF A SYMPOSIUM HELD IN HAMBURG,GERMANY, 11-14 OCTOBER 1993 (INDEXED UNDER 43)
3611 OPFRAT!ONAL lJSF nr ERS-1 OBSERVATIONS IN OCEAN WAVE FORECASTING AT
Er:Mwr ( ,Jf\tWflRY 1 '](Vi)GlJJILAlJMF A & llMISSEll B
3 FSA SP-361 II P 17 VOL
PAPFR !ti PROC or Tiff 'SECotlO FRS-1 SYMPOSIUM, SPACE AT THE SERVICEor OUR EllVIROtltfftCT'' PROCEEO!llGS or A SYMPOSIUM llELD Ill HAMBURG,GFRMMlY, ll-1'1 orrnBER 199~ (lUOFXED tJtlnFR 43)
* 9f100 7AE X SP ~f.J r,3TOWARDS A GFNFPALl7EO OPTIMAL INTERPOLATION METllOD FOR TllEASSIMIIATiotl OT FRS-1 SAR RETRIEVED WAVE SPECTRA IN A WAVE MODEL( J/\tHJl\RY 1994)HASSELMAtltl S , RRUFNitlG C & LJOllFLLO PESA SP-361 II P ?I VOL. 1
5 PAPER Ill PROC OT THE 'SECotlD ERS-1 SYMPOSIUM, SPACE AT THE SERVICEOT OUR EllVIROtlMFtlT'' PROCEEDINGS or A SYMPOSIUM llEl.D Ill HAMBURG,GFRM/\NY, 11-1(1 orrOBFR 1993 (JUDEXED mrnER 43)
* 9r,0079E x sr 361 r,3I ASSJMILAT!Otl OT OCFMl WAVE SPECTRA RFTRIEVrn !ROM ERS-1 SAR INTO THE
W/\VF MODEL W/\M (,J/\NU/\RY 1994JBAIJER F
3 FSfl SP-361 // r 77 VOL
5 F'f\P[R IN PRO[ nr THE 'SFcmrn FRS--1 SYMPOSIUM: SPJ\CE l\T THE SERVICEor nuR FtlVIRotlMftlf'' rROCEEDHWS or fl SYMPOSIUM JIELD IU HAMBURG,GERMANY, 11 I'+ nrTOFIFR 1993 (JNDFXFO UNDER 43)
* 9r,ooeoE x sr :ii6I 43GLOBAi. COMPARISOll or S!Gtl!rICAtlT WAVE HEIGHTS DERIVED FROM ERS-1SAR WAVE MOOE, FRS-1 ALTIMETER AtlD TOPEX ALTIMETER DATACJliNU/\RY l 99f1)
2 IJMISEll B , BRllFllJIJG C ~ STAARS C3 FS/\ SP-361 II r 33 VOL.
5 PAPER Ill PROC OT TJIE 'SECOtlD ERS-1 SYMPOSIUM, SPACE AT THE SERVICEor OUR ENVIROtltfftlT'' PROCEED!tlGS or A SYMPOSIUM HELD Ill HAMBURG,GFRMAtlY, 11-1'> OCTOBER 1993 (INDEXED lltlOER 43)
"' 9400BIE x sr 361 r,3I DEVELOPHEtlT or flt~ OPERf\TION/\L DATA /\SSIMH/\TION SYSTEM FOR ERS-1
WAVF SPECTRA C .IMIUARY 1994)DUNLAP E ' WII snt1 I J. & OLSENES/\ SP-361 II P s : VOL.
5 PAPER IN PROC nr THE 'SECOND ERS-1 SYMPOSIUM, SPACE AT THE SERVICEOF OUR ENVIROtlHENT', PROCEEDINGS OF A SYMPOSIUM HELD IN HAMBURG,GERMANY, 11-1'< OCTOBER 1993 <INDEXED UNDER 43)
* 9"1008?F X SP :'ifil r,3USE OF SAR-WAVF MODE ALTIMETER AND WIND SCATTEROMETER DATA INOPERATIONAL WAVF FORECASTING SYSTEM (JANUARY l99'dL/\SNIER P. ET fl.I
ESA SP-361 II P '•3 VOL.
PAPER IN PROC OT THE 'SECOtlD ERS-1 SYMPOSIUM, SPACE AT THE SERVICEor OUR ENVIROlltffllT.' PROCEEDINGS or A SYMPOSIUM HELD IN HAMBURG,GERMANY, 11-14 OCTOBER 1993 <INDEXED UNDER 43)
* 9f10083E X SP 361 43CROP DISCRIMlllATION USING MULTI-TEMPORAL ERS-1 SAR DATA( JAtlUARY 1994 lWOODING M. G , ZMUDA A. DESA SP-361 II r 41 VOL
GRIFFITHS G.H.
5 rAPER IN PROC or THE 'SECOND ERS-1 SYMPOSIUM, SPACE AT THE SERVICEor OUR ENVIROllMFtH'' PROCEEDINGS OF A SYMPOSIUM HELO IN HAMBURG,GERMANY, 11-1'< OCTOBER 1993 <INDEXED UNDER 43)
166
• 9400B4E X SP 361 43MULTI-TEMPORAL ERS-1 FOR CROP DISCRIMINATION (JANUARY 1994)BROWN R. J. ET AL.ESA SP-361 II P 57 VOL.
PAPER IN PROC. OF THE 'SECOND ERS-1 SYMPOSIUM, SPACE AT THE SERVICEOF OUR ENVIRONMEllT', PROCEEDINGS OF A SYMPOSIUM HELD IN HAMBURG,GERMANY, 11-14 OCTOBER 1993 (INDEXED UNDER 43)
• 9'<00B5E X SP 361 43AGRICULTURAL APPLICATIONS OF ERS-1 SAR DATA, PRELIMINARY RESULTS OFTHE PASTA PROJECT CJANUARY 1994)
HARTL PH. ET ALESA SP-361 /I P 63 VOL.
PAPER Ill PROC. OF THE 'SECOND ERS-1 SYMPOSIUM, SPACE AT THE SERVICEOF OUR ENVIRONMEtlT', PROCEEDINGS OF A SYMPOSIUM HELD IN HAMBURG,GERMANY, 11-14 OCTOBER 1993 (INDEXED UNDER 43)
* 9400B6E X SP 361 43SUITABILITY OF ERS-1 SAR PRI-DATA FOR MULTITEMPORAL ANDAGRICULTURAL LAND-USE MAPPING (JANUARY 1994)MUELLER U. ET AL.ESA SP-361 II P 69 VOL.
PAPER IN PROC. OF THE 'SECOND ERS-1 SYMPOSIUM, SPACE AT THE SERVICEOF OUR ENVIROllMEtlT', PROCEEDitlGS OF A SYMPOSIUM HELD IN HAMBURG,GERMANY, 11-1'< OCTOBER 1993 (INOEXED UNDER 43l
* 9400B7E X SP 361 43COMPARISON OF ERS-1 SLC AND LANDSAT THEMATIC MAPPER DATA FORMONITORING GRASSLAND ANO DETECTING CHANGES IN AGRICULTURAL USE(JANUARY 1994)SCHADT R. , KELL NDORFER J.
3 ESA SP-361 11 P 75 VOL.MAUSER W.
PAPER Ill PROC. or THE -stcoun ERS-1 SYMPOSIUM, SPACE AT THE SERVICEOF OUR ENVIRONMENT', PROCEEDINGS OF A SYMPOSIUM HELD IN HAMBURG,GERMAIN, 11-14 OCTOBER 1993 <INDEXED UNDER 43)
* 9400BBE X SP 361 43COMPARISON OF MULTITEMPORAL ERS-1 AND AIRBORNE DLR E-SAR IMAGEDATA FOR CROP MONITORING <JANUARY 199'<)SCHMULLIUS C., NITHACK J. 8 KERN M.ESA SP-361 II P 79 VOL.
PAPER IN PROC. OF THE 'SECOND ERS-1 SYMPOSIUM, SPACE AT THE SERVICEOF OUR ENVIRONMENT', PROCEEDINGS OF A SYMPOSIUM HELD IN HAMBURG,GERMANY, 11-14 OCTOBER 1993 CINDEXED UNDER 43)
* 940089E X SP 361 43INTEGRATION or FRS-1 DATA INTO THE EUROPEAN PROJECT OF AGRICULTURALSTATISTICS CJAtlUARY 1994)HARMS J. ET AL.ESA SP-~61 II P R5 VOL.
PAPER IN PROC. or THE 'SECOND ERS-1 SYMPOSIUM, SPACE AT THE SERVICEOF OUR ENVIROllMENT', PROCEEDINGS OF A SYMPOSIUM HELD Ill HAMBURG,GERMANY, 11-1'• OCTOBER 1993 (INDEXED UNDER 43)
* 940090E X SP 361 43I AGR!CUL TURAL STATISTICS, COMPARISON OF ERS-1 AtlO SPOT FOR THE CROP
ACREAGE ESTIMATIOll OF THE MARS PROJECT (JANUARY 1994)KOHL H.-G., KJllG C., 8 GROOF H. DEESA SP-361 II P R7 VOL.
PAPER IN PROC. or THE 'SECOND ERS-1 SYMPOSIUM, SPACE AT THE SERVICEOF OUR EllVIROllMFNT', PROCEEDINGS OF A SYMPOSIUM HELD IN HAMBURG,GERMANY, ll-1'• OCTOBER 1993 (ltlOEXED UNDER 43)
* 9f+0091E X SP 361 431 AGRICULTURAL POTENTIALS OF ERS-1 DATA (JAtlUARY 1994)
KOLAR J. 8 FERAllEC J.ESA SP-361 II P 93 VOL.
PAPER IN PROC. OF TllE 'SECOND ERS-1 SYMPOSIUM, SPACE AT THE SERVICEOF OUR ENVIRONMENT'' PROCEEDINGS or A SYMPOSIUM HELD IN HAMBURG,GERMANY, 11-14 OCTOBER 1993 (INDEXED UNDER 43)
* 940092E X SP 43361RICE CROP MONITORING WITH ERS-1 SAR, A FIRST YEAR RESULT(JANUARY 1994)KUROSU T. ET ALESA SP-361 I I P 97 VOL
5 PAPER IN PROC or THE 'SECOND ERS-1 SYMPOSIUM: SP/\CE AT HIE SERVICEOF OUR ENVIROtlHnH', PROCEEDINGS OF f\ SYMPOSIUM llELD Itl HAMBURG,GERMANY, 11-1'• OCTOBER 1993 (INDEXED UNDER 43)
* 9f10093E X SP 361 f13CROP MONITORING WllH ERS-1 SAR !ti EAST ANGLIA, UK (JANUARY 1994)WRIGHT P. , SAICll P. 8 CORDEY R.ESA SP-361 II P 103 VOL. 1
PAPER !ti PROC OF THE 'SECOtlD ERS-1 SYMPOSIUM, srACE AT THE SERVICEor OUR ENVIROllMFllT'' PROCEEDitlGS OF A SYMPOSIUM HELD IN HAMBURG,GERMANY, 11-1'• OCTOBER 1993 (INDEXED UNDER 431
* 9f1009f1E X SP 361 43ANTARCTIC TOPOGRAPHY DERIVED FROM ERS-1 ALTIMETRY (JANUARY 1994)BAMBER J. L. ET AL.ESA SP-361 II P 113 VOL.
PAPER Ill PROC. OF THE 'SECOND ERS-1 SYMPOSIUM, SPACE AT THE SERVICEOF OUR ENV!RONMEllT', PROCEEDINGS OF A SYMPOSIUM HELO JN HAMBURG,GERMANY, 11-1'• OCTOBER 1993 (INDEXED UNDER 43 l
ESA Journal 1994, Vol. 18

• 940095E X SP 361 43
ANALYSIS OF ERS-1 RADAR ALTIMETER DATA OVER ANTARCTICA
(JANUARY 1994)
IHDE J. ET Al
ESA SP-361IIP119 VOL.
PAPER IN PROC or THE 'SECOND ERS-1 SYMPOSIUM, SPACE AT THE SERVICE
OF OUR ENVIRONMFNT', PROCEEDINGS OF A SYMPOSIUM HELD IN HAMBURG,
GERMANY, 11-1'• OCTOBER 1993 (INDEXED UNDER 43)
* 940096E X SP 361 43MEASURING ICE SHEET CHANGES WITH THE ERS-1 ALTIMETER (JANUARY 1994)WINGHAM D.J. ET Al.ESA SP-361 II P 127 VOL.
PAPER IN PROC. OF THE 'SECOND ERS-1 SYMPOSIUM, SPACE AT THE SERVICEOF OUR ENVIRONMENT', PROCEEDINGS OF A SYMPOSIUM HELD IN HAMBURG,GERMANY, 11-14 OCTOBER 1993 (INDEXED UNDER 43)
• 9'o0097E X SP 361 43APPLICAT!OtlS or ERS-1 SAR AND SCATTEROMETER DATA FOR STUDIES OF THEANTARCTIC ICE SHEET <JANUARY 1994)ROTT H. ET Al.ESA SP-361 II P 133 VOL.
PAPER IN PROC OF THE 'SECOND ERS-1 SYMPOSIUM, SPACE AT THE SERVICEOF OUR ENVIROtlMFNT', PROCEEOJtlGS OF A SYMPOSIUM HELD Jtl HAMBURG,GERMANY, 11-14 OCTOBER 1993 (INDEXED UNDER r,3)
• 94009BE X SP 361 43EXTRACTION OF ANTARCTIC TOPOGRAPHIC-GLACIOLOGICAL FEATURES FROMERS-1 SAR DATA ( JANUARY 1994)BENNAT H , HEIDRICH B. 8 SIEVERS J.ESA SP-361 11 P 141 VOL
PAPER IN PROC. OF TflE 'SECOND ERS-1 SYMPOSIUM, SPACE AT THE SERVICEor OUR ENVIRotlMEllT.' PROCEEDlllGS OF A SYMPOSIUM HELD rn HAMBURG,GERMANY, 11-lf+ OCTORER 1993 <INDEXED UtlDl:R 43)
• 940099E X SP 361 43VELOCITIES AND MASS BALANCE OF PltlE ISLAND GLACIER, WEST ANTARCTICA,DERIVED FROM ERS-1 SAR IMAGES (JANUARY 1994)LUCCHITTA B.K. ET AL.ESA SP-361 II P 147 VOL.
PAPER IN PROC OF THE 'SECOND ERS-1 SYMPOSIUM, SPACE AT THE SERVICEOF OUR ENVIRONMEllT', PROCEEDINGS OF A SYMPOSIUM HELD IN HAMBURG,GERMANY, 11-14 OCTOBER 1993 (INDEXED UNDER 43)
• 940IOOE X SP 361 43ERS-1 DATA FOR MAPPING OF THE ANTARCTIC PENINSULA BYSHAPE- FROM- SHAD I NG TECHNIQUE ( JAtlUARY 1994 lFISKEL T., HARTMANN R. 8 WINZER W.ESA SP-361 11 P I 53 VOL .
PAPER IN PROC OF THE 'SECOND ERS-1 SYMPOSIUM, SPACE AT THE SERVICEOF OUR ENVIRONMENT', PROCEEDINGS OF A SYMPOSIUM HELD IN HAMBURG,GERMANY, 11-14 OCTOBER 1993 (INDEXED UNDER 43)
* 9f10101E x sr 361 43ICE SHEET TOPOGRAPHY FROM RETRAr.KED FRS-l Al T!METRY (JANUARY 1994)ZWALLY ll.J ET Al.FSA SP-361 II P 159 VOL
4 -5 PAPER Ill PROC or rnE 'SECOND ERS-1 SYMPOSIUM· SPACE AT TllE SERVICE
OF OUR FNV!ROllMFllT', PROCEEDlllGS OF A SYMPOSIUM llELD IN HAMBURG,GERMANY, II-I'• OCTOBER 1993 (INDEXED UNDER 43)
* 9f10102E X SP 361 43COMPARISOtl OF RADAR-Al TIMETRY DATA OVER GRFFNLAND WITH SURFACETOPOGRl\PMY DERTVFO FROM AIRBORNF LASER ALTJMETRY (JANUARY 1994)THOMAS R H ET AlESA SP-361 II P 165 VOL.
PAPER IN PROC or Tl!E 'SECOND ERS· I SYMPOSIUM, SPACE AT THE SERVICEOF OUR ENVIROrH1FtlT', PROCEEDINGS OF A SYMPOSIUM tlELD IN Ul\MBURG,GERM/\NY, 11-14 OCTOBER 1993 <INDEXED UNDER ft3)
* 9'10103E X SP 361 43l V/\tID/\Timl or Sl\R Of\T/\ fROM ERS--1 Otl SPITSRFRGEtl, SV/\l.Bf\RO:
PRFLIMillARY GI AC!OLOGICAL ANO GFOMORPllOLOG!CAL ItlTFRPRETAT!ON( JAllUARY 1994 lLErAUCONllTER R ET AlESA SP- 361 I I P I 71 VOL
PAPER IN PROC nr TllF 'SECOND ERS-1 SYMPOSIUM· SPACE Al TllE SERVICEor OUR EtlV!ROIH!FllT'' PROCEED!llGS or A SYMPOSIUM HELD IN HAMRURG,GFRMf\HY, l l-1'1 OCTOBFR 1993 C HHJFXEIJ UNIJER r,3)
* 940104E X SP 361 43RESULTS FROM ERS-1 RADAR AL TI METRY GROUND TRUTlllllG ON TiffF!LCHNER-RONNE-SCHELFEIS (JANUARY 1994)SCHENKE H.W. ET Al.ESA SP-361 II P 177 VOL.
PAPER Ill PROC or TllE 'SECOtlD ERS-1 SYMPOSIUM, SPACF AT THE SFRVICFOF OUR EtlV!ROIH1FllT.' PROCEEDINGS or A SYMPOSIUM llEI D !II HAMBURG,GERMANY, 11-14 OCTOBER 1993 CINOEXEO UNDER 43l
* 940105E X SP 361 '•3ERS-1 SAR, STRESS INDICATOR FOR AtlTARCTIC Ir.F STREAMS (.JANUARY 1994l
2 VAUGHAN D.G., FROLICll RM. 8 DOAKE C S.M3 ESA SP-361 II P 183 VOL.
PAPER IN PROC. or 111[ 'SECONDERS l SYMPOSIUM· SPACE AT TllE SERVICEOF OUR EHVIRotlMFPIT', rROCEEDIHGS OF /\ SYMPOSIUM nr t D Jtl 11/\MBURG,GERMANY, 11-14 Or.TOBER 1993 (!NDFXED UNDER '<3l
ESA Journal 1994 Vol. 18
• 9'10106E X SP 361 43ERS-1 SCATTEROMETER DATA ASSIMILATION (JANUARY !994)STOrFELEN A , GAFFARD, C. 8 ANDERSON DESA SP-361 II P 191 VOL.
PAPER 111 PROC OF TllE 'SECOND ERS-1 SYMPOSIUM, SPACE AT THE SERVICEOF OUR ENVIRONMENT', PROCEEDINGS OF A SYMPOSIUM HELO IN HAMBURG,GERMANY, II 14 OCTOBER 1993 (INDEXED UNDER 43)
• 940107E X SP 361 43OPERATIONAL USE OF ERS I PRODUCTS IN TllE METEOROLOGICAL OFFICE(JANUARY I99fdBELL R. S.ESA SP-361 II P 195 VOL.
PAPER IN PROC or THE 'SECOND ERS-1 SYMPOSIUM, SPACE AT THE SERVICEOF OUR EtlV!ROllMFNT', PROCEFDINGS OF A SYMPOSIUM HELD IN HAMBURG,GERMANY, 11-1'• Or.TOBER I 993 (INDEXED UNDER 43 l
* 94010BE X SP r,3361RESULTS FROM ASSIMILATION OF ERS-1 SCATTEROMETER WIND INFORMATIONIN AN OPERAT!OllAL LIMITED AREA WEATHFR rORECAST MODEL(JANUARY I 994 lBRF!V!K L A., HAUGSE B 8 llOMLEID M.ESA SP-361 II P 701 VOL I
PAPER IN PROC or THE 'SECOllD ERS-1 SYMPOSIUM, SPACE AT TllE SERVICEor OUR ENVIROllMFllT.' PROCEEDINGS OF A SYMPOSIUM HELD IN HAMBURG,GERMANY, 11-1'• OCTOBER 1993 (INDEXED UNDER 43)
* 9r,0109E x sr 361 '•3All ASSESSMFNT or TllE USE or ERS-1 SCATTEROMETFR WINDS IN CANADIANWEATllER FORECASIING CENTRES (JANUARY 1994)KING P.ESA SP-361 II P 201 VOL.
5 P/\PER IN PROC. or THE 'SECOND ERS-1 SYMPOSIUM: SP/\CE AT THE SF.RVICEOF OUR ENVIRONMENT', PROCEEDINGS OF A SYMPOSIUM HELD IN HAMBURG,GERMANY, II-I'• OCTOBER 1993 (INDEXED UNDER 43l
• 9401IOE X SP 361 43THE IMPACT OF Sr.ATTEROMETER DATA ON MEAN SEA LEVEL ANALYSES(JANUARY 1994 lPOLAVARAPU S.ESA SP-361 II r 711 VOL.
5 P/\PER IN PROC or THE 'SECOND ERS-1 SYMPOSIUM· SP/\Cf J\T THE SFRVICEor OUR ENVIROllMrtn•' PROCFFOlllGS OF A SYMPOSIUM HFI D IN HAMBURG,GFRMANY, 11-1'• OCTOBER 1993 CltlDEXEO UNDER 43)
* 9ftOlllE X SP 361 43l A GENER/HJ SEO tlOllL IHF/\R OCF/\N Wf\VF. S/\R SPECTRf\I_ HITEGR/\L TRf\NSrORH
ANO ITS APPLICATION TO ERS-1 SAR OCFAtl WAVE IMAGING (JANUARY 1994)BAO M., BRUEIHllG C. 8 ALPERS W.
3 ESA SP-361 II P 719 VOL 1
5 PAPER Ill PROC or THE 'SECOND ERS-1 SYMPOSIUM, SPACE AT THE SERVICEOF OUR ENVIRONMFNT', PROCEEDINGS OF A SYMPOSIUM llFLD IN HAMBURG,GERMANY, 11-14 OCTOBER 1993 (INDEXED UNDER 43)
* 940112E X SP 361 43VALIDATION OF A tlUMERICAL MODEL DESCRIBING THE GENERATION ANOPROPAGATION or INTERNAL WAVES IN THE STRAIT OF GIBRALTAR BY USINGERS-1 SAR DATA <JANUARY 1994)BRANDT P 8 Al.PERS W.ESA SP-361 11 P 225 VOL.
PAPER IN PROC. or THE 'SECOND ERS-1 SYMPOSIUM, SPACE AT THE SERVICEOF OUR ENVIRONMENT', PROCEEDINGS OF A SYMPOSIUM HELD IN HAMBURG,GERMANY, 11-14 OCTOBER 1993 (INDEXED UNDER 43)
* 9ft0113E X SP 361 43I ON Tiff RELATIVF !MPORTAllCE OF TllE or.FAN WAVE RADAR MODULATION
TR/\flSfER ruu<::TJOPI roR ItlVFRTHlG ERS I S/\R IH/\GF SPFCTR/\ INTOocrl\tl Wl\VE srrr:TPf\ (Jf\NtJ/\RY 1994)
2 BR1JFtlJNG C.3 ESA SP-361 II P 733 VOi
'• -PAPFR Ill PROC or THE 'SECOtlD ERS-1 SYMPOSIUM, SPACE AT TllE SERVICEor OIJR ENVJROtlHHIT I. PRocrFOltlGS or f\ SYMPOSIUM ur t D Hl HAMBURG,GERMANY, ll 1'+ nr:TOBfR 199~ (JNDFXED UNOFR 't3l
l COMP~RISOll or OfFAll WAVF !MAGlllG RY fRS I ANO Al MAl-1 SYtlTHETIC/\PFRTIJRE R/\D/\R < Jf\NU/\RY 1 qqr,)
7 WI\ OF A , BRUFtlltlG C R /\l_PFRS W3 ESf\ SP-361 // r 739 VOL l'• -
Pf\rFR Jtj PROC or Tiff 'SECOND ERS-1 SYMPOSIUM: SP/\CE /\T THE SfRVICEor OUR FtlV!ROllMrtn•' PROCEFO!llGS or A SYMPOSIUM HFI n IN HAMBURG,GFRMANY, 11·14 OCTOBFR 199~ CINDEXFO UllOER 43)
* 9'10l15E X SP ~61 r,3J NOil[ ItlE/\R TJIFnRv or OCfflll S/\R TRf\tlSFORH/\TIOM Mrn STflTISTIC/\L
Ml/\IYSIS or ERS l S/\R Wf\VF HOOE IMflGFTTFS (Jl\tllJ/\RY ]qqti)2 CH1WROH B FT /\I3 ESf\ SP-361 II r 7'17 VOL.
5 P/\PFR IH PROC or THE 'SECOND ERS-1 SYMPOSIUM SP/\f,F AT TllF SFRVICEor OUR HIVIRotllffllT I' PROCEEIJINGS or /\ SYHPOSilJH llFI D IN HAMBURG,GFRMl\t~Y. ll-1'1 OCTOBER 1993 (JtWFXFD IHWFR 'i:'>l
167
esa SP· 361Volume I
Proceedings of the Second ERS-1 Symposium
SPACE AT THE SERVICE OF OURENVIRONMENT
11-14 October 1993Hamburg, Germany
esaeuropean space agency
• 9ft01 l6F X SP 361 43VALIDATION or FRS-1 SAR FOR ARCTIC ICE PROPERTIES FROM ARCTIC-91CJl\NUARY 1994 lASKllF .I ET Al
3 FSA SP 361 // P ?S7 VOL
s P/\PFR lfl F'ROr: or THE 'SF.Cotm FRS-1 SYHrnsTUM· SPl\fE f\T TUE SERVICEor OUR FNVIRONMrtlT'' PROCEEn!NGS or A SYMPOSIUM llELD IN HAMBURG,GERM/\NY, 11- lft OCTOBER 1993 C INOEXFD lHIOER ft3 l
• 9f10ll7E X SP 361 43Tiff TRANSPOLAR !CE DRIFT NORTH OF FPAM STRAIT STUDIED FROM ERS-1SAR IMAGFRY ( JAl/UARY l 994 lKERGOH/\RO C rT AlFSA SP 361 // p ?63 VOL
5 PAPER IN PROC or THE 'SECOND ERS-1 SYMPOSIUM, SPACE AT THE SERVICEor OUR ENVIROllMFllT'' PROCEEDINGS OF A SYMPOSIUM llELD IN HAMBURG,GERM/\NV, i i -r» OCTOBER 1993 <INDEXED UNDER 43)
• 9r,011aE x sr 361 r,3SEA !CE LEAD OYtlAMICS FROM ERS-1 SAR (JANUARY l99'1lSTERN II L.., ROTHROCK D.A. 8 KWOK R.ESA sr 361 // p ?69 VOL. I
S PAPER IN PROC OF THE 'SECOND ERS-1 SYMPOSIUM, SPACE AT THE SERVICEor OUR FNVIROtlMFtH'' PROCEEDINGS OF A SYMPOSIUM llELD IN llAMBURG,GFRMl\fN, 11-1'• OCTOBER 1993 CINOEXEO UNDER 43)
• 940119E X SP 361 43TllE USE OF ERS-1 SAR OATA FOR SEA ICE MAPPING AND ICEBREAKEROPFRAT I ONS IN TtlE GULF OF BOTllN I A (JANUARY 1994 lTtlOMPSON TH. FT Al.
3 ESA SP-361 // P ?71 VOL.
PAPER IN PROC. or THE 'SECOND ERS-1 SYMPOSIUM, SPACE AT THE SERVICEOF OUR ENVIRONMENT', PROCEEDINGS OF A SYMPOSIUM HELD IN HAMBURG,GERMANY, 11-1'1 OCTOBER 1993 !INDEXED UNDER 43l
• 940120E X SP 361 43l MOll!TOR!NG SEA ICE FLUX THROUGH FRAM STRAIT (JANUARY l994l7 SCHWE!GER A J R ROTllROCK D A.
ESA SP-361 // P 777 VOL. I
5 PAPER IN PRDC OF THE 'SECOND ERS-1 SYMPOSIUM, SPACE AT THE SERVICEor OUR ENVI RONMFNT. ' PROCEEDINGS OF A SYMPOSIUM llEL D IN HAMBURG'GERMANY, ll-!<1 OCTOBER 1993 !INDEXED UNDER 43l
168
• 94012!E X SP 361 43THE GEOPHYSICAL PROCESSOR SYSTEM - AUTOMATED ANALYSIS OF ERS-1SAR IMAGERY ( JAllUARY 1994 lSTERN H.l. ET AlESA SP-361 // P 281 VOL.
PAPER IN PROC. OF THE 'SECOND ERS-1 SYMPOSIUM, SPACE AT THE SERVICEOF OUR ENVIROHMEllT', PROCEEDINGS OF A SYMPOSIUM llELD Ill HAMBURG,GERMANY, ll -1'1 OCTOBER 1993 (INDEXED UNDER 43 l
• 940122E X SP 361 43MULTI-SENSOR AND GROUND-TRUTH INVESTIGATION OF WEDDELL SEA ICECONOITIONS (JANUARY 1994)VIEHOFF T. & LIESA SP-361 // P 287 VOL.
PAPER IN PROC. OF TllE 'SECOND ERS-1 SYMPOSIUM, SPACE AT THE SERVICEOF OUR EtlVIROllMEllT', PROCEEDINGS OF A SYMPOSIUM HELD IN HAMBURG,GERMANY, 11-l't OCTOBER 1993 !INDEXED UNDER 43)
* 940123E X SP 361 43HIE ODDEN ICE TONGUE IN THE GREENLAND SEA, SAR IMAGERY ANO FIELDOBSERVATIONS OF ITS DEVELOPMENT IN 1993 (JANUARY 1994)WADHAMS P. & VIEllOFF T.ESA SP-361 I I P 291 VOL.
PAPER IN PROC. OF THE 'SECOND ERS-1 SYMPOSIUM, SPACE AT HIE SERVICEOF OUR ENVIRONMENT', PROCEEOINGS OF A SYMPOSIUM HELD IN HAMBURG,GERMANY, 11-14 OCTOBER 1993 CINOEXED UllOER 43)
• 940!24E X SP 361 43TEXTURE ANALYSIS AS AN AID FOR THE EVALUATION OF ERS-1 SAR DATA FROMA PART OF THE ANTARCTIC PENINSULA (JANUARY 1994)SAURER H. & TRIEBFUERST B.ESA SP-361 // P 297 VOL. I
PAPER IN PROC. OF THE 'SECOND ERS-1 SYMPOSIUM, SPACE AT THE SERVICEOF OUR ENVIRONMEtlT', PROCEEDINGS OF A SYMPOSIUM HELD IN HAMBURG,GERMANY, 11-14 OCTOBER 1993 !INDEXED UNDER 43l
• 94012sE x SP 361SEA ICE MOTIOU Ill THE WEDOELL SEA, ANTARCTICA FROM PAIRS OF ERS-1SAR IMAGES CJMHIARY 1994)TURNER J, ET AL.
3 ESA SP-361 // P 303 VOL.
'• -PAPER IN PROC OF TllE 'SECOND ERS-1 SYMPOSIUM, SPACE AT THE SERVICEOF OUR ENVIROllMFNT', PROCEEDINGS OF A SYMPOSIUM HELD IN HAMBURG,GERMAIN, II-I'• OCTOBER 1993 C!llOEXED UllOER 43)
-w 9ft0126E X SP 361 '13INTFRCOMPARISOll or ERS-1 SAR, AIRBORllE SLAR AND ELECTRO-MAGNETICICE-THICKNESS 01\T/\ (J/\NUl\RY 199ft)IKEDA M. 8 PRlllSEtlBERG S.ESA SP-361 // P 309 VOL.
PAPER IN PROC OF rut 'SECOND ERS-1 SYMPOSIUM, SPACE AT HIE SERVICEOF OUR ENVIROIH1FtH', PROCEEDlllGS OF A SYMPOSIUM llELD IN HAMBURG,GERMAIN, 11-l'o OrTOBER 1993 C!UDEXFD UNDER 43l
* 9ftnt77E x sr 11111 f13
ERS-1 SAR OBSFRVATIOtl or SWELL TRAVELLIUG INTO TllE ICE (JANUARY 1994)LEllNER S. 8 tfASSELMANN K.FSA SP-361 // P 311 VOL.
5 PAPER IN PROC or TllE 'SECOND FRS-1 SYMPOSIUM, SPACE AT TllE SERVICEOF OUR ENVIROllMFNI.' PROCEEDINGS or A SYMPOSIUM HELD IN tfAMBURG,GERMANY, 11- l'o OCTOBER 1993 CINDEXED UNDER 't3 l
* 9f101ZRE X SP 361 r,3OCEAN- ICE IIHFRACTION IN THE MARGINAL ICE ZONE CJANUARY 1994)LIU A. K . 8 PENG C. Y.ESA SP-361 II P 317 VOL.
4 -5 PAPER IN PROC or TttE 'SECOND ERS-1 SYMPOSIUM, SPACE AT TllE SERVICE
OF OUR ENVIROllMEIH', PROCEEDINGS OF A SYMPOSIUM tfELD IN HAMBURG,GERMANY, I I-1'1 OCTOBER 1993 ClllOEXFO UNDER 't3)
* 9ft0129E X SP 361SEA ICE AND Ct !MATE
't3AN /\PP ROACH USI NG S/\R DAT I\ C Jf\NU/\RY 19 94 J
ROTH R. ET AlESA SP 361 // P 323 VOL
PAPER IN PROC or THE 'SECOND ERS I SYMPOSIUM, SPACE AT TllE SERVICEOF OUR EllVIRON11Ftn.' PROCEEOilCGS or A SYMPOSIUM llELD IN HAMBURG,GERMANY, 11-l'• OCTOBER 1993 CINDFXED UNDER 43)
* 9'10130E X SP 361 it3THE SEGMENTATION OF ERS-1 SEA-ICE IMAGERY FOR POLAR OPERATIONS(JANUARY 1994)
7 WALKER NP. R RYE A.J3 ESA SP-361 II P 329 VOL.
PAPER IN PROC or THE 'SECOND ERS-1 SYMPOSIUM, SPACE AT THE SERVICEOF OUR ENVIRONMFNT', PROCEEDINGS OF A SYMPOSIUM HELD IN HAMBURG,GERMANY, ll -1'1 OCTOBER 1993 CINOEXED UNDER 43 l
• 940131E X SP 361I RADAR OBSERVATION OF AN ARCTIC POLYNA UNDER SUMMER CONDITIONS
CJ/\NU/\RY l 99'tlGUDMANDSEN P ET Al.ESA SP-361 // P 335 VOL.
PAPER IN PROC OF THE 'SECOND ERS-1 SYMPOSIUM, SPACE AT THE SERVICEOF OUR ENVIROllMEllT', PROCEEDINGS OF A SYMPOSIUM HELD IN llAMBURG,GERMANY, l I -1'1 OCTOBER 1993 CINDEXED UNDER 43 l
ESA Journal 1994 Vol. 18
* 9f10l32E X SP 43361SEA-ICE DETECTION IN THE BOHAI SEA USING TllE ATSR/M AND AVHRR(JANUARY 19941EZRATY R , HUAl/G R. 8 LIU J.ESA SP-361 // r 341 VOL.
PAPER IN PROC OF THE 'SECOND ERS-1 SYMrOSIUM, SPACE AT THE SERVICEOF OUR ENVIRONMENT', PROCEEDINGS OF A SYMPOSIUM HELD IN HAMBURG,GERMANY, II-I'• OCTOBER 1993 (INDEXED UNDER 43J
• 940133E X SP 361 43SURFACE PROCESSES IN GREENLAND SEA CONVECTION (JANUARY 1994)CARSEY F D.ESA SP-361 II P 347 VOL
PAPER IN PROC or THE 'SECOND ERS-1 SYMPOSIUM. SPACE AT THE SERVICEOF OUR ENVIROl/MFNT', PROCEEDINGS OF A SYMPOSIUM HELD IN HAMBURG,GERMANY, 11-14 OCTOBER 1993 (INDEXED UNDER 431
• 940134E X SP 361 43SIZEX'92 ERS-1 SAR ICE VALIDATION EXPERIMENT CJAtlUARY 19941SANDVEN S ET AlESA SP-361 II P 353 VOL.
PAPER IN PROC OF TllE 'SECOND ERS-1 SYMPOSIUM· SPACE AT THE SERVICEOF OUR ENVIROllMUIT', PROCEEDINGS OF A SYMPOSIUM HELD Ill HAMBURG,GERMANY, 11-1'• OCTOBER 1993 C!IWEXED llNOER 431
* 940135E X SP 361 <t3ERS-1 SEA ICE ArrLICATIONS DEVEl.OPMENT ACTIVITIES AT THE CANADACENTRE FOR REMOTE SENSING (JANUARY 1994 JMANORE M.JESA SP 361 // P 359 VOL
PAPER Ill PROC or THE 'SECOl/O ERS-1 SYMrOSIUM. srACE AT THE SERVICEOF OUR ENVIROllHFl/T', PROCEEDJllGS OF A SYMPOSIUM HELD IN HAMBURG,GERMANY, II-I'• OCTOBER 1993 (INDEXED UllDER 43)
• 940136E X SP 43361FUSION OF ERS-1 SAR AND SSMl/I ICE DATA (JANUARY 1994)RAMSEIER R. ET AlESA SP-361 // P 361 VOL.
PAPER IN PROC or THE 'SECOND ERS-1 SYMPOSIUM. SPACE AT THE SERVICEOF OUR ENVIRONMEllT', PROCEEDINGS OF A SYMPOSIUM HELD IN HAMBURG,GERMANY, 11-14 OCTOBER 1993 (INDEXED UNDER 43 J
* 9<t0l37E X SP 361 43THE OPERATIONAi MArPING OF ICE COllOITIONS USING ERS-1 IMAGES IN THEBALTIC SEA CJMlllARY 19941SE INA f\ 8 GRONVt\! I HESA SP-361 // r "9 VOL
5 PAPER Itl PROC or Tiff 'SECOND ERS-1 SYMPOSIUM· SPl\CE AT THE SERVICEor OUR EtlVIROllltrllT'' PROCEEDINGS OF A SYMrOS!lJM HELD IN HAMBURG,GERMhNY, 11-}f, orTOBER }QQ3 CINnFXFD tmnFR 43)
• 940l3BF x sr 36 l 43!CE-ATMOSPllFRF lllTFRACTIOllS Ill TllE CEllTRAL ARCTIC, REMOTELY SENSEDAND S!MlJLATEO !CF CONCENTRATIONS AllO MOTION (JANUARY 19941MASLANIK J A FI AlESA sr-361 // r 373 VOL
PAPER IN PROC or TllF 'SECOND ERS I SYMrOSIUM. srACE AT TllE SERVICEOF OUR FNVIROtlMFtH', PROCEEDINGS OF h SYMPOSIUM HFl_D IN HAMBURG,GERMANY, ll-lf1 OfTOBER 1993 (INDEXED lHlDFR ft3)
* 9r10139E X SP 361 r.;sl USF or ERS-1 WJtlO SChTTEROMETER DhTA OVFR Ll\tHJ SURFACES: ARID Mrn
SEMI-fl.RID \_AtlTIS t r i : (Jl\tHJf\RY 199~)KERR Y ll & Mf\GAGI R DESf\ SP-361 // P )A3 VOl
PAPER IN PROC nr THF 'SFCOl/D ERS I SYMrnSllJM· srACE AT TllE SERVICEor OUR EllV!ROllMFllT'' PROCEED II/GS or A SYtlrOSIUH HEID IN llAMRURG,GFRMf\NY, ll-Jf1 nr:TOBFR lq93 c runr xr n tJtlOFR ft3)
* 9<t0140E X SP .)61 43LAllD SURFACE JFMPFRATURE RETRIEVAi FROM ATSR DATA OVER TllE NIAMEYCNIGERJ AREA IJAlllJARY 1994)I.ABED J LI 1 I R STOLi Mr.
3 ESA SP-361 // r ;A9 VOL Ir, -5 Pf\PFR TN PRO[ or THF 'SFCOND ERS l SYMPOSIUM SPl\CE AT rm: SERVICE
or OUR ENVIROtltfftlT I' PROCEFDINGS or fl SYMPOSIUM HELD IN Hf\HBURG,GERMMJY, 11 tri Of:TORFR 1993 CHlnEXED \JNOFR <13)
• 940141E X SPANALYSIS or FRS I SCATTEROMETFR DATii OVFP tMrn SURrAr:FSRESULTS (JANUf\RY 1994)MOUG!ll E ET Al
3 ESA SP-361 II P '9; VOL
PRELIMINARY
5 PAPER IN PROC OF THE 'SECOllO FRS-1 SYMPOSIUM· srAcE AT TllE SERVICEOF OUR EtNIRotH1F-tlT', PROCEEDINGS OF A SYHPOSIUH HELD IN HAMBURG,GERMANY' 11- Jf1 OCTOBER 1993 ( nrnEXED UNDER 43)
• 940142E x sr 361l MONITORING THF TFMPORAL BEHAVIOUR OF I.AND SURFf\CFS WITH ERS-1 WIND
SCATTEROMFTFR DAIA !JANUARY 1994)WIESMANN A. & MAFTZLFR C.ESA SP-361 // r 399 VOL
PArER Ill PROC or THE 'SECOND ERS-1 SYMPOSIUM. SPACE AT THE SERVICEor OUR ENVIRONHFtlT'' PROCEEDINGS OF A SYMPOSIUM HELD IN HAMBURG,GERMAtlY, II-I'• OCIOBER 1993 (INDEXED UNDER fdl
ESA Journal 199-L Vol. 18
esa SP-361Volume II
Proceedings of the Second ERS-1 Symposium
SPACE AT THE SERVICE OF OURENVIRONMENT
11-14 October 1993Hamburg, Germany
• 9r,0143F X SP 361 <13I RAOAR SIGNATURES or LAND SURFACES MEASURED BY TllE ERS-1 SCATTEROMETER
( JAllUARY 1994 JWISMAllN V , AOFHllKE K. 8 SctlMULLIUS CFSA SP-361 // r r,05 VOL I
I) PAPER IN PROr: or THE 'SECOND FRS-l SYMPOSIUM: SPACE AT THE SERVICEor OUR FNVIRotJHftlT', PROCEEDINGS OF A SYMPOSIUM HELD IN HAMBURG,GFRMf\NY, ll-Jf1 OCTOBER 1993 <INDEXED UNDER 43)
* 9r101r1r1E X SP 361 r13I MArPING COASTAi rLJRRENTS WITll SAR USING NATURAi.iV-OCCURRING SURFACE
SUCK PATTERNS ( .11\tWARY 199<+)GOWFR J r R
3 ESA SP-361 II r r115 VOL
PArFR Ill PROC or THE 'SECOND ERS-1 SYMPOSIUM. SPACE AT THE SERVICEOF OIJR FNVIROtlHFNT', PROCEEDINGS OF A SYMPOSIUM HELD IU HAMBURG,GERMIH,Y, 11 1<4 nrTOBER 1993 (JNDEXF.D UNOFR 1'13)
w 9r1ntr11JF X SP 361 <,3I TWO YFAR RFSUI TS or ARTIFICIAi Oil rrn LlJTION OEIECTIOll EXPERIMENTS
IN THE S[f\ f\D.J/\CFtlT TO Jl\PAN RY FRS 1 S/\R (JANUARY l 994)OKAMOTO K FT AlESf\ SP-361 II P ri19 VOi.
PAPFR IN PROC or Tiff 'SECOllD ERS-1 SYMPOSIUM· srAcE AT TllE SERVICEor OUR FNVIROtlHFtH'' PROCEEDINGS or A SYMPOSIUM HELD IN HAMBURG,GFRMAllY, 11 Ir, OCIOBER 1993 ( ItlOEXED IJIWER 43 J
w 9<+0l46E X SP 361 43OPERAT!OtlAL USF OF 'REAL-TIME' ERS-1 SAR DATA FOR Oil SPILLDETECTION ON TllF NORTH SEA FIRST RESULTS !JANUARY 1994)PELLEHAllS A.H J M ET AL
3 FSA SP-361 // P ~ZS VOL
5 PAPER JU PROC or THE 'SECOND ERS-l SYMPOSIUM: SPACE AT TtlE SERVICEor OUR FNVIROllHFtlT'' rROCEFDJllGS or A SYMrOS!lJM llElD IN HAMBURG,GFRMAUY. 11 tr, OCTOBFR 1993 <HHJFXFn UNDFR lf3J
• 9401/f?E X SP 361 43l OIL SPIU. DFTFCTJotl AND MONITORING WJTtl TllF FRS-1 SAR
( Jl\NUf\RY l 99f1)WI SMANN V
3 ESf\ SP 361 // p f1~l VOL
PAPFR JI/ PROC Of TllE 'SECOND ERS-J SYMrOSIUM· SPACE AT THE SERVICEor OUR EUVIROtlMFtlT'. PROCEEDINGS or f\ SYMPOSIUM HELD IN HAMBURG,GERMANY, 11·14 OCTOBER 1993 CJNOEXEO UNDER 43l
• 94014BE X SP 361 43
EVALUATING MUL Tl-TEMPORAL ERS-1 SAR DATA FOR TROPICAL FOREST MAPPING:
DATA SELECTION, PROCESSING AND TARGET IDENTIFICATION (JANUARY 1994)
CONWAY J,A,, LEYSEN M. 8 SIEBER A.J.
ESA SP-361 II P 441 VOL. I
PAPER IN PROC. OF THE 'SECOND ERS-1 SYMPOSIUM: SPACE AT THE SERVICEOF OUR ENVIRONMENT', PROCEEDINGS OF A SYMPOSIUM HELD IN HAMBURG,GERMANY, 11-14 OCTOBER 1993 !INDEXED UNDER 43)
* 940149E X SP 361 43EVALUAT!tlG HUl Tl-TEMPORAL ERS-1 SAR DATA FOR TROPICAL FOREST MAPPING:REGIOllAL MAPPHIG MIO CHAtlGE DETECTION APPL !CA r IOllS (JANUARY I994)LEYSEfl H , COllWAY JA. & SIEBER A.JESfl SP-361 II r 447 VOL
'• -PAPER Ill PROC or THF 'SECOllD ERS-1 SYMPOSIUM: SPACE AT THE SERVICEOF OUR EtlVIROfltffflT', PROCEEDillGS OF A SYMPOSIUM HELD Ill HAMBURG,GERMAllY, 11-l'• OCTOBER 1993 !INDEXED UNDER 43)
* 9f101SOE X SP 361 43All APPLICAT!Ofl or ERS-1 IMAGES FOR FORSET DAMAGE ASSESSMENT( JAllUARY 1994 lCIOLKOSZ A., ZAWfLA NIEDZWIECKI T. 8 BOCHENEK Z.ESA SP-361 II P 4S3 VOL. l
PAPER Ill PROC. or TllE 'SECOND ERS-1 SYMPOSIUM: SPACE AT THE SERVICEor OUR ENVIROllMDIT'' PROCEEDINGS OF A SYMPOSIUM HELO IN HAMBURG,GERMANY, 11-l'• OCTOBER 1993 CINOEXED UllOER 43>
* 9f10151E X SP :'>61 'i3l CHARAC!ERISATJOll OF AUSTRALIAN VEGETATION TYPES USING ERS-1 SAR
( JAtlUARY 1994)MIINE AK.
3 ESA SP-361 II P 459 VOL.
PAPER Ill PROC. or THE 'SECOllO ERS-1 SYMPOSIUM: SPACE AT TllE SERVICEOF OUR ENVIRONHFIH', PROCEEDillGS OF A SYMPOSIUM HELO IN HAMBURG,GFRMAtlY, 11-l'• OCTOBER 1993 CillOEXEO UNDER 43)
* 94015ZE X SP 361 43SAR OBSERVATIOllS MIO BACKSCATTER MODELL ING OF AUSTRALIAN NATIVEFORESfS !JANUARY 1994)RICHARDS J.A., DONG Y & CASHMAN J DESA SP-361 II P 463 VOL. l
PAPER IN PROC or fllE 'SECOND ERS-1 SYMPOSIUM: SPACE AT rut SERVICEor OUR ENVIROlll1FllT'' PROCEEDillGS or A SYMPOSIUM HELD !ti IMMRURG,GERMANY, 11-1" OCTOBER 1993 !INDEXED UtlDER 43)
* 940153E X SP 361 43
SCOPE MID rIRS! RESULTS OF ERS-1 PILOT PROJECT TRULi: TROPICALRAHi FOREST AllD llSE OF LAND INVESTIGATION !JANUARY 1994)SIEGERT F., WAtlll!llGER A. 8 FUCllS UESA SP-361 II P "69 VOL
PAPER Ill PROC or THE 'SECOND ERS-1 SYMPOSIUM: SPACE AT THE SERVICEOF OUR ENVIRONMENT', PROCEEDINGS OF A SYMPOSIUM HELD IN HAMBURG,GERMANY, 11- l'• OCTOBER 1993 (INDEXED UNDER 43 l
* 9ft0154E X SP 361 43ERS-1 S/\R I NTERrEROMETRY OVER FORESTED TERRAIN CJANUARY 1994)ULMIOER L M II HAGBERG J. 0. 8 J ASKNEES/\ SP-361 I I P r,75 VOL.
PAPER Ill PROC OF THE 'SECOND ERS-1 SYMPOSIUM: SPACE AT THE SERVICEOF OUR ENVIROllMENT', PROCEEDINGS OF A SYMPOSIUM HELD IN HAMBURG,GERMANY, 11-14 OCTOBER 1993 (INDEXED UNDER 43 J
* 9f10155E X SP 361 lf3TROPICAL RA!lffOREST INVESTIGATION IN BRAZIL USING ERS-1 SAR DATA( J/\NUJ\RY !1;19/f)KEIL M., WINTFR R 8 HONSCH H.ESA SP-361 II P '•Bl VOL I
PAPER Ill PROC. or TllE 'SECOND ERS-1 SYMPOSIUM: SPACE AT THE SERVICEOF OUR ENVIROllMEllT', PROCEEDINGS OF A SYMPOSIUM HELD IN HAMBURG,GERMANY, 11-1"+ OCTOBER 1993 <INDEXED UNDER 43)
* 9'+0156E X SP 361 43l OCEMIOGRAPHIC RESULTS FROM ANALYSIS OF ERS-1 ALTIMETRY
! JANUARY 1994 lTAPLEY B.O ET ALESA SP-361 // P r,99 VOL.
5 PAPER IN PROC. OF THE 'SECOND ERS-1 SYMPOSIUM: SPACE AT THE SERVICEOF OUR ENVIRONMFllT', PROCEEDINGS OF A SYMPOSIUM HELO IN HAMBURG,GERMANY, 11-14 OCTOBER 1993 !INDEXED UNDER 43)
* 940157E X SP 361 43TllE 1991-93 LOS NII/OS FROM ERS-1 ALTIMETRY !JANUARY 1994)LILLIBRIDGE J. CHENEY B 8 DOYLE N.
3 ES/\ SP-361 // P r,95 VOL
PAPER Ill PROC or rut 'SECOND ERS· l SYMPOSIUM: SPACE AT THE SERVICEOF OUR ENV!ROflMFNT', PROCEEDINGS OF A SYMPOSIUM HELD IN HAMBURG,GERMANY, 11-l'• OCTOBER 1993 (INDEXED UNDER 43)
• 940158E X SP 361I OCEAN DYNAMICS FROM THE ERS2 NAEIJE M.C. ET Al.
ESA SP-361 II P 501 VOL.
4335-DAY REPEAT MISSION !JANUARY 1994)
PAPER IN PROC OF THE 'SECOND ERS-1 SYMPOSIUM: SPACE AT THE SERVICEOF OUR ENVIROllMENT', PROCEEDINGS OF A SYMPOSIUM HELD IN HAMBURG,GERMANY, 11-14 OCTOBER 1993 (INDEXED UNDER 43 J
170
• 940159E X SP 361 43RADAR SIGNATURES OF EQUATORIAL UPWELLING REGIONS MEASURED BY THEERS-1 SCATTEROMETER (JANUARY 1994)BOEHNKE K. 8 WISMANN V.ESA SP-361 11 P 507 VOL.
PAPER IN PROC. OF THE 'SECOND ERS-1 SYMPOSIUM: SPACE AT THE SERVICEOF OUR ENVIROllMEllT', PROCEEDINGS OF A SYMPOSIUM HELD IN HAMBURG,GERMANY, 1I-14 OCTOBER 1993 CINDEXED UNDER 43 J
• 940160E X SP 361 431 SEA SURFACE HEIGHT AND ITS VARIATION FROM ERS-1 ALTIMETER DATA
!JANUARY 1994)GANEKO Y. ET AL.ESA SP-361 11 513 VOL.
PAPER IN PROC. OF THE 'SECotlD ERS-1 SYMPOSIUM: SPACE AT THE SERVICEOF OUR ENVIRONMENT', PROCEEDINGS OF A SYMPOSIUM HELD IN HAMBURG,GERMANY, 11-14 OCTOBER 1993 !INDEXED UNDER 43)
* 940161E X SP 361 43SEA LEVEL VARIATIONS IN THE TROPICAL PACIFIC DURING 1992-1993DERIVED FROM ERS-1 ALTIMETRY !JANUARY 1994)ZOU J. 8 BURKERT R.ESA SP-361 II P 519 VOL.
PAPER IN PROC. or THE 'SECOND ERS-1 SYMPOSIUM: SPACE AT THE SERVICEOF OUR ENVIROllHEllT', PROCEEDINGS OF A SYMPOSIUM HELD IN HAMBURG,GERMANY, 11-14 OCTOBER 1993 !INDEXED UNDER 43)
* 9r.0162E x sr 361 43TROPICAL PACIFIC SEA-SURFACE TEMPERATURE IN AN OCEAN GENERALCIRCULATIOll MODEL ANO AS MEASURED BY THE ATSR (JANUARY 1994)
2 MURRAY J. ET ALESA SP-361 II P 523 VOL.
PAPER !ti PROC OF TllE 'SECOND ERS-1 SYMPOSIUM: SPACE AT THE SERVICEOF OUR ENVIRONMENT', PROCEEDINGS OF A SYMPOSIUM HELD IN HAMBURG,GERMANY, 11-14 OCTOBER 1993 !INDEXED UllDER 43l
* 91f0163E X SP 43361AN INVESTIGATIOll OF INTRASEASONAL VARIABILITY IN SEA-SURFACETEMPERATURE !fl TllE TROPICAL PACIFIC USING DATA FROM THE ATSRCJANUARY 1994 lMURRAY J. ET ALESA SP-361 II P 529 VOL.
PAPER Ill PROC OF TllE 'SECOND ERS-1 SYMPOSIUM: SPACE AT THE SERVICEor OUR ENVIROllMFllT'' PROCEEDillGS OF A SYMPOSIUM HELD IN HAMBURG,GERMANY, 11-l'• OCTOBER 1993 (INDEXED UNDER 43)
• 940164E X SP 36 l 43HIGH FREQUENCY SPACE-TIME VARIABILITY OF THE GULF STREAM ANDKUROSHIO USING ERS-1 ALTIMETER DATA !JANUARY l994lMINSTER J-F. 8 GENNERO M C.ESA SP-361 II P 535 VOL.
PAPER Ill PROC. or THE 'SECOND ERS-1 SYMPOSIUM: SPACE AT THE SERVICEOF OUR ENVIRONMftlT', PROCEEDINGS OF A SYMPOSIUM MELD IN HAMBURG,GERMANY, 11-14 OCTOBER 1993 !INDEXED UNDER 43)
• 940165E X SP 361 43A STUDY ON THE IllFLOW OF ATLANTIC WATER TO THE GIN SEA USINGALTIMETER DAT/\ ( JAtW/\RY 199r•)SAMUEL P., JOHAllNESSEll J.A. 8 JOHANNESSEN O.M.ESA SP-361 II P 5''1 VOL
PAPER IN PROC. OF THE 'SECOND ERS-1 SYMPOSIUM: SPACE AT THE SERVICEOF OUR ENVIRONMENT', PROCEEDINGS OF A SYMPOSIUM HELD IN HAMBURG,GERMANY, 11-14 OCTOBER 1993 !INDEXED UNDER 43)
• 940166E X SP 361 43LARGE AND SMALL SCALE CIRCULATION SIGNATURES OF THE ERS-1 SAR OVERHIE GULF STREfl.M CJfl.NUARY 1994)BEAL R. C. ET ALESA SP-361 II 547 VOL.
PAPER IN PROC. OF THE 'SECOND ERS-1 SYMPOSIUM: SPACE AT THE SERVICEOF OUR ENVIRONMENT', PROCEEDINGS OF A SYMPOSIUM HELD IN HAMBURG,GERMANY, 11-1 rt OCTOBER 1993 (INDEXED UNDER 43)
* 9r•Ol67E X SP 361 43DYNAMICAL OCEAllOGRAPHY OF THE BRANSFIELD STRAIT CANTARCTICAJ DURINGAUSTRAL SUMMER 1992193: AN APPLI CATI Oil OF ERS-1 PRODUCTS(JANUARY I 994 lGARCIA M.A. ET AlESA SP-361 11 P 553 VOL.
PAPER !ti PROC OF THE 'SECOllD ERS-1 SYMPOSIUM: SPACE AT THE SERVICEOF OUR ENVIRONMENT', PROCEEDINGS OF A SYMPOSIUM HELD !ti HAMBURG,GERMANY, 11-l'• OCTOBER 1993 ( ItlDEXED UNDER 43)
* 94016BE X SF' 361DETECTION OF APARIAN SEA EDDY USING ERS-1 Al TIMETER DATA(JANUARY 1994 JALI M.M. 8 SHARMA R.ESA SP-361 II P 557 VOL.
5 PAPER IN PROC or THE 'SECOND ERS-1 SYMPOSIUM: SPACE AT THE SERVICEOF OUR ENVIRONMENT', PROCEEDINGS OF A SYMPOSIUM HELD IN HAMBURG,GERMANY, 11- l'• OCTOBER 1993 ! INDEXED UNDER 43 J
ESA Journal 1994 Vol. 18
* 940169E X SP 361 43DETECTION OF SURFACE CURRENT FEATURES WITH ERS-1 SAR (JANUARY 19941JOHANllESSEN J FT AL.ESA SP-361 // P 565 VOL.
PAPER IN PROC or THE 'SECOtm ERS-1 SYMPOSIUM, SPACE AT THE SERVICEOF OUR ENVIRONMFNT'' PROCEEDINGS or A SYMPOSIUM HELD IN HAMBURG,GERMANY, 11-14 OCTOBER 1993 CINDEXED UNDER 43)
* 940170E X SP 361 43USE OF ERS-1 SCATTEROMETER DATA IN NUMERICAL MODELS (JANUARY 1994)BORZELLI G. ET AlESA SP-361 // P 571 VOL.
PAPER IN PROC. or THE 'SECOND ERS -1 SVHPOS I UH' SPACE AT TlfE SERVI CEOF OUR ENV!RotlHFr/T', PROCEED!t/GS OF A SYMPOSIUM HELD IN HAMBURG,GERMANY, 11-1'+ OCTOBER 1993 CINDEXED UNDER 43l
* 940171E X SP 361 43MESOSCALE VARIABILITY REVEALED BYERS l ALTIMHFR FDC AND OPR AND ITSASSIMILATION HITO A llUMERICAL OCEAN MODEL (JANUARY 1994)IKEDA MESA SP-361 // P 577 VOL.
PAPER IN PROC. or TlfE 'SECOND ERS-1 SYMPOSIUM, SPACE AT THE SERVICEOF OUR ENVIROllHENT', PROCEED!t/GS OF A SYMPOSIUM HELD IN HAMBURG,GERMANY, 11-14 OCTOBER 1993 (INDEXED UNDER 43)
* 940172E X SP 361 43HESOSCALE CIRCULATION IN THE SOUTHERN OCEAN AS OBSERVED BY SATELLITEAL TIME TRY (JANUARY 1994 lSNAITH H.M.
3 ESA SP-361 // P 581 VOL.
PAPER IN PROC. OF THE 'SECOND ERS-1 SYMPOSIUM, SPACE AT THE SERVICEOF OUR ENVIRONMENT', PROCEEDINGS OF A SYMPOSIUM HELD IN HAMBURG,GERMANY, 11-14 OCTOBER 1993 <INDEXED UNDER 43l
• 940173E X SP 361 43l A SIGNAL FROM Tiff SOUTHERN OCEAN, DETECTABLE BY ALTIHETRY
CJANUARY 1994 lHUGHES C.W., VASSIE J.HESA SP-361 // P 587 VOL
SHI THSON M J.
PAPER HI PROC nr TH[ 'SECOND FRS-1 SYMPOSIUM: SPACE AT THE SERVICEOF OUR ENVIRotlMFllT', PROCEEDINGS OF A SYMPOSIUM HFLD IN llAMBURG,GERMANY, 11-lff Or:TORER 1993 <INDEXED IJfWER 43l
•940174EXSP 361 43l THE SUITABILITY OF ERS-1 RADAR ALTIHFTER DATA roR OCEAtlOGRAPHIC AND
GEODETIC APPLI CAT r nus FOR THE BALTIC SEA (JANUARY 1994 lz METZNER M.' GRArAREtm E w 8 DICK s3 FSA SP-361 II P 591 VOL. 1
5 PAPER IN PROC nr THE 'SECOND ERS-1 SYMPOSIUM: SPACE AT TtfE SERVICEOF OUR ENVIRONMENT'' PROCEEDUIGS or A SYMPOSIIJH HELD rn HAMBURG,GERMANY, 11-14 OCTOBF.R 1993 <INDEXED UNDER f+3)
• 94017Sf x srl DETERMiflATiotl or FRS-1 'S SFl\-ST/\TF BI/\S fROM ItlST/\UCES OF RAPID
CHl\NGE TU WAVE HFIGHT CJMWARY 199'1)z SROKOSZ M. A 8 nuAR II y G D.3 ESA SP-361 // P r:,97 VOL
PAPER JN PROC nr THE 'SECOt/O ERS-1 SYMPOSIUM· SPACE AT TllE SERVICEOF OUR FNVIRotlHFtiT I' PROCEFDIUGS or I\ SYHPOSJllM JffLD HI HAMBURG,GERMAtlY, 11- Jf+ OCTOBER 1993 CltlDEXFD UllOFR 43 l
* 9'tOl 76E X SP 36 l r,3llEIGHTillG rROH STFREOSCOPIC ERS l DATA (JAllUARY 1994)DOWMAN, I .J. ET AL
3 ESA SP-361 II P 609 VOL
s PAPER IN PROC. or TllE 'SECOtlD ERS-1 SYMPOSIUM, SPACE AT TllE SERVICEor OUR ENVIRotlM[tiT'' PROCEEDINGS or I\ SYMPOSTlJM tlELD Ifj H/\MRURG,GERMANY, 11-1'+ OCTOBER 1993 (INDEXED UtlnER '+.>l
*' 9'+0177E X SP 36 l 43I LAtm COVF.R CHMIGF DETfCTION WITHERS I D/\T/\ /\trn DATA FROM OHIER
REMOTE SENSING SAIFI I !TES EXAMPLE' TllE DEL TA or THE RIVER EBRO(SPAIN} CJJ\tllJARY 199'1)
Z llARMS J 8 ART77A r3 FSA SP-361 II P 6JS VOL.
c; PAPER IN PROC. or HIE 'SECOUD ERS-l SYMPOSIUM· srACE AT TllF SERVICEOF OUR FNVIRotlHFtlT', PROCEFDillGS OF A SYMPOSIUM HELD Ill HAMBURG,GERMANY, 11·1'+ OCTOBER 1993 (INDEXED UNDER '•3l
• 9fi017BE X SP 361 43l FRS-I SAR AND OPTICAL DATA FOR I /\UO USE/I /\NO COVER MAPPING: A CASE
STUDY Ill A SAVAtltlAlt lOllE OF GUINEA (.JANUARY 199'+)OALLEHAND J F ET AlESA SP-361 // P 617 VOL.
PAPER IN PROC. or THE 'SECOND ERS-1 SYMPOSIUM, SPACE AT THE SERVICEOF OUR ENVJRONHEllT', PROCEEDINGS OF A SYMPOSIUM HELD Ill HAMBURG,GERMANY, 11-14 OCTOBER 1993 CINDEXED UNDER 43)
• 940179E X SP 43IMAGES AND ITS IMPLICATIONS
361I THE STRUCTURAi cour tu r OF ERS
(JANUARY 1994)Z QUEGAN S., CAVES R.G.3 ESA SP-361 // P 623 VOL.
WHITE .G.
PAPER IN PROC. or THE 'SECOND ERS-1 SYMPOSIUM, SPACE AT THE SERVICEOF OUR ENVIROHMEllT', PROCEEDINGS OF A SYMPOSIUM HELD IN HAMBURG,GERMANY, 11-14 OCTOBER 1993 CINDEXED UNDER 431
ESA Journal 1994. Vol. 18
'If 940lBOE X SP 361 43MOSAIC ING AtlD Cl ASS !FICA Tl ON FOR THE RADARMAP GERMANY (JANUARY 1994 lKOSMANN D ET ALESA SP-361 // P 629 VOL
PAPER IN PROC. OF THE 'SECOND ERS-1 SYMPOSIUM, SPACE AT THE SERVICEOF OUR Et/VJRONMFIH', PROCEEDHIGS OF A SYMPOSIUM HELD IN HAMBURG,GERMANY, 11-14 OCTOBER 1993 CINDEXED UNDER 43 J
"" 9'10l8IE X SP 361 43lt!Gll RESOLUTlotl OETECTIOtl AND MONITORillG OF CltAtlGFS USING ERS-1TIME SERIES (JANUARY 1994)KATTENBORN G. ET Al.ESA SP-361 // P 635 VOL.
PAPER IN PROC or THE 'SECOND ERS-1 SYMPOSIUM, SPACE AT THE SERVICEOF OUR ENVIROtlHFNI', PROCEEDINGS OF A SYMPOSIUM HFI D IN HAMBURG,GERHAllY, 11-14 OCJOBER 1993 (INDEXED UNDER 431
• 940l82E X SP 361 43THE OEEPE/GEOSAR TEST OF GEOCODING ERS-1 DATA BACKGROUND AND STATUS(JANUARY l994 lDOWHAN I.ESA SP-361 // 643 VOL.
PAPER IN PROC or THE 'SECOND ERS-1 SYMPOSIUM, SPACE AT Tl!E SERVICEOF OUR FNV!RotlHFllT', PROCEEDINGS OF A SYMPOSIUM llfl 0 IN HAMBURG,GFRMANY, 11-1'+ OCTOBER 1993 CINDEXEO llllOFR 43)
'If 940183E X SP ~61 43FOREST AND CROP MONITORING, EXPERIEllCES WITH ERS-1 Itl BELGIUMCJANUARY 1994 lDF ROOVER B. P. E. , OE HUI DER S. C & GOOSSENS R EFSA SP-361 II
PAPER Ill PROC or THE 'SECOND FRS-1 SYMPOSIUM, SPACE AT TllE SERVICEor OUR ENVIROtlMFtlT'' PROCEEDINGS OF A SYMPOSIUM HELD IN HAMBURG,GERMANY, 11-1'+ OCTOBER 1993 <INDEXED UNDER 43)
• 940184E X SP 361 43GEOCODHIG SPOT PRODUCTS WITH ERS-1 SAR GEOMETRY CJANUARY 1994)RENOUARD L & PERLANT F.ESA SP-361 // P 653 VOL.
PAPER IN PROC. or THE 'SECOND ERS-1 SYMPOSIUM, SPACE AT TlfE SERVICEor OUR ENVIRONMENT'' PROCEEDINGS OF A SYMPOSIUM HELD IN HAMBURG,GERMANY, 11-14 OCTOBER 1993 CINDEXED UNDER 43)
• 9f10IASE x sr .Hd 43OPERATIONAL USE or FRS-1 SAR DATA TO MOtl!TOR SFA ICE CONOITIONS INTiff GULF or ST I f\WRF.tlCE (J/\tHJARY 199(1)
2 SJIOKR M , RAMSAY R. 8 F/\l.K INGJlf\M J C3 FSI\ sr 361 // r f.6.l., VOl
PAPFR Ill PROr or TllF 'SECOllD FRS~I SYt1POSIUH, SPACF AT TllF SERVICEor OUR FNVJROtlMrtn.' PROCFFOitms OF f\ SYMPOSIUM llFI Tl IN til\MBURG,GFRMfdlY, II l'• nr:TORER 199.~ ( INOEXFD \JNTlFR 43)
• 9't0186E X SP )r, 1 r,3l COASTWATCll SAR APPi !CATIONS DFMotlSTRAI Intl
CJ/\tlU/\RY 199'+)2 PJCllEI W. FT Al3 FSA SP-361 // r 669 VOL
DEVFI OPMFNT PHASE
PAPFR JU rRor: or Tiff 'SECOtrn FRS I SYMPOSIUM· SPACf f\T Tiff SERVICEor OUR FtlVIRotH1FtlT I. PROCEFOHIGS or I\ SYMPOSIUM Ifft 0 Jtj HAMBURG,GFRMJ\tlY, 1I-}f1 nr:toRER 1993 (JtHJEXF.n lJNDFR 43)
• 9r1nt87E x sr ::H.i '+3GRFAI I AKES SAR t r.r RFSEARCll APPIICAT!OtlS OEMOllSTRA!Iotl CJAtlUARY 19941
? t.FSJIKEVJC\l G , rTr:JlFt W.3 FSA SP 361 // P 67S VOi
Cl FMFtHE-rOI ori r .
5 P/\PFR Itl PROC or TllF 'SECOND FRS-1 SYMrOSJUH Sr/HT /\T TllF SFRVICEOF OUR ftNIROtlMrt/1'' PROCEFOHIGS OF I\ SYHroSIUM ur t n IN HAMBURG,GFRM/\tN, II Jf1 nr:TOBFR 199.) (JtHJFXEO tmnrR '+3)
• 9'10lAAF x sr ."it'll r,3l Rflil TIME ICF MotlITORING HI TllF Rf\LTJr SF/\ (J/\tHJf\RY 1994J2 HFRLMID F A3 FSA SP-361 II P liAI VOL
5 rArrR Itl PRO[ or THF 'SFCONO FRS-1 SYMrOSIUM· SPl\rr /\T TllF SFRVICEor OIJR EllVIROtlHfllT'' PROCEEDINGS or A SYMPOSIUM Itri n IN HAMBURG,GFPM/\"Y, 11 1'1 OCTOHFR 199.~ c runr xr n lltlnFR 43)
• 9'10189F. X SP H.t r,3USF OF THE SPF(TRAt SltirT IN SAR ItlTFRrrROHETRY (.JAIHIARY 199f,JPRATI c 8 Rocrl\ r
3 FSA SP-361 // P 691 VOi
s PAPER Ill PROf' or fllF 'SECotlD FRS-1 SYMPOSIUM, SPAfE AT TllF SERVICEor OUR FtlVJROtltfftll.' PROCFFD!tlGS OF A SYHPOSJllH ltFI 0 Ill ltAMBURG,GFRMl\tlY, II I'• or:TOBFR 199.~ CINDFXED UtrnFR 43)
* 9'10190E x sr 43INrORHATIOU EXTRl\CTIOtl FROH ERS-1 SAR 01\TA BY HFMlS OF INSl\R l\UDD~JtlSAR TECllll! OllES Ill AtlT ARCT JC RESFARCll CJANUARY 1994 l
2 HARTL PH , TllIH K~H. & WU X.FSA SP-361 // P 697 VOL
PAPFR !ti PROC or THE 'SECOND ERS-1 SYMPOSIUM, SPACF AT THE SERVICEor OUR ENVIROtlMFUT'' PROCEEDINGS OF A SYMPOSIUM llEl D ltl HAMBURG,GERMM,Y, ll-lf1 OCTOBER 1993 CltmEXED UNOfR 43)
171
• 940191E X SP 4336 l
VALIDATION OF FRS-1 INTERFEROMETRY AT CNES (JANUARY 1994)
MASSOtlET D.
ESA SP-361 // P 703 VOL.
PAPER IN PROC. or THE 'SECOND ERS-1 SYMPOSIUM· SPACE AT THE SERVICE
OF OUR ENVIRONMEIH', PROCEEDINGS OF A SYMPOSIUM HELD IN HAMBURG,
GERMAIN, i r-r« OCTOBER 1993 C!NDEXED UNDER 43l
* 940192E X SP 361 43DERIVATION OF TERRAIN SLOPE FROM SAR INTERFEROMETRIC PHASE GRADIENT(JANUARY 1994 lWEGMULLER U., WFRNER C ;. 8 ROSEN P.A.ESA SP- 361 I I P 71 l VOL. 2
PAPER IN PROC or TllE 'SECOND ERS-1 SYMPOSIUM. SPACE AT THE SERVICEOF OUR ENV I RONMFIH' , PROCEEDINGS OF A SYMPOSIUM HELD IN HAMBURG,GERMANY, 11-14 OCTOBER 1993 (INDEXED UNDER 43l
• 940193E X SP 361 43PRACTICAL APPLICATION OF SAR INTERFEROMETRY, EXPERIEllCES MADE BYTHE INSTITUTE or tlAV!GAT!ON ( JAtlUARY 1994)HARTL Ptl ET Al.ESA SP-361 II P 717 VOL
PAPER IN PROC. OF THE 'SECOND ERS-1 SYMPOSIUM, SPACE AT TllE SERVICEOF OUR ENVIROllMFllT', PROCEEDINGS OF A SYMPOSIUM llELD HI HAMBURG,GERMANY, ll-14 OCTOBER 1993 (INDEXED UtlDER 43l
* 940194E X SP 361 43APPLICATIONS OF INTERFEROMETRICALLY DERIVED TERRAIN SLOPES•NORMALIZATION or SAR BACKSCATTER AND THE INTERFEROMETRIC CORRELATIONCOEFFICIENT CJAllUARY 1994)WERNER C.l. WEGMULLER U. 8 SMALL O.l.ESA SP-361 // P 723 VOL. 2
PAPER IN PROC or THE 'SECOND ERS-1 SYMPOSIUM. SPACE AT rnE SERVICEOF OUR ENVIROllMFllT', PROCEEDINGS OF A SYMPOSIUM llELO IN HAMBURG,GERMANY, ll-1'• OCTOBER 1993 (INDEXED UNDER 't3l
* 940l95E X SP 361 43I SAR INTERFEROMETRY, EXPERIENCES WITH VARIOUS PttASE UNWRAPPING
METtlOOS CJAllUARY 199'•)HARTL P. 8 XJAOQING WUESA SP- 361 // P 777 VOL.
PAPER IN PROC. or TllE 'SECOND ERS-1 SYMPOSIUM· SPACE AT THE SERVICEOF OUR ENV!ROllMFtH.' PROCEEDINGS or A SYMPOSIUM HELD IN HAMBURG,GERMANY, 11-14 OCTOBER 1993 (INDEXED UNDER 43)
• 940196E X SP 361 43TllE ORBIT DETERMltlATJON ACCURACY OF THE ERS-1 MISSION <JANUARY 1994)SCtlARROO R, WAKKER K. F. 8 METS G. J.ESA SP-361 // P 735 VOL. 2
PAPER IN PROC. OF THE 'SECOND ERS-1 SYMPOSIUM, SPACE AT THE SERVICEOF OUR ENVIRONMENT', PROCEEDINGS OF A SYMPOSIUM HELD IN HAMBURG,GERMANY, ll-14 OCTOBER 1993 CINDEXED UNDER 43l
* 9'10l 97E x sr 361 43ERS-1 ORRIT Cf\ICUU'\TION WITH TllE GEOS/\T sorTWl\RE (JANU/\RY 1994)AKSllES II ET AlES/\ sr- 361 // r 7'*1 VOL.
5 P1°\PER H' PROr: nr TllE 'SECOND FRS-1 SYMPOSIUM· SPACE f\T THE SERVICEor OUR ENVIROllMFtll.' PROCEfDltlGS OF A SYMPOSIUM HELD IN HAMBURG,GFRMAllY, 11-l'o OCTORFR 1993 CTIWFXEO UIWFR 't3l
* 9f10I 98E x sr ''>I '•3I PRECISF ORBIT MIA\ YSIS AllD GLORAt VERIFTrATIOll RESULTS FROM ERS-1
1\1_ TI ME TRY ( Jl\NlJl\RY 199(•)2 SHUM C K. ET Al3 ES/\ sr ·'61 ;; r 7r,7 voi..
5 PAPFR Ill PROC or TllE 'SECOND FRS-1 SYMrOSIUM. SPACE AT THE SERVICEor OUR ftlVIROIUffttT.' PROCEfDillGS or A SYMPOSIUM llELD Ill HAMBURG,GF.RH/\NY, 11-lfi nr:TORFR 1993 (JNOF.XEil UNDER f13)
* 9r10199E X SP .'61 43!MrROVE11FNT or RADIAL POSITIOtlING OF ERS-1 TllROUGll DllAL CROSSOVER/\tl/\l.YSIS WIHI r nr r x POSEIOON (Jl\tnl/\RY 199(!)CARNOCtlAtl S FT Al
3 FSI\ SP-361 II P 7S3 VOL
5 PArFR Jtl PROC or TllE 'SECOND ERS-1 SYMrOSIUM. srACE AT TllE SERVICEor OUR FNVTROllMFNT.' PROCEEDINGS OF A SYMPOSIUM llELO IN HAMBURG,GFRMAllY, 11-i'o OCTOBER 1993 CINDFXED llNOER 't3l
• 9ft0200E X SPREDUCI NG ERS-
36] 43ORRIT ERROR USING TOPEX-POSE!Dotl DATA (JANUARY 1994)
LE TRAON PY FT Al.ESA SP-361 // P 759 VOL
PAPFR IN PROC or TllE • SECOND ERS-1 SYMPOSIUM' SPACE AT THE SERVICEOF OUR ENVIRONMrtlf', PROCEEDINGS OF I\ SYMPOSIUM tlELD IN H/\MBURG,GERMl\NY, 11 lf1 nr:TOBF.R 1993 <INDEXEfl l/NDER f+3)
* 9t10ZOlE X SPERS-1 ORBIT ltffORMl\TION PROVIflFD RY 0-Pl\F (Jl\NUl\RY 199ftJMASSMANN F-11 FT At.
3 FS/\ SP 361 // r 7fi5 VOL.
5 rArER Ill PROC or THE 'SECotrn FRS-1 SYJWOSIUM. SPACE AT THE SERVICEor OUR FNVIROtlf!FllT'' PROCEEDINGS OF A SYMPOSIUM llELD Ill HAMBURG,GERMAtlY, 11-1'• rlrTOBER 1993 CIIWFXED UNDER 43l
172
* 940202E X SP 361 43IMPROVEMENT OF GLOBAL GRAVITY FIELD MODELLING FOR ERS-1(JANUARY l 994 lSCHWINTZER P. ET Al.ESA SP-361 // P 771 VOL.
PAPER IN PROC. OF THE 'SECOND ERS-1 SYMPOSIUM, SPACE AT THE SERVICEOF OUR ENVIROllMEtlT', PROCEEDINGS OF A SYMPOSIUM HELD IN HAMBURG,GERMANY, ll-14 OCTOBER 1993 (INDEXED UNDER 43)
* 940203E X SP 361 43AERODYNAMIC FORCE REFINEMENT TO ERS-1 ORBITS USING ALONG-TRACKACCELERATIOtlS FROM DORIS ON SPOT-2 (JANUARY 1994)EHLERS S. 8 MOORE P.ESA SP-361 II P 777 VOL.
PAPER IN PROC. or THE 'SECOND ERS-1 SYMPOSIUM. SPACE AT TllE SERVICEOF OUR ENVIROllMFtlT', PROCEEDINGS OF A SYMPOSIUM HELD IN HAMBURG,GERMANY, ll-14 OCTOBER 1993 CINDEXED UNDER 43)
* 940204E X SP 361 43D-PAF SEA SURFACE MODELS GENERATED FROM DIFFERENT DATA SOURCES(JANUARY 1994>AtlZENtlOFER M. , GRUBER T.ESA SP-361 // P 783 VOL.
REtlTSCH M.
PAPER IN PROC. or THE 'SECOND ERS-1 SYMPOSIUM. SPACE AT TllE SERVICEOF OUR ENVIRONMENT', PROCEEDINGS OF A SYMPOSIUM HELD IN HAMBURG,GERMANY, 11-14 OCTOBER 1993 CINDEXED UNDER 43)
* 940205E X SP 36 l 43M SUBSCRIPT 2 AllO S SUBSCRIPT 2 OCEAN TIDE MODELS FOR TllE NORTHATLANTIC AND OCEAll ADJACENT SEAS FROM ERS-1 ALTIMETRY (JANUARY 1994)ANDERSEN 0. B.ESA SP-361 // P 789 VOL.
PAPER IN PROC. or rnE 'SECOND ERS-1 SYMPOSIUM. SPACE AT THE SERVICEOF OUR EllVIRONMFNT', PROCEEDINGS OF A SYMPOSIUM HELD IN HAMBURG,GERMANY, l l-14 OCTOBER 1993 (INDEXED UNDER 43 l
* 940206E X SP 43361DETECTION OF RAJtl CELLS IN ALTIMETER RETURNS (JANUARY 1994)QUARTLY G.D., GUYMER T. H. 8 LAX ON S. W.ESA SP-361 // P 799 VOL. 2
PAPER IN PROC. OF TllE 'SECOllD ERS-1 SYMPOSIUM, SPACE AT TllE SERVICEOF OUR EtlVIROllMFllT', PROCEEDitlGS OF A SYMPOSilJM HELD IN HAMBURG,GERMANY, ll-14 OCTOBER 1993 CINDEXED UNDER 43!
• 940207E X SP 361 43DETERMINATION or WIND SPEED' WIND DIRECTION AND ATMOSPHERIC STRUCTUREUSING ERS-1 SAR DATA DURING NORCSEX'9l (JANUARY 1994)SllUCllMAN R. ET Al.ESA SP-361 // P 805 VOL.
PAPER !ti PROC. or THE 'SECOND ERS-1 SYMPOSIUM. SPACE AT THE SERVICEOF OUR ENVIROllMEtlT', PROCEEDINGS OF A SYMPOSIUM HELD IN HAMBURG,GERMANY, 11- l'o OCTOBER 1993 (INDEXED UNDER 43)
* 940208E X SP 36 l 43I HIGll LATITUDE MESOSCALE ATMOSPHERIC CIRCULATION FEATURES OBSERVED
WITH TllE ERS-1 SCATTEROMETER <JANUARY 1994)LACHLAN-COPE T.A. ET Al.ESA SP-361 // P 809 VOL.
PAPER IN PROC. OF THE 'SECOND ERS-1 SYMPOSIUM, SPACE AT THE SERVICEOF OUR ENVIRONMENT', PROCEEDitlGS OF A SYMPOSIUM HELD IN HAMBURG,GERMANY, ll-14 OCTOBER 1993 C!NDEXED UNDER 43l
* 91f0209E X SP 361 43EXAMPLES OF MFSOSCALE METEOROLOGY IN THE MEDITERRANEAN SEA USINGERS-1 SCATTEROHETER DATA (JANUARY 1994)ZECCHETTO S R RORTOLETTO M.
3 ESA SP-361 // P RlS VOL. 2
PAPER IN PROC or THE 'SECOND ERS-1 SYMPOSIUM. SPACE AT THE SERVICEOF OUR ENVJROllMFNT', PROCEEDINGS OF A SYMPOSIUM HELD IN HAMBURG,GERMANY, ll-l'• OCTOBER 1993 <INDEXED UNDER 't3l
* 9f10210E X SP 361 r,3WATER VAPOUR RETRIEVALS USING COMRINED ATSR ItlFRARED AllD MICROWAVEDATA <JANUARY 1994)BARTON I .J. ET AlESA SP-361 // P Rl9 VOL.
PAPER Ill PROC. OF TllE 'SECOllD ERS-1 SYMPOSIUM, SPACE AT THE SERVICEor OUR ENVIROllHENT'' PROCEEDINGS OF A SYMPOSIUM HELO IN HAMBURG,GERMANY, 11-14 OCTOBER 1993 (INDEXED UNDER '•3l
* 9(10211E x sr 361 43AtlAIYSIS OF ATMOSrllFRIC LEE WAVES llEAR llOPEN <JANUARY 1994)Vl\CHON r.w .. .10111\NtlESSEN O.H. 8 .JOHl\NtlESSEN JI\.ESA SP-361 // P R75 VOL. 2
5 PAPER Ill PROC or THE -sscouo ERS-1 SYMPOSIUM. SPACE AT TllE SERVICEor OUR ENVIROllMFNT'' PROCEEDINGS OF A SYMPOSIUM HELD IN HAMBURG,GF.RHl\NY, i i -r« OCTOBER 1993 <INIJEXED UNIJF.R '•3)
• qr,0212E x sr 43361QUANTITATIVE REMOTE SENSING IN THE 11-MICRON WAVELENGHT REGION USING/\TSR (Jl\NUARY 1991f)ZAVODV A.H. ET Al
3 ESA SP-361 // P 829 VOL.4 -
PAPER IN PROC. OF THE 'SECOND ERS-1 SYMPOSIUM, SPACE AT TllE SERVICEOF OUR ENVIROllMEtlT', PROCEEDINGS OF A SYMPOSIUM HELD IN HAMBURG,GERHl\NY, 11-Ft OCTOBER 1993 <INDEXED UNOER lf3)
ESA Journal 1994 Vol. 18

* 940213E X SP 361 43ERS-1 SAR FOR MONITORING SOIL MOISTURE AND RIVER FLOODING(JANUARY 1994)BLYTH K., BIGGIN D.S. 8 RAGASESA SP-361 // P 839 VOL 2
PAPER HI PROC or THE 'SECOND ERS-1 SYMPOSIUM. SPACE AT TllE SERVICEOF OUR ENVIROtJHFtlT', PROCEEDINGS OF A SYMPOSIUM HELD IN HAMBURG,GERMANY, 11-14 OCTOBER 1993 <INDEXED UNDER 43)
* 940214E E SP 361 43USE OF ERS-1 SAR DATA FOR LAND APPLICATIONS (JANUARY 1994)BORGEAUD H. ET AL.ESA SP-361 // P 8'+5 VOL.
PAPER IN PROC OF THE 'SECOND ERS-1 SYMPOSIUM, SPACE AT THE SERVICEOF OUR ENVIRONMENT', PROCEEDINGS OF A SYMPOSIUM HELD IN HAMBURG,GERMANY, 11-14 OCTOBER 199 3 (INDEXED UNDER 43)
* 940215E X SP 361 43DETECTING SURFACE ROUGHNESS AND MOISTURE VARIATIONS IN DESERTS(JANUARY l994)CUDLIP W. ET ALESA SP-361 // P 849 VOL.
PAPER IN PROC. OF THE 'SECOND ERS-1 SYMPOSIUM, SPACE AT THE SERVICEOF OUR ENVIRONMENT', PROCEEDINGS OF A SYMPOSIUM HELD IN HAMBURG,GERMANY, 11-1 '+ OCTOBER 1993 (INDEXED UNDER 43)
* 940216E X SP 361 43SOIL MOISTURE ESTIMATION USING ERS-1 SAR DATA (JANUARY 1994)VENKATARATNAM L. ET AL.ESA SP-361 // P 855 VOL.
PAPER HI PROC OF THE 'SECOND ERS-1 SYMPOSIUM, SPACE AT THE SERVICEOF OUR ENVIROf/HENT', PROCEEDINGS OF A SYMPOSIUM HELD IN HAMBURG,GERMANY, 11-Jf• OCTOBER 1993 <INDEXED UNDER 43)
* 94021 ?E X SP 361 '+3CORRELATION BETWEEN SOIL MOISTURE AND THE BACKSCATTERING COEFFICIENTOF ERS-1 DAH <JANUARY 199'+)
2 ROMBACH M., DEHIRCAN A. 8 MAUSER W.ESA SP-361 // P 861 VOL. 2
PAPER IN PROC. OF THE 'SECOND ERS-1 SYMPOSIUM, SPACE AT THE SERVICEOF OUR ENVIRONMEllT', PROCEEDINGS OF A SYMPOSIUM HELD IN HAMBURG,GERMANY, 11-14 OCTOBER 1993 (INDEXED UNDER 43)
* 940218E X SP 361 43SOIL MOISTURE BASED ON ERS-1 SAR DATA FOR BIOMASS ASSESSEMENT(JANUARY 1994)DABROWSKA-ZIELINSKA K. ET AL.ESA SP-361 // P 865 VOL.
5 PAPER IN PROC. OF THE 'SECOND ERS-1 SYMPOSIUM: SPACE /\T THE SERVICEOF OUR ENVIRotlHENT', PROCEEDINGS OF A SYMPOSIUM HELD H~HAMBURG,GERMANY, 11-1 r, OCTOBER 1993 (INDEXED UNDER '•'J
* 940219E X SP 361 43DONNEES HULTI-TEMPORELLES SAR ERS-1 POUR UNE ETUDE ENV!RONNEMENTALE,RECHERCllE DE LA HESURE D'UN PARAMETRE D'HUMIDITE DES SOLS EN ALSACE,FRANCE (JANUARY 1994)FELLAH K ET ALESA SP-361 // P 869 VOL
PAPER IN PROC OF THE 'SECOND ERS-1 SYMPOSIUM, SPACE AT THE SERVICEOF OUR ENV!RotlHENT', PROCEEDINGS OF A SYMPOSIUM HELD IN HAMBURG,GERMANY, 11-14 OCTOBER 1993 (INDEXED UNDER 43)
* 940220E X SP 361 43SOIL MOISTURE ESTIMATION USING ERS-1 SAR DATA (JANUARY 1994)MOHAN S. ET AL.ESA SP-361 II P 875 VOL.
PAPER IN PROC. OF THE 'SECOND ERS-1 SYMPOSIUM, SPACE AT THE SERVICEOF OUR ENVIRONMENT', PROCEEDINGS OF A SYMPOSIUM HELD IN HAMBURG,GERMANY, 11-14 OCTOBER 1993 <INDEXED UNDER 43)
* 940221E X SP 361 '+3I REG!ONALIZAT!OtJ or SOIL PHYSICAL PARAMETERS USHIG ERS-1 PR! SAR DATA
(JANUARY 1994)
V. PONCET F. ET AL3 ESA SP-361 // P R79 VOL.
* 9r,ozZ4E X SP 361 43ERS'S SAR, AN AID FOR GEOLOGICAL HAPPING AND MINERAL EXPLORATIONIN RAIN FOREST AREAS (JANUARY 1994)DEROIN J-P. ET AL.ESA SP-361 II P 897 VOL.
PAPER HI PROC. OF THE 'SECOND ERS-1 SYMPOSIUM, SPACE AT TllE SERVICEor OUR ENVIRONMFllT'' PROCEEDINGS or A SYMPOS!llM HELD IN HAMBURG,GERMANY, II-I'• OCTOBER 1993 <INDEXED UNDER 43)
* 940225E X SP 361 43GEOECOLOGICAL HIVEST!GATIONS ON LANDSCAPE DEGRADATION IN S.E.PATAGOllIA WITll ERS-1 SAR DATA <JANUARY 19941END LI CHER W. R HOPPE P.ESA SP-361 II P 003 VOL.
PAPER IN PROC or THE 'SECOND ERS-1 SYMPOSIUM, SPACE AT TllE SERVICEOF OUR ENV!RotlMftlT', PROCEEDINGS OF A SYMPOSIUM HELD IN HAMBURG,GERMANY, 11-14 OCTOBER 1993 <INDEXED UNDER 43)
Jf 940226E X SP 361 43APPLICATION OF ERS-1 AND OPTICAL DATA FOR HAPPING OF GEOLOGICALFEATURES IN ARGENTINA (JANUARY 1094)MEHL II., MILLER H. 8 REIMER W.ESA SP-361 II P 907 VOL.
PAPER IN PROC or THE 'SECOND ERS-1 SYMPOSIUM. SPACE AT THE SERVICEOF OUR ENV I RONMEllT' , PROCEEDINGS OF A SYMPOSIUM llEL D IN HAMBURG,GERMANY, 11-14 OCTOBER 1993 ( ltlDEXED UNDER 43)
* 9<10227E X SP 361 43ERS-1 SAR OBSFRVAT ION OF SALT CRUST DEVEL OPHENT IN SOUTHERN TUN! SI A<JANUARY 1994)Ml LL ING TON A C .. WADGE G. R ARCHER DESA SP-361 // P 911 VOL
5 P/\PER IN PROC or THE 'SECOND ERS-1 SYMPOSIUM: SPACE AT THE SERVICE
or OUR ENVIROllMEllT'' PROCEEDINGS OF A SYMPOSIUM HELD IN HAMBURG,GERMAllY, 11-14 OCTOBER 1993 <INDEXED UNDER 43)
• 940228E X SP 361 43MARINE TERRACES IN PATAGONIA AND THEIR VISUALIZATION IN SATELLITEIMAGES <JANUARY 1994)SCHWAN H. ET ALESA SP-361 // P 917 VOL.
PAPER IN PROC OF THE 'SECOND ERS-1 SYMPOSIUM, SPACE AT THE SERVICEOF OUR ENVIRONMENT', PROCEEDINGS OF A SYMPOSIUM HELD IN HAMBURG,GERMANY, 11-14 OCTOBER 1993 C!NOEXED UNDER 43)
* 940229E X SP 361 '+3GEOMORPHIC OBJECTS DETECTED RY ERS-1 SAR JM/\GES IN DIFFERENTGEOOYNAHIC CONTFXTS C JANUARY 199t, lCHOROWICZ J ET ALESA SP-361 // P 923 VOL
PAPER HI PROC or THE • SECOND ERS - I SYMPOSIUM' SPACE AT THE SERVI CEOF OUR ENVIROllHFNT', PROCEEDINGS OF A SYMPOSIUM llELD IN HAMBURG,GERMANY, ll-1'1 OCTOBER 1993 <INDEXED lHlDER 43)
* 9(+0230E X SP 361 43GEOLOGICAL POTEllTIAL OF ERS-1 SAR DATA, OBSERVATIONS IN PARTS OFARAVALLI AND TllAR DESERT <WESTERN INDIA) <JANUARY 1994)MEHTA N.S. ET AlESA SP-361 // P 031 VOL.
5 PAPER HJ PROC or THE 'SECOND ERS-1 SYMPOSIUM SP/\CE J\T THE SERVICEOF OUR ENVIRONMFllT', PROCEEDINGS OF A SYMPOSIUM HFLD IN HAMBURG,GERMANY, i i -t « OCTOBER 1993 (INDEXED UNDER 43)
* 94023IE X SP 361 43I SIGNIFICATIVITY OF WAVE LENGTH COMPUTATION USING SPATIAL
AUTOCORRE LAT I Oii TllEORY ON SAR IMAGE OF ERS-1 C JANUARY 1994)CORNET Y, COMllAIRE A-L. & OZER AES/\ SP-361 // P 9ftl VOL.
5 PAPER HI PROC or THE 'SECOND ERS-1 SYMPOSIUM· SPACE AT THE SERVICEOF OUR ENVIRONMENT', PROCEEDINGS OF A SYMPOSIUM HELD IN HAMBURG,GERMANY, 11-1'• OCTOBER 1993 <ItlDEXED UNDER 43)
• 940232E X SP 361 43
PAPER HI PROC or TllE 'SECOND ERS-1 SYMPOSIUM· SPACE AT THE SERVICEOF OUR'ENV!Rotll1UIT', PROCEEDINGS OF A SYHPOS!l/M llELD HI HAMBURG,GERMANY, 11-]r, OCTOBER 1993 CINDEXED UNDER 43)
'+ - 3 ESA SP-361 II P 045 VOL.
HAPPING OF SEA BOTTOM TOPOGRAPHY WITH ERS-1 C-BAND SAR <JANUARY 1994)VOGELZANG J ET AL.
* 9'!0222E X SP 361 r,3ON TllE RETRIEVM OF SOii MOISTURE FROM ERS-1 SAR DATA (JAllUARY 1994)LE TOAN T ET AlESA SP-361 II P 883 VOL
PAPER IN PROC or THE 'SECOND ERS-1 SYMPOSIUM SPACE AT THE SERVICEOF OUR ENVIROtJMEllT', PROCEEDHIGS OF A SYMPOS!llM HELD ltl HAMBURG,GERMANY, 11-14 OCTOBER 1993 (INDEXED UNDER 43)
* 940223E X SP 361 431 ERS-1 SAR D/\T/\ roR GEOECOLOGICAl MONITORING OF A GRASSLAND AREA
(JANUARY 1994 lPRIETZSCH C 8 GROSS H
3 ESA SP-361 // P 8R9 VOL.
PAPER IN PROC or THE 'SECOllO ERS-1 SYMPOSIUM· SPACE AT THE SERVICEOF OUR ENVIRONMF.NT', PROCEEDINGS OF A SYMPOSIUM liF.LD IN HAMBURG,GERMAllY, II-I'• OCTOBER 1993 (INDEXED UNDER 43)
ESA Journal 1994, Vol. 18
PAPER IN PROC or THE 'SECOND ERS-1 SYMPOSIUM. SPACE AT THE SERVICEOF OUR ENVIRONMENT', PROCEEDINGS OF A SYMPOSIUM HELD IN HAMBURG,GERMANY, 11-14 OCTOBER 1993 (INDEXED UNDER 43)
* 9f10233E X SP 361 r.3ERS-1 SAR !MAGFS A SLICK NEAR A SHEi F SEA FROllT IN CARDIGAN BAY
2 MATTHEWS J P , FIROWNE D P g KENNEDY F3 ES/\ SP-361 // p qr,q VOL
PAPER IN PROC nr TllE 'SECOllD FRS-1 SYMPOSIUM. SPACE AT THE SERVICEOF OUR EllVIROIHfftlT'' PROCEEDINGS or A SYMPOSIUM HELD IN HAMBURG,GERHfdN, 11-1'1 OCTOBER 1993 <INDEXED lJNDER 43)
* 9f10234E X SP :1i61 43
l ERS-1 SAR D/\Tfl !\Nl\LYSIS OF THF rREtlCH GUYANA COl\STl\L PLAIN: SOMETHEHl\TIC ASPECTS (JANUARY l99'i)RUDMH J P ET /\L
3 ESA SP-361 II P 953 VOL.
5 PAPER Itl PROC or TliE 'SECOND ERS-1 SYMPOSIUM· SPACE AT THE SERVICEor OUR ENVIRO!IMFtH'' PROCEEDINGS OF I\ SYHPOSil/H HF.ID IN HAMBURG,GERMANY, 11-1'• OCTOBER !993 (INDEXED UNDER 43)
173
* 940?.35E x sr 361 43CAPABILITIES or FRS-I SAR FOR SllOW Mrn GLACIER MONITORING INALPlllE AREAS CJANUARY 1994 JROTT IL 8 tlAGIER T.ESA SP 361 // P 965 VOL.
PAPER 111 PROC OF TllE 'SECOND ERS-1 SYMPOSIUM, SPACE AT THE SERVICEOF OUR EtNIROtlHFtlT', PROCEEDINGS OF A SYMPOSIUM llELD IN HAMBURG,GERHMN, 11-14 OCTOBER 1993 CINDEXED UNDER 43)
• 940236E X SP 43361CAPABILITIES MID LIMITATIONS OF ERS-1 SAR DATA FOR SNOW COVERDETERMINATION IN MOUNTAINOUS REGIONS CJANUARY 1994 lHAEFNER H. ET Al
3 ESA SP-361 // P 971 VOL.4 -5 PAPER IN PROC. OF THE 'SECOND ERS-1 SYMPOSIUM, SPACE AT THE SERVICE
or OUR ENVJROtlHEtlT'' PROCEEDINGS OF A SYMPOSIUM HELD IN HAMBURG,GERMANY, 11-Jt+ 01.TOBER 1993 ClNDEXEO IJNOER 43)
* 9r,0237E x SP 3fd 43I MICROWAVE REHOTF SENSING OF SNOW USING RADAR AND RADIOMETER
( JMWARY 199t,)llALLIKAJNEN H.ESA SP-361 // P 977 VOL.
PAPER Ill PROC. or THE 'SECOND ERS-1 SYMPOSIUM, SPACE AT THE SERVICEOF OUR EtlV I ROJIMEllT' , PROCEEDINGS OF A SYMPOSIUM llELD Ill HAMBURG,GERMANY, 11 I'< OCTOBER 1993 CINDEXED UNDER 43J
* 940238E X SP 361 43DETECTillG NATURAL WHITER-RELATED FEATURES USING ERS-1 SAR IMAGES
CJANUARY 1994)Z WEYDAHL D.J.
ESA SP-361 // P 983 VOL.
PAPER IN PROC. OF THE 'SECOND ERS-1 SYMPOSIUM, SPACE AT THE SERVICEOF OUR ENV I RDNHENT' , PROCEEDINGS OF A SYMPOSIUM HEL0 IN HAMBURG,GERMANY, 11-14 OCTOBER 1993 CINDEXED UNDER 43 J
• 940Z39E X SP 361 43SNOW-COVER DEVELOPMENT AS A COMPONENT OF THE LOCAL GEOSYSTEM ONPOTTER PENINSULA, KING GEORGE I SLAND, ANTARCTICA CJANUARY 1994)WUNDERLE S., GOSSMANN H. 8 SAURER H.
3 ESA SP-361 // P 987 VOL.
PAPER IN PROC or THE 'SECOND ERS-1 SYMPOSIUM, SPACE AT THE SERVICEOF OUR ENVIRONMFNT', PROCEEDINGS OF A SYMPOSIUM HELD IN HAMBURG,GERMANY, ll-1'1 OCTOBER 1993 CINDEXED UNDER 43)
* 9r,ozr+oE x sr 361 43CllARACTERISATIOll OF ERS-1 SCATTEROMETER MEASUREMENTS AND WINDRETRIEVAL CJANUARY 199'1 lSTOFFELEN A. & ANDERSON 0.ESA SP-361 // P 997 VOL. Z
PAPER !ti PROC. OF THE 'SECOND ERS-1 SYMPOSIUM, SPACE AT THE SERVICEOF OUR ENV!ROllMENT', PROCEEDINGS OF A SYMPOSIUM HELD IN HAMBURG,GERMANY, 11-14 OCTOBER 1993 CINDEXED UNDER 43)
* 940241E X SP 361 li3ERS-1 SCATTEROHETER ESTIMATES OF ANNUAL VARIATIONS OF ATLANTIC ITCZAND PACIFIC NECC (JANUARY 1994)HALPERN D., FREILICH M.H. 8 DUNBAR R.S.
3 ESA SP-361 // P 1003 VOL.
PAPER ltl PROC. or THE 'SECOND ERS-1 SYMPOSIUM, SPACE AT TllE SERVICEOF OUR ENVIROtlHFtlT', PROCEEDINGS OF A SYMPOSIUM HELD IN HAMBURG,GERHf\NY, 11-lft OCTOBER 1993 CINDEXED UNDER t+3)
• 940Z4ZE X SP 361 43IDENTIFICATION OF SEA ICE ZONES USING THE AMI-WINO, PHYSICAL BASESAND APPLICATIONS TO THE FOP AND CERSAT PROCESSING CHAINS(JANUARY 1994)CAVAN IE C. ET ALESA SP-361 // P 1009 VOL.
PAPER !ti PROC or THE 'SECOND ERS-1 SYMPOSIUM, SPACE AT THE SERVICEor OUR EtlVIRONMFtlT'' PROCEED!tlGS or A SYMPOSIUM HELD IN HAMBURG,GERMANY, II I'• OCTOBER 1993 <INDEXED UNDER 43)
* 940243E X SP 361 43SCATTEROMETER-RFTRIEVED WINDS FROM Tiff ICELAND-FAEROE AREACJANUARY 1994)ESSEN H.HESA SP-361 // P 1013 VOL.
4 -PAPER IN PROC OF THE 'SECOND ERS-1 SYMPOSIUM, SPACE AT THE SERVICEOF OUR ENVIRONMENT', PROCEEDINGS OF A SYMPOSIUM HELD IN HAMBURG,GERMANY, 11-14 OCTOBER 1993 (INDEXED UNDER 43)
• 940244E X SP 361 43MAPPING ERS-1 WIND FIELDS OVER NORTH WEST ATLANTIC USING A VARIATIONALOBJECTIVE ANALYSIS (JANUARY 1994)SIEFRIDT L. ET AL.ESA SP-361 II P 1017 VOL.
PAPER IN PROC. OF THE 'SECOND ERS-1 SYMPOSIUM, SPACE AT THE SERVICEOF OUR ENVIROtlMEtlT', PROCEEDINGS OF A SYMPOSIUM HELD IN HAMBURG,GERMANY, 11-14 OCTOBER 1993 CINDEXED UNDER 43J
174
* 940245E X SP 361 43METHOD TO DERIVE AVERAGE WIND FIELD FROM ERS-1 SCATTERDMETERMEASUREMENTS CJANUARY 1994)BEtlTAMY A. ET Al.ESA SP-361 // P 1023 VOL.
PAPER -IN PROC OF THE 'SECOND ERS-1 SYMPOSIUM, SPACE AT TllE SERVICEOF OUR ENVIROtlMHIT', PROCEEDINGS OF A SYMPOSIUM HELD IN HAMBURG,GERMANY, 11-1'• OCTOBER 1993 CINDEXED UNDER 43J
* 940246E X SP 361 43TllE VIERS-I SCATTEROMETER ALGORITHM (JANUARY 1994)JANSSEN P.A.E.M. ET AL.ESA SP-361 II P 1033 VOL.
PAPER Ill PROC. or THE 'SECOND ERS-1 SYMPOSIUM, SPACE AT TllE SERVICEOF OUR ENVIRONMENT', PROCEEDINGS OF A SYMPOSIUM HELD IN HAMBURG,GERMANY, 11-14 OCTOBER 199 3 CI NDEXED UNDER 43)
* 940Z47E X SP 43361APPLICATION OF FRS-1 35 DAY CYCLE ALTIHETRY DATA TO MEAN SEA LEVELDETERMillAT JON Ill SMALl OCEAN BAS INS CJANUARY 1994 JFENOGLIO L. & GROTEN E.ESA SP-361 // P 10'<1 VOL.
PAPER IN PROC. OF THE 'SECOND ERS-1 SYMPOSIUM, SPACE AT THE SERVICEOF OUR ENVIROtlMEtlT', PROCEEDINGS OF A SYMPOSIUM HELD !ti HAMBURG,GERMANY, 11-1'< OCTOBER 1993 CltlDEXED UNDER '•3l
* 9'10248E X SP 361 43AN Al TIMETRIC HEAN SEA SURFACE AND ITS SPECTRAL ANALYSISCJANUARY 1994 JKIM M.C., SHUM C.K. 8 TAPLEY B.D.ESA SP-361 // P 1047 VOL. 2
s PAPER IN PROC. or THE 'SECOND ERS-1 SYMPOSIUM, SPACE AT THE SERVICEOF OUR ENVIROllMENT', PROCEEDINGS OF A SYMPOSIUM llELD HI HAMBURG,GERMANY, 11-Jt, OCTOBER 1993 CINDEXED UNDER 43)
* 940Z49E X SP 361 f'3MEAN SEA SURFACE COMPUTATION FROM ERS-1 DATA (JANUARY 1994)WISSE E. ET Al.ESA SP-361 // P 1053 VOL.
PAPER IN PROC OF THE 'SECOND ERS-1 SYMPOSIUM, SPACE AT TllE SERVICEOF OUR FNVIROtlMEtlT', PROCEEDINGS OF A SYMPOSIUM llELD IN HAMBURG,GERMANY, 11-Jf• OrTOBER 1993 CItlDEXED UNDER 43)
• 940250E X SP 361 43ARCTIC GEODYNAMTCS, ARCTIC SCIENCE AND ERS-1 SATELLITE ALTIMETRYCJANUARY 1994 JANDERSON A.J. & SANDWELL 0. T.ESA SP-361 // P 1059 VOL. Z
PAPER IN PROC OF THE 'SECOND ERS-1 SYMPOSIUM, SPACE AT THE SERVICEOF OUR ENVIROtlMENT', PROCEEDINGS OF A SYMPOSIUM HELD IN HAMBURG,GERMANY, 11-1'< OCTOBER 1993 <INDEXED UNDER 43)
• 940Z51E X SP 361 43GEOID UNDULATIONS AND SEA SURFACE TOPOGRAPHY IN THE NORTH ATLANTICFROM Al TIMETER DATA (JANUARY 1994)
Z ARENT ti., HUCKELHEIM G. 8 KOCH K. R.3 ESA SP-361 // P 1065 VOL. Z
PAPER IN PROC OF THE 'SECOND ERS-1 SYMPOSIUM, SPACE AT THE SERVICEOF OUR ENVIRONMENT', PROCEEDINGS OF A SYMPOSIUM HELD IN HAMBURG,GERHAtlY, 11-14 OCTOBER 1993 CINDEXED UNDER 43)
* 940Z5ZE X SP 361 43AN ALTIMETER-DERIVED GEOID IN THE ARCTIC OCEAN, FIRST RESULTS OF THEPEGASE PROJECT CJANUARY 1994)BLANC F. ET Al.ESA SP-361 // P 1071 VOL.
5 PAPER IN PROC OF TllE 'SECOND ERS-1 SYMPOSIUM, SPACE AT THE SERVICEOF OUR ENVIRONHEtlT', PROCEEDINGS OF A SYMPOSIUM HELD IN HAMBURG,GERMANY, ll-1'1 OCTOBER 1993 CINDEXED UNDER 43)
* 940253E X SP 361 r,3SEA SURFACE TEMPERATURE AND BOUNDARY IAYER FLUXES FROM ERS-1/ATSRDATA (JANUARY 199'olMATllUR A.K., ILANllHRAYANESA SP-361 // P 1081 VOL.
& AGARWAL V .K.
PAPER IN PROC. OF THE 'SECOND ERS-1 SYMPOSIUM, SPACE AT THE SERVICEOF OUR ENVIRONMENT', PROCEEDINGS OF A SYMPOSIUM HELD ltl HAMBURG,GERMANY, 11-1 '1 OCTOBER 1993 CINDEXED UNDER 43)
• 940Z54E X SP 43361FILAMENTS AND FINE STRUCTURE OF SEA SURFACE TEMPERATURE IN ATSRIMAGE DATA (JANUARY 1994)ROBINSON I. S. ET AL.ESA SP-361 // P 1087 VOL.
5 PAPER IN PROC. OF THE 'SECOND ERS-1 SYMPOSIUM, SPACE AT THE SERVICEOF OUR ENVIRONMENT', PROCEEDINGS OF A SYMPOSIUM HELD ltl HAMBURG,GERMANY, i r-r« OCTOBER 1993 CINDEXED UNDER t+3)
* 940Z55E X SP 361AN ASSESSMENT OF TllE ACCURACY OF ATSR DUAL VIEW SEA SURFACETEMPERATURE ALGORITHMS (JANUARY 1994)THOMAS J.P. & TURNER J.ESA SP-361 // P 1093 VOL
PAPER IN PROC. or THE 'SECotrn ERS-1 SYMPOSIUM, SPACE AT THE SERVICEOF OUR ENVIRONMENT', PROCEEDINGS OF A SYMPOSIUM HELD IN HAMBURG,GERMANY, 11-14 OCTOBER 1993 CINDEXED UNDER 43)
ESA Journal 1994, Vol. 18
• 940256E X SP 43361
INTERCOMPAR!SON OF AVHRR AND ATSR DATA AND DATA PRODUCTS
CJANUARY 19941
BARTON I .J. ET Al
ESA SP-361 // P 1099 VOL. 2
PAPER IN PROC. OF THE 'SECOND ERS-1 SYMPOSIUM, SPACE AT THE SERVICE
OF OUR ENVIROtlMnlT', PROCEEDINGS OF A SYMPOSIUM HELO IN HAMBURG,
GERMANY, 11-14 OCTOBER 1993 CINDEXED UNDER 43 l
• 94025 IE X SP 361 43
PROSPECTS FOR GLOBAL CHANGE DETECTION WITH SATELLITE SST OBSERVATIONSCJANUARY 1994)
ALLEN M.R. ET Al.
ESA SP-361 II P 1103 VOL.
PAPER IN PROC. OF THE 'SECOND ERS-1 SYMPOSIUM, SPACE AT THE SERVICEOF OUR ENVIRONMHIT', PROCEEDINGS OF A SYMPOSIUM HELO 111 HAMBURG,GERMANY, II-I'< OCTOBER 1993 Clt/DEXED UNDER 431
• 94025BE X SP 361ERS-1 SCATTEROHFTER MEASUREMENTS OVER TllE SOUTHERN OCEAtlCJANUARY 1994 lFREILICll M.H.ESA SP-361 // 1111 VOL.
PAPER IN PROC OF THE 'SECOND ERS-1 SYMPOSIUM, SPACE AT THE SERVICEOF OUR ENVIRONHFNT', PROCEEDINGS OF A SYMPOSIUM HELD IN HAMBURG,GERMAtlY, JJ-1'1 OCTOBER 1993 CltlDEXED UNDER 431
• 940259E X SP 361 43SURFACE WIND Atrn PRECIPITATION PATTERNS IN TROPICAL CYCLONESOBSERVED WITH TllE ERS-1 SCATTEROMETER AND WITll TllE SSM/lCJANUARY 199'olQUILFEN Y. ET MESA SP-361 // P 1117 VOL.
4 -5 PAPER IN PROC. or THE 'SECOND ERS-1 SYMPOSIUM, SPACE AT THE SERVICE
OF OUR ENVJRONMEtlT', PROCEEDINGS OF A SYMPOSIUM HELD IN HAMBURG,GERMANY, 11-1'• OCTOBER 1993 <INDEXED UNDER 43)
• 940260E X SP 361 43COMPARISON OF ERS-1 SCATTEROHETER AND FLORIDA STATE UNIVERSITYTROPICAL WINDS CJANUARY 1994 lLEGLER D.M 8 O'RRIEN J J.ESA SP-361 // P 1173 VOL
PAPER !ti PROC. or TllE 'SECOND ERS-1 SYMPOSIUM, SPACE AT TllE SERVICEOF OUR ENVJRotlHFHT'' PROCEEDINGS or A SYMPOSIUM HELD IN HAMBURG,GERMANY, 11-Jfo OCTOBER 1993 <INDEXED UNDER 43l
• 940261E X SP 361 43ERS-1 SURFACE WHID OBSERVATIONS OVER A CYCLOtlE SYSTEM IN BAY OFBENGAL DURING tlOVEHBER 1992 <JANUARY 19941KISHTWAL C.H. ET Al.ESA SP-361 II P 1127 VOL.
PAPER IN PROC OF THE 'SECOND ERS-1 SYMPOSIUM, SPACE AT THE SERVICEOF OUR ENVJRONMEtlT', PROCEEDINGS OF A SYMPOSIUM HELD IN HAMBURG,GERMANY, 11-14 OCTOBER 1993 CINDEXED UNDER 43l
• 940262E X SP 361 43TROPICAL CYCLONE MONITORING USING ERS-1 SCATTEROMETER DATA(JANUARY 1994)ROQUET H. 8 POI TEVIN J.ESA SP-361 II P 1133 VOL.
PAPER IN PROC. OF THE 'SECOND ERS-1 SYMPOSIUM, SPACE AT THE SERVICEOF OUR ENVIRONMENT', PROCEEDINGS OF A SYMPOSIUM HELD IN HAMBURG,GERMANY, 11-14 OCTOBER 1993 (INDEXED UNDER 43 l
• 940263E X SP 361 43ERS-1 SAR USE TO DETERMINE LAKE DEPTHS IN ARCTIC AND SUB-ARCTICREGIONS (JANUARY 19941MELLOR J.C.ESA SP-361 // P 1141 VOL.
PAPER IN PROC OF THE 'SECOND ERS-1 SYMPOSIUM, SPACE AT THE SERVICEOF OUR ENVIRONMENT', PROCEEDINGS OF A SYMPOSIUM HELD IN HAMBURG,GERMANY, 11-14 OCTOBER 1993 CINDEXED UNDER 43)
• 940264E X SP 361 43ERS-1 SCATTEROMETER DATA PROCESSING OVER THE MEDITERRANEAN SEA,ALGORITHM DEVELOPMENT AND VALIDATION ACTIVITIES AT 1-PAFCJANUARY 1994 lBARTOLOtll A ET AL.ESA SP-361 // P 1149 VOL.
PAPER IN PROC. OF THE 'SECOND ERS-1 SYMPOSIUM, SPACE AT THE SERVICEOF OUR ENVIROllMFNT', PROCEEDINGS OF A SYMPOSIUM HELD JN HAMBURG,GERMANY, 11-14 OCTOBER 1993 (INDEXED UNDER 43)
• 940265E X SP 361 431 ERS-1 SATELLITE DATA JN COMPARISOtl WITH NUMERICAL WIND AND WAVE
MODEL FORECAST RESULTS CJANUARY 1994)BEHRENS A. 8 SCHRADER D.ESA SP-361 // P 1155 VOL.
PAPER IN PROC OF THE 'SECOND ERS-1 SYMPOSIUM, SPACE AT THE SERVICEOF OUR ENVIRDllHFflT', PROCEEDINGS OF A SYMPOSIUM HELD IN HAMBURG,GERMAtlY, 11-14 OCTOBER 1993 CINDEXED UNDER 43l
ESA Journal 1994, Vol. 18
• 940266E X SP 361 43OBSERVATIONS WITH THE ROWS INSTRUMENT DURING THE GRAND BANKSCALIBRATION/VALIDATION EXPERIMENTS (JANUARY 19941VANDEMARK D. 8 CHAPRON B.ESA SP-361 // P 1161 VOL.
PAPER IN PROC. OF THE 'SECOND ERS-1 SYMPOSIUM, SPACE AT TllE SERVICEOF OUR ENVIRONMENT', PROCEED!tlGS OF A SYMPOSIUM HELD IN HAMBURG,GERMANY, 11-14 OCTOBER 1993 CINDEXED UNDER 43)
• 94026/E X SP 361 43CROSS CALIBRATION OF ERS-1 AND TOPEX AND GEOSAT WAVE HEIGHTSCJANUARY 1994 lCOTTON P.O. 8 CARTER D.J.ESA SP-361 // P 1165 VOL.
'• -PAPER JN PROC. OF THE 'SECOND ERS-1 SYMPOSIUM, SPACE AT THE SERVICEOF OUR ENVIRONMENT', PROCEEDINGS OF A SYMPOSIUM HELD IN HAMBURG,GERMANY, 11-14 OCTOBER 1993 CJNDEXED UNDER 43l
* 94026BE x sr 361 43ERS-1 SAR JllVFSTIGATIONS OF SNOW AND ICE FACIES ON ICE CAPS IN THEEUROPEAN HIGH ARCTIC <JANUARY 1994lDOWDESWELL J.A , REES W.G. 8 DIAMENT A.O.ESA SP-361 // P 1171 VOL. 2
PAPER IN PROC. OF THE 'SECOND ERS-1 SYMPOSIUM, SPACE AT THE SERVICEOF OUR ENVIRONMENT', PROCEEDINGS OF A SYMPOSIUM HELD IN HAMBURG,GERMANY, 11-14 OCTOBER 1993 CINDEXED UNDER 431
* 9t+0269E x sr 361 43THF RASCALS SYSTfH, A TOOL FOR ERS-1 OATA PRODUCT QUALITY ANALYSISAtlD SEtlSOR rrnroRHANCE ASSESSHEtlT ( JAtlUARY 1994)
2 EI CllENllERR II El Al3 ESA SP-361 // P 1177 VOL.
'• -PAPER !ti PRDC OF !HE 'SECOND ERS-1 SYMPOSIUM, SPACE AT THE SERVICEor OUR ENVIRmrnFNT'' PROCEEDINGS or /\SYMPOSIUM HELD IN HAMBURG,GERMANY, ll-Jf1 ncTOBER 1993 (INDEXED UNDER 43)
• 9402/0E X SP 06 ICD-RECORDARI E AS llEW MEDIUM FOR TllE OJSTRJRUTJON OF ERS-1 SARPRODUCTS BY rut n-rl\F (Jl\NUl\RY 199f1)ENGEL H. 8 GRFDFL J.ESA SP-361 // P 1183 VOi..
PAP[R It/ PRDC nr THE 'SECOND ERS- I SYMPOSIUM, SPACE AT TllE SERVICEOF OUR ENVIROllMrtlT'' PRDCEEnltlGS or A SYMPOSIUM HELD IN HAMBURG,GERMANY, 11-l'• OCTOBER 1993 CJNOEXFD UNDER '13)
06 JTllE rREllCll PROrFSSING AllO ARCllJVltlG rACJl!TY, OVFRVJEW AND STATUSC JMHJARY 199'+)r l\RCY r rrun I OtJFU s R HhRSr:Ofl. T MESA SP-361 // P 1187 VOi. 7
PAPER Ill PROC or TllE 'SECOllD ERS·I SYMPOSIUM, SPACE AT TllE SERVICEOF OUR FNVIROtlMFNT', F'ROCEFOltlGS OF /\SYMPOSIUM HELD IN HAMBURG,GERM/\NY, 11-11'1 OCTOBER 1993 CltlDEXED UNDER '+3)
• 940272E X SP 361 43QUICK-LOOK OCEMI PRODUCTS GENERATION AT 0-PAF (JANUARY 19941GRUBER T , AN7ENllDFER M. 8 RENTSCH MESA SP-361 II P 1101 VOL
5 PAPER IN F'ROC or THE 'SECOND FRS-1 SYMPOSIUM: SP/\CE /\T TllE SERVICEOF OUR FNVIROtlMFtlT' J PROCEEDJUGS or A SYMPOSIUM urt.n IN JH\MBIJRG,GERMMN, 11-lf• Or:TORER 1993 CHIDEXFO \JNDFR fd)
• 940273E x sr 361I OPERATION/\L rFRrnRMMICE OF THE GERMl\tl PROCESSING MW /\RCHIVlNG
FACILITY (JANUARY 1994)GREOEL JFSA SP-361 // P 1197 VOL
PAPER !ti PROC nr Tiff 'SFCOtrn FRS-1 SYMPOSIUM, SPACE AT TllE SERVICEOF 01/R FtlVJROtltfflll'' PROCEEO!t/GS or A SYMPOSJl/H llFI D IN HAMBURG,GERMANY, 11-lfi OCTOBER 1993 (INDEXED UNDER 43)
* 940274E x sr 361 (+3I GEOMORPHOLOGICAi MAPPING AND IllVESTIGAT!Otl or TllE THAWING DYNAMICS
l\T POTTER PENINSUL/\ CKitlG GEORGE ISLMID) CJAtW/\RY 1994)HOCllSCHJLD V., STABLEIN G. 8 KLENKE M.
3 FSA SP-361 // P 1203 VOL
5 PAPER IN PROC OF THE 'SECOND ERS-1 SYMPOSIUM, SPACE AT THE SERVICEor DUR ENVIROtlMENT'' PROCEEDINGS OF A SYMPOSIUM HELD IN HAMBURG,GERMANY, 11- 1'1 OCTOBER 1993 CINDEXED UNDER 43 l
w 940275E X SP 361 ft3STEREO-RADARGRAMMETRIC EVALUATION OF FRS-1 SAR IMAGES, A CASE STUDYIN SOUTllERN ITALY (JANUARY 1994)
2 KAUFMAtltl V. ET AL.3 ESA SP-361 // P 1211 VOL.4 -5 PAPER IN PROC OF THE 'SECOND ERS-1 SYMrOSIUM: SPACE AT TUE SERVICE
OF OUR ENVJROllMFtlT', PROCEEDINGS OF A SYMPOSIUM HELD IN HAMBURG,GERMANY, ll-lf1 OCTOBER 1993 CINDF.XED UNDER 43)
lf 9fi0276E X SP 3fil 43MFSOSCALE VARIATIONS IN THF ALASKA GYRE FROM ERS-1 AL Tl METER DATACJANUARY 1994 lLAGERLOEF G. ET Al.ES/\ SP-361 // P 1217 VOL.
PAPER IN PROC OF TllE 'SECOt/D ERS-1 SYMPOSIUM, SPACE AT TllE SERVICEOF DUR ENVJROllMFNT', PROCEED!tlGS OF A SYMPOSIUM HELD !ti HAMBURG,GERMANY, 11-14 OCTOBER 1993 CINDEXED UNDER 43)
175
• 940277E X SP 43361
MOSAICKING ERS-1 IMAGES, DIFFICULTIES, SOLUT!OtlS AND RESULTS ON
THE FRENCH GUYArlA (JANUARY 1994)
ROSAZ J.M., MAITRE H. & RUDANT J.P.
ESA SP-361 II P 1221 VOL. 2
PAPER IN PROC. or THE 'SECOtlD ERS-1 SYMPOSIUM, SPACE AT THE SERVICEOF OUR ENVIRONMENT', PROCEEDINGS OF A SYMPOSIUM HELD IN HAMBURG,GERMANY, 11-14 OCTOBER 1993 (INDEXED UNDER 43)
• 940278E X SP 361 43GRAVITY FIELD OF THE ROSS SEA REGION FROM SATELLITE ALTIMETRY,GEODYNAMIC IMPLICATIONS FOR WEST ANTARCTICA (JANUARY 1994)MCADOO D. C. ET AL.ESA SP-361 II P 1227 VOL
PAPER !ti PROC or TlfE 'SECOND ERS-1 SYMPOSIUM, SPACE AT THE SERVICEOF OUR ENVJRotllff'lT', PROCEEDINGS OF A SYMPOSIUM HELD HI HAMBURG,GERMANY, II-I'• OCTOBER 1993 (INDEXED UNDER 43J
• 940279E X SP 361 43THE VALIDATION OF ATSR MEASUREMENTS WIHI IN SITU SEA TEMPERATURES(JANUARY 1994 JMHINETT P a STMISFIELD K.L.ESA SP-361 II P 1733 VOi
PAPER IN PROC or THE 'SECotlD ERS-1 SYMPOSIUM, SPACE AT THE SERVICEOF OUR ENVIRONMEflT', PROCEEDINGS OF A SYMPOSIUM HELD IN HAMBURG,GERMANY, 11-14 OCTOBER 1993 (INDEXED UNDER 43J
• 940280E X SP 43361IMPLEMENTATION OF THE DLRIINPE SAR PROCESSOR FOR ERS-1INTERFEROMETRY (JANUARY 1994 JMOREIRA J.R. & MURA J.C.ESA SP-361 II P 1239 VOL.
PAPER IN PROC. OF THE 'SECOND ERS-1 SYMPOSIUM, SPACE AT THE SERVICEOF OUR ENVIRONMEtlT', PROCEEDINGS OF A SYMPOSIUM HELD IN HAMBURG,GERMANY, 11-14 OCTOBER 1993 r t NDEXED UNDER 43)
• 9r,028IE X SP 361 43TllE ALotlG TRACK SCAtltl!llG RADIOMETER ( ATSRl GLOBAL VALIDATION RESULTSC.Jf\NlJ/\RY 199/'fJMUTLOWC.T. El Al.ESA SP-361 II P 1245 VOi.
PAPER -IN PROC. or THE 'SECOND ERS-1 SYMPOSIUM, SPACE AT THE SERVICEor OUR EtlVIROttMFtlT'' PROCEEDINGS OF A SYMPOSIUM HELD IN HAMBURG,GERMANY, II-I'• Or:TOBER 1993 (INDEXED IJNOER 43)
* 9f10282E X SP .~61 lf3INTERFEROMETRIC SAR SIMIJLATOR (JANUARY 199'•1NIRCHIO r . s OLTVIERI A.ESA SP-361 II P 1251 VOL
PAPER IN PROC or HIE 'SECOND ERS-1 SYMPOSIUM, SPACE AT THE SERVICEOF OUR EtlVIROtJMENT', PROCEEDINGS OF A SYMPOSIUM HELD IN HAMBURG,GERMANY, 11-14 OCTOBER 1993 (INDEXED llNDER 431
* 9<,02B3E x sr 361 431 GEOMETRIC INTEGR/\TION OF MULTI-IMl\GE HffORMl\Tlot~ (Jl\NUARY 1994)Z POllL C. 8 Vl\N GFtmF.:REN J.l3 ESA SP-361 II P !?SS VOL.
PAPFR !ti PROC or THE 'SECOND ERS-1 SYMPOSIUM, SPACE AT TllE SERVICEOF OUR EtlVIROtJMrtlT', PROCEEDINGS OF A SYMPOSIUM HELD IN HAMBURG,GERH/\NY, ll-lf1 or:fORER 1993 CINDEXFO l/NOF.R 43)
* 9r,02Ar1E X SP ~Ill 43REI IEF ESTIMATJotl !ti TROPICAL CONTEXT (rRENCll GllYANAl WIHI SARERS I IMAGERY (.JANUARY 199'• l
? TOtlON M. ET Al3 ESA SP-361 II P 1261 VOL.
5 PAPER !ti PROC or THE 'SECOND ERS-1 SYMrOSIUM, SPACE AT THE SERVICEor OllR ENVIRONMFtlT'' PROCEFDitlGS OF A SYMPOSIUM tlELD !ti HAMBURG,GERMANY, II l'• OCJOBER 1993 (JNOEXED lltlOER 43)
* 9407ASE x sr 361 43CONTRIBUTION OF ERS-1 SAR DATA TO tlYDROLOGIC APPROACH IN TROPICALAREA, EXAMPLE OF FRENCH GUYANA (JANUARY 1994)LO!tlTIER M. ET Al.ESA SP-361 II P 1267 VOL
'• -P/\PFR tN PROC or TffE 'SECOND ERS·l SYMPOSIUM: SPACE AT THE SERVICEor OUR ENVIRotlMFtll I J PROCEEDINGS OF A SYMPOSIUM HELD IN HAMBURG,GERMANY, i i -r « OCTOBER 1993 (INDEXED UNDER 43)
* 940286E X SP 361 43EXPERIENCES WJTll FRS-1 SAR DATA PROCESSING AND GEOCODING AT THEGERMAN PAF (JANUARY 1994)
2 SCll/\TTLER B , ROTH A 8 KOSMANN D.3 ESA SP-361 II P 1?73 VOL 2
PAPER IN PROC or THE 'SECOND ERS-1 SYMPOSIUM, SPACE AT THE SERVICEor OUR ENVIRONMENT'' PROCEEDINGS OF A SYMPOSIUM HELD IN HAMBURG,GERMANY, 11-14 OCTOBER 1993 (INDEXED UNDER 431
• 940287E X SP 361 43ESTIMATION OF SOIL MOISTURE BY USING ERS-1 DATA (JANUARY 19941SCllOENERMARK M. FT AL.
3 ESA SP-361 II P 1277 VOL.
rAPER IN PROC. or THE 'SECOND ERS-1 SYMPOSIUM' SPACE AT THE SERVICEOF OUR ENVIRONHEtlf', PROCEEDINGS OF A SYMPOSIUM HELD IN HAMBURG,GFRHANY, II-I'• OCTOBER 1993 (INDEXED UNDER 431
176
• 940288E X SP 361 43DETERMINATION or PHASE ERRORS OF ERS-1 SAR (JANUARY 19941SEIFERT F.M. & MOREIRA J.R.ESA SP-361 II P 1279 VOL.
PAPER IN PROC. OF THE 'SECOND ERS-1 SYMPOSIUM, SPACE AT THE SERVICEOF OUR ENVIRONMEtlT', PROCEEDINGS OF A SYMPOSIUM HELD IN HAMBURG,GERMANY, 11-14 OCTOBER 1993 (INDEXED UNDER 431
• 940289E X SP 361 43!ti SEARCH OF THE FRANKLIN EXPEDITION WITH THE AID OF ERS-1(JANUARY 1994 lWADHAMS P. 8 SAllVADET P.ESA SP-361 11 P 1285 VOL.
PAPER !ti PROC. OF THE 'SECOND ERS-1 SYMPOSIUM, SPACE AT TllE SERVICEOF OUR ENVIROllMFtlT', PROCEEDINGS OF A SYMPOSIUM HELD IN HAMBURG,GERMANY, 11- lf• OCTOBER 1993 (INDEXED UNDER 43 J
• 940290E X SP 361 43SAR OCEAN WAVE IMAGERY, SPECTRA AND STATISTICS (JANUARY 19941IETILE F.ESA SP-361 II P 1343 VOL.
PAPER IN PROC. OF THE 'SECOND ERS-1 SYMPOSIUM, SPACE AT THE SERVICEOF OUR EtlVIROllMENT', PROCEEDINGS OF A SYMPOSIUM HELD IN HAMBURG,GERMANY, 11-14 OCTOBER 1993 (INDEXED UNDER 43)
• 940291E E sr 361 43HIGH PRECISION ORBITS FOR ERS-1, 3 DAY AND 35 DAY REPEAT CYCLES(JANUARY 1994)DOW J.M. ET AL.
3 ESA SP-361 11 P 1349 VOL.
PAPER IN PROC. or TllE 'SECOND ERS-1 SYMPOSIUM, SPACE AT THE SERVICEOF OUR ENVIROllMFtlT', PROCEEDltlGS OF A SYMPOSIUM HELD IN HAMBURG,GERMANY, 11-14 OCTOBER 1993 (INDEXED UNDER 431
• 940292E E SP 361 43GLOBAL OCEAN TIDE MAPPING AND DYNAMIC SEA SURFACE TOPOGRAPHYDETERMINATION USING ERS-1 AL TIME TRY (JANUARY 1994 lROMAY-MERINO M. M. ET AL.ESA SP-361 II P 1355 VOL.
PAPER IN PROC. OF THE 'SECOND ERS-1 SYMPOSIUM, SPACE AT THE SERVICEOF OUR ENVIRONMENT', PROCEEDINGS OF A SYMPOSIUM HELD IN HAMBURG,GERMANY, 11-14 OCTOBER 1993 (INDEXED UNDER 431
* 940322E E B 0078 43TllE ESA EARTll-ORSERVATION GUIDE AND OIRECTORY SERVICE (MAY 19941TRIEBtl!G GESA BULLETIN NO 78 II PP 65-73
r, SEE ESA BULLET!tl uo . 78, INDEXED UNDER 99
Energy Production and Conversion 44
* 9r10070E CRP 37r,.5 4r,RFCS PHASE 3 rltlAL REPORT OlOVEMBER 1993)DORN! ER, GERMANY ( CONTR NO. 7 56 l 1881Nt/US (SC l lESA CR(Pl-3745 II 230 PP
4 AVAIL MF
Life Sciences
Life Sciences (General) 51
• 940059E CRP 3736 51AUTOMATED BIOi AR - EXECUTIVE SUMMARY CDECEMBER 1993)CARLO GAVAZZI, ITALY (CONTR NO. 100601921NLIJSCl
3 ESA CR(P)-3736 II 63 PP4 AV/\Il/\BLE HF R; flARO COPY (ESA PRICE CODE El)
Aerospace Medicine 52
• 940328E X J 1801 52THE USE OF MEOJCAMENTS IN SPACE THERAPEUTIC MEASURES MID POTENTIALIMPACT OF PltARHACOKINETICS DUE TO WEIGHTLESSNESS (MARCH 19941
2 PAVY-LE TRAON A ET AL.3 ESA JOURNAL VOi 18, NO. II PP 33-50
SEE ESA JOURNAL, INDEXED UNDER 99IN SUPPORT OF THE PREPARATORY PROGRAMME FOR THE EUROPEAN MANNEDSPACE ltlFRASTRUUllRE, THE LONG-TERM PROGRAMME OFFICE (LTPOl WITHINESA'S SPACE STATION ANO MICROGRAVITY DIRECTORATE INITIATED A SERIESor STUDIES AIMED AT A BETTER UNDERSTANDING OF TllE PHYSIOLOGICALMIO PSYCHOLOGICAL ASPECTS OF LIVING !ti SPACE. IN THIS CONTEXT, IN1991 MEDES ( INSTITUT DE MEDECINE ET PHYSIOLOGIE SPATIALEl WASCONTRACTED BY THE AGENCY TO INVESTIGATE THE TYPE AND EFFICACY OF DRUGSAVAILABLE FOR USE BY ASTRONAUTS DURING SPACE MISSIONS TO COUNTERACTTllE EFFECTS OF WEIGHTLESSNESS OR FOR MEDICAL TREATMEtlTS. THIS PAPERSUMMARISES HIE MA!tl OUTCOME OF THIS RESEARCH, !ti TllE CONTEXT OF THESO-CALLED 'PHARHEMSI STUDY'. TllE FIRST PART rs DEDICATED TO THECotlTENT OF Tiff MFDICAL KITS USED BY ASTRONAUTS !ti FLIGHT, WHILE THESErOND OESCRIB!CS HOW WEIGHTLESSNESS CMI MODIFY TllE ACTION OF DRUGS(I E PHARMACOOYtlAMJCS AND PtlARMACOK lllETICS PARAMETERS l ON THE HUMANBOOY. RECOMMENOAJIONS ARE GIVEN Otl 'SPACE PHARMACOPOEIA' AS WELL ASTHE AREAS OF RESFARCH NEEDED TO ADAPT MEDICAT!otl TO THE WEIGHTLESSENVIRONMENT
ESA Journal 1994. Vol. 18

Behavioral Sciences
• 940303E CRP 3760 53COGNITIVE ACTIVITY ANALYSIS TOOL SET 3535S/l/TR.I + 2 - FINAL REPORTANO EXECUTIVE SllMMARY COCTOBER 1993)AEROSYSTEMS, U. K CCONTR NO. 98'111921Nl./FHC SC l lESA CRCPl-3760 II 132 PP AND 6 PP
4 AVAIL HF AND I/ARD COPY CESA PRICE CODE E2, EOl
Man/System Technology and Life Support
• 940068E STH ;>45 54BODY POSTURE IN MICROGRAVITY CMARCH 1994lVERGE-OEPRE KESA STH-245 II VI + 39 PPESA PRICE CODE, EOTHIS REPORT DESCRIBES THE PLANNING, EXECUTION ANO ANALYSIS OF ANUMBER OF EXPFRIMENTS PERFORMED UNDER COtlDITIONS OF WEIGHTLESSNESSDURING PARABO/ IC AEROPLANE FLIGHTS. THE AIM OF THESE EXPERIMENTSWAS TO OBTA!tl DATA FOR USE IN THE ERGOHAN COMPUTER SIMULATOR, WHICll ISusr o IN THE OFVFlOPHENT OF MANNED SPACECRAFT WORKING AREAS. THE NEEDTO OBTAIN SUC/I DATA AROSE BECAUSE OF UNCERTAINTY ABOUT THE RELIABILITYOF THE NASA DATA, WHICH HAD HITHERTO BEEN THE ONLY ONES AVAILABLE. THERESULTS OF TllE EXPERIMENTS WERE SOMEWHAT INCONCLUSIVE THIS WASDUE TO TWO MAIN DIFFICULTIES. IN THE FIRST PLACE THE PARABOLAS FLOWNTENDED TO VARY WITH REGARD TO TllE LENGTH OF TIME THE WEIGHTLESSCONDITION WAS SIMULATED ANO THE SMOOTHNESS OF THE FLIGHT. IN THESECOND PLACE, TllE NUMBER OF SUBJECTS TESTED WAS QUITE SMALL, WHILEDIFFERENCES IN TllE MANNER IN WHICH THEY REACTED TO 0 G WERE QUITELARGE.
• 940311E CRP 3761SPECIFIC METHODS FOR MM! DESIGN FINAL REPORT ANO EXECUTIVE SUMMARYCJUllE 1993)CR!, DENMARK CCONTR NO. 98421921NLIFMC SCl lESA CRCPl-376I II 305 Pr AND 41 pp
4 AVAIL MF AND llARD COPY CESA PRICE CODE E3, FOl
Mathematical and Computer Sciences
Computer Operations and Hardware• 940050E CRX 3727 60
Sil ICON COMPILER ASSESSMENT AND DESI ml TOWARDS EUROPEAN SPACESCADES-1 - FltlAL REPORT CHARCH 1993)IHEC, BELGIUM CCONTR NO 86151901NLIPHC SC l lESA CRCX)-3727 II 108 PPAVAILABLE MF g HARO COPY CESA PRICE CODE E2l
• 940321E E B 0078 60EVOLUTION OF rur TECHNICAL COMPUT!tlG SERVICES AT ESTEC CHAY 1994lDE JONG E FT /\IESA BULLET!tl NO 78 II PP 60-64SEE ESA BULLETIN tlO 78, HlOEXED UNDER 99
5 -
Computer Programming and Software
w 9f10055E CRP 3732 61I ADA PAYLOAD SUPPORT SOFTWARE FOR OBDH INTELLIGENT CONTROL UNIT
FINAL REPORT C.MNUARY 1993)THARSYS, FRANCE CCONTR NO 95171911Nl/SFlESA CRCPl-373;> II 38 PP
4 AVAILABLE MF R llARD COPY CESA PRICE CODE EOl
• 940299E CRP 3756 61ESA-DDC I. I EXECUTIVE SUMMARY CMARCH 1994!
2 HHS, FRANCE CCOt/TR ND. 95581911NLIJG-WO 12)3 ESA CRCPl-3756 II 37 PP4 AVAIL HF AND HARD COPY CESA PRICE CODE FO)
Computer Systems
• 940323E E B 0078 62THE COLUMBUS UTILISATION INFORMATION SYSTEM 'CUIS' CHAY 1994)GENDREAU G & WILLEKENS P.ESA BULLETIN NO 78 II PP 74-79SEE ESA BULLETIN NO. 78, INDEXED UNDER 99
Social Sciences
Administration and Management
• 940316E E B 0078 81THE ESA MOOIFICATIOll PROCEDURE AS A TOO/ FOR MAJIAGEMFNT A/10ENGINEERING COtlTROL CMAY 1994)KA/IN S. G & DllRAll MESA BULlETIN uo 78 II PP ?0-27
r, SEE ESA RUii FT Ill no 78, I NOEXEO UllDFR 99
ESA Journal 1994 Vol. 18
53 Economics and Cost Analysis 83
• 9ft03UtE E 8 0078 83REVIEW or !llDUSTRY/ESA BUSHIESS PRACTICFS WITHIN TllE SCIENTIFICPROGRAMME CMAY I 994 lDAIE 0., JAGTMAll F 8 DEAK T.ESI\ BULLETIN NO 78 II rr 7-14SFF ESA BUI LETH/ 110. 78, HIOEXFD UNDER 99
54 * 9ft0315E E 8 0078 8:\I.A POLITIQUE HIDllSTRJELLF OF L'FSA'JUSTE RETOUR' CHfl.Y l99tt)IMRERT r & GRiil.i G.
3 ESA BULi ETIN /JO 78 II PP 16-19'• SEE FSA nuur t t u t/O 78, INDEXED UNDFR 99
IF CONCFPT EVOLllTIF 011
Law and Political Science 84
• 9<1037t1F F 8 0078 er1I LA COllVFNTION OF I 'FSA A l 'OFllVRF FHSFJGNFMFNTS DU PASSF
( Hf\Y l qqr, JLAfrFRRAtlOFRIF G & KAYSFR V
:\FSA BUllETIN uo 78 II Pr AO-A?4 SEE ESA 8UL I.ET rn NO 78, INDEXED llNDFR 99
Space Sciences
Lunar and Planetary Exploration 91
• 9<t0317E E 8 0078 91I COMET PIS/IOFMAKFR-LEVY 9 ON COLLISION COURSE WITH JUPITER CHAY 1994!
81LLEAAUO F & LEBRETON J -rESA RULLFTIN no 78 II pp ;>8-:\?
4 SFF ESA AlJUFTHI NO. 78, JNDFXFO Ut/DFR 99
60 * 940330F X J IAOI 91SPACE·PLATFORM IMPACT PROBARJLJTJES 11/F Tl/REAi or TllF LEONIOSCMARCH 1994)BFFCll M. & BROW/I P.FSA JOllPt/AI VD/ 18, 110 I II pp 6:\ I?
4 SEE ESA JDllRllAI , IllDEXED UllOER 995 COMFT P/TEMPEl_-TllTTLE Pf\SSFS PFRIHEI Intl otl 28 ffBRUf\RY 1998 /\ND IT
IS /JIG/II Y /IKEI Y Tl/AT IN TllF TIME INHRVM rROM 1997 TO 2000 TllEFARTH WILL WITllFSS AT LEAST ONE METfOR STORM rRDM I/IF ASSOCIATEDLEO/HO MFTORO!D STREAM I/IF VERY HIGll MFTEOROIO FLUX, AND THECONCOMITANT RISE IN THE SPACE-PLATfORMIMFTEOROIO IMPACT PROBABILITYTllAT COULD RESULT FROM A LEOIHO MFTFOR STORM, POSES A TANGIBLETllRFAT TO Al.L FART/I-ORBITING SPACE PIATFORMS
61 General 99
• 9403l 3E R 0078ESA BlJLl.FTIN, MAY 1994BATT RICK B. I GllYENNE T. 0 I MATTOK C C EDS JESA BULLETIN NO 78 II 100 PAGES
99
NO CHARGE
• 9f10325F J IAOl 99ESf\ JOURN/\I Ml\Rr:ll I 99t1BAT TRICK B I G\JYEtHff T n (Ens )ES/\ JO\JRtM.I vrn IA, uo I // qr, P/\GfS
r, NO Cflf\RGF
62
81
177

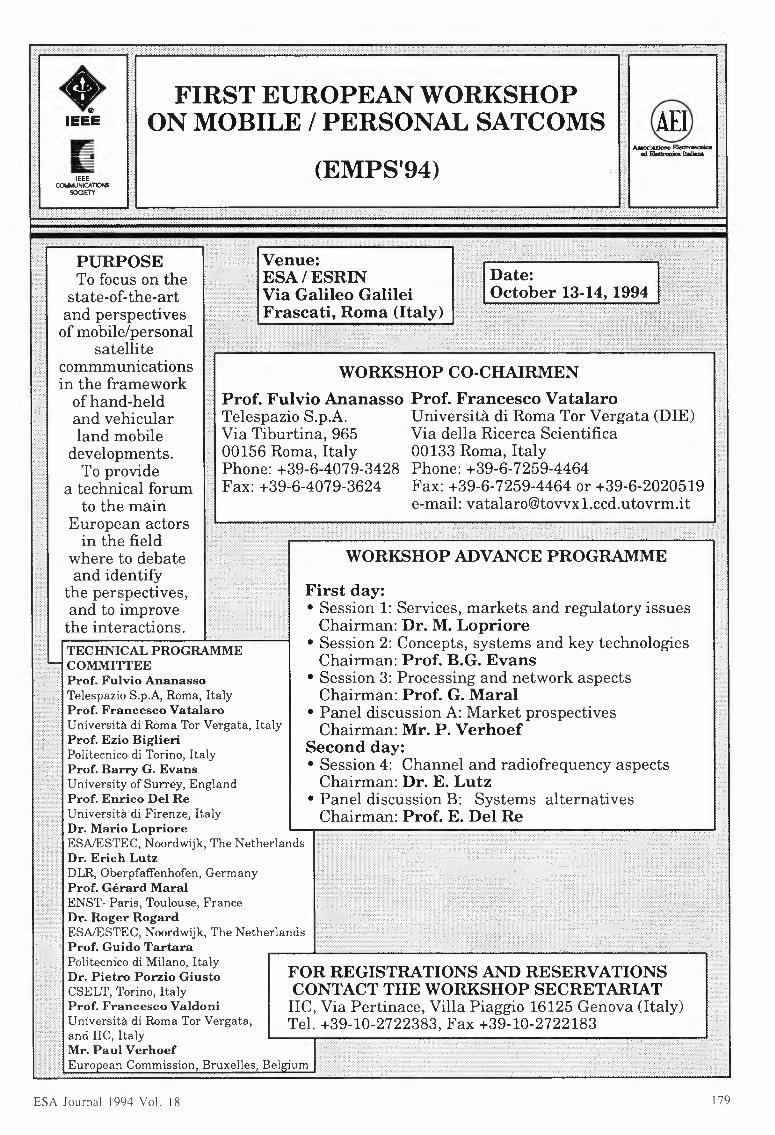
+IEEE FIRST EUROPEAN WORKSHOPON MOBILE I PERSONAL SATCOMS
I (EMPS'94)IEEECa.MUNICATIONS
scam
PURPOSETo focus on thestate-of-the-artand perspectivesof mobile/personal
satellitecommmunicationsin the frameworkof hand-heldand vehicularland mobiledevelopments.To provide
a technical forumto the main
European actorsin the field
where to debateand identify
the perspectives,and to improvethe interactions.
Politecnico di Milano, ItalyDr. Pietro Porzio GiustoCSELT, Torino, ItalyProf. Francesco ValdoniUniversita di Roma Tor Vergata,and IIC, ItalyMr.Paul VerhoefEurooean Commission, Bruxelles, Bel
WORKSHOPCO-CHAIRMENProf. Fulvio Ananasso Prof. Francesco VatalaroTelespazio S.p.A. Universita di Roma Tor Vergata (DIE)Via Tiburtina, 965 Via della Ricerca Scientifica00156 Roma, Italy 00133 Roma, ItalyPhone: +39-6-4079-3428 Phone: +39-6-7259-4464Fax: +39-6-4079-3624 Fax: +39-6-7259-4464 or +39-6-2020519
e-mail: [email protected]
WORKSHOPADVANCEPROGRAMME
TECHNICALPROGRAMMECOMMITTEEProf. Fulvio AnanassoTelespazio S.p.A, Roma, ItalyProf. Francesco VatalaroUniversita di Roma Tor Vergata, ItalyProf. EzioBiglieriPolitecnico di Torino, ItalyProf. Barry G. EvansUniversity of Surrey, EnglandProf. Enrico DelReUniversita di Firenze, ItalyDr. Mario LoprioreESA/ESTEC, Noordwijk, The NetherlandsDr. Erich LutzDLR, Oberpfaffenhofen, GermanyProf. Gerard MaralENST- Paris, Toulouse, FranceDr. Roger RogardESA/ESTEC, Noordwijk, The NetherlandsProf. Guido Tartara
First day:• Session 1: Services, markets and regulatory issuesChairman: Dr. M.Lopriore
• Session 2: Concepts, systems and key technologiesChairman: Prof. B.G.Evans
• Session 3: Processing and network aspectsChairman: Prof. G.Maral
• Panel discussion A: Market prospectivesChairman: Mr. P. Verhoef
Second day:• Session 4: Channel and radiofrequency aspectsChairman: Dr. E. Lutz
• Panel discussion B: Systems alternativesChairman: Prof. E. Del Re
ESA Journal 1994 Vol. 18 179
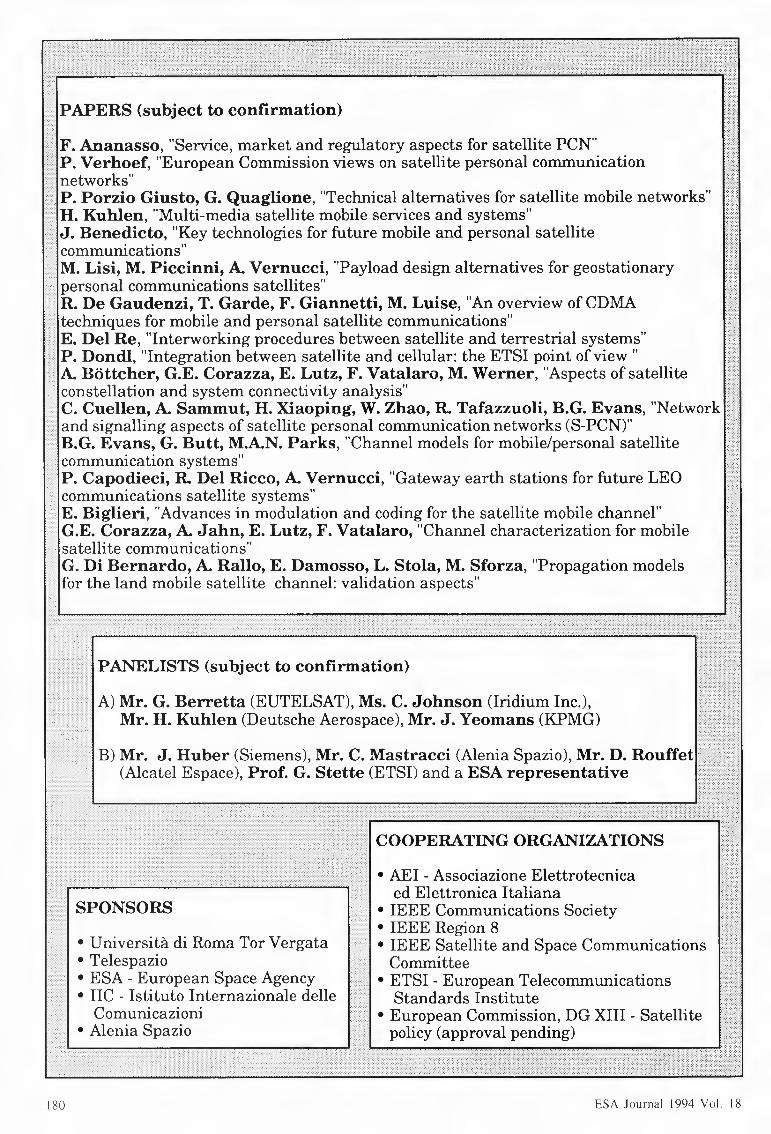
PAPERS (subject to confirmation)
F. Ananasso, "Service, market and regulatory aspects for satellite PCN"P. Verhoef, "European Commission views on satellite personal communicationnetworks"P. Porzio Giusto, G. Quaglione, "Technical alternatives for satellite mobile networks"H. Kuhlen, "Multi-media satellite mobile services and systems"J. Benedicto, "Key technologies for future mobile and personal satellitecommunications"M. Lisi, M. Piccinni, A. Vernucci, "Payload design alternatives for geostationarypersonal communications satellites"R. De Gaudenzi, T. Garde, F. Giannetti, M. Luise, "An overview of CDMAtechniques for mobile and personal satellite communications"E. Del Re, "Interworking procedures between satellite and terrestrial systems"P. Dondl, "Integration between satellite and cellular: the ETSI point of view"A. Bottcher, G.E. Corazza, E. Lutz, F. Vatalaro, M. Werner, "Aspects of satelliteconstellation and system connectivity analysis"C. Cuellen, A. Sammut, H. Xiaoping, W. Zhao, R. Tafazzuoli, B.G. Evans, "Networkand signalling aspects of satellite personal communication networks (S-PCN)"B.G. Evans, G. Butt, M.A.N. Parks, "Channel models for mobile/personal satellitecommunication systems"P. Capodieci, R. Del Ricco, A. Vernucci, "Gateway earth stations for future LEOcommunications satellite systems"E. Biglieri, "Advances in modulation and coding for the satellite mobile channel"G.E. Corazza, A. Jahn, E. Lutz, F. Vatalaro, "Channel characterization for mobilesatellite communications"G. Di Bernardo, A. Rallo, E. Damosso, L. Stoia, M. Sforza, "Propagation modelsfor the land mobile satellite channel: validation aspects"
PANELISTS (subject to confirmation)
1 <<<< .. .. 1A)Mr. G. Berretta (EUTELSAT),Ms. C. Johnson (Iridium Inc.),Mr. H. Kuhlen (DeutscheAerospace),Mr. J. Yeomans (KPMG)
B)Mr. J. Huber (Siemens),Mr. C. Mastracci (AleniaSpazio),Mr. D. Rouffet(AlcatelEspace), Prof. G. Stette (ETSI)and a ESA representative
COOPERATING ORGANIZATIONS
• Universita di RomaTorVergata• Telespazio• ESA - European SpaceAgency• IIC - Istituto Internazionale delleComunicazioni
• Alenia Spazio
• AEI -AssociazioneElettrotecnicaed Elettronica Italiana
• IEEE CommunicationsSociety• IEEE Region8• IEEE Satellite and Space CommunicationsCommittee
• ETSI - European TelecommunicationsStandards Institute
•European Commission,DGXIII - Satellitepolicy(approval pending)
180 ESA Journal 1994 Vol. 18
Publications Available from ESA Publications Division
Publication SourceNumber ofissues per year
Scope/Contents Availability
PeriodicalsESA Bulle!ir'ESA JournalEarth Observat.cn Oua'lc11y
(Engl1sl1 or Fre·1ch1ECSL Nc:.s
Reach111q for lhc SkiesM1crograv11y News
1Eng:1sr :.1th Frenc~1sLu1irr:ar1eslP'eoa:;ng for the Fu\ure
444
4
43
4
ESA s primary magazineESAs learned 1ournalRemote·sens1ng newspaper
Free o! C~l<-HQC ESA Publ1cat10•1s 01\ 1s1011.ESTIC.2200 AG Noorclw11k Tlie Netl1crlar1ds
Newspaper of Ilic European Centre forSpace Law (under the auspices of ESA)Space Transportation Systems newspaperMrcrogravrty Programme newspaper
Technology Programme newspaper
MonographsConference ProceedingsSc1ent1f1c/Tech111calMonographs
ESA Brochures
ESA Folders
Sc.ennt.c & Tecl1n1cal Reports
Sc1ent1f1c& Iecnmcal Memoranda
Code(SP-xxx)(SP xxxx)
(BR xxx)
(F xxx)
(STR xxx)
Procedures. Stancaros & Soecncat.ons (PSS-xxx)
(STM xxx)
Volumes of specific Conference papersSpcc1f1c/deta1led information ongraduate·level subjectsSlJnm1<cir1cs of less than 50 pages
on a specific subjectFolders g1vrng short descriptions ofsubjects for the space interested laymanGraduate level reflecting ESAsposition on a given subjectGraduate level latest but not finalisedth1r1k1ngon a given subjectDelrmtrve requirements .n support ofcontracts
Prices below ESA Publ1cat1011so,vis1orc FSTIC2200 AG Noorc1w11k Tile Nctl1cr l;lllds
Prices below
Other PublicationsTraining Manuals
Technical Tr;-ins1a11ons
(TM xxx)
(TT-xxx)
Series for education of users or potentialusers of ESA programmes. services orracuu.osTranslations of national space relateddocuments (M1crofrche orphotocopy only)
Prices from FSRIN ESRIN. Via Galileo Galile1CP64. 00044 Frasca11. lldlyor ESA IRS 011 ce. 810 MarH1 Nik,,,75738 Paris 15. France
Public-relations material General literature. postersorotouraohs films etc
ESA PulJl1c Relations Servicr:8 10 rue Mario N1k1s75738 Paris 15. France
Charges for printed documentsNumber of pages 1n documentPrrce (Dutch Gurlders)
EO1-5035
El51-10050
E2101-20070
EJ201-40080
E4401-600100
Note from Head of ESAPublications Division:In the last three years we have left the puce of our pubticetions unchanged. Costs have nseri in that time, particularly postal charges, and from 1January1994 new prtces will be charged as shown aboveTo compensate for this increase two discounts will be possible:
a All orders over Off 110 - discount of 10%.b. All orders for addresses outside Europe over Off. 110 - no extra payment for airmail.
ESA Journal 1994. Vol. 18 181
Order Form for ESA PublicationsIMPORTANT1. Orders must be accompanied by a Cheque or InternationalBanker's Draft, in Dutch Guilders,
made payable to 'ESA PublicationsDivision'.No publications will be sent before receipt ofpayment.
2. Within Europe mailing is free-of-charge.Outside Europe airmail is free-of-chargefor orders overDfl 110;smaller orders are sent sea mail
RETURN TO: FINANCE DIVISION (EFA/P)ESTEC, POSTBUS 2992200 AG NOORDWIJKTHE NETHERLANDS
No. of ESA Title Price per Totalcopies reference copy, Dfl. Dfl.
Total:
Discount for orders over Dfl 110 10% of total: ........
Totalamount enclosed: Dfl. ........
MAILING ADDRESS (Print carefully)
Name ........ . .............................................................
Function ......................................................................
Organisation ...................................................................
Mailing Address ........ . ...........................................
. . . . . . . . . . . . . . . . . . . . . . . . . . . . . . . . . . . . . . . . . . . . . . . . . . . . . . . . . . . . . . . .
Town & Postal Code ...............................................
Country ......................................................................
Date . . . . . . . . . . . . . . . . . . . . . . . . . . . . . . . . Signature ................................
METHOD OF PAYMENT(Please tick box)I I Cheque enclosed, made payable to ESA Publications Division'.I I International Banker's Draft
182 ESA Journal 1994 Vol. 18
NOTES FOR CONTRIBUTORS RECOMMANDATIONS AUX AUTEURS
Contributions. which should be original papers.should be addressed to ESA Publications Division(attn. B. Battrick), c/o ESTEC, Noordwijk, TheNetherlands.
Le Journal public des articles orginaux: ccs dcrnicrsdoivcnt etre adresses a l'ESA. Division tiesPublications. ESTEC. Noordwijk. Pays-Bas (<tl'attention de B. Battrick).
Manuscripts and Illustrations Text es et illustrations
Abstract
Les textes doivent etre correctement dactylographies, au recto seulement, avec double interligne et unemarge suffisante a gauche. Les formules mathernatiques qui ne sont pas dactylographiees doivent ctresoigneusement ecrites a la main.
Les illustrations originales (dessins, photographies .. ). qui seront fournies sur des feuilles separees dutexte, doivent etre d'une qualite suffisantc pourpermettre une reproduction claire. Les dessins doiventetre assez nets et comporter des annotations assezgrandes pour rester lisibles apres reduction. Lesphotographies sur pa pier glace (format 18 x 24 cm)permettent les mcillcures reproductions. Unc listc deslegendes sera fournie sur une feuille separee, avecindication precise de la figure que chacune d'ellesaccompagne.
The manuscript should be neatly typed on one sideof the paper only. with double spacing and an adequateleft-hand margin. Mathematics, where not typed.should be very clearly written.
Diagrams and illustrations should be separate fromthe typescript and of sufficient quality to permitdistinct reproduction. Line drawings should be clear.with lettering large enough to be legible when reducedfor printing. Glossy photographs (approx. 18 x 24 cm)permit the best quality of reproduction. A separate listof captions and legends should be submitted. with aclear indication of which illustration they mustaccompany.
This should be as brief as possible (normally notmore than 150 words) and should summarise theconclusions of the paper. It should be self-explanatoryand not require reference to the paper itself. It shouldbe provided in both English and French wherepossible.
Resume
References
Chaque texte est accornpagne d'un resume succinct(pas plus de 150 mots) qui fait ressortir avec concisionJes points saillants ct les conclusions de l'etude. Ceresume sera fourni, dans la mesure du possible. enanglais et en francais.
Bibliographical references should be numbered andlisted at the end of the paper, and noted in the text withArabic indices.
For periodicals. the author's name. year of publication, title of the article. abbreviated name of theperiodical. volume number. issue number and pagenumbers should be quoted. For books, the author's oreditor's name. year of publication, title of the book.volume (where applicable). page numbers. name andlocation of publisher should be given.
References
Les references bibliographiques doivent etre nurnerotees et regroupees dans une liste a la fin du tcxtc.
Pour Jes periodiques, on indiquera dans l'ordre:nom(s) de(s) auteur(s). annee de publication. titre del'article, nom du periodique en abrege, nurneros duvolume et du fascicule, nombre de pages. Pour leslivres, on indiquera: nom(s) de(s) auteur(s) ouresponsable(s) de la publication. annee de publication.titre du livre, tome. pages concernees, editeur et lieu deparution.