Embed Size (px)
Citation preview


Summary
This Research Note presents species correction data for use with electric moisture meters in measuring the moisture content of five wood species grown in Hawaii, namely: saligna and robusta eucalyptus ( Eucalyptus saligna and Eucalyptus robusta ), silk-oak ( Grevillea robusta ), ohia ( Metrosideros collina ), and koa ( Acacia koa ). Indexes of direct current electrical resistance and radio frequency power absorption were obtained at a temperature of 80° F. and at moisture content values ranging from about 6 percent to above the fiber saturation point for each species.
The data were obtained using commercial moisture meters of both the resistance and radio frequency power-loss types. True moisture content was defined as that obtained by the ovendrying method.
Prepared in cooperation with the Pacific Southwest Forest and Range Experiment Station, U.S. Forest Service: the Forestry Division, Hawaii Depart- ment of Land and Natural Resources; and Hawaiian Fern-Wood, Ltd.
FPL-061 -i-

CALIBRATION OF ELECTRIC MOISTURE METERS
FOR SOME WOOD SPECIES GROWN IN HAWAII
WILLIAM L. JAMES, Physicist
1 Forest Products Laboratory, Forest Service
U.S. Department of Agriculture
Introduction
The value of electric moisture meters as tools for measuring the moisture content of wood has been demonstrated innumerable times. However, in order that the readings of these instruments be reliable, several factors such as species, temperature, moisture gradients, and chemical treatment should be considered.' The wood species is important because the electrical properties of the wood, upon which the meter calibrations are based, vary between species.
2
Electric moisture meters usually are calibrated to read moisture content directly for one species, and tables of corrections are provided for other species. Moisture meters made in the United States are commonly, but not always, calibrated for Douglas-fir ( Pseudotsuga menziesii ). Correction factors for native North American species rarely exceed 1 or 2 percent moisture content for resistance-type meters calibrated for Douglas-fir. Several small resistance- type meters are on the market that have a universal scale for which no species corrections are intended, and although the accuracy is reduced somewhat, they are still satisfactory for many applications.
1 Maintained at Madison, Wis., in cooperation with the University of Wisconsin, 2 James, Wm. L. Electric moisture meters for wood. U.S. Forest Service Research Note FPL-08,
1963.
FPL-061
By
For power-loss type meters, a universal calibration is not feasible because the species effects are too large. Similarly, universal calibrations for resistance- type meters cannot in general include tropical species, because these species frequently have moisture-resistance relationships that differ greatly from native North American species.
Data are presented for correcting electric moisture meter readings for each of the following five Hawaii-grown wood species studied, for which no comparable data are available: saligna and robusta eucalyptus ( Eucalyptus saligna and Eucalyptus robusta ), silk-oak ( Grevillea robusta ), ohia ( Metrosideros collina ) 3 , and koa ( Acacia koa ).
Description of the Experiment
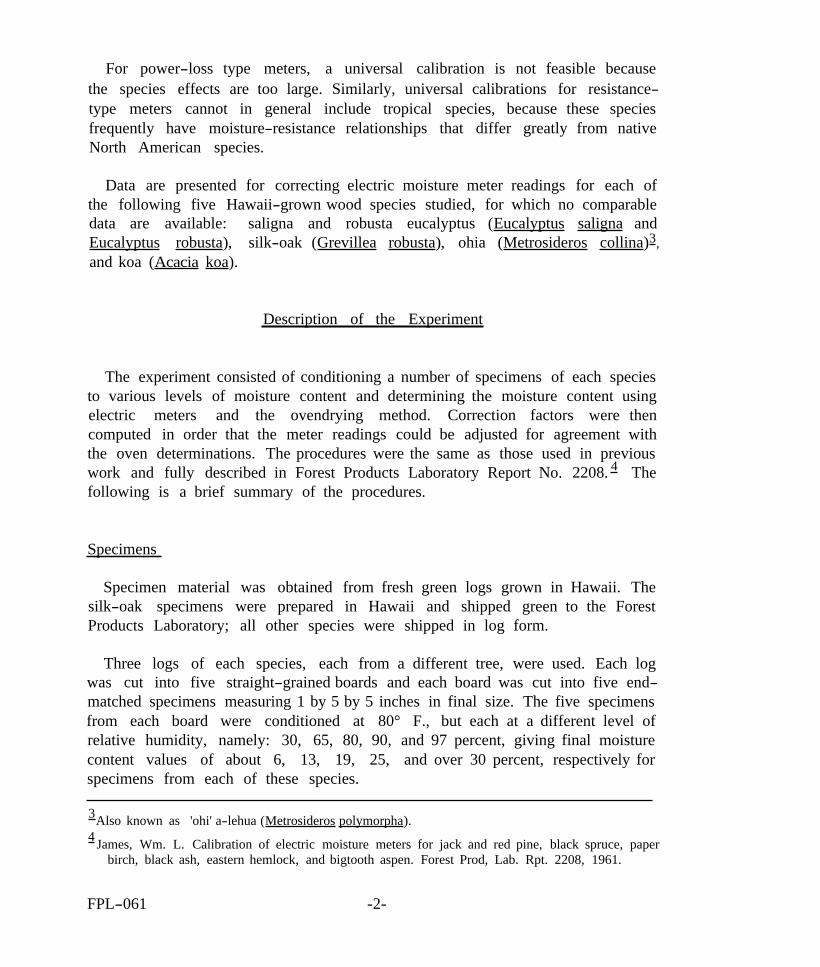
The experiment consisted of conditioning a number of specimens of each species to various levels of moisture content and determining the moisture content using electric meters and the ovendrying method. Correction factors were then computed in order that the meter readings could be adjusted for agreement with the oven determinations. The procedures were the same as those used in previous work and fully described in Forest Products Laboratory Report No. 2208. The following is a brief summary of the procedures.
4
Specimens
Specimen material was obtained from fresh green logs grown in Hawaii. The silk-oak specimens were prepared in Hawaii and shipped green to the Forest Products Laboratory; all other species were shipped in log form.
Three logs of each species, each from a different tree, were used. Each log was cut into five straight-grained boards and each board was cut into five end- matched specimens measuring 1 by 5 by 5 inches in final size. The five specimens from each board were conditioned at 80° F., but each at a different level of relative humidity, namely: 30, 65, 80, 90, and 97 percent, giving final moisture content values of about 6, 13, 19, 25, and over 30 percent, respectively for specimens from each of these species.
3 Also known as 'ohi' a-lehua ( Metrosideros polymorpha ). 4 James, Wm. L. Calibration of electric moisture meters for jack and red pine, black spruce, paper
birch, black ash, eastern hemlock, and bigtooth aspen. Forest Prod, Lab. Rpt. 2208, 1961.
FPL-061 -2-

All material to be conditioned at 30, 65, or 80 percent relative humidity was first placed in a room at 80 percent relative humidity for preconditioning. Similarly, the material to be conditioned at 90 and 97 percent humidity was preconditioned at 90 percent. A period of approximately 3 months was allowed for preconditioning, after which it was estimated the material should be below the fiber saturation point. Following preconditioning, the specimens were placed in their final conditioning environments.
After more than a year of final conditioning, the material preconditioned at 30 and 65 percent relative humidity had essentially stabilized, but the material preconditioned at 80 and 90 percent relative humidity was still losing weight at an appreciable rate. To speed the moisture stabilization of the specimens, they were moved alternately for 2- or 3-week periods between their final conditioning environment and drier environments, causing the weight losses to accelerate. This was continued until the specimens began to regain weight when returned to their final environments. When this occurred, they were left in the final environment for about 6 weeks andtheirweight checked every 1 or 2 weeks. After this period of time, specimens showing negligible weight change were considered stabilized, Material still changing in weight was moved temporarily into other humidities as dictated by the rate of weight gain or loss. This procedure was followed until every specimen showed nearly constant weight for a period of 2 or 3 weeks, at which time the material was considered to be in moisture equilibrium The total conditioning time was about 2 years.
Experimental Design
As described, the material was prepared in groups of five end-matched specimens, and one specimen from each group conditioned at a different humidity. In order to prevent any consistent effect of the sampling method from biasing the differences between humidities, the specimens were distributed into the humidity conditions according to 5 by 5 Latin squares. Details of this scheme were
4. previously reported.-
Apparatus
All data were collected using commercial moisture meters. One resistance and two radio frequency power-loss types were used. Both a two- and a four-pin electrode were used with the resistance meter, while the power-loss meters used all-purpose electrodes designed for either rough or smooth lumber. The meters are illustrated in figure 1.
FPL -0 61 -3-

When the wood specimens had come to constant weight in the various humidity rooms, readings were taken on each specimen using each of the three moisture meters. With the resistance-type meter, readings were taken on just one face of the specimens, but with the power-loss type meters, readings were taken on both faces and the average recorded. This was done because, in general, less variability was noted in the resistance-type meter readings than in those of the power-loss type meters. The weight of each specimen was obtained at the same time the meter readings were taken. The moisture content of every specimen was read with the resistance meter using the four-pin electrode, and five specimens from each species at each humidity were read using the two-pin electrode.
Because of the excessive time required for these species to reach stable moisture content, no attempt was made to repeat the experiment with specimen groups reconditioned at the different humidities.
After the weights and meter readings had been obtained and replicated once, the specimens were dried for 60 hours at 103° C. and the moisture content computed. The data for each species at each humidity were averaged and the standard deviation calculated.
Curves were then plotted from the averaged data obtained for each species at each moisture level, and from these curves correction factor charts were prepared.
Presentation of Results
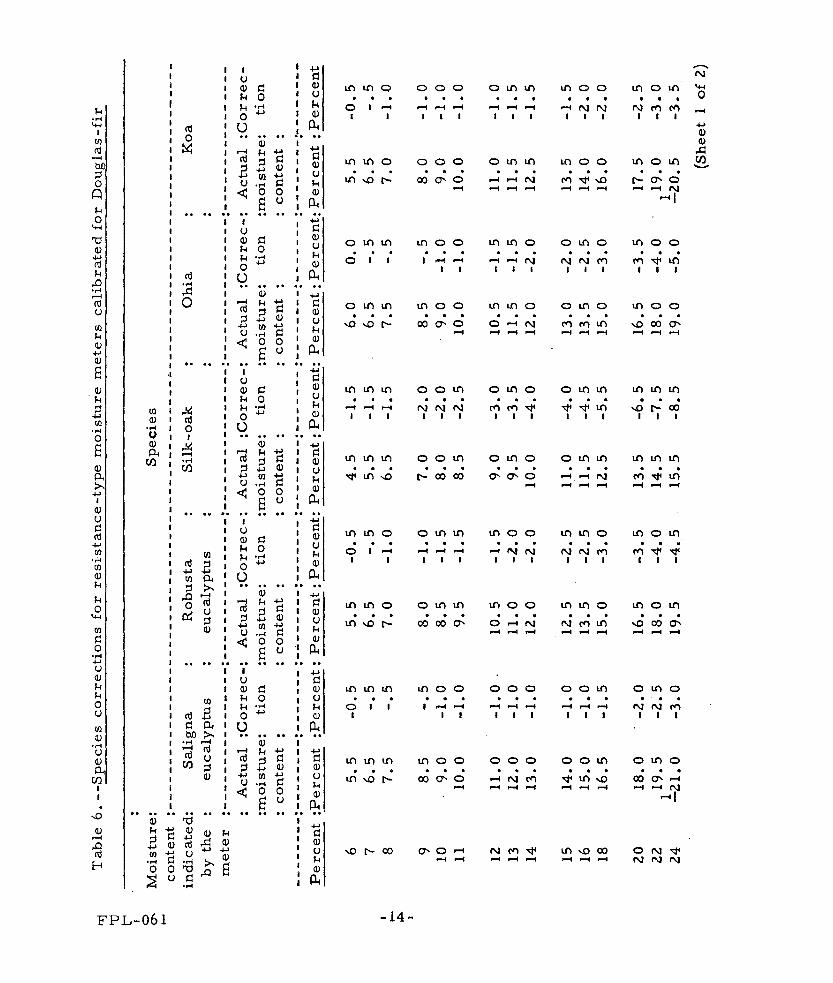
The data obtained from this study are presented in tables 1-9 and are shown graphically in figures 2-7. Tables 1-5 list the averages and standard deviations of moisture content data obtained with the electric moisture meters and the oven- drying method for each species and humidity level. Table 6 presents the species corrections to be added algebraically to readings when using a resistance-type meter calibrated for Douglas-fir. Figure 7 gives data for converting scale readings to moisture content when using power-loss type meters on these five Hawaii-grown species.
Table 8 shows the difference in readings of a resistance-type meter when using a two- or four-pin electrode, based only on those specimens for which readings were obtained with both types of electrodes.
FPL-061 -4-
Experimental Procedure

Table 9 lists the actual resistance values in megohms obtained for these species at various moisture content levels when using the four-pin electrode. These data were obtained from tables 1-5 by interpolation and using the cali- bration of the moisture meter as an ohmmeter.
Figures 2-6 show graphically the data given in tables 1-5, and figure 7 is a plot of the data given in table 9.
Discussion of Results
The specimen material representing the five Hawaii-grown species studied came to apparent moisture equilibrium at moisture levels somewhat higher than the nominal equilibrium levels of the conditioning rooms. This may be due to real species differences, but it is also believed to be partly due to the facts that: (1) some of the material approached equilibriumin the desorption direction exclusively, which would result in higher equilibrium moisture levels; and (2) the material showed low rates of change in moisture content, indicating that possibly true equilibrium was not attained.
These matters would not compromise the usefulness of the data for calibration of moisture meters, however, as long as the true moisture contents were correctly determined and there were no appreciable moisture gradients in the specimens.
The affinity of dry wood for water is so strong that it is difficult to determine the dividing line between hygroscopic water and water of constitution in wood. Thus, the determination or even the definition of wood moisture content is fundamentally difficult. A practical and reasonable solution to the problem, that has received general acceptance, is to define the moisture content of wood that is free of volatiles other than water as the result of an ovendrying moisture deter- mination following a prescribed procedure. Thus, the "true" moisture content in this study was determinedusing the standard ovendrying procedure. Furthermore, by observing resistance meter readings with the electrode pins driven into the specimen to progressively increasing depths, it was established that moisture gradients had no significant effect on the data obtained.
The electrical conductivity and power loss of these Hawaii-grown species at low moisture levels were not greatly different from typical native North American species. Consequently, for low moisture ranges, the species correction for resistance meters are not large, and the conversion factors for power-loss
FPL-061 -5-

meters are not unusual. At higher moisture levels, however, both the electrical conductivity and the power-loss factor of these species, especially silk-oak, increased remarkably. Consequently, the species calibrations for either type of meter at higher moisture levels are far different from those of any native North American species for which the corresponding electrical properties are known.
This unusually rapid increase in conductivity and power absorption with increasing moisture is similar to the behavior of salt-impregnated wood. Thus, this behavior is most readily explained by assuming that the wood contains soluble salts that ionize in the presence of loosely bound water. Whatever the basic reason is for this unusual behavior, it would appear that at higher moisture levels a relatively small variation in this basic factor could result in major changes in the dependent electrical properties. Therefore, it does not appear justified to place a high degree of confidence in the accuracy of electric moisture meters when used on these species at moisture levels above 15 or 20 percent. Subsequent data on the variability of the readings indicate that with some of these species the maximum moisture content at which electric moisture meters may be used with confidence is even lower than 15 percent.
The variability of the readings of the power-loss meters was observed to be greater than that of the resistance meters: thus, for the same level of confidence, in determining the mean moisture content of a given lot of material with a power- loss meter, a larger sample is required than when using a resistance meter.
The variability of electric moisture meter readings on these species seems to increase rapidly at moisture levels approaching or exceeding 20 percent. For resistance meters, the standard deviation of readings on material below 20 percent moisture ranged from about 3 to 6 percent of the mean, and for material over 20 percent moisture, 6 to over 10 percent of the mean. Similarly, for power-loss meters, the standard deviation of readings on material below 20 percent moisture ranged from about 4 to 10 percent of the mean, and for material near 20 percent moisture, from about 10 to 20 percent of the mean. A small fraction of the observed variability is due to variability in the actual moisture content. The significance of these variability values is that about one-half of the readings on a given sample can be expected to be in error by more than two-thirds of the standard deviation.
The calibration factors for power-loss meters on these species at extremely low or high moisture levels are subject to additional uncertainty because they were obtained by extrapolation of limited data. The power-loss factors increased
FPL-061 -6-

so rapidly with increasing moisture content that readings on all material conditioned at 90 or 97 percent relative humidity were above the range of the meters. For two of the species, this was also true of material conditioned at 80 percent humidity. Thus, power-loss data were obtained at only three moisture levels for three species, and at only two moisture levels for the other two species. These data points were insufficient to establish independently the relationship between loss factor and moisture content; so, in order to derive approximate calibration factors for use with power-loss meters on these species, a curve consistent with the generally observed form of the relationship between loss factor and moisture content for wood was fitted to the two or three data points that were obtained. In fitting this curve, consideration was also given to the fact that the upper limit to the range of moisture content covered by the curve was established by the lowest moisture content at which the readings of the meter exceeded its range.
Calibration factors were then read from the fitted curves, using both extrapolation and interpolation. It should be again emphasized that data obtained from these curves by extrapolation are approximate and can only be relied upon for rough estimates of moisture content.
In addition to the uncertainties involved in the estimated extrapolation of limited power-loss data, the large variability in the observed data, mentioned earlier, introduces large probable errors in the readings of power-loss meters in some moisture ranges where data were actually obtained. The data in tables 1-5 indicate that the standard deviations of the readings of power-loss meters increase rapidly as the moisture content of the specimen material exceeds 10 or 15 percent. Data for ohia appear to be unusually variable, but the samples used in this study were actually not sufficient to establish a real species difference in this regard. Instead, it appears most reasonable to conclude that the readings of power-loss meters on these species will be reliable only in the range of about 6 to 10 percent moisture content, and readings on material whose moisture content ex- ceeds these limits will be reliable only as rough estimates.
Readings of resistance-type meters using a two-pin electrode were lower than corresponding readings using a four-pin electrode by amounts greater than previously observed for other species. This unusually great difference between readings is consistent with the exceptionally high electrical conductivity of these species, especially at the higher moisture levels. The data (table 8) indicate that at moisture levels below 7 or 8 percent the differences between readings using the two- and four-pin electrodes are about 1/2 percent; and at 12 to 15 percent moisture content, the differences are about 1 percent. At moisture levels
FPL-061 -7-

near or above 20 percent, the differences exceed2 percent and are quite erratic, so that no average or approximate value could be specified that would be applicable to all five species.
Summary of Findings
The data presented permit approximate determinations of moisture content of the five Hawaii-grown wood species studied, when using electric moisture meters calibrated for Douglas-fir. However, because of the unusually large increase in electrical conductivity and power-loss factor with increasing moisture content, especially at the higher moisture levels, it appears unlikely that the moisture meter readings on these species would be reliable except for rough approximations of the true moisture content when the material is above about 15 percent moisture content using a resistance meter, or above about 10 percent when using a power-loss meter.
Differences between readings of resistance meters using the two- and four-pin electrodes were unusually large. When using the two-pin electrode for readings near or below 8 percent, one-half percentage point should be added to the reading; and for readings of about 10 to 15 percent moisture, add one percentage point. For readings over 15 percent, however, differences' ranged from 3 to over 10 percent, and no general correction appears to be possible.
The variability of readings of the power-loss meters was larger than that of the resistance meter, and as a result, for the same level of confidence, a larger sample is required when using a power-loss meter in a determination of the average moisture content of a lot.
FPL-061 -8- 1. -28

FPL-061 -9-

FPL-061 -10-

FPL-061 -11-

FPL-061 -12-

FPL-061 -13-


FPL-061 -18-

Figu
re
1.--
Type
s of
co
mm
erci
al
moi
stur
e m
eter
s us
ed
in
this
st
udy:
re
sist
ance
ty
pe
(left)
; ra
dio
freq
uenc
y po
wer
-los
s ty
pe
Mod
el
A
(cen
ter)
an
d M
odel
B
(r
ight
).
M 1
18 6
94

Figure 2.--Moisture meter readings versus actual moisture content as determined by ovendrying for saligna eucalyptus ( E . saligna ). The scale of resistance meters reads percent moisture content, but power-loss meters have an arbitrary linear scale.

Figure 3,--Moisture meter readings versus actual moisture content as determined by ovendrying for robusta eucalyptus ( E . robusta ). The scale of resistance meters reads percent moisture content, but power-loss meters have an arbitrary linear scale.
FPL-061

Figure 4.--Moisture meter readings versus actual moisture content as determined by ovendrying for silk-oak (Grevillea robusta), The scale of resistance meters reads percent moisture content, but power-loss meters have an arbitrary linear scale,

Figure 5.--Moisture meter readings versus actual moisture content as determined by ovendrying for ohia ( Metrosideros collina ). The scale of resistance meters reads percent moisture content, but power-loss meters have an arbitrary linear scale.
FPL-061

Figure 6.--Moisture meter readings versus actual moisture content as determined by ovendrying for koa ( Acacia koa ). The scale of resistance meters reads percent moisture content, but power-loss meters have an arbitrary linear scale.

Figure 7.--Actual resistance at 80° F. versus moisture content as determined by ovendrying. Resistance measurements were made using a standard four-pin electrode on all five Hawaiian species studied,
FPL-061
PUBLICATION LISTS ISSUED BY THE
FOREST PRODUCTS LABORATORY
The following lists of publications deal with investigative projects of the Forest Products Laboratory or relate to special interest groups and are avail- able upon request:
Box, Crate, and Packaging Data
Chemistry of Wood
Drying of Wood
Fire Protection
Fungus and Insect Defects in
Logging, Milling, and Utilization of Timber Products
Mechanical Properties of Timber
Pulp and Paper
Structural Sandwich, Plastic Laminates, and Wood-Base
Forest Products Components
Glue and Plywood Thermal Properties of Wood
Growth, Structure, and Wood Finishing Subjects
Wood Preservation
Architects, Builders, Engineers,
Identification of Wood
Furniture Manufacturers, Woodworkers, and Teachers of Woodshop Practice and Retail Lumbermen
Note: Since Forest Products Laboratory publications are so varied in subject matter, no single catalog of titles is issued. Instead, a listing is made for each area of Laboratory research. Twice a year, December 31 and June 30, a list is compiled showingnew reports for the previous 6 months. This is the only item sent regularly to the Laboratory’s mailing roster, and it serves to keep current the various subject matter listings. Names may be added to the mailing roster upon request.