Embed Size (px)
Citation preview

Spring 2014
CALGARY & REGION ECONOMIC O U T L O O K
2014-2024
calgary.ca/economy call 3-1-1

Calgary & Region Economic Outlook 2014-2024 | Spring 20142 calgary.ca/economy
Table of Contents
Executive Summary ..................... 3
Calgary ........................................... 6
Assumptions:
Alberta ..................................... 13
World Outside Alberta .......... 16
Forecast Tables ............................ 18
About Corporate Economics .... 26
Tsuu T'ina Nation
Irricana
Three Hills
Truchu
Crossfield
Carstairs
Didsbury
OldsSundre
StrathmoreChestermereLake
Nanton
Vulcan
High River
Okotoks
TurnerValley
BlackDiamond
Cochrane
Airdrie
Legend
Calgary Economic Region
Census Metropolitan Area
City of Calgary
t
Calgary Economic Region Map
Completed: April 2014

Executive Summary
3Calgary & Region Economic Outlook 2014-2024 | Spring 2014 calgary.ca/economy
EXECUTIVE SUMMARY
Calgary
� The pace of economic activity in Calgary will quicken in 2014 and 2015 in reaction to faster growth in the world outside Calgary, and increased investment activity arising from the need to repair the residential and non-residential structures damaged by the flood.
� The consumer price inflation rate for 2013 was estimated at 1.7 per cent, up from 1.0 per cent in 2012. Residential vacancy rates are expected to remain low in 2014, which would again push accommodation costs and consumer prices higher.
� Construction inflation has fluctuated around 3 per cent over the past few years. The outlook for non-conventional oil projects indicates continued expansion, but at the current pace.
� Construction activity would be driven by low vacancy rates in the residential sector in 2014 and 2015. Employment and population growth would also add to the need for new space and support building intentions. However, the value of building permits is expected to decline from $6.1 billion in 2013 and settle in the range of $3.9 to $4.9 billion by 2018.
� The city of Calgary’s population is projected to reach 1.274 million by 2018. The population is expected to grow by 77,600 persons or by 25,900 persons annually over the 2015-2018 period, down from the annual average of 27,600 for the 2012 to 2014 period.
Assumptions:
Alberta
� The Alberta economy will remain buoyant in 2014 thanks to solid oil production, and the reconstruction efforts from the widespread flooding in June 2013. Alberta’s economy is expected to grow at 3.3 per cent in 2014, and 3.0 per cent in 2015. An aging population would depress the economy’s potential growth rate towards the end of the forecast period as consumer and labour supply both grow at a slower pace.
� Crude oil prices stayed elevated in 2013 compared to historical levels. In the near term, the price discounts for Alberta producers would continue as long as the transportation bottleneck exists. It is expected that WTI crude oil prices will average US$93.80/bbl in 2014, and US$90.00/bbl in 2015.
� Natural gas prices at AECO spot in Alberta are expected to average $3.70/GJ in 2014 and $4.00/GJ in 2015. The discovery and development of large natural gas shale resources in North America has significantly increased supply in both the U.S. and Canada. As a result, natural gas prices remain below pre-2008 levels.
World Outside Alberta
� The Canadian economy is expected to expand by 2.2 per cent in 2014 and 2.4 per cent in 2015, up from 1.6 per cent in 2013. The economic growth rate is expected to decelerate from 2016 to the end of the forecast period as the economy grows in line with demographic change.
� U.S. economic growth should accelerate in 2014 as the adverse effects of a relatively tight fiscal policy weaken. Economic growth would also be boosted by historically low short-term interest rates.
� The developed countries should grow stronger in 2014 compared to 2013, while the pace of growth in the emerging countries should decelerate. Almost all regions in the world economy are expected to grow.

Executive Summary
Calgary & Region Economic Outlook 2014-2024 | Spring 20144 calgary.ca/economy
ConsumerSector
GovernmentSector
World outsideAlberta
BusinessSector
+
+
+
Lifting FactorsDragging Factors
• Risinginterestrates• Highconsumerdebtlevels• Negativenetmigration
• Reductioningovernmentspending
• U.S.economygrowsbelowitspotentialgrowthrate
• TheBRICeconomiesexperienceweakergrowth
• Thedevelopedeconomiesexperiencesignificantlyweakergrowth
• Escalationof geopoliticalinstabilityinEurope
• Theglobaleconomybecomessignificantlyprotectionist
• Depressednaturalgasprices• Saggingconsumerandbusiness
confidences• Lowhousingstarts• Lownon-residentialconstruction• Risinginterestrates
• Increasingemployment
• Stronggrowthintheemergingeconomies
• Confidenceinthedevelopedworldpromptingastrongerreboundindemand
• Risingoilprices• Lowinterestrates
Forecast Risks

Executive Summary
5Calgary & Region Economic Outlook 2014-2024 | Spring 2014 calgary.ca/economy
VariablePast Cycle 2012 - 2014 Average
Current Cycle 2015 - 2018 Average
Forecast Implications
Assumptions
World Gross Domestic Product (annual % change) 3.50 4.40
Positive economic growth would increase the economic base of the world economy over the 2015-2018 period. Larger economic and demographic bases would increase the demand for commodities. This would place upward pressure on commodity prices. It would have a negative effect on the municipal budget.
U.S. Real Gross Domestic Product Growth (chained 2005 dollar) (%) 2.10 2.93
Increased demand for Canadian (Alberta) exports such as oil and forest products would keep demand and prices high. Municipalities could expect to pay higher prices to purchase commodities over time.
Canada Real Gross Domestic Product Growth (chained 2007 dollar) (%) 2.00 2.37
Increased demand for Alberta exports such as oil and natural gas. This would increase the energy industry's cashflow and drive investment spending over time. The end result is continued economic growth. As the economy exhausts its spare capacity, inflation rates to trend higher. The impact on the municipal budget would be negative.
Prime Business Loan Rate (%) 3.04 5.22 Higher borrowing costs for municipal suppliers and these would increase their purchase costs. Municipalities would face higher borrowing costs.
Exchange Rate (US$/Cdn$) 0.98 0.93 Lower exchange rates would increase the purchase price of imports.
Crude Oil Price - WTI (US$/bbl) 96.40 93.40 Higher prices would increase the price for petroleum based commodities such as diesel fuel and asphalt.
Alberta Natural Gas Price - AECO/NIT ($/GJ) 2.80 4.20
This would increase municipalities’ heating (utility) costs and at the same time increase franchise fee revenues; assuming all things are equal. Both population and price levels are expected to be higher over time and this would have a positive impact on franchise fee revenues.
Alberta Average Wage Rate Increase for All Industries (%) (IHS) 2.7 2.4
Wage inflation would exceed price inflation; disposable incomes would increase. Municipal operating costs would increase as municipalities compete with the private sector for scarce labour.
Calgary - Forecast
Real Gross Domestic Product (%) 3.3 2.8 Positive economic growth would result in larger economic and demographic bases . Slower growth may allow for catch-up with infrastructure backlog.
Total Employment ('000 Persons) 827.8 918.0 Larger employment would result in an increased demand for non-residential spaces. This would increase property tax bases.
Total Employment Growth (%) 3.1 2.4 Non-residential building permitting fees may moderate over this period as employment grows at a slower rate.
Unemployment Rate (%) 4.8 4.4 This would constrain municipalities' ability to attract highly skilled staff. This would also place pressure on operating and capital costs.
Inflation Rate (%) 1.6 2.1 This would increase the operating cost for municipal partners.
Total Population ('000 Persons) 1,148 1,236 The demand for City services would increase over the previous period. In this period revenue bases that are tied to population size would be larger.
Total Population Growth (%) 2.5 2.0 The demand for services would grow at a slower rate compared to the previous period. Revenues that are tied to population growth would be lower.
Net Migration ('000 Persons) 17.9 14.0 Despite net migration growing at a slower rate, it remains the main source of population growth.
Household Formation ('000 Units) 11.3 11.7 On average, municipalities would be required to provide services to a slightly higher number of households each year.
Forecast Implications (2015-2018)

Calgary
Source: Statistics Canada, Corporate Economics.
FORECAST
2
3
4
5
6
Calgary: Vacany rate, absorption (12‐month‐moving‐average, billions of dollars)
Calgary CMA: Inflation rate(Annual average, 2004 ‐ 2024, per cent)
‐1
0
1
2
04 08 12 16 20 24
2
4
6
8
10
CER: Employment rate and (12‐month‐moving‐average)
CER: Employment growth rate(12‐month‐moving‐average, per cent)
‐4
‐2
0
2
04 05 06 07 08 09 10 11 12 13 14
Source: Statistics Canada, Corporate Economics.
Source: Conference Board of Canada, Corporate Economics.
FORECAST
3
6
9
Calgary: Vacany rate, absorption (12‐month‐moving‐average, billions of dollars)
CER: Gross domestic product growth rate(Annual average, 2004 ‐ 2024, per cent)
‐6
‐3
0
04 08 12 16 20 24
Calgary & Region Economic Outlook 2014-2024 | Spring 20146 calgary.ca/economy
Source: Statistics Canada, Corporate Economics.
CALGARY � The CER’s economic growth rate decelerated in 2013 to 3.4 per
cent, from 3.6 per cent in 2012, in response to slower growth in the world outside of Calgary. Relatively slower employment growth kept the rate of growth in consumer spending in check. Retail sales increased by 7.4 per cent in January 2014, on an annual basis, up from 4.5 per cent in January 2013. Moreover, economic activity was constrained by the disruption caused by the flooding in June 2013. Consequently growth was lower than what was previously forecasted in the spring. Consumer spending is forecast to trend higher as economic activity quickens. The pace of economic growth will accelerate in 2014 and 2015, in reaction to faster growth in the world outside Calgary and increased investment activity arising from the need to repair the residential and non-residential structures damaged by the flood.
� Total employment averaged 830,000 persons in 2013, up from 806,000 in 2012 and 776,000 in 2011. The pace of job creation slowed in 2013 to 2.6 per cent from the 2012 rate of 3.9 per cent, as the local job market adjusted to weaker oil prices and reduced investment spending in the Alberta economy. The 2013 floods and the associated work disruption served to further dampen the rate of job creation. The unemployment rate averaged 4.8 per cent in 2013, unchanged from 2012. The unemployment rate is expected to fall to 4.5 per cent by 2018 as employment growth exceeds labour force growth.
� The consumer price inflation rate (CPI) for 2013 was estimated at 1.7 per cent, up from 1.0 per cent in 2012. The increase in the overall price level mainly reflects higher shelter costs. Above average population growth resulted in an increased need for residential space and this drove the cost of housing higher. Residential vacancy rates are forecast to remain low in 2014 and 2015, which would again increase accommodation costs and drive consumer prices higher. A depreciated Canadian exchange rate relative to the U.S. dollar would increase the price for imported goods and place upward pressure on the overall inflation rate. Slower world economic growth would result in reduced price pressures for commodities, which should in turn, act as an offset to higher inflation rates. Consumer prices are expected to rise by 2.0 per cent in 2014, increase to 2.1 per cent in 2015, and remain at that rate until 2018 before falling back to 2.0 per cent for the rest of the forecast period.
� The apartment vacancy rate, already low in the thriving

Calgary
1.02
1.06
1.10
Calgary: Vacany rate, absorption (12‐month‐moving‐average, billions of dollars)
Calgary: Inflation rates ‐ consumer and house prices (index March 2008 = 1, January 2001 ‐ February 2014)
Consumer price index
0.90
0.94
0.98
08 09 10 11 12 13 14
House price index
7Calgary & Region Economic Outlook 2014-2024 | Spring 2014 calgary.ca/economy
Source: National Bank of Canada, Corporate Economics.
Source: National Bank of Canada, Corporate Economics.
Source: Statistics Canada, Corporate Economics.
18
24
30
36
42
100
120
140
160
180
Calgary: Vacany rate, absorption (12‐month‐moving‐average, billions of dollars)
Calgary: House price index(February 2001 ‐ February 2014)
House price index (2005=100) Percentage change
Index
‐12
‐6
0
6
12
0
20
40
60
80
01 04 07 10 13
Percentage change
8
10
12
14
Calgary: Vacany rate, absorption (12‐month‐moving‐average, billions of dollars)
Calgary CMA: Vacancy rates,apartment structures of six units and over
(1971 ‐ 2013, per cent)
0
2
4
6
71 78 85 92 99 06 13
Calgary economy, sank even lower in the aftermath of the flood of 2013. Months later, the vacancy rate sits below 1 per cent as the recovery effort has drawn in workers, particularly from the job-strapped provinces of British Columbia and Ontario. Consequently, the low vacancy rates are exerting upward pressure on rental rates as renters bid for available space.
� House prices are now close to their pre-recession peaks. Since 2008, the average house price has increased by less than the CPI or the average wage rate. Also in this period, mortgage rates have remained at historically low levels. These factors have combined to result in house prices in Calgary being relatively affordable compared to other Canadian cities. The outlook for house prices in 2017 onward is for modest increases near the rate of growth in consumer prices.
� The total sales of re-sale (MLS) housing was estimated at 23,486 units in 2013, up by 2,282 units from 2012. At the same time, total MLS listings were calculated at 34,386 units, down by 177 units from 2012. The MLS sales / listing ratio therefore increased sharply to 0.683 in 2013 from 0.613 in 2012, as growth in sales outstripped growth in listings. The sharp increase in the sales / listing ratio exerted upward pressure on the MLS median price (5.5 per cent). The combination of increasing re-sale prices, relatively low mortgage rates, and higher demographic (population and employment) levels has improved the conditions for new home construction. Over the forecast period, the combination of high house price inflation and higher mortgage rates would threaten the affordability of home ownership in Calgary. House prices are expected to increase by 3.5 per cent in 2014, then moderate to 3.0 per cent by 2019, and remain at that rate for the rest of the forecast period as house prices grow in line with wage rate increase.

Calgary
Source: Altus Insite, Corporate Economics.
8
10
12
14
Calgary: Vacany rate, absorption (12‐month‐moving‐average, billions of dollars)
Calgary: Total office space vacancy rate(per cent)
0
2
4
6
04 05 06 07 09 10 11 12 14
9
12
15
Calgary: Vacany rate, absorption (12‐month‐moving‐average, billions of dollars)
City of Calgary: Total household formation(2004 ‐ 2024, thousands of units)
3
6
04 08 12 16 20 24
FORECAST
Calgary & Region Economic Outlook 2014-2024 | Spring 20148 calgary.ca/economy
� The current downtown office vacancy rate in Calgary sits at over 8 per cent, up from 5 per cent only a few months ago. Nearly 800,000 square feet of space has been vacated recently with major moves out of the downtown core into the beltline and suburbs. The National Energy Board, several smaller energy companies, and a few mid-sized law firms have relocated into the beltline while CP rail and Esso are also relocating out of the core. As a result, not all of the currently announced construction projects will go ahead within the next 5 years. Downtown office market vacancies will likely fluctuate within the market range of 8-10 per cent over the forecast horizon while the traditionally higher vacancies in the surrounding areas will slowly whittle down.
� The total value of building permits was estimated at $6.1 billion in 2013, up from $4.4 billion in 2012. The growth in building permit values over the 2012-13 period was driven by both residential ($0.873 billion) and non-residential ($0.751 billion) investment. New single family permits were up 7 per cent in 2013 to 4,900, while permits for multi-family dwellings shot up 76 per cent with over 3,000 more apartments permitted compared to 2012. Given the delay between the beginning of construction and completion of new residential space, vacancy rates are expected to remain below measurable levels for at least 2 more years.
� Construction activity in 2014 and 2015, would be driven by low vacancy rates in the residential sector, while employment and population growth would also add to the need for new space and support building intentions. The population projections indicate that population growth would support an extra 11,500 housing units annually over the 2015-2018 period. Moreover, the need to re-build structures damaged by the recent floods would boost construction values in the short-term. The completion of office space currently under construction should have a dampening effect on non-residential space construction from 2016 to the end of the forecast period. The forecast calls for the value of building permits to decline from $6.1 billion in 2013, and settle in the range of $3.9 to $4.9 billion by 2018.
FORECAST
Source: The City of Calgary, Corporate Economics.
Source: The City of Calgary, Corporate Economics.
5
6
7
Calgary: Vacany rate, absorption (12‐month‐moving‐average, billions of dollars)
Mid‐pointLowHigh
City of Calgary: Total building permit value(Annual average, 2004 ‐ 2024, billions of dollars)
2
3
4
04 08 12 16 20 24

Calgary
Source: Statistics Canada, Corporate Economics.
Source: Statistics Canada, Corporate Economics.
Source: Statistics Canada, Corporate Economics.
5
10
15
20
Calgary: Vacany rate, absorption (12‐month‐moving‐average, billions of dollars)
Non‐residential building price inflation(per cent)
‐10
‐5
0
04 08 12 16 20 24
30
45
60
75
Calgary: Vacany rate, absorption (12‐month‐moving‐average, billions of dollars)
Asphalt price inflation(per cent)
Asphalt price inflation(per cent)
‐30
‐15
0
15
04 08 12 16 20 24
20
40
60
80
Calgary: Vacany rate, absorption (12‐month‐moving‐average, billions of dollars)
Asphalt price inflation(per cent)
Rubber price inflation(per cent)
‐40
‐20
0
04 08 12 16 20 24
FORECAST
FORECAST
FORECAST
9Calgary & Region Economic Outlook 2014-2024 | Spring 2014 calgary.ca/economy
Non-Residential Building Price Inflation
� Construction inflation has fluctuated around 3 per cent for the past few years. The outlook for non-conventional oil projects indicates continued expansion, but at the current pace. Few new oilsands jobs means that during the forecast period Calgary will stop losing trades people, beyond normal turnover. While oil prices are expected to stabilize in the mid $90’s, construction inflation is expected to moderate to the level of general inflation over the forecast horizon. That said, current construction of downtown office towers is causing market tightness for concrete, site delivery and some trades such as commercial plumbers. These issues are expected to continue for 2-3 more years.
Commodity markets were more volatile than expected during the U.S. election season. With the uncertainty of the election now behind us we look to calm commodity markets.
Commodity Prices
AsphaltHigher oil prices combined with a lower value of the Canadian dollar will serve to push up asphalt prices this season. Price declines last year will be eliminated and we anticipate prices to average $755/tonne, up from the winter price of $680. Prices are expected to soften over the forecast period to around $600 by 2024, mostly as a result of increased production capacity.
RubberWeather and oil prices cause dramatic shifts in prices making rubber markets the second most volatile in the world next to electricity. Barring any extreme weather events, recent oil price increases will cause international rubber prices to spike by nearly 20 per cent this year. Stabilizing global demand for rubber will dampen prices into the future and we anticipate only moderate price increases in line with general inflation for the remainder of the forecast horizon.

Calgary
Source: Statistics Canada, Corporate Economics.
Source: Altus Insite, Corporate Economics.
Source: Statistics Canada, Corporate Economics.
FORECAST
FORECAST
FORECAST
0
20
40
Diesel oil price inflation(per cent)
‐40
‐20
04 08 12 16 20 24
6
9
Calgary: Vacany rate, absorption (12‐month‐moving‐average, billions of dollars)
Asphalt price inflation(per cent)
Vehicle parts price inflation(per cent)
0
3
04 08 12 16 20 24
6
0
6
12
18
Calgary: Vacany rate, absorption (12‐month‐moving‐average, billions of dollars)
Asphalt price inflation(per cent)
Aluminum price inflation(per cent)
‐24
‐18
‐12
‐6
04 08 12 16 20 24
Calgary & Region Economic Outlook 2014-2024 | Spring 201410 calgary.ca/economy
Source: Statistics Canada, Corporate Economics.
DieselCalgary diesel prices spiked in 2011 when a major pipeline feeding Edmonton refineries leaked, resulting in significant refining downtime in Alberta. With oil prices and exchange rates firming, we expect some modest escalation in price in 2014 and continued inflationary increases thereafter.
Vehicle PartsCalgary Transit spends just over $20 million per year on vehicle parts. The City incurs additional charges for vehicle parts buried in lease agreements.
Vehicle sales are recovering somewhat faster than expected in the U.S. There were 15.9 million sales in 2013, up from 14.8 million in 2012. Pent-up demand, availability of low-rate financing and a return of easier credit terms are helping the U.S. auto industry recover quickly. As such, our forecast for price increases in vehicle parts has been revised to show moderately strong and consistent escalation throughout the forecast period.
Aluminum
Aluminum is a primary metal used in transportation, packaging, building, electrical and general goods. Since 2009, facilities in the U.S. have been struggling to re-start and in 2013 “temporary” closures became permanent. Production is moving to places where costs for electricity and shipping bauxite are cheaper. China and Saudi Arabia are now the primary producer locations. A Canadian attempt to smelt alumina using locally available clay instead of bauxite is viable, but not as cheap as was hoped. The existence of this technology is acting as a limit on international prices rather than bringing riches to Canada. With the U.S. imposing a rule that the average U.S. vehicle should achieve 55 mpg by 2020, demand for aluminum is set to expand. Indeed, the 2015 Ford F-150 will be made mostly of aluminum. Even so, we anticipate only moderate global price increases in aluminum throughout the forecast period.

Calgary
Source: Statistics Canada, Corporate Economics.
Source: Statistics Canada, Corporate Economics.
FORECAST
FORECAST
0
4
8
12
Asphalt price inflation(per cent)
Wood price inflation(per cent)
‐12
‐8
‐4
04 08 12 16 20 24
10
15
20
25
Iron and steel price inflation(per cent)
‐5
0
5
04 08 12 16 20 24
11Calgary & Region Economic Outlook 2014-2024 | Spring 2014 calgary.ca/economy
WoodCanadian wood markets are divided into 3 sectors: lengths, fibre-boards and pulp. As an input to construction projects and as a component of paper, The City is a large consumer of wood products.
Canada can produce enough wood lengths to frame 1.3 million houses per year. Housing starts in the U.S. have stalled since the start of the global recession, but recently U.S. housing starts grew to reach 1 million units (from 1.3 million per year on average before the recession). However, about half of those 1 million starts this year are multiplex dwellings traditionally constructed using other materials. Even though prices for boards are firming in the U.S. at around $400 per thousand feet, U.S. lumber production is ramping up to meet demand. We look for Canadian prices to bounce up and down by as much as 25 per cent in a single construction season while facilities re-start to meet demand, but expect prices to soften on a year-to-year basis over the forecast period.
Demand for pulp and paper is shrinking as electronic screens become the mainstream reading and advertising medium in North America. Due to the distance from international markets and rising electricity prices since construction, Alberta pulp mills are no longer globally competitive producers. However, since their local market is also a great distance from other suppliers, local producers have some price support. We look for Alberta pulp and paper prices to remain stable throughout the forecast period.
SteelSteel prices typically surge every 4 to 5 years as global economic activity, particularly in international trade, increases. It seems to cycle with the Olympic Games, but also depends on how far the host city is from major manufacturing facilities. Also, demand for cars and shipping containers are major drivers of steel demand. Prices for international shipping rose slightly in the usual last-minute rush to get facilities ready for the 2014 Olympics, but quickly fell and continue to hover at around 10 per cent of what they were just before the global recession. Demand for steel is growing moderately but there are signs growth is softening in developing countries. Our outlook is for modest increases in steel prices except in 2020. With the games returning to Tokyo, we anticipate Japan will take the opportunity to showcase one of the world’s largest cities.

Calgary
Source: City of Calgary Civic Census, Corporate Economics.
Source: City of Calgary Civic Census, Corporate Economics.
Source: City of Calgary Civic Census, Corporate Economics.
FORECAST
FORECAST
Calgary & Region Economic Outlook 2014-2024 | Spring 201412 calgary.ca/economy
Source: Statistics Canada, Corporate Economics.
2
3
4
City of Calgary: Population growth rate(2004‐2024, per cent)
0
1
04 08 12 16 20 24
5
10
15
Asphalt price inflation(per cent)
City of Calgary: Population change 2015‐2018(thousands of persons)
Average change
‐5
0
0‐4
5‐9
10‐14
15‐19
20‐24
25‐29
30‐34
35‐39
40‐44
45‐49
50‐54
55‐59
60‐64
65‐69
70‐74
75‐79
80‐84
85‐89
90+
500
550
600
City of Calgary: Households(thousands of persons)
400
450
12 14 16 18 20 22 24
Population - City of Calgary
� Calgary’s population is projected to reach 1.274 million by 2018, up from 1.196 million in 2015. The population is expected to grow by 77,600 persons or by 25,900 persons annually over the 2015-18 period, down from the annual average of 27,500 for the 2012 to 2014 period. The annual growth rate for the 2015 to 2018 period is estimated at 1.9 per cent, down from 2.4 per cent over the 2012-14 period.
� In this period net migration is expected to account for 46,000 of the 77,600 population growth, with natural increase accounting for the remaining 31,600. Net migration would be influenced by the relatively low unemployment rates in Calgary and Alberta compared to Canada. Meanwhile, the rate of natural increase is projected to slow over the forecast period as the death rate grows faster than the birth rate. A lack of apartment vacancies will temper the population growth in the City in 2014 with some migrants electing to reside in the region instead. Thereafter, Calgary will experience a slowing in net migration as the rest of the Canadian and World economy improves.
� The age distribution of Calgary’s population would shift by 2018, in response to the combination of population aging, net migration and natural increase. The largest population increases would be experienced by the 60-64 cohort (11,500), and the 35-39 cohort (10,500). The increase in the 60-64 age group represents aging of the baby boomers, while growth in the 35-39 age group comes from the effects of net migration as a source for economic growth.
� The number of households is expected to reach 500,600 in 2018, up from 465,400 in 2015, an increase of 35,200. This should drive the demand for additional housing units and government services.

13Calgary & Region Economic Outlook 2014-2024 | Spring 2014 calgary.ca/economy
AlbertaAssumption:
ALBERTA � The Alberta economy will remain buoyant in 2014 thanks
to solid oil production and the reconstruction efforts from widespread flooding in June 2013. Business investment in the oil sands and related sectors should be a key driver of economic activity in the province in 2014. A tight labour market, higher incomes and a healthy flow of in-migration will also boost the province’s fortunes in 2014. However, with oil price growth moderating, oil sands investment should be essentially flat in the medium term. The forecast is therefore for real business investment to increase by 4.7 per cent in 2014, followed by another 4.4 per cent in 2015. Alberta’s economy is expected to grow at 3.3 per cent in 2014, and 3.0 per cent in 2015. An aging population would depress the economy’s potential growth rate towards the end of the forecast period as consumer and labour supply both grow at a slower pace.
� With the labour market tightening, wage growth in Alberta has accelerated and remained well above the national average. In 2013, personal income per capita in Alberta increased 3.9 per cent over 2012. Wages are forecast to increase another 3.2 per cent in 2014, and 3.4 per cent in 2015. This should continue to support consumer spending and retailers will benefit from these conditions going forward. Retail sales posted strong growth of 5.9 per cent in Alberta in 2013. Demographics also played a role in boosting Alberta’s retail performance. With a relatively young average age than other provinces, Albertans tend to purchase more per capita. Retail sales are expected to grow by 4.1 per cent in 2014 and 5.1 per cent in 2015, respectively.
� Crude oil prices remained elevated in 2013 compared to historical levels. The price discount for Canada Western Select (WCS) compared with West Texas Intermediate (WTI) has fluctuated widely since 2012, due to transportation and refinery constraints. Given the increasing production capacity, the need for additional transportation has become a priority for Canadian oil producers. Rail transportation of crude oil has increased substantially, helping to alleviate some of the strain on the current pipeline network. In the near term, price discounts for Alberta producers should continue as long as the transportation bottleneck exists. It is expected that WTI crude oil prices will average at US$93.80/bbl in 2014 and US$90.00/bbl in 2015.
FORECAST
Source: IHS Global Insight, Statistics Canada, Corporate Economics.
Source: IHS Global Insight, Conference Board of Canada, Corporate Economics.
Alberta: GDP and non‐residential construction investment(2004 ‐ 2024)
05 08 11 14 17 20 23 Inve
stm
ent i
n N
on-R
esid
entia
l Con
stru
ctio
nbi
llion
s of
dol
lars
0
20
40
60
Alb
erta
GD
P G
row
th R
ate,
%
-5
0
5
10Investment in non‐residential construction Alberta GDP growth rate
Source: IHS Global Insight, Conference Board of Canada, Corporate Economcis
Alberta: Retail sales and personal income growth(2000 ‐ 2018)
2000 2003 2006 2009 2012 2015 2018
Alb
erta
Ret
ail S
ales
Gro
wth
, %
-10
-5
0
5
10
15
20
Alb
erta
Per
sona
l Inc
ome
Gro
wth
, %
-8
-4
0
4
8
12
16
Retail salesPersonal income
Source: IHS Global Insight, Statistics Canada, Corporate Economcis
Source: U.S. Energy Information Administration, Federal Reserve Bank of St. Louis, Bloomberg, NetEnergy, Natural Gas Exchange, Cenovus, Corporate Economics.
Source: U.S. Energy Information Administration, Deferal Reserve Bank of St. Louis, Bloomberg, NetEnergy, Natural Gas Exchange, Cenovus, Corporate Economics
International and Alberta crude oil prices(Q1 2005 ‐ Q4 2013, US$/barrel)
05 06 07 08 09 10 11 12 13 0
25
50
75
100
125
150
175West Texas IntermediateBrent Crude
Western Canadian Select
Alberta: GDP and non‐residential construction investment(2004 ‐ 2024)
04 08 12 16 20 24 Inve
stm
ent i
n N
on-R
esid
entia
l Con
stru
ctio
nbi
llion
s of
dol
lars
0
20
40
60
Alb
erta
GD
P G
row
th R
ate,
%
Investment in non‐residential construction Alberta GDP growth rate
Source: IHS Global Insight, Conference Board of Canada, Corporate Economcis
Alberta: Retail sales and personal income growth(2000 ‐ 2018)
2000 2003 2006 2009 2012 2015 2018
Alb
erta
Ret
ail S
ales
Gro
wth
, %
-10
-5
0
5
10
15
20
Alb
erta
Per
sona
l Inc
ome
Gro
wth
, %
-8
-4
0
4
8
12
16
Retail salesPersonal income
Source: IHS Global Insight, Statistics Canada, Corporate Economcis
Alberta: GDP and non‐residential construction investment(2004 ‐ 2024)
05 08 11 14 17 20 23 Inve
stm
ent i
n N
on-R
esid
entia
l Con
stru
ctio
nbi
llion
s of
dol
lars
0
20
40
60
Alb
erta
GD
P G
row
th R
ate,
%
-5
0
5
10Investment in non‐residential construction Alberta GDP growth rate
Source: IHS Global Insight, Conference Board of Canada, Corporate Economcis

FORECAST
Calgary & Region Economic Outlook 2014-2024 | Spring 201414 calgary.ca/economy
AlbertaAssumption:
Source: GLJ Canadian Natural Gas Focus database, U.S. Energy Information Administration, Corporate Economics.
Source: GLJ Canadian Natural Gas Focus database, Corporate Economics.
Source: U.S. Energy Information Administration, Corporate Economics.
2010 2012 2014 2016 2018 20200
3
6
9Tight Oil US Total Production
Source: GLJ Canadian Natural Gas Focus database, Corporate Economics, U.S. Energy Information Administration
U.S. crude oil and liquid fuels production(Annual average, 2010‐2020, million barrels per day)
Alberta: AECO spot market prices(2003 ‐ 2013,C$/GJ)
03 04 05 06 08 09 10 11 13 0
3
6
9
12
15Monthly exports to U.S. 12-month-moving-average
Source: U.S. Energy Information Administration, Corporate Economics
2000 2003 2006 2009 2012 2015 20180
2
4
6
8
10
AECO natural gas price
Source: GLJ Canadian Natural Gas Focus database, Corporate Economics, U.S. Energy Information Administration
AECO natural gas price(Annual average, 2000 ‐ 2018, C$/GJ)
� The United States has been the major export destination for Alberta crude oil products. With rapid growth in the U.S. domestic oil supply, the demand for Alberta crude has decelerated. U.S. domestic crude oil output increased 1.0 million bbl/d in 2013, thanks to tight oil production. This was the biggest increase in the U.S. in the past 24 years. The U.S. Energy Information Administration expects strong crude oil production growth, primarily concentrated in the Bakken, Eagle Ford, and Permian regions, to continue through 2020. In the medium to long term, this should put downward pressure on bitumen prices and oil sands investment in Alberta. In the near term, U.S. demand for Canadian crude should continue, since most of the U.S. refineries are geared for dealing with Alberta bitumen. Canadian oil sands usually have a flat production profile and a long reserve life. This should provide greater stability relative to the U.S. tight oil plays, which mitigates a key risk with any long-term projects.
� In 2013, Alberta natural gas prices at AECO spot averaged $3.01/GJ, about one third higher than the 2012 average of $2.27/GJ. Natural gas prices advanced in the first half of last year in response to increased power generation demand, but dipped in Q3 2013 due to the extra supply in the province caused by a temporary disruption in pipeline transportation. Prices surged in the last quarter of 2013 in response to extremely cold weather. Cold weather boosted the demand for heating fuel, and prompted record-high withdrawals from storage. Inventories at the end of this heating season should drop to the lowest levels since 2008. The reduction in working gas storages should keep natural gas prices elevated. Production was disrupted in several areas of the U.S. and resulted in increased imports from Canada to mitigate the loss of supply.
� Natural gas prices at AECO spot in Alberta are expected to average $3.70/GJ in 2014 and $4.00/GJ in 2015. The discovery and development of large natural gas shale resources in North America have significantly increased supply in both the U.S. and Canada. As a result, natural gas prices remain below pre-2008 levels. Relatively low natural gas prices support coal-to-gas switching in power generation in the medium term. Higher natural gas production should also support increases in exports of both pipeline and liquefied natural gas. For Alberta producers, transportation remains a critical issue, particularly during peak demand periods.
2010 2012 2014 2016 2018 20200
3
6
9Tight Oil US Total Production
Source: GLJ Canadian Natural Gas Focus database, Corporate Economics, U.S. Energy Information Administration
U.S. crude oil and liquid fuels production(Annual average, 2010‐2020, million barrels per day)
2000 2003 2006 2009 2012 2015 20180
2
4
6
8
10
AECO natural gas price
Source: GLJ Canadian Natural Gas Focus database, Corporate Economics, U.S. Energy Information Administration
AECO natural gas price(Annual average, 2000 ‐ 2018, C$/GJ)

FORECAST
FORECAST
FORECAST
15Calgary & Region Economic Outlook 2014-2024 | Spring 2014 calgary.ca/economy
AlbertaAssumption:
Source: CMHC, Conference Board of Canada, Corporate Economics.
Source: Statistics Canada, Conference Board of Canada, Corporate Economics.
Source: Statistics Canada, Conference Board of Canada, Corporate Economics.
Alberta: Housing starts and population growth(2000 ‐ 2018)
2000 2003 2006 2009 2012 2015 2018
Alb
erta
Hou
sing
Sta
rts, '
000
units
0
12
24
36
48
60
Alb
erta
Pop
ulat
ion
Gro
wth
, %
1.0
1.5
2.0
2.5
3.0
3.5Housing starts in Alberta Alberta population growth
Source: CMHC, Conference Board of Canada, Corporate Economcis
Alberta: Unemployment rate and employment growth(2000 ‐ 2024, per cent)
2000 2003 2006 2009 2012 2015 2018 2021 2024-3
0
3
6
9Unemployment RateEmployment Growth
Source: Statistics Canada, Conference Board of Canada, Corporate Economcis
Alberta: Inflation and wage growth(2000 ‐ 2018, per cent)
2000 2003 2006 2009 2012 2015 2018-2
0
2
4
6
8
Average weekly wage growthAlberta inflation rate
Source: Statistics Canada, Conference Board of Canada, Corporate Economcis
� Healthy economic growth in Alberta continues to drive employment to new heights. Job creation was strong in 2013, with an annual employment growth rate of 2.8 per cent. Improved job opportunities attracted migrants to the province at a faster pace in 2012 and 2013. Job gains are expected to outpace the growth in the labour force throughout the forecast period. The unemployment rate was 4.6 per cent in 2013, and should fall to 4.5 per cent in 2014.
� Housing starts are estimated at 35,800 in 2013, up 8 per cent over 2012. Single-family starts rose by 5 per cent, while multi-family activity increased 11 per cent. It will be another busy year for Alberta’s new home builders and renovators in 2014, supported by the record-high in-migration level in 2013. Looking ahead, improving economic activity in other provinces in Canada should lead to an easing in interprovincial migration into Alberta. We expect total housing starts to increase by 3 per cent in 2014, and moderate slightly after 2015.
� The consumer inflation rate (CPI) was 1.4 per cent in 2013, up from 1.1 per cent in 2012. Consumer prices picked up slightly toward the end of 2013, driven mainly by higher gasoline prices. Aside from energy prices, the CPI index increased in reaction to higher shelter costs.
� Wage growth continues to exceed the inflation rate, which supports growth in real purchasing power and increased consumer confidence in Alberta. In the near term slack in the economy, as well as heightened competition in the retail sector, should moderate the growth in inflation. Inflation is expected to remain soft in 2014 at 1.9 per cent, and gradually move upward to 2.0 per cent in 2015, and 2.1 per cent in 2016.
Alberta: Retail sales and personal income growth(2000 ‐ 2018)
2000 2003 2006 2009 2012 2015 2018
Alb
erta
Ret
ail S
ales
Gro
wth
, %
-10
-5
0
5
10
15
20
Alb
erta
Per
sona
l Inc
ome
Gro
wth
, %
-8
-4
0
4
8
12
16
Retail salesPersonal income
Source: IHS Global Insight, Statistics Canada, Corporate EconomcisAlberta: Inflation and wage growth
(2000 ‐ 2018, per cent)
2000 2003 2006 2009 2012 2015 2018-2
0
2
4
6
8
Average weekly wage growthAlberta inflation rate
Source: Statistics Canada, Conference Board of Canada, Corporate Economcis
Alberta: Unemployment rate and employment growth(2000 ‐ 2024, per cent)
2000 2003 2006 2009 2012 2015 2018 2021 2024-3
0
3
6
9Unemployment RateEmployment Growth
Source: Statistics Canada, Conference Board of Canada, Corporate Economcis

Assumption:
World Outside Alberta
FORECAST
FORECAST
FORECAST
Source: Conference Board of Canada, Corporate Economics.
Source: Conference Board of Canada, Corporate Economics.
Source: Conference Board of Canada, Corporate Economics.
0
2
4
Calgary: Vacany rate, absorption (12‐month‐moving‐average, billions of dollars)
Canada: Gross domestic product growth rate(Annual average, 2004 ‐ 2024, per cent)
‐4
‐2
04 08 12 16 20 24
0
2
4
Calgary: Vacany rate, absorption (12‐month‐moving‐average, billions of dollars)
U.S: Gross domestic product growth rate(Annual average, 2004 ‐ 2024, per cent)
‐4
‐2
04 08 12 16 20 24
2
3
4
5
6
Calgary: Vacany rate, absorption (12‐month‐moving‐average, billions of dollars)
World: Gross domestic product growth rate(Annual average, 2004 ‐ 2024, per cent)
‐1
0
1
2
04 08 12 16 20 24
Calgary & Region Economic Outlook 2014-2024 | Spring 201416 calgary.ca/economy
Source: Statistics Canada, Corporate Economics.
WORLD OUTSIDE ALBERTA � The pace of economic growth in Canada will quicken
in 2014 and 2015, as the U.S. economy shifts to higher growth rates as fiscal policy becomes less restrictive. As the pace of U.S. economic activity quickens, the demand for Canadian exports would increase and this would be further aided by a weaker Canadian dollar. The Canadian economy is forecast to expand by 2.2 per cent in 2014 and 2.4 per cent in 2015, up from 1.6 per cent in 2013. The economic growth rate is expected to decelerate from 2016 to the end of the forecast period as the economy grows in line with demographic change. Higher levels of economic activity would result in a reduction of the economy’s spare capacity and an increase in inflationary pressures. Consequently, the Bank of Canada should begin tightening monetary policy in order to reduce inflationary pressures in the economy by 2015.
� The U.S. economic growth rate averaged 1.6 per cent in 2013, down from 2.8 per cent in 2012 in response to tighter fiscal policy brought on by sequestration. Higher taxes and public sector job losses have combined to reduce consumer and business confidence and depress the rate of economic growth. Private sector job growth, an improving housing market and increased domestic oil production from shale should combine to offset some of the negative effects of fiscal policy. Economic growth should accelerate in 2014 as the adverse effects of a relatively tight fiscal policy weaken. Economic growth would also be boosted by historically low short-term interest rates.
� The forecast for the global stage in 2014 is for the developed countries to grow at a stronger pace than 2013, while the pace of growth in the emerging countries should decelerate. Most regions in the world economy are expected to grow. We continue to expect positive growth from the developing countries given the expectations of increased demand from the developed nations for imports, which should drive net exports of these countries and further stimulate world economic activity.

World Outside AlbertaAssumption:
FORECAST
Source: Conference Board of Canada, Corporate Economics.
4
6
8
Calgary: Vacany rate, absorption (12‐month‐moving‐average, billions of dollars)
World: Inflation rates(Annual average, 2004 ‐ 2018, per cent)
0
2
04 06 08 10 12 14 16 18
17Calgary & Region Economic Outlook 2014-2024 | Spring 2014 calgary.ca/economy
� Output growth for the global economy is expected to rise in 2014 to around 3.7 per cent and to 3.9 per cent in 2015. Growth is projected to continue into 2018, averaging around 4.6 per cent over the 2015-2018 forecast period.
� Moderate growth in the developed and emerging countries will keep pressure on commodity markets relatively subdued and therefore global inflation under less pressure. Inflation is expected to fall from 3.7 per cent in 2013 to 3.6 per cent in 2014, and edge down further to 3.4 per cent in 2015.

Forecast Tables
Calgary & Region Economic Outlook 2014-2024 | Spring 201418 calgary.ca/economy
Table 1 - Selected Economic Indicators
Rest of the World, United States, Canada, Alberta, Calgary Economic Region (CER) & Calgary Census Metropolitan Area (CMA)
2004 2005 2006 2007 2008 2009 2010 2011 2012 2013
ASSUMPTIONS
Global Economy
World Gross Domestic Product (annual % change) 4.9 4.5 5.2 5.4 2.8 -0.6 5.3 3.9 3.2 3.6
The United States
U.S. Real Gross Domestic Product Growth (chained 2005 dollar) (%) 3.5 3.1 2.7 1.9 -0.3 -3.5 2.4 1.8 2.8 1.6
Canada
Canada Real Gross Domestic Product Growth (chained 2007 dollar) (%) 3.1 3.0 2.8 2.2 0.7 -2.8 3.2 2.6 1.7 1.6
Prime Business Loan Rate (%) 4.0 4.4 5.8 6.1 4.7 2.4 2.6 3.0 3.0 3.0
Exchange Rate (US$/Cdn$) 0.77 0.83 0.88 0.93 0.94 0.88 0.97 1.01 1.00 0.97
Alberta
Gross Domestic Product (%) 5.5 4.8 6.2 2.1 1.0 -4.4 3.3 5.2 3.5 3.3
Total Employment Growth (%) 2.6 2.7 4.9 3.8 3.1 -1.4 -0.4 3.8 2.6 2.8
Unemployment Rate (%) 4.6 3.9 3.4 3.5 3.6 6.6 6.5 5.5 4.6 4.6
Housing Starts ('000 Units) 36.3 40.8 49.0 48.3 29.2 20.3 27.1 25.7 33.4 35.8
Inflation Rate (%) 1.4 2.1 3.9 4.9 3.2 -0.1 1.0 2.4 1.1 1.4
Crude Oil Price - WTI (US$/bbl) 41.40 56.50 66.10 72.30 99.60 61.80 79.50 95.10 94.10 98.00
Western Canadian Select - WCS (US$/bbl) 54.85 36.20 45.00 49.60 79.60 52.10 65.30 77.97 73.14 72.80
Alberta Natural Gas Price - AECO/NIT ($/GJ) 3.50 5.70 4.60 6.40 7.70 3.80 3.80 3.43 2.27 3.00
FORECAST
Calgary Economic Region (CER)
Gross Domestic Product (%)* 5.0 4.9 4.7 6.2 1.1 -3.8 5.1 5.3 3.6 3.4
Total population** 1,119 1,152 1,188 1,230 1,251 1,296 1,338 1,362 1,398 1,435
Total Employment ('000 Persons) 643 649 718 745 768 765 755 776 806 830
Total Employment Growth (%) 3.1 1.0 8.0 3.8 3.1 -0.4 -1.3 2.8 3.9 2.6
Unemployment Rate (%) 5.0 3.9 3.4 3.2 3.3 6.3 7.0 6.2 4.8 4.8
Inflation Rate (%) (CMA) 1.7 2.0 4.6 5.0 3.2 -0.1 0.8 2.2 1.0 1.7
Building Permits ($billion) 3.1 4.3 6.0 7.1 5.1 4.5 3.8 5.5 5.6 7.5
Low Forecast N/A N/A N/A N/A N/A N/A N/A N/A N/A N/A
High Forecast N/A N/A N/A N/A N/A N/A N/A N/A N/A N/A
Housing Starts ('000 Units) (CMA) 14.0 13.7 17.0 13.5 11.4 6.3 9.3 9.3 12.8 12.6
Non-Residential Building Price Inflation (%) (CMA) 6.7 6.9 12.8 17.7 13.7 -7.7 -2.2 2.7 3.7 1.2
Numbers may not add up due to rounding * Source: Centre for Spatial Economics, Corporate Economics** Total population, census divisions and census metropolitan areas, 2001 Census boundaries

Forecast Tables
19Calgary & Region Economic Outlook 2014-2024 | Spring 2014 calgary.ca/economy
Table 1 - Selected Economic Indicators
Rest of the World, United States, Canada, Alberta, Calgary Economic Region (CER) & Calgary Census Metropolitan Area (CMA)
FORECAST COMPLETED: March 2014 BASE FORECAST
2014 2015 2016 2017 2018 2019 2020 2021 2022 2023 2024
ASSUMPTIONS
Global Economy
World Gross Domestic Product (annual % change) 3.7 3.9 4.5 4.6 4.6 4.6 4.6 4.6 4.6 4.6 4.6
The United States
U.S. Real Gross Domestic Product Growth (chained 2005 dollar) (%) 2.6 3.4 3.5 2.7 2.2 2.2 2.2 2.2 2.2 2.2 2.2
Canada
Canada Real Gross Domestic Product Growth (chained 2007 dollar) (%) 2.2 2.4 2.5 2.4 2.2 2.2 2.2 2.2 2.1 2.1 2.1
Prime Business Loan Rate (%) 3.0 3.2 4.8 6.4 6.5 6.7 6.7 6.5 6.5 6.5 6.5
Exchange Rate (US$/Cdn$) 0.95 0.95 0.94 0.92 0.91 0.91 0.91 0.91 0.91 0.91 0.91
Alberta
Gross Domestic Product (%) 3.3 3.0 2.7 2.6 2.6 2.8 2.7 2.7 2.5 2.6 2.6
Total Employment Growth (%) 2.2 2.0 1.5 1.3 1.4 1.3 1.4 1.3 1.3 1.3 1.4
Unemployment Rate (%) 4.5 4.2 4.3 4.4 4.2 4.4 4.3 4.2 4.2 4.1 4
Housing Starts ('000 Units) 37.1 36.0 35.1 34.8 34.3 41.6 38.9 37.4 36.5 36.1 36.1
Inflation Rate (%) 1.9 2.0 2.1 2.2 2.1 2.2 2.3 2.3 2.2 2.3 2.3
Crude Oil Price - WTI (US$/bbl) 93.80 90.00 92.70 95.00 95.70 97.00 98.50 100.50 102.50 103.70 104.40
Western Canadian Select - WCS (US$/bbl) 78.40 72.20 75.00 79.80 81.00 81.80 82.90 83.50 84.60 85.80 87.20
Alberta Natural Gas Price - AECO/NIT ($/GJ) 3.73 3.99 4.12 4.22 4.32 4.25 4.69 4.90 4.82 4.96 5.22
FORECAST
Calgary Economic Region (CER)
Gross Domestic Product (%)* 3.5 3.2 2.7 2.6 2.6 2.8 2.7 2.7 2.5 2.6 2.6
Total population** 1,467 1,493 1,527 1,562 1,590 1,615 1,640 1,664 1,688 1,711 1,734
Total Employment ('000 Persons) 860 885 905 925 945 965 985 1,005 1,025 1,045 1,065
Total Employment Growth (%) 3.6 2.9 2.3 2.2 2.2 2.1 2.1 2.0 2.0 2.0 1.9
Unemployment Rate (%) 4.6 4.4 4.3 4.5 4.5 4.4 4.3 4.3 4.2 4.2 4.1
Inflation Rate (%) (CMA) 2.0 2.1 2.1 2.1 2.1 2.0 2.0 2.0 2.0 2.0 2.0
Building Permits ($billion) 7.0 6.0 5.6 5.6 5.5 5.5 5.5 5.5 5.5 5.5 5.5
Low Forecast 6.4 5.4 5.0 5.0 4.9 4.9 4.9 4.9 4.9 4.9 4.9
High Forecast 7.6 6.6 6.3 6.3 6.1 6.1 6.1 6.1 6.1 6.1 6.1
Housing Starts ('000 Units) (CMA) 12.5 13.5 15.0 15.4 13.5 12.6 12.4 12.1 11.7 11.5 11.3
Non-Residential Building Price Inflation (%) (CMA) 2.7 0.7 2.4 2.8 2.5 1.9 1.3 1.5 1.6 2.0 2.4
Numbers may not add up due to rounding * Source: Centre for Spatial Economics, Corporate Economics** Total population, census divisions and census metropolitan areas, 2001 Census boundaries

Forecast Tables
Calgary & Region Economic Outlook 2014-2024 | Spring 201420 calgary.ca/economy
Table 2 - Selected Indicators for City of Calgary
City of Calgary
FORECAST COMPLETED: March 2014
2004 2005 2006 2007 2008 2009 2010 2011 2012 2013
DEMOGRAPHY
Total Population ('000 Persons) 933 956 992 1,020 1,043 1,065 1,072 1,091 1,120 1,149
Total Population Growth (%) 1.2 2.4 3.7 2.9 2.2 2.2 0.6 1.8 2.7 2.6
Net Migration ('000 Persons) 2.3 13.7 25.6 17.6 12.4 12.9 -4.2 9.6 19.7 19.1
Household Formation ('000 Units) 6.8 12.5 14.5 8.2 8.4 7.4 4.1 8.1 12.2 8.1
REAL ESTATE
Residential Market
Housing Starts ('000 units) 12.2 11.7 14.1 10.9 9.6 5.0 7.3 7.7 10.3 9.4
House Price Index Inflation (%) 5.8 8.3 31.4 24.0 0.5 -7.8 2.7 -1.2 2.5 5.7
Total Building Permits mid point ($billions) 2.4 3.6 4.9 5.6 4.0 3.7 2.9 4.5 4.4 6.1
BASE FORECAST
2014 2015 2016 2017 2018 2019 2020 2021 2022 2023 2024
DEMOGRAPHY
Total Population ('000 Persons) 1,175 1,196 1,223 1,251 1,274 1,294 1,314 1,333 1,352 1,371 1,389
Total Population Growth (%) 2.2 1.8 2.2 2.3 1.8 1.6 1.5 1.5 1.4 1.4 1.3
Net Migration ('000 Persons) 15.0 10.0 16.0 18.0 12.0 10.0 10.0 10.0 10.0 10.0 10.0
Household Formation ('000 Units) 12.1 10.8 12.0 12.3 10.8 10.1 9.9 9.6 9.4 9.2 9.1
REAL ESTATE
Residential Market
Housing Starts ('000 units) 10.0 10.8 12.0 12.3 10.8 10.1 9.9 9.6 9.4 9.2 9.1
House Price Index Inflation (%) 3.5 3.2 3.1 3.0 3.0 3.0 3.0 3.0 3.0 3.0 3.0
Total Building Permits mid point ($billions) 5.6 4.8 4.5 4.5 4.4 4.4 4.4 4.4 4.4 4.4 4.4
Low Forecast 5.1 4.3 4.0 4.0 3.9 3.9 3.9 3.9 3.9 3.9 3.9
High Forecast 6.1 5.3 5.0 5.0 4.9 4.9 4.9 4.9 4.9 4.9 4.9
Numbers may not add up due to rounding

Forecast Tables
21Calgary & Region Economic Outlook 2014-2024 | Spring 2014 calgary.ca/economy
Table 3 - City of Calgary Population Projection
City of Calgary
FORECAST COMPLETED: July 2013 BASE FORECAST
2012 2013 2014 2015 2016 2017 2018
Total Population (as April) 1,120,200 1,149,600 1,175,400 1,196,200 1,222,800 1,251,300 1,273,800
Total Population Growth Rate (April - March) 2.7 2.6 2.2 1.8 2.2 2.3 1.8
Total Net Migration (April - March) 19,700 19,100 15,000 10,000 16,000 18,000 12,000
Total Births (April - March) 15,000 15,300 15,500 15,500 15,600 15,800 15,700
Total Deaths (April - March) 4,700 4,500 4,700 4,900 5,100 5,300 5,500
Total Natural Increase (April - March) 10,300 10,800 10,800 10,600 10,500 10,400 10,200
Total Households (as April) 434,500 442,600 454,700 465,400 477,500 489,800 500,600
Total Household Formation (April - March) 12,200 8,100 12,100 10,800 12,000 12,300 10,800
Population by Cohort BASE FORECAST2012 2013 2014 2015 2016 2017 2018
0-4 76,700 76,200 76,400 76,600 77,500 78,800 79,800
5-9 66,800 71,000 74,400 77,100 79,500 81,100 81,400
10-14 62,400 64,800 66,200 67,700 70,000 73,000 76,100
15-19 65,200 67,000 67,600 67,600 68,200 69,000 69,700
20-24 73,100 75,600 74,700 73,300 73,100 73,900 73,500
25-29 93,500 93,700 92,000 90,000 88,600 87,200 85,800
30-34 96,400 98,100 102,000 103,800 105,500 106,700 105,400
35-39 91,200 91,900 94,700 97,100 100,500 104,100 107,600
40-44 89,100 90,000 92,000 93,500 95,200 97,400 99,100
45-49 87,000 85,800 86,200 86,800 89,700 93,100 96,100
50-54 84,900 86,700 88,200 89,200 89,000 89,200 88,800
55-59 71,600 75,300 78,600 81,100 83,400 85,000 86,600
60-64 52,500 55,400 58,400 62,000 65,900 70,000 73,500
65-69 35,700 40,100 43,000 46,000 49,100 51,100 52,800
70-74 24,900 26,900 28,400 29,800 31,100 33,700 37,100
75-79 19,900 20,600 20,900 21,400 22,100 22,700 23,800
80-84 15,600 15,900 16,200 16,600 16,800 17,000 17,300
85-89 8,500 9,300 10,100 10,800 11,500 12,000 12,500
90+ 5,200 5,300 5,500 5,800 6,100 6,500 6,900
Total 1,120,200 1,149,600 1,175,400 1,196,200 1,222,800 1,251,300 1,273,800
12-17 76,500 78,700 79,400 79,900 81,800 83,900 86,000
Numbers may not add up due to rounding
Base forecast 2019-2024 on page 22
Forecast Tables
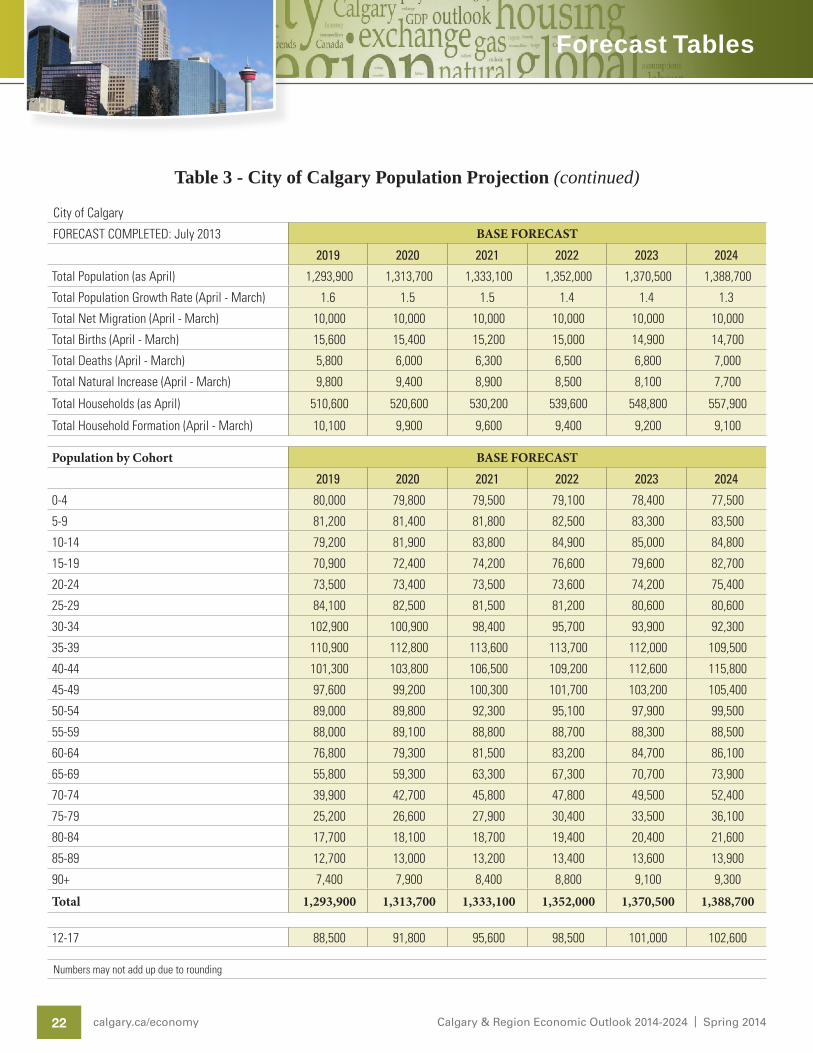
Calgary & Region Economic Outlook 2014-2024 | Spring 201422 calgary.ca/economy
Table 3 - City of Calgary Population Projection (continued)
City of Calgary
FORECAST COMPLETED: July 2013 BASE FORECAST
2019 2020 2021 2022 2023 2024
Total Population (as April) 1,293,900 1,313,700 1,333,100 1,352,000 1,370,500 1,388,700
Total Population Growth Rate (April - March) 1.6 1.5 1.5 1.4 1.4 1.3
Total Net Migration (April - March) 10,000 10,000 10,000 10,000 10,000 10,000
Total Births (April - March) 15,600 15,400 15,200 15,000 14,900 14,700
Total Deaths (April - March) 5,800 6,000 6,300 6,500 6,800 7,000
Total Natural Increase (April - March) 9,800 9,400 8,900 8,500 8,100 7,700
Total Households (as April) 510,600 520,600 530,200 539,600 548,800 557,900
Total Household Formation (April - March) 10,100 9,900 9,600 9,400 9,200 9,100
Population by Cohort BASE FORECAST2019 2020 2021 2022 2023 2024
0-4 80,000 79,800 79,500 79,100 78,400 77,500
5-9 81,200 81,400 81,800 82,500 83,300 83,500
10-14 79,200 81,900 83,800 84,900 85,000 84,800
15-19 70,900 72,400 74,200 76,600 79,600 82,700
20-24 73,500 73,400 73,500 73,600 74,200 75,400
25-29 84,100 82,500 81,500 81,200 80,600 80,600
30-34 102,900 100,900 98,400 95,700 93,900 92,300
35-39 110,900 112,800 113,600 113,700 112,000 109,500
40-44 101,300 103,800 106,500 109,200 112,600 115,800
45-49 97,600 99,200 100,300 101,700 103,200 105,400
50-54 89,000 89,800 92,300 95,100 97,900 99,500
55-59 88,000 89,100 88,800 88,700 88,300 88,500
60-64 76,800 79,300 81,500 83,200 84,700 86,100
65-69 55,800 59,300 63,300 67,300 70,700 73,900
70-74 39,900 42,700 45,800 47,800 49,500 52,400
75-79 25,200 26,600 27,900 30,400 33,500 36,100
80-84 17,700 18,100 18,700 19,400 20,400 21,600
85-89 12,700 13,000 13,200 13,400 13,600 13,900
90+ 7,400 7,900 8,400 8,800 9,100 9,300
Total 1,293,900 1,313,700 1,333,100 1,352,000 1,370,500 1,388,700
12-17 88,500 91,800 95,600 98,500 101,000 102,600
Numbers may not add up due to rounding

Forecast Tables
23Calgary & Region Economic Outlook 2014-2024 | Spring 2014 calgary.ca/economy
Table 4 - Calgary Economic Region (CER) Population Projection
Calgary Economic Region (CER)
FORECAST COMPLETED: July 2013 BASE FORECAST
2012 2013 2014 2015 2016 2017 2018
Total Population (as April) 1,398,400 1,435,000 1,467,300 1,493,300 1,526,500 1,562,200 1,590,200
Total Population Growth Rate (April - March) 2.6 2.6 2.3 1.8 2.2 2.3 1.8
Total Net Migration (April - March) 23,100 18,800 12,500 20,000 22,500 15,000 12,500
Total Births (April - March) 19,000 19,100 19,300 19,400 19,500 19,700 19,600
Total Deaths (April - March) 5,500 5,600 5,800 6,100 6,300 6,600 6,900
Total Natural Increase (April - March) 13,500 13,500 13,500 13,300 13,200 13,000 12,700
Total Households (as April) 542,000 554,600 567,400 580,100 592,400 604,100 615,100
Total Household Formation (April - March) 14,200 12,600 12,800 12,700 12,300 11,700 11,000
Population by Cohort BASE FORECAST2012 2013 2014 2015 2016 2017 2018
0-4 95,000 95,100 95,400 95,600 96,700 98,400 99,600
5-9 85,100 88,600 92,900 96,300 99,200 101,300 101,600
10-14 80,100 80,800 82,700 84,500 87,400 91,100 95,000
15-19 84,200 83,700 84,400 84,400 85,200 86,100 87,100
20-24 92,500 94,400 93,300 91,500 91,300 92,300 91,700
25-29 112,000 117,000 114,800 112,300 110,600 108,800 107,100
30-34 115,700 122,400 127,300 129,600 131,700 133,300 131,600
35-39 111,100 114,700 118,200 121,300 125,500 129,900 134,400
40-44 110,000 112,400 114,800 116,700 118,800 121,600 123,700
45-49 108,500 107,100 107,600 108,300 112,000 116,200 119,900
50-54 107,300 108,200 110,100 111,400 111,200 111,300 110,900
55-59 90,900 94,000 98,100 101,300 104,100 106,100 108,000
60-64 67,000 69,200 72,900 77,400 82,300 87,400 91,800
65-69 46,400 50,100 53,600 57,400 61,300 63,700 66,000
70-74 31,900 33,600 35,400 37,200 38,900 42,100 46,300
75-79 24,900 25,700 26,100 26,700 27,500 28,300 29,800
80-84 19,200 19,900 20,200 20,700 20,900 21,200 21,600
85-89 10,400 11,600 12,600 13,500 14,400 15,000 15,600
90+ 6,400 6,600 6,800 7,200 7,600 8,200 8,600
Total 1,398,600 1,435,100 1,467,200 1,493,300 1,526,600 1,562,300 1,590,300
Numbers may not add up due to rounding
Base forecast 2019-2024 on page 24

Forecast Tables
Calgary & Region Economic Outlook 2014-2024 | Spring 201424 calgary.ca/economy
Table 4 - Calgary Economic Region (CER) Population Projection (continued)
Calgary Economic Region (CER)
FORECAST COMPLETED: July 2013 BASE FORECAST
2019 2020 2021 2022 2023 2024
Total Population (as April) 1,615,400 1,640,100 1,664,300 1,688,000 1,711,100 1,733,800
Total Population Growth Rate (April - March) 1.6 1.5 1.5 1.4 1.4 1.3
Total Net Migration (April - March) 12,500 12,500 12,500 12,500 12,500 12,500
Total Births (April - March) 19,400 19,200 19,000 18,800 18,600 18,400
Total Deaths (April - March) 7,200 7,500 7,800 8,100 8,400 8,700
Total Natural Increase (April - March) 12,200 11,700 11,200 10,700 10,100 9,700
Total Households (as April) 625,800 636,200 646,400 656,200 665,600 674,900
Total Household Formation (April - March) 10,700 10,400 10,200 9,800 9,400 9,300
Population by Cohort BASE FORECAST2019 2020 2021 2022 2023 2024
0-4 99,800 99,600 99,300 98,700 97,800 96,800
5-9 101,400 101,600 102,100 103,000 104,000 104,200
10-14 98,900 102,200 104,600 106,000 106,100 105,900
15-19 88,500 90,300 92,700 95,700 99,400 103,200
20-24 91,800 91,600 91,700 91,900 92,700 94,100
25-29 105,000 103,000 101,700 101,400 100,600 100,600
30-34 128,400 125,900 122,900 119,500 117,300 115,200
35-39 138,400 140,900 141,900 141,900 139,800 136,700
40-44 126,500 129,600 133,000 136,400 140,500 144,500
45-49 121,900 123,900 125,200 126,900 128,800 131,600
50-54 111,100 112,100 115,300 118,700 122,200 124,200
55-59 109,800 111,200 110,900 110,800 110,300 110,500
60-64 95,900 99,000 101,800 103,800 105,700 107,400
65-69 69,700 74,100 79,000 84,000 88,300 92,200
70-74 49,800 53,300 57,100 59,600 61,800 65,400
75-79 31,500 33,200 34,800 37,900 41,900 45,100
80-84 22,000 22,500 23,300 24,200 25,500 27,000
85-89 15,800 16,200 16,400 16,700 17,000 17,400
90+ 9,300 9,800 10,500 10,900 11,400 11,700
Total 1,615,500 1,640,000 1,664,200 1,688,000 1,711,100 1,733,700
Numbers may not add up due to rounding
Forecast Tables
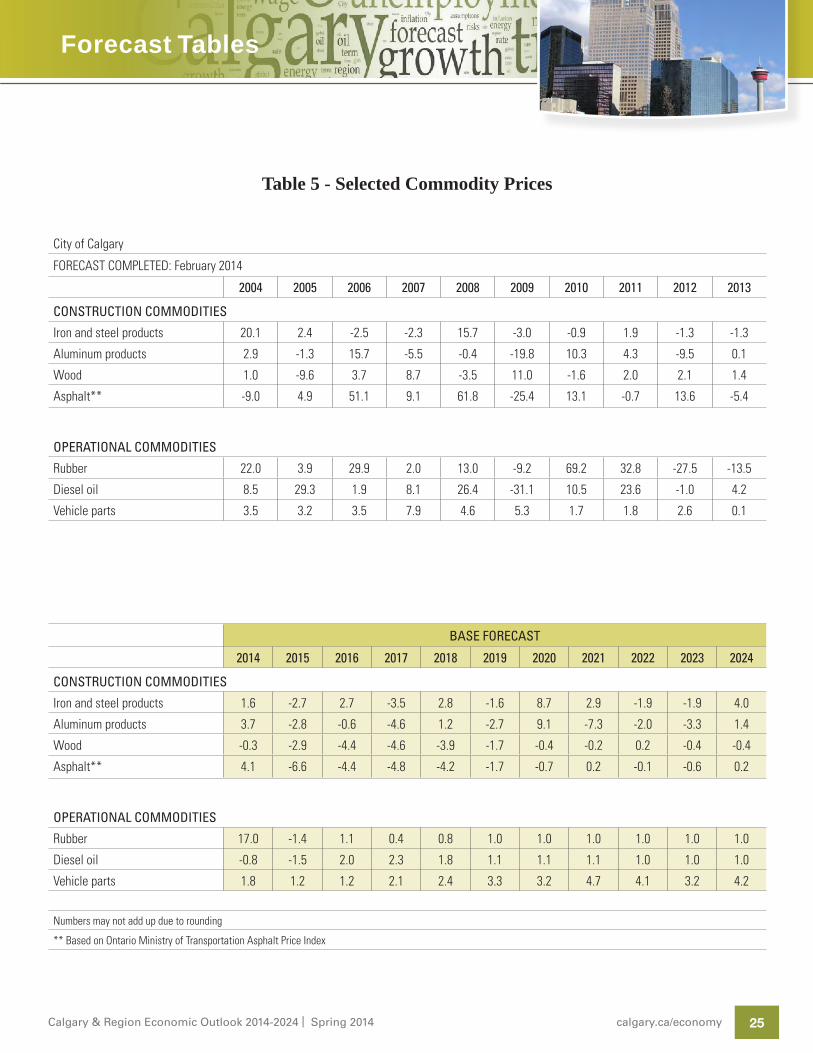
25Calgary & Region Economic Outlook 2014-2024 | Spring 2014 calgary.ca/economy
Table 5 - Selected Commodity Prices
City of Calgary
FORECAST COMPLETED: February 2014
2004 2005 2006 2007 2008 2009 2010 2011 2012 2013
CONSTRUCTION COMMODITIES
Iron and steel products 20.1 2.4 -2.5 -2.3 15.7 -3.0 -0.9 1.9 -1.3 -1.3
Aluminum products 2.9 -1.3 15.7 -5.5 -0.4 -19.8 10.3 4.3 -9.5 0.1
Wood 1.0 -9.6 3.7 8.7 -3.5 11.0 -1.6 2.0 2.1 1.4
Asphalt** -9.0 4.9 51.1 9.1 61.8 -25.4 13.1 -0.7 13.6 -5.4
OPERATIONAL COMMODITIES
Rubber 22.0 3.9 29.9 2.0 13.0 -9.2 69.2 32.8 -27.5 -13.5
Diesel oil 8.5 29.3 1.9 8.1 26.4 -31.1 10.5 23.6 -1.0 4.2
Vehicle parts 3.5 3.2 3.5 7.9 4.6 5.3 1.7 1.8 2.6 0.1
BASE FORECAST
2014 2015 2016 2017 2018 2019 2020 2021 2022 2023 2024
CONSTRUCTION COMMODITIES
Iron and steel products 1.6 -2.7 2.7 -3.5 2.8 -1.6 8.7 2.9 -1.9 -1.9 4.0
Aluminum products 3.7 -2.8 -0.6 -4.6 1.2 -2.7 9.1 -7.3 -2.0 -3.3 1.4
Wood -0.3 -2.9 -4.4 -4.6 -3.9 -1.7 -0.4 -0.2 0.2 -0.4 -0.4
Asphalt** 4.1 -6.6 -4.4 -4.8 -4.2 -1.7 -0.7 0.2 -0.1 -0.6 0.2
OPERATIONAL COMMODITIES
Rubber 17.0 -1.4 1.1 0.4 0.8 1.0 1.0 1.0 1.0 1.0 1.0
Diesel oil -0.8 -1.5 2.0 2.3 1.8 1.1 1.1 1.1 1.0 1.0 1.0
Vehicle parts 1.8 1.2 1.2 2.1 2.4 3.3 3.2 4.7 4.1 3.2 4.2
Numbers may not add up due to rounding
** Based on Ontario Ministry of Transportation Asphalt Price Index

WHO WE ARE
Corporate Economics provides services in four areas: forecasting, information provision, policy analysis and consulting. We also monitor the current economic trends which allows us to develop unique insights on how external events are impacting the local economy and the Municipal government. We are experienced at researching different economic topics and have developed reliable methods of forecasting and analysis.
For more information, please contact:
Patrick Walters 403.268.1335 or [email protected]
Many of our publications are available on the internet at www.calgary.ca/economy.
Corporate Research Analyst: Estella Scruggs
The City of Calgary provides this information in good faith. However, the aforementioned organization makes no representation, warranty or condition, statutory express or implied, takes no responsibility for any errors and omissions which may contained herein and accepts no liability for any loss arising from any use or reliance on this report.
Sources: Statistics Canada, CMHC, CREB, MLS, Bank of Canada, Conference Board of Canada, GLJ Energy Publications, The City of Calgary, Centre for Spatial Economics, IHS Global Insight, U.S. Federal Bank Reserve of St. Louis, International Money Fund (World Economy Outlook), World Bank, Central Plan Bureau Netherlands, and others.
Brie
fing
Not
eSe
ptem
ber 2
010
Summary
The Calgary real estate market slumbered long before roaring to life in recent years. The dramatic and sudden change has left many wondering what’s next? Our research indicates the future of residential real estate in Calgary is for modest price increases keeping up with the general level of inflation for the next 5-10 years. The Commercial market is expected to see high vacancy rates slowly diminish over the next 5-10 years with rents slowly rising from lows that are expected to hit in late 2011.
Introduction
Municipalities in Canada are interested in real estate prices. Prices indicate how attractive a region is to reside in. They indicate current and foreshadow future economic performance, and most importantly for Canadian municipalities, provide revenue opportunities through property taxation. Construction starts are also watched as these represent opportunities for revenue from development and building permits and licences, but a large share of municipal revenues come from property taxes so prices are the key real estate variable for Canadian municipalities.
The City of Calgary provides this information in good faith. However, the aforementioned organization makes no representation, warranty or condition, statutory, express or implied, takes no responsibility for any errors and omissions which may be contained herein and accepts no liability for any loss arising from any use or reliance on this report. The views expressed here represent the views of the authors and do not necessarily represent those of The City of Calgary.
Briefing Note #6
Calgary Residential and Commercial Real Estate Markets
P.O. Box 2100, Stn. M, #8311, Calgary, AB, Canada T2P 2M5
calgary.ca/economy call 3-1-1
This paper reveals research that has been done to shed light on the movement of prices in the Calgary real estate markets over time, with a view to predicting those price change in the future. We investigate only residential and commercial markets in this paper as they represent the core sources of property tax revenue in Calgary.
Real Estate Economics
Much has been written about land economics, the financial minutia of real estate transactions and there are hosts of bodies engaged in forecasting real estate market activities from CMHC to Teranet. This paper reveals our research into the Calgary market exclusively, and does so in an accessible manner. Readers interested in more detail of the theoretical underpinnings of this work may find a good general description of real estate economics at http://en.wikipedia.org/wiki/Real_estate_economics.
Corporate Economics occasionally publishes briefing notes to help interested readers understand the economy. Most of our briefing notes are highly technical and are geared toward an audience that is aware of the current economic state of Calgary, Alberta, Canada and the world. This note is part of our non-technical series aimed at introducing the Calgary economy to interested readers.
Forecasting Information Provision Policy Analysis
f Calgary & Region Economic Outlook
f Energy Reports on Natural Gas and Crude Oil
f Labour Market Review
f Inflation Review
f Current Economic Analysis
f Construction Inflation
f A Case of Fiscal Imbalance: The Calgary Experience
f Diesel Fuel Price Pass-Through in Calgary
f Calgary Residential and Commercial Real Estate Markets
Estella Scruggs 403.268.5556 or [email protected]
calgary.ca/economy call 3-1-1


![Calgary Region Economic Partnership Assessment … · a project of the Calgary Region Economic Partnership in collaboration with: ... PcaW\Saa U`]ebV) O\R 7\b`]RcQW\U \Se W[^`]dSR](https://img.dokumen.tips/doc/110x75/5b8094f87f8b9ae6088dcb93/calgary-region-economic-partnership-assessment-a-project-of-the-calgary-region.jpg)


