Embed Size (px)
Citation preview

Calf Scours in Southern Austral ia
A review of the impact of calf scours on beef enterprises
Project number AHW.026 Final Report prepared for MLA by: Alison Gunn BVSc MVS MACVSc Clarke and Goulding Veterinary Practice PO Box 1292 Mount Gambier SA 5290 Meat and Livestock Australia Ltd Locked Bag 991 North Sydney NSW 2059
ISBN 1 74036 449 X
October 2003
Animal Health and Welfare

Calf Scours in Southern Australian Beef Enterprises
1
ABSTRACT This study was carried out to determine the impact of calf diarrhoea on Australian beef enterprises. Calf scours was demonstrated to be a significant and time-consuming disease problem on many beef properties. Calves were most severely affected between one and six weeks of age. Twenty-eight percent of respondents had a prevalence of 20% or greater in one or more of the age groups and 33% of respondents had a mortality rate greater than 2% from 0 to 16 weeks. A historical survey of veterinary pathology laboratories in 4 states established that the most common pathogens isolated from faecal samples are cryptosporidia and rotavirus. Diagnosis of calf scours was shown to be frustrating, because it is relatively expensive and results are not guaranteed. Producers were employing a large and contradictory range of management practices to control and treat calf scours, indicating that there was little clear and consistent advice available. The establishment of key management strategies at a herd level is essential to minimise calf scours in Australia. This report details the strategic research, product development and extension required reducing the impact of calf scours on beef enterprises.
LIST OF ACRONYMS
ABARE Australian Bureau of Agricultural and Resource Economics
AHL Animal Health Laboratories
CSP Calf scour package
DNRE Department of Natural Resources and Environment
DPI Department of Primary Industries
DPIWE Department of Primary Industries, Water and Environment
EAEEC Enteropathogenic attaching and effacing E. coli
ELISA Enzyme-linked immunosorbent assay
EMAI Elizabeth MacArthur Agriculture Institute
ETEC Enterotoxigenic E. coli
HEC Haemolytic E. coli
MPCSP Major pathogen calf scour panel
MZN Modified Ziehl-Neelsen
NATA National Association of Testing Authorities, Australia
NHEC Non-haemolytic E. coli
PIRD Producer Initiated Research and Development
RT-PCR Reverse transcriptase-polymerase chain reaction
RVL Regional Veterinary Laboratory

Calf Scours in Southern Australian Beef Enterprises
2
EXECUTIVE SUMMARY The aim of this project was to compile and assess all available knowledge on calf scours in the Southern Australian beef industry in order to better define the problem and recommend where further research, extension and product development is required. These goals were achieved by collating and analysing information from surveys of interested producers and cattle veterinarians working in the industry, as well as analysis of historical data on beef calf scours from 4 veterinary laboratories.
This study has shown that calf scours is a significant and time-consuming disease problem on many of the properties surveyed. It is a multifactorial disease and there are no recently published scientifically proven studies showing how to prevent outbreaks in Australian conditions. Diagnosis is frustrating, because it is relatively expensive, results are not guaranteed, and when pathogens are isolated the appropriate advice and interpretation is sometimes inconsistent.
The impact of calf scours on some properties is severe. Information was collected from survey respondents on the number of calves affected in different age groups. Twenty-eight percent of respondents had a prevalence of 20% or greater in one or more of the age groups, and 33% of respondents had a mortality rate greater than 2% from 0 to 16 weeks. This degree of severity was supported by epidemiological data from submissions from laboratories in NSW and WA, where the mean mortality rate from reported outbreaks was 6%.
The cost of calf scours to the enterprises surveyed ranged from $0.50-$68.60 per breeding cow with a mean cost of $18.70 per breeding cow. Significant cost was involved in herds with high mortality or when a high proportion of calves needed to be treated with intravenous fluids.
There was a large variation reported in the presentation of the scour problems. Some farmers described large numbers affected (up to 100 % of calves from 0 - 6 weeks) but low mortality, others had a high mortality compared to the number of calves observed affected. This latter presentation is concerning and requires better definition and determination of the underlying causes. Much of the variation in presentation will relate to the virulence of different pathogens, but it should be noted that there is no standard case definitions for a scouring calf, and this needs to be established.
Laboratory results from Tasmania, Victoria and Western Australia indicate that the major causes of calf scours in these states were rotavirus and cryptosporidia, and the main age groups affected are 1 to 6 weeks. The New South Wales laboratories had a statistically higher proportion of submissions from calves aged 7 to 16 weeks, and the most common diagnoses in this state were coccidia, enterotoxaemia and nematode infections. As Cryptosporidium parvum can survive in cool moist conditions for many months and rotaviruses are stable in faeces, it is probable that in cooler southern climates these pathogens are surviving much longer and possibly from one calving season to the next.
The percentage of submissions from which there was no diagnosis was between 25% and 45% across the 4 laboratories from which data was collected. In many cases there is intermittent shedding of a pathogen, or the samples are taken before the infective stage of the pathogen is present in the faeces. However in many laboratory submissions not all the major pathogens were tested for. The cost of testing enough samples to establish a diagnosis can be significant and it would be common for veterinarians to only use faecal samples to confirm common aetiologies. However where a complete panel of diagnostic tests for the major pathogens was carried out the diagnosis rate was higher. Many laboratories also noted that where full cost recovery is applied, veterinarians often request that faecal tests are carried out in stages, stopping when a pathogen is isolated. The consequence of this strategy is to attribute a problem to a single pathogen when the actual diagnosis is more complex.
Treatment of calves is time consuming and affected calves can be slow to recover. The actual diagnosis is seldom known resulting in empirical treatment that is prescribed across a veterinary surgeons counter after a conversation on the current problem. Eighty-four percent of respondents to the detailed farmer survey were treating affected calves with electrolyte solutions, however there is a huge range of treatment protocols with respect to the amount fed, type of electrolytes used, whether calf is separated from its mother or not, and if so for how long. This is just an example of the large and contradictory range of management practices farmers are using to control and treat calf scours, indicating that there is little clear and consistent advice available.

Calf Scours in Southern Australian Beef Enterprises
3
After extensive analysis the only clear relationship between management practices and calf scours shown by the second questionnaire is that calf scours is strongly related to spring calving. However the fact that other management practices were not shown to contribute is related to the imprecise method of data collection (i.e. numbers estimated over the phone as opposed to analysis of records); the subjective nature of the available information about the farm; and the large range of different environments in the study population. Other management practices are likely to be contributing to calf scours in Australia
Experience overseas has shown that the most important method of controlling calf scours is through good management practices. These aim to minimise the level of infection in the calves’ environment, increase the non-specific resistance of the calf and minimise stress. Best practice recommendations for management strategies to minimise calf scours in Australia need to be researched and presented to farmers. Although there is a need for case control studies to determine key management strategies for the Australian beef industry, the initial step should be a combination of a literature search and application of first principles to establish standard recommendations. The literature search should encompass grassland cow-calf operations from overseas and research that has been carried out in the dairy industry. Having established the most likely strategies to minimise calf scours the most significant of these can be confirmed by detailed studies.
The survey respondents extensively requested the development of vaccines. This study has identified the major pathogens affecting different regions and on many farms therapeutic control methods for these pathogens may be valuable. Effective vaccines are likely to be beneficial for a specific problem or pathogen on seriously affected properties. However wider industry benefit is likely to be achieved by establishing appropriate management strategies.
The focus for development of management strategies and further research should be to minimise the impact of calf scours in calves aged 0-6 weeks in wetter cooler areas of Australia. Good preventative strategies for enterotoxaemia and nematode infestation in older calves are already well established. Strategies aimed at minimising disease in a narrow target population will mainly focus on prevention of infectious disease and these principles can then be broadened to include older calves and other neonatal diseases.
An overall strategy to minimise the impact of calf scours would have significant benefits to the Australian beef industry. Objectives of this strategy should encompass:
establishment of key management strategies at the herd level to minimise calf scours
development of a scoring system for disease severity and case definitions for scouring calves that will improve definition of the problem on farm
standard recommendations of appropriate and affordable diagnostic procedures and pathways on farm and at the laboratory, including establishment of the role of post mortems
establishment of the significance of coronavirus, bovine torovirus, EAEEC and selenium deficiency in calf scours in Australia
standardisation of the interpretation and reporting of laboratory results
coordination between industry across state borders and with state agriculture departments to specifically investigate and establish diagnoses for outbreaks where there is a high mortality rate (suggested level greater than 5%)
establishment of appropriate treatment protocols that address
a) simple and effective ways to manage sick calves
b) appropriate protocols for the administration of therapies to provide a good clinical outcome
c) minimising the risk of antibiotic resistance
extension of these strategies to farmers, veterinarians and veterinary pathology laboratories
Extension is also required to promote recognition by veterinarians and industry of the significant costs and other impacts that calf scours can have on an enterprise

Calf Scours in Southern Australian Beef Enterprises
4
Table of Contents 1. BACKGROUND .................................................................................................................... 7 2. PROJECT OBJECTIVES...................................................................................................... 8
2.1. Producer surveys......................................................................................................................... 8 2.2. Survey of cattle veterinarians....................................................................................................... 8 2.3. Survey of veterinary laboratories in southern Australia ................................................................ 8 2.4. Collation of laboratory data .......................................................................................................... 8
3. RECOMMENDATIONS - IMPROVING THE APPROACH TO CALF SCOURS IN AUSTRALIA.............................................................................................................................. 9
3.1. Establish key management strategies at the herd level to minimise calf scours .......................... 9 3.2. Develop a scoring system that will improve definition of the problem on farm.............................. 9 3.3. Recommend appropriate, affordable and reliable standard diagnostic procedures and pathways on farm and at the laboratory, including establishment of the role of post mortems............................ 9 3.4. Recommend standards for the interpretation and reporting of laboratory results ....................... 10 3.5. Establish coordination between industry and state agriculture departments to specifically investigate and establish diagnoses for outbreaks where there is a high mortality rate (suggested level greater than 5%)....................................................................................................................... 11 3.6. Investigate the role of enteropathogenic attaching and effacing E. coli in calf scours in Australia......................................................................................................................................................... 11 3.7. Establish appropriate treatment protocols.................................................................................. 11 3.8. Extension of strategies .............................................................................................................. 12 3.9. Industry recommendation: improving disease surveillance ........................................................ 12
4. REVIEW OF PREVIOUS MLA RESEARCH....................................................................... 13 4.1. 93/N17 Tallangatta study number one ....................................................................................... 13 4.1.1. Vaccination trial ...................................................................................................................... 13 4.1.2. Producer survey...................................................................................................................... 13 4.1.3. Treatments used..................................................................................................................... 14 4.2. 96/V04 Tallangatta study number two........................................................................................ 15 4.3. 99V07 Proposed Pakenham Study ............................................................................................ 15
5. PRODUCERS EXPERIENCE WITH CALF SCOURS -PRELIMINARY QUESTIONNAIRE................................................................................................................................................ 16
5.1 Methodology ............................................................................................................................... 16 5.2. Results....................................................................................................................................... 16 5.2.1. Demographics......................................................................................................................... 16 5.2.2. Producers experience with calf scours in cow calf enterprises................................................ 17 5.2.3. Mortality rates ......................................................................................................................... 18 5.2.4. Isolates from faecal samples .................................................................................................. 18 5.2.5. Use of vaccination .................................................................................................................. 19 5.2.6. Stocking rate........................................................................................................................... 19 5.2.7. Treatments used..................................................................................................................... 19
6. PRODUCERS EXPERIENCE WITH CALF SCOURS - DETAILED SURVEY ................... 20 6.1. Methodology .............................................................................................................................. 20 6.2. Results....................................................................................................................................... 20 6.2.1. Herd demographics and management practices..................................................................... 20
Herd Management ........................................................................................................................ 21 6.2.2. Management of cows and calves............................................................................................ 21
6.2.2.1. Calving Management ....................................................................................................... 21 6.2.2.2. Colostrum management ................................................................................................... 21 6.2.2.3. Management of cows with young calves .......................................................................... 21 6.2.2.4. Nutritional management ................................................................................................... 22 6.2.2.5. Other diseases ................................................................................................................. 22 6.2.2.6. Preventative measures..................................................................................................... 22 6.2.2.7. Calf scours on the survey farms ....................................................................................... 22 The pathogens on the survey farms: ............................................................................................. 25
6.3. Factors that predispose to calf scours ....................................................................................... 26

Calf Scours in Southern Australian Beef Enterprises
5
6.3.1. At Calving ............................................................................................................................... 26 6.3.2. Neonatal management............................................................................................................ 26 6.3.3. Nutritional management.......................................................................................................... 26 6.3.4. Concurrent diseases on the farm ............................................................................................ 27 6.3.5. Management practices............................................................................................................ 27 6.4. Management of sick calves........................................................................................................ 27 6.5. Interaction with veterinarians ..................................................................................................... 29 6.6. The effects of calf scours on the enterprise ............................................................................... 29 6.7. Economic losses due to calf scours ........................................................................................... 29 6.8. What the respondents would like to minimise their calf scour problem ...................................... 31
7. CATTLE VETERINARIANS EXPERIENCE WITH CALF SCOURS................................... 32 7.1. Methodology .............................................................................................................................. 32 7.2. Results....................................................................................................................................... 32 7.2.1. Disease presentation .............................................................................................................. 33 7.2.2. Laboratory work up ................................................................................................................. 33
7.2.2.1. Tests requested ............................................................................................................... 33 7.2.2.2. Pathogens isolated........................................................................................................... 34
7.2.3. Vaccination ............................................................................................................................. 35 7.2.4. The veterinarians approach to a calf scour outbreak .............................................................. 35 7.2.5. Management changes ............................................................................................................ 36
7.2.5.1. Management changes in cow calf operations................................................................... 36 7.2.5.2 Management changes in calf rearing operations ............................................................... 37
7.2.6. Treatment of scouring calves .................................................................................................. 38 7.2.7. The assistance that veterinarians would like to help overcome calf scours............................. 39
8. REPORT FROM A SURVEY OF VETERINARY PATHOLOGY LABORATORIES........... 41 8.1. New South Wales ...................................................................................................................... 41 8.2. South Australia .......................................................................................................................... 41 8.3. Tasmania................................................................................................................................... 41 8.4. Victoria....................................................................................................................................... 41 8.5. Western Australia ...................................................................................................................... 42 8.6. The cost of diagnosing calf scours:............................................................................................ 42
9. COLLATION AND ANALYSIS OF LABORATORY DATA ................................................ 44 9.1. Methodology .............................................................................................................................. 44 9.2. NSW Laboratory Samples ......................................................................................................... 44 9.2.1. Diagnoses............................................................................................................................... 46 9.3. Tasmanian Laboratory Samples ................................................................................................ 47 9.3.1. Diagnoses............................................................................................................................... 48 9.3.2. Diagnostic protocols ............................................................................................................... 49 9.4. Victorian Laboratory Samples.................................................................................................... 49 9.4.1. Intervet Database 1997-1999 ................................................................................................. 49
9.4.1.1. Diagnoses ........................................................................................................................ 50 9.4.2. DNRE/Intervet database 1989-1995 ....................................................................................... 50 9.5. Western Australian Laboratory Samples.................................................................................... 52 9.5.1. Diagnostic protocols ............................................................................................................... 54 9.6. Beef and Dairy Comparison....................................................................................................... 55 9.7. Report of all calf scours samples processed by D. N. R. E. Bendigo from 1998 until 2002........ 55
10. DISCUSSION .................................................................................................................... 57 10.1. Impact of calf scours on cow calf enterprises........................................................................... 57 10.1.1. Morbidity and mortality ..........................................................................................................................57 10.1.2. Management impacts ............................................................................................................................57 10.1.3. Economic impact ....................................................................................................................................57 10.2. Pathogens causing scours in beef calves in Southern Australia .............................................. 58 10.3. Diagnosis of calf scours ........................................................................................................... 58 10.3.1. The role of E. coli....................................................................................................................................59 10.3.2. Is coronavirus a significant pathogen in Australia?..........................................................................60 10.3.3. Interpretation of samples from which there is no diagnosis ...........................................................60 10.4. Using management to control calf scours ................................................................................ 61

Calf Scours in Southern Australian Beef Enterprises
6
10.4.1. Biosecurity ...............................................................................................................................................61 10.5. Management of sick calves...................................................................................................... 61 10.6. Areas for further research and clarification .............................................................................. 62
11. CONCLUSIONS................................................................................................................63 11.1. Success in achieving objectives............................................................................................... 63 11.2. Impact on Meat and Livestock industry - now and in five years time...............................................63
BIBLIOGRAPHY..................................................................................................................... 64 APPENDIX 1: INITIAL PRODUCER QUESTIONNAIRE........................................................ 66 APPENDIX 2: MLA DETAILED CALF SCOUR SURVEY...................................................... 68
Enterprise overview....................................................................................................................... 68 The problem.................................................................................................................................. 72
APPENDIX 3: MLA CALF SCOURS PROJECT VETERINARY SURVEY ............................ 78

Calf Scours in Southern Australian Beef Enterprises
7
1. BACKGROUND Scours in beef calves has been an ongoing issue for producers for many years. A 1966 study of beef cattle diseases in Victoria noted that over 80% of properties experienced some form of white scour, and on just under 50% of properties this was regarded as a problem1. Subsequently 2 PIRD projects have been carried out on this topic, but unfortunately yielded few answers to the producers involved. Studies from overseas have shown that calf scours is a major cause of economic loss to beef producers and although research has been carried out overseas into preventative strategies and control of calf scours, there is little Australian research that documents the impacts of this disease on beef enterprises, or demonstrates preventative and treatment strategies to minimise this impact. This study was commissioned after beef scours was identified as an ongoing issue to some producers.

Calf Scours in Southern Australian Beef Enterprises
8
2. PROJECT OBJECTIVES The aim of this project was to compile and assess all available knowledge on calf scours in the Southern Australian beef industry in order to define the impact this disease is this having on beef producers, determine the common pathogens involved and identify where there are gaps in our knowledge across all aspects of diagnosis, control and treatment. The outcome is to recommend where further research, extension and product development is required.
These goals were achieved by collating information using the four-part process outlined below.
2.1. Producer surveys An initial short survey was published in Feedback magazine that was designed to gauge the severity of calf scours that some producers were suffering, and obtain a basic understanding of the approaches they had taken to remedy the problem. A second more detailed survey of willing respondents was then carried out to acquire information on the demographics of the respondents and the risk factors on their farms. This survey also obtained information on the epidemiology of the disease, the management of affected calves, and the producers’ perspective of the economic impact that the disease had on their enterprise.
2.2. Survey of cattle veterinarians A notice was published in the Australian Cattle Veterinarian asking for veterinarians that were willing to respond to a survey on calf scours in their district and if possible provide any diagnostic results that they had collated. Questionnaires were sent to respondents, and also to practices in major beef areas where practitioners had not volunteered to participate in the survey. This ensured that all major beef producing areas in Southern Australian were included.
Practitioners were asked to provide details of the beef enterprises in their district and an overview of how calf scours affected these enterprises. Information was also collected on the range of morbidity and mortality that they were presented with and the approximate numbers and types of pathogens that had been diagnosed in their practices in the previous 5 years. They also provided information on the management changes and treatment regimes that they recommended. Finally they were asked for their opinion on further research, extension and product development that needs to be carried out on this topic.
2.3. Survey of veterinary laboratories in southern Australia Veterinary laboratories in southern Australia were telephoned to obtain information on the number of calf scour samples that they processed each year and the tests that they would routinely perform on these samples. Information was also obtained on the ease of collation and analysis of their records.
2.4. Collation of laboratory data Calf scour data was collated and analysed from information provided jointly by Intervet and the DNRE (now DPI) laboratory at Bendigo, from the DPIWE Mount Pleasant Laboratory in Tasmania, from Agriculture WA - Animal Health Laboratories and from the Regional Veterinary Laboratories in New South Wales.

Calf Scours in Southern Australian Beef Enterprises
9
3. RECOMMENDATIONS - IMPROVING THE APPROACH TO CALF SCOURS IN AUSTRALIA The predisposing factors, causes and management of calf scours in cow calf enterprises is poorly understood by producers and veterinarians. A whole of industry approach is required to ensure clear and consistent advice, together with structured systems to minimise the impact of this problem. This program needs to encompass producers, farm advisers, veterinarians and veterinary pathology laboratories and could be structured on similar but larger programs already ongoing in the dairy industry. The program or projects should achieve the following deliverables:
3.1. Establish key management strategies at the herd level to minimise calf scours A significant amount of research has been carried out overseas on management of cows and calves to minimise the impact and transmission of enteric pathogens. Much of the initial work was carried out in Canada in the 1970’s and 1980’s2. However little structured research has been carried out in Australia to demonstrate best practice management to minimise calf scours in cow calf operations, and consequently there are few consistent recommendations for producers.
An extensive literature search is required looking at both overseas research in the beef industry, and also the dairy industry both overseas and in Australia. From this a set of standard recommendations that can be expected to work under Australian conditions can be compiled. Many of the recommendations should be based on the first principles of disease control.
These recommendations should include management of cows from prior to calving until the calves are four months of age, and should have a significant emphasis on the peri-parturient period. Different management strategies that can be used for different enteric pathogens must be considered and this will lead to increased benefit from diagnostic tests. The recommendations should also address biosecurity at a herd level, and specifically target purchasing calves to replace dead calves, or to run as additional calves on a dam. Indirect methods of transmission such as flies and ducks should be included in a biosecurity review. Methods of decontaminating areas where affected calves have been run also needs to be addressed.
Having established a set of standard management procedures, it may be appropriate to test the most significant of these using case control studies.
3.2. Develop a scoring system that will improve definition of the problem on farm The current study showed that some farmers have a high proportion of calves affected with very little or nil mortality. On other farms more calves died than were reported affected with calf scours. Whilst recognising that different pathogens will have different presentations, at present there is not a standard definition of a scouring calf accepted within the Australian cattle industry.
In order to minimise the confusion in the industry and to better recommend when treatment strategies and management controls should be applied, it is necessary to establish case definitions for Australia. These definitions need to be at an individual and outbreak level and consider the age group of the affected calves.
3.3. Recommend appropriate, affordable and reliable standard diagnostic procedures and pathways on farm and at the laboratory, including establishment of the role of post mortems At present there is a large variation in the number of samples that are submitted to laboratories and the testing protocols carried out. To a large part this has been determined by cost factors, however all states except Victoria at present have some degree of subsidisation, at least for major disease outbreaks where deaths are occurring.

Calf Scours in Southern Australian Beef Enterprises
10
Standard protocols and diagnostic decision trees need to be determined that addresses the following issues:
the appropriate number of faecal samples that should be submitted
the amount of faeces that should be submitted and whether swabs are acceptable
the appropriate calves to sample with respect to stage of infection and the benefits of sampling unaffected animals in the same group
opportunities to pool samples to minimise costs whilst still achieving satisfactory diagnoses
the sensitivity and specificity of the tests used
the role of post mortems -how many and what are the appropriate samples
is a post-mortem alone an appropriate test or should faecal samples be submitted from others in the group?
appropriate testing strategies for different age groups
the benefits of routinely running a complete panel of diagnostic tests to determine if there are multiple pathogens involved
standardisation of serotyping of E. coli including identification of fimbrial adhesins to differentiate pathogenic E. coli and allow accurate interpretation of results.
the inclusion of ELISA tests for coronavirus and bovine torovirus
The role and efficacy of “calf-side” dip-stick assays both at the laboratory and veterinary practice level
These issues need to be addressed both from the aim of being able to come to a reliable diagnosis for the majority of cases, and to ensure there is economic benefit to the producer from the diagnostic work-up. Some of this information is already available in standard texts and advice from veterinary laboratories, however it is generic advice and there would be a huge benefit in compiling it into a document that addresses the specific issue of calf diarrhoea.
Having established appropriate diagnostic protocols it is also important that all laboratories are working to the same standards. The development of a national diagnostic test certification scheme would ensure producers get value for money and provide quality assurance for export markets. In this scheme aliquots of the same sample would be sent to each of the laboratories for testing and the results of testing compared to check for consistency between laboratories. This scheme should have a broader outlook than just faecal samples – for instance semen testing, and work within the framework of the current NATA accreditation scheme
3.4. Recommend standards for the interpretation and reporting of laboratory results Most enteric pathogens are present in the faeces of non-affected animals and there are no industry-recognised guidelines as to how many positive samples are required to confirm that the isolation of enteric pathogens is significant. This needs to the established and standardised.
The other area where there is currently confusion is the isolation of E. coli. When coliforms are not serotyped or tested for adhesins, there is no confirmation that the isolate is pathogenic unless histology is also available. A large number of producers and veterinarians attribute disease to E. coli on the basis of a culture alone. Whilst appropriate testing need to be addressed, interpretation of the result from the laboratory would also be helpful to determine when a culture is significant.

Calf Scours in Southern Australian Beef Enterprises
11
3.5. Establish coordination between industry and state agriculture departments to specifically investigate and establish diagnoses for outbreaks where there is a high mortality rate (suggested level greater than 5%) The epidemiological information collected from producers and veterinary laboratories have shown that there are a significant number of outbreaks of calf diarrhoea occurring with a high mortality rate. In many cases a conclusive diagnosis as not been established for these outbreaks.
In many states investigation into disease outbreaks is already subsidised when there is high mortality rates. There would be significant industry benefit to target investigation towards such outbreaks and coordinate results across states to determine the aetiology of high mortality events. As well as establishing the causative pathogen it is also necessary to establish whether these outbreaks are solely due to the virulence of the pathogen, or whether recognition and appropriate treatment of affected calves is contributing to the severity of the problem.
3.6. Investigate the role of enteropathogenic attaching and effacing E. coli in calf scours in Australia EAEEC are associated with disease in calves aged 4 days to 2 months of age and no Australian veterinary laboratory has been routinely testing for the serotypes associated with these E. coli. E. coli is considered a significant pathogen by many veterinary practitioners, especially in older age groups, but the study of laboratory data only yielded one positive diagnosis of EAEEC. If E.coli actually are the cause of disease in older calves it is likely that they are EAEEC. Further investigation is required to establish if known EAEEC serotypes are associated with disease outbreaks in Australia, and determine if other serotypes are consistently associated with disease in calves.
3.7. Establish appropriate treatment protocols Effective treatment of sick calves is a challenge for many beef producers. In order to improve clinical outcomes it is necessary to document convenient and simple management practices to ensure that calves get an appropriate course of treatment.
Issues that should be addressed include:
establishment of a treatment decision tree to facilitate recognition by producers of the appropriate animals to treat and the most effective treatment protocols
simple methods of identification, such as coloured neck bands, so that calves can be identified from one day until the next
Practical methods of handling mobs of affected calves
appropriate isolation facilities for affected animals
criteria for separating the calf from its mother
protocols for feeding electrolytes and opportunities for extension of these – ie with the fluids when purchased
improving treatment outcomes by establishing a diagnosis
the role of oral antibiotics
appropriate use of injectable antibiotics
minimising the risk of antibiotic resistance

Calf Scours in Southern Australian Beef Enterprises
12
3.8. Extension of strategies Having established appropriate protocols and procedures that will minimise the impact of calf scours on Australian beef enterprises and ensure effective procedures are carried out when there is an outbreak, this information needs to be disseminated to farmers, veterinarians and veterinary pathology laboratories where appropriate.
It is likely that the most appropriate format for this will be written guidelines together with best practice procedures and protocols. In order to promote wider industry recognition it may be necessary to run courses for farmers either as a stand-alone program or by providing materials to veterinarians.
Extension is also required to promote recognition by veterinarians and industry of the significant costs and other impacts that calf scours can have on an enterprise.
Any extension program should have a subsequent evaluation program and assessment methods should be considered when the program is designed.
3.9. Industry recommendation: improving disease surveillance This study involved substantial collation of information from veterinary laboratories and in many cases submissions could not be included because not enough information was available. Moreover in all cases the original submission forms had to be accessed to confirm epidemiological and breed information making data collection slow and expensive. Some laboratories did not have a good enough retrieval system to make collation of any reliable data cost effective. The problem is three-fold
i) Veterinarians are not providing enough information when submitting samples
ii) Some submission forms do not request appropriate information. In the current study the focus was the beef industry and some laboratory forms do not have the proviso to differentiate breed or industry
iii) Laboratories are using different computer systems, with different and often incomplete information stored on them, and varying abilities to export this information into other formats.
Effective and efficient disease surveillance should be a major priority for the Australian animal export industries. For this to occur standardisation of submission forms for production animals is essential, together with recognition by veterinarians of the importance of providing epidemiological details. This needs to be combined with effective and complete recording in a standard format across all veterinary laboratories to allow for the rapid and efficient collation of national disease data.

Calf Scours in Southern Australian Beef Enterprises
13
4. REVIEW OF PREVIOUS MLA RESEARCH Over the past ten years two Producer Initiated Research and Development (PIRD) projects have been carried out on calf' scours.
4.1. 93/N17 Tallangatta study number one The first study was carried out in Tallangatta into the effectiveness of E. coli vaccination (Bovac) in 1995. The project also studied the organisms causing scours in calves to weaning in the Albury/Wodonga region and assessed the impact that calf scours was having on reducing efficiency from herds in North East Victoria and Southern NSW.
4.1.1. Vaccination trial 1300 cows on 10 farms were used in a vaccination trial where every second cow or heifer was vaccinated. Cows were vaccinated six weeks before planned start of calving and again 4 weeks later. Sixty-six scouring calves from both vaccinated & unvaccinated dams were sampled using faecal swabs. ETEC is most likely to affect calves aged less than 7 days of age, however no faecal swabs were taken from calves in this age group in the unvaccinated group and only three from the vaccinated group. E. coli was isolated from twice as many calves from the unvaccinated group (19 vs. 9) in calves eight days and older, however no serotyping was carried out. This decrease may be attributable to the vaccine, but is unlikely to result in variation in clinical disease. The Bovac vaccination specifically aims to prevent enterotoxigenic E. coli with the K99 antigen from affecting calves in the first week of life. This pathogen may be isolated from older animals but it is not pathogenic unless there is immune suppression.
The only isolates reported from the faecal swabs were E. coli, cryptosporidia, and rotavirus, with some E. coli and cryptosporidia being isolated from the same faecal swab.
Table 1: Analysis of all faecal swabs taken from farms during first Tallangatta study Total E. coli Rotavirus Cryptosporidia E. coli & cryptosporidia Nil
66 28 6 16 12 15
Although information on the number of calves affected and treatments used should have been collected little information is provided in the final report on the range of morbidity and mortality between farms or between vaccinated and unvaccinated animals. We are told that the incidence of severe scours (those requiring treatment) was around 15 percent of all calves in the trial and deaths due to scours were approximately 4% of all calves.
An analysis of 150-day liveweights of 73 calves showed no significant difference between the vaccinated and unvaccinated calves. Faecal swabs from this farm indicated that their primary problem was cryptosporidia. No other weights were collected and although the protocol for an economic analysis was set up no figures were presented in the final report.
4.1.2. Producer survey A survey was conducted in the Tallangatta Valley in 1995 following a season of acute calf scours in autumn 1994. Both beef and dairy properties were included, however no indication of the number of properties surveyed is given.
The percentage of calves reported to be affected by scours in 1994 varied from 2% to 90%. Most calves affected with acute scours were between 5 days to three weeks of age.
From samples that had been taken it was concluded that in that area:
E. coli was less responsible than the other organisms as a cause of scours
verotoxin-producing E. coli may be contributing scours

Calf Scours in Southern Australian Beef Enterprises
14
Salmonella spp and possibly Cryptosporidium spp are more likely to be the causes of microbial scours
parasitic scours may be responsible
Diagnostic tests were slow, generally taking longer than one week, and often inconclusive
Farmers noted that calves born early in the season were responsible for infecting later calves, and the later calves were much slower to respond to treatment or died. This was especially the case on dairy farms.
The producer survey indicated that the 1994 calf scour outbreak in that district could be related to or associated with:
the abundance of good quality green summer feed prior to the autumn calving period
a lack of shade and a long distance for calves to travel to water
poor vaccination programs for clostridial diseases and leptosporosis
first calf heifers
introduction of stock, especially introduction of calves to replace dead calves
extreme heat, wet or windy days followed by thunderstorms
It was also noted that incidence of calf scours was minimised by:
the application of lime to the paddocks which pregnant cows had access to
running pregnant cows in sheep paddocks or bush paddocks before calving
4.1.3. Treatments used Several farmers reported not using any treatment at all and veterinary advice was usually sought only for stud calves. It was noted that veterinary advice from different sources varied.
Mild scours were treated with tablets and electrolytes, more serious cases by tablets electrolytes and injectable antibiotics. Acute scours were regularly treated with IV fluid therapy and antibiotics, but still resulted in a number of deaths. It was noted that in beef herds early intervention can be difficult, and late treatment resulted in increased treatment cost.
The dose of electrolytes used varied and it was suggested that the recommended dose on the pack may be too low. It was also reported that antibiotics had very little or no effect. This statement referred to injectable antibiotics as it was also noted that the use of tablets together with electrolyte replacement was most beneficial.
Treatment was frustrating, as animals that responded to initial treatments with electrolytes would become sick again.
It was recommended that farms affected by scours should routinely collect and analyse faecal swabs, but post-mortem examination of untreated acutely affected animals is the best diagnostic tool. Faecal swab samples can be difficult to interpret because of mixed infections.

Calf Scours in Southern Australian Beef Enterprises
15
4.2. 96/V04 Tallangatta study number two This study in 1999 was a 4 way trial looking at E. coli vaccination and selenium injection prior to calving. It also aimed to determine the causative organisms for scours in calves less than four weeks of age, to devise management strategies to maximise calf survival during the first four weeks, and to assess the impact of calf scours on herd efficiency.
Twenty-seven percent of the 431 calves born on the three farms during the monitoring period had some degree of scours, with the herd incidence varying from 20 to 32 percent. There was no significant difference between any of the treatment or control groups.
Marginal selenium deficiency was only diagnosed on one farm, although only 4 cows were sampled on each property. On the marginal property there was no significant difference between selenium treated and non-treated animals. However it was also noted that the dose of selenium given was half that recommended by the manufacturer.
There was no benefit shown by E. coli vaccination, however E. coli was not cultured from any of the farms and was probably not the cause of calf scours on these farms.
Faecal samples from three farms were tested for rotavirus, coronavirus, Salmonella, Yersinia and pathogenic E. coli strains, however the only organisms isolated were cryptosporidia. No information was given as to the number of samples from which this was cultured, or the age of the calves from which this was isolated. In the conclusion is the project coordinator commented that the presence of cryptosporidia were inconclusive, however this statement was not explained.
There was no significant difference in the 300-day weights of scouring and non-scouring calves.
4.3. 99V07 Proposed Pakenham Study The Pakenham Beefcheque group also applied to run a PIRD project on calf scours. Its aim was to increase the understanding of the group of the major factors that affect calf health and survival during the first few months of life, and to specifically investigate whether poor transfer of maternal immunity is an important factor for the early health and performance of beef calves as they are managed on the farms in that district. However the project did not take place as the group and their advisers were unable to agree on methodology.

Calf Scours in Southern Australian Beef Enterprises
16
5. PRODUCERS EXPERIENCE WITH CALF SCOURS -PRELIMINARY QUESTIONNAIRE 5.1 Methodology A short survey on calf scours was published in Feedback magazine in February 2003. The aim of this questionnaire was to gauge the level of interest among beef producers and give a brief overview of their experience with calf scours. Information was collected on the size of the enterprise, the number and age groups of calves affected, treatments used and their perspective on the significance of calf scours to their enterprise
5.2. Results Seventy-six producers responded to this questionnaire; forty-eight considered calf scours to be a major problem in their enterprise, 21 considered it a minor problem, 4 enterprises had no problem with calf scours and 3 properties had previously experienced a problem.
5.2.1. Demographics Thirty-one respondents were from Victoria, 20 from New South Wales, 10 from South Australia, 10 from Western Australia, 3 from Queensland and 2 from Tasmania.
Sixty-seven of the respondents had a cow calf enterprise, 4 were calf rearers, and 5 participated in both types of enterprises. One of the latter purchased dairy – cross heifer replacements as calves to rear on cows and it was only in the purchased calves that there was a problem
The four calf rearing properties included one white veal operation that raises 12,500 calves a year, and another farmer who raises six calves at one time. Due to the small number of these operations and the large discrepancy in the type of their operation subsequent analysis was only carried out on the sixty-seven cow calf enterprises.
Two of these were in Queensland, one was within 10 kilometres of the New South Wales border and the other within 40 km of the border, both in the Warwick area. Due to their proximity to NSW it was decided to include them in the data analysis.
Eighteen farmers (28%) raised 100 calves or less, 17 (27%) farmers raised between 101 and 200 calves a year, twenty farmers (31%) raised between 201 and 500 calves a year, eight farmers (12%) raised between 501 and 1000 calves per year and one farmer raised 1300 calves a year.
Figure 1: Number of calves reared per farm per year
02468
101214161820
1-100 101-200
201-300
301-400
401-500
501-600
701-800
801-900
901-1000
1201-1300
Number of calves reared per year
Num
ber o
f far
ms

Calf Scours in Southern Australian Beef Enterprises
17
Stocking rates varied from 0.5 to 32 DSE per hectare for the 61 respondents that provided this data. Fifty-four producers had one calving period a year and 13 producers had two. Only three producers calved all year-round. Producers were asked in which months they calved their cows, and these were grouped into spring (August to November), summer (December and January), autumn (February to May) and winter (June and July). 71% of producers calved cows in autumn and 56% in spring. The distribution of farmers calving in each period for each state is shown Table 2.
Table 2: Distribution of calving period by State (number of farms) τ
State
Spring Summer Autumn Winter
NSW 18 1 11 8
QLD 2 1 1 1
SA 2 10
TAS 2 1
VIC 13 3 16 6
WA 1 1 9 1
Total 38 6 47 17
τ total number is greater than the number of farms involved in the survey due to farms having more than one calving period, or they calving period overlapping two or more seasons
5.2.2. Producers experience with calf scours in cow calf enterprises Forty-two producers considered calf scours a major problem, 19 a minor problem, 2 had previously had a problem and thirteen producers did not consider calf scours to be a problem on their properties. Seventy-six percent of producers (n=51) had consulted their veterinarians with this problem. However 14% of producers (n=6) who considered this a major problem had not consulted their veterinarian. Both producers who had previously had a problem with calf scours had consulted their veterinarian.
Thirty-seven percent of producers (n=25) reported some calves affected within five days of birth. Seven producers had between 30% and 50% of their calves affected and 1 producer reported 90 percent of their calves affected at this age.
Sixty percent of producers (n=40) had calves affected between 6 - 21 days of age. Eleven producers had between 30% and 50% of their calves affected, with 1 producer reporting 70% of calves affected and another 100% of calves affected at this age. However, in the latter case mortality rate was zero.
Sixty three percent of producers (n=42) reported calves affected between three and six weeks of age. Three producers had between 30 and 50% affected, and five producers had 50% or more affected. However no producers described the extreme numbers reported in the younger age groups.
Thirty one percent of producers (n=21) had calves affected between 7 and 16 weeks. In general this age group was less of a problem, but there was still one producer with 50% of his calves affected and another producer with 65% affected

Calf Scours in Southern Australian Beef Enterprises
18
Table 3: Numbers of farms with calves affected in each age group Age of Calves Affected Percent affected 0-5 days 6-21 days 3-6 weeks 7-16 weeks
0% 42 27 25 46
0.1 - 5% 14 9 12 11
5.1 - 10% 3 8 8 5
10.1 - 15% 0 1 3 0
15.1 - 20% 3 9 4 2
20.1-30% 3 4 7 1
30.1 - 50% 1 7 3 1
> 50% 1 2 5 1 5.2.3. Mortality rates Seven producers (10%) lost more than 5% of calves in one or more age groups.
Twenty-five percent of producers (n=17) lost calves from scours within five days of birth. (Table 4) Two producers had a mortality rate greater than 5%.
Forty-two percent of producers (n=28) lost calves between 6 - 21 days of age. Four producers had a mortality rate greater than 5%.
Forty-three percent of producers (n=29) lost calves between three and six weeks. Four producers had a mortality rate greater than 5%.
Nine percent of producers had calves die between 7 and 16 weeks. This age group was not as badly affected with no more than 2 percent losses.
Table 4: Mortality rate in different age groups (number of farms) Age of Calves Affected Percent affected
0-5 days 6-21 days 3-6 weeks 7-16 weeks
0% 50 39 38 61
0.1-2% 12 17 17 6
2.1-5% 3 7 8 0
5.1-10% 2 4 4 0 5.2.4. Isolates from faecal samples Faecal samples had been carried out on 20 farms with pathogens had been isolated on 18 farms, 16 of which considered that they had a major problem with scouring calves, and one farm that had previously had a problem. Only farms in NSW, Vic and WA reported that they had taken faecal samples. The most common isolate was E. coli (n=14) followed by coccidiosis (n=8) and rotavirus (n=6) (Table 5). More than one pathogen had been isolated from faecal samples on 11 farms. E. coli and coccidiosis were isolated together on 7 farms, and in 6 of the 7 properties where rotavirus was isolated E. coli was also cultured. On 2 farms all three of these pathogens were isolated together with Salmonella. E. coli, rotavirus and coccidiosis had been isolated in all three states, all 4 cryptosporidia isolates were reported from Victoria, and both Salmonella isolates from New South Wales.

Calf Scours in Southern Australian Beef Enterprises
19
It is not possible to draw significant conclusions relating pathogen isolated to the age of the calves affected. This is partially due to the small number of farms that reported isolates and also because in this short survey we did not enquire at what age the samples had been taken and many farms had calves affected across several age groups. As a general rule the relationship between isolates and age group followed the trend that would be expected from their pathogenesis. However E. coli was most commonly isolated on farms that had calves affected between five days and six weeks. There was little association between E. coli isolation and calves affected at less than five days and no association between E. coli isolation and high mortality at less than five days. As E. coli was mainly isolated on farms in conjunction with another pathogen it is likely that it was not the primary cause of the scours.
Table 5: Number of farms reporting culture of major pathogens Pathogen Number of isolatesϕ
E. coli 14
Rotavirus 6
Coronavirus 0
Cryptosporidia 4
Coccidiosis 8
Salmonella 2
Yersinia 0 ϕ total number greater than total number of farms due to multiple isolates on many farms
5.2.5. Use of vaccination Five producers used E. coli vaccination in their cows and only one used a Salmonella vaccine. Sixty three percent of producers (n=42) vaccinated for Clostridial diseases +/- Leptospirosis. The producer that vaccinated for Salmonella also vaccinated for E. coli, had isolated both pathogens from faecal samples, and stated that scours was no longer problem on his property. The other four respondents who vaccinated for E. coli all considered calf scours to be a major problem on their farm. E. coli had been isolated from faecal samples from three out of four properties.
5.2.6. Stocking rate Cow calf enterprises that considered calf scours a major problem reared between 40 and 1300 calves a year. There was also a wide range of stocking rates. Three of the four producers who considered that calf scours was not a problem on the property had stocking rates less than 0.2 cows per hectare, but 14 properties with a similar stocking rates considered calf scours to be a major or minor problem.
5.2.7. Treatments used Sixty-nine percent of all respondents used proprietary antibiotic scour treatments in the form of tablets or liquid and 73% used oral electrolytes. Forty-six percent used injectable antibiotics and 19% had used IV fluids. IV fluids were only used by producers who considered that they had a major problem, and were most commonly used when the age group affected was 6-21 days. There was significant association between use of IV fluids and isolation of rotavirus (p <0.01) and E. coli (p < 0.01). Producers who considered they had a major problem also showed a trend towards using more oral electrolytes compared with those that had a minor problem (81% vs. 68%).
Very few other treatments were reported. One respondent used “red cordial”, another used fresh water and a third used “paddock management”
Calf Scours in Southern Australian Beef Enterprises
20
6. PRODUCERS EXPERIENCE WITH CALF SCOURS - DETAILED SURVEY The aim of this survey was to better define the scour problem on the respondents’ properties and to determine more specific information on management strategies and how they might relate to the problem. Information was also collected on the range and success rate of treatment strategies employed, as well as the interaction the producer had with their veterinarian regarding calf scours. The majority of the respondents to the first farmer survey were from cow-calf enterprises, therefore it was decided to confine a more detailed study to these farms.
6.1. Methodology A comprehensive telephone survey was designed and 60 of the 76 respondents from the first farmer survey participated. Twelve of the original participants declined to participate in any further survey and four were calf rearing enterprises. Most of the information collated is descriptive details on management practices, the scour problem on the farm, and various treatment and preventative strategies.
Information on the number of calves affected was collected for different age groups. Age groups were selected that were likely to relate to possible pathogens. The percentage of animals affected in each age group was calculated by taking the number of cows calved minus the expected 0-48 hour death rate as the initial denominator. For each age group apart from the youngest, the number of animals known to have died in the preceding age groups was subtracted from the initial denominator. In order to compare different age groups the prevalence was converted to an attack rate, which equates to the prevalence per week. Farms were then grouped according to the maximum attack rate in any age group into low attack rate (< 5%, n=32) and high attack rate (≥5%, n=25) herds. The two groups of herds were compared against the presence or absence of a range of specific management factors using Fisher’s exact test3 in order to show any relationship that existed.
6.2. Results 6.2.1. Herd demographics and management practices Twenty-five respondents were from Victoria, 16 from New South Wales, 8 each from South Australia and Western Australia, 2 from Tasmania and 1 from the Warwick area of Queensland. Forty-four of the respondents considered calf scours to be a major problem on their farm, 12 respondents considered it a minor problem and 4 respondents either had no problem or no longer had a problem.
Twenty-three enterprises supplied the feedlot industry, 20 produced vealers, 13 sold their stock as stores, 8 sold replacement heifers, and 22 had other markets for their cattle. The main breed of cattle on the respondents enterprises were Angus cattle represented by 21 farms, 21 farms had crossbred cattle, 7 Hereford, 5 Murray Grey cattle and the rest of the farms ran Limousin, Charolais, Shorthorn and Friesian cattle.
The number of breeders on the enterprises concerned varied from 46 to 1300 with a median of 240 (Figure 2). Twenty-six farmers had increased the number of breeders by more than 20 percent in the last three years, on 23 farms the number of breeders had stayed the same, and on 11 farms the number of breeders had decreased by more than 20 percent. Fourteen farmers that had increased their number of breeders had also increased their stocking rate, and 12 farmers had kept their stocking rate the same. Six farmers that had decreased their number of breeders had also decreased their stocking rate, 4 farmers had kept their stocking rate same and 1 had increased their stocking rate. The majority of farmers (n=43) had a stocking rate of eight DSE/ha or less, a further 15 farmers had a stocking rate of 8 - 16 DSE/ha and two farmers had a stocking rate of 32 DSE/Ha.
Twenty-six herds calved in spring, 2 in summer, 39 in autumn and 14 in winter. The calving percentage of the herds varied from 53% to 102% with a mean of 92% and median of 94%. Forty-five herds (75%) routinely pregnancy tested their cows.
Less than 5% of calvings were assisted in 56% (n=34) of herds, between 5 and 10 percent of calvings were assisted in 33% (n=20) of herds, and six herds assisted in excess of 10% of calvings. Mortality rates

Calf Scours in Southern Australian Beef Enterprises
21
at or within 48 hours of calving were generally low with 36 farmers reporting that less than 2% of calves were lost at this time. Twenty-two herds lost between 2% and 5% of calves and 2 herds lost between 5% and 10% of calves. Forty-two percent of herds were easy calving with less than 5% of cows having an assisted birth and a less than 2% mortality rate.
Figure 2: Variation in the number of breeding cows between survey respondents Herd Management
The weaning percentage of 50 herds for which that information was available varied from 75% to 107% (mean 96%, median 96%). For the 8 herds that had not yet weaned their last drop the branding percentage varied from 79% - 100% (Mean and median = 90%).
Thirteen farmers purchased calves or unmated heifers, and a further 6 had purchased some calves in the preceding year to foster onto cows. Seven farmers routinely purchased mated heifers and 9 purchased adult cows. Thirty-five farmers did not purchase any additional breeding stock or calves to foster.
6.2.2. Management of cows and calves 6.2.2.1. Calving Management Forty-two respondents had a set calving paddock or paddocks and 17 rotated their calving paddocks. Fifteen farms had less than 10% shelter from the prevailing wind in their calving paddocks, three farms had no shade, and 18 farms had only the occasional tree to provide shade. Seven farms had calving paddocks that were wet more than 50% of the time, 29 farms had calving paddocks that were never wet and on the remaining farms the calving paddocks were wet in inclement conditions. Seven respondents vaccinated against E. coli and two against Salmonella
6.2.2.2. Colostrum management Thirteen farmers supplemented their calves with colostrum or colostrum substitutes, however not one of them tested the quality of the colostrum and only one farm had checked the effectiveness of colostrum transfer by blood testing calves to check for antibody or serum protein level.
6.2.2.3. Management of cows with young calves Two-thirds of farms (n = 40) use the same paddocks for cows with young calves every year. On thirteen farms less than 25% of paddocks where cows and calves are run are sheltered from the prevailing winds. Twenty-one farms had more than 75 percent of paddocks sheltered from the prevailing wind. Fifty-eight farms had water available in all paddocks but on 11 farms there were obstructions preventing the calves
0
5
1 0
1 5
2 0
2 5
3 0
0 -19 9 2 0 0 -39 9 4 0 0 -59 9 6 0 0 -79 9 8 0 0 -9 99 1 0 0 0 -1 1 9 9
1 2 0 0 -1 3 9 9
Nu m b e r o f Br e e d in g c o w s
Num
ber o
f her
ds

Calf Scours in Southern Australian Beef Enterprises
22
from drinking. On 29 farms there was less than 200 m between shade and water, on twenty-six farmers this distance was between 200 and 499m and on five farms this distance was greater than 500 m.
6.2.2.4. Nutritional management Forty farms are used a rotational grazing pattern (either rotational, cell grazing or strip grazing), 12 farms set stocked and 7 farms used a combination of both.
The majority of farms (n=47) supplemented their herd with some hay, although in most cases (n=28) this was only between 1-50 kg/DSE /year, 13 farms supplemented with silage and 7 with grain. Most farmers (n=44) did not routinely condition score their cows.
Mineral deficiencies had been tested for on 18 properties in the last 10 years. Five properties were shown to be deficient for copper, cobalt and selenium, 7 properties were shown to be deficient in selenium only, 1 property was deficient in copper and another in cobalt. A total of 37 herds supplemented with minerals, and 22 herds supplemented with more than one type of mineral. Twenty-four herds supplemented with selenium, 22 with copper, 21 with cobalt and 16 with magnesium.
6.2.2.5. Other diseases Although other diseases were prevalent in the study herds they were generally at a low level. Twenty-five herds experienced grass tetany, but in the majority of cases (n=21) less than 5% of the cows were affected. Twenty-eight herds had cows go down with milk fever, but this incidence was less than 5% in 27 of the herds. Twenty-one herds had calves with pneumonia, but in 20 herds less than 5% of calves were affected, 26 herds had calves with infected navels and 22 herds in calf with joint ill. Twenty herds whose calves were affected by calf scours had no other disease problems in their calves, nor did the two herds that did not have problems with calf scours.
6.2.2.6. Preventative measures Vaccines are currently available for E. coli and Salmonella, and a rotavirus vaccine was available until it was withdrawn in the late 1990’s. Of the 57 farms that reported a problem with calf scours 7 respondents vaccinated against E. coli and two against Salmonella. Neither of the properties that vaccinated for Salmonella had had Salmonella isolated from faecal samples, and the two properties where Salmonella was isolated did not vaccinate.
Only 3 of the properties that vaccinated for E. coli had had E. coli isolated. Of these respondents only two thought that vaccination had resulted in lower morbidity and mortality from scours in their calves. None of the other respondents that vaccinated for E. coli had seen any benefit from the vaccine. The reasons given for not vaccinating against E. coli by six respondents that had had E. coli isolated on their property were as follows
had discussed the possibility with their veterinarian but didn’t think the problem was severe enough to warrant it (2 respondents),
too expensive
had tried vaccinating but results not good enough to warrant the time and expense, plus timing was a problem before calving
not had a problem since
did not feel the E. coli was the sole cause for the problem, other factors need fixing first.
Only 2 respondents had vaccinated for rotavirus when that vaccine was available, one of these respondents had felt this was beneficial.
6.2.2.7. Calf scours on the survey farms Respondents were asked to provide the number of calves that had scoured in the most recent calving period for the age groups 0-5 days, 6-21 days, 3-6 weeks and 7-16 weeks. Because the calves and their dams are often all run together as one mob, many farmers found it difficult to be specific on the ages
Calf Scours in Southern Australian Beef Enterprises
23
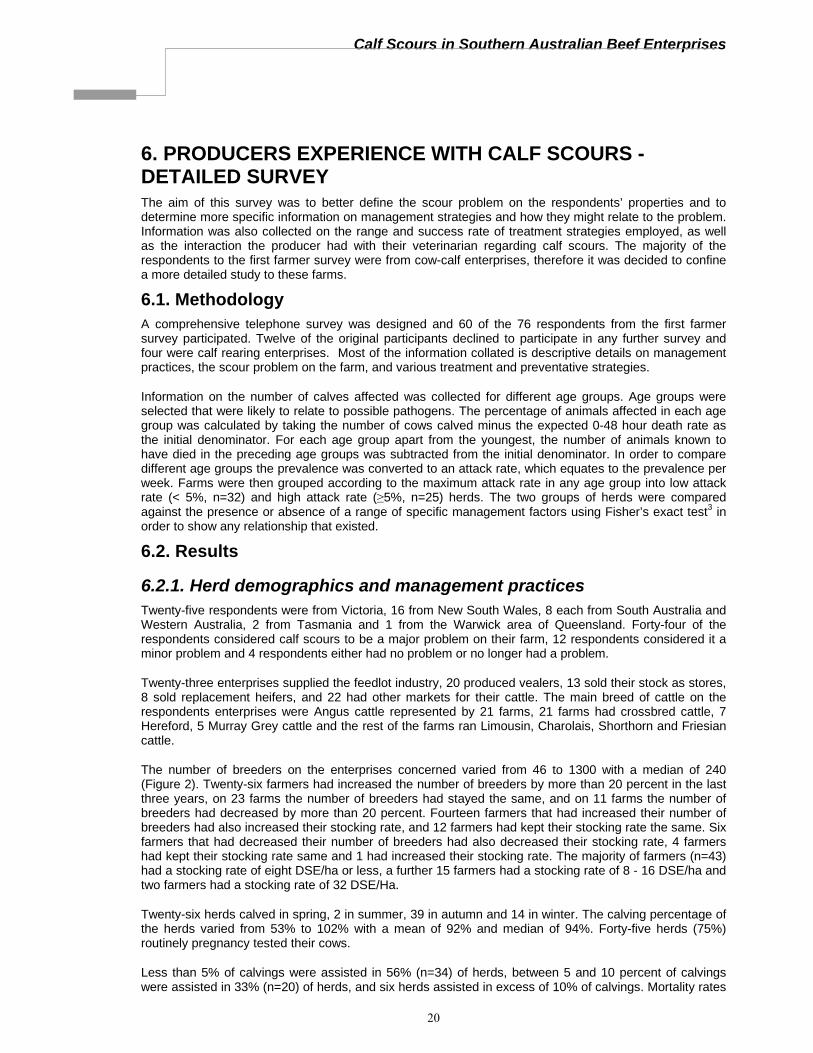
affected. Three farmers were unable to provide precise numbers and so the following information is from 57 properties. The majority of farms had calves affected in the 6-day to six-week period, although on one third of farms calves were affected in the first 5 days of life and a similar proportion had calves affected at 7-16 weeks of age. Only 3 farms had calves that were affected when they were older than 16 weeks. Sixteen farms had a prevalence of 20% or greater in one or more of the age groups, and 19 farms had a mortality rate > 2% from 0 to 16 weeks. The mean, median and range of prevalence and mortality rate for each period for the 57 farms that provided data are shown in Table 6. The age at which clinical signs were first observed are shown in Table 7.
Table 6: The prevalence of calf scours and associated mortality rates for each age group Prevalence 0-5 days 6-21 days 3-6 weeks 7-16 weeks >16 weeks
Mean 4.2% 12.1% 8% 2% 0%
Median 0% 5.5% 4% 0% 0%
Max 94% 96% 52% 25% 3%
Min 0% 0% 0% 0% 0%
Number herds affected 19 41 45 17 3
% Herds Affected 33% 72% 79% 30% 5%
Mortality rates
Mean 0.3% 1.0% 0.6% 0.2% 0.0%
Median 0.0% 0.0% 0.0% 0.0% 0.0%
Max 5% 9% 6% 7% 0%
Min 0% 0% 0% 0% 0%
Number herds affected 12 28 20 5 1
% Herds Affected 21% 49% 35% 9% 2%
Number of herds with mortality > 2%
2 9 5 1 0
Table 7: The age at which calves first showed signs of scours on the 57 properties Age signs first seen Number of farms
0-5 Days 19
6-21 Days 22
3-6 Weeks 11
7-16 Weeks 3
Don’t have a problem 3
In order to compare the different periods the attack rate was calculated for each week. Between 0-5 days 12 herds had attack rates greater than 5%, from 6-21 days 16 herds had attack rates greater than 5% and from 3-6 weeks 8 herds had attack rates greater than 5%. The range of attack rates for each age group is shown in Table 8.

Calf Scours in Southern Australian Beef Enterprises
24
Table 8: Mean median and distribution of attack rate between herds in each of the different age groups
Age of calves
Attack rate 0-5 days 6-21 days 3-6 weeks 7-16 weeks
Mean 5.3% 5.3% 2.6% 0.2%
Median 0.0% 2.4% 1.4% 0.0%
0% 38 16 12 43
0.1-5% 7 25 37 14
5.1-10% 4 6 5
10.1-15% 4 4 2
15.1-20% 2 3 1
20.1-50% 3
>50% 2
When this is plotted against the total mortality for the 0-16 week period it can be postulated that there are several different presentations of calf scours (Figure 3). However this also demonstrates that there is likely to be a large range in the definition of calf scours. Area A outlines outbreaks of calf scours that are observed to have a high mortality compared to the attack rate. This may indicate severe illness, or a failure to recognise symptoms early enough resulting in a high mortality. Area B shows a strong positive correlation between attack rate and mortality corresponding to a classic disease pattern. In general neither mortality nor attack rate are very high in this group. Area C shows cases of calf scours with no mortality. In these herds that attack rate can be high, in this case in excess of 70%, but there is little or no mortality. This is possibly a nutritional scour or self-limiting disease, however the question must be asked if these are just animals with loose faeces due to lush grass.
Figure 3: The maximum attack rate (In weeks) compared with the total mortality rate for the 0-16 week period.
A
B
C 0%
2%
4%
6%
8%
10%
0.0% 10.0% 20.0% 30.0% 40.0% 50.0% 60.0% 70.0% 80.0% 90.0% 100.0%
Maximum weekly attack rate
Tota
l 0-1
6 w
eek
mor
talit
y ra
te

Calf Scours in Southern Australian Beef Enterprises
25
Affected calves showed a variety of symptoms, with the most common ones being dehydration, watery faeces, soft faeces and lethargy. The range of signs observed and the frequency of their occurrence are shown in Table 9.
Table 9: Common symptoms observed in scouring calves and the number of farms they were observed on Blood in faeces 31
Coughing 5
Death 43
Dehydration 53
Distended Abdomen 18
Kicking at Belly 13
Lethargy 50
Panting 22
Soft Faeces 50
Straining 26
Watery diarrhoea 52 The pathogens on the survey farms: Twenty-five of the sixty respondents had had faecal cultures carried out on their farms. A veterinarian had recommended that samples should be taken on a further 9 farms but this had not been done. Pathogens had been isolated from 18 farms and 10 of these farms had had multiple pathogens isolated. Two of the 18 farms knew that a pathogen or pathogens had been isolated but could not remember what. The total numbers of each pathogen isolated from the 16 farms are shown in Figure 1. Farmers were also asked if they were suspicious of particular pathogens even if nothing had been isolated or if tests had not been done. Twenty-three farmers were suspicious of a specific pathogen or pathogens and these are also shown in Figure 4.
Figure 4: The number of farms with confirmed isolates from faecal samples or suspicious cases of each pathogen
0
5
10
15
20
25
30
35
E Coli
Salmon
ella
Yersini
a
Cyptos
porid
ia
Coccid
iosis
Rotavir
us
Corona
virus
Intes
tinal
Worms
Pestiv
irus
Pathogens
Number of farms
SuspiciouscasesConfirmedisolates

Calf Scours in Southern Australian Beef Enterprises
26
E. coli was the most common isolate and was found on 13 farms, however on it was isolated from all 10 farms with multiple pathogens. The other pathogens were mainly coccidia (9 farms) and also cryptosporidia, rotavirus and Salmonella. Although one farmer was able to relate different isolates to different years and distinguish the numbers affected, the majority of farmers attributed the same outbreak to multiple pathogens. The mean percentage of calves affected in 8 known multiple pathogen outbreaks was 14% (Median 11%, range 0.3-35%) and the mean mortality rate was 3% (Median 3%, range 0-10%). Apart from E. coli the only other single isolate was Cryptosporidium, The three farms affected reported a morbidity of 16%, 21% and 100% and a mortality of 8%, 8% and 1% respectively.
6.3. Factors that predispose to calf scours Farms were divided into high and low prevalence farms on the maximum weekly attack rate across the first 16 weeks of life. High attack rate farms had a maximum attack rate > 5% for one or more weeks of this period. Management factors that might influence calf scours were compared between the 25 high farms and 32 farms that had an attack rate less than 5% per week using the McNemar’s test to compare proportions.
A high attack rate was strongly associated with spring calving (71% vs. 24%, P < 0.001). Attack rate was also higher in herds where grass growth coincided with calving (65% VS 29%, P < 0.05). It is likely that the latter is a reflection that the problem is much more common in spring calving herds. A low attack rate was associated with fertiliser application in the summer (18% VS 0, P < 0.05).
Within the limits of the accuracy of the data and the number of herds surveyed no association could be shown between a high attack rate and the following possible predisposing factors.
6.3.1. At Calving calving in the summer, autumn or winter
colostrum supplementation
the % of births assisted
the mortality rate in the first 48 hours
if the same paddock was used for calving every year
whether the calving paddocks were rotated or set stocked
the amount of shelter from the prevailing wind or shade in the calving paddock
the amount of time the paddocks were muddy at calving
6.3.2. Neonatal management the amount of shelter from the prevailing wind or shade in the paddocks where calved were reared
the distance from shade to water in the calving paddock
availability or accessibility of water
water source
6.3.3. Nutritional management the stocking rate on the farm
set stocking or rotational grazing
grass growth in any specific month of the year

Calf Scours in Southern Australian Beef Enterprises
27
fertiliser application in autumn, spring or winter
the feeding of hay, silage or grain
known deficiencies in copper, cobalt or selenium
mineral supplementation
6.3.4. Concurrent diseases on the farm grass tetany
milk fever
calf pneumonia
joint ill in calves
naval ill in calves
diagnosis of pestivirus
6.3.5. Management practices castration when less than 16 weeks
dehorning when less than 216 weeks
age when first drenched for worms
change in stocking rate over the past 3 years
change in cow numbers over the past 3 years
Purchase of replacement breeding stock
Purchase of calves to foster onto cows
6.4. Management of sick calves Respondents were asked about how they managed scouring calves and what treatments they used. Fifty-seven respondents that had a calf scour problem answered this part of the survey. Forty-eight respondents check for sick calves once or twice a day when the calves were young. The remaining respondents check between every second day up to once a week. Twenty-seven respondents had an isolation area for sick calves for sick calves and their mothers. Fifteen farmers do not isolate cows and calves or separate sick calves from their mothers for treatment. Thirteen respondents isolate cows and their calves from unaffected animals for up to 3 days, nine respondents isolate cows and their calves for over three days and some cases for over a week, and a further three respondents isolate cows and their calves until calves have stopped scouring.
A total of 23 respondents separate calves from their mothers for treatment as routine practice, and five separate calves when they are more severely affected. Twelve farmers separate calves from their mothers for up to 24 hours, nine farmers separate calves for 25-48 hours, 4 farmers separate calves for more than 48 hours and a further three separate calves until they have stopped scouring and/or they can stand.
Forty-eight farmers feed calves electrolytes when they are scouring, however only 17 feed more than four litres a day, and seven feed 2 litres or less (Table 10). Four farmers that feed less than 2 litres leave calves with their mothers, but one farmer separates calves from the dams for over 48 hours. Two farmers that separate the calves from the mother do not feed any electrolytes at all. Of the 25 farmers that feed electrolytes when the calf is on the dam at least three of them feed electrolytes solutions containing

Calf Scours in Southern Australian Beef Enterprises
28
sodium bicarbonate and a further eight feed unknown solutions that may contain sodium bicarbonate. Only 4 farmers feed electrolytes solutions containing additional energy.
Table 10: Litres of electrolytes fed per day to scouring calves Remove from dam Amount of
electrolytes/day No Sometimes Yes
<2 L 4 3
2.1-4 L 12 3 9
4.1-6 L 5 1 7
>6 L 1 1 2
Don't feed 7 2
Four farmers do not use any antibiotic treatments for scouring calves, 22 farmers use only oral antibiotic scour tablets or liquids, 7 only use antibiotic injection and 23 use both. The most common antibiotic injections used are trimethoprim sulphurs, oxytetracycline and penicillin. On 21 properties there is significant under-dosing of antibiotic treatments, most commonly because treatment course was not long enough.
The reported recovery rates from farms that provided this information is given in Table 11, however this information could not be related to the severity of disease in the affected animals. It is likely that animals that were not treated were less severely affected and animals given electrolytes, injectable and oral antibiotics were more severely affected. Very few calves were given IV fluids, it was used on 6 properties with between 4% and 25% of calves on each property being treated and in most cases it is likely to be given to severely affected calves. The highest mean recovery rate was achieved when electrolytes only were used.
Only 16 farmers treat every scouring calf, most farmers only treat calves are that sick or dehydrated or that they “can catch”. Only eight farmers treat calves with more specific clinical signs such as blood in faeces or watery scours.
Depending on how cows with young calves are managed and the severity of the scour outbreak, treatment of affected calves can be very time-consuming. Forty percent of respondents (n=23) reported that it took between 40 and 60 minutes per day to treat each affected calf, fourteen respondents said it took between 20 and 40 minutes per day and only 16 respondents reported that it took less than 20 minutes per day per calf. Two respondents reported that it took between 1 1/2 and three hours to treat each affected calf.
Table 11: Reported recovery rate (% of calves treated) of treatments used Treatment No farms Mean (%) Median (%) Range (%)
Electrolytes only 13 97 100 90-100
Oral antibiotics only 15 91 100 50-100
Injectable Antibiotic only 6 86 95 50-100
Electrolytes & oral antibiotics 23 86 90 50-100
Electrolyte & Injectable antibiotic 2 85 85 75-95
Injectable & oral antibiotics 7 92 95 70-100
Electrolytes, injectable & Oral antibiotics 6 78 88 50-100
IV fluids 5 45 30 0-100
No treatment 10 96 100 60-100

Calf Scours in Southern Australian Beef Enterprises
29
6.5. Interaction with veterinarians Most respondents would contact their veterinarian with a scour problem when the usual treatment was not working or when calves started dying (Table 12). Six respondents stated that they would never contact a veterinarian with a calf scour problem.
Table 12: The stage at which respondents would contact their vet with a calf scour problem
Reason for contact No. respondentsτ
Non response to usual treatment 19
When calves start dying 18
When mortality > 2% 9
Never 6
When at least 5% of the group are affected 4
When scours first noticed 3
When need more antibiotics 3
When 10% Need Treating 1
When mortality > 5% 1
When mortality > 10% 1 τ Some respondents recorded more than 1 reason
Only 14 respondents would expect their veterinarian to visit the farm when they have a calf scour problem, with the majority (n=32) expecting that their veterinarian would prescribe them drugs and advice over-the-counter. Six farmers would expect their veterinarian to ask them to bring calves into the clinic, and a further 11 would expect to be asked to bring faeces samples in. Post-mortems had only been carried out on calves on 14 of the affected properties.
6.6. The effects of calf scours on the enterprise Only 13 farmers did not notice any effect of calf scours on the growth of their calves. Twenty-one farmers could identify calves that had scoured 1 month later, 15 farmers could identify calves that had scoured 2 months later and eight farmers could identify calves that had scoured at weaning. No respondents had calculated the exact cost of calf scours to the enterprise, 4 respondents estimated the cost at between $2000 and $20,000 per annum, and one farmer had calculated that it cost $30.50 to treat each calf.
6.7. Economic losses due to calf scours The losses due to an outbreak of calf scours include:
Calf death - which is effectively the loss of income from a cow for the year
Cost of treatment of the calf, including the time taken, which can be significant in a paddock situation
Impact on growth rate and possible lower weaning weight
Culling cost of the dam (in most situations she is likely to be culled because she does not have a calf at foot at weaning/marking
Loss of genetic potential from the calf and the dam
A decreased capacity to improve and maintain the herd
The economic losses for each farm for the year preceding survey was calculated from the information the respondents had provided on number of calves affected and dead, treatments used and the proportions

Calf Scours in Southern Australian Beef Enterprises
30
of animals treated, and the time respondents had given to treat each calf. Costs that we used to calculate these are shown in Table 13.
Table 13: The costs used to calculate economic loss from calf scours for each study farm Cost of loss of calf (includes loss of income/cost of replacement calf $150.00
Cost of time/hr to treat calves $15.00
Cost of electrolytes/litre $1.25
Cost of scour tablets/liquid per day $1.00
Cost of short-acting antibiotic injection per day $1.50
Cost of long acting antibiotic injection $3.50
Cost of intravenous fluids $120.00
Cost of culled cow (replacement cost - income from culled cow) $300.00
This estimate does not include any amounts for the impact on the growth rate, loss of genetic potential or the reduction in capacity to improve and maintain the herd, as these figures were not known.
The impact of calf scours can be calculated as estimate of the cost per scouring calf, the total cost to the enterprise or the loss per breeding cow, which adjusts for variation in the size of the enterprise.
Adequate information was available from 46 respondents. The cost of a scouring calf was calculated by estimating the chance and cost of treatment (including time for treatment) for each farm together the the chance of the calf dying. The mean cost was estimated as $73.30 (median $51.90, range $5.31 - $297.50) Low estimates related to herds with large numbers of scouring calves, most of which were not treated. Properties with a high cost either treated a significant number of calves with intravenous fluid or had a high mortality rate.
The loss per affected property varied from $128 to $41,138, and the mean loss per breeding cow was $18.70 (median $11.40, range $0.50 - $68.60). The range of loss per breeding cow is shown in Figure 5.
Figure 5: The range of loss per affected cow from calf scours in the year preceding the survey
0
2
4
6
8
10
12
14
16
$0-$5
$6-$10
$11-$15
$16-$20
$21-$25
$25-$30
$31-$35
$36-$40
$41-$45
$46-$50
$51-$55
$56-$60
$61-$65
$66-$70
Cost per breeding cow
Num
ber o
f far
ms

Calf Scours in Southern Australian Beef Enterprises
31
6.8. What the respondents would like to minimise their calf scour problem Forty-nine respondents had suggestions for solutions to their calf scour problem. The majority of suggestions (n=23) were to develop better vaccines. Ideally this vaccine would prevent all infectious causes of scours, preferably be one shot or even better combined with 7in1, and be cost effective! Eleven respondents would like to see better treatment options and protocols; 8 respondents would like more education, information and extension; 5 respondents would like to see better tests and investigation protocols; 3 respondents would like effective ways to prevent the spread and remove contagious bacteria and viruses from the environment; and 2 respondents would like better information on nutrition.

Calf Scours in Southern Australian Beef Enterprises
32
7. CATTLE VETERINARIANS EXPERIENCE WITH CALF SCOURS 7.1. Methodology A comprehensive study of cattle veterinarians’ experience with beef calf scours was carried out across the southern states of Australia using a written survey of major large animal practices.
In initial advert was placed in the Australian Cattle Veterinarian to identify interest veterinarians. Additional veterinarians were recruited from major beef cattle areas from where there were no respondents.
7.2. Results Of the 55 practices surveyed, 39 surveys were returned (69% response rate). The number of practices surveyed in each State is shown in Table 14. One practice that responded from New South Wales did not have a significant number of beef clients in their area, and one Victorian practice did not have time to fill out the survey. These practices were excluded from any further analysis.
Table 14: The number of practices in each state surveyed on their experience with beef calf scours State Replied No reply Total Percentage
response
NSW 16 7 23 70%
SA 4 4 100%
TAS 5 2 7 71%
VIC 9 6 15 60%
WA 4 2 6 67%
Total 38 17 55 69%
Over half of the practices (n=21, 58%) serviced 200 beef farms or less, 17% (n=6) serviced between 201 and 400 beef farms and 9% (n=3) serviced more than 400 beef farms. Another six practices (17%) were unable to supply the number of beef farms that they serviced. Cow-calf operations made up more than 75% of the beef clients for 64% (n=23) of the practices surveyed, and for a further 25% of practices cow-calf operations made up between 50% and 75% of their beef clients.
Fifty-eight percent of veterinarians considered scouring in beef calves to have significant economic impact on producers in their area, ranging from 20% in Tasmanian to 75% in South Australia and Victoria (Table 15). Veterinarians reported that an average of 9% of cow calf operations that they serviced were affected (range 0-20%).
Calf Scours in Southern Australian Beef Enterprises
33
Table 15: Veterinarians perceptions on the economic impact that calf scours has on their beef clients State No economic
impact Rarely has
economic impactQuestion not
answered Significant
economic impact Total
NSW 6 (40%) 1 8 (53%) 15
SA 1(25%) 3 (75%) 4
TAS 3 (60%) 1 1 (20%) 5
VIC 1 1 6 (75%) 8
WA 1 ( 25%) 1 2 (50%) 4
Total 11 (31%) 1 4 20 (56%) 36 7.2.1. Disease presentation Scouring calves were most commonly presented between 6 and 21 day of age in 44% (n=16) of practices. Twenty-eight percent of practices (n=10) treated the most scouring calves between 3 and 6 weeks, and 22% (n=8) of practices treated the most scouring calves between 0 and 5 days of age. Only two practices saw the most scouring calves between 7 and 16 weeks.
The group sizes presented varied from 10 to 300 calves (mean = 90.6 ± 7.0). Morbidity and mortality rates declined with age, but typical morbidity rates exceeding 75% of the group were reported especially in the younger age groups. Typical mortality rates up to 70% were also reported in the 0-5 day age group, with the average mortality reported for this group at 12% (Table 16).
Table 16: Typical morbidity and mortality rates for scouring beef calves according to age group 0-5 days 6-21 days 3-6 weeks 7-16 weeks > 16 weeks Morbidity Mortality Morbidity Mortality Morbidity Mortality Morbidity Mortality Morbidity Mortality
Mean (±Std)
21.1 (± 22.0)
12.0 (±16.0)
23.4 (±17.8)
7.3 (±7.0)
17.5 (±13.6)
4.4 (±5.0)
7.8 (±5.5)
2.1 (±3.4)
6.4 (±3.5)
1.8 (±3.6)
Min 5 0 2 1 1 0 2 0 2 0
Max 100 70 75 30 50 21 20 10 10 10 7.2.2. Laboratory work up Almost all veterinarians surveyed used the agriculture department laboratory in their state or the laboratory contacted to the State Department. Several Victorian practices used a private laboratory for some or all of their samples. In states where full cost recovery has been introduced in the past five years the comment was made by many practices that they no longer submitted as many, if any samples.
7.2.2.1. Tests requested Apart from two practices that treated very little calf scours, all practices had submitted faecal samples to a laboratory. However, 16 practices (46%) only submitted samples for 10% or less of the cases that were presented, and only 5 practices submitted samples for 50% or more of the cases that presented. A large majority of practices (n=27) submitted five samples or less and only four practices submitted more than five samples. Interestingly only one of these practices was in a state where full cost recovery was possible. One practice routinely submitted 5-10 samples from 75% of the cases presented. This practice appeared to have a good knowledge of the aetiology of calf scours in their area.
Only 14 practices (39%) requested a “calf scour package”, however this is probably because this is not available in New South Wales. Where practices specified the tests that they wanted carried out 58% requested a faecal float, 95% requested a bacterial culture and sensitivity, 63% requested viral isolation, 42% requested E. coli typing where appropriate, and only 11% requested Salmonella phage typing. However laboratories would provide the latter if Salmonella were cultured.

Calf Scours in Southern Australian Beef Enterprises
34
7.2.2.2. Pathogens isolated Respondents were asked to estimate the approximate number of pathogens isolated in the last five years. Response to this question was varied and some respondents only indicated approximate percentages. Of the 29 respondents to this question, two practices had not submitted samples. The number submitted by the remaining range from 3 to 270 (Mean 55 ± 62).
E. coli was isolated from all states, and only 2 practices reported that it had not been isolated from samples that they had submitted. In 15 practices it contributed to less than 25% of the total samples, and in eight practices it contributed to between 26 and 50% of the total samples. In one practice in South Australia it contributed to 60% of the total samples and in another in New South Wales E. coli was isolated from 90% of the samples submitted. It was isolated across all age groups of calves, but most commonly in calves aged six weeks or less. Thirty-six percent of veterinarians saw E. coli as a significant problem in calves aged 5 days or less, and the same percentage considered it to be a significant problem in calves aged 3-6 weeks. Forty-four percent of veterinarians saw E. coli as a significant problem in calves aged 6-21 days. In three veterinary practices E. coli was considered a significant problem in calves aged 7-16 weeks. Resistant E. coli were reported from 12 practices across all states. The most common antibiotics that E. coli were resistant to were trimethoprim sulphur, oxytetracycline and ampicillin, however one practice reported E. coli resistant to everything except gentamycin and two practices reported E. coli resistant to all antibiotics tested for.
Coccidiosis was the second most commonly reported pathogen and was reported from all states. It contributed to less than 25% of the diagnoses in 16 practices, and none of the diagnoses from eight practices. In one practice in New South Wales it contributed to between 26 and 50% of the diagnoses and in two practices in New South Wales E. coli contributed to between 51 and 75% of diagnoses.
Rotavirus was the next most commonly reported pathogen and was isolated from all states, but 9 practices reported that it had not been isolated from samples that they had submitted. It contributed to less than 25% of the samples submitted from 15 practices, between 26 and 50% of the samples from two practices and 57% of the samples submitted from one practice in Western Australia.
Salmonella was isolated from all states except for WA. It was not reported from 14 practices, contributed to less than 25% of the total samples in 12 practices and 33% of the total samples in one practice. Resistant Salmonella were reported from 10 practices in all states except WA. Most common resistances were to trimethoprim sulphur, oxytetracycline and neomycin. One practice reported a Salmonella that was resistant to all antibiotics tested.
Cryptosporidium was only reported in 11 practices across all states. It contributed to less than 25% of the diagnoses in nine of these practices, and between 26 and 50% in two practices.
Yersinia was also isolated from all states except WA. It was not reported from 17 practices and in the remaining 10 contributed to less than 25% samples submitted.
Coronavirus was not reported from practices in South Australia or Western Australia, and in total 19 practices did not report its isolation. However it should be noted that not all laboratories carry out coronavirus isolation. It was reported as contributing to less than 25% of all samples in 8 practices.
Three practices reported other diagnoses contributing to less than 25% of the samples. These included nematodes and mixed pathogens
Samples from which there was no growth/no diagnosis were reported from 16 practices. In seven practices these made up less than 25% of all samples, in three practices that made up between 26 and 50% of all samples, in four practices they made up between 51 and 75% of all samples and in one practice 76% of all samples.

Calf Scours in Southern Australian Beef Enterprises
35
7.2.3. Vaccination Fifty-three percent of practices had between 1 and 5% of their clients that used E. coli vaccination, and one practice had 10% of their beef clients that used this vaccine. In comparison only 17% of practices had beef clients using Salmonella vaccine and again in these practices it was only used on between 1 and 5% of farms. There appeared to be no relationship between practices that had clients that vaccinated, and the isolation of either pathogens in faecal samples, or the perception of how significant a problem E. coli was to their clients.
7.2.4. The veterinarians approach to a calf scour outbreak Veterinarians were asked the following questions on their initial approach to a scour outbreak
If a beef farmer contacts you with a calf scour problem:
Does your practice have a standard protocol / checklist to work up a calf scour problem
What % of these inquiries would you visit the farm?
For those cases where you don’t visit the farm, what % of the time would the farmer bring faeces samples in?
What % of these inquiries would you dispense the farmer treatment without a visit?
What % of the time would a farmer refuse a visit when you insist on one before dispensing prescription animal remedies?
Five of the 26 practices (19%) that answered part a) had a standard protocol or checklist within their practice to work up a scour problem. One practice never visited a farm with a scour outbreak and the majority of practices (25) visited farms 20% of the time or less (Table 17). Only five practices visited the farm 50% of the time or more. There was a positive trend between the percentage of time that a farm was visited and the number of beef herds in the practice area (R2=0.36, P< 0.01).
Table 17: The percentage of scour outbreaks for which a practice would visit the farm Number ( & % ) of practices
0 1 (3%)
1-20% 25 (69%)
21-40% 1 (3%)
41-60% 4 (11%)
61-80% 0
81-100% 1 (3%)
Not Answered 4 (11%)
Four practices never asked the farmer to bring in faeces samples if they did not visit the farm, and 20 practices only asked for faecal samples less than 20% of the time. Six practices collected faecal samples at least 50% of the time.
The low level of visits was reflected in the fact that 23 practices dispensed treatment over-the-counter for 60% or more cases of calf scours. However many practices qualified this by stating that prescription drugs would only be dispensed to bona fide clients and/or they would only treat with electrolytes. Only one practice refused treatment without a visit, and three practices dispensed treatment for 20% of the time or less.
Most practices (26) found that farmers accepted that they should have a visit if the veterinarians insisted, however six practices noted that the majority of clients declined a visit.

Calf Scours in Southern Australian Beef Enterprises
36
7.2.5. Management changes Thirty-one veterinarians routinely recommended management changes when faced with an outbreak in scouring calves, however the management changes that were recommended varied and there were a few changes that veterinarians consistently found successful.
7.2.5.1. Management changes in cow calf operations Veterinarians were asked to rate the success they had found with common management changes that have been suggested in a calf scour outbreak. The management changes recommended in cow-calf operations and the success that veterinarians had found with them are shown in Table 18. The most common management change that veterinarians found to be very or moderately successful was to change the paddock that the affected herd is running in (Table 18). Other management changes that veterinarians found to be very or moderately successful were to vaccinate for E. coli before calving (13 practices), to provide additional shelter (11 practices), to fence off muddy areas +/- areas where calf “creches” are located (9 practices) and to alter the time of calving to a different season (9 practices).
The veterinarians were also asked for management changes that they recommended which were not included in the questionnaire. These changes and their success rate are shown in Table 19, however each change was only recommended by one veterinarian/veterinary practice.
Table 18: A breakdown of the success rate that veterinarians have found with a range of common management changes in cow calf operations Management changes recommended for cow calf operations
Very Successful
Moderately successful
Little Success
Don’t recommend or not answered
Provide additional shelter 4 7 7 18
Change paddock that affected herd is running in 7 19 4 6
Fence off muddy areas +/- areas where calf “creches” are located 3 6 3 24
Vaccinate cattle for E. coli before calving 4 9 5 18
Vaccinate cattle for Salmonella before calving 2 1 2 31
Alter timing of calving – different season 2 7 4 23
Manage 1st calvers separately 1 4 5 26
Check colostrum quality of heifers 0 2 1 33
Check colostrum quality of all age groups, either every cow or selected animals 0 1 1 34
Monitor serum protein or antibody levels in calves 0 2 2 32

Calf Scours in Southern Australian Beef Enterprises
37
Table 19: Other management changes suggested by veterinarians treating a scour problem in cow calf operations Avoid unnecessary yarding: Treat sick calves in paddock Very successful
Early recognition & treatment Moderately successful
Ensure adequate nutrition of breeders Moderately successful
Feed adequate quantities of electrolytes Very successful
Increase hygiene Moderately successful
Maintain colostrum bank Moderately successful
Medical pen for affected calves Moderately successful
Move healthy cattle & leave affected animals in paddock Very Successful
Reduce effective stocking rate Very Successful
Reduce feed intake Moderately successful
Remove from mother for 24 hrs Very Successful
Rotate calf paddocks annually Very successful
Rotational graze with sheep Very successful
Selenium supplements (From known deficient area) Moderately successful
Switch to poorer pasture Moderately successful
Treat intensively for concomitant pinkeye/eye problem and ensure fly control Moderately successful
7.2.5.2 Management changes in calf rearing operations Only 22 practices (60%) that responded recommended management changes in cow calf rearing operations- this reflected the number of practices that serviced these clients. Nineteen of these practices found that improving hygiene was very or moderately successful in controlling calf scours (Table 20). Other management changes that veterinarians commonly found very or moderately successful were to introduce incentives that ensured calves received adequate colostrum at birth, and to ensure the different calves from different sources were kept in separate groups.
Addition recommendations that practitioners had had success with included mixing the milk powder properly, to feed ad lib pellets from day one, and to mix yoghurt with the milk powder.

Calf Scours in Southern Australian Beef Enterprises
38
Table 20: A breakdown of the success rate that veterinarians have found with a range of common management changes in calf rearing operations Management changes recommended for calf rearing operations
Very Successful
Moderately successful
Little Success
Don’t recommend or not answered
Improve hygiene 8 11 2 1
Introduce incentives to ensure that calves get adequate colostrum at birth 5 12 1 4
Ensure that calves from different sources are kept in separate groups 1 13 3 4
Ensure calves are fed twice a day for first 2 weeks 2 11 0 9
Ensure calves have access to fresh water at all times 2 11 2 7
Decrease number of calves in the pen 4 9 5 4
Feed calves electrolytes for 1st 24 hours on the farm 2 9 0 11
Introduce an “all in all out” policy 2 7 2 11
Change the milk powder formulation so that calves are getting more total powder 2 4 1 15
Rear calves in individual pens for 1st 2 weeks 1 4 3 14
Change the milk powder formulation so that calves are getting less total powder 1 3 2 16
Change from powdered milk to whole milk 1 2 1 18
Change from whole milk to powdered milk 0 1 1 20
7.2.6. Treatment of scouring calves Ten practices (26%) only treated calves when they were depressed. Twenty-six practices isolated the calf or the calf and its mother. All veterinarians gave oral electrolytes with or without an additional energy supplement. Only one practice did not report using any antibiotic treatment at all. Thirty-two veterinarians treated with antibiotic scour tablets or liquid, although 18 veterinarians used these only when the calves were depressed. Twenty-four practices used injectable antibiotic treatment, which in the vast majority of cases was either oxytetracycline or trimethoprim sulphur. One practice sometimes treated with amoxil, and another used apramycin. Twenty of these practices treated only depressed calves with injectable antibiotics.
Twenty-six practices (66%) used IV fluids, although twenty-one of these practices only used them in 5% of cases or less. One practice used IV fluids for 20% of cases. Eleven practices that used IV fluids also used subcutaneous fluids, two of these practices also used intra-peritoneal fluids. Two practices also reported using blood transfusions in sick calves where there was evidence of compromised immunoglobulin transfer.
Other treatment supplements used by practitioners included colostrum supplements, kaolin, warmth especially rugs, anti-inflammatories, dextrose, red cordial and probiotics.

Calf Scours in Southern Australian Beef Enterprises
39
7.2.7. The assistance that veterinarians would like to help overcome calf scours Veterinarians were asked what assistance their practice would like to overcome scours on beef farms. A large majority wanted more information on effective preventative strategies (Table 21). Other popular requests were information packages for farmers and information on “best practice” investigation protocols.
Table 21: Types of assistance that veterinarians would like to overcome calf scours
Assistance required Number of veterinarians that would like this type of assistance
Information on effective preventative strategies 27
Information packages for farmers 19
Information on “best practice” investigation protocols 17
Regular updates from local laboratories on most common isolates and resistance patterns
16
Interactive website for farmers 16
Information on appropriate laboratory work-up 13
Newsletter “grabs” 11
Farmer workshops 8
Interactive website for veterinarians 7
Educational videos 5
Educate farmers on early intervention and clinical signs 2
Education re control of spread and uptake of pathology 1
Information on effective treatment strategies 1
More information on the epidemiology of calf scours 1
Scientific advise on calf rearing considering good welfare practices and decreased labour
1
Educate farmers on economic impact of calf scours 1
Educate farmers on the value of vaccination 1
Veterinarians were also asked where they saw the main areas of further research and /or product development needed to be to minimise the impact of scours in beef enterprises. The most common request was for more vaccines, especially rotavirus. The areas of product development, further extension and further research that veterinarians’ see as assisting in management of calf scours in beef calves are listed in Table 22.

Calf Scours in Southern Australian Beef Enterprises
40
Table 22: Areas of product development, further research and further extension that production animal veterinarians see as beneficial to assist management of scours in beef calves Product development Number of
requests
Vaccine development 7
Rotavirus vaccine 4
Multivalent Vaccines - Salmonella / E. coli / Rotavirus / Pestivirus 1
Oral Coccidiosis treatment. 1
Oral Colostrum products 1
Treatment for cryptosporidia 1
Further research
Causative factors for scours in open range beef cattle scours 1
Define the extent of the problem with some appropriately set up “on farm” surveys 1
Research to demonstrate to farmers that high milk production in cows is not responsible for scouring in calves
1
Non medical methods of prevention and control 1
Role of iron in white scours 1
Study of factors affecting the immune system of calves (and dams) 1
Value of whole blood transfusion 1
Further extension
Preventative management 2
Extension package - guidebook/ guidelines 1
Effective vaccination protocols 2
Better advice on powdered milk products especially re mixing and frequency of feeding a little & often
1
Farmers want a "one-shot cure-all"! Main emphasis is on educating farmers to treat correctly with available products (lots of fluids)
1
Increase farmers awareness of the service that vets can provide 1

Calf Scours in Southern Australian Beef Enterprises
41
8. REPORT FROM A SURVEY OF VETERINARY PATHOLOGY LABORATORIES Veterinary laboratories across southern Australian were telephoned to determine the approximate number of calf scour samples processed in the past year and their common protocols for processing these samples. A summary of the services offered by the laboratories is shown in Table 24.
8.1. New South Wales New South Wales agriculture has three regional veterinary laboratories; the Elizabeth Macarthur Agricultural Institute at Menangle and 2 regional laboratories at Orange and at Wollongbar. Idexx also has laboratory in Sydney, but they indicated that they received very few cattle samples.
EMAI processes between 50 and 100 calf scour samples a year with a smaller number processed by Orange and Wollongbar. (The number of beef calf scour samples from 1997 to June 2003 is shown in Table 27.) Protocols are standardised between the three laboratories. The laboratories do not offer a calf scour package and veterinarians request the tests that they require. A latex test is used for rotavirus, and other viruses are detected by electron microscopy if requested. E. coli is not routinely typed.
8.2. South Australia Most samples would be sent to Idexx-VPS - this is the laboratory used by PIRSA and samples can be eligible for a free processing. In 2002 - 2003 financial year 43 calf scour packages were carried out, together with 172 cultures of bovine faeces of unknown age.
Calf scour package includes culture and sensitivity, rotavirus ELISA and Cryptosporidium, plus coccidiosis and faecal egg counts for calves more than 4 weeks of age. They do not have a space on the submission form for breed or beef/dairy and consequently were not be able to provide information on beef scour pathogens.
8.3. Tasmania Samples are sent to the Department of Primary Industries Mount Pleasant laboratory in Launceston. They process an average of 37 samples per annum when including both faecal and post-mortem samples. Their calf scour package includes Salmonella, E. coli, Yersinia, rotavirus, cryptosporidium, coccidiosis and faecal egg count, but this varied depending on the age of the animal from which the samples is submitted. Most veterinarians prefer to select a calf scour package. E. coli is not routinely checked for fimbrial antigens or serotyped.
8.4. Victoria Samples are processed by the DPI Laboratory at Bendigo, Gribbles Laboratory in Melbourne and Gippsland Pathology in Traralgon. Some samples are sent to Department of Primary Industries laboratory at Bendigo because of their relationship with Intervet and because it is the E. coli reference laboratory for Australia.
Gippsland Pathology offers one calf scour package that includes Salmonella, Yersinia, rotavirus and cryptosporidia with the coronavirus at the veterinarians request. Coccidia and faecal egg count can also be requested. E. coli is not routinely typed, but K99 can be identified at the laboratory. They have not collated any data and their system would not be suitable to do this.
Gribbles Pathology offer 4 calf scour packages (Table 23) that 90 percent of veterinarians would select. Coronavirus is tested using an ELISA test and is part of their routine virology. Faecal float for strongyles and eimeria are not part of any of their panels but can be added as an option at the veterinarians request. Data is stored electronically and the submission forms are kept as optical images. They do collect data on breed but only “Bovine” is in an electronic format, and the original submission form would have to be consulted to obtain the breed.

Calf Scours in Southern Australian Beef Enterprises
42
Table 23: Calf scour packages offered by Gribbles pathology in Melbourne Panel name Tests included
Faecal 1 Rotavirus, Cryptosporidium and Coronavirus
Culture and serotype for E. coli K99
Faecal 2 Rotavirus, Cryptosporidium and Coronavirus
Culture for Salmonella and Yersinia
Faecal 3 Culture for Salmonella and Yersinia
Faecal 4 F1 and F2 combined
The Department of Primary Industries Laboratory at Bendigo receives a lot of scour samples due to its relationship with Intervet. They have recently introduced a calf scour package that includes Salmonella, E. coli, Yersinia, rotavirus, cryptosporidia and coccidia. They have also recently introduced an ELISA test kits for Coronavirus. E. coli isolates are routinely checked for fimbria and are serotyped when thought to be a significant growth
8.5. Western Australia Scours in beef calves is perceived as a large problem by practitioners in the south-west, one practitioner in Albany had 45 farmers turn up to an invite only seminar. Most samples are sent to the government laboratory and are processed free where there is high morbidity or mortality, but the laboratory will only carry out one free investigation per property. Murdoch University processes very few samples, mainly from calves seen by veterinarians from their ambulatory clinic. Vetpath (a private laboratory) does not receive calf scour samples.
The Department of Agriculture in WA has two animal health laboratories one in Albany and one in Perth. The Perth laboratory receives most of the data from across the state and often caried out histology on calf scour investigations. They do not have a calf scour package as such, but have standard protocol that is culture and sensitivity, rotavirus, cryptosporidium and electron microscopy. They are also trialing a calf scour dipstick test manufactured by Biox and imported from Belgium.
8.6. The cost of diagnosing calf scours: The prices charged by the different laboratories were collated to estimate the costs involved in a thorough diagnostic work up and the range of these are shown in Table 25. The cost of a basic scour package ranged from $110- $624. Whilst recognising that in some cases the animals may not be of the correct age group to require a complete set of testing (ie samples may not necessarily have a FEC carried out as well as K99) this figure gives an indication of the potential costs involved. It should also be recognised that at present all states except Victoria have some degree of subsidisation for production animal laboratory tests, especially where mortalities are occurring. Therefore the laboratory charges may not be that high depending on the criteria applied. The producer may also have to pay the veterinary investigation costs as well as costs for any post mortem that occurs. Therefore for most producers a complete diagnostic procedures including appropriate faecal samples and post mortems can be expected to be between $500 - $1000 where they are not eligible for subsidisation of laboratory costs.

Calf Scours in Southern Australian Beef Enterprises
43
Table 24: Summary of laboratory services State Laboratory No samples
per year Differentiate beef or breed
CSP offered
Check for Coronavirus
Check K99
E. coli Serotype
NSW RVLs 30-40 Breed No Not routine have EM
Not Routine
Not Routine, can do on-site
SA Idexx-VPS No Yes No No Not routine send samples to VPS on request
Tas DPI Mount Pleasant
37 Yes Yes No Currently trialling test
No
Vic Gippsland Pathology
3-400
80% Dairy
No Yes On request Y No
Vic Gribbles pathology
Yes on sub form but not electronically
Yes (4) Routinely using ELISA
Y
Vic DPI Bendigo No Yes Just started using ELISA
Y Often
WA AHL Albany < 20 Breed No EM Y
WA AHL Perth 50 Breed No EM and Biox Calf scour Sticks, but see very few
Y
Not routine, send some cases to Bendigo - interesting cultures or histopathology
Table 25: The range of costs involved in a laboratory work-up Laboratory test Mean Median Range Single culture and sensitivity including isolation of salmonella and yersinia
$51 $43 $30-$105
Single culture and sensitivity including testing for K99ð $47 $49 $35-$56
5 faecal egg counts $44 $35 $20-$78
5 calf scour packages¥ $393 $424 $110-$624
5 sections for histology $98 $88 $78-$137 ð: does not include one laboratory that does not test for K99 ¥ Includes culture and sensitivity for E. coli & salmonella, faecal egg count, rotavirus, cryptosporidia, coccidiosis (and coronavirus ELISA in 3 out of the 6 laboratories)

Calf Scours in Southern Australian Beef Enterprises
44
9. COLLATION AND ANALYSIS OF LABORATORY DATA 9.1. Methodology Historical calf scour data was collated from Intervet Australia, the Regional Veterinary Laboratories in New South Wales, the DPIWE Mount Pleasant laboratory in Tasmania, the DPI Veterinary Laboratory at Bendigo in Victoria and from the Agriculture WA Animal Health Laboratories. Submission forms were analysed to find samples from beef calves that were less than four months of age. The samples were from both cow calf enterprises and calf rearers and in most cases the enterprise type was not identifiable. Due to the few number of submissions that actually identified a breed or enterprise type, many submissions were assumed to be from the properties as the calves were male or mixed sex.
Where available information was collected on the location of the properties; the history of the problem; the age of calves affected; the type of samples submitted; the laboratory tests carried out and the subsequent diagnoses. This was then analysed to determine the range of morbidity and mortality reported, the common pathogens affecting each age group and the proportion of samples tested for major pathogens. For each laboratory the proportion of submissions that were tested for a “Major Pathogen Calf Scour Panel” (MPSCP) was noted. These were samples tested for rotavirus and cryptosporidia and coccidia as well as having a culture and sensitivity, and Salmonella enrichment carried out.
The tests used from each laboratory to diagnose the common pathogens are shown in Table 26. In general the tests were similar except for cryptosporidia and coronavirus. The variation in these tests will contribute to some of the variation in results between laboratories
Table 26: Variation in testing procedures between the participating laboratories Laboratory Salmonella Cryptosporidia Coccidiosis Coronavirus Rotavirus DPI Bendigo individual
culture MZN stain Faecal float Not tested in
period of study (now using ELISA)
Latex agglutination (now using ELISA)
AgricultureWA
individual culture
fluorescent antibody test
Faecal float EM – not routine Latex agglutination
Mt Pleasant individual culture
MZN stain Faecal float Not tested Latex agglutination
RVL NSW individual or pooled culture
flotation or MZN stain
Faecal float some coccidial flotation or intestinal scraping
EM – not routine Latex agglutination
In many submissions a major pathogen was only diagnosed from a low proportion of samples. Whilst recognising that many of the major pathogens, notably viruses, can be isolated from clinically normal calves, this pathogen was used as the diagnosis for the submission. If more than one pathogen was isolated then the submission or sample was categorised as “multiple pathogens”, without specifying which pathogens were involved in the case.
9.2. NSW Laboratory Samples Data was collected from NSW Regional Veterinary Laboratories for 1997-June 2003.Two hundred and fifty four samples from scouring beef calves were processed from 179 submissions in this period. One hundred and fifty-six samples included faeces or intestinal contents. The rest were fixed or fresh tissues only, together with blood samples for mineral analysis or Pestivirus antigen capture ELISA. The number of submissions received at each laboratory per year is shown in Table 27.
The age groups of the calves affected are shown in Table 28. The majority of the samples submitted to all 3 laboratories were from calves that were 7-16 weeks of age.

Calf Scours in Southern Australian Beef Enterprises
45
Table 27: The number of beef calf scour submissions for each NSW laboratory from 1997- June 2003 Year EMAI Menangle Orange Wollongbar Total
1997 31 11 11 53
1998 9 5 8 22
1999 15 6 13 34
2000 12 6 5 23
2001 6 2 4 12
2002 11 3 10 24
2003 3 6 2 11
Total 87 39 53 179
Table 28: The distribution of submissions by calf age group Age of calves (weeks)
Number of submissions
Percent of total submissions
< 1 week 17 9%
1-3 47 26%
4-6 41 23%
7-16 74 41%
Total 179
Morbidity data was provided for 120 submissions (Table 29) and mortality data for 149 submissions (Table 30). The highest morbidity was in the younger age groups of calves and although there was little difference in the mean mortality rate between the age groups there was a decrease in the median mortality rates. Mortality is seen as a major reason for submission of samples, with 114 submissions reporting this.
Table 29: The range of morbidities reported in affected calves and variation with age Age of calves (weeks)
Number of Submissions
Mean no. at risk
Median & range of no at risk
Mean morbidity
Median & range of morbidity
< 1 week 9 56 40 (4-200) 23% 13% (1-90%)
1-3 34 50 36 (7-300) 16% 10% (1-83%)
4-6 30 138 55 (10-700) 14% 7% (0.4-80%)
7-16 47 82 50 (1-300) 18% 6% (0.3-100%)
Table 30: The range of mortalities reported in affected calves and variation with age Age of calves (weeks)
Number of Submissions
Mean no. at risk
Median & range of no at risk
Mean mortality
Median & range of mortalities
< 1 week 13 63 50 (4-200) 7% 4% (0-50%)
1-3 40 59 38 (7-450) 9% 5% (0-80%)
4-6 35 125 60 (7-700) 4% 2% (0-20%)
7-16 61 117 50 (1-1700) 6% 2% (0-50%)

Calf Scours in Southern Australian Beef Enterprises
46
9.2.1. Diagnoses Initial examination of the data shows that there is a wide range of diagnoses in all age groups and no diagnosis was reached from between 34% (7-16 weeks) and 52% (1-3 weeks) of samples in each group. This data set illustrated the role of histology, confirming of two cases each of colibacillosis, enterotoxaemia and coccidiosis, and one case of Salmonella. However many of the histological diagnoses were still non-specific or pertaining to individual animals such as peritonitis, hepatopathy and abomasitis.
Further analysis of the samples submitted that contained faeces or intestinal contests showed that a MPCSP was only carried out on 37 of the 221 samples. When the proportion of submissions with faeces or intestinal contents that were tested for the major pathogens was analysed it was shown that a culture and sensitivity was carried out on 78% of submissions, Salmonella was tested for in 82% of submissions and Yersinia in 44%. A faecal egg count was carried out on 31% of submissions and coccidia tested for in 44% of submissions. Rotavirus latex agglutination was carried out on 41% of submissions and cryptosporidia tested for in 46% of submissions, and electron microscopy was only carried out on 9% of submissions. The proportion of submissions in each age group for rotavirus, cryptosporidia, coccidia and nematodes are shown in Table 32 to Table 35. It can be seen that a higher proportion of younger calves was tested for rotavirus, and a higher proportion of older calves was tested for coccidia and nematodes. However in all age groups a significant number of submissions was not tested.
Table 31: A summary of all diagnoses from submissions (and samples) for the different age groups. Age of calves Diagnosis < 1 week 1-3 weeks 4-6 weeks 7-16 weeks
Number of submissions (with number of samples in brackets)
Submission diagnosis as
% of total submissions
Coccidia 1 (3) 6 (8) 10 (15) 9%
Colibacillosis¥ 4 (5) 2 (2) 5 (9) 1 (1) 7%
Coronavirus 1 (1) 1%
Cryptosporidium 1 (1) 5 (5) 3 (3) 2 (3 ) 6%
E. coli K99 +ve 1 (1) 1 (1) 4%
Enterotoxaemia 2 (2) 1 (2) 5 (7) 1%
Miscellaneous 1 (1) 4 (4) 9 (9) 8%
Multiple pathogens 3 (4) 2%
Nematodes 2 (2) 6 (20) 4%
No Diagnosis 6 (7) 29 (32) 17 (21) 30 (40) 46%
Pestivirus 3 (5) 2%
Rotavirus 4 (12) 3 (4) 2 (2) 5%
Salmonella 1 (1) 2 (4) 3 (6) 3%
Selenium deficiency 1 (10) 1%
Yersiniosis 1 (1) 1%
Total 16 (19) 48 (61) 41 (55) 74 (119) ¥ one diagnosis on histology – all others were cultures of E. coli

Calf Scours in Southern Australian Beef Enterprises
47
Table 32: Rotavirus diagnoses and the proportion of submissions tested in each age group Age of calves (weeks) Positive Negative Not tested % tested
< 1 week 3 8 5 69%
1-3 3 24 19 59%
4-6 3 13 21 43%
7-16 2 8 47 18%
Total 11 53 92 41%
Table 33: Cryptosporidia diagnoses and the proportion of submissions tested in each age group Age of calves (weeks) Positive Negative Not tested % tested
< 1 week 2 6 8 50%
1-3 5 21 20 57%
4-6 3 19 15 59%
7-16 2 14 41 28%
Total 12 60 84 46%
Table 34: Coccidia diagnoses and the proportion of submissions tested in each age group Age of calves (weeks) Positive Negative Not tested % tested
< 1 week 4 12 25%
1-3 1 18 27 41%
4-6 7 14 16 57%
7-16 10 15 32 44%
Total 18 51 87 44%
Table 35: Nematode diagnoses and the proportion of submissions tested in each age group Age of calves (weeks) Positive Negative Not tested % tested
< 1 week 3 13 19%
1-3 2 8 36 22%
4-6 4 9 24 35%
7-16 8 15 34 40%
Total 14 35 107 31% 9.3. Tasmanian Laboratory Samples Data was collated from the DPIWE Mount Pleasant Laboratories at Kings Meadows from May 1997 until June 2003. In this period there were 31 submissions for scouring beef calves distributed through 13 postcode regions of Tasmania. The total number of samples submitted was 50. The majority of the samples were submitted from calves that were 1-3 weeks of age. The number of submissions per year is shown in Table 36 and the age groups of calves affected in Table 37. Very little epidemiological information was available on the final laboratory reports provided.

Calf Scours in Southern Australian Beef Enterprises
48
Table 36: The number of beef calf scour submissions at the Mount Pleasant Laboratories from May 1997- June 2003 Year Number of
Submissions
1997 5
1998 5
1999 4
2000 1
2001 5
2002 8
2003 3
Table 37: The distribution of submissions by age group of calves affected Age of calves (weeks)
Number of submissions
Percent of total submissions
< 1 week 2 6%
1-3 17 55%
4-6 4 13%
7-16 6 19%
Unknown § 2 § Assumed to be less than 4 months from history provided
9.3.1. Diagnoses It was not possible to see any major trends in the pathogens isolated due to the low number of submissions (Table 38). The majority of samples were submitted from calves aged 1-3 weeks of age, and in this group the most common pathogen isolated was cryptosporidia. A diagnosis was not reached in 45% of all submissions. Mount Pleasant Laboratory does not test for coronavirus since a survey they carried out in the mid-nineties revealed it was seldom isolated.
Table 38: A summary of all diagnoses from submissions (and samples) according to age groups affected. Age of calves
Diagnosis < 1 week 1-3 weeks 4-6 weeks 7-16 weeks
Unknown Submission
diagnosis as % of total submissions
Number of submissions (with number of samples in brackets)
Coccidia 1 (1) 3%
Cryptosporidia 4 (5) (1) 13%
Miscellaneous 1 (1) 2 (2) 10%
Multiple pathogens 2 (5) 1 (1) 1 (0) 13%
Nematodes 1 (1) 3%
No Diagnosis 1 (1) 7 (7) 3 (3) 2 (2) 1 (9) 45%
Rotavirus (1)
Salmonella 2 (5) 1 (5) 10%
Yersiniosis 1 (1) 3%
Total 2 (2) 17 (23) 4 (8) 6 (6) 2 (11)

Calf Scours in Southern Australian Beef Enterprises
49
9.3.2. Diagnostic protocols A MPCSP was only carried on 18 samples from 7 submissions. Overall 58% of submissions were tested for rotavirus, 68% for cryptosporidia and 42% for coccidia. A culture and sensitivity was carried out on 94% of submissions, isolation for Yersinia on 61% and a faecal egg count on 29% of submissions. However it is often not indicated to test for all pathogens on all samples and to minimise cost it is often appropriate to vary testing strategies depending on the age groups affected. This data that shows that there was a higher percentage of submissions from calves that were 1 to 3 weeks of age tested for cryptosporidia and rotavirus, and a higher percentage of submissions from calves that were 7-16 weeks of age tested for coccidia and nematodes (Table 4)
Table 39: Variation in the percentage of submissions tested for a pathogen with age of animals affected
Percent of submissions tested for pathogen Age of calves (weeks)
Number of submissions Cryptosporidia Rotavirus Coccidia Faecal Egg Count
< 1 week 2 0% 0% 0% 0%
1-3 17 88% 76% 35% 24%
4-6 4 50% 50% 50% 25%
7-16 6 33% 17% 67% 67% 9.4. Victorian Laboratory Samples 9.4.1. Intervet Database 1997-1999 One hundred and seventy-three scour samples were submitted to Intervet between 12/12/97 and 20/12/99. Of these only 36 submissions were positively identifiable as beef samples compared with 67 submissions were from dairy calves. The beef submissions contained 127 faecal samples. Fourteen submissions were processed in 1998, 21 in 1999 and one from Dec 1997. The samples were from all southern states except Tasmania (Table 40). Fifty three percent of submissions were from calves aged between 1 and 3 weeks of age (Table 41). This may reflect the fact that samples were sent to Intervet to determine if E. coli or Salmonella was present in order to make a vaccine.
Table 40: The number of beef calf scour submissions by State from Dec 1997 until December 1999 State Number of
Submissions
NSW 5
SA 7
VIC 23
WA 1
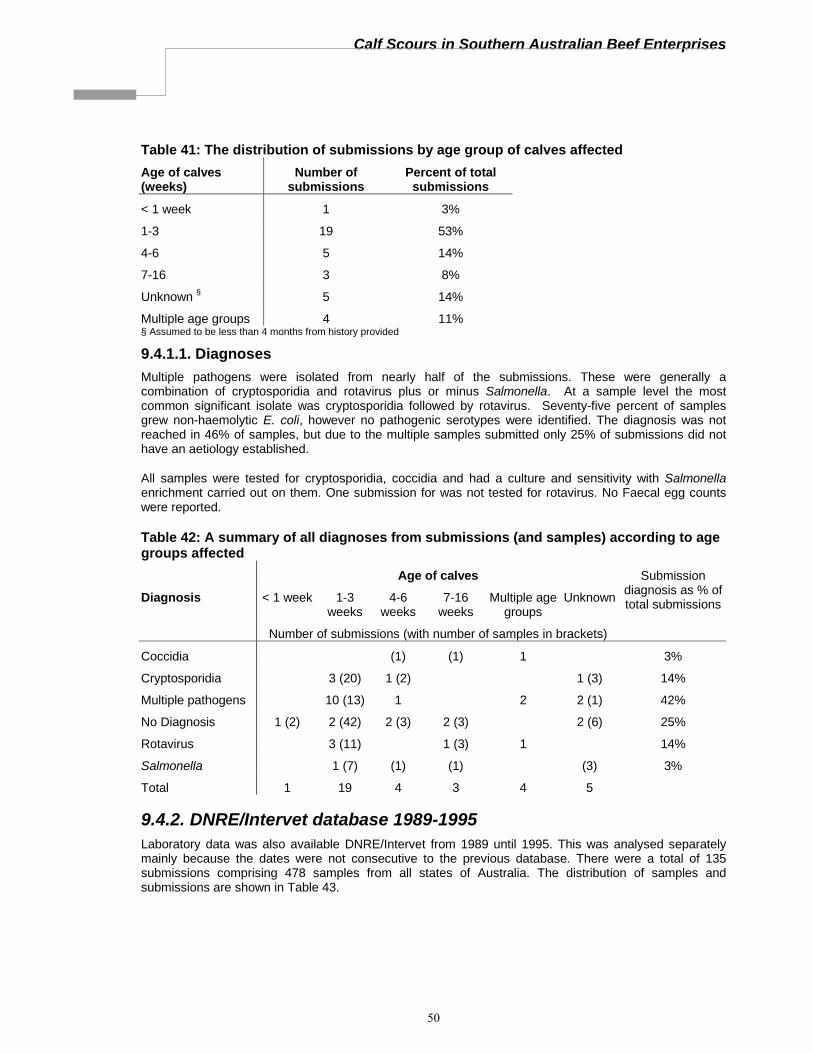
Calf Scours in Southern Australian Beef Enterprises
50
Table 41: The distribution of submissions by age group of calves affected Age of calves (weeks)
Number of submissions
Percent of total submissions
< 1 week 1 3%
1-3 19 53%
4-6 5 14%
7-16 3 8%
Unknown § 5 14%
Multiple age groups 4 11% § Assumed to be less than 4 months from history provided
9.4.1.1. Diagnoses Multiple pathogens were isolated from nearly half of the submissions. These were generally a combination of cryptosporidia and rotavirus plus or minus Salmonella. At a sample level the most common significant isolate was cryptosporidia followed by rotavirus. Seventy-five percent of samples grew non-haemolytic E. coli, however no pathogenic serotypes were identified. The diagnosis was not reached in 46% of samples, but due to the multiple samples submitted only 25% of submissions did not have an aetiology established.
All samples were tested for cryptosporidia, coccidia and had a culture and sensitivity with Salmonella enrichment carried out on them. One submission for was not tested for rotavirus. No Faecal egg counts were reported.
Table 42: A summary of all diagnoses from submissions (and samples) according to age groups affected Age of calves Diagnosis < 1 week 1-3
weeks 4-6
weeks 7-16
weeks Multiple age
groups Unknown
Submission diagnosis as % of total submissions
Number of submissions (with number of samples in brackets)
Coccidia (1) (1) 1 3%
Cryptosporidia 3 (20) 1 (2) 1 (3) 14%
Multiple pathogens 10 (13) 1 2 2 (1) 42%
No Diagnosis 1 (2) 2 (42) 2 (3) 2 (3) 2 (6) 25%
Rotavirus 3 (11) 1 (3) 1 14%
Salmonella 1 (7) (1) (1) (3) 3%
Total 1 19 4 3 4 5 9.4.2. DNRE/Intervet database 1989-1995 Laboratory data was also available DNRE/Intervet from 1989 until 1995. This was analysed separately mainly because the dates were not consecutive to the previous database. There were a total of 135 submissions comprising 478 samples from all states of Australia. The distribution of samples and submissions are shown in Table 43.

Calf Scours in Southern Australian Beef Enterprises
51
Table 43: Distribution of samples submitted to the Bendigo DNRE laboratory between 1989 and 1985 State Number of
Samples Number of
submissions Number of
postcode areas
NSW 198 51 33
QLD 42 13 11
SA 13 5 5
TAS 6 3 2
VIC 210 59 46
WA 9 4 3
Submissions from Queensland were removed from the data set before analysis of diagnosis. Analysis of 122 submissions showed that the most common pathogens were cryptosporidia, coccidia and rotavirus. However the most notable feature is the high proportion of submissions with no diagnosis. Further analysis demonstrated that there had been a notable decrease in the proportion of samples from which there was no diagnosis between 1989 and 1995 (Table 45). Although a culture and sensitivity had been carried out on 98% of submissions, and rotavirus, coccidia and cryptosporidia had been tested for on over 80% of submissions, many of the early submissions had not been tested for all pathogens. Also Salmonella enrichment was not recorded as included on 42 percent of submissions. The proportion of samples tested for all pathogens in each year is shown in Table 46 and it can be seen that this correlates to the proportion of positive diagnoses.
The proportion of submissions that were positive for coccidia was also higher than other data sets that had been analysed. Sixty percent of submissions from which coccidia were diagnosed came from New South Wales, compared with 28% from Victorian and 4% from each of South Australia, Tasmania and Western Australia. There was a significantly greater proportion of positive samples from New South Wales than Victoria (p=0.02). There was no difference in the proportion of diagnoses of the other pathogens between states.
Table 44: A summary of all diagnoses from submissions (and samples) for the different age groups Age of calves
Diagnosis < 1 week 1-3 weeks
4-6 weeks
7-16 weeks
Multiple age groups Unknown
Submission diagnosis as % of total submissions
Number of submissions (with number of samples in brackets)
Coccidia 1 (3) 5 (27) 2 (11) 6 11%
Cryptosporidia (3) 5 (28) (5) (2) 9 11%
Multiple Pathogens 5 (8) 3 (1) 11 16%
No diagnosis 5 (23) 34 (197) 11 (65) 2 (21) 10 2 (10) 52%
Rotavirus (2) 5 (18) (4) (3) 5 8%
Salmonella 1 (2) (1) 1%
Total 5 (28) 51 (256) 16 (102) 7 (39) 41 2 (10)

Calf Scours in Southern Australian Beef Enterprises
52
Table 45: Variation in diagnoses between 1989 and 1995 Year
Diagnosis 1989 1990 1991 1992 1993 1994 1995 Total Diagnoses
Number of submissions
Coccidia 6 4 3 1 14
Cryptosporidia 3 7 1 3 14
Multiple Pathogens 4 6 3 6 19
No diagnosis 7 11 5 11 20 3 7 64
Rotavirus 1 1 1 1 1 1 4 10
Salmonella 1 1
Total 8 12 6 25 38 11 22 122
No diagnosis as % of total submissions 88% 92% 83% 44% 53% 27% 32%
Table 46: Proportion of submission tested for all pathogens between 1989 and 1995 Tested for all pathogensYear No Yes
% tested for all pathogens
1989 25 2 7%
1990 43 1 2%
1991 22 0 0%
1992 59 31 34%
1993 80 60 43%
1994 3 37 93%
1995 0 72 100%
Total 232 203 47%
9.5. Western Australian Laboratory Samples Data from beef calf scour submissions was collected from Agriculture Western Australia Animal Health Laboratories in Albany, Busselton and Perth from 1994 to June 2003. A total of 83 submissions from 33 different postcodes were processed in this period (Table 47) with the majority of samples being submitted to the main Perth laboratory.
The age groups of the calves affected are shown in Table 48. The majority of the samples were submitted from calves that were 1-3 weeks of age. Epidemiological data was only available for submissions from 1994-2000. There was very little difference in the reported morbidity and mortality for any age group, although most age groups were only represented by a few submissions. The morbidity and mortality rates for all submissions and for the largest subgroup of calves aged 1 to 3 weeks of age are shown in Table 49 and Table 50.

Calf Scours in Southern Australian Beef Enterprises
53
Table 47: The number of beef calf scour submissions for each WA laboratory from 1994- June 2003 Laboratory
Year Albany Busselton Perth Total Samples
1994 2 5 7
1995 6 6
1996 3 3
1997 1 4 5
1998 1 6 7
1999 3 5 8
2000 8 8
2001 4 9 13
2002 2 14 16
2003 2 8 10
Total 13 2 68 83
Table 48: The distribution of submissions by calf age group Age of calves (weeks)
Number of submissions
Percent of total submissions
< 1 week 8 10%
1-3 35 42%
4-6 22 27%
7-16 17 20%
Unknown § 1 § Assumed to be less than 4 months from history provided
Table 49: The range of morbidities reported in affected calves Age of affected calves
Number of Submissions
Mean number at risk
Median & range of number at risk
Mean morbidity
Median & range of morbidity
All Submissions (0-4 months) 34 117 55 (10-800) 20% 12% (1-75%)
1-3 Weeks 19 123 75 (10-800) 14% 13% (1-75%)
Table 50: The range of mortalities reported in affected calves Age of calves (weeks)
Number of Submissions
Mean number at risk
Median & range of number at risk
Mean mortality
Median & range of mortalities
All Submissions (0-4 months)
38 109 50 (10-800) 7% 6% (0-27%)
1-3 Weeks 22 111 60 (10-800) 6% 6% (0-25%)

Calf Scours in Southern Australian Beef Enterprises
54
Table 51: A summary of all diagnoses according to age groups affected Age of calves
Diagnosis < 1 week 1-3 weeks 4-6 weeks 7-16 weeks Unknown
Submission diagnosis as % of total submissions
Number of submissions
Aspiration Pneumonia 1 1%
Attaching Effacing Enterotoxigenic E. coli
1 1%
Coccidia 1 1%
Colibacillosis 5# 3 10%
Cryptosporidia 2 5 1 1 11%
Miscellaneous 1 2 4%
Mucosal disease 2 2%
Multiple pathogens 1 5 7%
No Diagnosis 5 6 11 5 1 34%
Rotavirus 9 7 1 20%
Salmonellosis 1 1%
Selenium deficiency 1 1 3 6%
Viral enteritis 1 1% # 2 cases confirmed by histology – all other E. coli diagnoses either K99 –ve or not tested for fimbriae
9.5.1. Diagnostic protocols Seventy-six percent of samples had a culture and sensitivity carried out on them, and with further Salmonella isolation in 60% of submissions. Rotavirus and cryptosporidia in 63% and 54% of submissions respectively, and electron microscopy carried out on 33% of submissions. A faecal egg count was performed on 14 percent of submissions, and concentration flotation and identification of coccidia in 14% of submissions. The percentage of submissions tested for each pathogen, and variation with age group affected is shown in Table 52
Table 52: Variation in the percentage of submissions tested for a pathogen according to the age of animals affected
Percent of submissions tested for pathogen Age of calves (weeks)
Number of submissions Cryptosporidia Rotavirus Electron
Microscopy Coccidia Faecal Egg
Count
< 1 week 7 57% 86% 57% 14% 0%
1-3 36 64% 75% 31% 8% 11%
4-6 22 59% 68% 45% 14% 32%
7-16 17 29% 18% 6% 6% 6%

Calf Scours in Southern Australian Beef Enterprises
55
9.6. Beef and Dairy Comparison 127 known beef isolates were compared with 218 known dairy isolates from the 1998-99 Intervet database. There was no differentiation between cow-calf and “calf rearer” in the beef enterprises. The number of isolates from each group is shown in Table 53.
Table 53: Comparison of isolates between 127 beef calf faecal samples and 218 dairy calf faecal samples in the 1998-99 Intervet Database Beef Dairy Number Percent Number Percent
Rotavirus 24 19% 38 17%
Cryptosporidia 39 31% 58 27%
Salmonella 16 13% 40 18%
Coccidia 3 2% 20 9%
Non-haemolytic E. coli (Not EAEEC) 95 75% 126 58%
Haemolytic E. coli 0 0% 2 0.9%
Y. pseudotuberculosis 0 0% 3 1.4%
There was no significant difference in the proportion of rotavirus, cryptosporidia or Salmonella between the two enterprise types. There was a significant difference in the proportion of coccidia isolated (P <0.05). Consequently likely that data that does not differentiate the type of enterprise is likely to give an indication of the problems encountered in beef enterprises.
9.7. Report of all calf scours samples processed by D. N. R. E. Bendigo from 1998 until 2002 Due to the paucity of identifiable beef samples from any laboratory all calf scours samples (beef, dairy and unknown) processed at DNRE Bendigo from 14th January 1998 until 31st December 2002 were analysed to look for trends in the pathogens isolated. No age group was provided, however as the samples were submitted as “calf scours”, it was assumed that the majority were less than four months of age.
Nine hundred and eighty six samples were analysed from 391 submissions. Samples were tested for rotavirus, cryptosporidia, coccidia and a culture and sensitivity was carried out. Seven hundred and sixty one samples (77%) had the complete panel of tests carried out on them. The most common diagnosis in all years was cryptosporidia. These were diagnosed from 32% of samples and 39% of submissions across the five years.
Table 54: The distribution of pathogens at a sample and farm level Pathogen No of each
pathogen isolated‡No (&%) of samples
tested for this pathogen
No Submissions from which pathogen
isolated
No (&%) of submission from tested for each
pathogen
Rotavirus 131 822 (84%) 89 316 (81%)
Cryptosporidia 262 827 (84%) 152 318 (81%)
Coccidia 65 814 (83%) 40 316 (81%)
Salmonella 169 962 (98%) 87 385 (98%)
ETEC 47 962 (98%) 21 385 (98%) ‡ Multiple pathogens were isolated from some samples

Calf Scours in Southern Australian Beef Enterprises
56
Table 55: Variation in the proportions of major pathogens isolated between 1998 and 2002 Pathogen Year 1998 1999 2000 2001 2002
Total submissions 54 59 82 117 79
Rotavirus No. positive submissions 15 18 17 24 15
% positive submissions* 30% 33% 23% 25% 37%
% submissions tested 93% 92% 91% 82% 52%
Cryptosporidia No. positive submissions 21 25 42 47 17
% positive submissions* 42% 46% 55% 48% 43%
% submissions tested 93% 92% 93% 84% 51%
Coccidia No. positive submissions 4 6 8 12 10
% positive submissions* 8% 11% 11% 12% 27%
% submissions tested 93% 92% 93% 85% 47%
Salmonella No. positive submissions 5 13 25 34 10
% positive submissions* 9% 22% 30% 30% 13%
% submissions tested 100% 100% 100% 98% 95%
No. positive submissions 3 0 6 12 11 ETEC
(K99 & F41) % positive submissions* 6% 0% 7% 10% 15%
% submissions tested 100% 100% 100% 98% 95% * The denominator for % positive submissions is the number of samples tested for that pathogen
Multiple pathogens were diagnosed from 116 faecal samples from calves on 82 properties. A single pathogen was diagnosed in 173 submissions, 2 pathogens in 83 submissions and between three and five pathogens in 23 submissions. No diagnosis was reached from 428 samples and from 112 submissions.
There was very little variation from year to year in the percentage of farms from which the two most common pathogens, rotavirus and cryptosporidia, were isolated (Table 55). There was an increase in the percentage of farms from which coccidia were isolated in 2002, however this may reflect the age of the animals tested, and a trend away from testing neonates for pathogens in order to develop on farm vaccination. It should be noted that there was also an increase in the percentage of farms from which enteropathogenic E. coli were isolated.

Calf Scours in Southern Australian Beef Enterprises
57
10. DISCUSSION Efficient production of beef calves requires minimising losses from birth to the sale of the finished product. Any disease that causes losses greater than 2% is likely to have a significant economic impact on that enterprise. Calf diarrhoea has been identified as the most important disease of neonatal calves, resulting in greatest economic loss due to disease in that age group in both dairy and beef calves in United States4 and Canada5. Mortality rates due to calf scours in beef enterprises reported from Europe and Canada vary from 4-7%6, 7, 8, and similar levels have been demonstrated in this study. Calf scours is not an industry wide problem, and the severity of outbreaks varies from year to year. Moreover, many veterinarians report that often different farms within a district are seriously affected each year. However serious outbreaks can be devastating to the morale and profitability of enterprise and minimising the impact of calf scours should be a significant priority within the industry.
10.1. Impact of calf scours on cow calf enterprises 10.1.1. Morbidity and mortality Data from the questionnaires of veterinarians and farmers, together with the submission histories available from laboratories demonstrated that some farms have an extremely high morbidity and mortality due to calf scours. The majority of producers that responded to the detailed survey had calves affected with scours between six days and six weeks of age. This was also the age at which most producers lost calves to diarrhoea. However mortality rates in the producer survey were generally low, and less than 70% of affected properties had calves die from the disease. A small proportion of herds had mortality rates greater than 2% in calves from birth to 6 weeks, and in these cases the effect of calf scours on the enterprise was significant. The mortality rates reported in the Tallangatta study was higher as were those reported by veterinarians and the New South Wales Regional Veterinary Laboratories, with the greatest mortality from birth until three weeks. The mean mortality rate in outbreaks reported by veterinarians and from which samples were submitted in New South Wales was greater than 2% for all age groups less than 16 weeks of age. However this sample is likely to be biased, as veterinary investigations and diagnostic tests are more likely to be carried out in serious outbreaks.
Herds where a high mortality occurs are distressing to the owner and should be a significant concern to the industry warranting further investigation into the underlying causes.
10.1.2. Management impacts A calf diarrhoea outbreak can be an extremely time-consuming and frustrating event for beef farmers. Affecting calves are often in large paddocks making it challenging to treat them before they can be easily caught, by which point they are often severely affected. Moreover identification of individual calves is not often practised, making it difficult to ensure that calves receive a full course of treatment. The majority of respondents to the detailed survey check calves at least once a day when experiencing a calf scour outbreak, and 40% of respondents reported that it took between 40 and 60 minutes per day to treat each affected calf. Consequently a large outbreak can be an all consuming event, detracting from managing other aspects of the enterprise.
10.1.3. Economic impact The cost of calf scours is far more than the cost of treatment and the replacement cost of any calves lost. The loss of income from dams whose calves die, the culling cost of those cows, the time to treat affected calves, the loss of genetic potential, the reduction in capacity to improve and maintain the herd, the biosecurity cost of purchasing replacement calves and any reduction in growth rate all need to be considered. The mean cost of calf scours to producers that responded to the detailed survey was estimated at $73 per affected calf, or $19 per breeding cow. The ABARE 1998-9 to 2001-2 three-year average figures for farm cash income and herd size9 for specialist beef producers in NSW, SA, Tas and Vic were used to calculate the economic impact this figure would have on an average beef property for each stateω. This figure per adult cow across the southern states equates to between10 and 15% of average farm cash income. As this was not a random study it is likely that this figure does not represent
ω This figure was not calculated for WA as average number of breeding cows was much higher reflecting the influence of the northern beef industry in that state.

Calf Scours in Southern Australian Beef Enterprises
58
the average beef property, but many veterinarians reported that calf scours is a widespread problem in their district and the 1966 study of diseases affecting beef cattle in Victoria reported 80% of herds had calves affected with the scours1. Even if the actual effect on industry were half that calculated using the ABARE figures it would represent a significant economic impact to the industry.
10.2. Pathogens causing scours in beef calves in Southern Australia The most common pathogens diagnosed across all laboratories were cryptosporidia, rotavirus and coccidia. Coccidiosis was diagnosed more frequently from samples from New South Wales. The high prevalence of rotavirus and cryptosporidia concurs with results from a study of diarrhoea in dairy calves in Victoria in 198110, and these pathogens were also diagnosed in the Tallangatta studies. In many samples these pathogens were found together or in conjunction with salmonella, ETEC or coccidia. Multiple pathogens were isolated form 42% of the submissions in the Intervet database where all submissions were tested for major pathogens.
Both the current study of available laboratory data, and the Tallangatta studies fail to demonstrate ETEC as a significant pathogen in beef calves in Australia. Not all laboratories are testing for pathogenic fimbriae, and where they are only tests for K99 have been carried out, with the exception of the DPI laboratory at Bendigo. However analysis of the Intervet/DNRE data for 1998-99 showed that there were only 4 submissions from which ETEC was diagnosed and these were all in dairy calves. More recent Bendigo data demonstrates an increase in the proportion of ETEC isolated, but there are no records as to whether this is in beef or dairy calves.
Comparison of laboratory data between states indicates that there is a significant difference in the ages of calves affected between New South Wales and other states, and that there is also a different distribution of pathogens. Calves with diarrhoea in New South Wales are most commonly affected at 7-16 weeks and the most common diagnosis is coccidia. Cryptosporidia and rotavirus are still significant pathogens, but enterotoxaemia, nematode infestation and BVD/Pestivirus are also commonly diagnosed. There is more testing for these pathogens in the New South Wales laboratories than in some other states, however this would also reflect the age of calves affected.
Selenium deficiency was diagnosed in one submission from New South Wales and is causing a significant problem in WA, where a syndrome causing diarrhoea in calves on selenium deficient soil has been recognised. In these cases the calves themselves may not be clinically selenium deficient. Selenium deficiency was diagnosed as the cause of scours in 6% of submission from WA, with calves affected from 1-16 weeks. More research is required to determine the underlying pathophysiology of scours in selenium deficient areas and whether this condition is more widespread than it is current diagnoses indicate.
Yersiniosis was diagnosed in 2 cases of scours from calves aged 7-16 weeks in Tasmania and New South Wales, and there was only a single diagnosis of coronavirus also reported from New South Wales.
10.3. Diagnosis of calf scours Few veterinary practices have a standard investigation protocol or checklist for calf scours, and often cases are discussed over the counter without a visit to the farm. In general there appears to be a lack of recognition from both veterinarians and producers on the economic impact of calf scours on an enterprise, with the focus being on cost of individual calf compared with that of veterinary visit. Part of this reflects the lack of knowledge of good preventative strategies that could be recommended to producers to minimise an outbreak. Farm visits are more common in more intensive rural areas. There are a few practices that carry out a lot of farm visits and a lot of laboratory testing and seem to have a good understanding of the epidemiology and pathology of calf scours in their area.
The cost of testing diagnostic samples, the unreliability of a conclusive outcome and the difficulty in interpreting results mean that the pathogenesis of many calf scour outbreaks is not established. Even where tests are carried out this is generally only a “one off “ event. Knowledge of the pathogens involved has seldom changed the recommended treatments or preventative practices and consequently many producers and veterinarians have questioned the benefit of diagnostic procedures. To increase the benefit from diagnostic tests, strategies need to be put in place to ensure more reliable outcomes, and the benefit of differentiating pathogens in order to fine-tune treatment and control needs to be demonstrated.
The role of diagnostic procedures is fivefold: the first 3 are of benefit to the producer

Calf Scours in Southern Australian Beef Enterprises
59
1. To establish if the pathogen is bacterial and the appropriate treatment
2. To exclude the possibility that the pathogen is a bacteria that was not cultured, by confirming an infective organism against which generic preventative measures may be applied. Whilst at this stage there are no preventative vaccinations or therapies for cryptosporida and the enteric viruses, a positive diagnosis for one of these gives the producer and veterinarian a focus and an understanding of the problem
3. To rule out preventable diseases such as enterotoxaemia and nematode infections
The final 2 are of benefit to industry
4. Disease surveillance
5. Information on the prevalence of pathogens will ensure pharmaceutical companies have appropriate targets for the development of vaccines and therapeutic control.
However at present these objectives are not being achieved in many cases, and the situation has significantly deteriorated where full-cost recovery by laboratories has been introduced. Initial examination of available data indicates there is probably more benefit from complete testing of three to five samples, than partial testing of a greater number. Although the costs of a diagnostic workup has been estimated at between $500-$1000 for most states (without subsidisation of laboratory charges), this cost needs to be considered in the light of the potential cost of the disease outbreak to the enterprise. It is possible that pooling of samples may reduce some of these costs and appropriate testing strategies need to be developed and adopted by veterinarians and veterinary laboratories.
10.3.1. The role of E. coli Evaluation of laboratory diagnoses shows that many cultures of E. coli are being reported without further serotyping or testing for pathogenic fimbriae. In some cases infections have been diagnosed on or confirmed with histology, but the majority of cases are reported at significant or pure growths. As E. coli is a normal faecal pathogen the significance of any growth of E. coli without further evidence of pathogenicity is dubious.
E. coli produces two distinct types of diarrhoeal disease. The most commonly recognised is associated with enterotoxigenic E. coli (ETEC) that has two virulence factors involved in the production of diarrhoea. The first are fimbrial adhesins that allow them to attach to the villi of the small intestine - in calves these are most commonly K99 or F41 fimbrial antigens. Some strains possess both. 987P is another fimbrial adhesin that has been associated with disease in calves, although it is generally found in combination with K99 or F41. K88 fimbriae have not being associated with disease in calves. ETEC also have a thermostable nonantigenic enterotoxin (Sta) that influences intestinal ion and fluid secretion to produce a non-inflammatory secretory diarrhoea. ETEC generally produce disease in calves less than six days old, however the age of susceptibility may be extended when other pathogens are present. Calves initially have a swollen abdomen then pass profuse amounts of liquid faeces rapidly becoming depressed and recumbent. Hypovolaemic shock and death may occur in 12-24 hr.
The second type of diarrhoeal disease is produced by enteropathogenic attaching and effacing E. coli (EAEEC) in calves from four days two-months of age. Isolates shown in Table 56 have all been associated with attaching and effacing lesions in calves11,12,13, 14, 15. These cases often present dysentery with mucus and blood. These have been associated with a multifactorial disease complex in which other diarrhoea causing pathogens may be isolated. The clinical case may be short.

Calf Scours in Southern Australian Beef Enterprises
60
Table 56: E. coli serotypes possessing attaching and effacing sequences and associated with diarrhoea or dysentry in calves O5:H- or NM O26:NM or H11 or K60
O103:H2 O111:H- or NM
O113:H21 O114:H- or H40
O118:H16 O119:K69
O126:K71
The E. coli reference laboratory at DPI Bendigo has been routinely serotyping E coli isolates and testing for K99, K88, F41 and 987P. No other laboratories are routinely serotyping E. coli isolates, and the only fimbrial antigen that is tested for in some laboratories is K99. Moreover, DPI Bendigo have not been routinely testing for the serotypes associated with EAEEC. E. coli is considered a significant pathogen by many veterinary practitioners, especially in older age groups. However at present the significance of the isolation of E. coli from a faecal culture is generally unknown unless confirmed by histology, and in many cases this is not occurring. Consequently more investigation is required to elicit the role of E. coli in calf diarrhoea outbreaks in Australia.
10.3.2. Is coronavirus a significant pathogen in Australia? Reports from overseas indicate that coronavirus is a significant cause of diarrhoea in calves accounting for between 4 and 26% of isolates6, 20, 16, 17, 18, although it is also associated with healthy calves6, 19. In the analysis of laboratory data there was only a single isolate from beef calves across the 4 laboratories from which data was collected. This can be partially explained by the fact that only 2 laboratories were testing for it, and in these laboratories it was identified using electron microscopy, which is time consuming expensive and therefore not routinely carried out. Coronaviruses are fragile and can only be reliably diagnosed with electron microscopy when the number of virions is >106/g of faeces20. Whilst laboratory testing has shown that electron microscopy and ELISA yield similar results, it is possible that with field samples which may be taken several days before the sample is processed, coronaviruses are deteriorating in transit, making diagnosis difficult. Eight veterinarians had diagnosed coronavirus in beef calves across New South Wales, Victoria and Tasmania in the last 5 years and it is likely that the majority of these were using the one laboratory that has been testing for coronavirus using ELISA for some years.
It is possible that coronaviruses are not as prevalent in Australia as they are in other countries, and a study that was carried out in Tasmania in the 1990s failed to show coronavirus as significant pathogen in faecal samples from calves in that State. It is because of that study that coronavirus is no longer tested for at the Mount Pleasant laboratory. However coronaviruses ELISA kits are now available in Australia and some laboratories are including them as part of their routine calf diarrhoea diagnostic protocol. Whilst there is no vaccine or therapeutic control for this pathogen in Australia, positive identification of its involvement in a calf scour problem does allow for appropriate preventative strategies to be put in place. Consequently further monitoring need to be carried out using the ELISA test to specifically ascertain if it is a common pathogen in beef enterprises in Australia. This information would not only be useful in understanding the pathology of calf scour is in Australia, but should also be considered from a human health aspect, in the light of the recent SARS outbreak.
10.3.3. Interpretation of samples from which there is no diagnosis The number of submissions from which there was no diagnosis varied between 25% and 52% depending on laboratory. A major determinant of the percentage of successful diagnoses was the proportion that was tested for all major pathogens. Although a MPSCP may be expensive, the cost of this must be weighed against the frustration of not achieving a diagnosis.
Many enteric pathogens cause clinical symptoms before infective stages are shed in the faeces and this would account for a proportion of samples from which nothing is isolated. Similarly certain bacteria such as salmonella can be difficult to isolate, or the calf may have previously been treated with antibiotics. Like any other biological sample it is also possible that the pathogen may deteriorate in transit.
It is also possible that other enteric pathogens that have not been identified in Australia. One virus that has been identified as a significant cause of calf diarrhoea overseas is bovine torovirus (Breda virus)21, 22,

Calf Scours in Southern Australian Beef Enterprises
61
23. This has been isolated from up to 26% of calves with diarrhoea, with the majority of animals affected at less than 3 weeks of age23. This has not been observed using electron microscopy in New South Wales or Western Australia, but diagnoses from abroad have used ELISA and RT-PCR. Further studies are required to determine the significance of bovine torovirus in the pathogenesis of calf scours in Australia.
10.4. Using management to control calf scours Management of cows and calves around the time of calving has long been known to have a significant role in managing calf diarrhoea. Much of this research has been done overseas, and a significant proportion in housed cattle2, 24. There are no studies published in refereed journals that have established management strategies to minimise calf scours in Australia.
Consequently there was a huge range of recommendations from veterinarians to their clients in a calf scour outbreak. Producers also used an enormous range of management strategies for their cows and calves. Many of the strategies would have been determined by other factors such as the layout of their farm, and their nutritional management. The only factor that was shown to be associated with calf scours from the data provided in the detailed producer survey was time of calving. Herds that calved in spring had a higher proportion of calves affected with scours.
Vaccination has been advocated to control calf scours. Only a few respondents were using the available vaccines against E. coli and salmonella and in many cases this was without confirmation of the pathogen as an aetiological agent on their farm. Although vaccination is a beneficial tool when targeting the appropriate pathogens the data collected in this study did not allow assessment of the usefulness of vaccination.
It is likely that there are many more management factors that will influence the severity of calf scours on a property, however the data collected in the detailed producer survey was not precise enough to show any other statistically significant associations. A prospective study on farmers where exact details of how calves are affected, and exact measurements of parameters on the farm is more likely to show how management is influencing calf scour outbreaks.
Veterinarians have indicated that there is a significant need for increased understanding of the epidemiology and pathology of calf scours in southern Australia. This would result in them being better able to recommend appropriate preventative strategies, and also may promote the development and increased use of appropriate vaccination. It would also allow for an increased knowledge base for farmer extension.
10.4.1. Biosecurity Sixteen farmers purchased young calves to put on cows, and further nine purchased replacement breeding stock. There were several properties that purchased a large number of calves to run as extra calves on dairy cross dams. Although there was no statistically significant association between buying calves and percentage of animals affected with calf scours, there were some properties that purchased calves that had severe outbreaks. There were also several reported instances of outbreaks after purchasing replacement calves. Biosecurity is an issue that is often not adequately addressed within the beef industry, and certainly several veterinarians commented that they had seen more outbreaks in the past year with animals being moved around in the drought. Purchasing of replacement stock can lead to exposure of cattle already on a property to new pathogens, and this, as well as purchasing calves need to be considered in any control strategy.
10.5. Management of sick calves Management of sick calves is another area in which there is conflicting procedures and advice. One of the first hurdles on a beef property is catching and managing affected calves. There is no simple solution as either catching calves within a paddock or bringing affected calves and their dams in to treat them are time consuming. Separating the calf from the dam may be another option, but also has problems with the calf being accepted by the mother after treatment, and the increased risk of decreased milk production from the mother. Consequently on many farms effective treatment is probably not carried out well. Sick calves are often not recognised quickly enough to ensure good outcomes from treatment, they may not be individually identified and consequently may not receive a full course of treatment.

Calf Scours in Southern Australian Beef Enterprises
62
Although electrolytes are used extensively on most properties that reported a calf scour problem, often than inadequate amount is given. Electrolytes containing bicarbonate are also given on some properties when the calf is on the dam. If they calf suckles within two hours of the electrolyte feed it is possible that the milk may not form an clot in the abomasum, resulting in undigested milk passing into small intestine and exacerbating the problem.
The majority of farmers have consulted their veterinarians and are using an appropriate range of treatments. Many farms are using electrolytes in conjunction with an oral scour antibiotic, although 10% of farms are using oral scour antibiotics by themselves. Oral scour antibiotics are recognised as an “effective” method of controlling calf scours by producers, even though the survey has shown that the majority of outbreaks are not due to a bacterial course. Over half the producers are using injectable antibiotics on some calves, although the antibiotic used is not always appropriate for enteric disease. On many properties there is significant under-dosing of calves with antibiotic therapies, mainly because animals are not receiving a full course of treatment.
The most significant observation on how sick calves are treated is the large variation from property to property even when similar disease presentations are described. A goal for the Australian industry must be to determine cost-effective and practical methods of treating scouring calves.
10.6. Areas for further research and clarification This report has shown that there are significant areas that need to be addressed by further research into the epidemiology and control of scours within Australia. The survey also revealed some specific topics that need to be clarified.
The exact impact of calf scours on the subsequent growth rate of calves needs to be determined. A survey of 70 calves in the second Tallangatta study showed no difference in weaning weights, but information is needed across a broader base.
The relationship between cow production and calf scours required clarification. Should farmers restrict feed, calve at a time of year when there is a feed shortage or select breeds that do not have abundant milk, to ensure that calves do not initially receive an unlimited amount of milk, or does this strategy limit calves growth not calf scours?
One third of the respondents to the detailed producer survey bred Angus cattle. Whilst recognising that there has been significant increase in the prevalence of this breed in Australia in the last 10 years, this seems to be a disproportionate number. In a case control study in Switzerland 67% of the calves were Angus or Angus crossbreds25. Whilst there are many other factors that will influence the prevalence of severity of calf diarrhoea, any increased predisposition of Angus cattle needs to be established due to the rapid increase of popularity of this breed.

Calf Scours in Southern Australian Beef Enterprises
63
11. CONCLUSIONS This study has demonstrated that calf scours is the most significant and time-consuming disease problem on many beef properties. Calves are most severely affected between one and six weeks of age. The disease is multifactorial and in many cases several pathogens are found concurrently. The most common pathogens are cryptosporidia and rotavirus, however, coccidiosis has a significant role especially in New South Wales. Diagnosis is frustrating, because it is relatively expensive and results are not guaranteed. Moreover cost constraints and diagnostic protocols are resulting in incomplete testing of specimens and consequently a higher rate of no diagnosis.
A higher prevalence of calf scours is associated with herds that calve in spring, but no other significant association between management and herd prevalence was shown by this study. Producers are employing a large and contradictory range of management practices to control and treat calf scours, indicating that there is little clear and consistent advice available. The establishment of key management strategies at a herd level is essential to minimise calf scours in Australia.
11.1. Success in achieving objectives The multi-faceted design of the project has resulted in a good overview of the issues relating to calf scours in cow calf enterprises in Australia. Although issues pertaining to calf rearers have been not documented as thoroughly, the initial questionnaire received few responses from producers involved in this aspect of the industry. It is likely that these producers are based in dairy areas where there is better veterinary servicing and extension. It is also probable that there is better understanding of the management issues involved in the control of calf scours in housed calves. The analysis of data from different veterinary laboratories has given a good picture of the common pathogens that are being diagnosed, the variation from state to state and also the issues involved in achieving a satisfactory diagnosis.
The producer questionnaires have allowed a thorough assessment of the impact of calf scours on cow calf enterprises. Unfortunately it was not possible to statistically show how variation in management between farms affected the prevalence of calf scours. In order to achieve this, better definition of different management strategies than is allowed by a telephone survey is required, together with exact records of stock affected and stock losses together with their date of birth. Many beef producers do not to document this information to the detail required.
11.2. Impact on Meat and Livestock industry - now and in five years time
Scours in beef calves has been an ongoing issue for the producers for many years. Little research has been carried out in Australia and where it has been no satisfactory strategies to minimise the impact have been demonstrated. In order for this project to have impact on the meat and livestock industry, a whole of industry approach is required to implement the recommendations. The goal for the industry in five years time is to have a clear and consistent approach to calf scours documented and adopted by producers, advisers, veterinarians and veterinary pathology laboratories. It is unlikely that in the foreseeable future, effective control methods will be available to minimise the impact of calf scours on all properties, but successful strategies need to be put in place to minimise the frustration associated with this problem, enable good therapeutic outcomes and provides preventative strategies to minimise ongoing problems on affected properties.

Calf Scours in Southern Australian Beef Enterprises
64
BIBLIOGRAPHY
1 Dickson J. (1966) A survey of beef cattle diseases in Victoria. Masters Thesis .University of Melbourne, School of Veterinary Science
2 Radostits OM and Acres SD. (1980) The prevention and control of epidemics of acute undifferentiated diarrhoea in beef calves in western Canada. Can Vet J. 21: 243-249
3 Abramson JH and Gahlinger PM (2001) "Computer Programs for Epidemiologists" Sagebrush Press, USA
4 Donovan GA. (1987) Evaluation of dairy heifer replacement -rearing programs. Comp Cont Ed Pract Vet 9: F133-139
5 Radostits OM. (1991) The role of management and the use of vaccines in the control of acute undifferentiated diarrhoea in newborn calves. Can Vet J. 32: 155-159
6 Bendali F, Bichet H, Schelcher F and Sanaa M. (1999) Pattern of diarrhoea in newborn beef calves in south-west France. Vet Res 30: 61-74
7 Busato A, Steiner L, Martin SW et al. (1997) Calf health in cow-calf herds in Switzerland. Prev Vet Med 30: 9-22
8 Schumann FJ, Townsend HG and Naylor JM. (1990) Risk factors for mortality from diarrhoea in beef calves in Alberta. Can J Vet Res 54: 366-372
9 Gleeson T, McDonald D, Hooper S and Martin P. (2003) Australian Beef Industry 2003, Report on the Australian Agricultural and Grazing Industries Survey of Beef Producers, ABARE Research Report 03.3, Canberra.
10 Jerret IV. (1982) Studies on neonatal calf diarrhoea. Aust Adv Vet Sci 163-165
11 Vorster JH, Henton MM, Bastianello SS, Lugt JJ van der. (1994) Attaching and effacing Escherichia coli strains as a cause of diarrhoea and mortality in calves in South Africa. J South African Vet Assoc. 65: 3
12 Fukui, H. Sueyoshi, M. Naitoh, et al. (1996) Bacteriology and pathology of natural infection in calves with attaching and effacing Escherichia coli. J. Japan Vet Med Assoc. 49: 517-522
13 Janke BH, Francis DH, Collins JE et al. (1990) Attaching and effacing Escherichia coli infection as a cause of diarrhea in young calves. JAVMA 196: 897-901
14 Sandhu KS, Gyles CL. (2002) Pathogenic Shiga toxin-producing Escherichia coli in the intestine of calves. Can J Vet Res 66: 65-72
15 Saridakis HO. el Gared SA. Vidotto MC. Guth BE. (1997) Virulence properties of Escherichia coli strains belonging to enteropathogenic (EPEC) serogroups isolated from calves with diarrhea. Vet Micro 54: 145-53
16 Reynolds DJ, Morgan JH, Chanter N et al. (1986) Microbiology of calf diarrhoea in southern Britain. Vet Rec. 119: 34-39
17 Snodgrass DR, Terzolo HR, Sherwood D et al. (1986) Aetilogy of diarrhoea in young calves. Vet Rec 119: 31-34
18 Brenner J, Trainin Z, (1994) Prevalence of coronavirus infection in cattle in Israel. Israel J Vet Med. 49: 23-24
19 Rycke J de, Bernard S, Laporte J et al. (1986) Prevalence of various enteropathogens in the feces of diarrheic and healthy calves. Ann de Rech Vet. 17: 159-168
20 Dar AM, Kapil S, Goyal SM (1998) Comparison of immunohistochemistry, electron microscopy, and direct fluorescent antibody test for the detection of bovine coronavirus. J Vet Diagn Invest 10: 152-157
21 Koopmans M, van Wuijckhuise-Sjouke L, Schukken YH et al. (1991) Association of diarrhea in cattle with torovirus infections on farms. Am J Vet Res. 52:1769-73
22 Perez E, Kummeling A, Janssen MM et al. (1998) Infectious agents associated with diarrhoea of calves in the canton of Tilaran, Costa Rica. Prev Vet Med. 33: 195-205

Calf Scours in Southern Australian Beef Enterprises
65
23 Hoet AE, Nielsen PR, Hasoksuz M et al. (2003) Detection of bovine torovirus and other enteric pathogens in feces from diarrhea cases in cattle. J Vet Diagn Invest. 15: 205-12
24 Bendali F, Sanaa M, Bichet H, and Schelcher F. (1999) Risk factors associated with diarrhoea in newborn calves. Vet Res 30: 509-522
25 Busato A, Lentze T, Hofer D et al. (1998) A case control study of potential enteric pathogens for calves raised in cow-calf herds. J Vet Med B. 45:519-528

Calf Scours in Southern Australian Beef Enterprises
66
APPENDIX 1: INITIAL PRODUCER QUESTIONNAIRE 1. How would you rate calf scours as a problem on your farm?
Major Minor Don’t see Used to be
2. Is your beef operation:
Cow / calf
Calf rearing (Bull beef / vealers)
Other _______________________________
3. How many calves do you rear each year? ___________
4. Which months do your cows calve in? __________________________________
5. How many hectares is your beef operation? ___________
6. What is the average make up of your beef herd?
Adult cows: ____________ Yearlings ____________
Bulls: ____________ Calves ____________
7. Have you consulted your veterinarian about calf scours?
Yes No
8. Do you vaccinate your cows for:
Salmonella E.coli 5 in 1 / 7 in 1
9. What percentage of your calves are affected by scours in the following age groups?
Affected Die
0-5 days _______% _____%
6-21 days _______% _____%
3-6 weeks _______% _____%
7-16 weeks _______% _____%
10. Which pathogens have been isolated from faecal samples taken from scouring calves?
E. coli Rotavirus Coronavirus Cryptosporidium Coccidiosis
Salmonella Yersina
Other (please specify) __________________

Calf Scours in Southern Australian Beef Enterprises
67
11. What treatments work on your farm?
Oral fluids Yes / No / Don’t use
Scour tablets/liquid Yes / No / Don’t use
IV Fluids Yes / No / Don’t use
Injectable antibiotics Yes / No / Don’t use
Other ________________________________
12. Can we contact you for more details? Y / N
Name: _________________________________
Address: ________________________________
State: ___________ Postcode _________
Phone: ______________ Fax: _____________
E-mail: _________________________________

Calf Scours in Southern Australian Beef Enterprises
68
APPENDIX 2: MLA DETAILED CALF SCOUR SURVEY Cow calf enterprises Name ID
Enterprise overview 1. How many breeding cows did you calve in the
last year?
2. a) How many calves did you rear in the last year?
2 b) How many calves did you buy in to rear on cows? _ _
3. In the past 3 years has your number of breeders Increased by more than 20% ___ Decreased by more than 20% ___ Stayed about the same ___
4. In the past 3 years has your stocking rate
Increased ___
Decreased ___
Stayed about the same ___
5. What is the market for your cattle?
Vealers ___
Stores ___
Feedlot ___
Replacement heifers ___
Other ___ 6. What breed of cattle you have?
__________________________
7. Dou you routinely purchase
Calves/ unjoined heifers ___
Mated Heifers ___
Adult cows ___
8. Do you pregnancy test? Y / N
9. How many cows calved in the last calving period? ___
10. How many cows and heifers did you join to calve in this calving period? ___
11. a) How many calves did you wean from this calving period? ___
or
b) If they haven’t weaned the calves yet - how many did they brand? ___
or
c) If not branded yet how many did they wean from the last mob? ___
How many did they calve down in this mob ___
Risk Factors Calving management 12. Which month do the majority of your cows calve
in
Jan Feb Mar Apr
May Jun Jul Aug
Sep Oct Nov Dec
13. What percentage of calvings do you have to assist?
< 5% 5-10% 10-20% >20%
14. What % of calves are born dead or die within 48 hours of calving?
< 2% 2-5% 5-10% >10%
15. Do you routinely drench your cows for worms around the time of calving? Y / N
Colostrum 16. Do you supplement any of your calves with colostrum or colostrum substitutes (Biocol). Y / N 17. Do you routinely monitor colostrum intake by:
a) Testing the colostrum with a colostrometer
Y / N
b) Blood sampling calves when they are a few days old to check for antibody levels
Y / N
First calf heifers 18. How many first calf heifers do you calve each
year?
19. Is there any difference in % of calves that scour between 1st calf heifers and older cows?
No Difference ___
Calves from heifers scour more ___
Calves from older cows scour more ___
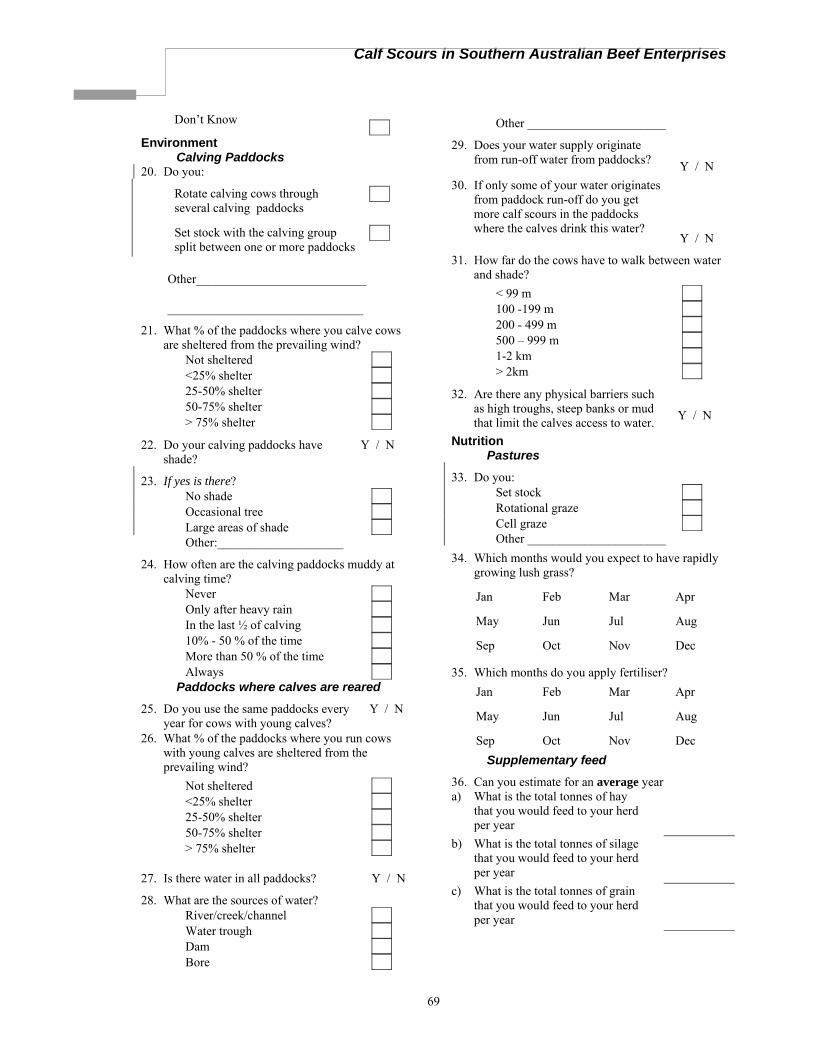
Calf Scours in Southern Australian Beef Enterprises
69
Don’t Know ___
Environment Calving Paddocks
20. Do you:
Rotate calving cows through several calving paddocks
___
Set stock with the calving group split between one or more paddocks
___
Other___________________________
_______________________________
21. What % of the paddocks where you calve cows are sheltered from the prevailing wind?
Not sheltered ___ <25% shelter ___ 25-50% shelter ___ 50-75% shelter ___ > 75% shelter ___
22. Do your calving paddocks have shade?
Y / N
23. If yes is there? No shade ___ Occasional tree ___ Large areas of shade ___ Other:____________________
24. How often are the calving paddocks muddy at calving time?
Never ___ Only after heavy rain ___ In the last ½ of calving ___ 10% - 50 % of the time ___ More than 50 % of the time ___ Always ___
Paddocks where calves are reared 25. Do you use the same paddocks every
year for cows with young calves? Y / N
26. What % of the paddocks where you run cows with young calves are sheltered from the prevailing wind?
Not sheltered ___ <25% shelter ___ 25-50% shelter ___ 50-75% shelter ___ > 75% shelter ___
27. Is there water in all paddocks? Y / N
28. What are the sources of water? River/creek/channel ___ Water trough ___ Dam ___ Bore ___
Other ______________________
29. Does your water supply originate from run-off water from paddocks?
30. If only some of your water originates from paddock run-off do you get more calf scours in the paddocks where the calves drink this water?
Y / N Y / N
31. How far do the cows have to walk between water and shade?
< 99 m ___ 100 -199 m ___ 200 - 499 m ___ 500 – 999 m ___ 1-2 km ___ > 2km ___
32. Are there any physical barriers such as high troughs, steep banks or mud that limit the calves access to water.
Y / N
Nutrition Pastures
33. Do you: Set stock ___ Rotational graze ___ Cell graze ___ Other ______________________
34. Which months would you expect to have rapidly growing lush grass?
Jan Feb Mar Apr
May Jun Jul Aug
Sep Oct Nov Dec
35. Which months do you apply fertiliser? Jan Feb Mar Apr
May Jun Jul Aug
Sep Oct Nov Dec Supplementary feed
36. Can you estimate for an average year a) What is the total tonnes of hay
that you would feed to your herd per year
b) What is the total tonnes of silage that you would feed to your herd per year
c) What is the total tonnes of grain that you would feed to your herd per year

Calf Scours in Southern Australian Beef Enterprises
70
37. Do you routinely condition score your cows
Y / N
38. Do more calves scours in years when cows calve in light condition
Y / N
Not sure Minerals
39. In the last 10 years have blood tests for mineral deficiency in cows shown
Copper deficiency ___ Cobalt deficiency ___ Selenium deficiency ___
Other_______________________
Not tested ___
40. Do you supplement breeders with: Copper ___ Cobalt ___ Selenium ___ Magnesium ___
Other diseases 41. What percentage of your cows get grass tetany
0 < 5% 5-10% 10-20% >20%
42. What percentage of your cows get milk fever
0 < 5% 5-10% 10-20% >20%
43. What percentage of your calves less than 4 months get pneumonia
0 < 5% 5-10%
10-20% 20-50% >50%
44. What percentage of your calves get infected navels
0 < 5% 5-10%
10-20% 20-50% >50%
45. What percentage of your calves get “joint ill” (lameness from infected joints)
0 < 5% 5-10%
10-20% 20-50% >50%
46. Have you ever had pestivirus diagnosed on your farm?
Y / N
47. Do you have any other major metabolic or disease problem affecting cows or calves on your farm? Please detail
___________________________________
___________________________________

Calf Scours in Southern Australian Beef Enterprises
71
Calf management 48. At what age do you first drench your calves for
worms? < 4 weeks ___ 4-8 weeks ___ 8-12 weeks ___ 12-16 weeks ___ > 16 weeks ___ Never ___
49. At what age do you disbud/dehorn your calves Have polled cattle ___ < 4 weeks ___ 4-8 weeks ___ 8-16 weeks ___ 4-12 months ___ > 1 year ___ Leave horns on ___
50. When do you castrate calves? < 4 weeks ___ 4-16 weeks ___ > 4 months ___ Don’t castrate ___

Calf Scours in Southern Australian Beef Enterprises
72
The problem What is the problem? 1. How old are your calves when you first see signs?
0-5 days ___ 6-21 days ___ 3-6 weeks ___ 7-16 weeks ___ > 16 weeks ___
2. What was the total number of calves that were born in the past 12 months _ _
3. a) How many calves (in numbers) were affected by scours in the following age groups in the past 12 months?
b) How many calves (in numbers) died of scours in the following age groups in the past 12 months?
Affected Die
0-5 days _______ _____
6-21 days _______ _____
3-6 weeks _______ _____
7-16 weeks _______ _____
> 16 weeks _______ _____
4. Do the calves show the following symptoms? (Tick all that apply)
Soft faeces Y / N Lethargy Y / N Watery diarrhoea Y / N
Distended abdomen Y / N
Blood in the faeces Y / N
Kicking at belly Y / N
Straining Y / N Coughing Y / N Dehydration Y / N Death Y / N Panting Y / N
5. Do you notice more calf scours with any of the following situations (tick all that apply)
Wet weather ___ Cold weather ___ Windy weather ___ Introduction of calf pellets ___ Change in calf pellets ___ Spring/ autumn flush ___ Feed shortage for cows ___
6. Have faecal tests been carried out to determine the cause of the calf scours on your farm? Y / N
If answer to 6 is no go to Q 8
7. Was anything found on these tests? Y / N
If answer is yes go to Q 9a) If answer to 7 is no go to Q 9b
8. Has your veterinarian suggested faecal tests should be taken?
Y / N
Go to Q 9b

Calf Scours in Southern Australian Beef Enterprises
73
9. **
a) b) c) Ask the series of Q’s below if answer to a) or b) is yes
Disease a) Which of the following have been diagnosed from faeces samples on your farm?
b) Is there a suspicion that any of the following diseases may be present?
What age group of calves are affected?
How many calves have been affected by this in the past year
Have you had more calves affected in previous years? If yes please put the year and how many were affected
How many calves died from this in the past year?
Have you had more calves die in previous years? If yes please put the year and how many were affected
E. Coli Y / N Y / N
Salmonella Y / N Y / N
Yersinia Y / N Y / N
Cryptosporidium Y / N Y / N
Coccidiosis Y / N Y / N
Rotavirus Y / N Y / N
Coronavirus Y / N Y / N
Intestinal worms Y / N Y / N
Pestivirus Y / N Y / N

Calf Scours in Southern Australian Beef Enterprises
74
Prevention of calf scours 10. Do you vaccinate for Salmonella (Bovilis S)? Y / N If answer is no go to 13
11. How many years have you vaccinated for Salmonella (Bovilis S)? 1 year ___ 2-3 years ___ 4-5 years ___ > 5 years ___
12. What difference has vaccination with Salmonella vaccine made to the number of calves No
Difference Less More
Scouring in the first week of life
Dying in the first week of life
Scouring after the first week of life
Dying after the first week of life
13. Do you vaccinate for E coli (Bovac)? Y / N
If answer is no go to 16 if they who isolated E coli in Q 9. If they have not isolated E coli go to Q 17
14. How many years have you vaccinated for E. coli (Bovac)? 1 year ___ 2-3 years ___ 4-5 years ___ > 5 years ___
15. What difference has vaccination with Bovac made to the number of calves
No Difference Less More
Scouring in the first week of life
Dying in the first week of life
Scouring after the first week of life
Dying after the first week of life
16. *****If E. coli has been isolated from calves on your farm, but you are not vaccinating why not?
Not suggested by my veterinarian ___
Discussed the possibility with my veterinarian but didn’t think the problem was severe enough to warrant it ___
Too expensive ___
Will take too much time ___
Don’t have good enough facilities ___
Tried vaccinating but it made no difference ___
Tried vaccinating but the results weren’t good enough to warrant the time and expense ___
17. Did you previously vaccinate for Rotavirus? Y / N
If answer to 17 is no go to Q 19
18. Did the Rotavirus vaccine Reduce the number of scouring
calves Y / N
Reduce the number of dead calves Y / N Management of sick calves Please give answers for your average case: obviously there will be exceptions for extremely severe or very mild cases
19. How often do you look for sick calves?
Twice a day ___
Once a day ___
Every second day ___
Every 3-4 days ___
Every 5-7 days ___
Less than once a week ___
20. Do you have an isolation area for sick calves? Y / N
21. Do you remove the calves from their mothers to treat them Y / N
22. If yes, how long do you remove them for
12 hours or less ___
12-24 hours ___
25-48 hours ___
> 48 hours ___
Until they have stopped scouring ___

Calf Scours in Southern Australian Beef Enterprises
75
23. How long do you isolate the cow and the calf from other cows with calves?
Don’t isolate them ___ 24 hours or less ___ 1-3 days ___ 3-7 days ___ > 1 week ___ Until the calf has stopped scouring ___
24. How many litres of electrolytes do you feed each day to a scouring calf
Don’t feed electrolytes ___
2 litres or less ___
2.1 - 4 litres ___
4 .1 - 6 litres ___
> 6 litres ___ 25. If you feed electrolytes which brands do you use (Tick all that apply)? Hydrate Liquid ___ Lactolyte ___ Lectade ___ Scourlyte ___ Scourproof ___ Vytrate ___
Other ______________________________
26. Do you use any electrolytes with extra energy such as Albicalb or Diarrest? Y / N
27. a)*** Which Scour tablets/liquid do you use (fill in 1st column)? b) **** Which injectable antibiotics do you use? (Continue in first column)
c) for each drug in first column ask the dose they would use and the number of days they would treat for ( If they are not sure of the dose ask if it is as prescribed by your veterinarian if yes put “AP” in the dose box)
Drug Dose Number of days you treat for
28. Do you use other supplements such as probiotics or Biocol Y / N 29. Do you treat everything that scours? Y / N
30. If no which scouring calves do you treat (Pease tick all appropriate)
Calves that are dehydrated ___ Calves that look sick ___ Calves that have blood in their faeces ___ Calves with very watery scours ___
Other ______________________

Calf Scours in Southern Australian Beef Enterprises
76
Ask question below for each option unless have indicated they don’t use the treatment in the last section
If the answer is no put a 0 in this column, if yes ask questions below
31. Do you treat scouring calves with :
Percent of scouring calves treated in this way
Percent of treated calves that recover
Electrolytes only Scour tablet/liquid only Injectable antibiotic only Scour tablet/liquid plus electrolytes Scour tablet/liquid plus injectable antibiotics
Veterinary “intensive care “ - IV Fluids etc
No treatment Other: Interaction with your veterinarian 32. Who is your veterinarian?
Name: _______________________
Practice: _______________________
Address _______________________
_______________________________
Phone: _______________________
33. At what point would you contact your vet with a scour problem?
When you first see scours ___ When at least 5% of the group are affected ___ If the treatment that you usually use isn’t working ___ When calves start dying ___ When you have lost at least 2% of the group ___ Never ___
34. What is your vet likely to do? Visit the farm
___ Get you to bring calves in
___ Get you to bring faeces samples in
___ Prescribe you drugs over the counter ___
Other__________________________
_______________________________
35. Has you veterinarian carried out any post-mortems? Y / N Effect of calf scours on the profitability of your enterprise 36. What effect does the disease have on calf growth? (Please tick one box)
No effect ___
Can pick calves that scoured at weaning ___
Can pick calves that scoured 2 months after outbreak ___
Can pick calves that scoured 1 month after the outbreak ___
37. How much time is involved in treating each sick calf per day on average? Less than 10 minutes ___ 10-20 minutes ___ 20-40 minutes ___ 40-60 minutes ___
38. Have you estimated the cost of calf scours to your enterprise? Y / N
39. If yes what is the cost per sick calf? $______
40. If yes what is the cost to you per year? $______

Calf Scours in Southern Australian Beef Enterprises
77
41. Is there anything else relevant to your calf scour problem that we haven’t asked you about?
__________________________________
__________________________________
__________________________________
__________________________________
__________________________________
42. Where do you see the main areas of further research and /or product development need to be to minimise the impact of scours in beef enterprises?
__________________________________
__________________________________
__________________________________
__________________________________
__________________________________
Thank you for your time

Calf Scours in Southern Australian Beef Enterprises
78
APPENDIX 3: MLA CALF SCOURS PROJECT VETERINARY SURVEY Code no: X0NN
Practice background 1. How many beef farms in your area? _______
2. What % of these do you service? _______%
3. What are the main types of beef enterprises in your region? (please give approximate proportion)
Cow/calf _____% Bull beef _____% Steer rearing _____% Feedlot _____% Other _____%
Information on calf scours 4. In your practice what percentage of calf scour outbreaks between birth and 4 months of age are reported in:
• Cow/calf operations _______%
• Beef calf rearing operations _______%
• Other (name if > 20%) _______%
5. Please estimate what % of beef cow/calf operations serviced by your practice would vaccinate for
• Salmonella _______%
• E. coli _______%
6. Please indicate what percentage of outbreaks would be in each of the following age groups
0-5 days _______%
6-21 days _______%
3-6 weeks _______%
7-16 weeks _______%
7. Please give an indication of the typical problem that you treat in each age group:
Mean Group Size % Affected % Mortality
0-5 days _______ _______ _______
6-21 days _______ _______ _______
3-6 weeks _______ _______ _______
7-16 weeks _______ _______ _______
> 16 weeks _______ _______ _______

Calf Scours in Southern Australian Beef Enterprises
79
Laboratory testing 8. Which laboratory do you send faecal samples to? _____________________
9. Do you ask for a calf scour package (if available) ___ or specific tests? ___
10. If specific tests, which of the following would you routinely include– please indicate all appropriate:
• Faecal float ___
• Protozoan smear ___
• Bacterial culture & sensitivity ___
• Viral isolation ___
• E. coli typing ___
• Salmonella phage typing ___
11. From what proportion of beef calf scour problems would you send away faecal samples?
(Please put a cross on the line in the appropriate place)
0 25% 50% 75% 100%
12. If you send away samples how many are sent for the average outbreak? ________
13. Please indicate the approximate numbers of the following that you would have isolated in the last 5 years:
Isolate Number %
Salmonella
E. Coli
Yersinia
Rotavirus
Coronavirus
Cryptosporidia
Coccidiosis
Pestivirus
No growth
Other

Calf Scours in Southern Australian Beef Enterprises
80
Isolation of E. coli 14. Please indicate the age groups in which your laboratories isolating E. coli from faecal samples
0-5 days Y / N
6-10 days Y / N
11-21 days Y / N
> 3 weeks Y / N
15. In which age groups are you attributing isolation of E. coli to significant clinical disease.
0-5 days significant / not significant
6-10 days significant / not significant
11-21 days significant / not significant
> 3 weeks significant / not significant
16. Are you finding resistant strains of E. coli? Y / N
If you are finding resistant strains please detail the antibiotics to which E. coli is resistant
_________________________________________________________________________
Isolation of Salmonella 17. Are you finding resistant strains of Salmonella? Y / N
If you are finding resistant strains please detail the antibiotics to which Salmonella is resistant
_________________________________________________________________________
Recommendations to farmers Approach to an outbreak 18. If a beef farmer contacts you with a calf scour problem:
a) Does your practice have a standard protocol / checklist to work up a calf scour problem Y / N
b) What % of these inquiries would you visit the farm? _______%
c) For those cases where you don’t visit the farm, what % of the time would the farmer bring faeces samples in? _______%
d) What % of these inquiries would you dispense the farmer treatment without a visit? _______%
e) What % of the time would you insist on a visit before giving prescription drugs and have the farmer refuse this offer _______%
Control and Prevention 19. Do you recommend management changes to control an outbreak of calf scours? Y / N
20. What changes have you recommended? Please indicate how successful have they been
Management Change Very
Successful Moderately successful
Little Success
Don’t recommend

Calf Scours in Southern Australian Beef Enterprises
81
Cow calf operations
Provide additional shelter ___ ___ ___ ___
Change paddock that affected herd is running in ___ ___ ___ ___
Fence of muddy areas +/- areas where calf “creches” are located ___ ___
___ ___
Vaccinate cattle for E. coli before calving ___ ___ ___ ___
Vaccinate cattle for Salmonella before calving ___ ___ ___ ___
Alter timing of calving – different season ___ ___ ___ ___
Manage 1st calvers separately ___ ___ ___ ___
Check colostrum quality of heifers ___ ___ ___ ___
Check colostrum quality of all age groups, either every cow or selected animals ___ ___ ___ ___
Monitor serum protein or antibody levels in calves ___ ___ ___ ___
Others – please detail
___ ___ ___ ___
___ ___
___ ___
___ ___
___ ___
___ ___ ___ ___
Calf rearing operations
Introduce incentives to ensure that calves get adequate colostrum at birth ___ ___ ___ ___
Feed calves electrolytes for 1st 24 hours on the farm ___ ___ ___ ___
Ensure calves are fed twice a day for first 2 weeks ___ ___ ___ ___
Change the milk powder formulation so that calves are getting more total powder ___ ___ ___ ___
Change the milk powder formulation so that calves are getting less total powder ___ ___ ___ ___
Change from powdered milk to whole milk ___ ___ ___ ___
Change from whole milk to powdered milk ___ ___ ___ ___

Calf Scours in Southern Australian Beef Enterprises
82
Calf rearing operations continued Very
Successful Moderately successful
Little Success
Don’t recommend
Ensure calves have access to fresh water at all times ___ ___ ___ ___
Improve hygiene ___ ___ ___ ___
Decrease number of calves in the pen ___ ___ ___ ___
Rear calves in individual pens for 1st 2 weeks ___ ___ ___ ___
Introduce an “all in all out” policy ___ ___ ___ ___
Ensure that calves from different sources are kept in separate groups ___ ___ ___ ___
Others – please detail
___ ___ ___ ___
___ ___ ___ ___
___ ___ ___ ___
___ ___ ___ ___
Treatment General 21. If you only have a clinical history what of the following treatments are you likely to use (please tick as appropriate): Calf bright and
alert Calf depressed and dehydrated
• Isolation of calf? ___ ___
• Isolation of dam and calf ___ ___
• Oral electrolytes ___ ___
• Oral fluid therapy with additional energy supplement – eg Albicalb® ___ ___
• S/C fluids ___ ___
• Scour tablets/liquid? ___ ___
• Injectable antibiotics – which one? ________________________ ___ ___
22. What percentage of cases would receive IV fluid? _______%
23. Is there any other treatment that you might use? _________________________________________
___________________________________________________________________________________

Calf Scours in Southern Australian Beef Enterprises
83
Specific cases 24. What would be your specific recommendations for outbreaks of the following (Please tick as appropriate):
Salmonella E. Coli Yersinia Rotavirus Coronavirus Cryptosporidia Coccidiosis
Isolation of calf?
Isolation of dam and calf
Oral electrolytes
Oral fluid therapy with additional energy
S/C fluids
Scour tablets/liquid
Parenteral antibiotics
Oxytetracycline
Amoxil
Trimethoprim/Sulphur
Apramycin
Other: Please state what
IV fluid
Others: Please detail

Calf Scours in Southern Australian Beef Enterprises
84
Feedback on the project: 25. Do beef scours have a significant economic impact on producers in your area? Y / N
26. What assistance does your practice need to overcome scour problems on beef farms?
• Information packages for farmers ___
• Newsletter “grabs” ___
• Farmer workshops ___
• Information on “best practice” investigation protocols ___
• Information on appropriate laboratory work-up ___
• Information on effective preventative strategies ___
• Regular updates form local laboratories on most common isolates and resistance patterns ___
• Interactive website for farmers ___
• Interactive website for veterinarians ___
• Educational videos ___
• Other (Please detail) _______________________________________________________
• ________________________________________________________________________
27. Where do you see the main areas of further research and /or product development need to be to minimise the impact of scours in beef enterprises?
_____________________________________________________________________________________________
_____________________________________________________________________________________________
__________________________________________________________________________________________
Other comments
_____________________________________________________________________________________________
_____________________________________________________________________________________________
__________________________________________________________________________________________
Thank you very much for your help