Embed Size (px)
Citation preview

CALCULUS I
Chapter IIIAdditionnal Applications of the
Derivative
Mr. Saâd BELKOUCH

2
Increasing and Decreasing Functions; Relative Extrema
Concavity and Points of Inflection Curve Sketching
3
Increasing and Decreasing Functions; Relative Extrema
Intuitively, we regard a function f(x) as increasing where the graph of f is rising, and decreasing where the graph is falling.

4
Increasing and decreasing functions Let f(x) be a function defined on the interval a
< x < b, and let Xl and X2 be two numbers in the interval. Then:f(x) is increasing on the interval if f(X2) > f(XI) whenever X2 > Xl
f(x) is decreasing on the interval if f(X2) <f(XI) whenever X2 > Xl
5
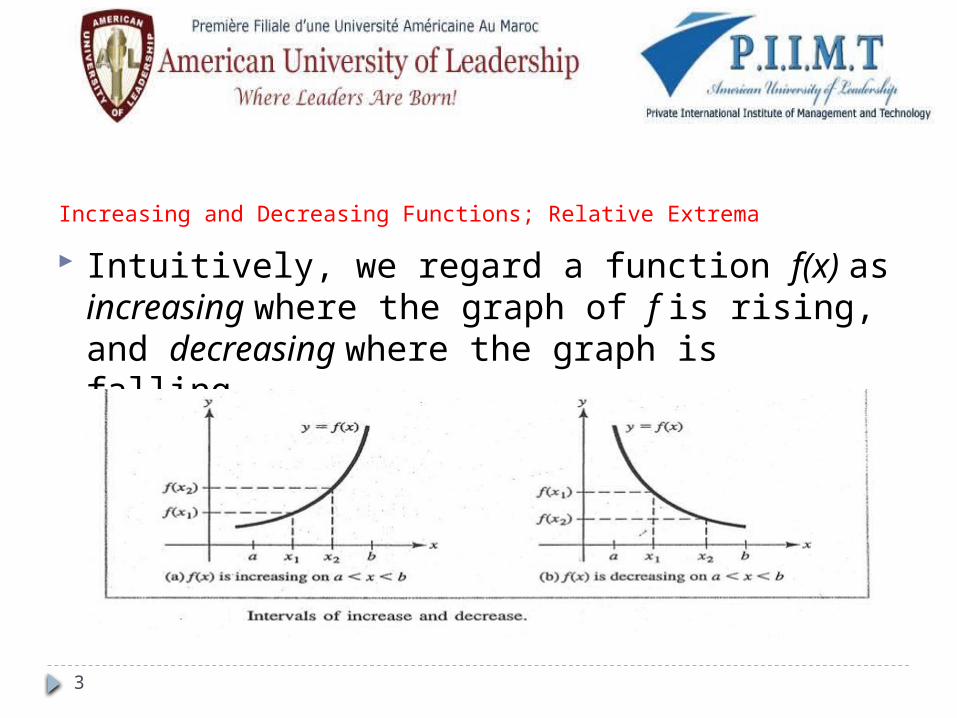
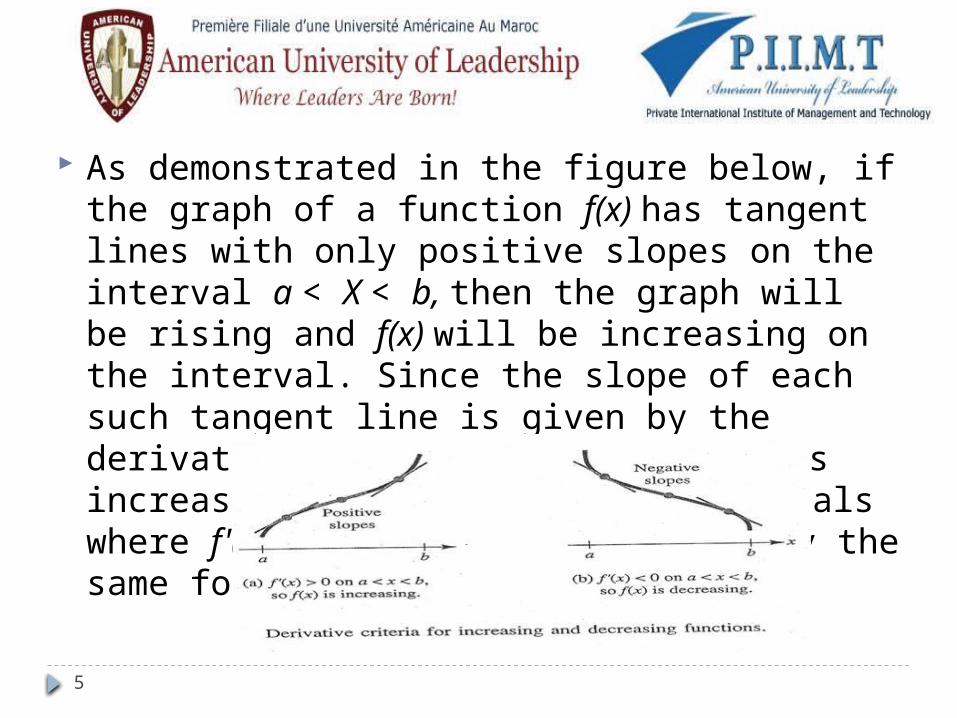
As demonstrated in the figure below, if the graph of a function f(x) has tangent lines with only positive slopes on the interval a < X < b, then the graph will be rising and f(x) will be increasing on the interval. Since the slope of each such tangent line is given by the derivative f' (x), it follows that f(x) is increasing (graph rising) on intervals where f'(x) > 0. Similarly, we can say the same for negative slopes.

6
Procedure for Using the Derivative to Determine Intervals of Increase and Decrease for a Function f
Step 1. Find all values of x for which f' (x) = 0 or f' (x) is not continuous, and mark these numbers on a number line. This divides the line into a number of open intervals.
Step 2. Choose a test number c from each interval a < x < b determined in step 1 and evaluate f'(c). Then, If f'(c) > 0, the function f(x) is increasing (graph rising) on a < x < b. If f’(c) < 0, the function f(x) is decreasing (graph falling) ona < x <b.

7
Ex: Intervals of increase and decrease for: f(x) = 2x3 + 3x2 - 12x - 7
f'(x) = 6x2 + 6x - 12 = 6(x + 2)(x - 1) which is continuous everywhere, with f'(x) = 0 where x = 1 and x = -2
The numbers -2 and 1 divide the x axis into three open intervals; namely, x < -2, -2 < x < 1, and x > 1. Choose a test number c from each of these intervals; say, c = -3 from x < -2, C = 0 from -2 < x < 1, and C = 2 from x> 1. Then evaluate f'(c) for each test number:
f'(-3) = 24> 0 f'(0) = -12 < 0 f'(2) = 24 > 0
We conclude that f' (x) > 0 for x < - 2 and for x > 1, so f(x) is increasing (graph ris ing) on these intervals. Similarly, f'(x) < 0 on -2 < x < 1, so f(x) is decreasing (graph falling) on this interval.

8
NOTATION We shall indicate an interval where f(x) is increasing by an "up arrow" and an interval where f(x) is decreasing by a "down arrow“. Thus, the results in the last example can be represented by this arrow, diagram:
9
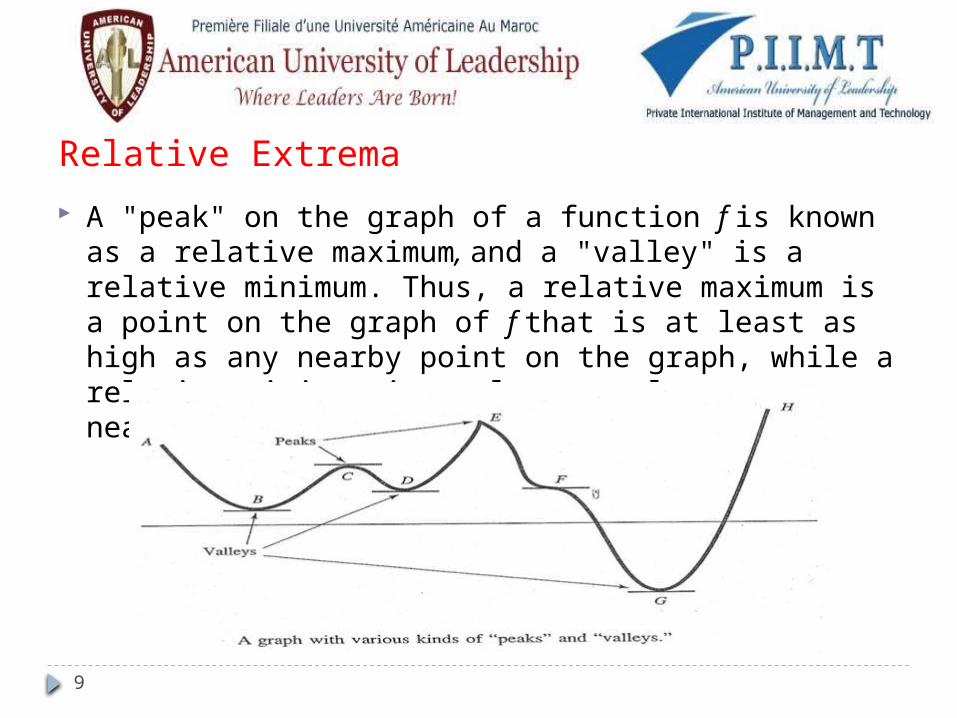
Relative Extrema A "peak" on the graph of a function f is known as a
relative maximum, and a "valley" is a relative minimum. Thus, a relative maximum is a point on the graph of f that is at least as high as any nearby point on the graph, while a relative minimum is at least as low as any nearby point.
10
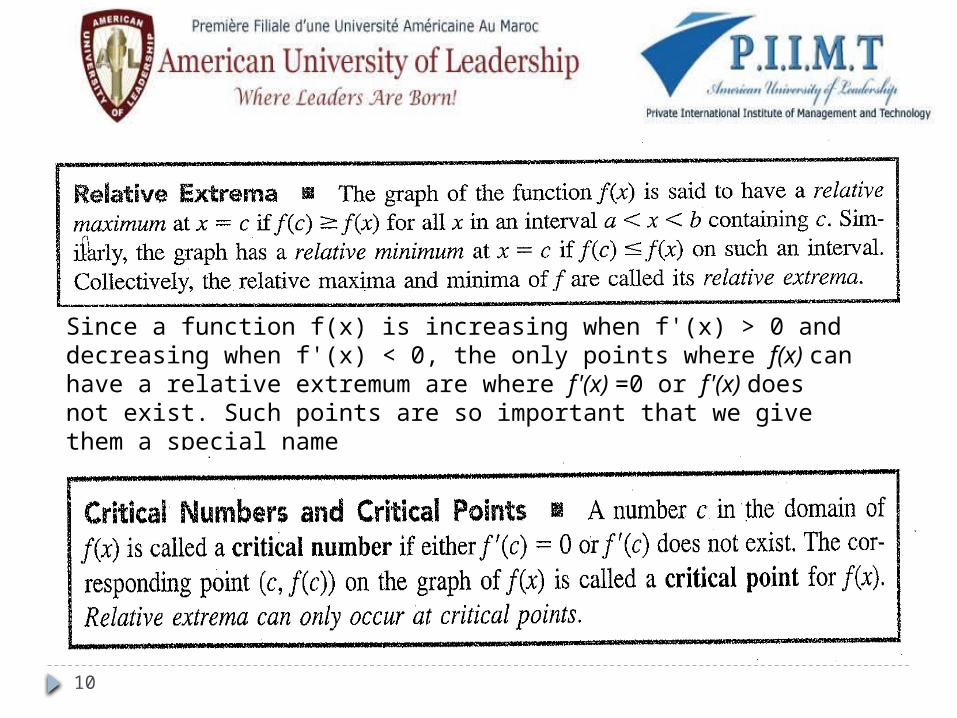
Since a function f(x) is increasing when f'(x) > 0 and decreasing when f'(x) < 0, the only points where f(x) can have a relative extremum are where f'(x) =0 or f'(x) does not exist. Such points are so important that we give them a special name

11
First Derivative Test for Relative Extrema

12
A procedure for sketching the graph of a continuous function using its derivative

13
2. Concavity and points of inflection If the function f(x) is differentiable on the interval a < x
< b, then the graph of f is concave upward on a < x < b if the slope of the tangent lines to the graph is increasing on the interval, and concave downward on a < x < b if it is decreasing on the interval

14
Determining Intervals of Concavity we observed that a function f(x) is increasing where its
derivative is positive. Thus, the derivative func tion f'(x) must be increasing where its derivative f’’(x) is positive. Suppose f’’(x) > 0 on an interval a < x < b. Then f'(x) is increasing, which in turn means that the graph of f(x) is concave upward on this interval. Similarly, on an interval a < x < b, where f’’(x) < 0, the derivative f'(x) will be decreasing and the graph of f(x) will be con cave downward.

15
Ex:intervals of concavity for f(x) = 2x6 - 5x4 + 7x – 3
f'(x) = 12x5 - 20x3 + 7 and f"(x) = 60x4 - 60x2 = 60r(x2 - 1)
= 60x(x - 1)(x + 1)
The second derivative f"(x) is continuous for all x and f"(x) = 0 for x = 0, x = 1, and x = -1. These numbers divide the x axis into four intervals on which I" (x) does not change sign; namely, x < -1, -1 < x < 0, 0 < x < 1, and x> 1. Evaluating f"(x)

16
Thus, the graph of f(x) is concave up for x < -1 and for x > 1 and concave down for -1 < x < 0 and for 0 < x < I, as indicated in this concavity diagram.
The graph of f(x) will look like
17
End of Chapter 3