Embed Size (px)
Citation preview

Calculation of Drainage Area
B-005-OWQ-WAP-XX-17-T-R0
Technical Standard Operating Procedure (TSOP) Office: Office of Water Quality
Branch: Watershed Assessment and Planning Branch
Section: All
Last Revised: N/A
Revision Cycle: Every 4 years
Originally Effective: August 1, 2017
Purpose (of the TSOP)
This technical standard operating procedure (TSOP) provides instructions in using the
United States Geological Survey’s (USGS’s) StreamStats web application to compute
the drainage area of sampling sites. Drainage area of a stream at a specified location is
that area measured in a horizontal plane, enclosed by a topographic divide from which
direct surface runoff from precipitation normally drains by gravity into the stream.
Drainage area calculations are used in a number of water quality models and indices.
This TSOP should be used by:
This TSOP applies to agency staff in the Office of Water Quality (OWQ) Watershed
Assessment and Planning Branch (WAPB) who are responsible for calculating drainage
areas and performing quality control (QC) of the measurements.


Calculation of Drainage Area B-005-OWQ-WAP-XX-17-T-R0 August 1, 2017
3
Table of Contents
Purpose (of the TSOP) .............................................................................................................................. 1
This TSOP should be used by: ................................................................................................................ 1
Authorizing Signatures .............................................................................................................................. 2
1.0. Overview Flowchart ....................................................................................................................... 4
2.0. Procedure ........................................................................................................................................ 5
2.1. Procedural Flowchart ................................................................................................................. 5
2.2. Procedural Steps ........................................................................................................................ 5
2.3. Related Technical Issues ........................................................................................................ 11
A. Health and Safety Warnings .................................................................................................. 11
B. Cautions .................................................................................................................................... 11
C. Interferences ............................................................................................................................. 12
D. Calibration ................................................................................................................................. 12
E. Troubleshooting ........................................................................................................................ 12
3.0. Roles .............................................................................................................................................. 13
3.1. Responsibilities ......................................................................................................................... 13
3.2. Training requirements .............................................................................................................. 13
4.0. List forms, equipment, and/or software to be used ................................................................. 13
4.1. Forms ......................................................................................................................................... 13
4.2. Equipment ................................................................................................................................. 13
4.3. Software ..................................................................................................................................... 13
5.0. Records Management ................................................................................................................. 13
6.0. Definitions ...................................................................................................................................... 14
7.0. Quality Assurance / Quality Control .......................................................................................... 15
8.0. References .................................................................................................................................... 15
9.0. Appendices .................................................................................................................................... 16
Calculation of Drainage Area B-005-OWQ-WAP-XX-17-T-R0 August 1, 2017
4
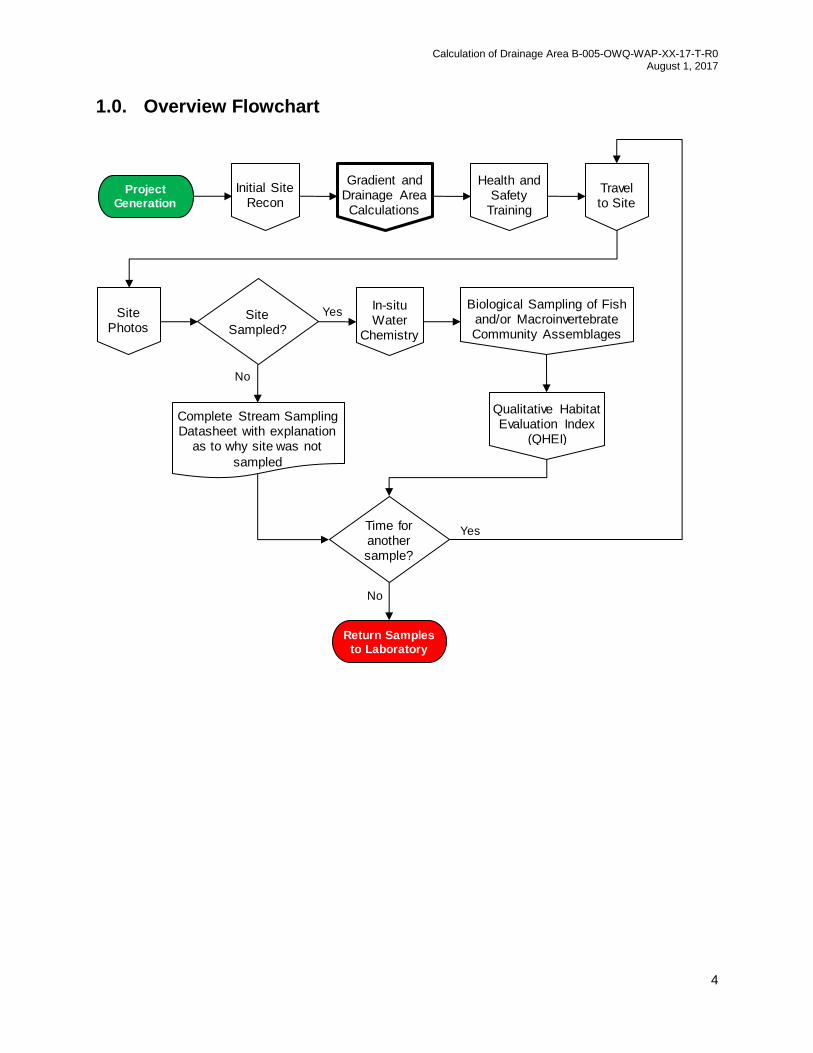
1.0. Overview Flowchart
Initial Site Recon
Health and Safety
Training
Travel to Site
Site Photos
Complete Stream Sampling Datasheet with explanation
as to why site was not
sampled
In-situ Water
Chemistry
Biological Sampling of Fish and/or Macroinvertebrate Community Assemblages
Qualitative Habitat Evaluation Index
(QHEI)
Time for another sample?
Return Samples to Laboratory
Site Sampled?
Yes
No
Yes
No
Project Generation
Gradient and Drainage Area Calculations

Calculation of Drainage Area B-005-OWQ-WAP-XX-17-T-R0 August 1, 2017
5
2.0. Procedure
2.1. Procedural Flowchart
2.2. Procedural Steps
Step 1. All steps will be completed by a WAPB staff member. Create a
Microsoft Excel spreadsheet with the Site Number, L-Site,
Waterbody Name, Latitude, and Longitude for sites approved
through site reconnaissance (Appendix A). This can be queried
from the Assessment Information Management System (AIMS)
database or found in the project folder on the Shared Drive. This
file should be saved in the project folder on the Shared Drive
using a filename that includes the year and sampling basin, such
as “2017 Kankakee Gradient and Drainage Area”.
Step 2. Add columns for Drainage Area (mi2), Completed by, and
additional columns for two rounds of quality control (QC) in the
same spreadsheet. Whoever fills in the Drainage Area (mi2) and
QC columns should leave their initials in the appropriate
Completed by column; there should be three different initials for
each sampling site.
Step 3. Open a web browser and navigate to USGS’s StreamStats
website for Indiana.
Step 4. Click on Interactive Map in the center of the page to open the
most current version of the application; do not use the beta
version. Make sure popups are enabled because a popup
window will open when you click on Interactive Map to inform you
Begin Process
Gradient and Drainage Area Spreadsheet
(Steps 1-2)
Navigate to USGS
StreamStats
Indiana(Steps 3-4)
Zoom to sampling site(Steps 5-6)
Delineate drainage
basin
(Step 7)
Computedrainage
area
(Steps 8-9)
Moresampling
sites?
End Process
Yes
No

Calculation of Drainage Area B-005-OWQ-WAP-XX-17-T-R0 August 1, 2017
6
of any issues or technical difficulties affecting the web
application.
Step 5. Click on the Zoom To button located at the top of the page and
select Lat/Long (Figure 1). In the Zoom to Latitude-Longitude
window that opens (Figure 2), copy and paste latitude and
longitude information for the approved site into the respective
text boxes. Then, press the ZoomTo button.

Calculation of Drainage Area B-005-OWQ-WAP-XX-17-T-R0 August 1, 2017
7
Figure 1
Figure 2
Calculation of Drainage Area B-005-OWQ-WAP-XX-17-T-R0 August 1, 2017
8
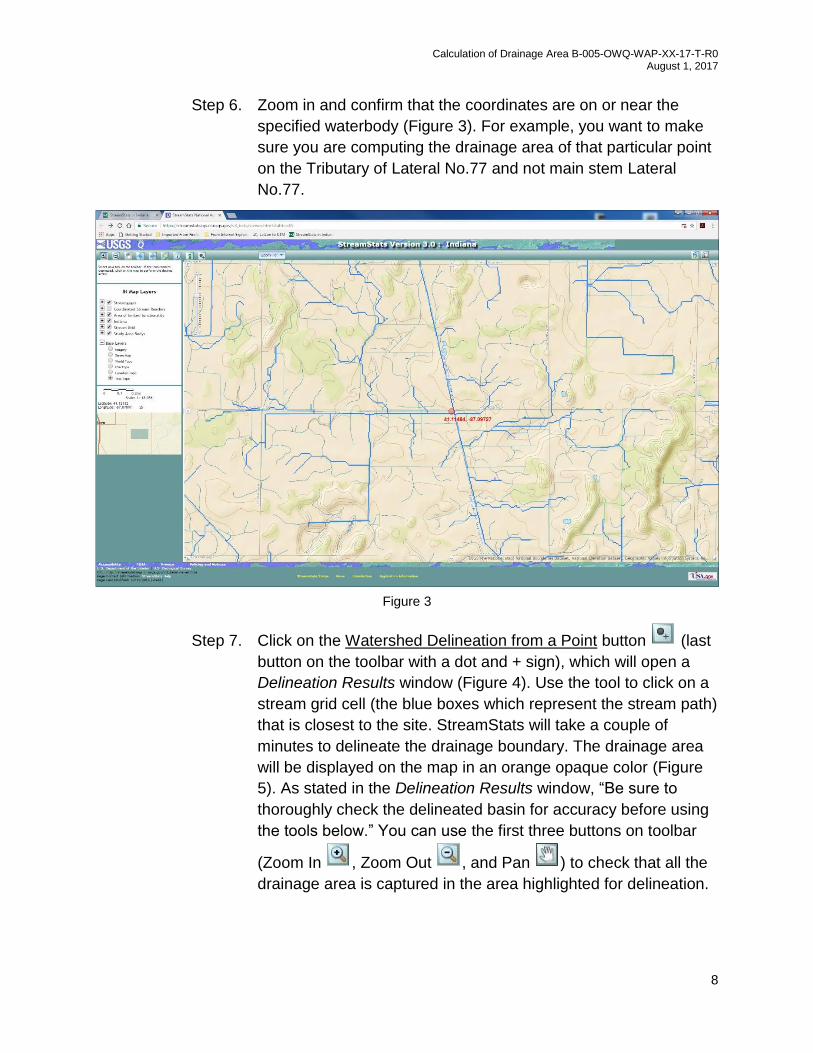
Step 6. Zoom in and confirm that the coordinates are on or near the
specified waterbody (Figure 3). For example, you want to make
sure you are computing the drainage area of that particular point
on the Tributary of Lateral No.77 and not main stem Lateral
No.77.
Step 7. Click on the Watershed Delineation from a Point button (last
button on the toolbar with a dot and + sign), which will open a
Delineation Results window (Figure 4). Use the tool to click on a
stream grid cell (the blue boxes which represent the stream path)
that is closest to the site. StreamStats will take a couple of
minutes to delineate the drainage boundary. The drainage area
will be displayed on the map in an orange opaque color (Figure
5). As stated in the Delineation Results window, “Be sure to
thoroughly check the delineated basin for accuracy before using
the tools below.” You can use the first three buttons on toolbar
(Zoom In , Zoom Out , and Pan ) to check that all the
drainage area is captured in the area highlighted for delineation.
Figure 3

Calculation of Drainage Area B-005-OWQ-WAP-XX-17-T-R0 August 1, 2017
9
Figure 4
Figure 5

Calculation of Drainage Area B-005-OWQ-WAP-XX-17-T-R0 August 1, 2017
10
Step 8. In the Delineation Results window, click on the Compute Basin
Characteristics button . This will open a window called Select
Basin Characteristics Parameters (Figure 6). In this window, click
on the ALL box to uncheck all parameters; DRNAREA will
remain selected. Press the Compute Basin Chars button to
obtain drainage area.
Figure 6

Calculation of Drainage Area B-005-OWQ-WAP-XX-17-T-R0 August 1, 2017
11
Step 9. Drainage area is displayed in square miles, which is exactly what
we want (Figure 7). Copy and paste the value into the
appropriate cell in the spreadsheet.
Step 10. Repeat Steps 5 to 9 for the remaining approved sites.
2.3. Related Technical Issues
A. Health and Safety Warnings
Not applicable. This TSOP does not involve travel or field work. All
steps are to be completed in an office setting on a computer
workstation.
B. Cautions
Be sure to use the current version of StreamStats and not the beta
version.
Do not use StreamStats if the status window indicates that there
are technical difficulties or incorrect outputs. Check back at a later
time.
Figure 7
Calculation of Drainage Area B-005-OWQ-WAP-XX-17-T-R0 August 1, 2017
12
Enter coordinates for each site accurately into StreamStats, making
sure it is for the appropriate site and not for the one above or below
in the spreadsheet.
Enter the drainage area for each site accurately onto the
spreadsheet, making sure it corresponds to the appropriate
coordinates.
Be mindful of where you place the point to delineate the drainage
basin. Zoom in to select the closest stream grid to the site of
interest; delineating the drainage basin on a larger scale may result
in incorrect boundaries. Selecting a stream grid that is upstream or
downstream of the site of interest may also result in incorrect
boundaries. For example, let’s say the site of interest is
downstream of a tributary, if the point to delineate the drainage
basin is placed upstream of the tributary, it will result in a smaller
drainage basin and drainage area. If the point to delineate the
drainage basin is placed downstream of the site of interest, it will
result in a larger drainage basin and drainage area.
C. Interferences
Not applicable.
D. Calibration
Staff are not responsible for calibrating StreamStats which is
maintained by USGS. However, staff should stay updated on which
version of StreamStats is available and read the appropriate literature
on USGS’s website prior to using the web application.
E. Troubleshooting
Read the literature provided on USGS’s website.
Visit USGS’s StreamStats Troubleshooting webpage for further
assistance.

Calculation of Drainage Area B-005-OWQ-WAP-XX-17-T-R0 August 1, 2017
13
3.0. Roles
3.1. Responsibilities
A. WAPB staff member
1. Reviews and follows this TSOP.
2. Prepares the Gradient and Drainage Area Spreadsheet.
3. The staff member assigned to Drainage Area QC Round 2 will
discuss value discrepancies with staff who performed calculations
and finalize which drainage area calculations to enter into AIMS.
3.2. Training requirements
A. Training in USGS StreamStats
1. WAPB staff member
B. Training in AIMS database management
1. WAPB staff member
4.0. List forms, equipment, and/or software to be used
4.1. Forms
A. Gradient and Drainage Area Spreadsheet
4.2. Equipment
A. Computer workstation
4.3. Software
A. Internet capabilities
B. USGS StreamStats
C. AIMS database
5.0. Records Management
Information recorded in the Gradient and Drainage Area Spreadsheet is entered
into the AIMS database. The Gradient and Drainage Area Spreadsheet is stored
electronically in the project folder on the Shared Drive.

Calculation of Drainage Area B-005-OWQ-WAP-XX-17-T-R0 August 1, 2017
14
6.0. Definitions
6.1. “Agency staff” – Any employee or representative of Indiana Department of
Environmental Management (IDEM) including regular employees,
temporary employees, contractors, and interns.
6.2. “Assessment Information Management System database (AIMS
database)” – IDEM database containing information related to water
chemistry, aquatic habitat, macroinvertebrate, fish, algae communities,
fish tissue analyses, sediments, and E. coli bacteria data collected by
agency staff from watershed sampling events.
6.3. “L-Site” – A unique Site ID generated by the AIMS database for each
sampling site, and is linked with location information (stream name,
description, latitude, longitude, county, HUC12, HUC14, etc.).
6.4. “Quality control” – The overall system of technical activities that measures
the attributes and performance of a process, item or service against
defined standards to verify that they meet the stated requirements
established by the customer; operational techniques and activities that are
used to fulfill requirements for quality. In other words, QC involves
measuring the "thing produced" against a standard to ensure it is a quality
product that meets the identified need.
6.5. “Reconnaissance” – Obtaining information about a site through visual
observations and investigating routes to safely access the site, as well as
gathering property owner information and access permission.
6.6. “Site number” – The designated program area specific numeral given to
an environmental location of interest.
6.7. “Technical Standard Operating Procedure (TSOP)” – A standard operating
procedure that involves environmental data generation, manipulation, or
compilation of an analytical process.

Calculation of Drainage Area B-005-OWQ-WAP-XX-17-T-R0 August 1, 2017
15
7.0. Quality Assurance / Quality Control
New WAPB staff should review this TSOP prior to calculating drainage area.
Data is checked for quality before being entered into the AIMS database. A
WAPB staff member will be assigned to perform Drainage Area QC Round 1 by
going through Steps 3 to 10 of Section 2.2. Following that, a different WAPB staff
member who is experienced in utilizing StreamStats will perform Drainage Area
QC Round 2 by first going through Steps 3 to 10 of Section 2.2, and then
discussing value discrepancies with staff who performed calculations. When all
discrepancies are resolved and drainage area values are finalized, the data is
then entered into the AIMS database. Following data entry, two rounds of quality
control will be performed on the database entries to ensure they reflect the
Gradient and Drainage Area Spreadsheet. Additional rounds of quality control will
be performed as necessary. When quality control has been completed on the
database entries, the data is available for use in other work products.
8.0. References
8.1. USGS
A. StreamStats.
8.2. Other Guidance
A. Hoggatt, R.E. 1975. Drainage areas of Indiana streams. U.S.
Geological Survey, Indianapolis, Indiana.

Calculation of Drainage Area B-005-OWQ-WAP-XX-17-T-R0 August 1, 2017
16
9.0. Appendices
Appendix A – Example of a Gradient and Drainage Area Spreadsheet