Embed Size (px)
Citation preview
Calculating the Final Incidenceof Australian Indirect Taxes
Rosanna Scutella*
Melbourne Institute of Applied Economic and Social ResearchThe University of Melbourne
Melbourne Institute Working Paper No. 18/97
August 1997
ISSN 1328-4991
ISBN 0 7325 0951 3
*This paper results from work undertaken for the research project “Taxation Reform: Efficiencyand Equity”, a collaborative research project using the resources of the Melbourne Institute, The
Brotherhood of St Laurence and the Committee for Economic Development of Australia, andfunded by the Australian Research Council. I particularly wish to thank Rajat Sood for the initial
work in the construction of this paper. I would also like to thank David Johnson, John Freebairn andJohn Creedy for helpful comments.
Melbourne Institute of Applied Economic and Social ResearchThe University of Melbourne
Parkville, Victoria 3052 Australia
Telephone (03) 9344 5288Fax (03) 9344 5630
Email [email protected]
WWW Address http://www.ecom.unimelb.edu.au/iaesrwww/home.html

Table of Contents
1. Introduction ............................................................................................................................1
2. Measuring final incidence of indirect taxes ...........................................................................3
3. Problem with margin services..............................................................................................13
4. Methodology to redistribute margin services.......................................................................20
5. Final incidence of Australian indirect taxes in 1992-93 ......................................................28
6. Concluding comment ...........................................................................................................36
Appendix 1: Summary of equations and matrix operations used to calculate final incidence of
indirect taxes ............................................................................................................................37
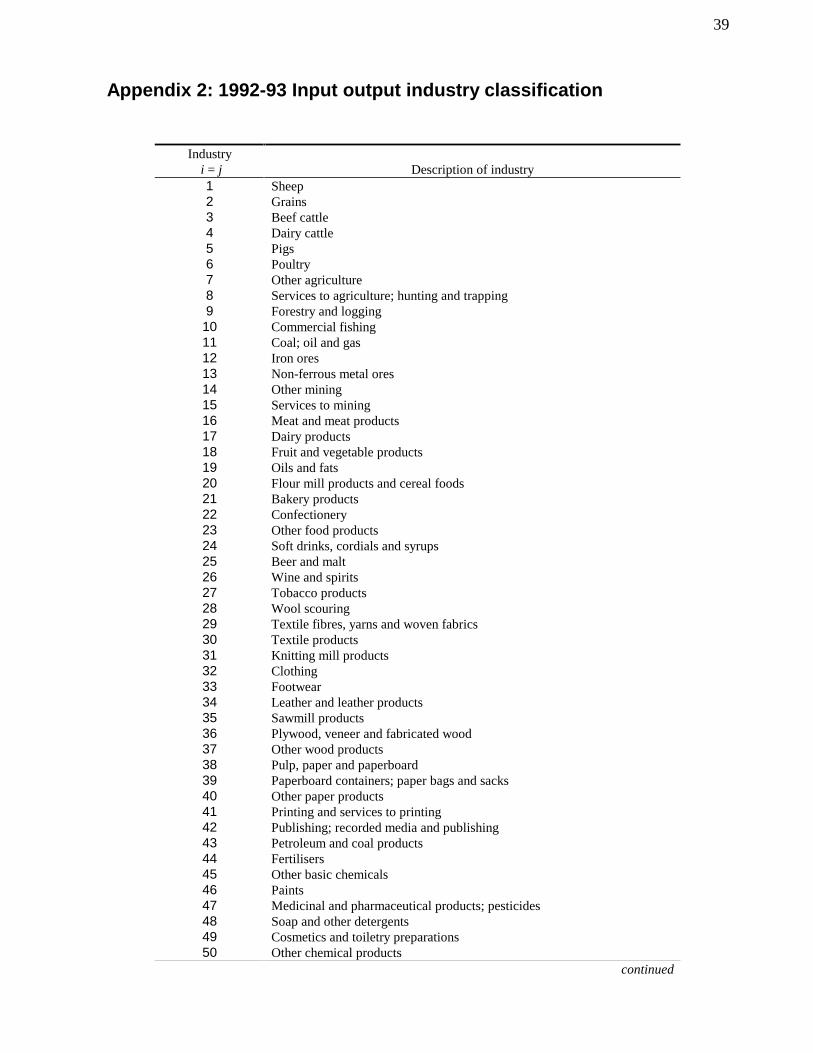
Appendix 2: 1992-93 Input output industry classification.......................................................39
Appendix 3: Calculating final incidence and effective tax rates of indirect taxes...................42
Appendix 4: Effective tax rates on final demand broken down by type of tax ........................56
References.................................................................................................................................86


1
1. Introduction
Many indirect taxes operate in Australia, each with its own legislation and administering
department which may be at Federal, State or Local level. Indirect taxes are taxes assessed on
producers in respect of the production, sale, purchase or use of goods and services which are
charged to the expense of production (ABS, 1995, p.29). The main Australian indirect taxes are
wholesale sales tax, excise, financial institutions duty, payroll tax, land tax, stamp duties,
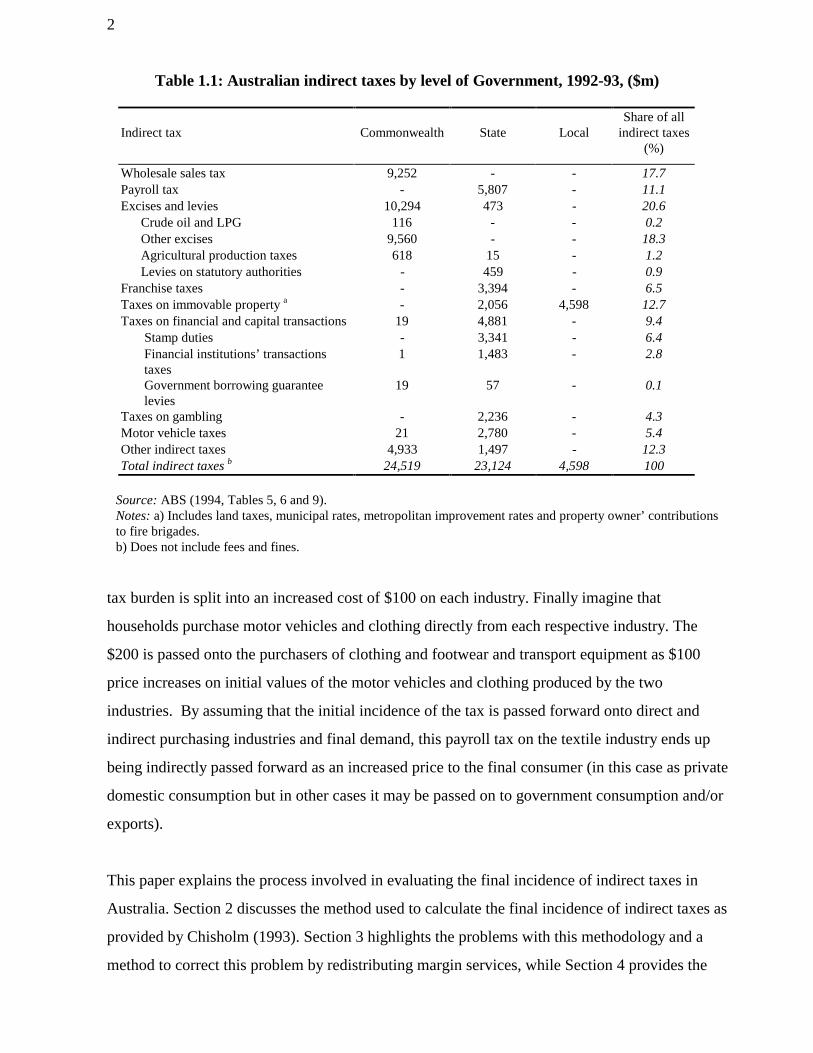
municipal rates and primary production tax1. Table 1.1 presents the tax revenue collected by each
level of government for the main Australian indirect taxes in 1992-93. It is evident from this
table that the Commonwealth and State Governments raise roughly the same amount of revenue
from indirect taxes, however the two taxes raising most revenue are excise and wholesale sales
tax, which are raised by the Commonwealth Government.
Unpublished data by the Australian Bureau of Statistics provide a breakdown by industry of the
statutory incidence of the major indirect taxes in Australia (ABS, 1996a). This statutory
incidence is the amount of revenue collected from each industry for each indirect tax. In other
words it shows who actually writes the cheques to the government. This information does not
show who bears the ultimate burden of the tax as each industry may pass on its initial burden to
purchasing industries and/or final consumers through higher prices. Thus, the burden of the tax is
passed on round by round to indirect business purchases and final demand until the total burden
of the tax is passed on to final demand. The following example illustrates this process.
Payroll tax is imposed on medium and large sized firms. In medium to large size firms in the
textiles industry for example, employers are thus liable to pay payroll tax on the wages, salaries,
fringe benefits and superannuation paid to their employees. Suppose that the textiles industry
pays a total of $200 in payroll tax. This extra cost is seen as an increase in the cost of inputs used
in textiles. Now imagine that a half of textile products are purchased by the transport equipment
industry, for seats, etc. and the remaining half by the clothing and footwear industry. This $200
1 While the ABS classifies land tax and municipal rates as indirect taxes, they are arguably more of an asset or
wealth tax. If classified as an asset tax, the assumption that statutory incidence of the taxes are fully passed forward
is debatable.
2
tax burden is split into an increased cost of $100 on each industry. Finally imagine that
households purchase motor vehicles and clothing directly from each respective industry. The
$200 is passed onto the purchasers of clothing and footwear and transport equipment as $100
price increases on initial values of the motor vehicles and clothing produced by the two
industries. By assuming that the initial incidence of the tax is passed forward onto direct and
indirect purchasing industries and final demand, this payroll tax on the textile industry ends up
being indirectly passed forward as an increased price to the final consumer (in this case as private
domestic consumption but in other cases it may be passed on to government consumption and/or
exports).
This paper explains the process involved in evaluating the final incidence of indirect taxes in
Australia. Section 2 discusses the method used to calculate the final incidence of indirect taxes as
provided by Chisholm (1993). Section 3 highlights the problems with this methodology and a
method to correct this problem by redistributing margin services, while Section 4 provides the
Table 1.1: Australian indirect taxes by level of Government, 1992-93, ($m)
Indirect tax Commonwealth State LocalShare of all
indirect taxes(%)
Wholesale sales tax 9,252 - - 17.7Payroll tax - 5,807 - 11.1Excises and levies 10,294 473 - 20.6 Crude oil and LPG 116 - - 0.2 Other excises 9,560 - - 18.3 Agricultural production taxes 618 15 - 1.2 Levies on statutory authorities - 459 - 0.9Franchise taxes - 3,394 - 6.5Taxes on immovable property a - 2,056 4,598 12.7Taxes on financial and capital transactions 19 4,881 - 9.4 Stamp duties - 3,341 - 6.4 Financial institutions’ transactions taxes
1 1,483 - 2.8
Government borrowing guarantee levies
19 57 - 0.1
Taxes on gambling - 2,236 - 4.3Motor vehicle taxes 21 2,780 - 5.4Other indirect taxes 4,933 1,497 - 12.3Total indirect taxes b 24,519 23,124 4,598 100
Source: ABS (1994, Tables 5, 6 and 9).Notes: a) Includes land taxes, municipal rates, metropolitan improvement rates and property owner’ contributionsto fire brigades.b) Does not include fees and fines.

3
process involved to undertake this redistribution. Applications of this procedure to 1992-93 data
are illustrated in Section 5 with some of the more detailed results outlined in appendix 2.
Concluding comments are made in Section 6.
2. Measuring final incidence of indirect taxes
The method used to derive final indirect tax incidence is developed from Chisholm (1993). The
major innovation is to include the use of margin industries in the initial flows of the input output
matrix ensuring that taxes on inputs to margin services are fully passed forward onto the good or
service that the consumer purchases. Margin industries are service industries which add value to
a product on its way from the producing industry to the purchasing industry. Margin industries
include all or part of four different classes of transport (rail, road, sea and air); services to
transport; marine insurance services; retail trade; wholesale trade; and accommodation, cafes and
restaurant services. The methodology is differentiated by type of tax so it is possible to
investigate the impact of any plausible change in indirect tax on household consumption and
hence on household welfare.
Warren (1989), developing on earlier work in Warren (1979), attempted to calculate the impact
of both direct and indirect taxation in Australia on the household sector in the form of an
intertemporal study of the Australian tax system between 1975-76 and 1984-85. Warren (1991)
furthers the study by looking at the changing incidence of indirect taxes between 1975-76 and
1988-89. This analysis includes the effects of Australian tax on the distribution of household
income incorporating various tax shifting assumptions rather than full passing forward onto final
demand.
The Fiscal Incidence Study (FIS) performed by the ABS also looks at calculating the final
incidence of indirect taxes in Australia. The method used is outlined in ABS (1996b pp. 75-81).
In this the ABS attempts to calculate indirect tax rates and applies these to each household’s
average weekly expenditure (as recorded in the Household Expenditure Survey) on respective
commodities. Results of the study are reported in ABS Catalogue No. 6537.0.

4
By calculating the final incidence of indirect taxes on final consumption it is possible to evaluate
the effect of indirect taxes on households. Given the different pattern of purchases of groups of
households defined by demographic type or by income range, it is possible using a method
derived by Creedy (1997) to evaluate the effect of the changes in the tax mix on household
welfare and on the distribution of household income. The method involves the use of the
Household Expenditure Survey (HES) collected by the ABS to estimate consumer demand
equations for various HES commodity groups, for different income levels. After these are
estimated it is possible to evaluate the likely change in welfare for each household in the survey
thus allowing for distributional analyses to be carried out. Creedy and Martin (1997) report the
initial stage of estimation of this model using the 1993 HES. This model combined with the
results of this paper make it possible to evaluate the equity effects of a change in the tax
structure.
Both a long run and short run model may be used to calculate the final incidence with this paper
reporting the method and results of the long run model.
2.1 Short run model
The short run model consists of the original input-output absorption matrix, in the case of the
1992-93 data for 113 industries. Private and public enterprise gross fixed capital expenditure
remain as final demand categories, however the increase in stocks component is deleted as it is
assumed that the capital stock is fixed in the short term.
2.2 Long run model
The methods described below apply to the long run model with indirect taxes falling both
initially and subsequently on private and public enterprise gross fixed capital expenditure
assumed to be passed forward into higher prices on goods and services bought by final buyers for
consumption or for export. The process involved in building this long run model is simply to sum
private and public enterprise gross fixed capital expenditure and move the column into the
intermediate demand component of the input output matrix. Thus, with the 1992-93 input output
data, we identify 114 industries (compared to 113 industries in the short run model). To account
for capital inputs to industries the gross operating surplus row is moved to the intermediate flow

5
matrix. Thus, we now have an extra column and row in our industry by industry absorption
matrix.
2.3 Methodology to calculate final incidence of indirect taxes
This section describes the method used by Chisholm (1993). The steps involved in the
methodology, in calculating final incidence of indirect taxes are:
• calculating statutory incidence;
• setting up an exemptions matrix;
• calculating the first round output coefficients;
• calculating first round incidence on business inputs and final demand;
• flowing the tax on business inputs through to final demand;
• calculating total final incidence of indirect taxes by final demand category; and
• calculating the effective tax rates on final demand.
2.3.1 Calculate the Statutory Incidence Vector, SI
The statutory incidence of indirect taxes represents the actual revenue collected from business by
the Government due to statutory tax obligations. Statutory incidence split by industry for the
main Australian indirect taxes are shown in Table 2.1 and Table 2.2. Equation 1 shows that the
statutory incidence vector of indirect taxes on industry i, SIi, comprises the sum of the statutory
incidence on industry i over type of indirect tax j, SIij, where there are m industries and s types of
indirect tax.
SI SIi ijj
s
==
∑1
for i = 1, ..., m and j = 1, ..., s. (1)
SI=
SI
SI
:
SI
:
SI
i
m
1
2

6
Table 2.1: Statutory incidence of main indirect taxes, 1992-93 ($m.)
Industry Salestax
Exciseduties
BusinessFranchise
Fees aFID Stamp
Duties bPayroll
tax
Otherindirecttaxes b
Totalindirect
taxes
Agriculture; hunting andtrapping
0 0 0 0 58 48 1035 1141
Forestry and fishing 0 0 0 0 8 13 100 122Mining 0 159 0 0 23 189 153 525Meat and Dairy Products 81 0 0 0 11 87 275 455Other food products 298 0 0 0 12 121 76 507Beverages and Tobacco
products830 2317 2205 0 4 42 661 6059
Textiles 69 0 0 0 3 38 21 131Clothing and footwear 28 0 0 0 4 52 25 108Wood and wood products 16 0 0 0 6 35 28 85Paper and paper products;
printing and publishing1232 0 0 0 13 167 74 1485
Petroleum and coal products 0 7200 1174 0 3 14 55 8446Chemicals 551 0 0 0 10 101 73 735Rubber and plastic products 595 0 0 0 5 58 35 693Non-metallic mineral products 67 0 0 0 7 62 48 185Basic metals and products 0 0 0 0 8 156 74 238Fabricated metal products 457 0 0 0 11 95 61 625Transport equipment 2677 0 0 0 7 120 62 2866Other machinery and equipment 1901 0 0 0 14 164 77 2156Miscellaneous manufacturing 450 0 0 0 6 30 29 515Electricity, gas and water 0 0 15 0 29 110 530 684Construction 0 0 0 0 158 244 378 780Wholesale trade 0 0 0 0 95 538 678 1311Retail trade 0 0 0 0 108 491 582 1181Repairs 0 0 0 0 6 143 216 365Accommodation, cafes and
restaurants0 0 502 0 7 84 130 723
Transport and storage 0 0 0 0 566 574 802 1942Communication services 0 0 0 0 58 250 120 428Finance and insurance 0 0 0 1483 848 577 1871 4780Ownership of dwellings 0 0 0 0 12 0 3067 3079Property and business services 0 0 0 0 48 821 651 1520Government administration 0 0 0 0 0 6 161 167Education 0 0 0 0 6 94 296 396Health and Community services 0 0 0 0 18 102 352 472Cultural and recreational
services0 0 1225 0 80 46 708 2061
Personal and Other services 2 0 0 0 4 102 131 239Capital 0 0 0 0 2166 0 0 2166Total 9252 9676 5121 1483 4420 5776 13637 49365
Source: ABS (1996a, unpublished data, Commodity taxes and indirect taxes investigation)Notes: (a) Franchise fees in this analysis include taxes on gambling(b) Stamp duties in this analysis include motor vehicle taxes(c) Included in ‘Other’ are land taxes, primary production taxes, municipal rates, customs duty on exports, fringebenefits taxes, taxes on insurance and regulatory service fees.

7
Table 2.2: Statutory incidence of excise duties and franchise fees on petroleum products,tobacco products and alcohol, 1992-93, ($m.)
Excise Franchise feeTotal excise duty and
franchise feePetroleum and coal products 7,200 1,174 8,374Tobacco products 1,355 1,575 2,930Alcohol 962 630 1,592
Source: ABS (1996a, unpublished data, Commodity taxes and indirect taxes investigation)
2.3.2 Set up Exemptions Matrix, E
This matrix comprises the full industry by industry flow matrix but with flows between exempt
industries set at zero. This is to recognise the fact that some industries are exempt from certain
types of tax; for example, goods sold to defence forces are exempt from wholesale sales tax
therefore the column showing purchases by defence is set to zero. Where there is only a partial
exemption for one item out of a range of items covered by a particular industry classification,
only a partial adjustment is made. Summing across the rows of the exemptions matrix and
adding in non-exempt final demand, FDXi, gives industry i’s total non-exempt supply of
commodities or services, TSXi. Final demand categories that are exempt, for instance government
consumption and exports are exempt from sales tax, are also excluded when calculating total
non-exempt supply. Therefore the exemptions matrix for flows between industry i and industry j
for m industries is:
E=
E E ... E ... E
E E ... E ... E
: :
E E ... E ... E
: :
E E : E : E
j m
j m
i ij im
m m mj mm
11 12 1 1
21 22 2 2
1 12
1 2
(2)
and total non-exempt supply of commodity i is the sum of intermediate non-exempt demand, that
is the exemptions matrix, over j industries for commodity i plus non-exempt final demand for
commodity i:
TSX E FDXi ij i
m
=j=1
+∑ for i = j = 1, ... , m (3)

8
For this study, the sales tax exemption matrix is not needed (although may be calculated) as the
Australian Bureau of Statistics provides a margin analysis for the wholesale sales tax, already
providing the first round incidence on business inputs and final demand. For other taxes, it needs
to be determined how exemptions in the relevant legislation should be modelled in matrix form.
2.3.3 Calculating the first round output coefficients, OX
This involves dividing each element of each row in the exemptions matrix by total non-exempt
supply for that row or supplying industry. This gives a first round non-exempt output
coefficients matrix, OXij. This matrix expresses industry i’s intermediate non-exempt supply of a
commodity or service to purchasing industry j as a percentage of total non-exempt supply of that
commodity or service where there are m industries.
OX=
E TSX E TSX ... E TSX ... E TSX
E TSX E TSX ... E TSX ... E TSX
E TSX E TSX ... E TSX ... E TSX
E TSX E TSX ... E TSX ... E TSX
j m
j m
i i i ij i im i
m m m m mj m mm m
11 1 12 1 1 1 1 1
21 2 22 2 2 2 2 2
1 12
1 2
M M O M O M
M M O M O M
(4)
2.3.4 First round incidence on business inputs, TI
Increases in costs to various industries due to taxes such as wholesale sales tax are assumed to be
fully passed forward to purchasing industries or final demand. The outcome on purchasing
industries represents first round incidence on business inputs, TIi. First round incidence on
business inputs is obtained by multiplying the statutory incidence vector with the first round
output coefficients matrix.
TI SI OXi i ij’ ’= (5)
9
[ ]TI’= SI SI ... SI ... SI
E TSX E TSX ... E TSX ... E TSX
E TSX E TSX ... E TSX ... E TSX
: : : :
E TSX E TSX E TSX ... E TSX
: : : :
E TSX E TSX ... E TSX ... E TSX
i m
j m
j m
i i i i ij im i
m m m m mj m mm m
1 2
11 1 12 1 1 1 1 1
21 2 22 2 2 1 2 2
1 2 1
1 2
TI=
SI E TSX SI E TSX ...SI E TSX
SI E TSX SI E TSX ...SI E TSX
:
SI E TSX SI E TSX ...SI E TSX
:
SI E TSX SI E TSX ...SI E TSX
m m m
m m m
j j m mj m
m m m mm m
1 11 1 2 21 2 1
1 12 1 2 22 2 2
1 1 1 2 2 2
1 1 1 2 2 2
× + × + ×× + × + ×
× + × + ×
× + × + ×
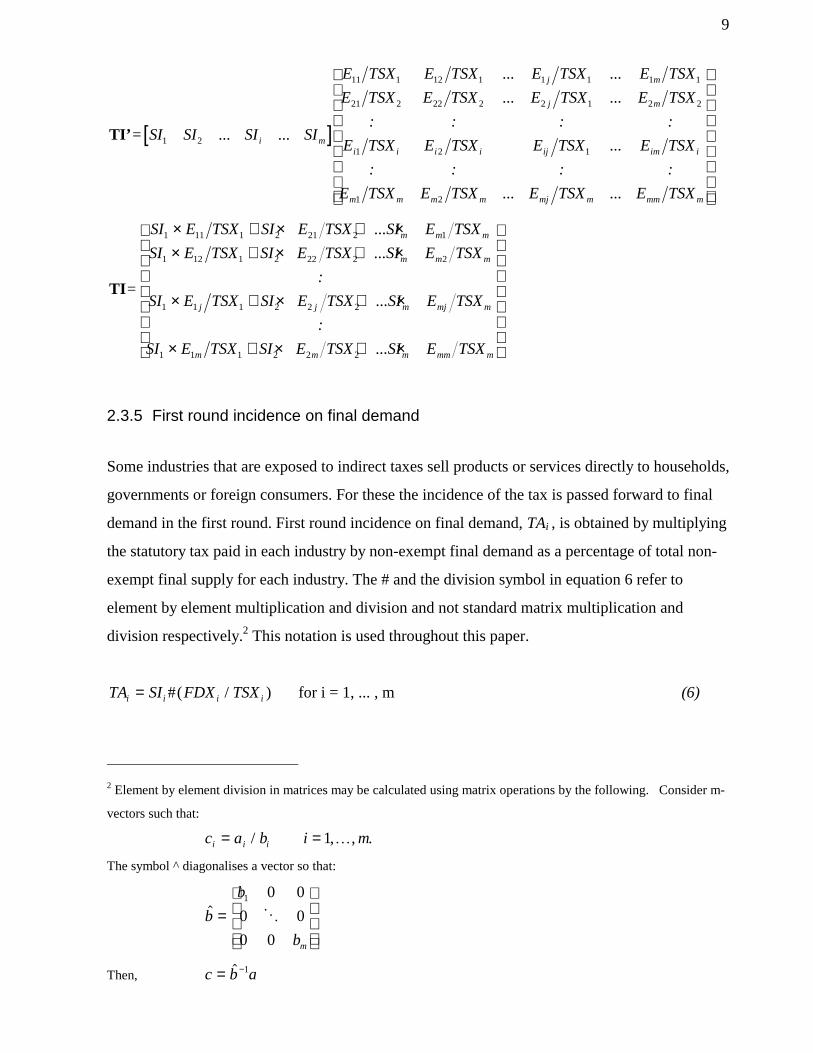
2.3.5 First round incidence on final demand
Some industries that are exposed to indirect taxes sell products or services directly to households,
governments or foreign consumers. For these the incidence of the tax is passed forward to final
demand in the first round. First round incidence on final demand, TAi , is obtained by multiplying
the statutory tax paid in each industry by non-exempt final demand as a percentage of total non-
exempt final supply for each industry. The # and the division symbol in equation 6 refer to
element by element multiplication and division and not standard matrix multiplication and
division respectively.2 This notation is used throughout this paper.
TA SI FDX TSXi i i i= #( / ) for i = 1, ... , m (6)
2 Element by element division in matrices may be calculated using matrix operations by the following. Consider m-
vectors such that:
c a b i mi i i= =/ , , .1K
The symbol ^ diagonalises a vector so that:
$b
b
bm
=
1 0 0
0 0
0 0
O
Then, c b a= −$ 1

10
TA=
SI
SI
SI
SI
#
FDX TSX
FDX TSX
FDX TSX
FDX TSX
SI FDX TSX
SI FDX TSX
SI FDX TSX
SI FDX TSX
i
m
i i
m m
i i i
m m m
1
2
1 1
2 2
1 1 1
2 2 2
:
:
:
:
:
:
=
××
×
×
The result is the statutory incidence for each industry multiplied by the proportion of final non-
exempt demand in total non-exempt supply, for each industry.
In the case of sales tax, the above steps are not necessary thanks to ABS data on margin matrices.
For other taxes, when the exemption matrix was created, the non-exempt final demand and non-
exempt total supply vectors were also computed.
2.3.6 Final incidence of indirect taxes
Calculating the final incidence of indirect taxes requires generating a matrix which does not
allow for exemptions, because those industries which are exempt from, say, sales tax, only get
the benefit of the exemption for taxes on their direct inputs, not for tax on inputs to their inputs.
Thus rather than using the exemptions matrix to calculate the output coefficients the original
industry by industry flow matrix is used with no exemptions. Each flow in this matrix is divided
by total supply of that supplying industry to obtain the new output coefficients matrix, Oij.
Flowing Tax on Business Inputs through to Final Demand
Now that we have our new output coefficients matrix the next step is to see how taxes on
business inputs flow through the output coefficients matrix to find how those taxes fall on final
demand. However, because a final good may use inputs that have been through several stages of
production, it is not possible to shift all of the taxes on business inputs through to final demand
in one round. Each round, a portion of an industry’s output will be purchased at a final demand
level and the remainder will be used by other industries as an input to their production which
they will in turn supply to either final purchasers or used as inputs to other industries production
processes and so on. Eventually, after many rounds, all of the inputs will end up in final demand
and correspondingly all of the tax on business inputs will be forwarded to final demand.

11
In each round, the portion of tax passed on to final demand in each industry, Zi ,is given by
dividing the components of the final demand vector by the total supply vector:
Z FD TSi i i= / for i = 1, ... ,m (7)
In this case, no exemptions are made from either vector as tax on inputs is borne by all sectors
and final demand components. When the amount of input tax remaining from a previous round
is multiplied element by element by Zi it gives the amount of tax forwarded on to final demand in
the current round. The amount of tax remaining on business inputs is TIi × Iij in round 2, TIi × Oij
in round 3, TIi × Oij 2 in round 4 and TIi × Oij
n-2 in round n. After n+2 rounds, the amount of tax
that has been forwarded to final demand is given by the series:
( )’# ( )’# ( )’# ( )’#TI’ I Z TI’ O Z TI’ O Z TI’ O Z× + × + × + + ×2 K n
Which simplifies to:
[ ’TI’ (I O O O )] # Z2 n× + + + +...
When n gets very large, the Oijn term becomes very small. When n is infinite the expression in
the round brackets is an infinite geometric series and so can be simplified to:
TB [TI (I O ) ]’#Zi i ij ij i= × − −’ 1 for i = j = 1, ... , m (8)
giving TBi , the subsequent rounds incidence on final demand.
If we let: A = (I - O) -1
Then:
TB [TI’ A]’ # Z= ×

12
[ ]TB= TI TI TI TI
A A A A
A A A A
A A A A
A A A A
Z
TI A TI A TI A TI A FD TS
j m
j m
j m
i i ij im
m m mj mm
i
j i m m
{ ... ...
... ...
... ...
: : :
... ...
: : :
... ...
}#
( ... ... ) ( /
1 2
11 12 1 1
21 22 2 2
1 2
1 2
1 11 2 21 1 1 1
=
× + × + + × + + × × 1
1 12 2 22 2 2 2 2
1 1 2 2
1 1 2 2
)
( ... ... ) ( / )
:
( ... ... ) ( / )
:
( ... ... ) ( / )
TI A TI A TI A TI A FD TS
TI A TI A TI A TI A FD TS
TI A TI A TI A TI A FD TS
j i m m
j j j ij m mj i i
m m j im m mm m m
× + × + + × + + × ×
× + × + + × + + × ×
× + × + + × + + × ×
Total final incidence of tax by final demand category, TFI
Total final incidence of indirect taxes, TFIi , is the sum of first round incidence on final demand
and subsequent rounds incidence. Thus,
TFIi = TAi + TBi for i = 1, ... ,m (9)
Total final incidence represents the dollar amount of tax paid by total final demand. To calculate
the final incidence on each final demand component one needs to take each final demand
components share of total demand and multiply it by both first round incidence on final demand
and subsequent rounds incidence. For instance when calculating total final incidence on private
consumption expenditure, TFIPCi , in the case of the wholesale sales tax first round incidence on
private consumption expenditure is equivalent to first round incidence on final demand as other
final demand components are exempt from wholesale sales tax in the first round. When
calculating subsequent rounds incidence on households, however, only the proportion of that
incidence attributable to private consumption expenditure must be taken. This is shown formally
in equation 10 where PCi refers to private final consumption expenditure.
TFIPCi = TBi × (PCi /FDi) + TAi for i = 1, ... ,m (10)

13
Retaining the wholesale sales tax example, final incidence on exports only consists of subsequent
rounds incidence on exports. Thus, final incidence on exports, TFIXi is represented by equation
11 where Xi refers to exports.
TFIXi = TBi × (Xi /FDi) for i = 1, ... ,m (11)
In the case of many other indirect taxes, such as payroll tax, all final demand components are
effected in the first round thus equation 10 and 11 will thus be replaced by equations 12 and 13
respectively where PCXi and XXi represent non-exempt private final consumption expenditure
and non-exempt exports respectively.
TFIPCi = TBi × (PCi /FDi) + TAi × (PCXi /FDXi) for i = 1, ... ,m (12)
TFIXi = TBi × (Xi /FDi) + TAi × (XXi /FDXi) for i = 1, ... ,m (13)
Effective tax rates for each final demand component can be calculated by dividing the final
incidence of the tax by the level of each final demand component, for example, private final
consumption expenditure.
3. Problem with margin services
Margin industries are service industries which add value to a product on its way from the
producing industry to the purchasing industry. They include amounts paid to industries that are
involved in the transport and marketing of goods for sale to intermediate or final purchasers.
Those industries that provide margin services are Wholesale and Retail Trade (ANZSIC 4501
and 5101 respectively), Accommodation, cafes and restaurants (5701), Road Transport (6101),
Rail Transport (6201), Water Transport (6301), Air and Space Transport (6401), Services to
Transport (6601) and Insurance (7401).
Chisholm (1993) makes no mention of ‘margins’. His method uses the basic values table to
derive the exemptions and output coefficients’ matrix. Using the Chisholm method, margins are
represented by flows from the margin industries to the usage industries and to final demand, as

14
the case may be. If margin services were included when valuing flows, margins would flow first
to the supplying producer whose output, including margin payments, is then absorbed by users.
To illustrate this distinction, consider the following illustration: Grain is used by the bakery
products industry to create bread. The grain is road transported to the bakery. After the grain has
been made into bread, it is acquired by a supermarket (retail trade) to be sold to final private
consumers. Under basic values, flows are recorded from grain and road transport into bakeries
while finished bread and road transport flow into final private consumption, a total of four flows.
Conversely when margins are included with the basic value transactions the value of road
transport would be incorporated in the flow between grain and the purchasing industry, bakeries.
The retail sales margin would also be represented as an added value in the flow between bakeries
and final consumption demand. In this method all the transactions are represented by just two
flows. In considering margin flows it is noted that not all of the supplies of the traditional margin
industries outlined above are margin services. For example, road transport includes non-margin
services such as passenger bus services which is a final service in its own right.
Chisholm’s technique allows for the passing on of taxes on inputs to final demand. However, his
method fails to allocate taxes on margin industries, or inputs to margin industries, to the final
sales of commodities that use those margins. To understand the problem, consider a tax on a
regular (non-margin) supply commodity like Other Basic Chemicals (OBC). OBC is an input for
a number of usage industry groups, but assume that it is not used by any margin industries. A
commodity tax on OBC would be passed on to the relevant non-margin industries, as well as to
final demand, through the matrix inversion outlined above in Section 2.
Compare a tax on a commodity that is heavily used by some margin industries: petroleum and
coal. A tax on petrol would not only affect the price of intermediate inputs to the car industry,
but would increase the price of road transport, wholesale trade and retail trade. These increased
margins would in turn increase the cost of car production. All this is accounted for in the matrix
inversion carried out above. However, what is not accounted for is the effect that increased
prices for transport and wholesale trade would have on the final purchase price of motor vehicles
for final consumers. Chisholm’s method pushes taxes on inputs to margins through to the basic
values of the final sales of margins. But he does not allocate the tax-boosted basic value of
margin industries at the final demand level to those commodities that use margin services to get

15
Industry
Commodity
goods to final purchasers. Looking at final demand, a tax on an input to, say, road transport,
would affect only the basic value figure. Assume that it increases that figure by $300 million.
To correctly show how the prices of final commodities that use road transport are affected, one
needs to allocate the $300 million to motor vehicles, paints, clothing and whatever other
commodities use road transport at the final stage of delivery to the consumer.
Consider the following illustration represented in Figure 3-1. Fuel and fertiliser are two products
derived from inputs of primary factors, say for example labour. Fuel feeds entirely into transport
and fertiliser entirely into grain. Transport feeds into grain, bakeries and final consumption
because it is required to move fertiliser to the land used to grow grain, grain to bakeries and from
bakeries to the final user as finished bread is transported to consumers. Intuitively from this
diagram, as bread is the only good directly purchased by the final consumer, it is expected that a
tax falling on any direct or indirect input to bread would ultimately impact on final consumers
usage of bread from the bakery. The Chisholm method outlined above, does not ensure this will
occur.
In basic values this diagram suggests the absorption matrix presented in Table 3.1. Note that the
usage of transport at basic values is represented by direct flows from the transport industry to the
industries (or final consumer) purchasing the goods. For instance the transport industry is used to
deliver fertiliser to the grain industry. This is recorded at basic values as a transaction between
the transport industry and the grain industry.
Table 3.1: Absorption matrix at basic values
Fertiliser Fuel Grain Transport Bakery FinalConsumption
TotalSupply
Fertiliser 0 0 $100 0 0 0 $100
Fuel 0 0 0 $300 0 0 $300
Grain 0 0 0 0 $200 0 $200
Transport 0 0 $100 0 $100 $100 $300
Bakery 0 0 0 0 0 $300 $300
Primaryfactors
$100 $300 0 0 0

16
Figure 3-1: Flow diagram for industry by industry transactions
Primary factors
Fertiliser Fuel
Grain Transport
Bakery
$100
$100 $100
$100
$100
$200
$300
Final consumer
$300
$300
Following the method outlined in Section 2 the output coefficients matrix (also the exemptions
matrix in this case) is:
OX = O =
0 0 1 0 0
0 0 0 1 0
0 0 0 0 1
0 0 13 0 1
30 0 0 0 0
Suppose that a 10% tax on fuel is levied.

17
SI’ = [ ]0 30 0 0 0
Thus, first round incidence on business inputs is:
TI’ = SI’ × OX =[ ]0 0 0 30 0
First round incidence on business inputs falls, as expected, on transport. As there is no first round
incidence on final demand equation 8 gives us final incidence thus:
TB = { TI’ ×
1 0 1 0 1
0 1 0 0 0
0 0 1 0 1
0 0 13 1 2
30 0 0 0 1
}’#
0
0
01
31
TB =
0
0
10
30
20
0
0
01
31
0
0
0
10
20
=
#
Thus the original $30 tax on fuel ends up on final consumption of transport and final
consumption of bakery products in $10 and $20 shares respectively. But the only final good
purchased by the consumer is bread. Hence, the $10 of tax making its way into the final basic
value of transport must be reallocated to the purchaser price of final bakery products. Whilst this
is a trivially simple exercise in the above example, where there are many margin industries and
many non-margin industries that use margins, the allocation becomes more complicated. To take
account of margin services to push the final incidence of indirect taxes to final consumers an
extra step is needed in the methodology. Prior to calculating any sort of incidence, the supply of
margin services must be redistributed to the commodities that use them, and inputs to margin
services must be redistributed to the industries which rely on margin services to increase the
value of their products. The previous example with this extra step is shown below.

18
Industry
Commodity
The new transformed absorption, final demand and total supply matrices are illustrated in Table
3.2.
Table 3.2: Absorption matrix with margin transactions redistributed
Fertiliser Fuel Grain Bakery FinalConsumption
TotalSupply
Fertiliser 0 0 $200 0 0 $200
Fuel $100 0 $100 $100 0 $300
Grain 0 0 0 $300 0 $300
Bakery 0 0 0 0 $400 $400
Primaryfactors
$100 $300 0 0
In Table 3.2 the transport industry row and column from Table 3.1 have been eliminated due to
the redistribution of all outputs of, and inputs to, transport. The $100 of transport used by grain to
transport fertiliser to grain has been redistributed in the flow between fertiliser to grain. The $100
of transport used to move grain to the bakery has been redistributed to the flow between grain
and the bakery, and the $100 of transport used to move bread to the final consumer has been
redistributed in the flow which brings the good which the final consumer uses, bread (or the
bakery) to the consumer. To redistribute the inputs to transport the $300 of fuel used by transport
is split evenly into fertilisers usage of fuel, grains usage of fuel and the bakery’s usage of fuel, as
these three industries all rely on transport to get their products to purchasers thus adding value to
their products. The sum of primary factors, final demand and total supply do not change with the
redistribution. The new transformed output coefficients matrix is:
O =
0 0 1 01
3 0 13
13
0 0 0 1
0 0 0 0
If the previous example of a 10% tax on fuel is imposed, first round incidence falls on fertiliser,
grain and the bakery (as the margin service transport has been redistributed):

19
TI =
10
0
10
10
Final incidence now falls solely on final consumers consumption of bread (bakery) as can be seen
below.
TB = TFI =
0
0
0
30
This is the required result and thus the larger task of including these extra steps to the larger
absorption matrix must be applied. This is complicated as there are many flows to take account
of and margin services use more than one input, unlike the above example. Fortunately, detailed
data is available in ABS (1996a, Tables 25 to 34) on the value of each margin used by each
commodity at both the intermediate level and for the various final demand categories. This
allows the redistribution of the usage of margin services to simply involve adding the margin
tables to the initial input-output table. When working out how tax ending up on final basic values
of margins should be reallocated to non-margin commodities, one must allow for the non-margin
production of the margin industries. It would be erroneous to allocate non-margin basic values
of margin industries to non-margin industries. For example, passenger bus services (or any
increase in their value) should remain a flow between road transport and final consumers and not
be allocated to other commodities along with the margin component of road transport. To
calculate the correct proportion of basic value for margin industries that should remain with each
margin industry, one needs to calculate the margin proportion of their output. These proportions
for 1992-93 are presented in Table 3.3.

20
4. Methodology to redistribute margin services
As mentioned above the margin matrices are added to the original absorption matrix to
redistribute the usage of margin services. After this, margin services supply must be deleted from
each corresponding margin row. This applies to the commodities wholesale trade (denoted by
subscripts i and j = 83); retail trade (i, j = 84); accommodation, cafes and restaurants (i, j = 87);
road transport (i, j = 88); rail, pipeline and other transport (i, j = 89); water transport (i, j = 90);
air and space transport (i, j = 91); services to transport, storage (i, j = 92); and insurance (i, j =
97). Note that only the proportions on actual margin services are deleted which were calculated
in Table 3.3 above. The operations needed for the calculations are as follows:
AA ij = (1-.955)ADDMARG ij if i = 83,
= (1-.9789)ADDMARG ij if i = 84,
= (1-.257)ADDMARG ij if i = 87,
= (1-.69)ADDMARG ij if i = 88,
= (1-.58988)ADDMARG ij if i = 89, (14)
3 The values in this publication correspond to the sum of total supply in each of the margin tables in ABS (1996a).
Table 3.3: Proportion of traditional margin industry output attributable to actual marginservices, 1992-93
Margin industry Proportion of margin industry outputthat is ‘margin service’
($m.) (per cent)Wholesale Trade [32,469.0/34,002.7) = 95.5
Retail Trade [34,216.5/34,953.7] = 97.89
Accommodation and restaurants [4,189.8/16,314.5] = 25.7
Road Transport [10,096.1/14,606.4] = 69.0
Rail, pipeline and other transport [2,944.8/4,992.2) = 58.99
Water transport [815.2/4,189.8] = 19.5
Air and space transport [439.6/11,495.7] = 3.8
Services to transport; storage [441.4/11,050.2] = 4.0
Insurance [68.7/8,352.6] = 0.82
Source: ABS (1996c, Table 1)3

21
= (1-.195)ADDMARG ij if i = 90,
= (1-.038)ADDMARG ij if i = 91,
= (1-.04)ADDMARG ij if i = 92,
= (1-.0082)ADDMARG ij if i = 97, and
= ADDMARG ij otherwise.
Where the matrix ADDMARGij is the original intermediate industry by industry flow matrix from
the input output table with margin matrices added on. This also needs to be performed on final
demand where PCAUGi, GGIAUGi, STOCAUGi and XAUGi in equations 15 to 18 refer to private
final consumption expenditure, general government gross fixed capital expenditure, increases in
stocks and exports respectively with margin flows added on. The reason why government
consumption expenditure is not included in the following calculations is because there are no
margin flows to government consumption expenditure reported in ABS (1996a, Tables 25-34).
Thus, final demand and total supply with margin flows redistributed are; for
Private final consumption expenditure,PCA i = (1-.955)PCAUG i if i = 83,
= (1-.9789)PCAUG i if i = 84,
= (1-.257)PCAUG i if i = 87,
= (1-.69)PCAUG i if i = 88,
= (1-.58988)PCAUG i if i = 89, (15)
= (1-.195)PCAUG i if i = 90,
= (1-.038)PCAUG i if i = 91,
= (1-.04)PCAUG i if i = 92,
= (1-.0082)PCAUG i if i = 97, and
= PCAUG i otherwise; for
General Government gross fixed capital expenditure,
GIA i = (1-.955)GGIAUG i if i = 83,
= (1-.9789)GGIAUG i if i = 84,
= (1-.257)GGIAUG i if i = 87,
= (1-.69)GGIAUG i if i = 88,
= (1-.58988)GGIAUG i if i = 89, (16)

22
= (1-.195)GGIAUG i if i = 90,
= (1-.038)GGIAUG i if i = 91,
= (1-.04)GGIAUG i if i = 92,
= (1-.0082)GGIAUG i if i = 97, and
= GGIAUG i otherwise; for
increase in stocks,ISA i = (1-.955)STOCAUG i if i = 83,
= (1-.9789)STOCAUG i if i = 84,
= (1-.257)STOCAUG i if i = 87,
= (1-.69)STOCAUG i if i = 88,
= (1-.58988)STOCAUG i if i = 89, (17)
= (1-.195)STOCAUG i if i = 90,
= (1-.038)STOCAUG i if i = 91,
= (1-.04)STOCAUG i if i = 92,
= (1-.0082)STOCAUG i if i = 97, and
= STOCAUG i otherwise; and for
exports,XA i = (1-.955)XAUG i if i = 83,
= (1-.9789)XAUG i if i = 84,
= (1-.257)XAUG i if i = 87,
= (1-.69)XAUG i if i = 88,
= (1-.58988)XAUG i if i = 89, (18)
= (1-.195)XAUG i if i = 90,
= (1-.038)XAUG i if i = 91,
= (1-.04)XAUG i if i = 92,
= (1-.0082)XAUG i if i = 96, and
= XAUG i otherwise.
Therefore, final demand (FDAi) and total supply (TSAi) are equivalent to the following
expressions,

23
where GCi refers to general government consumption expenditure,FDA PCAUG GC GGIAUG STOCAUG XAUGi i i i i i= + + + + (19)
and,
TSA AA FDAi ij ij
n
= +=
∑1
(20)
Inputs to margin services (columns) also need to be redistributed. In order to do this we need to
determine the increases in the total supply of each non-margin commodity due to margin
services. These can be found in the total supply vectors from each margin table. The rail transport
margin referred to in the following discussion includes pipeline margin services.
Once we have these vectors, non-margin inputs to margin services share of intermediate input
usage for each margin is calculated. This is due to the many inputs which margin services use. If,
as in the example in Section 3, margin services used only one input each, then each margins
share of that input to its total intermediate input usage would be one. Intermediate input usage is
calculated as the sum of all intermediate inputs, that is:
U AA for all jj iji
==∑
1
114
, (21)
The shares are calculated as follows:
SWT AA U if j
SRT AA U if j
SACC AA U if j
SRD AA U if j
SRL AA U if j
SWTR AA U if j
SAIR AA U if j
SSER AA U if j and
SINS AA
i ij j
i ij j
i ij j
i ij j
i ij j
i ij j
i ij j
i ij j
i
= × =
= × =
= × =
= × =
= × =
= × =
= × =
= × =
= ×
0 955 83
0 9789 84
0 257 87
0 69 88
0 58988 89
0195 90
0 038 91
0 04 92
0 0082
1
1
1
1
1
1
1
1
. /
. /
. /
. /
. /
. /
. /
. / ,
.
ij jU if j/ .1 97=
(22)
Multiply the shares by the increases in total supply due to the use of margin service:

24
WT SWT WSTS
RT SRT RSTS
ACC SACC RESTS
RD SRD ROADTS
RL SRL RAILTS
WTR SWTR WATRTS
AIR SAIR AIRTS
SER SSER PORTTS
INS SINS MARITS
ij i i
ij i i
ij i i
ij i i
ij i i
ij i i
ij i i
ij i i
ij i i
= ×
= ×
= ×
= ×
= ×
= ×
= ×
= ×
= ×
’
’
’
’
’
’
’
’
’
(23)
Now that the inputs to margin services have been redistributed they can be deleted from each
respective margin column in the AAij matrix, that is:
AB AA if j
AA if j
AA if j
AA if j
AA if j
AA if j
AA if j
AA if j
AA if j and
AA
ij ij
ij
ij
ij
ij
ij
ij
ij
ij
= − × =
= − × =
= − × =
= − × =
= − × =
= − × =
= − × =
= − × =
= − × =
=
( . ) ,
( . ) ,
( . ) ,
( . ) ,
( . ) ,
( . ) ,
( . ) ,
( . ) ,
( . ) ,
1 0 955 83
1 0 9789 84
1 0 257 87
1 0 69 88
1 0 58988 89
1 0195 90
1 0 038 91
1 0 04 92
1 0 0082 97
ij otherwise.
(24)
The final step is to add the matrices resulting from equations 18 and 19 to the resulting ABi
matrix from equation 24:
AC AB WT RT ACC RD RL WTR AIR SER INSij ij ij ij ij ij ij ij ij ij ij= + + + + + + + + + (25)
Now we have a new transformed absorption matrix denoted by ACij. Final demand categories are
FDAi (for total demand), PCAi (private final consumption expenditure), GCi (government
consumption expenditure), GIAi (general government gross fixed capital expenditure), ISAi

25
(increase in stocks), and XAi (exports) respectively. Total supply is TSAi. For convenience
rename these;
A AC
FD FDA
PC PCA
GC GC
GGI GIA
STOC ISA
X XA
TS TSA
ij ij
i i
i i
i i
i i
i i
i i
i i
=
====
===
4.1 Redistributing statutory incidence on margin services
Statutory incidence of taxes on margin services also need to be redistributed. To do this calculate
each non margin service industry’s usage of margin services. If Aij denotes the original
undistributed intermediate flow matrix, then intermediate usage of margin services is:
IU A A A A A
A A A A
A for i and and
A for any other i
i ijj
i i i i
i i i i
i
ijj
= − − − − − − − −
− − − − − − − −
− − =
=
=
=
∑
∑
1
114
83 84 87 88
89 90 91 92
97
1
114
1 0 955 1 0 9789 1 0 257 1 0 69
1 0 58988 1 0195 1 0 038 1 0 04
1 0 0082 83 84 87 88 89 90 91 92 97
( . ) ( . ) ( . ) ( . )
( . ) ( . ) ( . ) ( . )
( . ) , , , , , , , ,
.
(26)
26
SIS A IU if j
A IU if j
A IU if j
A IU if j
A IU if j
A IU if j
A IU if j
A IU if j
ij ij i
ij i
ij i
ij i
ij i
ij i
ij i
ij i
= − =
= − =
= − =
= − =
= − =
= − =
= − =
= − =
=
( . ) / ,
( . ) / ,
( . ) / ,
( . ) / ,
( . ) / ,
( . ) / ,
( . ) / ,
( . ) / ,
(
1 0 955 83
1 0 9789 84
1 0 257 87
1 0 69 88
1 0 58988 89
1 0195 90
1 0 038 91
1 0 04 92
1− =
=
=
0 0082 97
83 84 87 88 89 90 91 92 97
. ) / ,
/
A IU if j and
A IU otherwise
for i , , , , , , , and .
ij i
ij i
(27)
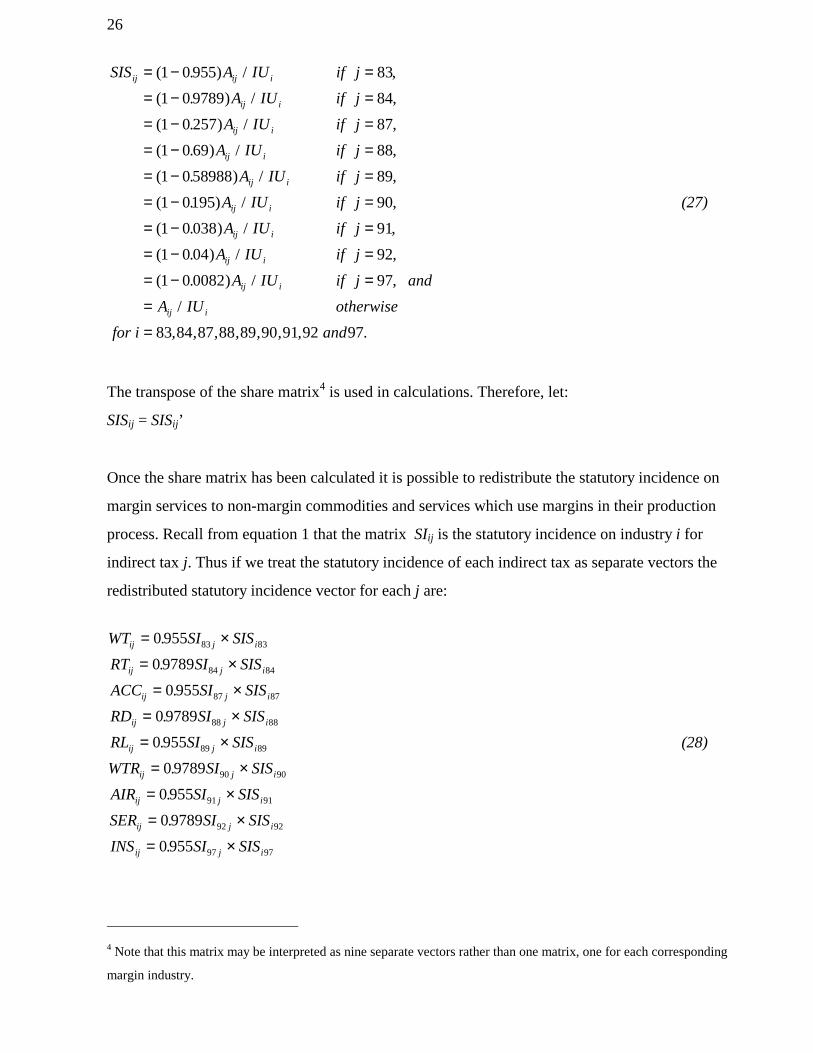
The transpose of the share matrix4 is used in calculations. Therefore, let:
SISij = SISij’
Once the share matrix has been calculated it is possible to redistribute the statutory incidence on
margin services to non-margin commodities and services which use margins in their production
process. Recall from equation 1 that the matrix SIij is the statutory incidence on industry i for
indirect tax j. Thus if we treat the statutory incidence of each indirect tax as separate vectors the
redistributed statutory incidence vector for each j are:
WT SI SIS
RT SI SIS
ACC SI SIS
RD SI SIS
RL SI SIS
WTR SI SIS
AIR SI SIS
SER SI SIS
INS SI SIS
ij j i
ij j i
ij j i
ij j i
ij j i
ij j i
ij j i
ij j i
ij j i
= ×
= ×
= ×
= ×
= ×
= ×
= ×
= ×
= ×
0 955
0 9789
0 955
0 9789
0 955
0 9789
0 955
0 9789
0 955
83 83
84 84
87 87
88 88
89 89
90 90
91 91
92 92
97 97
.
.
.
.
.
.
.
.
.
(28)
4 Note that this matrix may be interpreted as nine separate vectors rather than one matrix, one for each corresponding
margin industry.

27
The matrices referred to in equation 28 are calculated separately for each tax (denoted by the
subscript j). Thus rather than thinking of SIij and say, WTij, as matrices think of them as groups of
j vectors each of which should be treated separately in the calculation of each taxes final
incidence.
Margin services statutory incidence must be deleted from the corresponding row in SIij for each
tax:
SI SI if i
SI if i
SI if i
SI if i
SI if i
SI if i
SI if i
SI if i
SI if i and
SI otherwise
ij ij
ij
ij
ij
ij
ij
ij
ij
ij
ij
= − =
= − =
= − =
= − =
= − =
= − =
= − =
= − =
= − =
=
( . ) ,
( . ) ,
( . ) ,
( . ) ,
( . ) ,
( . ) ,
( . ) ,
( . ) ,
( . ) ,
.
1 0 955 83
1 0 9789 84
1 0 257 87
1 0 69 88
1 0 58988 89
1 0195 90
1 0 038 91
1 0 04 92
1 0 0082 97
(29)
Finally the results of equations 28 must be added to the statutory incidence vectors resulting from
equation 29 for each tax;
SI SI WT RT ACC RD WTR AIR SER INSij ij ij ij ij ij ij ij ij ij* = + + + + + + + + (30)
Again, j refers to a particular tax’s statutory incidence. In appendix 1 the SIij* vectors are denoted
as SIEXCi for excise, SIWSTi for the wholesale sales tax and so forth. These vector names simply
replace the j subscript in order to simplify the notation in the equations.
Given a new transformed input-output table and transformed statutory incidence, the method
outlined in Section 2 can be applied to calculate the final incidence of indirect taxes. The results
of this will be presented in the next section. See appendix 1 for the detail behind the equations
used to derive the incidence of various indirect taxes in Australia.

28
5. Final incidence of Australian indirect taxes in 1992-93
This section outlines the major results of combining the redistribution method of Section 4 with
the methodology to find final indirect tax incidence presented in Section 2.
Table 5.1 shows that over half of Australia’s tax incidence initially gets passed onto business
inputs in the first round. Thus, Australia’s indirect tax system is far from being a consumption
tax system in which first round incidence is largely restricted to consumption expenditure.
Table 5.1: First round incidence of Australian indirect taxes, 1992-93, ($m.)
Business inputs
Privatefinal
consumptionexpenditure
Exports Totalfinal
demand
Stamp duty 3745 430 132 669Wholesale sales tax 4833 4419 0 4419Municipal rates 977 1304 432 2236Primary production tax 261 3411 169 3720Payroll tax 3487 144 235 373Land tax 1038 535 72 899Business franchise fees 1108 3782 114 3889Financial institutions duty 1180 303 13 303Excise duties 5328 4445 0 4348Other indirect taxes 2878 2486 341 3317Total 24835 21260 1508 24173
Passing on this first round incidence on business inputs through to final demand round by round
and adding first round incidence of final demand gives the final incidence of Australian indirect
taxes presented in Table 5.2. Although private final consumption expenditure bears the majority
of the final burden of indirect taxes, exports and general government consumption and
investment are also significantly effected by the Australian indirect tax system. The table shows
that incidence on exports (in dollars) is relatively high for Australia’s traditional export industries
such as primary produce and wool; mining; and metal products. Private consumers bear the brunt
of indirect taxes through goods such as alcohol and tobacco products, petroleum and coal
products and motor vehicles and parts. Service industries like sport, gambling and recreational
services and accommodation, cafes and restaurants also have a high impact on private
consumers.

29
Table 5.2: Final incidence of Australian indirect taxes, 1992-93, ($m.)
Private finalconsumptionexpenditure
Generalgovernmentconsumptionexpenditure
Generalgovernmentgross fixed
capitalexpenditure
ExportsTotalfinal
demand
Sheep 4 0 0 423 422Grains 16 0 0 382 458Beef cattle 9 0 0 12 19Dairy cattle 0 0 0 0 1Pigs 1 0 0 0 1Poultry 46 0 0 0 45Other agriculture 536 0 0 162 689Services to agriculture; hunting and
trapping3 13 0 8 24
Forestry and logging 4 29 2 3 38Commercial fishing 168 8 0 42 205Coal; oil and gas 14 0 0 793 804Iron ores 0 0 0 315 312Non-ferrous metal ores 0 0 0 637 632Other mining 0 0 0 98 97Services to mining 0 9 0 5 15Meat and meat products 872 0 0 561 1375Dairy products 599 0 0 171 739Fruit and vegetable products 390 0 0 55 430Oils and fats 48 0 0 7 50Flour mill products and cereal foods 150 0 0 46 183Bakery products 452 0 0 4 442Confectionery 266 0 0 9 269Other food products 533 0 0 255 746Soft drinks, cordials and syrups 475 0 0 3 465Beer and malt 2041 0 0 33 2040Wine and spirits 1369 0 0 92 1442Tobacco products 3223 0 0 6 3169Wool scouring 0 0 0 150 145Textile fibres, yarns and woven fabrics 60 0 0 9 75Textile products 183 0 4 11 206Knitting mill products 133 0 0 3 143Clothing 549 0 0 9 576Footwear 153 0 0 2 160Leather and leather products 72 0 0 26 100Sawmill products 0 0 0 37 34Plywood, veneer and fabricated wood 0 0 0 10 9Other wood products 12 0 2 2 17Pulp, paper and paperboard 32 0 0 17 64Paperboard containers; paper bags and
sacks2 0 0 5 20
Other paper products 106 0 0 3 116Printing and services to printing 300 9 0 16 339Publishing; recorded media and
publishing551 0 5 14 571
Petroleum and coal products 3100 0 0 227 3292Fertilisers 17 0 0 1 26Other basic chemicals 1 0 0 66 68
continued

30
Private finalconsumptionexpenditure
Generalgovernmentconsumptionexpenditure
Generalgovernmentgross fixed
capitalexpenditure
ExportsTotalfinal
demand
Paints 1 0 0 4 9Medicinal and pharmaceutical products;
pesticides408 0 0 49 478
Soap and other detergents 250 0 0 6 262Cosmetics and toiletry preparations 340 0 0 4 348Other chemical products 88 0 0 15 105Rubber products 336 0 0 10 354Plastic products 197 0 0 21 238Glass and glass products 30 0 0 6 37Ceramic products 57 0 0 4 62Cement and lime 0 0 0 2 -1Concrete slurry 0 0 0 0 -1Plaster and other concrete products 0 0 0 3 4Other non-metallic mineral products 0 0 0 8 7Iron and steel 0 0 0 129 124Basic non-ferrous metal and products 10 0 0 782 780Structural metal products 0 0 2 10 11Sheet metal products 35 0 2 12 62Fabricated metal products 210 0 2 26 253Motor vehicles and parts; other transport
equipment1795 0 82 180 2009
Ships and boats 26 0 0 40 67Railway equipment 0 0 0 2 5Aircraft 2 0 0 13 15Photographic and scientific equipment 345 0 25 51 421Electronic equipment 631 0 123 86 858Household appliances 216 0 0 15 243Other electrical equipment 97 0 3 42 137Agricultural machinery 22 0 0 5 27Mining and construction machinery;
lifting and material handling equipment0 0 11 22 32
Other machinery and equipment 8 0 2 56 65Prefabricated buildings 0 0 3 2 5Furniture 345 0 29 7 403Other manufacturing 576 0 0 48 628Electricity supply 346 0 0 2 347Gas supply 182 0 0 0 182Water supply; sewerage and drainage
services0 17 0 1 18
Residential building construction 0 0 37 2 40Other construction 0 163 675 4 841Wholesale trade 31 0 3 16 51Retail trade 68 0 0 0 68Mechanical repairs 605 0 0 1 605Other repairs 106 0 0 2 108Accommodation, cafes and restaurants 1067 0 0 0 1067Road transport 205 7 2 72 285Rail, pipeline and other transport 73 0 0 76 150Water transport 0 0 0 0 0Air and space transport 0 0 0 0 0
continued
Table 5.2 (cont.): Final incidence of Australian indirect taxes, 1992-93, ($m.)

31
Private finalconsumptionexpenditure
Generalgovernmentconsumptionexpenditure
Generalgovernmentgross fixed
capitalexpenditure
ExportsTotalfinal
demand
Services to transport; storage 55 419 1 227 702Communication services 393 1 0 67 461Banking 584 0 0 9 593Non-bank finance 185 3 0 25 213Financial asset investors 0 0 0 0 0Insurance 1250 46 0 44 1341Services to finance, investment and
insurance74 0 0 19 93
Ownership of dwellings 6580 3 0 0 6583Other property services 62 1 0 4 67Scientific research, technical and
computer services12 70 0 68 150
Legal, accounting, marketing and businessmanagement services
143 24 0 53 221
Other business services 10 49 0 17 76Government administration 36 1287 0 0 1323Defence 0 654 0 10 663Education 161 498 0 25 684Health services 782 633 0 1 1416Community services 231 168 0 0 399Motion picture, radio and television
services48 83 0 0 131
Libraries, museums and the arts 47 64 0 3 113Sport, gambling and recreational services 1993 199 0 6 2198Personal services 515 12 0 1 527Other services 91 301 0 0 392Total 38446 4769 1017 7146 51231
Note: Total final demand includes increases (or decreases) in stocks thus it may be equivalent to the sum of the finaldemand components displayed in this table.
Table 5.3 provides the total effective tax rates on each final demand category by industry. For a
more detailed breakdown of effective tax rates on final demand by type of tax see Appendix 2.
The results in this table support previous comments made about the dollar value of final
incidence: exports are particularly hard hit for traditional export industries, private consumers
face high effective tax rates for alcohol and tobacco products; petroleum and coal products;
motor vehicles and parts; sport, gambling and recreational services and accommodation, cafes
and restaurants. Interestingly, consumers of tobacco products face a tax mark up of nearly 230
per cent. Also, private consumers face high effective tax rates for printing services and ‘other
chemicals’.
Table 5.2 (cont.): Final incidence of Australian indirect taxes, 1992-93, ($m.)

32
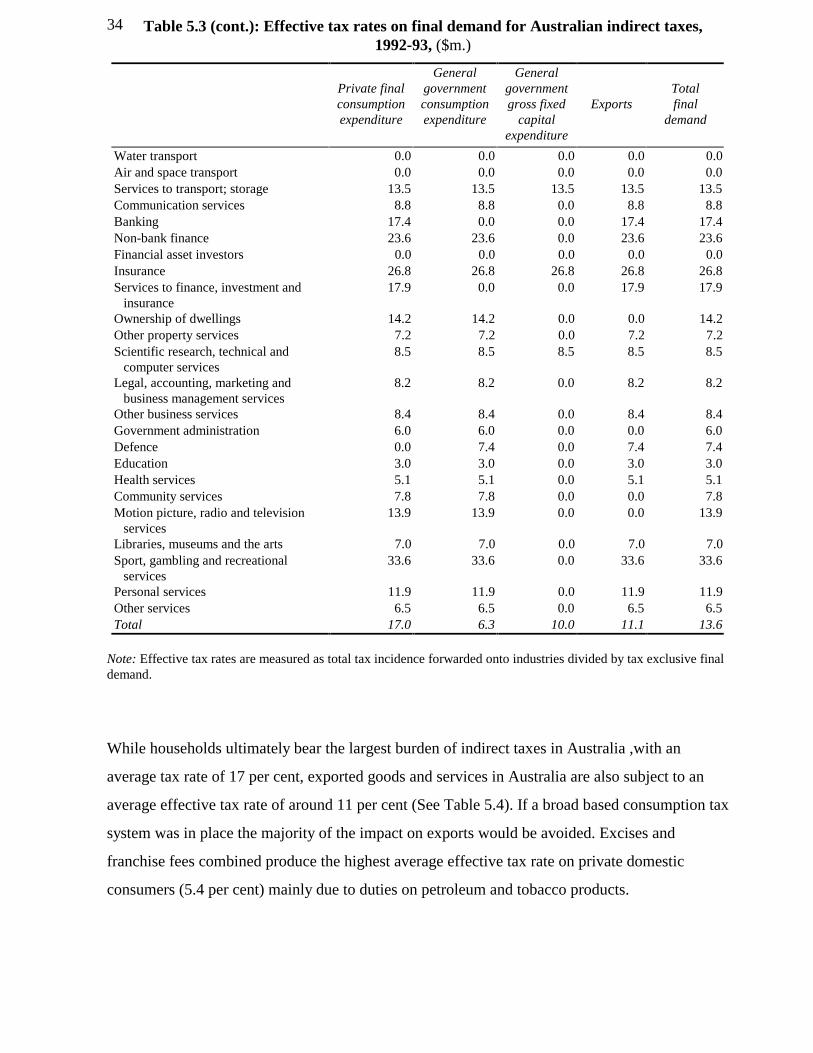
Table 5.3: Effective tax rates on final demand for Australian indirect taxes, 1992-93, percent
Private finalconsumptionexpenditure
Generalgovernmentconsumptionexpenditure
Generalgovernmentgross fixed
capitalexpenditure
ExportsTotalfinal
demand
Sheep 18.9 0.0 0.0 18.9 18.9Grains 15.4 0.0 0.0 15.4 15.4Beef cattle 14.8 0.0 0.0 14.8 14.8Dairy cattle 11.9 0.0 0.0 0.0 11.9Pigs 15.3 0.0 0.0 15.3 15.3Poultry 11.6 0.0 0.0 11.6 11.6Other agriculture 12.2 0.0 0.0 12.2 12.2Services to agriculture; hunting and
trapping11.1 11.1 0.0 11.1 11.1
Forestry and logging 12.2 12.2 12.2 12.2 12.2Commercial fishing 17.3 17.3 0.0 17.3 17.3Coal; oil and gas 9.0 0.0 0.0 7.5 7.5Iron ores 0.0 0.0 0.0 10.8 10.8Non-ferrous metal ores 0.0 0.0 0.0 11.0 11.0Other mining 11.2 0.0 0.0 11.2 11.2Services to mining 0.0 11.0 0.0 11.0 11.0Meat and meat products 13.0 0.0 0.0 13.0 13.0Dairy products 16.5 0.0 0.0 14.4 16.1Fruit and vegetable products 13.3 0.0 0.0 11.8 13.1Oils and fats 8.6 0.0 0.0 8.6 8.6Flour mill products and cereal foods 11.7 0.0 0.0 11.4 11.7Bakery products 11.4 0.0 0.0 10.2 11.4Confectionery 15.4 0.0 0.0 9.7 15.3Other food products 12.1 0.0 0.0 10.3 11.5Soft drinks, cordials and syrups 19.2 0.0 0.0 10.8 19.5Beer and malt 41.8 0.0 0.0 19.6 41.9Wine and spirits 43.1 0.0 0.0 30.8 42.2Tobacco products 227.4 0.0 0.0 132.1 230.3Wool scouring 0.0 0.0 0.0 15.3 15.3Textile fibres, yarns and woven fabrics 7.8 0.0 0.0 6.3 7.5Textile products 9.7 0.0 7.5 7.5 9.4Knitting mill products 6.5 0.0 0.0 6.5 6.5Clothing 7.6 0.0 0.0 7.5 7.5Footwear 6.7 0.0 0.0 6.7 6.7Leather and leather products 10.6 0.0 0.0 8.0 9.7Sawmill products 9.1 0.0 0.0 9.1 9.1Plywood, veneer and fabricated wood 9.9 0.0 0.0 9.9 9.9Other wood products 13.8 0.0 9.1 9.1 12.0Pulp, paper and paperboard 26.7 0.0 0.0 10.2 14.8Paperboard containers; paper bags and
sacks21.8 0.0 0.0 12.2 12.7
Other paper products 21.6 0.0 0.0 12.3 20.3Printing and services to printing 35.3 17.5 0.0 17.5 31.6Publishing; recorded media and
publishing12.8 0.0 8.5 8.5 12.6
Petroleum and coal products 63.0 0.0 0.0 20.0 56.0Fertilisers 10.0 0.0 0.0 9.1 9.7
continued

33
Private finalconsumptionexpenditure
Generalgovernmentconsumptionexpenditure
Generalgovernmentgross fixed
capitalexpenditure
ExportsTotalfinal
demand
Other basic chemicals 10.5 0.0 0.0 8.3 8.3Paints 8.9 0.0 0.0 8.9 8.9Medicinal and pharmaceutical products;
pesticides9.5 0.0 0.0 9.2 9.5
Soap and other detergents 17.1 0.0 0.0 8.6 16.3Cosmetics and toiletry preparations 16.0 0.0 0.0 8.8 15.7Other chemical products 51.0 0.0 0.0 9.0 29.2Rubber products 25.4 0.0 0.0 10.7 23.7Plastic products 14.3 0.0 0.0 9.7 13.2Glass and glass products 13.4 0.0 0.0 10.1 12.6Ceramic products 12.5 0.0 0.0 8.8 12.1Cement and lime 0.0 0.0 0.0 12.5 12.5Concrete slurry 0.0 0.0 0.0 0.0 14.4Plaster and other concrete products 0.0 0.0 0.0 10.9 10.9Other non-metallic mineral products 9.2 0.0 0.0 9.2 9.2Iron and steel 9.8 0.0 0.0 9.8 9.8Basic non-ferrous metal and products 10.9 0.0 0.0 10.9 10.9Structural metal products 0.0 0.0 8.9 8.9 8.9Sheet metal products 22.2 0.0 14.9 14.9 18.3Fabricated metal products 30.7 0.0 8.8 8.8 21.6Motor vehicles and parts; other
transport equipment30.1 0.0 14.8 14.8 27.1
Ships and boats 19.9 0.0 9.3 9.3 11.8Railway equipment 0.0 0.0 12.0 12.0 12.0Aircraft 3.5 0.0 3.5 3.5 3.5Photographic and scientific equipment 26.1 0.0 9.5 9.5 19.8Electronic equipment 20.3 0.0 7.5 7.5 14.0Household appliances 14.0 0.0 8.8 8.8 13.1Other electrical equipment 16.4 0.0 11.9 11.9 14.8Agricultural machinery 10.8 0.0 6.7 6.7 9.7Mining and construction machinery;
lifting and material handlingequipment
0.0 0.0 7.3 7.3 7.3
Other machinery and equipment 16.4 0.0 7.9 7.9 8.4Prefabricated buildings 0.0 0.0 9.8 9.8 9.8Furniture 10.6 0.0 9.5 9.5 10.4Other manufacturing 20.4 0.0 10.5 10.5 18.9Electricity supply 8.1 0.0 0.0 8.1 8.1Gas supply 21.0 0.0 0.0 0.0 21.0Water supply; sewerage and drainage
services0.0 9.7 0.0 9.7 9.7
Residential building construction 0.0 0.0 16.9 16.9 16.9Other construction 0.0 10.1 10.1 10.1 10.1Wholesale trade 10.0 10.0 10.0 10.0 10.0Retail trade 9.6 0.0 0.0 0.0 9.6Mechanical repairs 10.0 0.0 0.0 10.0 10.0Other repairs 8.6 0.0 0.0 8.6 8.6Accommodation, cafes and restaurants 11.1 0.0 0.0 0.0 11.1Road transport 15.2 15.2 15.2 15.2 15.2Rail, pipeline and other transport 9.7 0.0 9.7 9.7 9.7
continued
Table 5.3 (cont.): Effective tax rates on final demand for Australian indirect taxes,1992-93, ($m.)
34
Private finalconsumptionexpenditure
Generalgovernmentconsumptionexpenditure
Generalgovernmentgross fixed
capitalexpenditure
ExportsTotalfinal
demand
Water transport 0.0 0.0 0.0 0.0 0.0Air and space transport 0.0 0.0 0.0 0.0 0.0Services to transport; storage 13.5 13.5 13.5 13.5 13.5Communication services 8.8 8.8 0.0 8.8 8.8Banking 17.4 0.0 0.0 17.4 17.4Non-bank finance 23.6 23.6 0.0 23.6 23.6Financial asset investors 0.0 0.0 0.0 0.0 0.0Insurance 26.8 26.8 26.8 26.8 26.8Services to finance, investment and
insurance17.9 0.0 0.0 17.9 17.9
Ownership of dwellings 14.2 14.2 0.0 0.0 14.2Other property services 7.2 7.2 0.0 7.2 7.2Scientific research, technical and
computer services8.5 8.5 8.5 8.5 8.5
Legal, accounting, marketing andbusiness management services
8.2 8.2 0.0 8.2 8.2
Other business services 8.4 8.4 0.0 8.4 8.4Government administration 6.0 6.0 0.0 0.0 6.0Defence 0.0 7.4 0.0 7.4 7.4Education 3.0 3.0 0.0 3.0 3.0Health services 5.1 5.1 0.0 5.1 5.1Community services 7.8 7.8 0.0 0.0 7.8Motion picture, radio and television
services13.9 13.9 0.0 0.0 13.9
Libraries, museums and the arts 7.0 7.0 0.0 7.0 7.0Sport, gambling and recreational
services33.6 33.6 0.0 33.6 33.6
Personal services 11.9 11.9 0.0 11.9 11.9Other services 6.5 6.5 0.0 6.5 6.5Total 17.0 6.3 10.0 11.1 13.6
Note: Effective tax rates are measured as total tax incidence forwarded onto industries divided by tax exclusive finaldemand.
While households ultimately bear the largest burden of indirect taxes in Australia ,with an
average tax rate of 17 per cent, exported goods and services in Australia are also subject to an
average effective tax rate of around 11 per cent (See Table 5.4). If a broad based consumption tax
system was in place the majority of the impact on exports would be avoided. Excises and
franchise fees combined produce the highest average effective tax rate on private domestic
consumers (5.4 per cent) mainly due to duties on petroleum and tobacco products.
Table 5.3 (cont.): Effective tax rates on final demand for Australian indirect taxes,1992-93, ($m.)

35
Table 5.4: Final incidence of Australian indirect taxes by type of indirect tax, 1992-93
Private finalconsumptionexpenditure
Governmentconsumptionexpenditure
GeneralGovernment gross
fixed capitalexpenditure
Exports
$m.
Averageeffectivetax rate
(%)$m.
Averageeffectivetax rate
(%)$m.
Averageeffectivetax rate
(%)$m.
Averageeffectivetax rate
(%)Wholesale sales tax 8059 3.6 597 0.8 208 2.0 927 1.4Excise and Franchise fees 12136 5.4 1059 1.4 149 1.4 1986 3.1 -petroleum products 6043 2.7 876 1.2 142 1.4 1858 2.9 -tobacco products 2978 1.3 0 0.0 0 0 5 0.0 -alcohol 1555 0.7 12 0.0 0 0 46 0.1 -other excises and franchise fees
1560 0.7 171 0.2 7 0 77 0.1
Stamp duties 3236 1.4 518 0.7 130 1.3 908 1.4Payroll tax 3698 1.6 844 1.1 301 3.0 1152 1.8FID 1216 0.5 127 0.2 30 0.3 179 0.3Primary production taxes 306 0.1 7 0.0 1 0.0 335 0.5Land tax 1253 0.6 442 0.6 60 0.6 291 0.5Municipal rates 4106 1.8 221 0.3 36 0.4 411 0.6Other indirect taxes 4436 2.0 953 1.3 846 1.2 956 1.5Total indirect taxes 38446 17.0 4769 6.3 1017 10.0 7146 11.1

36
6. Concluding comment
A word of caution in interpreting the results presented in this paper. These results are based on
the premise that all indirect taxes are fully passed forward. This may be an unrealistic assumption
as some industries are not able to fully or even partially pass on the increased costs of production
due to these taxes. Keeping this in mind some major findings of this research are presented.
Households ultimately bear the major burden of Australian indirect taxes in this analysis. Exports
also face high increases in costs due to the Australian indirect tax system. Business inputs,
investment and exports would not be taxed under a broad based consumption tax.
Necessity items such as food and clothing, health and education services are not spared from the
ultimate burden of current indirect taxes. This is unknown to the majority of Australians as they
do not realise that the taxes imposed on business inputs in the production of all goods and
services are eventually passed onto households through higher prices.
Also apparent from the results of this study are the wide dispersions in the final incidence of
indirect taxes on various goods and services. These variations create distortions in decision
making which lead to losses in social welfare. A broad based consumption tax eliminates these
distortions if a single tax rate covers all goods and services.
37
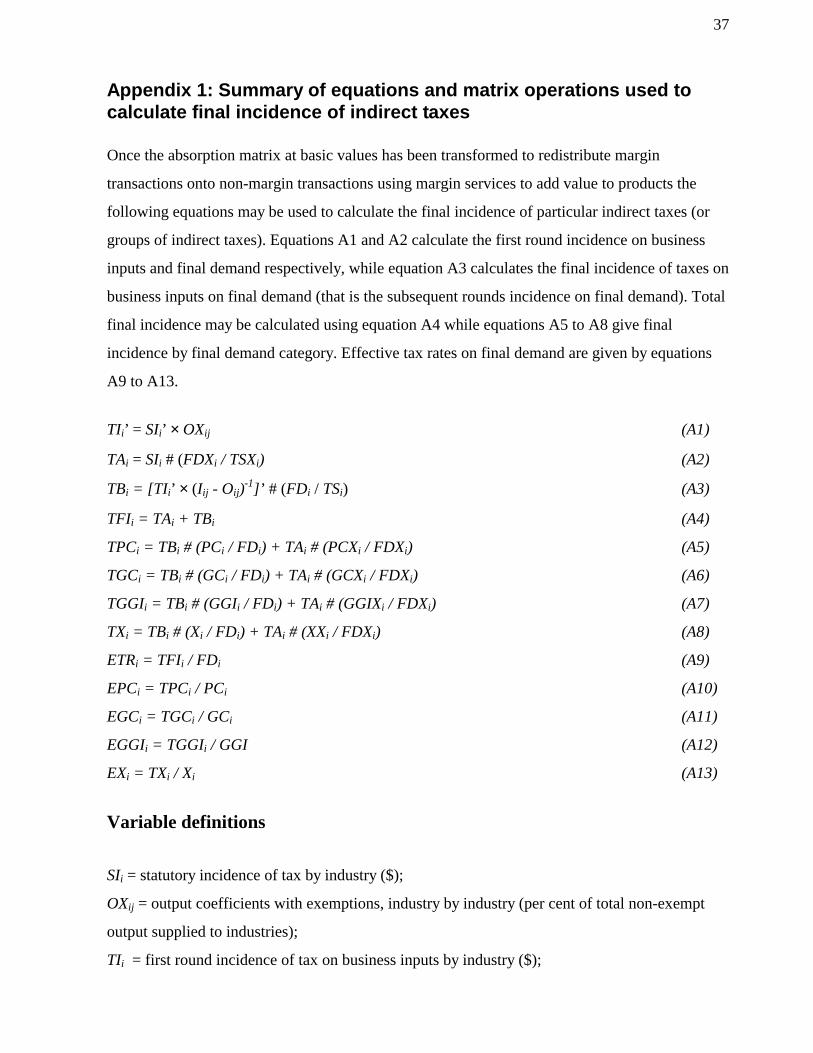
Appendix 1: Summary of equations and matrix operations used tocalculate final incidence of indirect taxes
Once the absorption matrix at basic values has been transformed to redistribute margin
transactions onto non-margin transactions using margin services to add value to products the
following equations may be used to calculate the final incidence of particular indirect taxes (or
groups of indirect taxes). Equations A1 and A2 calculate the first round incidence on business
inputs and final demand respectively, while equation A3 calculates the final incidence of taxes on
business inputs on final demand (that is the subsequent rounds incidence on final demand). Total
final incidence may be calculated using equation A4 while equations A5 to A8 give final
incidence by final demand category. Effective tax rates on final demand are given by equations
A9 to A13.
TIi’ = SIi’ × OXij (A1)
TAi = SIi # (FDXi / TSXi) (A2)
TBi = [TIi’ × (Iij - Oij)-1]’ # (FDi / TSi) (A3)
TFIi = TAi + TBi (A4)
TPCi = TBi # (PCi / FDi) + TAi # (PCXi / FDXi) (A5)
TGCi = TBi # (GCi / FDi) + TAi # (GCXi / FDXi) (A6)
TGGIi = TBi # (GGIi / FDi) + TAi # (GGIXi / FDXi) (A7)
TXi = TBi # (Xi / FDi) + TAi # (XXi / FDXi) (A8)
ETRi = TFIi / FDi (A9)
EPCi = TPCi / PCi (A10)
EGCi = TGCi / GCi (A11)
EGGIi = TGGIi / GGI (A12)
EXi = TXi / Xi (A13)
Variable definitions
SIi = statutory incidence of tax by industry ($);
OXij = output coefficients with exemptions, industry by industry (per cent of total non-exempt
output supplied to industries);
TIi = first round incidence of tax on business inputs by industry ($);

38
TAi = first round incidence of tax on final demand by industry ($);
FDXi = non-exempt final demand by industry ($);
TSXi = total non-exempt supply by industry ($);
Oij = output coefficients without exemptions, industry by industry (per cent of total output
supplied to industries);
FDi = final demand by industry ($);
TSi = total supply by industry ($);
Iij = identity matrix, industry by industry;
TBi = final incidence of tax on business inputs on final demand by industry ($);
TFIi = total final incidence of tax on final demand by industry ($);
TPCi = total final incidence of tax on private final consumption expenditure by industry ($);
TGCi = total final incidence of tax on government consumption expenditure by industry ($);
TGGIi = total final incidence of tax on general government gross fixed capital expenditure by
industry ($);
TXi = total final incidence of tax on exports by industry ($);
ETRi = effective tax rates of tax on final demand by industry (per cent);
EPCi = effective tax rates of tax on private final consumption expenditure by industry (per cent);
EGCi = effective tax rates of tax on government consumption expenditure by industry (per cent);
EGGIi = effective tax rates of tax on general government gross fixed capital expenditure by
industry (per cent);
EXi = effective tax rates of tax on exports by industry ($);
PCi = private final consumption expenditure by industry ($);
GCi = government consumption expenditure by industry ($);
GGIi = general government gross fixed capital expenditure by industry ($);
Xi = exports by industry ($);
i = j = 113 for short run incidence; and i = j = 114 for long run incidence.
Matrix operations used
‘ = the transpose of a vector or matrix;
× = matrix multiplication;
/ = element by element division; and
# = element by element multiplication known as the Schur or Hadamard product.
39
Appendix 2: 1992-93 Input output industry classification
Industry i = j Description of industry
1 Sheep2 Grains3 Beef cattle4 Dairy cattle5 Pigs6 Poultry7 Other agriculture8 Services to agriculture; hunting and trapping9 Forestry and logging10 Commercial fishing11 Coal; oil and gas12 Iron ores13 Non-ferrous metal ores14 Other mining15 Services to mining16 Meat and meat products17 Dairy products18 Fruit and vegetable products19 Oils and fats20 Flour mill products and cereal foods21 Bakery products22 Confectionery23 Other food products24 Soft drinks, cordials and syrups25 Beer and malt26 Wine and spirits27 Tobacco products28 Wool scouring29 Textile fibres, yarns and woven fabrics30 Textile products31 Knitting mill products32 Clothing33 Footwear34 Leather and leather products35 Sawmill products36 Plywood, veneer and fabricated wood37 Other wood products38 Pulp, paper and paperboard39 Paperboard containers; paper bags and sacks40 Other paper products41 Printing and services to printing42 Publishing; recorded media and publishing43 Petroleum and coal products44 Fertilisers45 Other basic chemicals46 Paints47 Medicinal and pharmaceutical products; pesticides48 Soap and other detergents49 Cosmetics and toiletry preparations50 Other chemical products
continued

40
Industry i = j Description of industry51 Rubber products52 Plastic products53 Glass and glass products54 Ceramic products55 Cement and lime56 Concrete slurry57 Plaster and other concrete products58 Other non-metallic mineral products59 Iron and steel60 Basic non-ferrous metal and products61 Structural metal products62 Sheet metal products63 Fabricated metal products64 Motor vehicles and parts; other transport equipment65 Ships and boats66 Railway equipment67 Aircraft68 Photographic and scientific equipment69 Electronic equipment70 Household appliances71 Other electrical equipment72 Agricultural machinery73 Mining and construction machinery; lifting and material handling
equipment74 Other machinery and equipment75 Prefabricated buildings76 Furniture77 Other manufacturing78 Electricity supply79 Gas supply80 Water supply; sewerage and drainage services81 Residential building construction82 Other construction83 Wholesale trade84 Retail trade85 Mechanical repairs86 Other repairs87 Accommodation, cafes and restaurants88 Road transport89 Rail, pipeline and other transport90 Water transport91 Air and space transport92 Services to transport; storage93 Communication services94 Banking95 Non-bank finance96 Financial asset investors97 Insurance98 Services to finance, investment and insurance99 Ownership of dwellings100 Other property services101 Scientific research, technical and computer services102 Legal, accounting, marketing and business management services103 Other business services104 Government administration105 Defence
continued

41
Industry i = j Description of industry106 Education107 Health services108 Community services109 Motion picture, radio and television services110 Libraries, museums and the arts111 Sport, gambling and recreational services112 Personal services113 Other services114 Capital (long run model)

42
Appendix 3: Calculating final incidence and effective tax rates of
indirect taxes
A3.1 Wholesale sales tax
Wholesale Sales Tax first-round incidence data are available direct from ABS (1996a, Table 36).
Thus, we already have TIi and TAi outlined in Section 2 (first round incidence on business inputs
and final demand respectively). The notes below refer to the long run model of 114 commodities
by 114 industries. The short run model refers to 113 industries and thus matrices need to be
adjusted before calculating incidence.
We use an identity matrix denoted by Iij for i = j = 1, ... , m where m = 114.
Flowing tax on Business Inputs through to final demand (steps to calculate TB vector):
Oij = each row of Aij matrix divided by total supply of that row or industry
Zi = FDi/TSi
TBWSTi = [TIWSTi’× (Iij - Oij)-1]’# Zi
Total final incidence of tax by final demand category:
TFIWSTi = TAWSTi + TBWSTi
TPCWSTi =TBWSTi # (PCi /FDi) + TAWSTi
TGCWSTi = TBWSTi # (GCi /FDi)
TXWSTi = TBWSTi # (Xi /FDi)
TGGIWSTi = TBWSTi # (GGIi /FDi)
Effective Tax Rates for each final demand component:
ETRWSTi = TFIWSTi /FDi
EPCWSTi = TPCWSTi / PCi
EGCWSTi = TGCWSTi / GCi
EXWSTi = TXWSTi / Xi
EGGIWSTi = TGGIWSTi / GGIi

43
A3.2 Financial institutions duty (FID)
For FID we need to work out first round incidence outlined in Chisholm’s method. Thus, an
exemptions matrix is needed. This matrix comprises the full industry by industry flow matrix but
with flows between exempt industries set at zero. Where there is only a partial exemption for one
item out of a range of items covered by a particular industry classification, only a partial
adjustment is made. Summing across the rows of the exemptions matrix and adding in final
demand gives a vector of total non-exempt supply for each (supplying) industry. In some
instances final demand categories are exempt, for instance, government consumption and exports
are exempt from excise. In this situation the affected final demand categories are also excluded
when calculating total non-exempt supply. However, for taxes other than wholesale sales tax and
excise duties no categories of final demand will be exempt in the first round.
Exemptions matrix:
EFID A if i or
if j or
A if j
A if j
A if j and
otherwise
ij ij
ij
ij
ij
= =
= == =
= − =
= − =
=
94 95
0 104 105
0 5 106
1 0 3496 107
1 0 016 113
0
,
,
. ,
( . ) ,
( . ) ,
.
Final non-exempt demand:
FDXFID FD if i or and
otherwisei i= =
=94 95
0
,
.
Total non-exempt supply:
TSXFID EFID FDXFID ii ijj
i= + ∀=
∑1
114
,
OXFIDij = divide each element of row in EFIDij by total non-exempt supply for that row or
supplying industry.
Also needed is the statutory incidence vector:
SIFIDi

44
First round incidence on business inputs vector (TIi):
TIFIDi’ = SIFIDi’ × OXFIDij
First round incidence on final demand (TAi):
TAFIDi = SIFIDi # (FDXFIDi / TSXFIDi)
Flowing tax on Business Inputs through to final demand (steps to calculate TB vector):
TBFIDi = [TIFIDi’ × (Iij - Oij)-1]’# Zi
Total final incidence of tax by final demand category:
TFIFIDi = TAFIDi + TBFIDi
TPCFIDi = TAFIDi # (PCi / FDi) + TAFIDi # (PCXi / FDXi)
TGCFIDi = TAFIDi # (GCi / FDi)+ TAFIDi #( GCXi / FDXi)
TXFIDi = TAFIDi # (Xi / FDi)+ TAFIDi #( XXi / FDXi)
TGGIFIDi = TAFIDi # (GGIi / FDi)+ TAFIDi #( GGIXi / FDXi)
Effective Tax Rates for each final demand component:
ETRFIDi =TFIFIDi / FDi
EPCFIDi = TPCFIDi / PCi
EGCFIDi = TGCFIDi / GCi
EXFIDi = TXFIDi / Xi
EGGIFIDi = TGGIFIDi / GGIi
A3.3 Excise duties
Exemptions matrix:
EEXC A if i or and
otherwise
ij ij= =
=
11 25 26 27 43
0
, , , ,
.
Final non-exempt demand:
FDXEXC PC if i or and
otherwisei i= =
=11 25 26 27 43
0
, , , ,
Total non-exempt supply:

45
TSXEXC EEXC FDXEXC ii ijj
i= + ∀=
∑1
114
,
OXEXCij = divide each element of row in EEXCij by total non-exempt supply for that row or
supplying industry.
Also needed is the statutory incidence vector (114x1): SIEXCi
First round incidence on business inputs vector (TIi):
TIEXCi’= SIEXCi’ × OXEXCij
First round incidence on final demand (TAi):
TAEXCi’= SIEXCi # (FDXEXCi / TSXEXCi)
Flowing tax on Business Inputs through to final demand (steps to calculate TB vector):
TBEXCi = [TIEXCi’ × (Iij - Oij)-1]’ # Zi
Total final incidence of tax by final demand category:
TFIEXCi = TAEXCi + TBEXCi
TPCEXCi= TBEXCi # (PCi / FDi) + TAEXCi
TGCEXCi = TBEXCi # (GCi / FDi)
TXEXCi = TBEXCi # (Xi / FDi)
TGGIEXCi = TBEXCi # (GGIi / FDi)
Effective Tax Rates for each final demand component:
ETREXCi = TFIEXCi / FDi
EPCEXCi = TPCEXCi / PCi
EGCEXCi = TGCEXCi / GCi
EXEXCi = TXEXCi / Xi
EGGIEXCi = TGGIEXCi / GGIi

46
A3.4 Business franchise fees
Exemptions matrix:
EFRAN A if i or and
otherwise
ij ij= =
=
25 26 27 43 79 87 111
0
, , , , , ,
.
Final non-exempt demand:
FDXFRAN FD if i or and
otherwisei i= =
=25 26 27 43 79 87 111
0
, , , , , ,
Total non-exempt supply:
TSXFRAN EFRAN FDXFRAN ii ijj
i= + ∀=
∑1
114
,
OXFRANij = divide each element of row in EFRANij by total non-exempt supply for that row or
supplying industry.
Also needed is the statutory incidence vector: SIFRANi
First round incidence on business inputs vector (TIi)
TIFRANi’ = SIFRANi’ × OXFRANij
First round incidence on final demand (TAi):
TAFRANi = SIFRANi # (FDXFRANi / TSXFRANi)
Flowing tax on Business Inputs through to final demand (steps to calculate TB vector):
TBFRANi = [TIFRANi’ × (Iij - Oij)-1]’ # Zi
Total final incidence of tax by final demand category:
TFIFRANi = TAFRANi + TBFRANi
TPCFRANi = TBFRANi # (PCi / FDi) + TAFRANi # ( PCXi / FDXi)
TGCFRANi = TBFRANi # ( GCi / FDi) + TAFRANi # (GCXi / FDXi)
TXFRANi = TBFRANi # ( Xi / FDi) + TAFRANi # (XXi / FDXi)
TGGIFRANi = TBFRANi # ( GGIi / FDi) + TAFRANi # (GGIXi / FDXi)

47
Effective Tax Rates for each final demand component:
ETRFRANi = TFIFRANi / FDi
EPCFRANi = TPCFRANi / PCi
EGCFRANi = TGCFRANi / GCi
EXFRANi = TXFRANi / Xi
EGGIFRANi = TGGIFRANi / GGIi
A3.5 Land tax
Exemptions matrix:
ELAN for j or
A for j
A for j
A for j and
A otherwise
ij
ij
ij
ij
ij
= =
= =
= − =
= − =
=
0 1 2 3 4 5 6 7 8 9 10 105
0 2 106
1 0 3496 107
1 0 016 113
, , , , , , , , , , ,
. ,
( . ) ,
( . ) ,
.
Final non-exempt demand:
FDXLAN FDi i=
Total non-exempt supply:
TSXLAN ELAN FDXLAN ii ijj
i= + ∀=
∑1
114
,
OXLANij = divide each element of row in ELANij by total non-exempt supply for that row or
supplying industry.
Also needed is the statutory incidence vector: SILANi
First round incidence on business inputs vector (TIi):
TILANi’ = SILANi’ × OXLANij
First round incidence on final demand (TAi):
TALANi = SILANi # (FDXLANi / TSXLANi)

48
Flowing tax on Business Inputs through to final demand (steps to calculate TB vector):
TBLANi = [TILANi’ × (Iij - Oij)-1]’ # Zi
Total final incidence of tax by final demand category:
TFILANi = TALANi + TBLANi
TPCLANi = TBLANi # (PCi / FDi)+ TALANi # (PCXi / FDXi)
TGCLANi = TBLANi # (GCi / FDi)+ TALANi # (GCXi / FDXi)
TXLANi = TBLANi # (Xi / FDi)+ TALANi # (XXi / FDXi)
TGGILANi = TBLANi # (GGIi / FDi)+ TALANi # (GGIXi / FDXi)
Effective Tax Rates for each final demand component:
ETRLANi = TFILANi / FDi
EPCLANi = TPCLANi / PCi
EGCLANi = TGCLANi / GCi
EXLANi = TXLANi / Xi
EGGILANi = TGGILANi / GGIi
6.1.1 Payroll tax
Exemptions matrix:
EPAY if j or
A if j
A if j
A if j
A if j and
A otherwise
ij
ij
ij
ij
ij
ij
= =
= − =
= =
= − =
= − =
=
0 105 114
1 0169 104
0 5 106
1 0 3496 107
1 0 016 113
, ,
( . ) ,
. ,
( . ) ,
( . ) ,
.
Final non-exempt demand:
FDXPAY FDi i=
Total non-exempt supply:
TSXPAY EPAY FDXPAY ii ijj
i= + ∀=
∑1
114
,

49
OXPAYij = divide each element of row in EPAYi by total non-exempt supply for that row or
supplying industry.
Also needed is the statutory incidence vector: SIPAYi
First round incidence on business inputs vector (TIi)
TIPAYi’ = SIPAYi‘ × OXPAYij
First round incidence on final demand (TAi)
TAPAYi = SIPAYi # (FDXPAYi / TSXPAYi)
Flowing tax on Business Inputs through to final demand (steps to calculate TB vector):
TBPAYi = [TIPAYi’ × (Iij - Oij)-1]’ # Zi
Total final incidence of tax by final demand category:
TFIPAYi = TBPAYi + TAPAYi
TPCPAYi = TBPAYi # (PCi / FDi) + TAPAYi # (PCXi / FDXi)
TGCPAYi = TBPAYi # (GCi / FDi) + TAPAYi # (GCXi / FDXi)
TXPAYi = TBPAYi # (Xi / FDi) + TAPAYi # (XXi / FDXi)
TGGIPAYi = TBPAYi # (GGIi / FDi) + TAPAYi # (GGIXi / FDXi)
Effective Tax Rates for each final demand component:
ETRPAYi = TFIPAYi / FDi
EPCPAYi = TPCPAYi / PCi
EGCPAYi = TGCPAYi / GCi
EXPAYi = TXPAYi / Xi
EGGIPAYi = TGGIPAYi / GGIi
A3.6 Primary production taxes
Exemptions matrix:
EPRI A if i or
if j or and
otherwise
ij ij= =
= ==
1 2 3 4 5 6 7 10 16 17
0 104 105
0
, , , , , , , , , ,
,
.

50
Final non-exempt demand:
FDXPRI FD if i or and
otherwisei i= =
=1 2 3 4 5 6 7 10 16 17
0
, , , , , , , , , ,
.
Total non-exempt supply:
TSXPRI EPRI FDXPRI ii ijj
i= + ∀=
∑1
114
,
OXPRIij = divide each element of row in EPRIij by total non-exempt supply for that row or
supplying industry.
Also needed is the statutory incidence vector: SIPRIi
First round incidence on business inputs vector (TIi):
TIPRIi’ = SIPRIi’ × OXPRIij
First round incidence on final demand (TAi):
TAPRIi = SIPRIi’ # (FDXPRIi / TSXPRIi)
Flowing tax on Business Inputs through to final demand (steps to calculate TB vector):
TBPRIi = [TIPRIi’ × (Iij - Oij)-1]’ # Zi
Total final incidence of tax by final demand category:
TFIPRIi = TBPRIi + TAPRIi
TPCPRIi = TBPRIi # (PCi / FDi)+ TAPRIi # (PCXi / FDXi)
TGCPRIi = TBPRIi # (GCi / FDi)+ TAPRIi # (GCXi / FDXi)
TXPRIi = TBPRIi # (Xi / FDi)+ TAPRIi # (XXi / FDXi)
TGGIPRIi = TBPRIi # (GGIi / FDi)+ TAPRIi # (GGIXi / FDXi)
Effective Tax Rates for each final demand component:
ETRPRIi = TFIPRIi / FDi
EPCPRIi = TPCPRIi / PCi
EGCPRIi = TGCPRIi / GCi
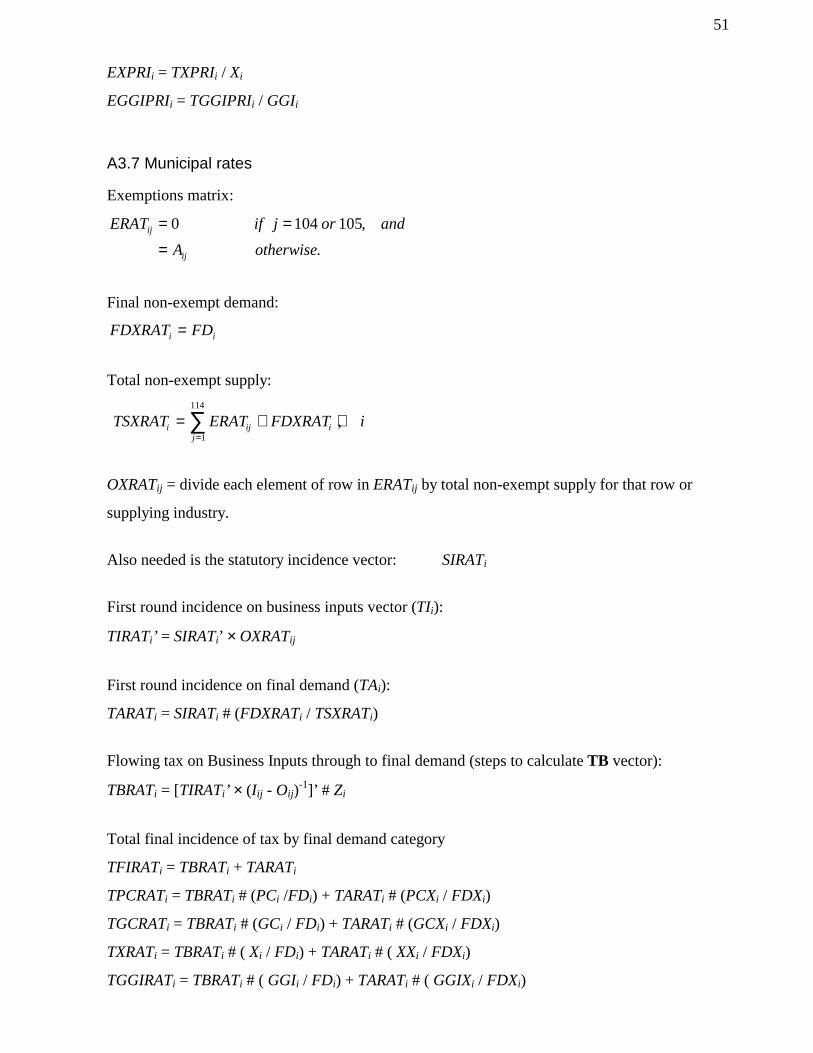
51
EXPRIi = TXPRIi / Xi
EGGIPRIi = TGGIPRIi / GGIi
A3.7 Municipal rates
Exemptions matrix:
ERAT if j or and
A otherwise
ij
ij
= =
=
0 104 105,
.
Final non-exempt demand:
FDXRAT FDi i=
Total non-exempt supply:
TSXRAT ERAT FDXRAT ii ijj
i= + ∀=
∑1
114
,
OXRATij = divide each element of row in ERATij by total non-exempt supply for that row or
supplying industry.
Also needed is the statutory incidence vector: SIRATi
First round incidence on business inputs vector (TIi):
TIRATi’ = SIRATi’ × OXRATij
First round incidence on final demand (TAi):
TARATi = SIRATi # (FDXRATi / TSXRATi)
Flowing tax on Business Inputs through to final demand (steps to calculate TB vector):
TBRATi = [TIRATi’ × (Iij - Oij)-1]’ # Zi
Total final incidence of tax by final demand category
TFIRATi = TBRATi + TARATi
TPCRATi = TBRATi # (PCi /FDi) + TARATi # (PCXi / FDXi)
TGCRATi = TBRATi # (GCi / FDi) + TARATi # (GCXi / FDXi)
TXRATi = TBRATi # ( Xi / FDi) + TARATi # ( XXi / FDXi)
TGGIRATi = TBRATi # ( GGIi / FDi) + TARATi # ( GGIXi / FDXi)

52
Effective Tax Rates for each final demand component:
ETRRATi = TFIRATi / FDi
EPCRATi = TPCRATi / PCi
EGCRATi = TGCRATi / GCi
EXRATi = TXRATi / Xi
EGGIRATi = TGGIRATi / GGIi
A3.8 Stamp duty
Exemptions matrix:
ESTP if j or
A if j
A if j
A if j
A if j
A otherwise
ij
ij
ij
ij
ij
ij
= =
= =
= =
= − =
= − =
=
0 104 105
0 84 114
0 5 106
1 0 3496 107
1 0 016 113
,
. ,
. ,
( . ) ,
( . ) ,
.
Final non-exempt demand
FDXSTP FDi i=
Total non-exempt supply:
TSXSTP ESTP FDXSTP ii ijj
i= + ∀=
∑1
114
,
OXSTPij = divide each element of row in ESTPij by total non-exempt supply for that row or
supplying industry.
Also needed is the statutory incidence vector : SISTPi
First round incidence on business inputs vector (TIi):
TISTPi’ = SISTPi’ × OXSTPij
First round incidence on final demand (TAi):
TASTPi = SISTPi # (FDXSTPi / TSXSTPi)

53
Flowing tax on Business Inputs through to final demand (steps to calculate TB vector):
TBSTPi = [TISTPi’ × (Iij - Oij)-1]’ # Zi
Total final incidence of tax by final demand category:
TFISTPi = TBSTPi + TASTPi
TPCSTPi = TBSTPi #( PCi / FDi)+ TASTPi #( PCXi / FDXi)
TGCSTPi = TBSTPi #( GCi / FDi)+ TASTPi #( GCXi / FDXi)
TXSTPi = TBSTPi #( Xi / FDi)+ TASTPi #( XXi / FDXi)
TGGISTPi = TBSTPi #( GGIi / FDi)+ TASTPi #( GGIXi / FDXi)
Effective Tax Rates for each final demand component:
ETRSTPi = TFISTPi / FDi
EPCSTPi = TPCSTPi / PCi
EGCSTPi = TGCSTPi / GCi
EXSTPi = TXSTPi / Xi
EGGISTPi = TGGISTPi / GGIi
A3.9 Other commodity taxes
Exemptions matrix:
EOTHC A if i or and
otherwise
ij ij= =
=
11 13 25 26 27 43 78 79 92 97 109
0
, , , , , , , , , , ,
.
Final non-exempt demand:
FDXOTHC FD if i or and
otherwisei i= =
=11 13 25 26 27 43 78 79 92 97 109
0
, , , , , , , , , , ,
Total non-exempt supply:
TSXOTHC EOTHC FDXOTHC ii ijj
i= + ∀=
∑1
114
,
OXOTHCij = divide each element of row in EOTHCij by total non-exempt supply for that row or
supplying industry.
Also needed is the statutory incidence vector: SIOTHCi

54
First round incidence on business inputs vector (TIi):
TIOTHCi’ = SIOTHCi’ × OXOTHCij
First round incidence on final demand (TAi):
TAOTHCi = SIOTHCi # ( FDXOTHCi / TSXOTHCi)
Flowing tax on Business Inputs through to final demand (steps to calculate TB vector)
TBOTHCi = [TIOTHCi’ × (Iij - Oij)-1]’ # Zi
Total final incidence of tax by final demand category
TFIOTHCi = TBOTHCi + TAOTHCi
TPCOTHCi = TBOTHCi # (PCi /FDi)+ TAOTHCi #( PCXi /FDXi)
TGCOTHCi = TBOTHCi # (GCi /FDi)+ TAOTHCi #( GCXi /FDXi)
TXOTHCi = TBOTHCi # (Xi /FDi)+ TAOTHCi #( XXi /FDXi)
TGGIOTHCi = TBOTHCi # (GGIi /FDi)+ TAOTHCi #( GGIXi /FDXi)
Effective Tax Rates for each final demand component
EFIOTHCi = TFIOTHCi / FDi
EPCOTHCi = TPCOTHCi / PCi
EGCOTHCi = TGCOTHCi / GCi
EXOTHCi = TXOTHCi / Xi
EGGIOTHCi = TGGIOTHCi / GGIi
A3.10 Other indirect taxes
Exemptions matrix:
EOTHI if j and
A otherwise
ij
ij
= =
=
0 105,
.
Final non-exempt demand:
FDXOTHI FDi i=
Total non-exempt supply:

55
TSXOTHI EOTHI FDXOTHI ii ijj
i= + ∀=
∑1
114
,
OXOTHIij = divide each element of row in EOTHIi by total non-exempt supply for that row or
supplying industry.
Also needed is the statutory incidence vector: SIOTHIi
First round incidence on business inputs vector (TIi):
TIOTHIi’ = SIOTHIi’ × OXOTHIi
First round incidence on final demand (TAi):
TAOTHIi = SIOTHIi # (FDXOTHIi / TSXOTHIi)
Flowing tax on Business Inputs through to final demand (steps to calculate TB vector):
TBOTHIi = [TIOTHIi’ × (Iij - Oij)-1]’ # Zi
Total final incidence of tax by final demand category:
TFIOTHIi = TBOTHIi + TAOTHIi
TPCOTHIi = TBOTHIi #( PCi /FDi)+ TAOTHIi #( PCXi / FDXi)
TGCOTHIi = TBOTHIi #( GCi / FDi)+ TAOTHIi #( GCXi / FDXi)
TXOTHIi = TBOTHIi #( Xi / FDi)+ TAOTHIi #( XXi / FDXi)
TGGIOTHIi = TBOTHIi #( GGIi / FDi)+ TAOTHIi #( GGIXi / FDXi)
Effective Tax Rates for each final demand component:
ETROTHIi = TFIOTHIi / FDi
EPCOTHIi = TPCOTHIi / PCi
EGCOTHIi = TGCOTHIi / GCi
EXOTHIi = TXOTHIi / Xi
EGGIOTHIi = TGGIOTHIi / GGIi

56
Appendix 4: Effective tax rates on final demand broken down by type
of tax
Table A4.1: Effective tax rates on final demand of the Wholesale Sales tax, 1992-93, percent
Private finalconsumptionexpenditure
Generalgovernmentconsumptionexpenditure
Generalgovernmentgross fixed
capitalexpenditure
ExportsTotalfinal
demand
Sheep 1.2 0.0 0.0 1.2 1.2Grains 1.2 0.0 0.0 1.2 1.2Beef cattle 1.2 0.0 0.0 1.2 1.2Dairy cattle 1.2 0.0 0.0 0.0 1.2Pigs 1.2 0.0 0.0 1.2 1.2Poultry 1.2 0.0 0.0 1.2 1.2Other agriculture 1.3 0.0 0.0 1.3 1.3Services to agriculture; hunting and
trapping1.0 1.0 0.0 1.0 1.0
Forestry and logging 1.0 1.0 1.0 1.0 1.0Commercial fishing 1.5 1.5 0.0 1.5 1.5Coal; oil and gas 1.0 0.0 0.0 1.0 1.0Iron ores 0.0 0.0 0.0 1.1 1.1Non-ferrous metal ores 0.0 0.0 0.0 1.1 1.1Other mining 1.3 0.0 0.0 1.3 1.3Services to mining 0.0 0.6 0.0 0.6 0.6Meat and meat products 1.2 0.0 0.0 1.2 1.2Dairy products 3.4 0.0 0.0 1.3 3.0Fruit and vegetable products 3.3 0.0 0.0 1.8 3.2Oils and fats 1.1 0.0 0.0 1.1 1.1Flour mill products and cereal foods 1.7 0.0 0.0 1.4 1.6Bakery products 2.6 0.0 0.0 1.5 2.7Confectionery 8.0 0.0 0.0 2.3 7.8Other food products 3.1 0.0 0.0 1.3 2.5Soft drinks, cordials and syrups 10.7 0.0 0.0 2.3 11.0Beer and malt 8.9 0.0 0.0 1.6 8.9Wine and spirits 9.6 0.0 0.0 2.2 9.1Tobacco products 1.5 0.0 0.0 1.5 1.5Wool scouring 0.0 0.0 0.0 1.1 1.1Textile fibres, yarns and woven
fabrics2.3 0.0 0.0 0.8 2.0
Textile products 3.6 0.0 1.4 1.4 3.2Knitting mill products 1.1 0.0 0.0 1.1 1.1Clothing 1.3 0.0 0.0 1.2 1.3Footwear 1.2 0.0 0.0 1.2 1.2Leather and leather products 3.9 0.0 0.0 1.3 3.0Sawmill products 0.9 0.0 0.0 0.9 0.9Plywood, veneer and fabricated
wood1.1 0.0 0.0 1.1 1.1
Other wood products 6.1 0.0 1.4 1.4 4.4continued

57
Private finalconsumptionexpenditure
Generalgovernmentconsumptionexpenditure
Generalgovernmentgross fixed
capitalexpenditure
ExportsTotalfinal
demand
Pulp, paper and paperboard 22.0 0.0 0.0 5.5 10.0Paperboard containers; paper bags
and sacks13.7 0.0 0.0 4.1 4.6
Other paper products 12.8 0.0 0.0 3.5 11.4Printing and services to printing 28.7 10.9 0.0 10.9 25.0Publishing; recorded media and
publishing5.9 0.0 1.6 1.6 5.7
Petroleum and coal products 1.1 0.0 0.0 1.1 1.1Fertilisers 2.0 0.0 0.0 1.1 1.7Other basic chemicals 3.8 0.0 0.0 1.6 1.7Paints 1.2 0.0 0.0 1.2 1.2Medicinal and pharmaceutical
products; pesticides2.7 0.0 0.0 2.4 2.7
Soap and other detergents 9.9 0.0 0.0 1.5 9.2Cosmetics and toiletry preparations 8.7 0.0 0.0 1.5 8.4Other chemical products 44.9 0.0 0.0 2.9 23.2Rubber products 19.8 0.0 0.0 5.1 18.1Plastic products 8.3 0.0 0.0 3.7 7.3Glass and glass products 6.5 0.0 0.0 3.1 5.7Ceramic products 5.0 0.0 0.0 1.4 4.6Cement and lime 0.0 0.0 0.0 1.2 1.2Concrete slurry 0.0 0.0 0.0 0.0 1.3Plaster and other concrete products 0.0 0.0 0.0 1.2 1.2Other non-metallic mineral products 1.1 0.0 0.0 1.1 1.1Iron and steel 0.8 0.0 0.0 0.8 0.8Basic non-ferrous metal and
products0.9 0.0 0.0 0.9 0.9
Structural metal products 0.0 0.0 1.1 1.1 1.1Sheet metal products 13.5 0.0 6.2 6.2 9.6Fabricated metal products 24.3 0.0 2.4 2.4 15.2Motor vehicles and parts; other
transport equipment24.3 0.0 9.0 9.0 21.3
Ships and boats 12.1 0.0 1.6 1.6 4.0Railway equipment 0.0 0.0 1.0 1.0 1.0Aircraft 0.6 0.0 0.6 0.6 0.6Photographic and scientific
equipment21.1 0.0 4.4 4.4 14.8
Electronic equipment 16.2 0.0 3.4 3.4 9.9Household appliances 8.3 0.0 3.1 3.1 7.4Other electrical equipment 10.0 0.0 5.5 5.5 8.4Agricultural machinery 5.2 0.0 1.1 1.1 4.0Mining and construction machinery;
lifting and material handlingequipment
0.0 0.0 0.9 0.9 0.9
Other machinery and equipment 11.6 0.0 3.1 3.1 3.6Prefabricated buildings 0.0 0.0 1.1 1.1 1.1Furniture 2.5 0.0 1.5 1.5 2.3Other manufacturing 14.0 0.0 4.0 4.0 12.5Electricity supply 1.0 0.0 0.0 1.0 1.0Gas supply 1.0 0.0 0.0 0.0 1.0
continued
Table A4.1 (cont.): Effective tax rates on final demand of the Wholesale Sales Tax,1992-93, per cent

58
Private finalconsumptionexpenditure
Generalgovernmentconsumptionexpenditure
Generalgovernmentgross fixed
capitalexpenditure
ExportsTotalfinal
demand
Water supply; sewerage anddrainage services
0.0 0.9 0.0 0.9 0.9
Residential building construction 0.0 0.0 1.2 1.2 1.2Other construction 0.0 1.1 1.1 1.1 1.1Wholesale trade 0.9 0.9 0.9 0.9 0.9Retail trade 1.1 0.0 0.0 0.0 1.1Mechanical repairs 3.0 0.0 0.0 3.0 3.0Other repairs 1.2 0.0 0.0 1.2 1.2Accommodation, cafes and
restaurants0.9 0.0 0.0 0.0 0.9
Road transport 1.3 1.3 1.3 1.3 1.3Rail, pipeline and other transport 0.5 0.0 0.5 0.5 0.5Water transport 0.0 0.0 0.0 0.0 0.0Air and space transport 0.0 0.0 0.0 0.0 0.0Services to transport; storage 0.9 0.9 0.9 0.9 0.9Communication services 1.2 1.2 0.0 1.2 1.2Banking 0.9 0.0 0.0 0.9 0.9Non-bank finance 0.8 0.8 0.0 0.8 0.8Financial asset investors 0.0 0.0 0.0 0.0 0.0Insurance 0.8 0.8 0.8 0.8 0.8Services to finance, investment and
insurance0.9 0.0 0.0 0.9 0.9
Ownership of dwellings 1.1 1.1 0.0 0.0 1.1Other property services 0.7 0.7 0.0 0.7 0.7Scientific research, technical and
computer services0.9 0.9 0.9 0.9 0.9
Legal, accounting, marketing andbusiness management services
0.8 0.8 0.0 0.8 0.8
Other business services 0.8 0.8 0.0 0.8 0.8Government administration 1.1 1.1 0.0 0.0 1.1Defence 0.0 1.3 0.0 1.3 1.3Education 0.2 0.2 0.0 0.2 0.2Health services 0.6 0.6 0.0 0.6 0.6Community services 0.8 0.8 0.0 0.0 0.8Motion picture, radio and television
services1.3 1.3 0.0 0.0 1.3
Libraries, museums and the arts 0.8 0.8 0.0 0.8 0.8Sport, gambling and recreational
services1.1 1.1 0.0 1.1 1.1
Personal services 1.2 1.2 0.0 1.2 1.2Other services 0.5 0.5 0.0 0.5 0.5Total 3.6 0.8 2.0 1.4 2.6
Table A4.1 (cont.): Effective tax rates on final demand of the Wholesale Sales Tax,1992-93, per cent

59
Table A4.2: Effective tax rates on final demand for Stamp Duties, 1992-93, per cent
Private finalconsumptionexpenditure
Generalgovernmentconsumptionexpenditure
Generalgovernmentgross fixed
capitalexpenditure
ExportsTotalfinal
demand
Sheep 2.0 0.0 0.0 2.0 2.0Grains 1.8 0.0 0.0 1.8 1.8Beef cattle 1.9 0.0 0.0 1.9 1.9Dairy cattle 1.8 0.0 0.0 0.0 1.8Pigs 2.0 0.0 0.0 2.0 2.0Poultry 1.5 0.0 0.0 1.5 1.5Other agriculture 1.6 0.0 0.0 1.6 1.6Services to agriculture; hunting and
trapping1.3 1.3 0.0 1.3 1.3
Forestry and logging 1.5 1.5 1.5 1.5 1.5Commercial fishing 1.4 1.4 0.0 1.4 1.4Coal; oil and gas 1.4 0.0 0.0 1.4 1.4Iron ores 0.0 0.0 0.0 1.8 1.8Non-ferrous metal ores 0.0 0.0 0.0 1.3 1.3Other mining 1.7 0.0 0.0 1.7 1.7Services to mining 0.0 1.2 0.0 1.2 1.2Meat and meat products 1.8 0.0 0.0 1.8 1.8Dairy products 1.8 0.0 0.0 1.8 1.8Fruit and vegetable products 1.3 0.0 0.0 1.3 1.3Oils and fats 1.2 0.0 0.0 1.2 1.2Flour mill products and cereal foods 1.6 0.0 0.0 1.6 1.6Bakery products 1.3 0.0 0.0 1.3 1.3Confectionery 1.3 0.0 0.0 1.3 1.3Other food products 1.4 0.0 0.0 1.4 1.4Soft drinks, cordials and syrups 1.2 0.0 0.0 1.2 1.2Beer and malt 1.5 0.0 0.0 1.5 1.5Wine and spirits 1.4 0.0 0.0 1.4 1.4Tobacco products 1.5 0.0 0.0 1.5 1.5Wool scouring 0.0 0.0 0.0 1.9 1.9Textile fibres, yarns and woven
fabrics0.7 0.0 0.0 0.7 0.7
Textile products 1.0 0.0 1.0 1.0 1.0Knitting mill products 0.9 0.0 0.0 0.9 0.9Clothing 1.0 0.0 0.0 1.0 1.0Footwear 0.9 0.0 0.0 0.9 0.9Leather and leather products 1.1 0.0 0.0 1.1 1.1Sawmill products 1.4 0.0 0.0 1.4 1.4Plywood, veneer and fabricated wood 1.2 0.0 0.0 1.2 1.2Other wood products 1.4 0.0 1.4 1.4 1.4Pulp, paper and paperboard 0.8 0.0 0.0 0.8 0.8Paperboard containers; paper bags
and sacks1.1 0.0 0.0 1.1 1.1
Other paper products 1.3 0.0 0.0 1.3 1.3Printing and services to printing 1.1 1.1 0.0 1.1 1.1Publishing; recorded media and
publishing1.1 0.0 1.1 1.1 1.1
Petroleum and coal products 1.3 0.0 0.0 1.3 1.3continued

60
Private finalconsumptionexpenditure
Generalgovernmentconsumptionexpenditure
Generalgovernmentgross fixed
capitalexpenditure
ExportsTotalfinal
demand
Fertilisers 1.2 0.0 0.0 1.2 1.2Other basic chemicals 0.8 0.0 0.0 0.8 0.8Paints 1.1 0.0 0.0 1.1 1.1Medicinal and pharmaceutical
products; pesticides1.2 0.0 0.0 1.2 1.2
Soap and other detergents 1.2 0.0 0.0 1.2 1.2Cosmetics and toiletry preparations 1.3 0.0 0.0 1.3 1.3Other chemical products 0.8 0.0 0.0 0.8 0.8Rubber products 0.9 0.0 0.0 0.9 0.9Plastic products 0.9 0.0 0.0 0.9 0.9Glass and glass products 1.1 0.0 0.0 1.1 1.1Ceramic products 1.0 0.0 0.0 1.0 1.0Cement and lime 0.0 0.0 0.0 1.5 1.5Concrete slurry 0.0 0.0 0.0 0.0 3.0Plaster and other concrete products 0.0 0.0 0.0 1.8 1.8Other non-metallic mineral products 1.4 0.0 0.0 1.4 1.4Iron and steel 1.2 0.0 0.0 1.2 1.2Basic non-ferrous metal and products 1.2 0.0 0.0 1.2 1.2Structural metal products 0.0 0.0 1.2 1.2 1.2Sheet metal products 1.2 0.0 1.2 1.2 1.2Fabricated metal products 0.9 0.0 0.9 0.9 0.9Motor vehicles and parts; other
transport equipment0.8 0.0 0.8 0.8 0.8
Ships and boats 1.0 0.0 1.0 1.0 1.0Railway equipment 0.0 0.0 1.0 1.0 1.0Aircraft 0.3 0.0 0.3 0.3 0.3Photographic and scientific
equipment0.8 0.0 0.8 0.8 0.8
Electronic equipment 0.7 0.0 0.7 0.7 0.7Household appliances 0.8 0.0 0.8 0.8 0.8Other electrical equipment 0.9 0.0 0.9 0.9 0.9Agricultural machinery 0.8 0.0 0.8 0.8 0.8Mining and construction machinery;
lifting and material handlingequipment
0.0 0.0 0.9 0.9 0.9
Other machinery and equipment 0.7 0.0 0.7 0.7 0.7Prefabricated buildings 0.0 0.0 1.3 1.3 1.3Furniture 1.3 0.0 1.3 1.3 1.3Other manufacturing 1.1 0.0 1.1 1.1 1.1Electricity supply 1.6 0.0 0.0 1.6 1.6Gas supply 1.5 0.0 0.0 0.0 1.5Water supply; sewerage and drainage
services0.0 1.4 0.0 1.4 1.4
Residential building construction 0.0 0.0 2.0 2.0 2.0Other construction 0.0 1.5 1.5 1.5 1.5Wholesale trade 1.3 1.3 1.3 1.3 1.3Retail trade 1.2 0.0 0.0 0.0 1.2Mechanical repairs 1.1 0.0 0.0 1.1 1.1Other repairs 1.0 0.0 0.0 1.0 1.0
continued
Table A4.2 (cont.): Effective tax rates on final demand for stamp duties, 1992-93, per cent
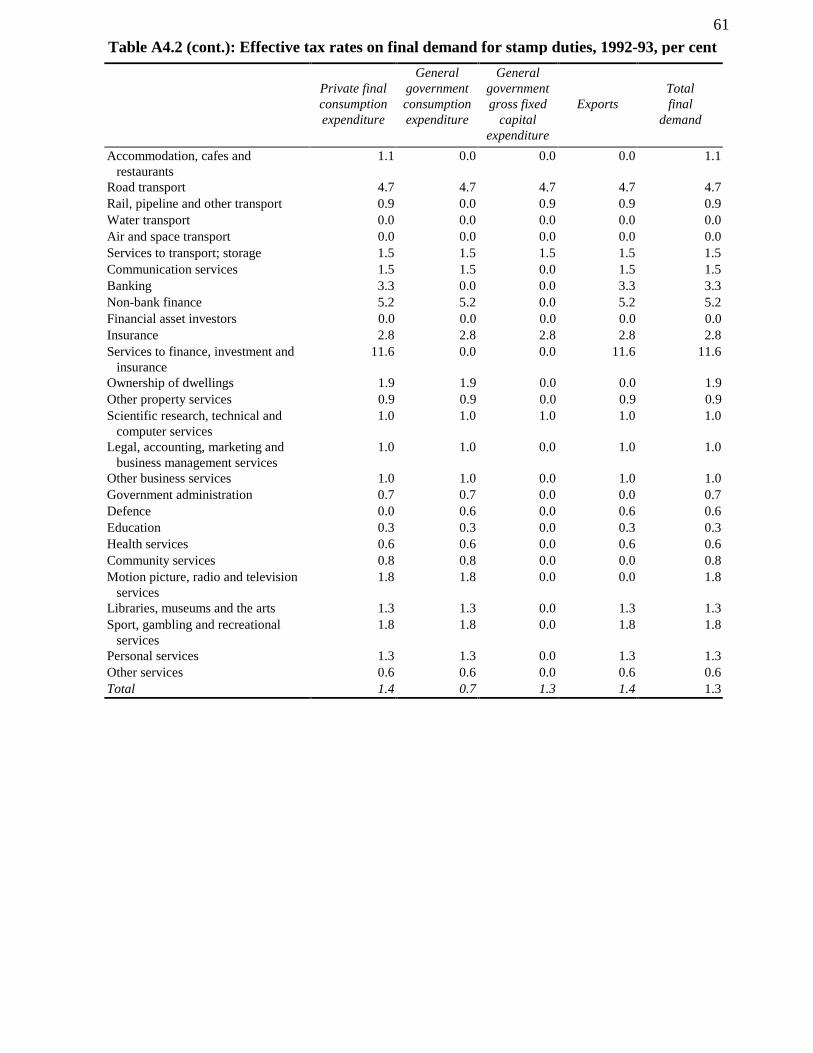
61
Private finalconsumptionexpenditure
Generalgovernmentconsumptionexpenditure
Generalgovernmentgross fixed
capitalexpenditure
ExportsTotalfinal
demand
Accommodation, cafes andrestaurants
1.1 0.0 0.0 0.0 1.1
Road transport 4.7 4.7 4.7 4.7 4.7Rail, pipeline and other transport 0.9 0.0 0.9 0.9 0.9Water transport 0.0 0.0 0.0 0.0 0.0Air and space transport 0.0 0.0 0.0 0.0 0.0Services to transport; storage 1.5 1.5 1.5 1.5 1.5Communication services 1.5 1.5 0.0 1.5 1.5Banking 3.3 0.0 0.0 3.3 3.3Non-bank finance 5.2 5.2 0.0 5.2 5.2Financial asset investors 0.0 0.0 0.0 0.0 0.0Insurance 2.8 2.8 2.8 2.8 2.8Services to finance, investment and
insurance11.6 0.0 0.0 11.6 11.6
Ownership of dwellings 1.9 1.9 0.0 0.0 1.9Other property services 0.9 0.9 0.0 0.9 0.9Scientific research, technical and
computer services1.0 1.0 1.0 1.0 1.0
Legal, accounting, marketing andbusiness management services
1.0 1.0 0.0 1.0 1.0
Other business services 1.0 1.0 0.0 1.0 1.0Government administration 0.7 0.7 0.0 0.0 0.7Defence 0.0 0.6 0.0 0.6 0.6Education 0.3 0.3 0.0 0.3 0.3Health services 0.6 0.6 0.0 0.6 0.6Community services 0.8 0.8 0.0 0.0 0.8Motion picture, radio and television
services1.8 1.8 0.0 0.0 1.8
Libraries, museums and the arts 1.3 1.3 0.0 1.3 1.3Sport, gambling and recreational
services1.8 1.8 0.0 1.8 1.8
Personal services 1.3 1.3 0.0 1.3 1.3Other services 0.6 0.6 0.0 0.6 0.6Total 1.4 0.7 1.3 1.4 1.3
Table A4.2 (cont.): Effective tax rates on final demand for stamp duties, 1992-93, per cent

62
Table A4.3: Effective tax rates on final demand for excise duties, 1992-93, per cent
Private finalconsumptionexpenditure
Generalgovernmentconsumptionexpenditure
Generalgovernmentgross fixed
capitalexpenditure
ExportsTotalfinal
demand
Sheep 2.7 0.0 0.0 2.7 2.7Grains 4.6 0.0 0.0 4.6 4.6Beef cattle 3.6 0.0 0.0 3.6 3.6Dairy cattle 2.5 0.0 0.0 0.0 2.5Pigs 3.1 0.0 0.0 3.1 3.1Poultry 1.8 0.0 0.0 1.8 1.8Other agriculture 3.1 0.0 0.0 3.1 3.1Services to agriculture; hunting and
trapping2.7 2.7 0.0 2.7 2.7
Forestry and logging 3.2 3.2 3.2 3.2 3.2Commercial fishing 6.2 6.2 0.0 6.2 6.2Coal; oil and gas 3.2 0.0 0.0 1.7 1.7Iron ores 0.0 0.0 0.0 2.7 2.7Non-ferrous metal ores 0.0 0.0 0.0 3.5 3.5Other mining 3.9 0.0 0.0 3.9 3.9Services to mining 0.0 1.9 0.0 1.9 1.9Meat and meat products 2.6 0.0 0.0 2.6 2.6Dairy products 2.2 0.0 0.0 2.2 2.2Fruit and vegetable products 3.2 0.0 0.0 3.2 3.2Oils and fats 1.8 0.0 0.0 1.8 1.8Flour mill products and cereal foods 2.2 0.0 0.0 2.2 2.2Bakery products 1.7 0.0 0.0 1.7 1.7Confectionery 1.4 0.0 0.0 1.4 1.4Other food products 2.2 0.0 0.0 2.2 2.2Soft drinks, cordials and syrups 2.1 0.0 0.0 2.1 2.1Beer and malt 17.7 0.0 0.0 2.8 17.7Wine and spirits 6.7 0.0 0.0 1.9 6.3Tobacco products 97.3 0.0 0.0 1.9 100.2Wool scouring 0.0 0.0 0.0 2.2 2.2Textile fibres, yarns and woven
fabrics1.1 0.0 0.0 1.1 1.1
Textile products 1.2 0.0 1.2 1.2 1.2Knitting mill products 1.1 0.0 0.0 1.1 1.1Clothing 1.3 0.0 0.0 1.3 1.3Footwear 1.1 0.0 0.0 1.1 1.1Leather and leather products 1.4 0.0 0.0 1.4 1.4Sawmill products 2.3 0.0 0.0 2.3 2.3Plywood, veneer and fabricated wood 1.9 0.0 0.0 1.9 1.9Other wood products 1.5 0.0 1.5 1.5 1.5Pulp, paper and paperboard 1.2 0.0 0.0 1.2 1.2Paperboard containers; paper bags
and sacks1.6 0.0 0.0 1.6 1.6
Other paper products 1.5 0.0 0.0 1.5 1.5Printing and services to printing 1.3 1.3 0.0 1.3 1.3Publishing; recorded media and
publishing1.2 0.0 1.2 1.2 1.2
Petroleum and coal products 49.0 0.0 0.0 6.1 42.0continued

63
Private finalconsumptionexpenditure
Generalgovernmentconsumptionexpenditure
Generalgovernmentgross fixed
capitalexpenditure
ExportsTotalfinal
demand
Fertilisers 2.3 0.0 0.0 2.3 2.3Other basic chemicals 2.6 0.0 0.0 2.6 2.6Paints 2.4 0.0 0.0 2.4 2.4Medicinal and pharmaceutical
products; pesticides1.3 0.0 0.0 1.3 1.3
Soap and other detergents 1.6 0.0 0.0 1.6 1.6Cosmetics and toiletry preparations 1.6 0.0 0.0 1.6 1.6Other chemical products 1.6 0.0 0.0 1.6 1.6Rubber products 1.2 0.0 0.0 1.2 1.2Plastic products 1.3 0.0 0.0 1.3 1.3Glass and glass products 1.5 0.0 0.0 1.5 1.5Ceramic products 1.9 0.0 0.0 1.9 1.9Cement and lime 0.0 0.0 0.0 4.0 4.0Concrete slurry 0.0 0.0 0.0 0.0 4.0Plaster and other concrete products 0.0 0.0 0.0 2.3 2.3Other non-metallic mineral products 1.9 0.0 0.0 1.9 1.9Iron and steel 2.4 0.0 0.0 2.4 2.4Basic non-ferrous metal and products 3.7 0.0 0.0 3.7 3.7Structural metal products 0.0 0.0 1.5 1.5 1.5Sheet metal products 1.7 0.0 1.7 1.7 1.7Fabricated metal products 1.3 0.0 1.3 1.3 1.3Motor vehicles and parts; other
transport equipment1.1 0.0 1.1 1.1 1.1
Ships and boats 1.4 0.0 1.4 1.4 1.4Railway equipment 0.0 0.0 1.1 1.1 1.1Aircraft 0.6 0.0 0.6 0.6 0.6Photographic and scientific
equipment1.0 0.0 1.0 1.0 1.0
Electronic equipment 0.9 0.0 0.9 0.9 0.9Household appliances 1.1 0.0 1.1 1.1 1.1Other electrical equipment 1.3 0.0 1.3 1.3 1.3Agricultural machinery 1.1 0.0 1.1 1.1 1.1Mining and construction machinery;
lifting and material handlingequipment
0.0 0.0 1.3 1.3 1.3
Other machinery and equipment 0.8 0.0 0.8 0.8 0.8Prefabricated buildings 0.0 0.0 1.6 1.6 1.6Furniture 1.6 0.0 1.6 1.6 1.6Other manufacturing 1.4 0.0 1.4 1.4 1.4Electricity supply 1.5 0.0 0.0 1.5 1.5Gas supply 2.1 0.0 0.0 0.0 2.1Water supply; sewerage and drainage
services0.0 2.4 0.0 2.4 2.4
Residential building construction 0.0 0.0 1.6 1.6 1.6Other construction 0.0 1.3 1.3 1.3 1.3Wholesale trade 1.2 1.2 1.2 1.2 1.2Retail trade 1.1 0.0 0.0 0.0 1.1Mechanical repairs 0.8 0.0 0.0 0.8 0.8Other repairs 1.7 0.0 0.0 1.7 1.7
continued
Table A4.3 (cont.): Effective tax rates on final demand for excise duties, 1992-93, per cent

64
Table A4.3 (cont.): Effective tax rates on final demand for excise duties, 1992-93, per cent
Private finalconsumptionexpenditure
Generalgovernmentconsumptionexpenditure
Generalgovernmentgross fixed
capitalexpenditure
ExportsTotalfinal
demand
Accommodation, cafes andrestaurants
1.2 0.0 0.0 0.0 1.2
Road transport 4.1 4.1 4.1 4.1 4.1Rail, pipeline and other transport 1.7 0.0 1.7 1.7 1.7Water transport 0.0 0.0 0.0 0.0 0.0Air and space transport 0.0 0.0 0.0 0.0 0.0Services to transport; storage 2.1 2.1 2.1 2.1 2.1Communication services 1.4 1.4 0.0 1.4 1.4Banking 0.8 0.0 0.0 0.8 0.8Non-bank finance 0.6 0.6 0.0 0.6 0.6Financial asset investors 0.0 0.0 0.0 0.0 0.0Insurance 0.7 0.7 0.7 0.7 0.7Services to finance, investment and
insurance0.6 0.0 0.0 0.6 0.6
Ownership of dwellings 0.8 0.8 0.0 0.0 0.8Other property services 1.0 1.0 0.0 1.0 1.0Scientific research, technical and
computer services1.3 1.3 1.3 1.3 1.3
Legal, accounting, marketing andbusiness management services
1.2 1.2 0.0 1.2 1.2
Other business services 1.3 1.3 0.0 1.3 1.3Government administration 1.2 1.2 0.0 0.0 1.2Defence 0.0 1.7 0.0 1.7 1.7Education 0.2 0.2 0.0 0.2 0.2Health services 0.6 0.6 0.0 0.6 0.6Community services 2.0 2.0 0.0 0.0 2.0Motion picture, radio and television
services1.4 1.4 0.0 0.0 1.4
Libraries, museums and the arts 0.7 0.7 0.0 0.7 0.7Sport, gambling and recreational
services1.2 1.2 0.0 1.2 1.2
Personal services 3.1 3.1 0.0 3.1 3.1Other services 1.3 1.3 0.0 1.3 1.3Total 3.4 1.0 1.2 2.5 2.7

65
Table A4.4: Effective tax rates on final demand for business franchise fees, 1992-93, percent
Private finalconsumptionexpenditure
Generalgovernmentconsumptionexpenditure
Generalgovernmentgross fixed
capitalexpenditure
ExportsTotal
final demand
Sheep 0.5 0.0 0.0 0.5 0.5Grains 0.8 0.0 0.0 0.8 0.8Beef cattle 0.6 0.0 0.0 0.6 0.6Dairy cattle 0.4 0.0 0.0 0.0 0.4Pigs 0.6 0.0 0.0 0.6 0.6Poultry 0.3 0.0 0.0 0.3 0.3Other agriculture 0.5 0.0 0.0 0.5 0.5Services to agriculture; hunting and
trapping0.5 0.5 0.0 0.5 0.5
Forestry and logging 0.5 0.5 0.5 0.5 0.5Commercial fishing 1.0 1.0 0.0 1.0 1.0Coal; oil and gas 0.3 0.0 0.0 0.3 0.3Iron ores 0.0 0.0 0.0 0.5 0.5Non-ferrous metal ores 0.0 0.0 0.0 0.6 0.6Other mining 0.6 0.0 0.0 0.6 0.6Services to mining 0.0 0.4 0.0 0.4 0.4Meat and meat products 0.5 0.0 0.0 0.5 0.5Dairy products 0.4 0.0 0.0 0.4 0.4Fruit and vegetable products 0.5 0.0 0.0 0.5 0.5Oils and fats 0.3 0.0 0.0 0.3 0.3Flour mill products and cereal foods 0.4 0.0 0.0 0.4 0.4Bakery products 0.3 0.0 0.0 0.3 0.3Confectionery 0.3 0.0 0.0 0.3 0.3Other food products 0.4 0.0 0.0 0.4 0.4Soft drinks, cordials and syrups 0.4 0.0 0.0 0.4 0.4Beer and malt 8.5 0.0 0.0 8.5 8.5Wine and spirits 6.5 0.0 0.0 6.5 6.5Tobacco products 115.1 0.0 0.0 115.1 115.1Wool scouring 0.0 0.0 0.0 0.4 0.4Textile fibres, yarns and woven fabrics 0.2 0.0 0.0 0.2 0.2Textile products 0.2 0.0 0.2 0.2 0.2Knitting mill products 0.2 0.0 0.0 0.2 0.2Clothing 0.3 0.0 0.0 0.3 0.3Footwear 0.2 0.0 0.0 0.2 0.2Leather and leather products 0.3 0.0 0.0 0.3 0.3Sawmill products 0.4 0.0 0.0 0.4 0.4Plywood, veneer and fabricated wood 0.4 0.0 0.0 0.4 0.4Other wood products 0.3 0.0 0.3 0.3 0.3Pulp, paper and paperboard 0.2 0.0 0.0 0.2 0.2Paperboard containers; paper bags and
sacks0.3 0.0 0.0 0.3 0.3
Other paper products 0.3 0.0 0.0 0.3 0.3Printing and services to printing 0.2 0.2 0.0 0.2 0.2Publishing; recorded media and
publishing0.3 0.0 0.3 0.3 0.3
Petroleum and coal products 7.5 0.0 0.0 7.5 7.5continued

66
Private finalconsumptionexpenditure
Generalgovernmentconsumptionexpenditure
Generalgovernmentgross fixed
capitalexpenditure
ExportsTotal
final demand
Fertilisers 0.4 0.0 0.0 0.4 0.4Other basic chemicals 0.4 0.0 0.0 0.4 0.4Paints 0.4 0.0 0.0 0.4 0.4Medicinal and pharmaceutical products;
pesticides0.3 0.0 0.0 0.3 0.3
Soap and other detergents 0.3 0.0 0.0 0.3 0.3Cosmetics and toiletry preparations 0.3 0.0 0.0 0.3 0.3Other chemical products 0.3 0.0 0.0 0.3 0.3Rubber products 0.3 0.0 0.0 0.3 0.3Plastic products 0.2 0.0 0.0 0.2 0.2Glass and glass products 0.3 0.0 0.0 0.3 0.3Ceramic products 0.4 0.0 0.0 0.4 0.4Cement and lime 0.0 0.0 0.0 0.7 0.7Concrete slurry 0.0 0.0 0.0 0.0 0.7Plaster and other concrete products 0.0 0.0 0.0 0.4 0.4Other non-metallic mineral products 0.3 0.0 0.0 0.3 0.3Iron and steel 0.4 0.0 0.0 0.4 0.4Basic non-ferrous metal and products 0.6 0.0 0.0 0.6 0.6Structural metal products 0.0 0.0 0.3 0.3 0.3Sheet metal products 0.3 0.0 0.3 0.3 0.3Fabricated metal products 0.2 0.0 0.2 0.2 0.2Motor vehicles and parts; other
transport equipment0.2 0.0 0.2 0.2 0.2
Ships and boats 0.3 0.0 0.3 0.3 0.3Railway equipment 0.0 0.0 0.2 0.2 0.2Aircraft 0.1 0.0 0.1 0.1 0.1Photographic and scientific equipment 0.2 0.0 0.2 0.2 0.2Electronic equipment 0.2 0.0 0.2 0.2 0.2Household appliances 0.2 0.0 0.2 0.2 0.2Other electrical equipment 0.2 0.0 0.2 0.2 0.2Agricultural machinery 0.2 0.0 0.2 0.2 0.2Mining and construction machinery;
lifting and material handlingequipment
0.0 0.0 0.2 0.2 0.2
Other machinery and equipment 0.2 0.0 0.2 0.2 0.2Prefabricated buildings 0.0 0.0 0.3 0.3 0.3Furniture 0.3 0.0 0.3 0.3 0.3Other manufacturing 0.3 0.0 0.3 0.3 0.3Electricity supply 0.2 0.0 0.0 0.2 0.2Gas supply 0.8 0.0 0.0 0.0 0.8Water supply; sewerage and drainage
services0.0 0.4 0.0 0.4 0.4
Residential building construction 0.0 0.0 0.3 0.3 0.3Other construction 0.0 0.2 0.2 0.2 0.2Wholesale trade 0.2 0.2 0.2 0.2 0.2Retail trade 0.2 0.0 0.0 0.0 0.2Mechanical repairs 0.1 0.0 0.0 0.1 0.1Other repairs 0.3 0.0 0.0 0.3 0.3Accommodation, cafes and restaurants 3.2 0.0 0.0 0.0 3.2
continued
Table A4.4 (cont.): Effective tax rates on final demand for business franchise fees,1992-93, per cent

67Table A4.4 (cont.): Effective tax rates on final demand for business franchise fees,1992-93, per cent
Private finalconsumptionexpenditure
Generalgovernmentconsumptionexpenditure
Generalgovernmentgross fixed
capitalexpenditure
ExportsTotal
final demand
Road transport 0.7 0.7 0.7 0.7 0.7Rail, pipeline and other transport 0.3 0.0 0.3 0.3 0.3Water transport 0.0 0.0 0.0 0.0 0.0Air and space transport 0.0 0.0 0.0 0.0 0.0Services to transport; storage 0.4 0.4 0.4 0.4 0.4Communication services 0.2 0.2 0.0 0.2 0.2Banking 0.2 0.0 0.0 0.2 0.2Non-bank finance 0.2 0.2 0.0 0.2 0.2Financial asset investors 0.0 0.0 0.0 0.0 0.0Insurance 0.2 0.2 0.2 0.2 0.2Services to finance, investment and
insurance0.1 0.0 0.0 0.1 0.1
Ownership of dwellings 0.1 0.1 0.0 0.0 0.1Other property services 0.2 0.2 0.0 0.2 0.2Scientific research, technical and
computer services0.3 0.3 0.3 0.3 0.3
Legal, accounting, marketing andbusiness management services
0.2 0.2 0.0 0.2 0.2
Other business services 0.3 0.3 0.0 0.3 0.3Government administration 0.3 0.3 0.0 0.0 0.3Defence 0.0 0.3 0.0 0.3 0.3Education 0.0 0.0 0.0 0.0 0.0Health services 0.1 0.1 0.0 0.1 0.1Community services 0.5 0.5 0.0 0.0 0.5Motion picture, radio and television
services1.7 1.7 0.0 0.0 1.7
Libraries, museums and the arts 0.6 0.6 0.0 0.6 0.6Sport, gambling and recreational
services17.6 17.6 0.0 17.6 17.6
Personal services 0.5 0.5 0.0 0.5 0.5Other services 0.3 0.3 0.0 0.3 0.3Total 2.0 0.4 0.2 0.6 1.4

68
Table A4.5: Effective tax rates on final demand for financial institutions duty, 1992-93, percent
Private finalconsumptionexpenditure
Generalgovernmentconsumptionexpenditure
Generalgovernmentgross fixed
capitalexpenditure
ExportsTotal
final demand
Sheep 0.4 0.0 0.0 0.4 0.4Grains 0.3 0.0 0.0 0.3 0.3Beef cattle 0.3 0.0 0.0 0.3 0.3Dairy cattle 0.3 0.0 0.0 0.0 0.3Pigs 0.3 0.0 0.0 0.3 0.3Poultry 0.3 0.0 0.0 0.3 0.3Other agriculture 0.3 0.0 0.0 0.3 0.3Services to agriculture; hunting and
trapping0.3 0.3 0.0 0.3 0.3
Forestry and logging 0.2 0.2 0.2 0.2 0.2Commercial fishing 0.3 0.3 0.0 0.3 0.3Coal; oil and gas 0.2 0.0 0.0 0.2 0.2Iron ores 0.0 0.0 0.0 0.3 0.3Non-ferrous metal ores 0.0 0.0 0.0 0.3 0.3Other mining 0.3 0.0 0.0 0.3 0.3Services to mining 0.0 0.2 0.0 0.2 0.2Meat and meat products 0.4 0.0 0.0 0.4 0.4Dairy products 0.3 0.0 0.0 0.3 0.3Fruit and vegetable products 0.3 0.0 0.0 0.3 0.3Oils and fats 0.3 0.0 0.0 0.3 0.3Flour mill products and cereal foods 0.3 0.0 0.0 0.3 0.3Bakery products 0.3 0.0 0.0 0.3 0.3Confectionery 0.3 0.0 0.0 0.3 0.3Other food products 0.3 0.0 0.0 0.3 0.3Soft drinks, cordials and syrups 0.3 0.0 0.0 0.3 0.3Beer and malt 0.3 0.0 0.0 0.3 0.3Wine and spirits 0.3 0.0 0.0 0.3 0.3Tobacco products 0.6 0.0 0.0 0.6 0.6Wool scouring 0.0 0.0 0.0 0.4 0.4Textile fibres, yarns and woven fabrics 0.2 0.0 0.0 0.2 0.2Textile products 0.3 0.0 0.3 0.3 0.3Knitting mill products 0.3 0.0 0.0 0.3 0.3Clothing 0.3 0.0 0.0 0.3 0.3Footwear 0.3 0.0 0.0 0.3 0.3Leather and leather products 0.3 0.0 0.0 0.3 0.3Sawmill products 0.2 0.0 0.0 0.2 0.2Plywood, veneer and fabricated wood 0.3 0.0 0.0 0.3 0.3Other wood products 0.3 0.0 0.3 0.3 0.3Pulp, paper and paperboard 0.2 0.0 0.0 0.2 0.2Paperboard containers; paper bags and
sacks0.3 0.0 0.0 0.3 0.3
Other paper products 0.3 0.0 0.0 0.3 0.3Printing and services to printing 0.3 0.3 0.0 0.3 0.3Publishing; recorded media and
publishing0.3 0.0 0.3 0.3 0.3
Petroleum and coal products 0.3 0.0 0.0 0.3 0.3Fertilisers 0.2 0.0 0.0 0.2 0.2
continued

69Table A4.5 (cont.): Effective tax rates on final demand for financial institutions duty,
1992-93, per cent
Private finalconsumptionexpenditure
Generalgovernmentconsumptionexpenditure
Generalgovernmentgross fixed
capitalexpenditure
ExportsTotal
final demand
Other basic chemicals 0.2 0.0 0.0 0.2 0.2Paints 0.3 0.0 0.0 0.3 0.3Medicinal and pharmaceutical
products; pesticides0.3 0.0 0.0 0.3 0.3
Soap and other detergents 0.3 0.0 0.0 0.3 0.3Cosmetics and toiletry preparations 0.3 0.0 0.0 0.3 0.3Other chemical products 0.2 0.0 0.0 0.2 0.2Rubber products 0.3 0.0 0.0 0.3 0.3Plastic products 0.2 0.0 0.0 0.2 0.2Glass and glass products 0.2 0.0 0.0 0.2 0.2Ceramic products 0.2 0.0 0.0 0.2 0.2Cement and lime 0.0 0.0 0.0 0.3 0.3Concrete slurry 0.0 0.0 0.0 0.0 0.3Plaster and other concrete products 0.0 0.0 0.0 0.3 0.3Other non-metallic mineral products 0.2 0.0 0.0 0.2 0.2Iron and steel 0.3 0.0 0.0 0.3 0.3Basic non-ferrous metal and products 0.3 0.0 0.0 0.3 0.3Structural metal products 0.0 0.0 0.3 0.3 0.3Sheet metal products 0.3 0.0 0.3 0.3 0.3Fabricated metal products 0.2 0.0 0.2 0.2 0.2Motor vehicles and parts; other
transport equipment0.2 0.0 0.2 0.2 0.2
Ships and boats 0.3 0.0 0.3 0.3 0.3Railway equipment 0.0 0.0 0.3 0.3 0.3Aircraft 0.1 0.0 0.1 0.1 0.1Photographic and scientific equipment 0.2 0.0 0.2 0.2 0.2Electronic equipment 0.2 0.0 0.2 0.2 0.2Household appliances 0.2 0.0 0.2 0.2 0.2Other electrical equipment 0.2 0.0 0.2 0.2 0.2Agricultural machinery 0.2 0.0 0.2 0.2 0.2Mining and construction machinery;
lifting and material handlingequipment
0.0 0.0 0.2 0.2 0.2
Other machinery and equipment 0.2 0.0 0.2 0.2 0.2Prefabricated buildings 0.0 0.0 0.4 0.4 0.4Furniture 0.3 0.0 0.3 0.3 0.3Other manufacturing 0.3 0.0 0.3 0.3 0.3Electricity supply 0.2 0.0 0.0 0.2 0.2Gas supply 0.3 0.0 0.0 0.0 0.3Water supply; sewerage and drainage
services0.0 0.4 0.0 0.4 0.4
Residential building construction 0.0 0.0 0.3 0.3 0.3Other construction 0.0 0.3 0.3 0.3 0.3Wholesale trade 0.2 0.2 0.2 0.2 0.2Retail trade 0.3 0.0 0.0 0.0 0.3Mechanical repairs 0.2 0.0 0.0 0.2 0.2Other repairs 0.2 0.0 0.0 0.2 0.2Accommodation, cafes and restaurants 0.2 0.0 0.0 0.0 0.2Road transport 0.2 0.2 0.2 0.2 0.2
continued

70Table A4.5 (cont.): Effective tax rates on final demand for financial institutions duty,
1992-93, per cent
Private finalconsumptionexpenditure
Generalgovernmentconsumptionexpenditure
Generalgovernmentgross fixed
capitalexpenditure
ExportsTotal
final demand
Rail, pipeline and other transport 0.2 0.0 0.2 0.2 0.2Water transport 0.0 0.0 0.0 0.0 0.0Air and space transport 0.0 0.0 0.0 0.0 0.0Services to transport; storage 0.2 0.2 0.2 0.2 0.2Communication services 0.2 0.2 0.0 0.2 0.2Banking 6.9 0.0 0.0 6.9 6.9Non-bank finance 10.3 10.3 0.0 10.3 10.3Financial asset investors 0.0 0.0 0.0 0.0 0.0Insurance 0.3 0.3 0.3 0.3 0.3Services to finance, investment and
insurance0.2 0.0 0.0 0.2 0.2
Ownership of dwellings 0.9 0.9 0.0 0.0 0.9Other property services 0.2 0.2 0.0 0.2 0.2Scientific research, technical and
computer services0.2 0.2 0.2 0.2 0.2
Legal, accounting, marketing andbusiness management services
0.3 0.3 0.0 0.3 0.3
Other business services 0.2 0.2 0.0 0.2 0.2Government administration 0.1 0.1 0.0 0.0 0.1Defence 0.0 0.1 0.0 0.1 0.1Education 0.1 0.1 0.0 0.1 0.1Health services 0.3 0.3 0.0 0.3 0.3Community services 0.2 0.2 0.0 0.0 0.2Motion picture, radio and television
services0.3 0.3 0.0 0.0 0.3
Libraries, museums and the arts 0.2 0.2 0.0 0.2 0.2Sport, gambling and recreational
services0.3 0.3 0.0 0.3 0.3
Personal services 0.2 0.2 0.0 0.2 0.2Other services 0.2 0.2 0.0 0.2 0.2Total 0.5 0.2 0.3 0.3 0.4

71
Table A4.6: Effective tax rates on final demand for payroll tax, 1992-93, per cent
Private finalconsumptionexpenditure
Generalgovernmentconsumptionexpenditure
Generalgovernmentgross fixed
capitalexpenditure
ExportsTotal
final demand
Sheep 1.4 0.0 0.0 1.4 1.4Grains 1.4 0.0 0.0 1.4 1.4Beef cattle 1.4 0.0 0.0 1.4 1.4Dairy cattle 1.4 0.0 0.0 0.0 1.4Pigs 1.7 0.0 0.0 1.7 1.7Poultry 1.7 0.0 0.0 1.7 1.7Other agriculture 1.4 0.0 0.0 1.4 1.4Services to agriculture; hunting and
trapping1.4 1.4 0.0 1.4 1.4
Forestry and logging 1.7 1.7 1.7 1.7 1.7Commercial fishing 1.7 1.7 0.0 1.7 1.7Coal; oil and gas 1.3 0.0 0.0 1.3 1.3Iron ores 0.0 0.0 0.0 1.7 1.7Non-ferrous metal ores 0.0 0.0 0.0 2.1 2.1Other mining 1.5 0.0 0.0 1.5 1.5Services to mining 0.0 3.4 0.0 3.4 3.4Meat and meat products 2.0 0.0 0.0 2.0 2.0Dairy products 1.9 0.0 0.0 1.9 1.9Fruit and vegetable products 2.0 0.0 0.0 2.0 2.0Oils and fats 1.6 0.0 0.0 1.6 1.6Flour mill products and cereal foods 2.1 0.0 0.0 2.1 2.1Bakery products 2.4 0.0 0.0 2.4 2.4Confectionery 1.9 0.0 0.0 1.9 1.9Other food products 1.9 0.0 0.0 1.9 1.9Soft drinks, cordials and syrups 2.1 0.0 0.0 2.1 2.1Beer and malt 1.9 0.0 0.0 1.9 1.9Wine and spirits 1.7 0.0 0.0 1.7 1.7Tobacco products 2.0 0.0 0.0 2.0 2.0Wool scouring 0.0 0.0 0.0 1.9 1.9Textile fibres, yarns and woven fabrics 1.3 0.0 0.0 1.3 1.3Textile products 1.6 0.0 1.6 1.6 1.6Knitting mill products 1.4 0.0 0.0 1.4 1.4Clothing 1.6 0.0 0.0 1.6 1.6Footwear 1.4 0.0 0.0 1.4 1.4Leather and leather products 1.5 0.0 0.0 1.5 1.5Sawmill products 1.7 0.0 0.0 1.7 1.7Plywood, veneer and fabricated wood 2.2 0.0 0.0 2.2 2.2Other wood products 2.0 0.0 2.0 2.0 2.0Pulp, paper and paperboard 1.1 0.0 0.0 1.1 1.1Paperboard containers; paper bags and
sacks2.4 0.0 0.0 2.4 2.4
Other paper products 2.7 0.0 0.0 2.7 2.7Printing and services to printing 1.8 1.8 0.0 1.8 1.8Publishing; recorded media and
publishing1.9 0.0 1.9 1.9 1.9
Petroleum and coal products 1.5 0.0 0.0 1.5 1.5Fertilisers 1.4 0.0 0.0 1.4 1.4
continued

72
Table A4.6 (cont.): Effective tax rates on final demand for payroll tax, 1992-93, per cent
Private finalconsumptionexpenditure
Generalgovernmentconsumptionexpenditure
Generalgovernmentgross fixed
capitalexpenditure
ExportsTotal
final demand
Other basic chemicals 1.3 0.0 0.0 1.3 1.3Paints 1.4 0.0 0.0 1.4 1.4Medicinal and pharmaceutical products;
pesticides1.8 0.0 0.0 1.8 1.8
Soap and other detergents 1.5 0.0 0.0 1.5 1.5Cosmetics and toiletry preparations 1.7 0.0 0.0 1.7 1.7Other chemical products 1.6 0.0 0.0 1.6 1.6Rubber products 1.5 0.0 0.0 1.5 1.5Plastic products 1.6 0.0 0.0 1.6 1.6Glass and glass products 1.8 0.0 0.0 1.8 1.8Ceramic products 1.7 0.0 0.0 1.7 1.7Cement and lime 0.0 0.0 0.0 1.8 1.8Concrete slurry 0.0 0.0 0.0 0.0 2.3Plaster and other concrete products 0.0 0.0 0.0 2.4 2.4Other non-metallic mineral products 1.8 0.0 0.0 1.8 1.8Iron and steel 2.5 0.0 0.0 2.5 2.5Basic non-ferrous metal and products 2.0 0.0 0.0 2.0 2.0Structural metal products 0.0 0.0 2.3 2.3 2.3Sheet metal products 2.8 0.0 2.8 2.8 2.8Fabricated metal products 1.9 0.0 1.9 1.9 1.9Motor vehicles and parts; other transport
equipment1.8 0.0 1.8 1.8 1.8
Ships and boats 2.6 0.0 2.6 2.6 2.6Railway equipment 0.0 0.0 6.5 6.5 6.5Aircraft 0.7 0.0 0.7 0.7 0.7Photographic and scientific equipment 1.4 0.0 1.4 1.4 1.4Electronic equipment 1.1 0.0 1.1 1.1 1.1Household appliances 1.9 0.0 1.9 1.9 1.9Other electrical equipment 2.0 0.0 2.0 2.0 2.0Agricultural machinery 1.9 0.0 1.9 1.9 1.9Mining and construction machinery;
lifting and material handling equipment0.0 0.0 2.3 2.3 2.3
Other machinery and equipment 1.8 0.0 1.8 1.8 1.8Prefabricated buildings 0.0 0.0 3.2 3.2 3.2Furniture 2.3 0.0 2.3 2.3 2.3Other manufacturing 1.5 0.0 1.5 1.5 1.5Electricity supply 1.2 0.0 0.0 1.2 1.2Gas supply 2.3 0.0 0.0 0.0 2.3Water supply; sewerage and drainage
services0.0 2.3 0.0 2.3 2.3
Residential building construction 0.0 0.0 8.9 8.9 8.9Other construction 0.0 3.5 3.5 3.5 3.5Wholesale trade 2.8 2.8 2.8 2.8 2.8Retail trade 2.6 0.0 0.0 0.0 2.6Mechanical repairs 2.0 0.0 0.0 2.0 2.0Other repairs 1.8 0.0 0.0 1.8 1.8Accommodation, cafes and restaurants 1.7 0.0 0.0 0.0 1.7Road transport 2.2 2.2 2.2 2.2 2.2Rail, pipeline and other transport 4.1 0.0 4.1 4.1 4.1
continued

73
Table A4.6 (cont.): Effective tax rates on final demand for payroll tax, 1992-93, per cent
Private finalconsumptionexpenditure
Generalgovernmentconsumptionexpenditure
Generalgovernmentgross fixed
capitalexpenditure
ExportsTotal
final demand
Water transport 0.0 0.0 0.0 0.0 0.0Air and space transport 0.0 0.0 0.0 0.0 0.0Services to transport; storage 2.3 2.3 2.3 2.3 2.3Communication services 2.5 2.5 0.0 2.5 2.5Banking 2.6 0.0 0.0 2.6 2.6Non-bank finance 3.2 3.2 0.0 3.2 3.2Financial asset investors 0.0 0.0 0.0 0.0 0.0Insurance 2.9 2.9 2.9 2.9 2.9Services to finance, investment and
insurance2.3 0.0 0.0 2.3 2.3
Ownership of dwellings 1.3 1.3 0.0 0.0 1.3Other property services 2.1 2.1 0.0 2.1 2.1Scientific research, technical and
computer services2.4 2.4 2.4 2.4 2.4
Legal, accounting, marketing andbusiness management services
2.3 2.3 0.0 2.3 2.3
Other business services 2.4 2.4 0.0 2.4 2.4Government administration 1.1 1.1 0.0 0.0 1.1Defence 0.0 0.7 0.0 0.7 0.7Education 0.6 0.6 0.0 0.6 0.6Health services 0.9 0.9 0.0 0.9 0.9Community services 1.2 1.2 0.0 0.0 1.2Motion picture, radio and television
services1.7 1.7 0.0 0.0 1.7
Libraries, museums and the arts 1.5 1.5 0.0 1.5 1.5Sport, gambling and recreational
services1.6 1.6 0.0 1.6 1.6
Personal services 2.3 2.3 0.0 2.3 2.3Other services 1.7 1.7 0.0 1.7 1.7Total 1.6 1.1 3.0 1.8 1.6

74
Table A4.7: Effective tax rates on final demand for primary production taxes, 1992-93, percent
Private finalconsumptionexpenditure
Generalgovernmentconsumptionexpenditure
Generalgovernmentgross fixed
capitalexpenditure
ExportsTotal
final demand
Sheep 6.8 0.0 0.0 6.8 6.8Grains 1.3 0.0 0.0 1.3 1.3Beef cattle 1.5 0.0 0.0 1.5 1.5Dairy cattle 0.1 0.0 0.0 0.0 0.1Pigs 1.7 0.0 0.0 1.7 1.7Poultry 0.3 0.0 0.0 0.3 0.3Other agriculture 0.4 0.0 0.0 0.4 0.4Services to agriculture; hunting and
trapping0.0 0.0 0.0 0.0 0.0
Forestry and logging 0.0 0.0 0.0 0.0 0.0Commercial fishing 0.6 0.6 0.0 0.6 0.6Coal; oil and gas 0.0 0.0 0.0 0.0 0.0Iron ores 0.0 0.0 0.0 0.0 0.0Non-ferrous metal ores 0.0 0.0 0.0 0.0 0.0Other mining 0.0 0.0 0.0 0.0 0.0Services to mining 0.0 0.0 0.0 0.0 0.0Meat and meat products 1.2 0.0 0.0 1.2 1.2Dairy products 3.1 0.0 0.0 3.1 3.1Fruit and vegetable products 0.1 0.0 0.0 0.1 0.1Oils and fats 0.3 0.0 0.0 0.3 0.3Flour mill products and cereal foods 0.3 0.0 0.0 0.3 0.3Bakery products 0.1 0.0 0.0 0.1 0.1Confectionery 0.1 0.0 0.0 0.1 0.1Other food products 0.2 0.0 0.0 0.2 0.2Soft drinks, cordials and syrups 0.0 0.0 0.0 0.0 0.0Beer and malt 0.2 0.0 0.0 0.2 0.2Wine and spirits 0.1 0.0 0.0 0.1 0.1Tobacco products 0.1 0.0 0.0 0.1 0.1Wool scouring 0.0 0.0 0.0 3.9 3.9Textile fibres, yarns and woven fabrics 0.4 0.0 0.0 0.4 0.4Textile products 0.2 0.0 0.2 0.2 0.2Knitting mill products 0.0 0.0 0.0 0.0 0.0Clothing 0.1 0.0 0.0 0.1 0.1Footwear 0.0 0.0 0.0 0.0 0.0Leather and leather products 0.4 0.0 0.0 0.4 0.4Sawmill products 0.0 0.0 0.0 0.0 0.0Plywood, veneer and fabricated wood 0.0 0.0 0.0 0.0 0.0Other wood products 0.0 0.0 0.0 0.0 0.0Pulp, paper and paperboard 0.0 0.0 0.0 0.0 0.0Paperboard containers; paper bags and
sacks0.0 0.0 0.0 0.0 0.0
Other paper products 0.0 0.0 0.0 0.0 0.0Printing and services to printing 0.0 0.0 0.0 0.0 0.0Publishing; recorded media and
publishing0.0 0.0 0.0 0.0 0.0
Petroleum and coal products 0.0 0.0 0.0 0.0 0.0Fertilisers 0.1 0.0 0.0 0.1 0.1
continued
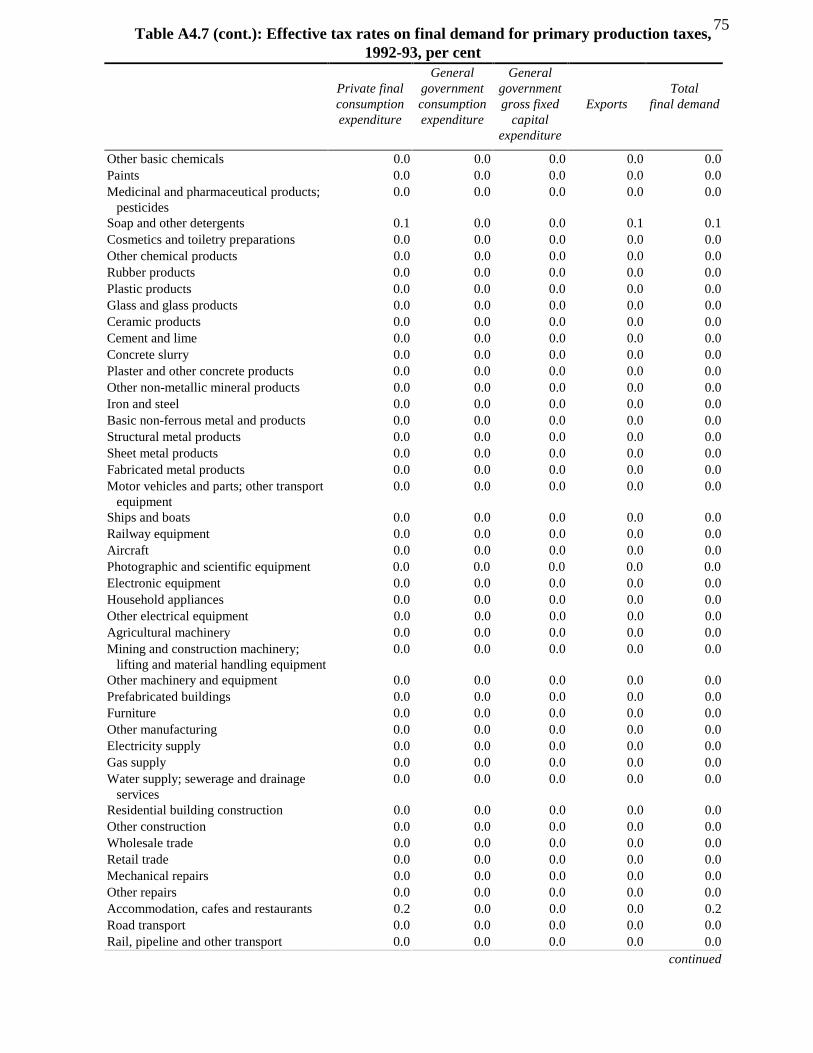
75Table A4.7 (cont.): Effective tax rates on final demand for primary production taxes,
1992-93, per cent
Private finalconsumptionexpenditure
Generalgovernmentconsumptionexpenditure
Generalgovernmentgross fixed
capitalexpenditure
ExportsTotal
final demand
Other basic chemicals 0.0 0.0 0.0 0.0 0.0Paints 0.0 0.0 0.0 0.0 0.0Medicinal and pharmaceutical products;
pesticides0.0 0.0 0.0 0.0 0.0
Soap and other detergents 0.1 0.0 0.0 0.1 0.1Cosmetics and toiletry preparations 0.0 0.0 0.0 0.0 0.0Other chemical products 0.0 0.0 0.0 0.0 0.0Rubber products 0.0 0.0 0.0 0.0 0.0Plastic products 0.0 0.0 0.0 0.0 0.0Glass and glass products 0.0 0.0 0.0 0.0 0.0Ceramic products 0.0 0.0 0.0 0.0 0.0Cement and lime 0.0 0.0 0.0 0.0 0.0Concrete slurry 0.0 0.0 0.0 0.0 0.0Plaster and other concrete products 0.0 0.0 0.0 0.0 0.0Other non-metallic mineral products 0.0 0.0 0.0 0.0 0.0Iron and steel 0.0 0.0 0.0 0.0 0.0Basic non-ferrous metal and products 0.0 0.0 0.0 0.0 0.0Structural metal products 0.0 0.0 0.0 0.0 0.0Sheet metal products 0.0 0.0 0.0 0.0 0.0Fabricated metal products 0.0 0.0 0.0 0.0 0.0Motor vehicles and parts; other transport
equipment0.0 0.0 0.0 0.0 0.0
Ships and boats 0.0 0.0 0.0 0.0 0.0Railway equipment 0.0 0.0 0.0 0.0 0.0Aircraft 0.0 0.0 0.0 0.0 0.0Photographic and scientific equipment 0.0 0.0 0.0 0.0 0.0Electronic equipment 0.0 0.0 0.0 0.0 0.0Household appliances 0.0 0.0 0.0 0.0 0.0Other electrical equipment 0.0 0.0 0.0 0.0 0.0Agricultural machinery 0.0 0.0 0.0 0.0 0.0Mining and construction machinery;
lifting and material handling equipment0.0 0.0 0.0 0.0 0.0
Other machinery and equipment 0.0 0.0 0.0 0.0 0.0Prefabricated buildings 0.0 0.0 0.0 0.0 0.0Furniture 0.0 0.0 0.0 0.0 0.0Other manufacturing 0.0 0.0 0.0 0.0 0.0Electricity supply 0.0 0.0 0.0 0.0 0.0Gas supply 0.0 0.0 0.0 0.0 0.0Water supply; sewerage and drainage
services0.0 0.0 0.0 0.0 0.0
Residential building construction 0.0 0.0 0.0 0.0 0.0Other construction 0.0 0.0 0.0 0.0 0.0Wholesale trade 0.0 0.0 0.0 0.0 0.0Retail trade 0.0 0.0 0.0 0.0 0.0Mechanical repairs 0.0 0.0 0.0 0.0 0.0Other repairs 0.0 0.0 0.0 0.0 0.0Accommodation, cafes and restaurants 0.2 0.0 0.0 0.0 0.2Road transport 0.0 0.0 0.0 0.0 0.0Rail, pipeline and other transport 0.0 0.0 0.0 0.0 0.0
continued

76Table A4.7 (cont.): Effective tax rates on final demand for primary production taxes,
1992-93, per cent
Private finalconsumptionexpenditure
Generalgovernmentconsumptionexpenditure
Generalgovernmentgross fixed
capitalexpenditure
ExportsTotal
final demand
Water transport 0.0 0.0 0.0 0.0 0.0Air and space transport 0.0 0.0 0.0 0.0 0.0Services to transport; storage 0.0 0.0 0.0 0.0 0.0Communication services 0.0 0.0 0.0 0.0 0.0Banking 0.0 0.0 0.0 0.0 0.0Non-bank finance 0.0 0.0 0.0 0.0 0.0Financial asset investors 0.0 0.0 0.0 0.0 0.0Insurance 0.0 0.0 0.0 0.0 0.0Services to finance, investment and
insurance0.0 0.0 0.0 0.0 0.0
Ownership of dwellings 0.0 0.0 0.0 0.0 0.0Other property services 0.0 0.0 0.0 0.0 0.0Scientific research, technical and
computer services0.0 0.0 0.0 0.0 0.0
Legal, accounting, marketing andbusiness management services
0.0 0.0 0.0 0.0 0.0
Other business services 0.0 0.0 0.0 0.0 0.0Government administration 0.0 0.0 0.0 0.0 0.0Defence 0.0 0.0 0.0 0.0 0.0Education 0.0 0.0 0.0 0.0 0.0Health services 0.0 0.0 0.0 0.0 0.0Community services 0.0 0.0 0.0 0.0 0.0Motion picture, radio and television
services0.0 0.0 0.0 0.0 0.0
Libraries, museums and the arts 0.0 0.0 0.0 0.0 0.0Sport, gambling and recreational
services0.0 0.0 0.0 0.0 0.0
Personal services 0.0 0.0 0.0 0.0 0.0Other services 0.0 0.0 0.0 0.0 0.0Total 0.1 0.0 0.0 0.5 0.2

77
Table A4.8: Effective tax rates on final demand for land tax, 1992-93, per cent
Private finalconsumptionexpenditure
Generalgovernmentconsumptionexpenditure
Generalgovernmentgross fixed
capitalexpenditure
ExportsTotal
final demand
Sheep 0.3 0.0 0.0 0.3 0.3Grains 0.3 0.0 0.0 0.3 0.3Beef cattle 0.3 0.0 0.0 0.3 0.3Dairy cattle 0.3 0.0 0.0 0.0 0.3Pigs 0.3 0.0 0.0 0.3 0.3Poultry 0.3 0.0 0.0 0.3 0.3Other agriculture 0.3 0.0 0.0 0.3 0.3Services to agriculture; hunting and
trapping0.3 0.3 0.0 0.3 0.3
Forestry and logging 0.3 0.3 0.3 0.3 0.3Commercial fishing 0.4 0.4 0.0 0.4 0.4Coal; oil and gas 0.4 0.0 0.0 0.4 0.4Iron ores 0.0 0.0 0.0 0.5 0.5Non-ferrous metal ores 0.0 0.0 0.0 0.5 0.5Other mining 0.5 0.0 0.0 0.5 0.5Services to mining 0.0 0.8 0.0 0.8 0.8Meat and meat products 0.5 0.0 0.0 0.5 0.5Dairy products 0.5 0.0 0.0 0.5 0.5Fruit and vegetable products 0.5 0.0 0.0 0.5 0.5Oils and fats 0.4 0.0 0.0 0.4 0.4Flour mill products and cereal foods 0.6 0.0 0.0 0.6 0.6Bakery products 0.6 0.0 0.0 0.6 0.6Confectionery 0.6 0.0 0.0 0.6 0.6Other food products 0.5 0.0 0.0 0.5 0.5Soft drinks, cordials and syrups 0.5 0.0 0.0 0.5 0.5Beer and malt 0.6 0.0 0.0 0.6 0.6Wine and spirits 0.5 0.0 0.0 0.5 0.5Tobacco products 0.5 0.0 0.0 0.5 0.5Wool scouring 0.0 0.0 0.0 0.5 0.5Textile fibres, yarns and woven fabrics 0.3 0.0 0.0 0.3 0.3Textile products 0.4 0.0 0.4 0.4 0.4Knitting mill products 0.4 0.0 0.0 0.4 0.4Clothing 0.4 0.0 0.0 0.4 0.4Footwear 0.4 0.0 0.0 0.4 0.4Leather and leather products 0.4 0.0 0.0 0.4 0.4Sawmill products 0.5 0.0 0.0 0.5 0.5Plywood, veneer and fabricated wood 0.7 0.0 0.0 0.7 0.7Other wood products 0.6 0.0 0.6 0.6 0.6Pulp, paper and paperboard 0.2 0.0 0.0 0.2 0.2Paperboard containers; paper bags and
sacks0.6 0.0 0.0 0.6 0.6
Other paper products 1.0 0.0 0.0 1.0 1.0Printing and services to printing 0.4 0.4 0.0 0.4 0.4Publishing; recorded media and
publishing0.5 0.0 0.5 0.5 0.5
Petroleum and coal products 0.5 0.0 0.0 0.5 0.5Fertilisers 0.7 0.0 0.0 0.7 0.7Other basic chemicals 0.4 0.0 0.0 0.4 0.4
continued

78
Table A4.8 (cont.): Effective tax rates on final demand for land tax, 1992-93, per cent
Private finalconsumptionexpenditure
Generalgovernmentconsumptionexpenditure
Generalgovernmentgross fixed
capitalexpenditure
ExportsTotal
final demand
Paints 0.5 0.0 0.0 0.5 0.5Medicinal and pharmaceutical products;
pesticides0.5 0.0 0.0 0.5 0.5
Soap and other detergents 0.5 0.0 0.0 0.5 0.5Cosmetics and toiletry preparations 0.5 0.0 0.0 0.5 0.5Other chemical products 0.4 0.0 0.0 0.4 0.4Rubber products 0.4 0.0 0.0 0.4 0.4Plastic products 0.4 0.0 0.0 0.4 0.4Glass and glass products 0.4 0.0 0.0 0.4 0.4Ceramic products 0.4 0.0 0.0 0.4 0.4Cement and lime 0.0 0.0 0.0 0.6 0.6Concrete slurry 0.0 0.0 0.0 0.0 0.6Plaster and other concrete products 0.0 0.0 0.0 0.6 0.6Other non-metallic mineral products 0.6 0.0 0.0 0.6 0.6Iron and steel 0.5 0.0 0.0 0.5 0.5Basic non-ferrous metal and products 0.4 0.0 0.0 0.4 0.4Structural metal products 0.0 0.0 0.5 0.5 0.5Sheet metal products 0.6 0.0 0.6 0.6 0.6Fabricated metal products 0.5 0.0 0.5 0.5 0.5Motor vehicles and parts; other
transport equipment0.4 0.0 0.4 0.4 0.4
Ships and boats 0.6 0.0 0.6 0.6 0.6Railway equipment 0.0 0.0 0.4 0.4 0.4Aircraft 0.3 0.0 0.3 0.3 0.3Photographic and scientific equipment 0.4 0.0 0.4 0.4 0.4Electronic equipment 0.3 0.0 0.3 0.3 0.3Household appliances 0.4 0.0 0.4 0.4 0.4Other electrical equipment 0.4 0.0 0.4 0.4 0.4Agricultural machinery 0.4 0.0 0.4 0.4 0.4Mining and construction machinery;
lifting and material handlingequipment
0.0 0.0 0.4 0.4 0.4
Other machinery and equipment 0.3 0.0 0.3 0.3 0.3Prefabricated buildings 0.0 0.0 0.5 0.5 0.5Furniture 0.6 0.0 0.6 0.6 0.6Other manufacturing 0.5 0.0 0.5 0.5 0.5Electricity supply 0.4 0.0 0.0 0.4 0.4Gas supply 0.4 0.0 0.0 0.0 0.4Water supply; sewerage and drainage
services0.0 0.9 0.0 0.9 0.9
Residential building construction 0.0 0.0 0.9 0.9 0.9Other construction 0.0 0.7 0.7 0.7 0.7Wholesale trade 1.4 1.4 1.4 1.4 1.4Retail trade 1.3 0.0 0.0 0.0 1.3Mechanical repairs 1.3 0.0 0.0 1.3 1.3Other repairs 1.1 0.0 0.0 1.1 1.1Accommodation, cafes and restaurants 0.7 0.0 0.0 0.0 0.7Road transport 0.6 0.6 0.6 0.6 0.6Rail, pipeline and other transport 0.5 0.0 0.5 0.5 0.5
continued

79
Table A4.8 (cont.): Effective tax rates on final demand for land tax, 1992-93, per cent
Private finalconsumptionexpenditure
Generalgovernmentconsumptionexpenditure
Generalgovernmentgross fixed
capitalexpenditure
ExportsTotal
final demand
Water transport 0.0 0.0 0.0 0.0 0.0Air and space transport 0.0 0.0 0.0 0.0 0.0Services to transport; storage 0.5 0.5 0.5 0.5 0.5Communication services 0.6 0.6 0.0 0.6 0.6Banking 0.9 0.0 0.0 0.9 0.9Non-bank finance 1.2 1.2 0.0 1.2 1.2Financial asset investors 0.0 0.0 0.0 0.0 0.0Insurance 0.8 0.8 0.8 0.8 0.8Services to finance, investment and
insurance0.7 0.0 0.0 0.7 0.7
Ownership of dwellings 0.3 0.3 0.0 0.0 0.3Other property services 0.6 0.6 0.0 0.6 0.6Scientific research, technical and
computer services0.7 0.7 0.7 0.7 0.7
Legal, accounting, marketing andbusiness management services
0.7 0.7 0.0 0.7 0.7
Other business services 0.7 0.7 0.0 0.7 0.7Government administration 0.4 0.4 0.0 0.0 0.4Defence 0.0 0.2 0.0 0.2 0.2Education 0.8 0.8 0.0 0.8 0.8Health services 0.8 0.8 0.0 0.8 0.8Community services 0.9 0.9 0.0 0.0 0.9Motion picture, radio and television
services0.7 0.7 0.0 0.0 0.7
Libraries, museums and the arts 0.5 0.5 0.0 0.5 0.5Sport, gambling and recreational
services0.7 0.7 0.0 0.7 0.7
Personal services 1.3 1.3 0.0 1.3 1.3Other services 0.7 0.7 0.0 0.7 0.7Total 0.6 0.6 0.6 0.5 0.5

80
Table A4.9: Effective tax rates on final demand for municipal rates, 1992-93, per cent
Private finalconsumptionexpenditure
Generalgovernmentconsumptionexpenditure
Generalgovernmentgross fixed
capitalexpenditure
ExportsTotalfinal
demand
Sheep 2.1 0.0 0.0 2.1 2.1Grains 2.0 0.0 0.0 2.0 2.0Beef cattle 2.3 0.0 0.0 2.3 2.3Dairy cattle 2.3 0.0 0.0 0.0 2.3Pigs 2.6 0.0 0.0 2.6 2.6Poultry 2.5 0.0 0.0 2.5 2.5Other agriculture 1.8 0.0 0.0 1.8 1.8Services to agriculture; hunting and
trapping2.1 2.1 0.0 2.1 2.1
Forestry and logging 2.3 2.3 2.3 2.3 2.3Commercial fishing 2.0 2.0 0.0 2.0 2.0Coal; oil and gas 0.3 0.0 0.0 0.3 0.3Iron ores 0.0 0.0 0.0 0.3 0.3Non-ferrous metal ores 0.0 0.0 0.0 0.4 0.4Other mining 0.3 0.0 0.0 0.3 0.3Services to mining 0.0 0.4 0.0 0.4 0.4Meat and meat products 1.4 0.0 0.0 1.4 1.4Dairy products 1.5 0.0 0.0 1.5 1.5Fruit and vegetable products 0.8 0.0 0.0 0.8 0.8Oils and fats 0.6 0.0 0.0 0.6 0.6Flour mill products and cereal foods 1.0 0.0 0.0 1.0 1.0Bakery products 0.7 0.0 0.0 0.7 0.7Confectionery 0.4 0.0 0.0 0.4 0.4Other food products 0.7 0.0 0.0 0.7 0.7Soft drinks, cordials and syrups 0.5 0.0 0.0 0.5 0.5Beer and malt 0.6 0.0 0.0 0.6 0.6Wine and spirits 0.6 0.0 0.0 0.6 0.6Tobacco products 0.6 0.0 0.0 0.6 0.6Wool scouring 0.0 0.0 0.0 1.4 1.4Textile fibres, yarns and woven fabrics 0.6 0.0 0.0 0.6 0.6Textile products 0.4 0.0 0.4 0.4 0.4Knitting mill products 0.3 0.0 0.0 0.3 0.3Clothing 0.4 0.0 0.0 0.4 0.4Footwear 0.3 0.0 0.0 0.3 0.3Leather and leather products 0.5 0.0 0.0 0.5 0.5Sawmill products 0.6 0.0 0.0 0.6 0.6Plywood, veneer and fabricated wood 0.8 0.0 0.0 0.8 0.8Other wood products 0.6 0.0 0.6 0.6 0.6Pulp, paper and paperboard 0.3 0.0 0.0 0.3 0.3Paperboard containers; paper bags and
sacks0.6 0.0 0.0 0.6 0.6
Other paper products 0.6 0.0 0.0 0.6 0.6Printing and services to printing 0.4 0.4 0.0 0.4 0.4Publishing; recorded media and
publishing0.3 0.0 0.3 0.3 0.3
Petroleum and coal products 0.4 0.0 0.0 0.4 0.4Fertilisers 0.5 0.0 0.0 0.5 0.5
continued

81
Table A4.9 (cont.): Effective tax rates on final demand for municipal rates, 1992-93, per cent
Private finalconsumptionexpenditure
Generalgovernmentconsumptionexpenditure
Generalgovernmentgross fixed
capitalexpenditure
ExportsTotalfinal
demand
Other basic chemicals 0.3 0.0 0.0 0.3 0.3Paints 0.5 0.0 0.0 0.5 0.5Medicinal and pharmaceutical products;
pesticides0.3 0.0 0.0 0.3 0.3
Soap and other detergents 0.5 0.0 0.0 0.5 0.5Cosmetics and toiletry preparations 0.3 0.0 0.0 0.3 0.3Other chemical products 0.3 0.0 0.0 0.3 0.3Rubber products 0.3 0.0 0.0 0.3 0.3Plastic products 0.4 0.0 0.0 0.4 0.4Glass and glass products 0.3 0.0 0.0 0.3 0.3Ceramic products 0.5 0.0 0.0 0.5 0.5Cement and lime 0.0 0.0 0.0 0.6 0.6Concrete slurry 0.0 0.0 0.0 0.0 0.5Plaster and other concrete products 0.0 0.0 0.0 0.6 0.6Other non-metallic mineral products 0.7 0.0 0.0 0.7 0.7Iron and steel 0.4 0.0 0.0 0.4 0.4Basic non-ferrous metal and products 0.4 0.0 0.0 0.4 0.4Structural metal products 0.0 0.0 0.5 0.5 0.5Sheet metal products 0.6 0.0 0.6 0.6 0.6Fabricated metal products 0.4 0.0 0.4 0.4 0.4Motor vehicles and parts; other transport
equipment0.3 0.0 0.3 0.3 0.3
Ships and boats 0.5 0.0 0.5 0.5 0.5Railway equipment 0.0 0.0 0.4 0.4 0.4Aircraft 0.3 0.0 0.3 0.3 0.3Photographic and scientific equipment 0.2 0.0 0.2 0.2 0.2Electronic equipment 0.2 0.0 0.2 0.2 0.2Household appliances 0.3 0.0 0.3 0.3 0.3Other electrical equipment 0.4 0.0 0.4 0.4 0.4Agricultural machinery 0.3 0.0 0.3 0.3 0.3Mining and construction machinery;
lifting and material handling equipment0.0 0.0 0.3 0.3 0.3
Other machinery and equipment 0.2 0.0 0.2 0.2 0.2Prefabricated buildings 0.0 0.0 0.5 0.5 0.5Furniture 0.6 0.0 0.6 0.6 0.6Other manufacturing 0.4 0.0 0.4 0.4 0.4Electricity supply 0.4 0.0 0.0 0.4 0.4Gas supply 0.4 0.0 0.0 0.0 0.4Water supply; sewerage and drainage
services0.0 0.3 0.0 0.3 0.3
Residential building construction 0.0 0.0 0.5 0.5 0.5Other construction 0.0 0.4 0.4 0.4 0.4Wholesale trade 0.7 0.7 0.7 0.7 0.7Retail trade 0.6 0.0 0.0 0.0 0.6Mechanical repairs 0.6 0.0 0.0 0.6 0.6Other repairs 0.5 0.0 0.0 0.5 0.5Accommodation, cafes and restaurants 0.6 0.0 0.0 0.0 0.6Road transport 0.3 0.3 0.3 0.3 0.3Rail, pipeline and other transport 0.3 0.0 0.3 0.3 0.3Water transport 0.0 0.0 0.0 0.0 0.0
continued

82
Table A4.9 (cont.): Effective tax rates on final demand for municipal rates, 1992-93, per cent
Private finalconsumptionexpenditure
Generalgovernmentconsumptionexpenditure
Generalgovernmentgross fixed
capitalexpenditure
ExportsTotalfinal
demand
Air and space transport 0.0 0.0 0.0 0.0 0.0Services to transport; storage 0.3 0.3 0.3 0.3 0.3Communication services 0.3 0.3 0.0 0.3 0.3Banking 0.4 0.0 0.0 0.4 0.4Non-bank finance 0.5 0.5 0.0 0.5 0.5Financial asset investors 0.0 0.0 0.0 0.0 0.0Insurance 0.4 0.4 0.4 0.4 0.4Services to finance, investment and
insurance0.4 0.0 0.0 0.4 0.4
Ownership of dwellings 6.8 6.8 0.0 0.0 6.8Other property services 0.3 0.3 0.0 0.3 0.3Scientific research, technical and
computer services0.4 0.4 0.4 0.4 0.4
Legal, accounting, marketing andbusiness management services
0.3 0.3 0.0 0.3 0.3
Other business services 0.3 0.3 0.0 0.3 0.3Government administration 0.1 0.1 0.0 0.0 0.1Defence 0.0 0.2 0.0 0.2 0.2Education 0.4 0.4 0.0 0.4 0.4Health services 0.4 0.4 0.0 0.4 0.4Community services 0.5 0.5 0.0 0.0 0.5Motion picture, radio and television
services0.4 0.4 0.0 0.0 0.4
Libraries, museums and the arts 0.3 0.3 0.0 0.3 0.3Sport, gambling and recreational
services0.4 0.4 0.0 0.4 0.4
Personal services 0.7 0.7 0.0 0.7 0.7Other services 0.4 0.4 0.0 0.4 0.4Total 1.8 0.3 0.4 0.6 1.3

83
Table A4.10: Effective tax rates on final demand for other indirect taxes, 1992-93, per cent
Private finalconsumptionexpenditure
Generalgovernmentconsumptionexpenditure
Generalgovernmentgross fixed
capitalexpenditure
ExportsTotalfinal
demand
Sheep 1.5 0.0 0.0 1.5 1.5Grains 1.6 0.0 0.0 1.6 1.6Beef cattle 1.6 0.0 0.0 1.6 1.6Dairy cattle 1.6 0.0 0.0 0.0 1.6Pigs 1.8 0.0 0.0 1.8 1.8Poultry 1.7 0.0 0.0 1.7 1.7Other agriculture 1.6 0.0 0.0 1.6 1.6Services to agriculture; hunting and
trapping1.3 1.3 0.0 1.3 1.3
Forestry and logging 1.5 1.5 1.5 1.5 1.5Commercial fishing 2.1 2.1 0.0 2.1 2.1Coal; oil and gas 1.0 0.0 0.0 1.0 1.0Iron ores 0.0 0.0 0.0 2.0 2.0Non-ferrous metal ores 0.0 0.0 0.0 1.3 1.3Other mining 1.1 0.0 0.0 1.1 1.1Services to mining 0.0 2.1 0.0 2.1 2.1Meat and meat products 1.5 0.0 0.0 1.5 1.5Dairy products 1.4 0.0 0.0 1.4 1.4Fruit and vegetable products 1.2 0.0 0.0 1.2 1.2Oils and fats 1.1 0.0 0.0 1.1 1.1Flour mill products and cereal foods 1.5 0.0 0.0 1.5 1.5Bakery products 1.3 0.0 0.0 1.3 1.3Confectionery 1.2 0.0 0.0 1.2 1.2Other food products 1.4 0.0 0.0 1.4 1.4Soft drinks, cordials and syrups 1.4 0.0 0.0 1.4 1.4Beer and malt 1.5 0.0 0.0 1.5 1.5Wine and spirits 15.7 0.0 0.0 15.7 15.7Tobacco products 8.3 0.0 0.0 8.3 8.3Wool scouring 0.0 0.0 0.0 1.5 1.5Textile fibres, yarns and woven fabrics 0.7 0.0 0.0 0.7 0.7Textile products 0.9 0.0 0.9 0.9 0.9Knitting mill products 0.8 0.0 0.0 0.8 0.8Clothing 1.0 0.0 0.0 1.0 1.0Footwear 0.8 0.0 0.0 0.8 0.8Leather and leather products 1.0 0.0 0.0 1.0 1.0Sawmill products 1.0 0.0 0.0 1.0 1.0Plywood, veneer and fabricated wood 1.2 0.0 0.0 1.2 1.2Other wood products 1.1 0.0 1.1 1.1 1.1Pulp, paper and paperboard 0.7 0.0 0.0 0.7 0.7Paperboard containers; paper bags and
sacks1.2 0.0 0.0 1.2 1.2
Other paper products 1.3 0.0 0.0 1.3 1.3Printing and services to printing 1.0 1.0 0.0 1.0 1.0Publishing; recorded media and
publishing1.2 0.0 1.2 1.2 1.2
Petroleum and coal products 1.3 0.0 0.0 1.3 1.3Fertilisers 1.2 0.0 0.0 1.2 1.2
continued

84Table A4.10 (cont.): Effective tax rates on final demand for other indirect taxes, 1992-93,
per cent
Private finalconsumptionexpenditure
Generalgovernmentconsumptionexpenditure
Generalgovernmentgross fixed
capitalexpenditure
ExportsTotalfinal
demand
Other basic chemicals 0.8 0.0 0.0 0.8 0.8Paints 1.1 0.0 0.0 1.1 1.1Medicinal and pharmaceutical products;
pesticides1.1 0.0 0.0 1.1 1.1
Soap and other detergents 1.1 0.0 0.0 1.1 1.1Cosmetics and toiletry preparations 1.2 0.0 0.0 1.2 1.2Other chemical products 0.9 0.0 0.0 0.9 0.9Rubber products 0.8 0.0 0.0 0.8 0.8Plastic products 0.9 0.0 0.0 0.9 0.9Glass and glass products 1.4 0.0 0.0 1.4 1.4Ceramic products 1.3 0.0 0.0 1.3 1.3Cement and lime 0.0 0.0 0.0 1.8 1.8Concrete slurry 0.0 0.0 0.0 0.0 1.5Plaster and other concrete products 0.0 0.0 0.0 1.3 1.3Other non-metallic mineral products 1.2 0.0 0.0 1.2 1.2Iron and steel 1.3 0.0 0.0 1.3 1.3Basic non-ferrous metal and products 1.4 0.0 0.0 1.4 1.4Structural metal products 0.0 0.0 1.2 1.2 1.2Sheet metal products 1.2 0.0 1.2 1.2 1.2Fabricated metal products 0.9 0.0 0.9 0.9 0.9Motor vehicles and parts; other transport
equipment0.9 0.0 0.9 0.9 0.9
Ships and boats 1.1 0.0 1.1 1.1 1.1Railway equipment 0.0 0.0 1.1 1.1 1.1Aircraft 0.5 0.0 0.5 0.5 0.5Photographic and scientific equipment 0.7 0.0 0.7 0.7 0.7Electronic equipment 0.6 0.0 0.6 0.6 0.6Household appliances 0.8 0.0 0.8 0.8 0.8Other electrical equipment 0.9 0.0 0.9 0.9 0.9Agricultural machinery 0.8 0.0 0.8 0.8 0.8Mining and construction machinery;
lifting and material handling equipment0.0 0.0 0.8 0.8 0.8
Other machinery and equipment 0.6 0.0 0.6 0.6 0.6Prefabricated buildings 0.0 0.0 1.2 1.2 1.2Furniture 1.1 0.0 1.1 1.1 1.1Other manufacturing 1.0 0.0 1.0 1.0 1.0Electricity supply 1.6 0.0 0.0 1.6 1.6Gas supply 12.2 0.0 0.0 0.0 12.2Water supply; sewerage and drainage
services0.0 0.8 0.0 0.8 0.8
Residential building construction 0.0 0.0 1.3 1.3 1.3Other construction 0.0 1.1 1.1 1.1 1.1Wholesale trade 1.3 1.3 1.3 1.3 1.3Retail trade 1.2 0.0 0.0 0.0 1.2Mechanical repairs 0.9 0.0 0.0 0.9 0.9Other repairs 0.9 0.0 0.0 0.9 0.9Accommodation, cafes and restaurants 1.3 0.0 0.0 0.0 1.3Road transport 1.0 1.0 1.0 1.0 1.0Rail, pipeline and other transport 1.3 0.0 1.3 1.3 1.3
continued

85Table A4.10 (cont.): Effective tax rates on final demand for other indirect taxes, 1992-93,
per cent
Private finalconsumptionexpenditure
Generalgovernmentconsumptionexpenditure
Generalgovernmentgross fixed
capitalexpenditure
ExportsTotalfinal
demand
Water transport 0.0 0.0 0.0 0.0 0.0Air and space transport 0.0 0.0 0.0 0.0 0.0Services to transport; storage 5.3 5.3 5.3 5.3 5.3Communication services 1.1 1.1 0.0 1.1 1.1Banking 1.4 0.0 0.0 1.4 1.4Non-bank finance 1.6 1.6 0.0 1.6 1.6Financial asset investors 0.0 0.0 0.0 0.0 0.0Insurance 18.0 18.0 18.0 18.0 18.0Services to finance, investment and
insurance1.1 0.0 0.0 1.1 1.1
Ownership of dwellings 1.0 1.0 0.0 0.0 1.0Other property services 1.2 1.2 0.0 1.2 1.2Scientific research, technical and
computer services1.4 1.4 1.4 1.4 1.4
Legal, accounting, marketing andbusiness management services
1.4 1.4 0.0 1.4 1.4
Other business services 1.4 1.4 0.0 1.4 1.4Government administration 0.9 0.9 0.0 0.0 0.9Defence 0.0 2.2 0.0 2.2 2.2Education 0.4 0.4 0.0 0.4 0.4Health services 0.8 0.8 0.0 0.8 0.8Community services 1.0 1.0 0.0 0.0 1.0Motion picture, radio and television
services4.4 4.4 0.0 0.0 4.4
Libraries, museums and the arts 1.2 1.2 0.0 1.2 1.2Sport, gambling and recreational
services8.9 8.9 0.0 8.9 8.9
Personal services 1.3 1.3 0.0 1.3 1.3Other services 0.9 0.9 0.0 0.9 0.9Total 2.0 1.3 1.2 1.5 1.7

86
References
Australian Bureau of Statistics, The Effects of Government Benefits and Taxes on Household
Income, Catalogue No. 6537.0, Canberra.
Australian Bureau of Statistics (1996a), Australian National Accounts: Input Output Tables,
1992-93, Catalogue No. 5209.0, Canberra.
Australian Bureau of Statistics (1996b), “The effects of Government benefits and taxes on
household income: methods and assumptions”, HIES working paper 1/96, Canberra.
Australian Bureau of Statistics (1996c), Australian National Accounts: Input Output Tables -
Commodity Details, 1992-93, Catalogue No. 5215.0, Canberra.
Chisholm, A. (1993), “Indirect taxation and consumption efficiency”, in J. Head (ed.),
Fightback: An Economic Assessment, 309-350, Sydney: Australian Tax Research
Foundation.
Creedy, J. (1997), “Measuring the welfare effects of price changes: A convenient parametric
method”, Melbourne Institute Working Paper No. 1/97, University of Melbourne.
Creedy, J. and C. Martin (1997), “Estimating the linear expenditure system using the Household
Expenditure Survey”, Melbourne Institute Working Paper No. 12/97, University of
Melbourne.
Warren, N. (1979), “Australian Tax Incidence in 1975-76: Some Preliminary Results”,
Australian Economic Review, 3rd Quarter, 19-30.
Warren, N. (1989), Changes in Australian tax incidence 1975-76 to 1984-85, in J. Head (ed.),
Australian Tax Reform in Retrospect and Prospect, 445-478, Sydney, Australian Tax
Research Foundation.
Warren, N. (1991), “The Changing Incidence of Federal Indirect Taxes 1975-76 to 1988-89”,
EPAC Background Paper No. 13, AGPS, Canberra.