Embed Size (px)
Citation preview

© 1
Calculate Total Cost and Per-Unit Cost for a Given Production Volume
Intermediate Cost Analysis and Management

© 2
How does total cost change as level of activity changes?

© 3
Terminal Learning Objective
• Task: Calculate Total Cost and Per-Unit Cost for a Given Production Volume
• Condition: You are training to become an ACE with access to ICAM course handouts, readings, and spreadsheet tools and awareness of Operational Environment (OE)/Contemporary Operational Environment (COE) variables and actors
• Standard: With at least 80% accuracy:• Differentiate between fixed and variable costs• Express total and per-unit variable cost in an equation• Graph total and per-unit variable cost• Express total and per-unit fixed costs in an equation• Graph total and per-unit fixed costs

© 4
Why Study Cost Relationships?
• Understanding what drives cost helps to understand how to reduce cost
• Recognizing cost relationships helps to define what views of cost are useful

© 5
What is Cost Relationship?
• Describes the change in cost that occurs with a change in a variable
• Examples: • As number of students in class increases, total cost
of class increases• As snowfall increases, cost of snow removal
increases• As number of miles driven increases, total cost of
trip increases

© 6
Cost Terminology
• Direct Costs• MATERIALS and LABOR that can be Identified
with a particular product or process• Example: Lumber and hardware for furniture
• Indirect Costs• PRODUCTION-RELATED costs that cannot be
Identified with a particular product or process• Example: Maintenance on power tools
© 7
Cost Terminology
• Manufacturing Overhead• An AGGREGATION of indirect production-
related costs• Will be ASSIGNED to products or processes and
become part of the cost of the product• of machinery, labor, utilities

© 8
Check on Learning
• Costs that can be identified with a particular product or process are called
• An aggregation of indirect costs is called

© 9
What is Cost Expression?
• Communicates a cost relationship using verbal, numerical and mathematical symbols
• Use plain language rather than variables x, y, z, etc. • Use math symbols • Add (+)• Subtract (–)• Multiply (*)• Divide (/)
• Example:Cost of hotel stay = Cost per day * # of days

© 10
Which Cost Expression is Useful?
• Sometimes it is useful to know Total Cost• Relevant cost of all inputs required to achieve
desired output• Example: Cost of PCAM = instructor pay + course
materials + classroom facilities + students’ pay• Sometimes it is useful to know Unit Cost• Unit cost = Total cost / # units• Example: Cost to train one student

© 11
Linear Cost Relationships
• The simplest cost relationships can be represented by a straight line
• Variable Costs - Costs that increase in direct proportion with the volume produced or consumed• Total variable cost = Upward sloping line• Unit variable cost = Horizontal line
• Example: Cost of materials used increases in direct proportion to number of units produced

© 12
Variable Cost Expression
• Total variable Cost = Variable $Cost per Unit * # Units
• Variable $Cost per Unit = Sum of all Variable inputs

© 13
Variable Cost Expression
• Total variable cost = Variable $Cost per Unit * # Units
• Variable $Cost per Unit = Sum of all Variable inputs

© 14
Variable Cost Example
• The Smoky Mountain Inn Bed and Breakfast reports the following cost information:Depreciation on building $60,000 per yearMaintenance person’s salary $30,000 per yearCleaning person’s salary $24,000 per yearReal estate taxes $10,000 per yearLaundry service $4.00 per person per nightFood $6.00 per person per night
• What is the unit of output?• Which costs will change as output changes?• What is the cost expression for variable cost per unit?• For Total Variable Cost?

© 15
Variable Cost Example
• What is the cost expression for variable cost per person per night?$4 laundry + $6 food = $10 per person/night
• What is the cost expression for Total variable cost?$10 per person per night * # person/nights

© 16
Check on Learning
• What is the definition of a variable cost?• What is the generic cost expression for total
variable cost?

17
Graph of Total Variable Cost
0 5 10 15 20 25 30 35 40 45 50 55 60 65 70 75 800
100
200
300
400
500
600
700
800
©
$
X Axis = Number of unitsAs # units increases, total variable cost increases

18
Graph of Total Variable Cost
0 5 10 15 20 25 30 35 40 45 50 55 60 65 70 75 800
100
200
300
400
500
600
700
800
©
$
X Axis = Number of unitsAs # units increases, total variable cost increases
At 10 units, Cost is $100

19
Graph of Total Variable Cost
0 5 10 15 20 25 30 35 40 45 50 55 60 65 70 75 800
100
200
300
400
500
600
700
800
©
$
X Axis = Number of unitsAs # units increases, total variable cost increases
At 40 units, Cost is $400

20
Graph of Total Variable Cost
0 5 10 15 20 25 30 35 40 45 50 55 60 65 70 75 800
100
200
300
400
500
600
700
800
©
$
X Axis = Number of unitsAs # units increases, total variable cost increases
At 75 units, Cost is $750
750

21
Graph of Unit Variable Cost
0 5 10 15 20 25 30 35 40 45 50 55 60 65 70 75 800
2
4
6
8
10
12
©
$Unit Cost = Total Variable Cost/# Units
Unit cost at 10 units = $100/10 units or
$10 per unit
X Axis = Number of unitsAs # units increases, Unit variable cost remains the same

22
Graph of Unit Variable Cost
0 5 10 15 20 25 30 35 40 45 50 55 60 65 70 75 800
2
4
6
8
10
12
©
$
Unit cost at 40 units = $400/40 units or
$10 per unit
X Axis = Number of unitsAs # units increases, Unit variable cost remains the same
Unit Cost = Total Variable Cost/# Units

23
Graph of Unit Variable Cost
0 5 10 15 20 25 30 35 40 45 50 55 60 65 70 75 800
2
4
6
8
10
12
©
$
Unit cost at 75 units = $750/75 units or
$10 per unit
X Axis = Number of unitsAs # units increases, Unit variable cost remains the same
Unit Cost = Total Variable Cost/# Units

© 24
Check on Learning
• How is Total variable cost represented on the graph?
• What is the generic cost expression for Variable cost per unit?

© 25
Linear Cost Relationships
• Fixed Costs - Costs that do not change with the volume produced or consumed• Total fixed cost = Horizontal line
• Unit Fixed Cost is non-linear
• Example: The cost of the instructor remains the same regardless of the number of students in the class

© 26
Fixed Cost Expression
• Total Fixed $Cost = Sum of all Fixed Inputs
• Fixed $Cost per Unit = Total Fixed $Cost / # Units
© 27
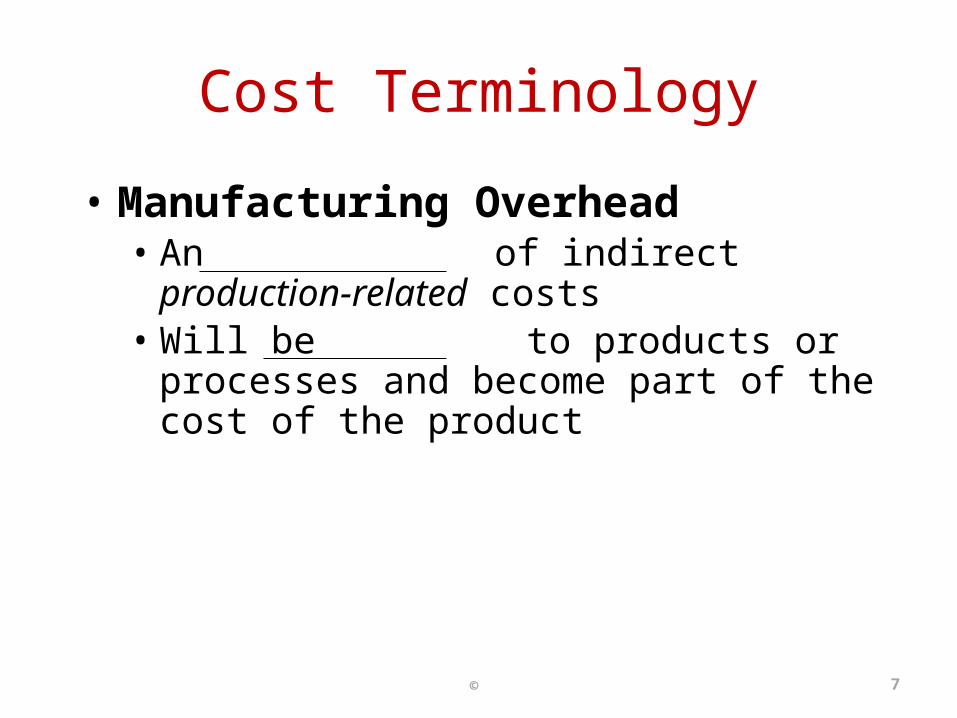
Fixed Cost Example
• The Smoky Mountain Inn Bed and Breakfast reports the following cost information:Depreciation on building $60,000 per yearMaintenance person’s salary $30,000 per yearCleaning person’s salary $24,000 per yearReal estate taxes $10,000 per yearLaundry service $4.00 per person per nightFood $6.00 per person per night
• What is the unit of output?• Which costs will NOT change as output changes?• What is the cost expression for Total Fixed Cost?• For Fixed Cost per Unit?

© 28
Fixed Cost Example
• What is the cost expression for Total Fixed Cost?$60,000 depreciation + $30,000 maintenance
salary + $24,000 cleaning salary + $10,000 taxes = $124,000
• What is the cost expression for Fixed Cost per Unit?
$124,000 / # person/nights

© 29
Check on Learning
• What is the definition of a fixed cost?• What is the generic cost expression for fixed
cost per unit?

30
Graph of Total Fixed Cost
0 5 10 15 20 25 30 35 40 45 50 55 60 65 70 75 80$0
$20,000
$40,000
$60,000
$80,000
$100,000
$120,000
$140,000
©
At 10 units, Total Fixed Cost is
$124,000
X Axis = Number of unitsAs # units increases, Total Fixed cost remains the same

31
Graph of Total Fixed Cost
0 5 10 15 20 25 30 35 40 45 50 55 60 65 70 75 80$0
$20,000
$40,000
$60,000
$80,000
$100,000
$120,000
$140,000
©
At 40 units, Total Fixed Cost is
$124,000
X Axis = Number of unitsAs # units increases, Total Fixed cost remains the same

32
Graph of Total Fixed Cost
0 5 10 15 20 25 30 35 40 45 50 55 60 65 70 75 80$0
$20,000
$40,000
$60,000
$80,000
$100,000
$120,000
$140,000
©
At 75 units, Total Fixed Cost is
$124,000
X Axis = Number of unitsAs # units increases, Total Fixed cost remains the same

33
Graph of Unit Fixed Cost
0 5 10 15 20 25 30 35 40 45 50 55 60 65 70 75 80$0
$5,000
$10,000
$15,000
$20,000
$25,000
©
Unit Cost = Total Fixed Cost/# Units
X Axis = Number of unitsAs # units increases, Unit Fixed cost decreases
At 10 units, Unit Fixed Cost =
$124,000/10 units or $12,400 per unit
$12,400

34
Graph of Unit Fixed Cost
0 5 10 15 20 25 30 35 40 45 50 55 60 65 70 75 80$0
$5,000
$10,000
$15,000
$20,000
$25,000
©
Unit Cost = Total Fixed Cost/# Units
X Axis = Number of unitsAs # units increases, Unit Fixed cost decreases
At 40 units, Unit Fixed Cost =
$124,000/40 units or $3,100 per unit
$3,100

35
Graph of Unit Fixed Cost
0 5 10 15 20 25 30 35 40 45 50 55 60 65 70 75 80$0
$5,000
$10,000
$15,000
$20,000
$25,000
©
Unit Cost = Total Fixed Cost/# Units
X Axis = Number of unitsAs # units increases, Unit Fixed cost decreases
At 75 units, Unit Fixed Cost =
$124,000/75 units or $1,653 per unit
$1,653

© 36
Check on Learning
• How is Total fixed cost represented on the graph?
• How is Unit fixed cost represented on the graph?

© 37
Cost Definitions
• Mixed Costs - A combination of fixed and variable costs
Total Cost = Variable Cost + Fixed Cost
• Also known as multivariate costs

© 38
Multivariate Cost Expressions
• Variable component:• Variable $Cost per Unit * # Units
-Plus-• Fixed component:• Sum of relevant costs that remain the same
regardless of units of output

© 39
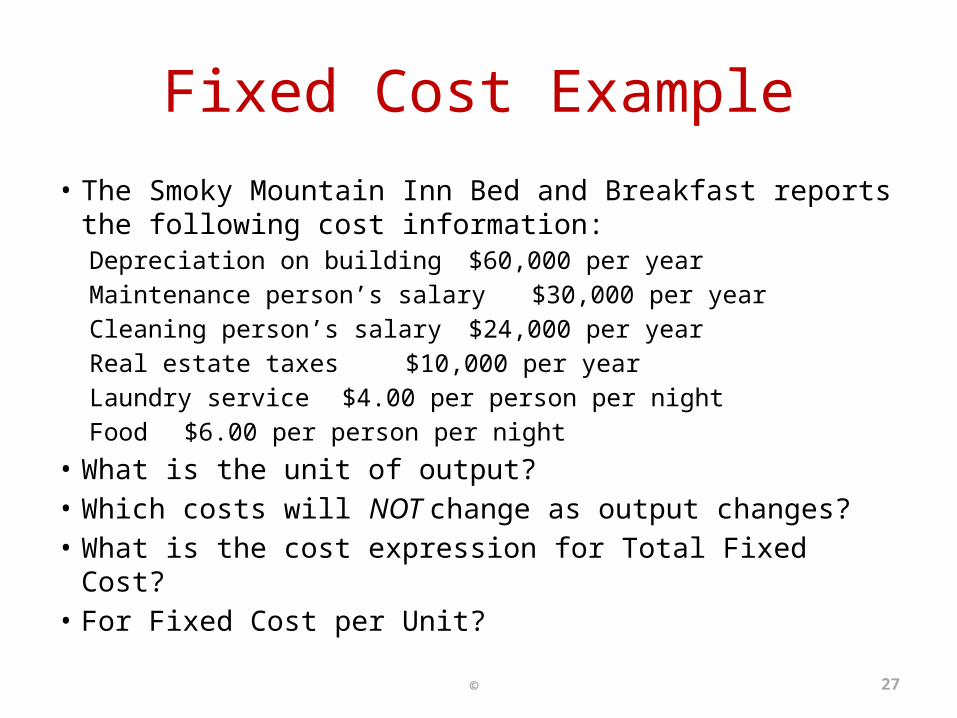
Demonstration Problem
• A vehicle repair shop incurs an average parts cost per repair of $220. Shop rent is $5,000 per month. Staff salaries are $5,000 per month and technicians earn a commission on repairs that averages $200 per repair.
• Which costs are fixed? • Which are variable?• What is total cost of 100 repairs? 200 repairs? • What is unit cost for 100 repairs? 200 repairs?

© 40
Demonstration Problem
• A vehicle repair shop incurs an average parts cost per repair of $220. Shop rent is $5,000 per month. Staff salaries are $5,000 per month and technicians earn a commission on repairs that averages $200 per repair.
• Which costs are fixed? Shop Rent $5,000Staff Salaries 5,000Total Fixed $10,000
© 41
Demonstration Problem
• A vehicle repair shop incurs an average parts cost per repair of $220. Shop rent is $5,000 per month. Staff salaries are $5,000 per month and technicians earn a commission on repairs that averages $200 per repair.
• Which costs are variable?Parts per repair $220Commission per repair 200Total $420

© 42
Demonstration Problem
• A vehicle repair shop incurs an average parts cost per repair of $220. Shop rent is $5,000 per month. Staff salaries are $5,000 per month and technicians earn a commission on repairs that averages $200 per repair.
• What is total cost of 100 repairs? 200 repairs? Total cost= $420 per repair * # repairs + $10,000$420 per repair*100 repairs+$10,000 = $52,000$420 per repair*200 repairs+$10,000 = $85,000

Graph of Mixed Cost0 20 40 60 80 100
120
140
160
180
200
220
240
260
280
300
0
10
20
30
40
50
60
70
80
90
100
Fixed Cost
©
43
X Axis = Number of Repairs As Number of Repairs increases, Fixed Cost does not change
$K

Graph of Mixed Cost0 20 40 60 80 100
120
140
160
180
200
220
240
260
280
300
0
10
20
30
40
50
60
70
80
90
100
Fixed CostVariable Cost
©
44
X Axis = Number of RepairsAs Number of Repairs increases, Variable Cost increases
$KVariable cost
for 200 repairs=$420 per repair *
200 repairs = $84,000
$84K

Graph of Mixed Cost0 20 40 60 80 100
120
140
160
180
200
220
240
260
280
300
0
10
20
30
40
50
60
70
80
90
100
Fixed CostVariable CostTotal Cost
©
45
X Axis = Number of RepairsAs Number of Repairs increases, both Variable Cost and Total Cost increase
$K
Total cost for 200 repairs =$420 per repair * 200 repairs +
$10,000 or $94,000
$94K

© 46
Demonstration Problem
• A vehicle repair shop incurs an average parts cost per repair of $220. Shop rent is $5,000 per month. Staff salaries are $5,000 per month and technicians earn a commission on repairs that averages $200 per repair.
• What is unit cost for 100 repairs? 200 repairs?Unit cost = Total cost / # repairs
Total @100 repairs $52,000 / 100 repairs = $520Total @200 repairs $94,000 / 200 repairs = $470

© 47
Question
• How would the graph of Cost per Repair appear?• It should be a downward sloping curve that will
level out above $420• Cost per repair will never drop below $420
(variable cost)

© 48
Practical Exercises