Embed Size (px)
Citation preview

1
CAL-MAINE FOODS, INC
Investor Presentation October 2011

2
FORWARD-LOOKING STATEMENTS
Statements contained in this presentation regarding expected operating results, acquisition transactions and other events are forward-looking statements that involve risk and uncertainties. Actual future events or results may differ materially from these statements. You are referred to the documents filed by Cal-Maine Foods, Inc. with the Securities and Exchange Commission, including the Company’s annual report on Form 10-K, quarterly reports on Form 10-Q and current reports on Form 8-K. These filings identify important risk factors and other uncertainties that could cause actual results to differ from those contained in the forward-looking statements.

3
CAL-MAINE PROFILE
We produce and market eggs
We produce and market more eggs
than anyone else
We produce and market eggs better
than anyone else
We are in the fresh shell egg business

4
CAL-MAINE HISTORY
1957 - Fred Adams formed Adams Foods, Inc. in Jackson, Mississippi
1969 - Cal-Maine Foods, Inc. was formed by the merger of Adams Foods, Inc.
Jackson, Mississippi; Maine Egg Farms of Lewiston, Maine;
and Dairy Fresh Products Company of Los Angeles, California
1972 - With acquisition of shell egg operations of Ralston Purina Company,
Cal-Maine became largest producer and distributor of shell eggs in the US
1974 and 1982, respectively, - divested
East and West Coast operations
1996 - Became public Company under
symbol “CALM”
Since 1989, Company has completed
16 acquisitions ranging in size from
600,000 layers to 7.5 million layers

5
KEY INVESTMENT POINTS
Largest egg producer and marketer in the United States
Efficient, state-of-the-art operations
Solid customer base of grocery retailers and food
service companies
Strong consumer demand for eggs
Growing market for high-margin specialty eggs
Solid financial position
Proven management team

6
$477.6
$598.1
$915.9 $928.8 $910.1$942.0
821.4805.4
777.9
678.5685.5683.1
$0.0
$100.0
$200.0
$300.0
$400.0
$500.0
$600.0
$700.0
$800.0
$900.0
$1,000.0
2006 2007 2008 2009 2010 2011
500.0
600.0
700.0
800.0
900.0
1000.0
Net Sales Eggs Sold
SALES TRENDS
Annual Net Sales ($ in millions)
Total Shell Eggs Sold (in millions of dozens)

7
CAL-MAINE LOCATIONS
Blue Shading indicates
Cal-Maine Major Market Areas

8
FULLY-INTEGRATED OPERATIONS
Feed mills
Hatching egg production
Hatcheries
Pullet growing
Egg production
Egg processing
Sales and distribution

9
EGG PRODUCTION FACILITIES
92% Company-owned
8% Contract production

10
COMPANY-OWNED FACILITIES
State-of–the-art
Fully-automated
Temperature
controlled
Labor efficient
Located near our customers

11
MONTHLY HEN INVENTORY
Million Hens First Day of Month
Source: USDA Chicken & Egg Report
275.0
277.0
279.0
281.0
283.0
285.0
287.0
289.0
291.0
293.0
Jan Feb Mar Apr May June July Aug Sept Oct Nov Dec
2006
2007
2008
2009
2010
2011

12
TOP 10 CUSTOMERS
1. Wal-Mart and Sam’s 32.6%
2. Publix 10.0%
3. H.E. Butt Co. 9.5%
4. Food Lion
5. Eggs America (Sysco, US Foodservice, etc.)
6. CCF Brands
7. Winn Dixie
8. CostCo
9. ISE
10. Shoprite
Total Top 10 customers 66.9%
(% Sales)

13
ANNUAL EGG PRICES
(Monthly average by fiscal year)
Urner-Barry southeastern regional large egg market price
(per dozen eggs)
$0.85$0.79
$0.69$0.72 $0.71 $0.73
$0.78
$1.05
$0.72$0.75
$0.93
$1.38
$1.21
$1.12 $1.13
$0.00
$0.20
$0.40
$0.60
$0.80
$1.00
$1.20
$1.40
$1.60
1997 1998 1999 2000 2001 2002 2003 2004 2005 2006 2007 2008 2009 2010 2011

14
RECORD FEED INGREDIENT PRICES
(Monthly average)
Corn
$/bushel
Soy Meal
$/ton
Soy Bean Meal Dollars per Ton Corn Dollars per Bushel
8
7
6
5
4
3
2
1
0
0.00
100.00
200.00
300.00
400.00
500.00
600.00
700.00
800.00

15
Cents per Dozen Eggs Produced
21.622.9
27.828.9 28.5
30.3
34.7
42.4
45.8
38.537.0 37.6
35.7 34.7 34.732.7 33.4
38.740.4
44.7
48.4
0.0
10.0
20.0
30.0
40.0
50.0
60.0
1Q07 2Q07 3Q07 4Q07 1Q08 2Q08 3Q08 4Q08 1Q09 2Q09 3Q09 4Q09 1Q10 2Q10 3Q10 4Q10 1Q11 2Q11 3Q11 4Q11 1Q12
FEED COSTS

16
GROWTH STRATEGY
Increase specialty egg business
Meet growing consumer demand
Benefit from higher selling prices
*16.1 percent of dozens sold *24.0 percent of revenue
*Fiscal Year Ended May 28, 2011
P
E
R
C
E
N
T
A
G
E
Specialty Egg Sales Dollars as Percentage of Total
Specialty Egg Dozens Sold as Percentage of Total 0.0%
5.0%
10.0%
15.0%
20.0%
25.0%
30.0%
% Sales
% Dozen

17
GROWTH STRATEGY
Continue to identify acquisition opportunities
Expand capabilities in existing markets and broaden geographic reach
Completed 16 acquisitions since 1989
Completed five acquisitions in the last five years (14 million hens)

18
TOP EGG PRODUCERS
INFORMATION SOURCE
EGG INDUSTRY MAGAZINE – JANUARY 2011
Company Total Layers
Cal-Maine Foods, Inc. 29,000,000
Rose Acre Farms 21,000,000
DeCoster Egg Farms & Aff. 13,000,000*
Moark LLC 12,500,000
Hillandale Farms of PA 12,000,000
Michael Foods 12,000,000
Rembrandt Enterprises 12,000,000
Sparboe Summit Farms 12,000,000
Daybreak Foods 10,800,000
Center Fresh Egg Group 7,200,000
Freemont Farms of IA 6,000,000
Midwest Poultry Services 5,500,000
Herbruck’s Poultry Ranch 5,200,000
ISE America 5,000,000
Fort Recovery Equity 4,500,000
Hickman’s Egg Ranch 4,400,000
Esbenshade Farms 4,000,000
Kreider Poultry Farms 4,000,000
Sunrise Farms, Inc. 4,000,000
Weaver Brothers 4,000,000
Wabash Valley Produce 3,800,000
Dutchland Farms 3,500,000
Company Total Layers
National Food 3,500,000
Creighton Bros. 3,100,000
Mahard Egg Farms 3,000,000
Wengers 3,000,000
Valley Fresh Foods 2,500,000
Hamilton Farm Bureau 2,300,000
S & R Egg Farms 2,200,000
Braswell Foods 2,200,000
LaValle Egg Farms 2,200,000
Dixie Egg/Foodonics 2,100,000
Gemperle Enterprises 2,000,000
R W Sauder 2,000,000
Willamette Egg Farms 2,000,000
Kreher Farms 1,900,000
Demler Enterprises 1,800,000
Sunrise Acres 1,700,000
J. S. West 1,700,000
Berne Highway Hatchery 1,500,000
Konos, Inc. 1,500,000
Pilgrim’s Pride Corp. 1,500,000
Hemmelgarn & Sons 1,500,000
Company Total Layers
Dakota Layers Coop 1,500,000
L & R Farms 1,300,000
Ritewood Egg Farm 1,300,000
Wilcox Farms 1,200,000
Country Charm Eggs 1,100,000
Morning Fresh Farms 1,100,000
Pearl Valley Eggs 1,100,000
Delta Egg Farms 1,100,000
Pine Hill Egg Ranch 1,100,000
Cooper Farms 1,000,000
Rindler Poultry 1,100,000
Sunrise Farms, LLC CA 1,000,000
Sioux County Egg Farms 1,000,000
SKS Enterprises 800,000
Egg Innovations 500,000
Maxim Egg Farm 400,000
Nature Pure, LLC 200,000
Total 257,300,000 (*Estimated Range of 13 to 15 million
Ownership of affiliates is not transparent)
TOP COMPANY RANKINGS - LAYERS IN PRODUCTION 12/31/2010

19
SUMMARY
Best facilities in the industry
Best management team
Best customer base

20
FINANCIAL HIGHLIGHTS- FY2011*
Fiscal Year 2011 Annual Sales - $942 million
Fiscal Year 2011 EBITDA - $131 million
Working Capital - $248 million
Total Debt - $88 million
Debt to EBITDA - .67:1
*Reported as of May 28, 2011

21
FINANCIAL SUMMARY
$477.6
$598.1
$915.9 $928.8 $910.1$942.0
$83.5
$102.6
$121.5
$223.6
$58.2
$4.5
$0.0
$100.0
$200.0
$300.0
$400.0
$500.0
$600.0
$700.0
$800.0
$900.0
$1,000.0
2006 2007 2008 2009 2010 2011
-$25.0
$25.0
$75.0
$125.0
$175.0
$225.0
$275.0
$325.0
Net Sales Operating Income
Annual Net Sales and Operating Income ($ in millions)
Dozen Eggs Sold (In millions)
683 685 679 778 805 821

22
INCOME STATEMENT – FY 2009-2011
Net sales $ 941,981 $ 910,143 $ 928,812
Gross profit 184,931 194,644 204,727
Operating income 83,483 102,604 121,474
Other income (expense) 8,188 889 (140)
Income before income taxes 91,671 103,493 121,334
Net income $ 60,839 $ 67,823 $ 79,500
Net income per common share:
Basic $ 2.55 $ 2.85 $ 3.34
Diluted $ 2.54 2.84 $ 3.34
Weighted average shares outstanding:
Basic 23,855 23,812 23,769
Diluted 23,942 23,877 23,811
(Unaudited; in thousands except per share amounts)
FY2009 FY2011 FY2010

23
INCOME STATEMENT – YTD FY2012
13 Weeks Ended
Aug. 27, Aug. 28,
2011 2010
Net sales $ 243,842 $ 190,403
Gross profit 33,786 32,736
Operating income 5,957 8,041
Other income (expense) (1,224) (956)
Income before income taxes 4,733 7,085
Net income $ 3,117 $ 4,763
Net income per common share:
Basic $ 0.13 $ 0.20
Diluted $ 0.13 $ 0.20
Weighted average shares outstanding:
Basic 23,867 23,842
Diluted 23,945 23,935
(Unaudited; in thousands except per share amounts)

24
OPERATING HIGHLIGHTS – YTD FY2012
13 Weeks Ended
Aug. 27, Aug. 28,
2011 2010
Dozen Eggs Sold (000) 208,096 193,987
Dozen Eggs Produced (000) 159,443 155,344
Dozen Eggs Purchased (000)* 48,653 38,643
% Specialty Egg Sales (Dozen) 15.7 14.9
% Specialty Sales (Dollars) 23.6 25.5
Net Average Selling Price (Dozen) $ 1.117 $ 0.930
Feed Cost (Dozen) $ 0.484 $ 0.334
*Net of Processing Loss and Inventory Adjustments

25
BALANCE SHEET HIGHLIGHTS
Aug. 27, Aug. 28,
2011 2010
Cash and short-term investments $ 177,230 $ 169,994
Total assets $ 647,123 $ 609,714
Long-term debt, less current maturities $ 73,691 $ 101,507
Shareholders' equity $ 412,572 $380,440
Working capital $ 255,717 $223,721
Debt to Capital .17:1 .23:1
(Unaudited; in thousands)
26
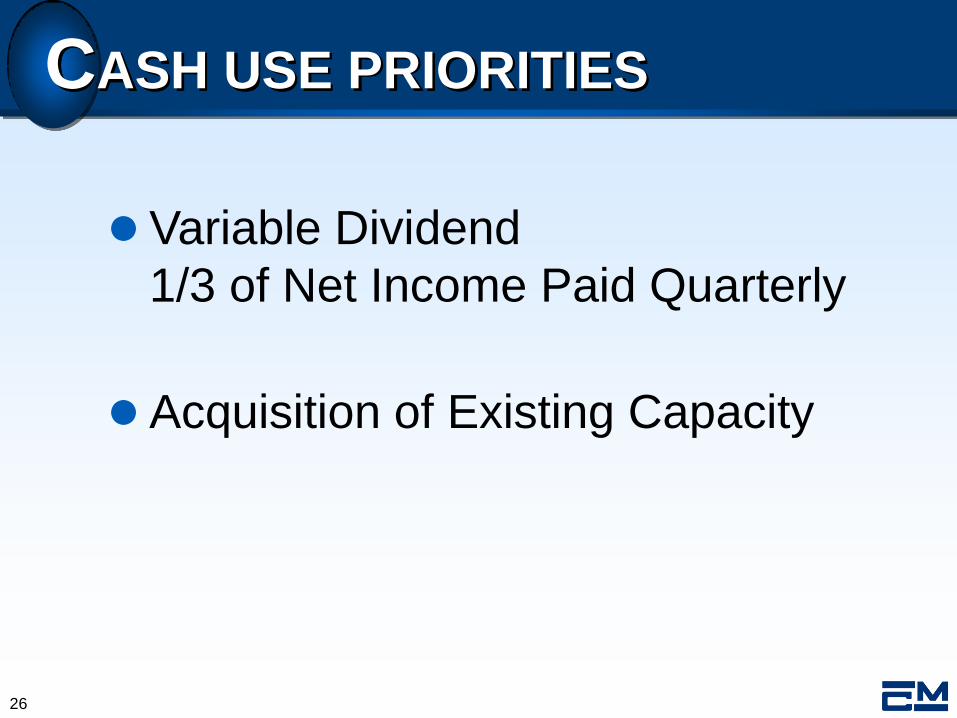
CASH USE PRIORITIES
Variable Dividend
1/3 of Net Income Paid Quarterly
Acquisition of Existing Capacity

27
CASH DIVIDENDS PAID
$0.807
$0.516
$0.157
$0.382
$0.432
$0.142
$0.000
$0.172
$0.480
$0.294
$0.067
$0.212
$0.470
$0.102
$0.044
$0.000
$0.100
$0.200
$0.300
$0.400
$0.500
$0.600
$0.700
$0.800
$0.900
3Q08 4Q08 1Q09 2Q09 3Q09 4Q09 1Q10 2Q10 3Q10 4Q10 1Q11 2Q11 3Q11 4Q11 1Q12

28
STOCK OWNERSHIP & FLOAT
Stock Ownership & Float As of Cal-Maine Proxy Dated July 31, 2011
Shares % of
Ownership Outstanding Total Shares Owned by Adams Family
(Excludes ESOP)
7,921,334 33.2%
Shares Owned by Other Insiders
(Excludes ESOP) 978,705 4.1%
Shares Owned by ESOP 1,431,897 6.0%
Public Float 13,533,155 56.7%
Total Outstanding Shares
23,865,091 100.0%

29
KEY INVESTMENT POINTS
Largest egg producer and marketer in the United States
Efficient, state-of-the-art operations
Solid customer base of leading food companies
Strong consumer demand for eggs
Growing market for high-margin specialty eggs
Solid financial position
Proven management team

30
CAL-MAINE FOODS, INC
Investor Presentation
October 2011