Embed Size (px)
Citation preview
CAD for VLSI
Debdeep MukhopadhyayIIT Madras

Tentative Syllabus– Overall perspective of VLSI Design– MOS switch and CMOS, MOS based logic design, the
CMOS logic styles, Pass Transistors– Introduction to Verilog HDL– Combinational logic Design: Simplification of
switching functions, K-map based reductions of switching circuits, complex designs using multiplexers/demultiplexers, decoders
– PLAs and their use in standard combinational logic design.

Tentative Syllabus– Memory elements: flip-flops, latches, registers. – Sequential logic Design: Concepts and state
diagrams. – VLSI Design Issues:
• Timing in Digital Circuits• Power Issues • and Parasitics
– Data Path Design: Realizations of Computational blocks, like adders, multipliers, CORDIC

Laboratory Work
• This is an Engineering Course. So, we shall have assignments and lab works integrated with this course. Please be sincere about them.
• Assignments shall encompass:– Verilog Coding– Developing knowledge of Standard CAD flow
• ASIC Flow• FPGA Flow
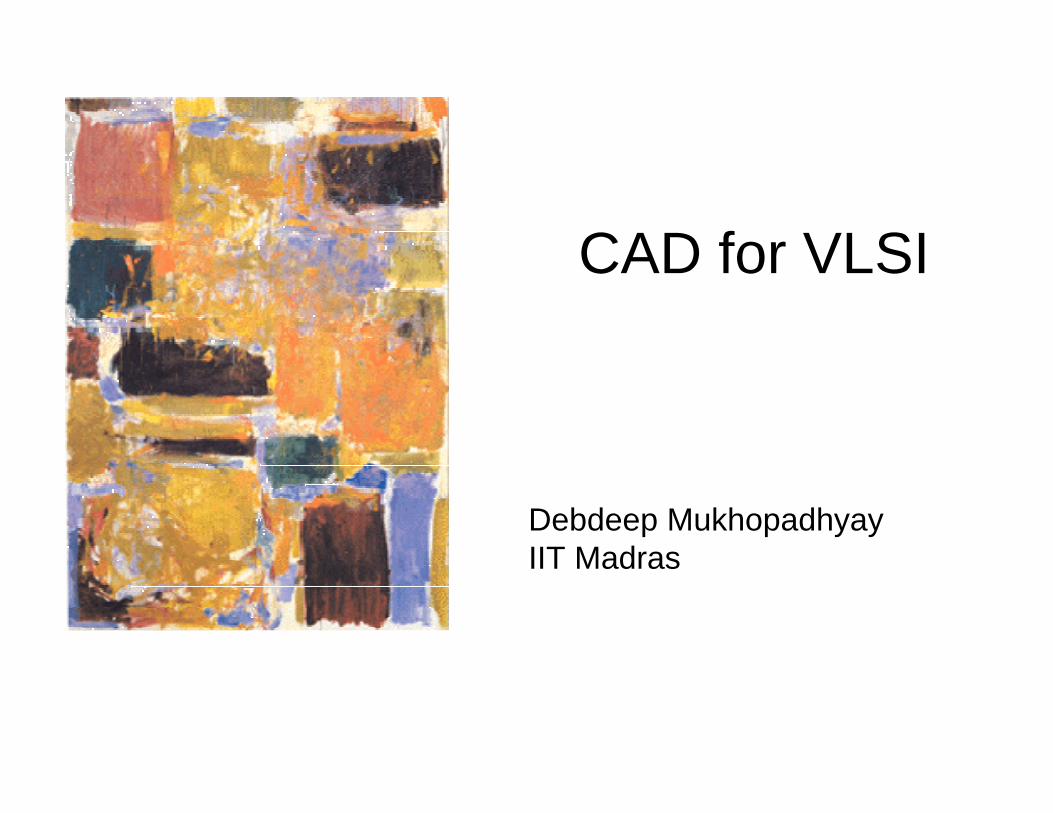
The First Computer
The BabbageDifference Engine(1832)25,000 partscost: £17,470
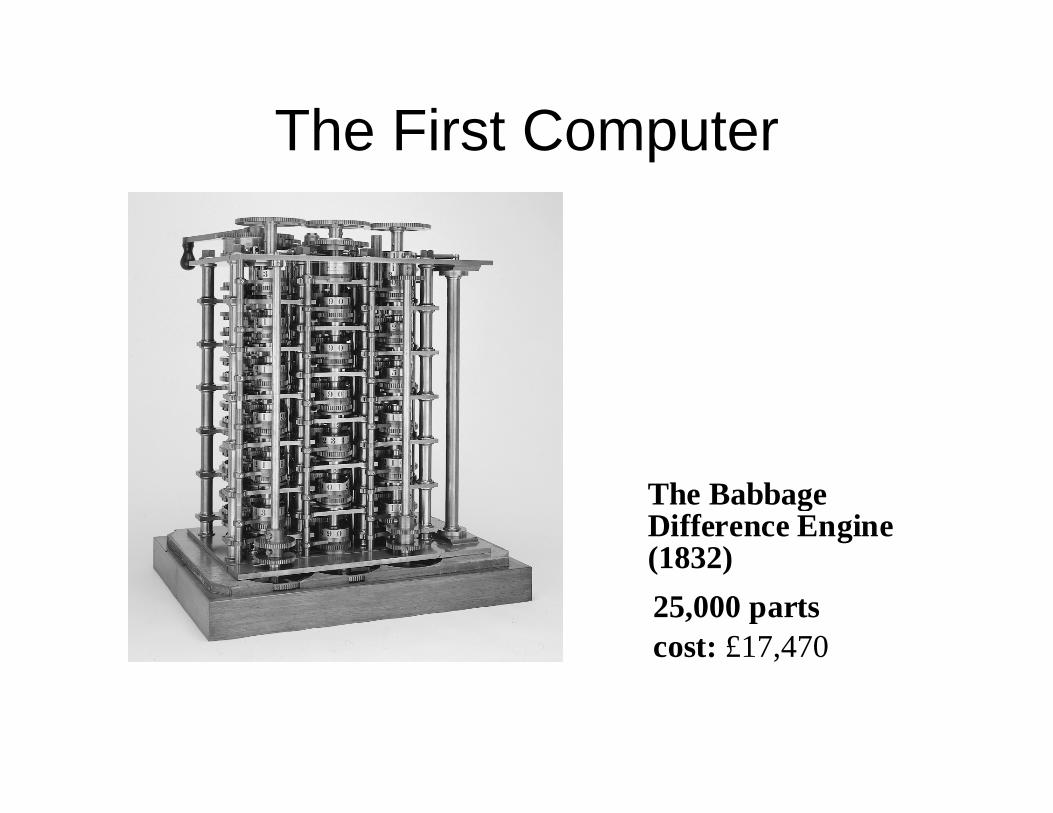
ENIAC - The first electronic computer (1946)

The Transistor Revolution
First transistorBell Labs, 1948

The First Integrated Circuits
Bipolar logic1960’s
ECL 3-input GateMotorola 1966
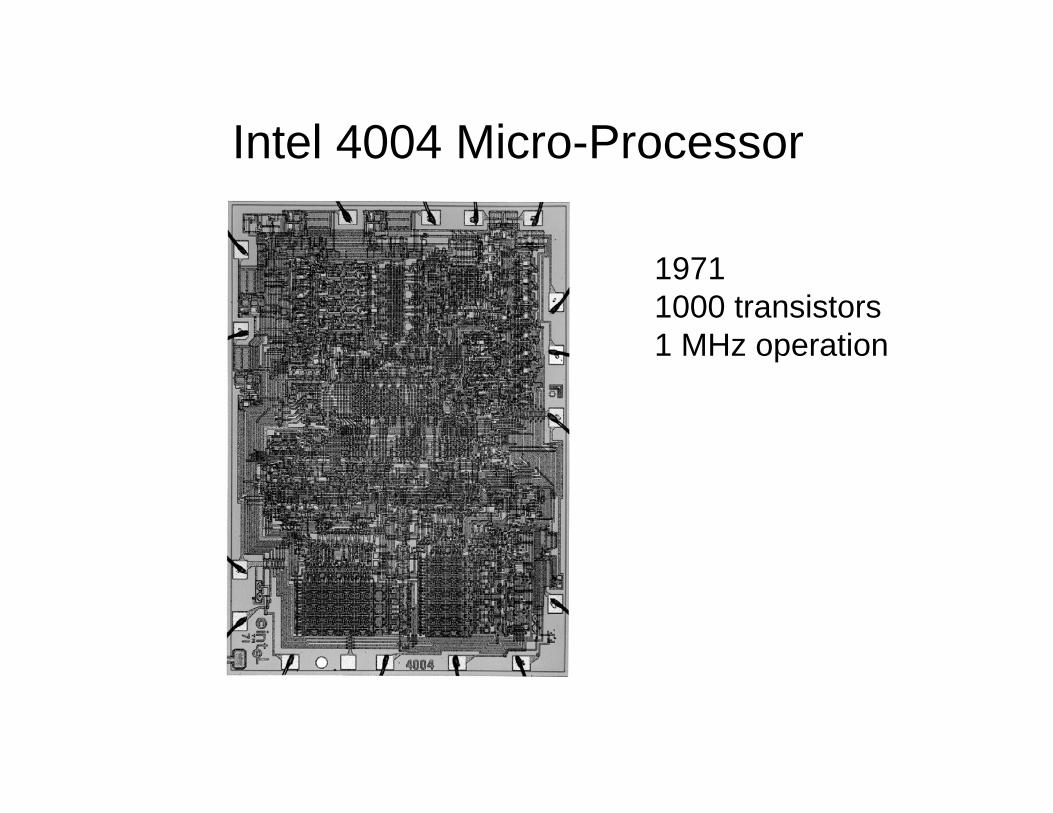
Intel 4004 Micro-Processor
19711000 transistors1 MHz operation
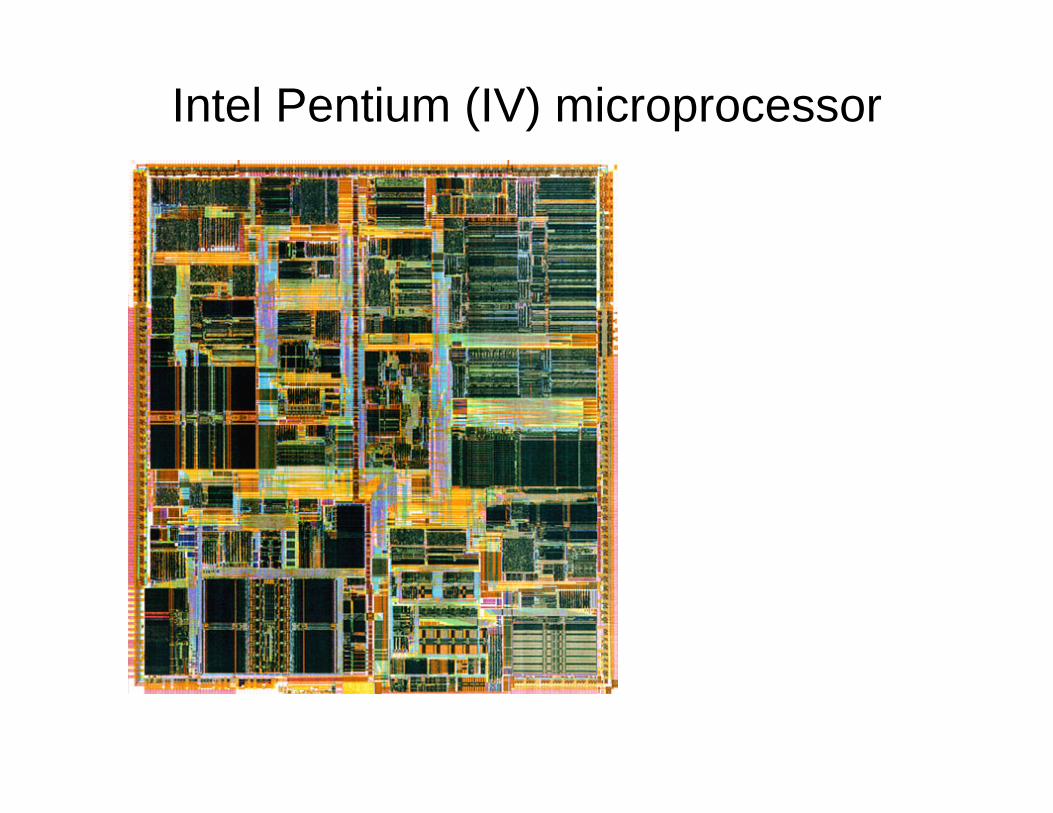
Intel Pentium (IV) microprocessor

Computer-Aided Design
• 1967: Fairchild develops the “Micromosaic” IC using CAD
• 1968: Noyce, Moore leave Fairchild, start Intel

Moore’s Law
In 1965, Gordon Moore noted that the number of transistors on a chip doubled every 18 to 24 months.
He made a prediction that semiconductor technology will double its effectiveness every 18 months

Moore’s Law
16151413121110
9876543210
1959
1960
1961
1962
1963
1964
1965
1966
1967
1968
1969
1970
1971
1972
1973
1974
1975
LOG
2 OF
THE
NU
MB
ER O
FC
OM
PON
ENTS
PER
INTE
GR
ATE
D F
UN
CTI
ON
Electronics, April 19, 1965.

Evolution in Complexity

Transistor Counts
1,000,000
100,000
10,000
1,000
10
100
11975 1980 1985 1990 1995 2000 2005 2010
808680286
i386i486
Pentium®Pentium® Pro
K 1 Billion 1 Billion TransistorsTransistors
Source: IntelSource: Intel
ProjectedProjected
Pentium® IIPentium® III
Courtesy, Intel

Evolution of Micro-electronics
GSIULSIVLSILSIMSISSIDiscrete Compon
ents
Transi-stor
Technology
Special processors,
virtual reality m/cs
16 bit uP,
DRAM
8 bit uP,
ROM, RAM
Counters, mux,
adders
Planar Devices,
Logic gates, FFs
JunctionTransist
or
-Typical product
>10M1 M-10M
20,000-1 M
1000-20,000
100-1000
1011No of transPer chip
2000->1990->1980->1971->1966->1961->1950->1947->Year

Moore’s law in Microprocessors
400480088080
8085 8086286
386486 Pentium® proc
P6
0.001
0.01
0.1
1
10
100
1000
1970 1980 1990 2000 2010Year
Tran
sist
ors
(MT)
2X growth in 1.96 years!
Transistors on Lead Microprocessors double every 2 yearsTransistors on Lead Microprocessors double every 2 years
Courtesy, Intel

Die Size Growth
40048008
80808085
8086286
386486 Pentium ® procP6
1
10
100
1970 1980 1990 2000 2010Year
Die
siz
e (m
m)
~7% growth per year~2X growth in 10 years
Die size grows by 14% to satisfy Moore’s LawDie size grows by 14% to satisfy Moore’s Law
Courtesy, Intel

Frequency
P6Pentium ® proc
48638628680868085
8080800840040.1
1
10
100
1000
10000
1970 1980 1990 2000 2010Year
Freq
uenc
y (M
hz)
Lead Microprocessors frequency doubles every 2 yearsLead Microprocessors frequency doubles every 2 years
Doubles every2 years
Courtesy, Intel

Power DissipationP6
Pentium ® proc
486386
2868086
808580808008
4004
0.1
1
10
100
1971 1974 1978 1985 1992 2000Year
Pow
er (W
atts
)
Lead Microprocessors power continues to increaseLead Microprocessors power continues to increase
Courtesy, Intel

Power will be a major problem5KW
18KW
1.5KW 500W
4004800880808085
8086286
386486
Pentium® proc
0.1
1
10
100
1000
10000
100000
1971 1974 1978 1985 1992 2000 2004 2008Year
Pow
er (W
atts
)
Power delivery and dissipation will be prohibitivePower delivery and dissipation will be prohibitive
Courtesy, Intel

Power density
400480088080
8085
8086
286 386486
Pentium® procP6
1
10
100
1000
10000
1970 1980 1990 2000 2010Year
Pow
er D
ensi
ty (W
/cm
2)
Hot Plate
NuclearReactor
RocketNozzle
Power density too high to keep junctions at low tempPower density too high to keep junctions at low temp
Courtesy, Intel

Not Only Microprocessors
Digital Cellular Market(Phones Shipped)
1996 1997 1998 1999 2000
Units 48M 86M 162M 260M 435M Analog Baseband
Digital Baseband(DSP + MCU)
PowerManagement
Small Signal RF
PowerRF
(data from Texas Instruments)(data from Texas Instruments)
CellPhone

24
Challenges in Digital Design
“Microscopic Problems”• Ultra-high speed design• Interconnect• Noise, Crosstalk• Reliability, Manufacturability• Power Dissipation• Clock distribution.
Everything Looks a Little Different
“Macroscopic Issues”• Time-to-Market• Millions of Gates• High-Level Abstractions• Reuse & IP: Portability• etc.
…and There’s a Lot of Them!
∝ DSM ∝ 1/DSM
?
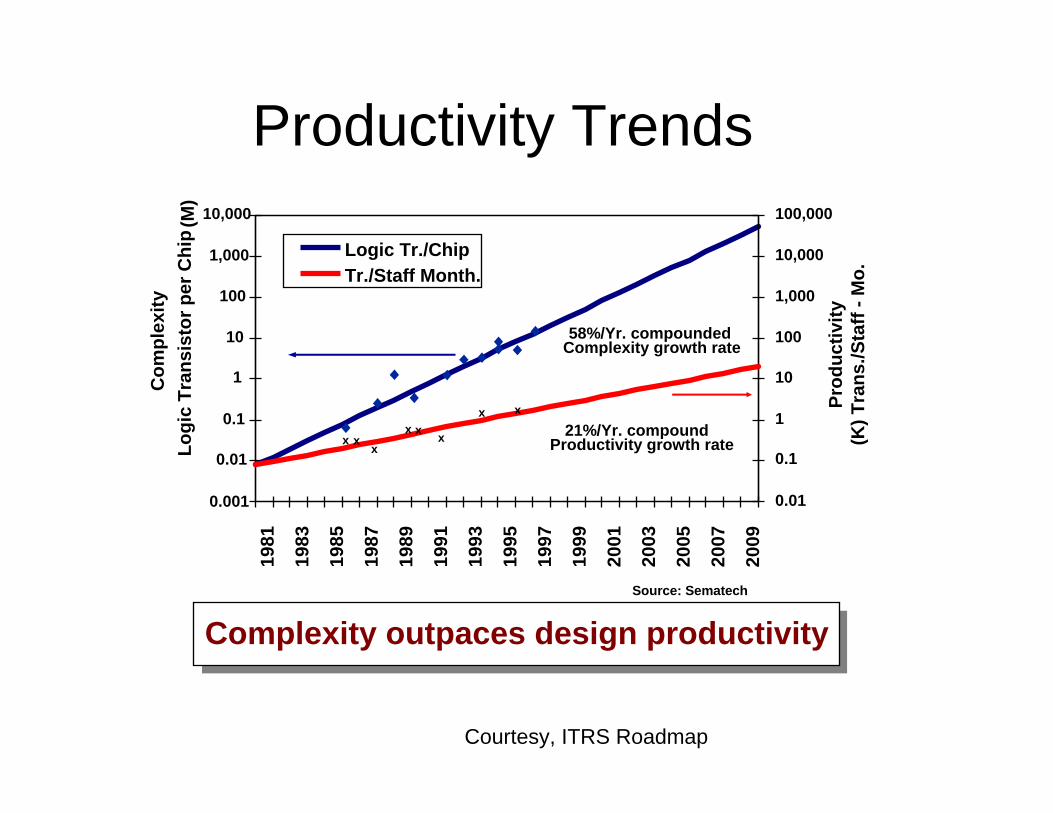
Productivity Trends
1
10
100
1,000
10,000
100,000
1,000,000
10,000,000
2003
1981
1983
1985
1987
1989
1991
1993
1995
1997
1999
2001
2005
2007
2009
10
100
1,000
10,000
100,000
1,000,000
10,000,000
100,000,000Logic Tr./ChipTr./Staff Month.
xxxx
xx
x21%/Yr. compound
Productivity growth rate
x
58%/Yr. compoundedComplexity growth rate
10,000
1,000
100
10
1
0.1
0.01
0.001
Logi
c Tr
ansi
stor
per
Chi
p(M
)
0.01
0.1
1
10
100
1,000
10,000
100,000
Prod
uctiv
ity(K
) Tra
ns./S
taff
-Mo.
Source: Sematech
Complexity outpaces design productivity
Com
plex
ity
Courtesy, ITRS Roadmap
Why Scaling?• Technology shrinks by 0.7/generation• With every generation can integrate 2x more
functions per chip; chip cost does not increase significantly
• Cost of a function decreases by 2x• But …
– How to design chips with more and more functions?– Design engineering population does not double every
two years…• Hence, a need for more efficient design methods
– Exploit different levels of abstraction

Design Abstraction Levels
n+n+S
GD
+
DEVICE
CIRCUIT
GATE
MODULE
SYSTEM

But Reality is complex!
• Advancement of technology requires designing and implementing module libraries.
• Require to understand critical paths of design to evaluate its performance.
• Library based design is fine for Application specific designs. But not so for high performance designs: Full custom…
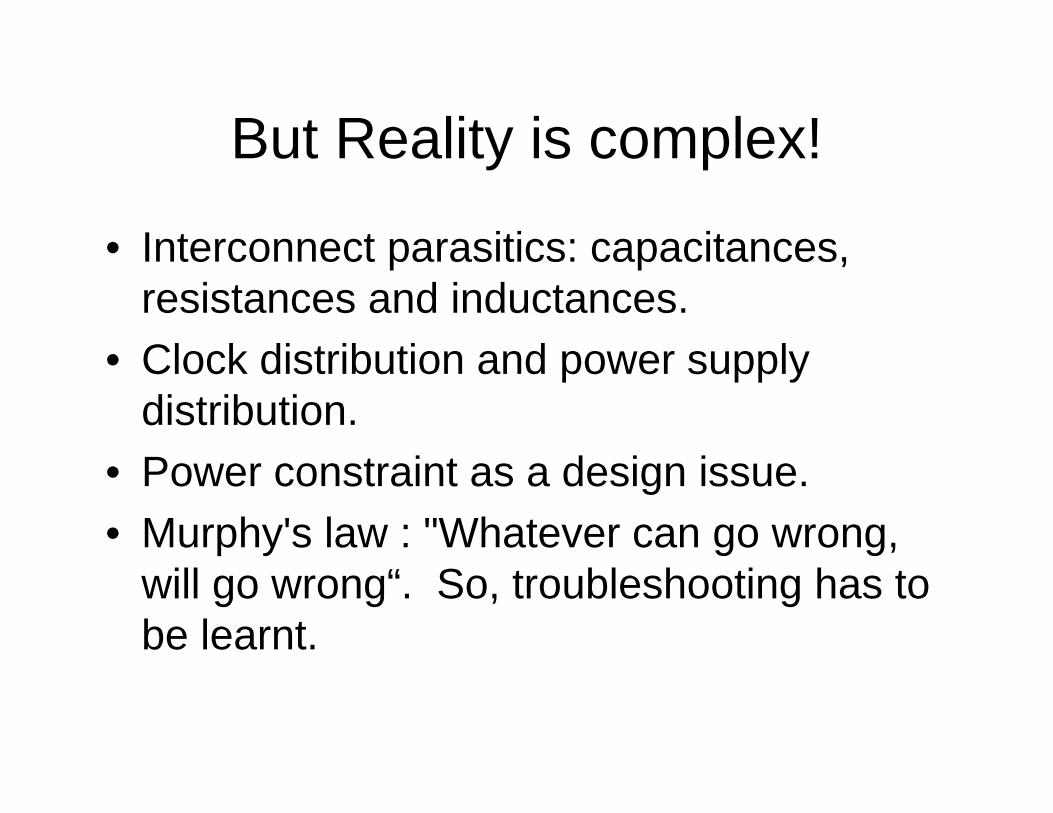
But Reality is complex!
• Interconnect parasitics: capacitances, resistances and inductances.
• Clock distribution and power supply distribution.
• Power constraint as a design issue.• Murphy's law : "Whatever can go wrong,
will go wrong“. So, troubleshooting has to be learnt.
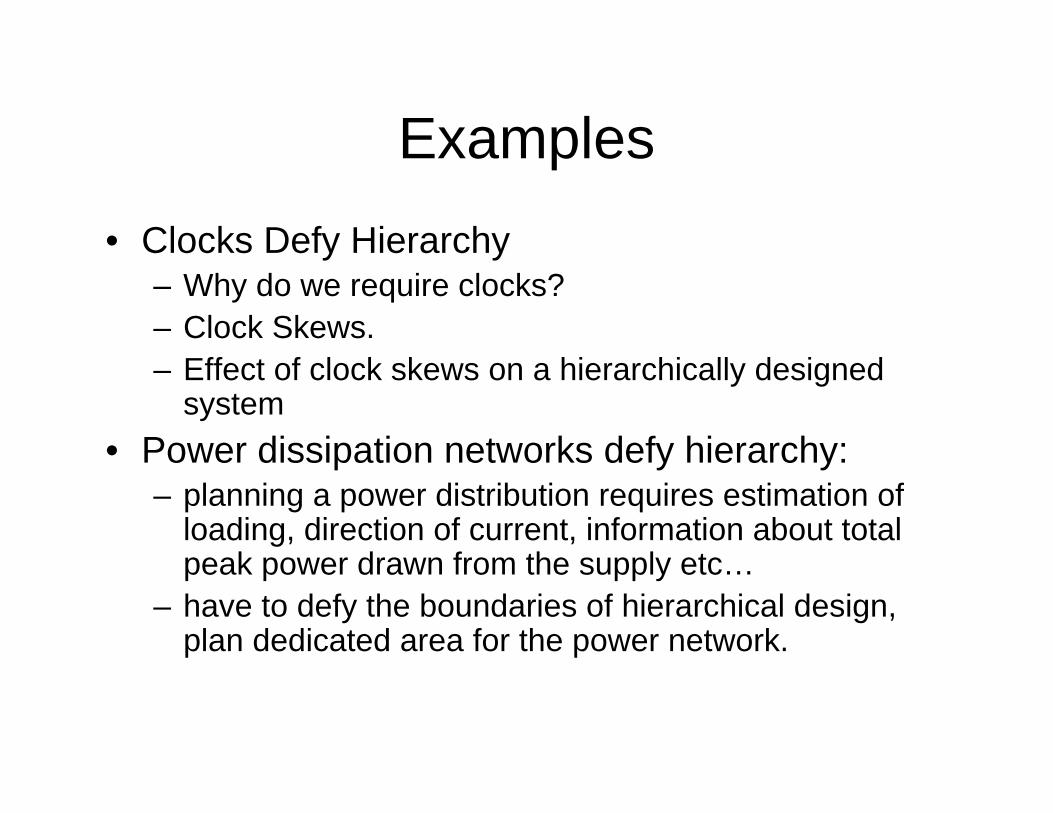
Examples• Clocks Defy Hierarchy
– Why do we require clocks?– Clock Skews.– Effect of clock skews on a hierarchically designed
system• Power dissipation networks defy hierarchy:
– planning a power distribution requires estimation of loading, direction of current, information about total peak power drawn from the supply etc…
– have to defy the boundaries of hierarchical design, plan dedicated area for the power network.

Design Metrics
• How to evaluate performance of a digital circuit (gate, block, …)?– Cost– Reliability– Scalability– Speed (delay, operating frequency) – Power dissipation– Energy to perform a function

Cost of Integrated Circuits
• NRE (non-recurrent engineering) costs– cost of work done by ASIC vendor, mask generation– $10,000-$3,00,000 (Mask cost: $5000-$50,000)– production test cost
• Recurrent costs– silicon processing, packaging, test– proportional to volume– proportional to chip area

NRE Cost is Increasing

Die Cost
Single die
Wafer
From http://www.amd.com
Going up to 12” (30cm)
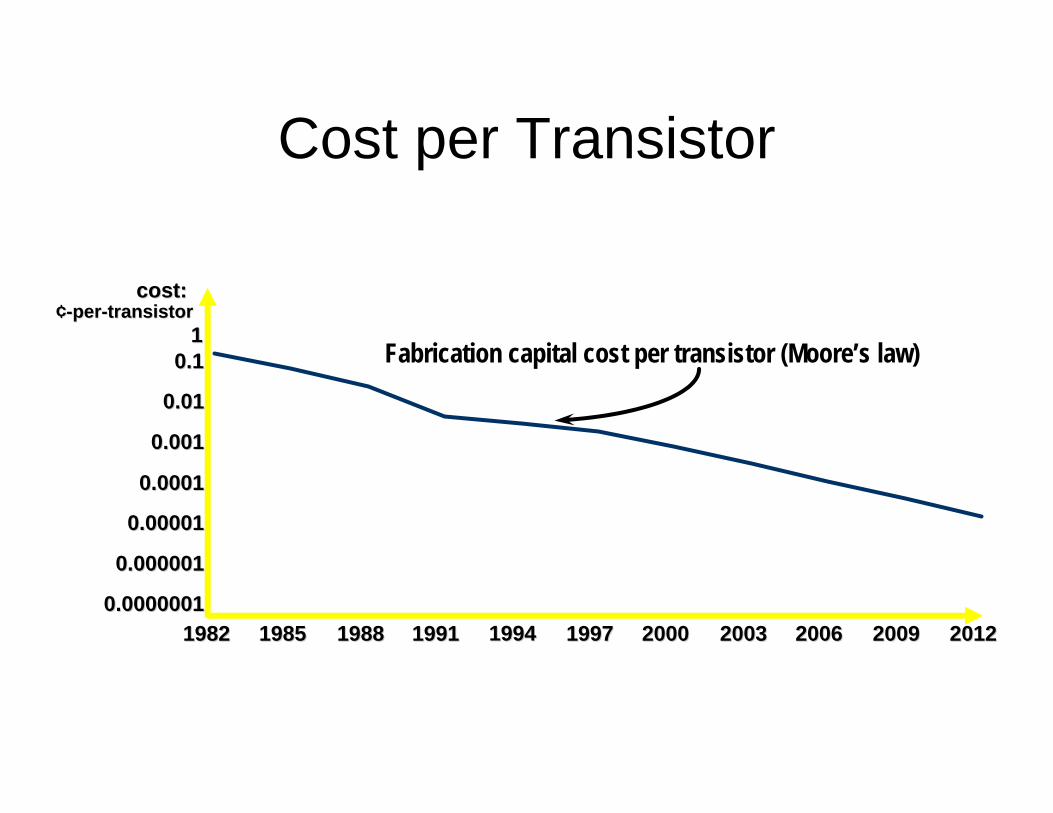
Cost per Transistor
0.00000010.0000001
0.0000010.000001
0.000010.00001
0.00010.0001
0.0010.001
0.010.01
0.10.111
19821982 19851985 19881988 19911991 19941994 19971997 20002000 20032003 20062006 20092009 20122012
cost: cost: ¢¢--perper--transistortransistor
Fabrication capital cost per transistor (Moore’s law)

Yield%100
per wafer chips ofnumber Totalper wafer chips good of No.
×=Y
yield Dieper wafer DiescostWafer cost Die×
=
( )area die2
diameterwafer area die
diameter/2wafer per wafer Dies2
××π
−×π
=

Defects
α−⎟⎠⎞
⎜⎝⎛
α×
+=area dieareaunit per defects1yield die
α is approximately 3
4area) (die cost die f=


![BackEnd[1]- Debdeep](https://img.dokumen.tips/doc/110x75/577d36c21a28ab3a6b93f104/backend1-debdeep.jpg)