Embed Size (px)
Citation preview
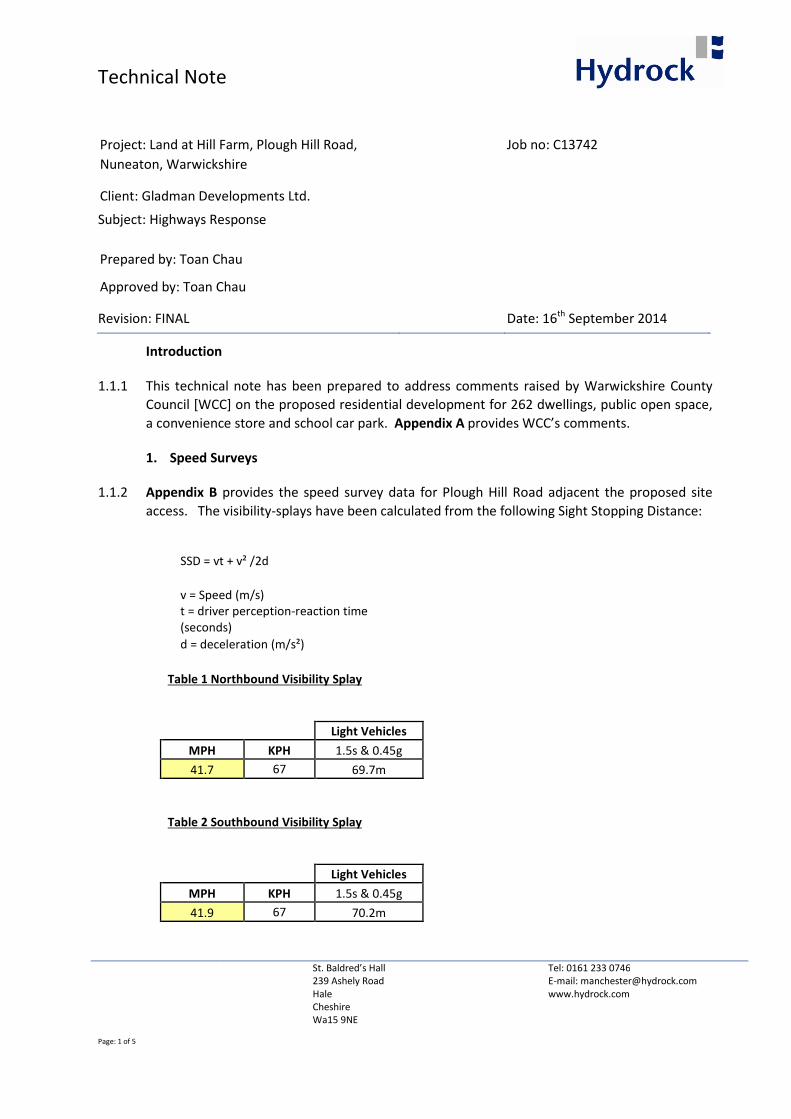
Technical Note
St. Baldred’s Hall
239 Ashely Road
Hale
Cheshire
Wa15 9NE
Tel: 0161 233 0746
E-mail: [email protected]
www.hydrock.com
Page: 1 of 5
Project: Land at Hill Farm, Plough Hill Road,
Nuneaton, Warwickshire
Job no: C13742
Client: Gladman Developments Ltd.
Subject: Highways Response
Prepared by: Toan Chau
Approved by: Toan Chau
Revision: FINAL Date: 16th September 2014
Introduction
1.1.1 This technical note has been prepared to address comments raised by Warwickshire County
Council [WCC] on the proposed residential development for 262 dwellings, public open space,
a convenience store and school car park. Appendix A provides WCC’s comments.
1. Speed Surveys
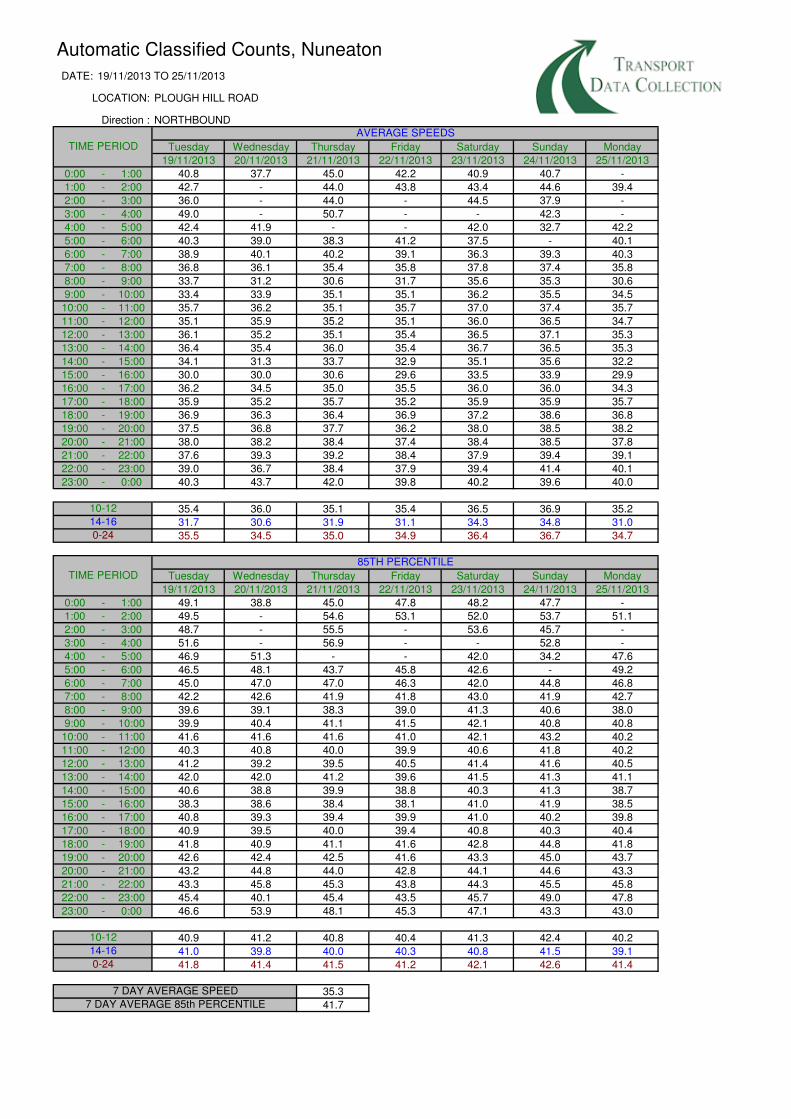
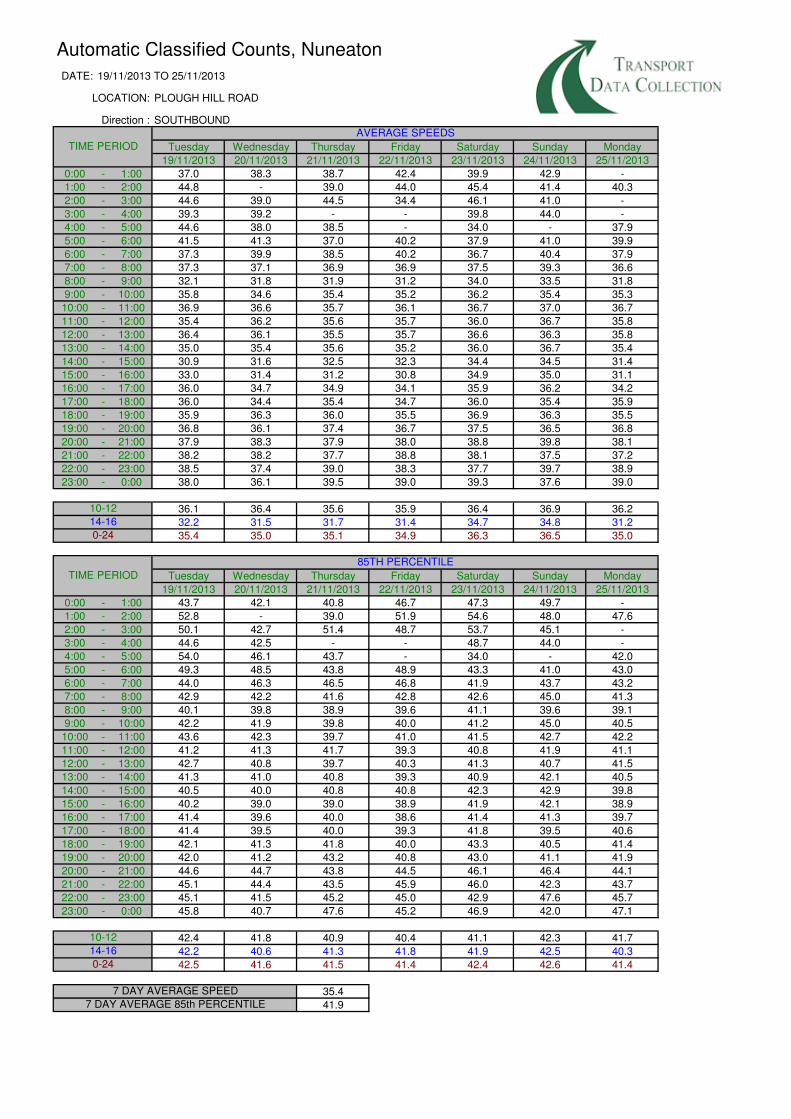
1.1.2 Appendix B provides the speed survey data for Plough Hill Road adjacent the proposed site
access. The visibility-splays have been calculated from the following Sight Stopping Distance:
SSD = vt + v² /2d
v = Speed (m/s) t = driver perception-reaction time
(seconds)
d = deceleration (m/s²)
Table 1 Northbound Visibility Splay
Light Vehicles
MPH KPH 1.5s & 0.45g
41.7 67 69.7m
Table 2 Southbound Visibility Splay
Light Vehicles
MPH KPH 1.5s & 0.45g
41.9 67 70.2m

Gladmans
Plough Hill Road, Nuneaton
C13742.001 Technical Note
Page: 2 of 5
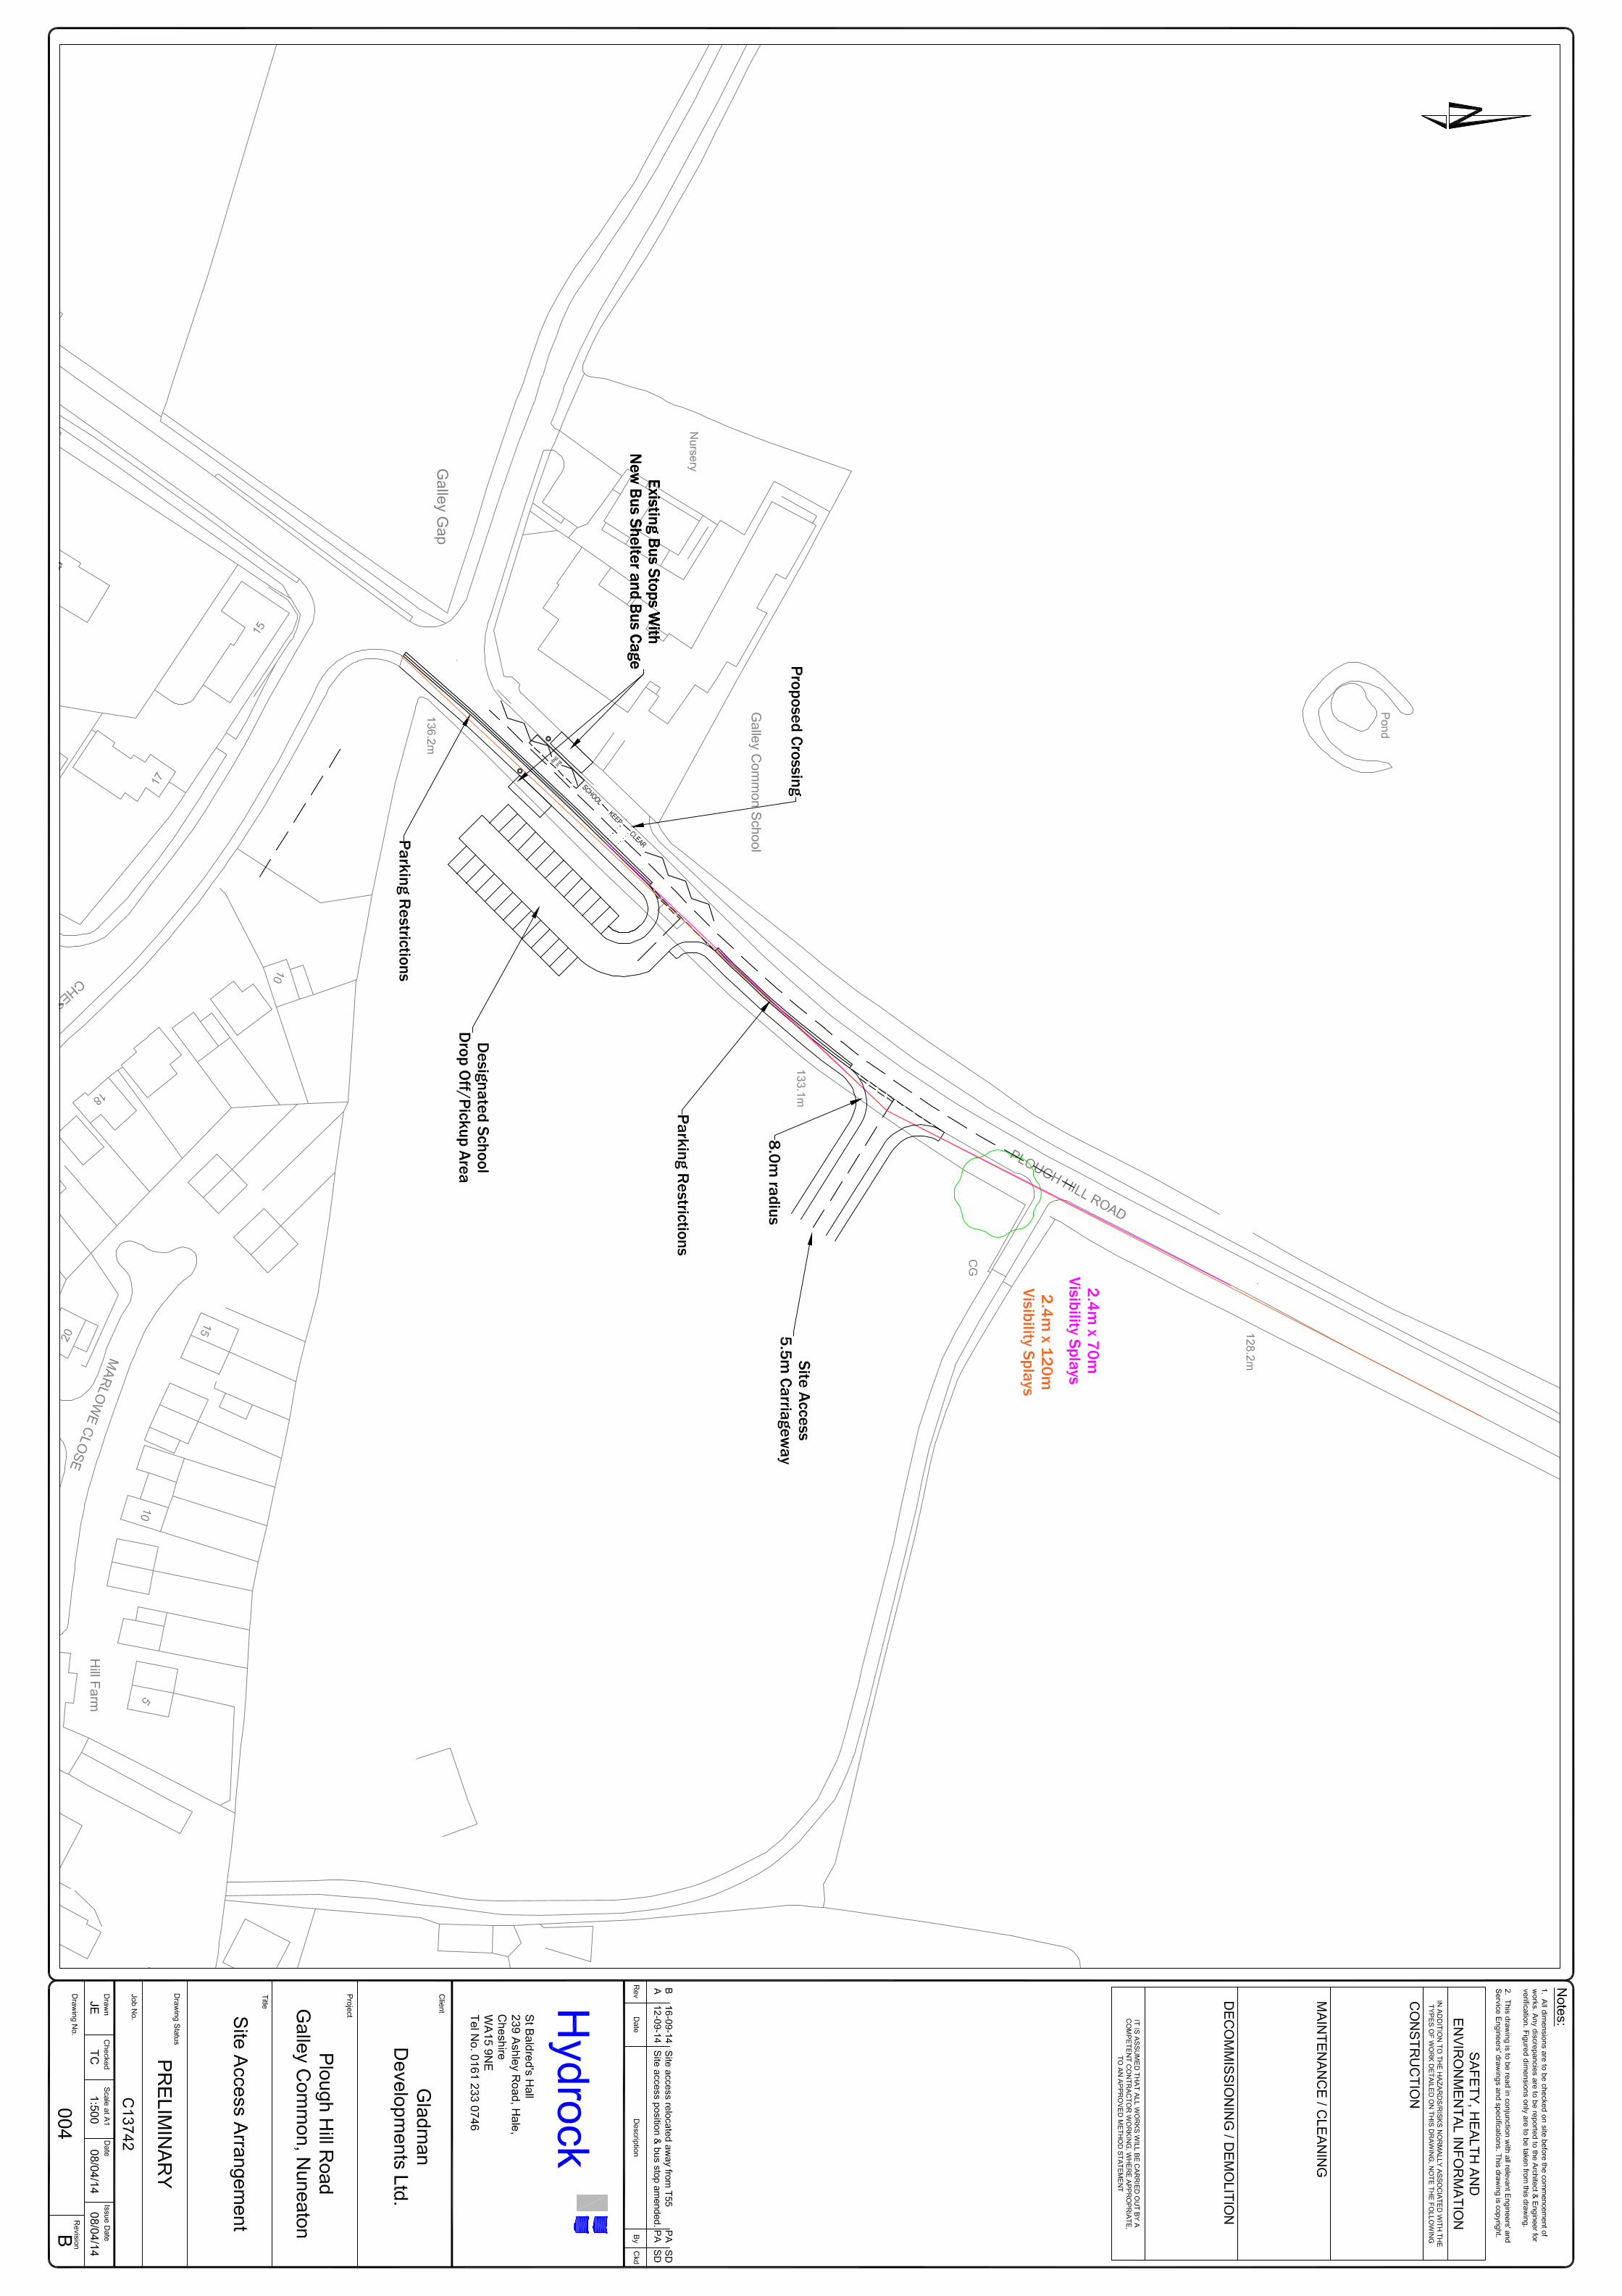
1.1.3 It can be deduced that the visibility splays of 2.4m x 70m are appropriate. Notwithstanding
this, the site access can achieve visibility “y” distance of over 120m which is well in excess of
what is required. Appendix C provides the updated site access proposals with both 2.4m x
70m and 2.4m x 120m visibility splays.
2. Plough Hill Road / Coleshill Road Junction
1.1.4 As agreed with the highway officer, we have updated the PICADY assessment for the Plough
Hill Road / Coleshill Road Junction using direct traffic flow input. Appendix D provides the
updated PICADY assessment.
1.1.5 Table 4 and 5 summarises the PICADY assessment.
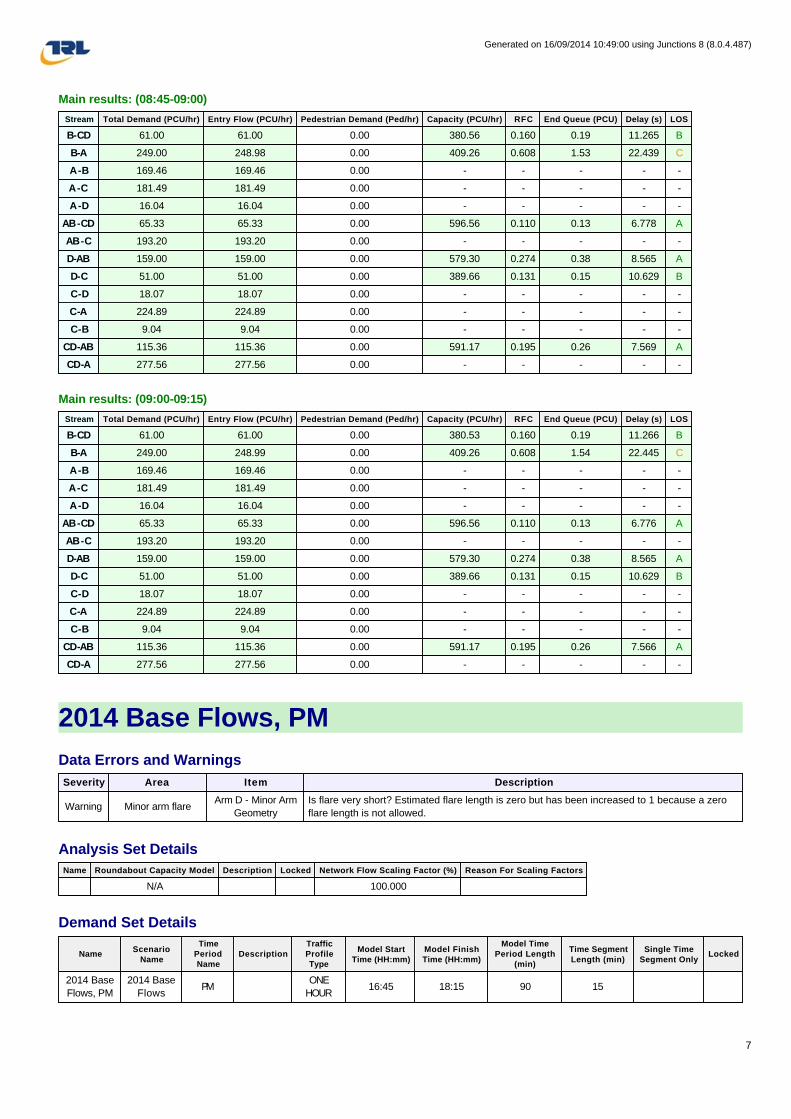
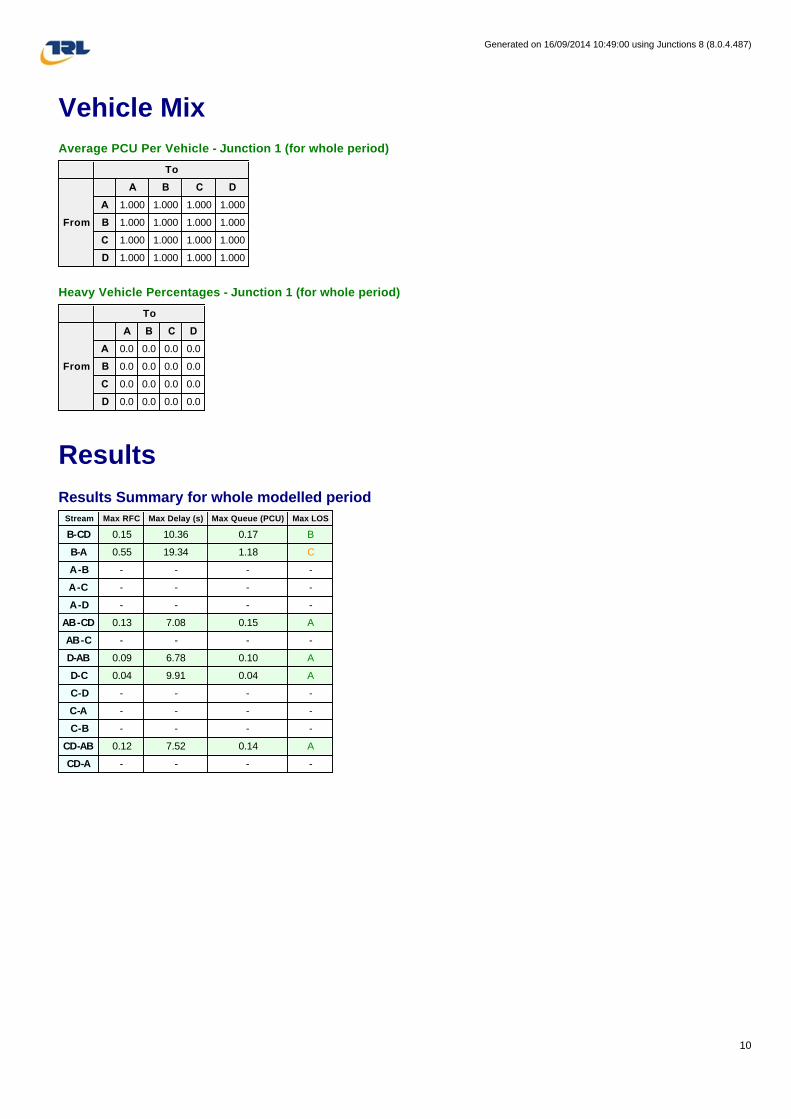
1.1.6 As can be seen, the junction would operate within capacity for all scenarios with only minor
increases in queues.

Gladmans
Plough Hill Road, Nuneaton
C13742.001 Technical Note
Page: 3 of 5
3. Safe Crossing Point
1.1.7 It is agreed that a pedestrian crossing point can be provided to facilitate safe movements to
and from the school. The updated access drawing in Appendix C annotates the location of the
crossing point, although this would be subject to detailed design.
4. Additional Junction Assessments
1.1.8 As part of the initial scoping exercise with Dave Neale (WCC) it was agreed that the wider
highway network was to be assessed using WCC’s own PARAMICS model. This PARAMICS
modelling was carried out by WCC’s consultants ARUP so that it can be readily validated.
1.1.9 ARUP confirmed that the School Hill/Coleshill Road East/Coleshill Road West and Victoria
Road/Camp Hill Road/Bucks Hill Road/Coles Hill Road junctions would operate
satisfactorily even with the proposed development in place. As such, it is clear that the
proposed development would not have a material impact at these junctions.
1.1.10 For completeness and at the request of WCC, additional PICADY assessments have been
carried out for each junction, using the extracted traffic flows from the PARAMICS model as
contained in Appendix E. Please note that on some links, the PARAMICS model redistributes
traffic in order to optimise the network performance. As such, there are links for the
development case where traffic flows are lower than the reference case as traffic is
redistributed on the highway network.
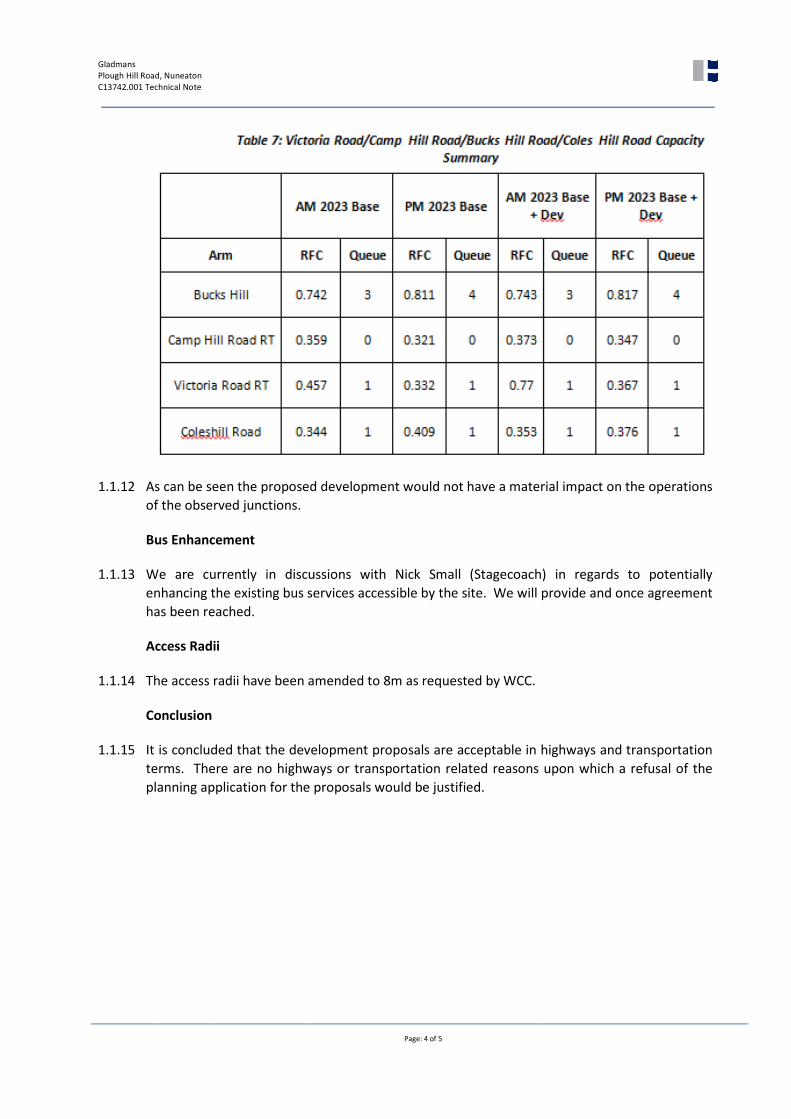
1.1.11 Tables 6 and 7 summarises the 2023 PICADY assessments for the School Hill/Coleshill Road
East/Coleshill Road West and Victoria Road/Camp Hill Road/Bucks Hill Road/Coles Hill
Road junctions respectively.
Gladmans
Plough Hill Road, Nuneaton
C13742.001 Technical Note
Page: 4 of 5
1.1.12 As can be seen the proposed development would not have a material impact on the operations
of the observed junctions.
Bus Enhancement
1.1.13 We are currently in discussions with Nick Small (Stagecoach) in regards to potentially
enhancing the existing bus services accessible by the site. We will provide and once agreement
has been reached.
Access Radii
1.1.14 The access radii have been amended to 8m as requested by WCC.
Conclusion
1.1.15 It is concluded that the development proposals are acceptable in highways and transportation
terms. There are no highways or transportation related reasons upon which a refusal of the
planning application for the proposals would be justified.

www.hydrock.com

Appendices

Appendix A – WCC Comments

Your ref: 032824
My ref: NBB/032824
Your letter received: 11 Jul 2014
Mr Ian Powell Assistant Director, Planning & Public Protection NUNEATON & BEDWORTH BOROUGH COUNCIL Town Hall Coton Road, Nuneaton CV11 5AA
FAO : Chris Kingham
Communities
PO Box 43
Shire Hall
Warwick
CV34 4SX
DX 723360 WARWICK 5
Tel: (01926) 412386
Fax: (01926) 412641
www.warwickshire.gov.uk
04 September 2014 Dear Mr Powell
PROPOSAL: Residential development of up to 262 dwellings and associated
public open space and landscaping, up to 186 square metres of
convenience retail floor space (A1 use) and school car park (all
existing buildings to be demolished) (outline to include access
with appearance, landscaping, layout and scale reserved).
LOCATION: Land at Hill Farm, Plough Hill Road, Nuneaton, Warwickshire
APPLICANT: Gladman Developments Ltd The Highway Authority has considered the submitted plans and Transport Assessment and is satisfied that the methodology used to consider the impact of the proposed development and associated outputs are acceptable. Notwithstanding, the Highway Authority consider that the submission to date does not provide sufficient confidence that the proposed development will not have a detrimental impact to public highway safety or the operation of the local and wider highway network. The Highway Authority's response to your consultation in regard to the above
application which was received by the Council on 11/07/2014, is one of OBJECTION for the following reasons: 1. The applicant has failed to submit any speed survey data to clarify the actual 85%ile speeds of vehicles approaching the proposed new junctions. The results of the speed survey data will provide information on the compliance with the existing posted speed limit and allow the Highway Authority to determine whether the level of visibility proposed (2.4m x 70m) is acceptable or whether increase forward visibility splays and visibility splays from the junction need to be provided to account for the actual speed of

vehicles. The result of the survey may also inform whether there would be any obligations requested for additional traffic calming measures. The speed survey will also assist in determining whether there is a requirement for a right turn lane at the proposed point of access. 2. The submitted Transport Assessment highlights that the junction of Plough Hill Road/ Coleshill Road operates over capacity when considering both the 2014 AM 2014 base + development and the AM 2023 base + development. Compared to the future base scenario this would see an increase in queue length from 2 to 6 in 2014 and from 4 to 15 in 2023. Visibility at the junction of Plough Hill Road/ Coleshill Road is below standard and historically there have been a number of accidents at this junction. The Highway Authority consider that the increase in queuing coupled with the below standard visibility may lead to an increase in drivers taking risks when exiting the junction. This could be detrimental to public highway safety. The Highway Authority consider that the developer must provide additional measure to mitigate the impact of the proposed development at this junction during the AM peak. 3. In addition to the new access to serve the housing development the proposal is also proposing an additional emergency access/ school drop off/pick up area. The Highway Authority consider that both the housing development and the drop off/ pick up area will generate new and additional pedestrians movements from the site to the school on the north side of Plough Hill Lane. Policy RS12 & W2 of Warwickshire Local Transport Plan 2011 – 2026 outline commitments to ensure that safer routes to school are provided. The Highway Authority consider that the applicant must provide a safe crossing point to order to facilitate safe movements to and from the school for pedestrian movements generated by the proposed development. 4. The submitted Transport Assessment identifies that the proposed development will have a notable impact on queuing at the School Hill/Coleshill Road East/ Coleshill Road West & Victoria Road/Camp Hill Road/Bucks Hill Road/ Coles Hill Road junctions. In order to fully consider the impact at these junctions the Highway Authority requests that PICADY assessments are undertaken at these junctions with the results submitted to the Highway Authority for further consideration. Notes for applicant/ Nuneaton and Bedworth Borough Council 1. The Highway Authority consider that improvements to the existing bus provision should be provided to ensure that the use of public transport to access local services and shopping areas is viable. Accordingly, it is considered that an additional service is provided between Nuneaton and the development operating between 0700 & 1900 Monday to Saturday. The overall cost of funding this service for 5 years would be £450,000.

2. Minimum radii of 8m must be applied at the access to the site (rather than the 7.5m radii shown on the submitted layout plan). Yours sincerely Peter Garrison BSc (Hons) EngTech MIHE Development Group CC – Cllr P Johnson, NUNEATON GALLEY COMMON, for information only

Appendix B – Speed Survey data
Automatic Classified Counts, Nuneaton
DATE: 19/11/2013 TO 25/11/2013
LOCATION: PLOUGH HILL ROAD
Direction : NORTHBOUND
Tuesday Wednesday Thursday Friday Saturday Sunday Monday
19/11/2013 20/11/2013 21/11/2013 22/11/2013 23/11/2013 24/11/2013 25/11/2013
0:00 - 1:00 40.8 37.7 45.0 42.2 40.9 40.7 -
1:00 - 2:00 42.7 - 44.0 43.8 43.4 44.6 39.4
2:00 - 3:00 36.0 - 44.0 - 44.5 37.9 -
3:00 - 4:00 49.0 - 50.7 - - 42.3 -
4:00 - 5:00 42.4 41.9 - - 42.0 32.7 42.2
5:00 - 6:00 40.3 39.0 38.3 41.2 37.5 - 40.1
6:00 - 7:00 38.9 40.1 40.2 39.1 36.3 39.3 40.3
7:00 - 8:00 36.8 36.1 35.4 35.8 37.8 37.4 35.8
8:00 - 9:00 33.7 31.2 30.6 31.7 35.6 35.3 30.6
9:00 - 10:00 33.4 33.9 35.1 35.1 36.2 35.5 34.5
10:00 - 11:00 35.7 36.2 35.1 35.7 37.0 37.4 35.7
11:00 - 12:00 35.1 35.9 35.2 35.1 36.0 36.5 34.7
12:00 - 13:00 36.1 35.2 35.1 35.4 36.5 37.1 35.3
13:00 - 14:00 36.4 35.4 36.0 35.4 36.7 36.5 35.3
14:00 - 15:00 34.1 31.3 33.7 32.9 35.1 35.6 32.2
15:00 - 16:00 30.0 30.0 30.6 29.6 33.5 33.9 29.9
16:00 - 17:00 36.2 34.5 35.0 35.5 36.0 36.0 34.3
17:00 - 18:00 35.9 35.2 35.7 35.2 35.9 35.9 35.7
18:00 - 19:00 36.9 36.3 36.4 36.9 37.2 38.6 36.8
19:00 - 20:00 37.5 36.8 37.7 36.2 38.0 38.5 38.2
20:00 - 21:00 38.0 38.2 38.4 37.4 38.4 38.5 37.8
21:00 - 22:00 37.6 39.3 39.2 38.4 37.9 39.4 39.1
22:00 - 23:00 39.0 36.7 38.4 37.9 39.4 41.4 40.1
23:00 - 0:00 40.3 43.7 42.0 39.8 40.2 39.6 40.0
35.4 36.0 35.1 35.4 36.5 36.9 35.2
31.7 30.6 31.9 31.1 34.3 34.8 31.0
35.5 34.5 35.0 34.9 36.4 36.7 34.7
Tuesday Wednesday Thursday Friday Saturday Sunday Monday
19/11/2013 20/11/2013 21/11/2013 22/11/2013 23/11/2013 24/11/2013 25/11/2013
0:00 - 1:00 49.1 38.8 45.0 47.8 48.2 47.7 -
1:00 - 2:00 49.5 - 54.6 53.1 52.0 53.7 51.1
2:00 - 3:00 48.7 - 55.5 - 53.6 45.7 -
3:00 - 4:00 51.6 - 56.9 - - 52.8 -
4:00 - 5:00 46.9 51.3 - - 42.0 34.2 47.6
5:00 - 6:00 46.5 48.1 43.7 45.8 42.6 - 49.2
6:00 - 7:00 45.0 47.0 47.0 46.3 42.0 44.8 46.8
7:00 - 8:00 42.2 42.6 41.9 41.8 43.0 41.9 42.7
8:00 - 9:00 39.6 39.1 38.3 39.0 41.3 40.6 38.0
9:00 - 10:00 39.9 40.4 41.1 41.5 42.1 40.8 40.8
10:00 - 11:00 41.6 41.6 41.6 41.0 42.1 43.2 40.2
11:00 - 12:00 40.3 40.8 40.0 39.9 40.6 41.8 40.2
12:00 - 13:00 41.2 39.2 39.5 40.5 41.4 41.6 40.5
13:00 - 14:00 42.0 42.0 41.2 39.6 41.5 41.3 41.1
14:00 - 15:00 40.6 38.8 39.9 38.8 40.3 41.3 38.7
15:00 - 16:00 38.3 38.6 38.4 38.1 41.0 41.9 38.5
16:00 - 17:00 40.8 39.3 39.4 39.9 41.0 40.2 39.8
17:00 - 18:00 40.9 39.5 40.0 39.4 40.8 40.3 40.4
18:00 - 19:00 41.8 40.9 41.1 41.6 42.8 44.8 41.8
19:00 - 20:00 42.6 42.4 42.5 41.6 43.3 45.0 43.7
20:00 - 21:00 43.2 44.8 44.0 42.8 44.1 44.6 43.3
21:00 - 22:00 43.3 45.8 45.3 43.8 44.3 45.5 45.8
22:00 - 23:00 45.4 40.1 45.4 43.5 45.7 49.0 47.8
23:00 - 0:00 46.6 53.9 48.1 45.3 47.1 43.3 43.0
40.9 41.2 40.8 40.4 41.3 42.4 40.2
41.0 39.8 40.0 40.3 40.8 41.5 39.1
41.8 41.4 41.5 41.2 42.1 42.6 41.4
35.3
41.7
7 DAY AVERAGE SPEED
10-12
14-16
0-24
TIME PERIOD
85TH PERCENTILE
TIME PERIOD
AVERAGE SPEEDS
7 DAY AVERAGE 85th PERCENTILE
10-12
14-16
0-24
Automatic Classified Counts, Nuneaton
DATE: 19/11/2013 TO 25/11/2013
LOCATION: PLOUGH HILL ROAD
Direction : SOUTHBOUND
Tuesday Wednesday Thursday Friday Saturday Sunday Monday
19/11/2013 20/11/2013 21/11/2013 22/11/2013 23/11/2013 24/11/2013 25/11/2013
0:00 - 1:00 37.0 38.3 38.7 42.4 39.9 42.9 -
1:00 - 2:00 44.8 - 39.0 44.0 45.4 41.4 40.3
2:00 - 3:00 44.6 39.0 44.5 34.4 46.1 41.0 -
3:00 - 4:00 39.3 39.2 - - 39.8 44.0 -
4:00 - 5:00 44.6 38.0 38.5 - 34.0 - 37.9
5:00 - 6:00 41.5 41.3 37.0 40.2 37.9 41.0 39.9
6:00 - 7:00 37.3 39.9 38.5 40.2 36.7 40.4 37.9
7:00 - 8:00 37.3 37.1 36.9 36.9 37.5 39.3 36.6
8:00 - 9:00 32.1 31.8 31.9 31.2 34.0 33.5 31.8
9:00 - 10:00 35.8 34.6 35.4 35.2 36.2 35.4 35.3
10:00 - 11:00 36.9 36.6 35.7 36.1 36.7 37.0 36.7
11:00 - 12:00 35.4 36.2 35.6 35.7 36.0 36.7 35.8
12:00 - 13:00 36.4 36.1 35.5 35.7 36.6 36.3 35.8
13:00 - 14:00 35.0 35.4 35.6 35.2 36.0 36.7 35.4
14:00 - 15:00 30.9 31.6 32.5 32.3 34.4 34.5 31.4
15:00 - 16:00 33.0 31.4 31.2 30.8 34.9 35.0 31.1
16:00 - 17:00 36.0 34.7 34.9 34.1 35.9 36.2 34.2
17:00 - 18:00 36.0 34.4 35.4 34.7 36.0 35.4 35.9
18:00 - 19:00 35.9 36.3 36.0 35.5 36.9 36.3 35.5
19:00 - 20:00 36.8 36.1 37.4 36.7 37.5 36.5 36.8
20:00 - 21:00 37.9 38.3 37.9 38.0 38.8 39.8 38.1
21:00 - 22:00 38.2 38.2 37.7 38.8 38.1 37.5 37.2
22:00 - 23:00 38.5 37.4 39.0 38.3 37.7 39.7 38.9
23:00 - 0:00 38.0 36.1 39.5 39.0 39.3 37.6 39.0
36.1 36.4 35.6 35.9 36.4 36.9 36.2
32.2 31.5 31.7 31.4 34.7 34.8 31.2
35.4 35.0 35.1 34.9 36.3 36.5 35.0
Tuesday Wednesday Thursday Friday Saturday Sunday Monday
19/11/2013 20/11/2013 21/11/2013 22/11/2013 23/11/2013 24/11/2013 25/11/2013
0:00 - 1:00 43.7 42.1 40.8 46.7 47.3 49.7 -
1:00 - 2:00 52.8 - 39.0 51.9 54.6 48.0 47.6
2:00 - 3:00 50.1 42.7 51.4 48.7 53.7 45.1 -
3:00 - 4:00 44.6 42.5 - - 48.7 44.0 -
4:00 - 5:00 54.0 46.1 43.7 - 34.0 - 42.0
5:00 - 6:00 49.3 48.5 43.8 48.9 43.3 41.0 43.0
6:00 - 7:00 44.0 46.3 46.5 46.8 41.9 43.7 43.2
7:00 - 8:00 42.9 42.2 41.6 42.8 42.6 45.0 41.3
8:00 - 9:00 40.1 39.8 38.9 39.6 41.1 39.6 39.1
9:00 - 10:00 42.2 41.9 39.8 40.0 41.2 45.0 40.5
10:00 - 11:00 43.6 42.3 39.7 41.0 41.5 42.7 42.2
11:00 - 12:00 41.2 41.3 41.7 39.3 40.8 41.9 41.1
12:00 - 13:00 42.7 40.8 39.7 40.3 41.3 40.7 41.5
13:00 - 14:00 41.3 41.0 40.8 39.3 40.9 42.1 40.5
14:00 - 15:00 40.5 40.0 40.8 40.8 42.3 42.9 39.8
15:00 - 16:00 40.2 39.0 39.0 38.9 41.9 42.1 38.9
16:00 - 17:00 41.4 39.6 40.0 38.6 41.4 41.3 39.7
17:00 - 18:00 41.4 39.5 40.0 39.3 41.8 39.5 40.6
18:00 - 19:00 42.1 41.3 41.8 40.0 43.3 40.5 41.4
19:00 - 20:00 42.0 41.2 43.2 40.8 43.0 41.1 41.9
20:00 - 21:00 44.6 44.7 43.8 44.5 46.1 46.4 44.1
21:00 - 22:00 45.1 44.4 43.5 45.9 46.0 42.3 43.7
22:00 - 23:00 45.1 41.5 45.2 45.0 42.9 47.6 45.7
23:00 - 0:00 45.8 40.7 47.6 45.2 46.9 42.0 47.1
42.4 41.8 40.9 40.4 41.1 42.3 41.7
42.2 40.6 41.3 41.8 41.9 42.5 40.3
42.5 41.6 41.5 41.4 42.4 42.6 41.4
35.4
41.9
14-16
0-24
85TH PERCENTILE
TIME PERIOD
AVERAGE SPEEDS
TIME PERIOD
7 DAY AVERAGE SPEED
7 DAY AVERAGE 85th PERCENTILE
10-12
14-16
0-24
10-12


Appendix C – Revised Access Arrangement

Appendix D – Plough Hill Road / Coleshill
Road Junction PICADY
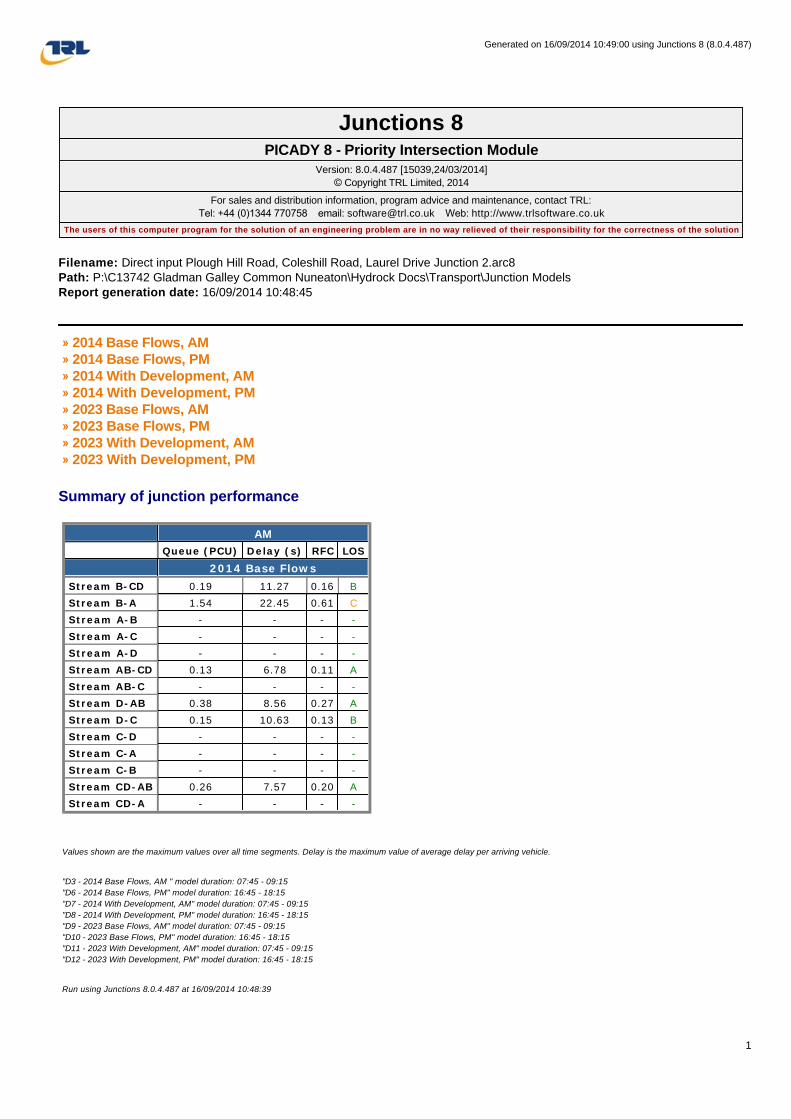
Filename: Direct input Plough Hill Road, Coleshill Road, Laurel Drive Junction 2.arc8
Path: P:\C13742 Gladman Galley Common Nuneaton\Hydrock Docs\Transport\Junction Models
Report generation date: 16/09/2014 10:48:45
» 2014 Base Flows, AM » 2014 Base Flows, PM » 2014 With Development, AM » 2014 With Development, PM » 2023 Base Flows, AM » 2023 Base Flows, PM » 2023 With Development, AM » 2023 With Development, PM
Summary of junction performance
Values shown are the maximum values over all time segments. Delay is the maximum value of average delay per arriving vehicle.
"D3 - 2014 Base Flows, AM " model duration: 07:45 - 09:15
"D6 - 2014 Base Flows, PM" model duration: 16:45 - 18:15
"D7 - 2014 With Development, AM" model duration: 07:45 - 09:15
"D8 - 2014 With Development, PM" model duration: 16:45 - 18:15
"D9 - 2023 Base Flows, AM" model duration: 07:45 - 09:15
"D10 - 2023 Base Flows, PM" model duration: 16:45 - 18:15
"D11 - 2023 With Development, AM" model duration: 07:45 - 09:15
"D12 - 2023 With Development, PM" model duration: 16:45 - 18:15
Run using Junctions 8.0.4.487 at 16/09/2014 10:48:39
Junctions 8PICADY 8 - Priority Intersection Module
Version: 8.0.4.487 [15039,24/03/2014]
© Copyright TRL Limited, 2014
For sales and distribution information, program advice and maintenance, contact TRL:
Tel: +44 (0)1344 770758 email: [email protected] Web: http://www.trlsoftware.co.uk
The users of this computer program for the solution of an engineering problem are in no way relieved of their responsibility for the correctness of the solution
AM
Queue (PCU) Delay (s) RFC LOS
2014 Base Flows
Stream B-CD 0.19 11.27 0.16 B
Stream B-A 1.54 22.45 0.61 C
Stream A-B - - - -
Stream A-C - - - -
Stream A-D - - - -
Stream AB-CD 0.13 6.78 0.11 A
Stream AB-C - - - -
Stream D-AB 0.38 8.56 0.27 A
Stream D-C 0.15 10.63 0.13 B
Stream C-D - - - -
Stream C-A - - - -
Stream C-B - - - -
Stream CD-AB 0.26 7.57 0.20 A
Stream CD-A - - - -
Generated on 16/09/2014 10:49:00 using Junctions 8 (8.0.4.487)
1

File summary
Analysis Options
Units
2014 Base Flows, AM
Data Errors and Warnings
Analysis Set Details
Demand Set Details
Junction Network
Junctions
Junction Network Options
Title (untitled)
Location
Site Number
Date 06/05/2014
Version
Status (new file)
Identifier
Client
Jobnumber
Enumerator michaelchau
Description
Vehicle Length
(m)
Do Queue
Variations
Calculate Residual
Capacity
Residual Capacity Criteria
Type
RFC
Threshold
Average Delay Threshold
(s)
Queue Threshold
(PCU)
5.75 N/A 0.85 36.00 20.00
Distance Units Speed Units Traffic Units Input Traffic Units Results Flow Units Average Delay Units Total Delay Units Rate Of Delay Units
m kph PCU PCU perHour s -Min perMin
Severity Area Item Description
Warning Minor arm flareArm D - Minor Arm
Geometry
Is flare very short? Estimated flare length is zero but has been increased to 1 because a zero
flare length is not allowed.
Name Roundabout Capacity Model Description Locked Network Flow Scaling Factor (%) Reason For Scaling Factors
N/A 100.000
NameScenario
Name
Time
Period
Name
Description
Traffic
Profile
Type
Model Start
Time (HH:mm)
Model Finish
Time (HH:mm)
Model Time
Period Length
(min)
Time Segment
Length (min)
Single Time
Segment OnlyLocked
2014 Base
Flows, AM
2014 Base
FlowsAM DIRECT 07:45 09:15 90 15
Junction Name Junction Type Major Road Direction Arm Order Junction Delay (s) Junction LOS
1 (untitled) NS-OS Stagger (UK LR Stagger) Two-way A,B,C,D 13.55 B
Driving Side Lighting
Left Normal/unknown
Generated on 16/09/2014 10:49:00 using Junctions 8 (8.0.4.487)
2

Arms
Arms
Major Arm Geometry
Geometries for Arm C are measured opposite Arm B. Geometries for Arm A (if relevant) are measured opposite Arm D.
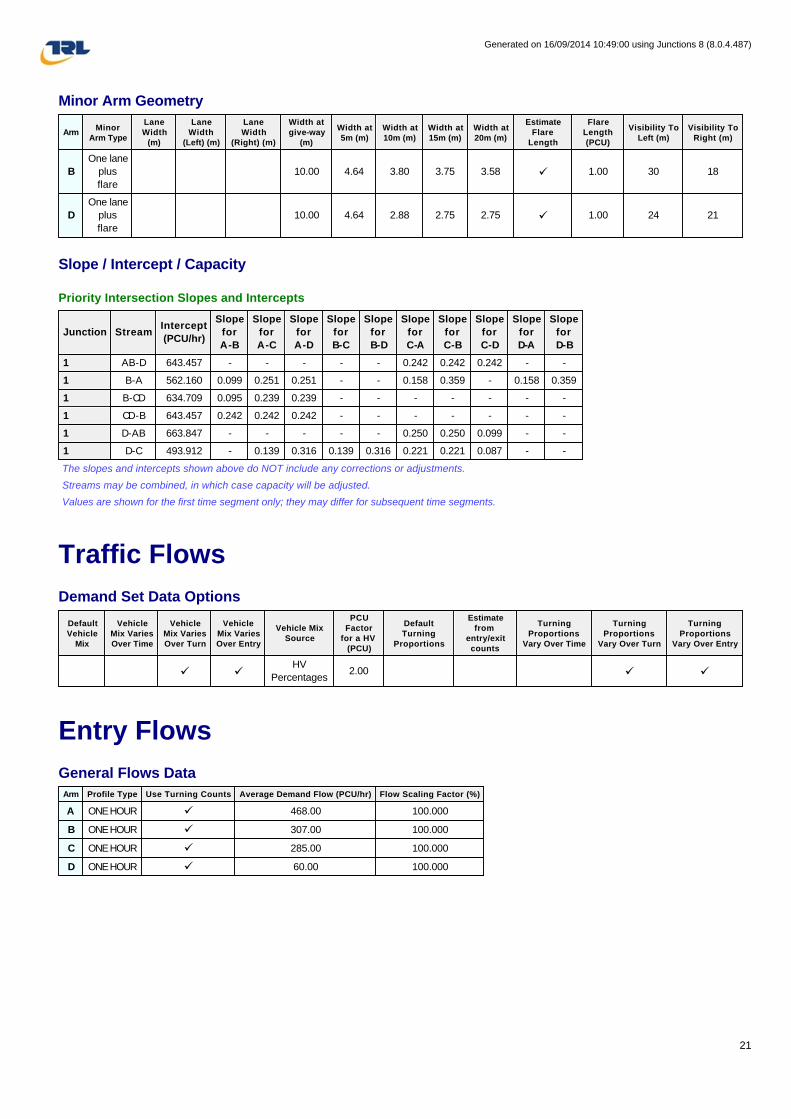
Minor Arm Geometry
Slope / Intercept / Capacity
Priority Intersection Slopes and Intercepts
The slopes and intercepts shown above do NOT include any corrections or adjustments.
Streams may be combined, in which case capacity will be adjusted.
Values are shown for the first time segment only; they may differ for subsequent time segments.
Traffic Flows
Demand Set Data Options
Arm Arm Name Description Arm Type
A A Coleshill Road East Major
B B Plough Hill Road Minor
C C Coleshill Road West Major
D D Laurel Drive Minor
ArmWidth of
carriageway (m)
Has kerbed central
reserve
Width of kerbed central
reserve (m)
Has right
turn bay
Width For Right
Turn (m)
Visibility For Right
Turn (m)Blocks?
Blocking Queue
(PCU)
A 6.65 0.00 2.20 120.00 ü 1.00
C 6.65 0.00 2.20 120.00 ü 1.00
ArmMinor
Arm Type
Lane
Width
(m)
Lane
Width
(Left) (m)
Lane
Width
(Right) (m)
Width at
give-way
(m)
Width at
5m (m)
Width at
10m (m)
Width at
15m (m)
Width at
20m (m)
Estimate
Flare
Length
Flare
Length
(PCU)
Visibility To
Left (m)
Visibility To
Right (m)
B
One lane
plus
flare
10.00 4.64 3.80 3.75 3.58 ü 1.00 30 18
D
One lane
plus
flare
10.00 4.64 2.88 2.75 2.75 ü 1.00 24 21
Junction StreamIntercept
(PCU/hr)
Slope
for
A-B
Slope
for
A-C
Slope
for
A-D
Slope
for
B-C
Slope
for
B-D
Slope
for
C-A
Slope
for
C-B
Slope
for
C-D
Slope
for
D-A
Slope
for
D-B
1 AB-D 643.457 - - - - - 0.242 0.242 0.242 - -
1 B-A 563.883 0.100 0.252 0.252 - - 0.159 0.360 - 0.159 0.360
1 B-CD 632.503 0.094 0.238 0.238 - - - - - - -
1 CD-B 643.457 0.242 0.242 0.242 - - - - - - -
1 D-AB 661.310 - - - - - 0.249 0.249 0.099 - -
1 D-C 498.846 - 0.140 0.319 0.140 0.319 0.223 0.223 0.088 - -
Default
Vehicle
Mix
Vehicle
Mix Varies
Over Time
Vehicle
Mix Varies
Over Turn
Vehicle
Mix Varies
Over Entry
Vehicle Mix
Source
PCU
Factor
for a HV
(PCU)
Default
Turning
Proportions
Estimate
from
entry/exit
counts
Turning
Proportions
Vary Over Time
Turning
Proportions
Vary Over Turn
Turning
Proportions
Vary Over Entry
ü üHV
Percentages2.00 ü ü
Generated on 16/09/2014 10:49:00 using Junctions 8 (8.0.4.487)
3

Entry Flows
General Flows Data
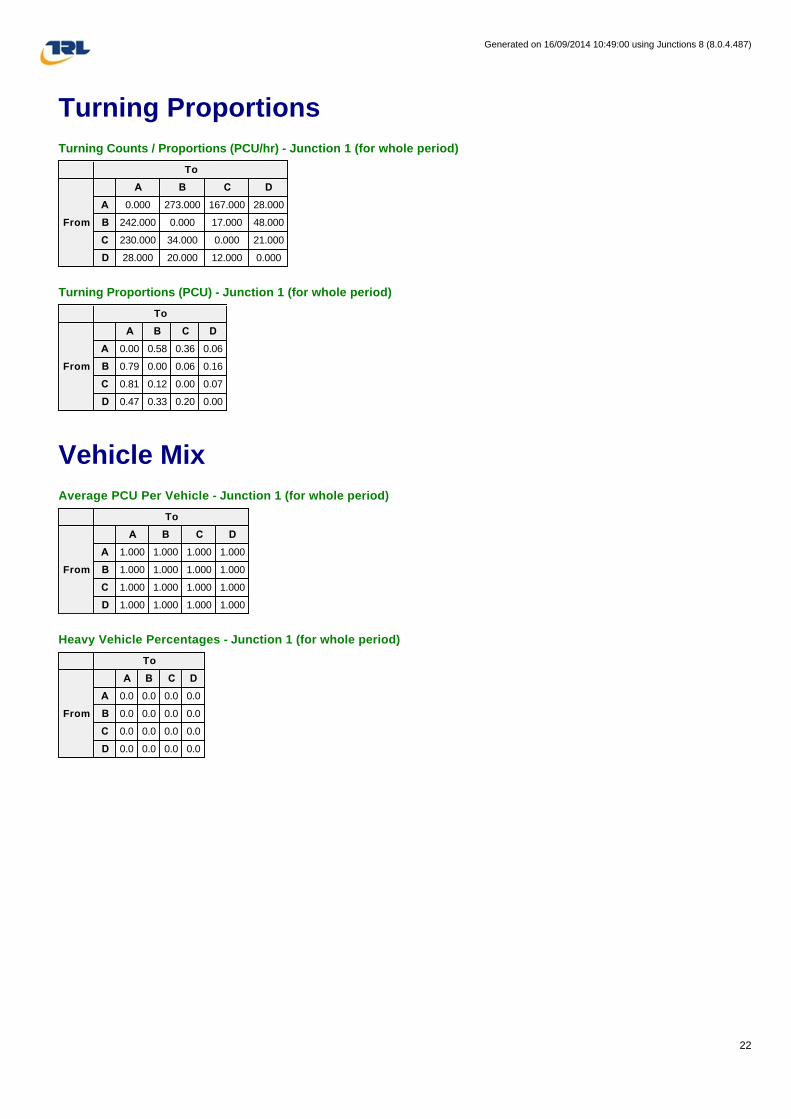
Turning Proportions
Turning Counts / Proportions (PCU/hr) - Junction 1 (for whole period)
Turning Proportions (PCU) - Junction 1 (for whole period)
Vehicle Mix
Average PCU Per Vehicle - Junction 1 (for whole period)
Heavy Vehicle Percentages - Junction 1 (for whole period)
Arm Profile Type Use Turning Counts Average Demand Flow (PCU/hr) Flow Scaling Factor (%)
A DIRECT N/A 100.000
B DIRECT N/A 100.000
C DIRECT N/A 100.000
D DIRECT N/A 100.000
To
From
A B C D
A 0.000 169.000 181.000 16.000
B 249.000 0.000 14.000 47.000
C 224.000 9.000 0.000 18.000
D 63.000 96.000 51.000 0.000
To
From
A B C D
A 0.00 0.46 0.49 0.04
B 0.80 0.00 0.05 0.15
C 0.89 0.04 0.00 0.07
D 0.30 0.46 0.24 0.00
To
From
A B C D
A 1.000 1.000 1.000 1.000
B 1.000 1.000 1.000 1.000
C 1.000 1.000 1.000 1.000
D 1.000 1.000 1.000 1.000
To
From
A B C D
A 0.0 0.0 0.0 0.0
B 0.0 0.0 0.0 0.0
C 0.0 0.0 0.0 0.0
D 0.0 0.0 0.0 0.0
Generated on 16/09/2014 10:49:00 using Junctions 8 (8.0.4.487)
4

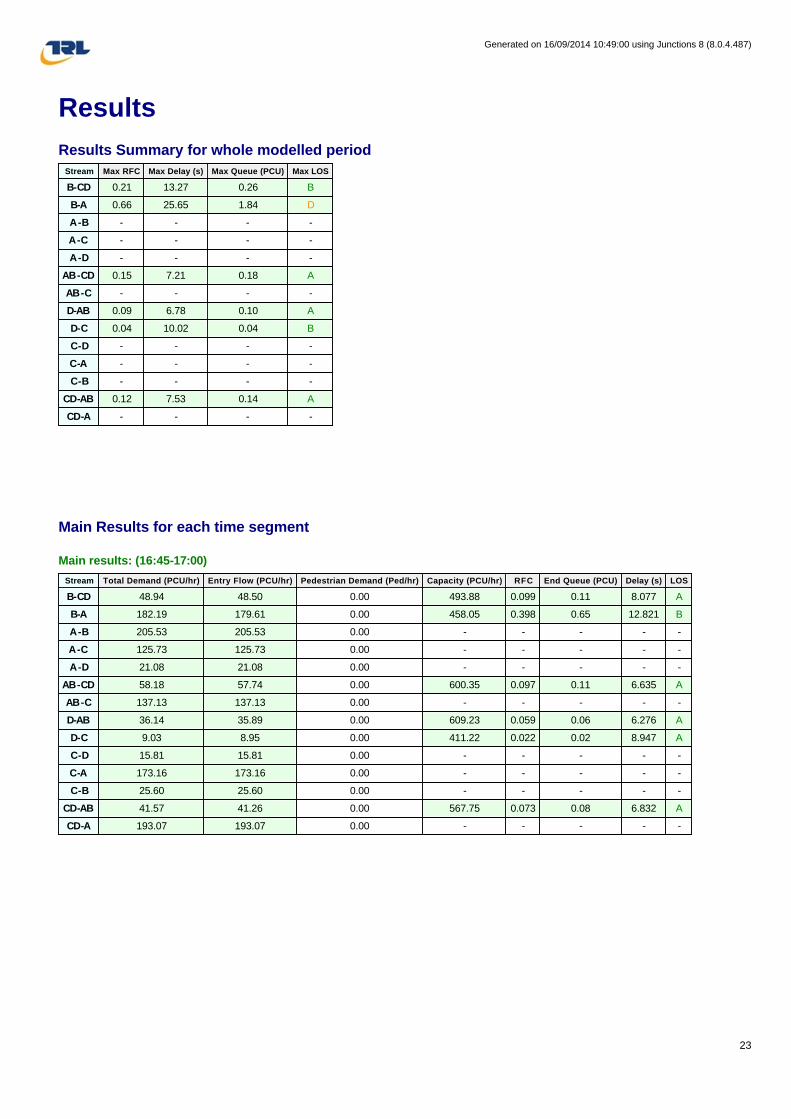
Results
Results Summary for whole modelled period
Main Results for each time segment
Main results: (07:45-08:00)
Stream Max RFC Max Delay (s) Max Queue (PCU) Max LOS
B-CD 0.16 11.27 0.19 B
B-A 0.61 22.45 1.54 C
A-B - - - -
A-C - - - -
A-D - - - -
AB-CD 0.11 6.78 0.13 A
AB-C - - - -
D-AB 0.27 8.56 0.38 A
D-C 0.13 10.63 0.15 B
C-D - - - -
C-A - - - -
C-B - - - -
CD-AB 0.20 7.57 0.26 A
CD-A - - - -
Stream Total Demand (PCU/hr) Entry Flow (PCU/hr) Pedestrian Demand (Ped/hr) Capacity (PCU/hr) RFC End Queue (PCU) Delay (s) LOS
B-CD 61.00 60.27 0.00 390.06 0.156 0.18 10.892 B
B-A 249.00 243.17 0.00 410.09 0.607 1.46 20.913 C
A-B 169.46 169.46 0.00 - - - - -
A-C 181.49 181.49 0.00 - - - - -
A-D 16.04 16.04 0.00 - - - - -
AB-CD 64.73 64.24 0.00 596.42 0.109 0.12 6.759 A
AB-C 193.08 193.08 0.00 - - - - -
D-AB 159.00 157.51 0.00 579.64 0.274 0.37 8.499 A
D-C 51.00 50.41 0.00 390.21 0.131 0.15 10.577 B
C-D 18.07 18.07 0.00 - - - - -
C-A 224.89 224.89 0.00 - - - - -
C-B 9.04 9.04 0.00 - - - - -
CD-AB 114.27 113.26 0.00 590.79 0.193 0.25 7.524 A
CD-A 277.17 277.17 0.00 - - - - -
Generated on 16/09/2014 10:49:00 using Junctions 8 (8.0.4.487)
5

Main results: (08:00-08:15)
Main results: (08:15-08:30)
Main results: (08:30-08:45)
Stream Total Demand (PCU/hr) Entry Flow (PCU/hr) Pedestrian Demand (Ped/hr) Capacity (PCU/hr) RFC End Queue (PCU) Delay (s) LOS
B-CD 61.00 60.98 0.00 380.99 0.160 0.19 11.249 B
B-A 249.00 248.81 0.00 409.27 0.608 1.50 22.367 C
A-B 169.46 169.46 0.00 - - - - -
A-C 181.49 181.49 0.00 - - - - -
A-D 16.04 16.04 0.00 - - - - -
AB-CD 65.32 65.31 0.00 596.55 0.109 0.12 6.775 A
AB-C 193.20 193.20 0.00 - - - - -
D-AB 159.00 158.99 0.00 579.30 0.274 0.38 8.564 A
D-C 51.00 51.00 0.00 389.67 0.131 0.15 10.629 B
C-D 18.07 18.07 0.00 - - - - -
C-A 224.89 224.89 0.00 - - - - -
C-B 9.04 9.04 0.00 - - - - -
CD-AB 115.36 115.34 0.00 591.17 0.195 0.25 7.566 A
CD-A 277.56 277.56 0.00 - - - - -
Stream Total Demand (PCU/hr) Entry Flow (PCU/hr) Pedestrian Demand (Ped/hr) Capacity (PCU/hr) RFC End Queue (PCU) Delay (s) LOS
B-CD 61.00 61.00 0.00 380.70 0.160 0.19 11.259 B
B-A 249.00 248.94 0.00 409.26 0.608 1.52 22.414 C
A-B 169.46 169.46 0.00 - - - - -
A-C 181.49 181.49 0.00 - - - - -
A-D 16.04 16.04 0.00 - - - - -
AB-CD 65.33 65.33 0.00 596.55 0.110 0.13 6.778 A
AB-C 193.20 193.20 0.00 - - - - -
D-AB 159.00 159.00 0.00 579.30 0.274 0.38 8.565 A
D-C 51.00 51.00 0.00 389.67 0.131 0.15 10.629 B
C-D 18.07 18.07 0.00 - - - - -
C-A 224.89 224.89 0.00 - - - - -
C-B 9.04 9.04 0.00 - - - - -
CD-AB 115.36 115.36 0.00 591.17 0.195 0.26 7.566 A
CD-A 277.56 277.56 0.00 - - - - -
Stream Total Demand (PCU/hr) Entry Flow (PCU/hr) Pedestrian Demand (Ped/hr) Capacity (PCU/hr) RFC End Queue (PCU) Delay (s) LOS
B-CD 61.00 61.00 0.00 380.61 0.160 0.19 11.263 B
B-A 249.00 248.97 0.00 409.26 0.608 1.53 22.432 C
A-B 169.46 169.46 0.00 - - - - -
A-C 181.49 181.49 0.00 - - - - -
A-D 16.04 16.04 0.00 - - - - -
AB-CD 65.33 65.33 0.00 596.56 0.110 0.13 6.778 A
AB-C 193.20 193.20 0.00 - - - - -
D-AB 159.00 159.00 0.00 579.30 0.274 0.38 8.565 A
D-C 51.00 51.00 0.00 389.66 0.131 0.15 10.629 B
C-D 18.07 18.07 0.00 - - - - -
C-A 224.89 224.89 0.00 - - - - -
C-B 9.04 9.04 0.00 - - - - -
CD-AB 115.36 115.36 0.00 591.17 0.195 0.26 7.566 A
CD-A 277.56 277.56 0.00 - - - - -
Generated on 16/09/2014 10:49:00 using Junctions 8 (8.0.4.487)
6
Main results: (08:45-09:00)
Main results: (09:00-09:15)
2014 Base Flows, PM
Data Errors and Warnings
Analysis Set Details
Demand Set Details
Stream Total Demand (PCU/hr) Entry Flow (PCU/hr) Pedestrian Demand (Ped/hr) Capacity (PCU/hr) RFC End Queue (PCU) Delay (s) LOS
B-CD 61.00 61.00 0.00 380.56 0.160 0.19 11.265 B
B-A 249.00 248.98 0.00 409.26 0.608 1.53 22.439 C
A-B 169.46 169.46 0.00 - - - - -
A-C 181.49 181.49 0.00 - - - - -
A-D 16.04 16.04 0.00 - - - - -
AB-CD 65.33 65.33 0.00 596.56 0.110 0.13 6.778 A
AB-C 193.20 193.20 0.00 - - - - -
D-AB 159.00 159.00 0.00 579.30 0.274 0.38 8.565 A
D-C 51.00 51.00 0.00 389.66 0.131 0.15 10.629 B
C-D 18.07 18.07 0.00 - - - - -
C-A 224.89 224.89 0.00 - - - - -
C-B 9.04 9.04 0.00 - - - - -
CD-AB 115.36 115.36 0.00 591.17 0.195 0.26 7.569 A
CD-A 277.56 277.56 0.00 - - - - -
Stream Total Demand (PCU/hr) Entry Flow (PCU/hr) Pedestrian Demand (Ped/hr) Capacity (PCU/hr) RFC End Queue (PCU) Delay (s) LOS
B-CD 61.00 61.00 0.00 380.53 0.160 0.19 11.266 B
B-A 249.00 248.99 0.00 409.26 0.608 1.54 22.445 C
A-B 169.46 169.46 0.00 - - - - -
A-C 181.49 181.49 0.00 - - - - -
A-D 16.04 16.04 0.00 - - - - -
AB-CD 65.33 65.33 0.00 596.56 0.110 0.13 6.776 A
AB-C 193.20 193.20 0.00 - - - - -
D-AB 159.00 159.00 0.00 579.30 0.274 0.38 8.565 A
D-C 51.00 51.00 0.00 389.66 0.131 0.15 10.629 B
C-D 18.07 18.07 0.00 - - - - -
C-A 224.89 224.89 0.00 - - - - -
C-B 9.04 9.04 0.00 - - - - -
CD-AB 115.36 115.36 0.00 591.17 0.195 0.26 7.566 A
CD-A 277.56 277.56 0.00 - - - - -
Severity Area Item Description
Warning Minor arm flareArm D - Minor Arm
Geometry
Is flare very short? Estimated flare length is zero but has been increased to 1 because a zero
flare length is not allowed.
Name Roundabout Capacity Model Description Locked Network Flow Scaling Factor (%) Reason For Scaling Factors
N/A 100.000
NameScenario
Name
Time
Period
Name
Description
Traffic
Profile
Type
Model Start
Time (HH:mm)
Model Finish
Time (HH:mm)
Model Time
Period Length
(min)
Time Segment
Length (min)
Single Time
Segment OnlyLocked
2014 Base
Flows, PM
2014 Base
FlowsPM
ONE
HOUR16:45 18:15 90 15
Generated on 16/09/2014 10:49:00 using Junctions 8 (8.0.4.487)
7

Junction Network
Junctions
Junction Network Options
Arms
Arms
Major Arm Geometry
Geometries for Arm C are measured opposite Arm B. Geometries for Arm A (if relevant) are measured opposite Arm D.
Minor Arm Geometry
Slope / Intercept / Capacity
Priority Intersection Slopes and Intercepts
The slopes and intercepts shown above do NOT include any corrections or adjustments.
Streams may be combined, in which case capacity will be adjusted.
Junction Name Junction Type Major Road Direction Arm Order Junction Delay (s) Junction LOS
1 (untitled) NS-OS Stagger (UK LR Stagger) Two-way A,B,C,D 13.22 B
Driving Side Lighting
Left Normal/unknown
Arm Arm Name Description Arm Type
A A Coleshill Road East Major
B B Plough Hill Road Minor
C C Coleshill Road West Major
D D Laurel Drive Minor
ArmWidth of
carriageway (m)
Has kerbed central
reserve
Width of kerbed central
reserve (m)
Has right
turn bay
Width For Right
Turn (m)
Visibility For Right
Turn (m)Blocks?
Blocking Queue
(PCU)
A 6.65 0.00 2.20 120.00 ü 1.00
C 6.65 0.00 2.20 120.00 ü 1.00
ArmMinor
Arm Type
Lane
Width
(m)
Lane
Width
(Left) (m)
Lane
Width
(Right) (m)
Width at
give-way
(m)
Width at
5m (m)
Width at
10m (m)
Width at
15m (m)
Width at
20m (m)
Estimate
Flare
Length
Flare
Length
(PCU)
Visibility To
Left (m)
Visibility To
Right (m)
B
One lane
plus
flare
10.00 4.64 3.80 3.75 3.58 ü 1.00 30 18
D
One lane
plus
flare
10.00 4.64 2.88 2.75 2.75 ü 1.00 24 21
Junction StreamIntercept
(PCU/hr)
Slope
for
A-B
Slope
for
A-C
Slope
for
A-D
Slope
for
B-C
Slope
for
B-D
Slope
for
C-A
Slope
for
C-B
Slope
for
C-D
Slope
for
D-A
Slope
for
D-B
1 AB-D 643.457 - - - - - 0.242 0.242 0.242 - -
1 B-A 562.345 0.100 0.252 0.252 - - 0.158 0.359 - 0.158 0.359
1 B-CD 634.471 0.095 0.239 0.239 - - - - - - -
1 CD-B 643.457 0.242 0.242 0.242 - - - - - - -
1 D-AB 663.847 - - - - - 0.250 0.250 0.099 - -
1 D-C 493.912 - 0.139 0.316 0.139 0.316 0.221 0.221 0.087 - -
Generated on 16/09/2014 10:49:00 using Junctions 8 (8.0.4.487)
8

Values are shown for the first time segment only; they may differ for subsequent time segments.
Traffic Flows
Demand Set Data Options
Entry Flows
General Flows Data
Turning Proportions
Turning Counts / Proportions (PCU/hr) - Junction 1 (for whole period)
Turning Proportions (PCU) - Junction 1 (for whole period)
Default
Vehicle
Mix
Vehicle
Mix Varies
Over Time
Vehicle
Mix Varies
Over Turn
Vehicle
Mix Varies
Over Entry
Vehicle Mix
Source
PCU
Factor
for a HV
(PCU)
Default
Turning
Proportions
Estimate
from
entry/exit
counts
Turning
Proportions
Vary Over Time
Turning
Proportions
Vary Over Turn
Turning
Proportions
Vary Over Entry
ü üHV
Percentages2.00 ü ü
Arm Profile Type Use Turning Counts Average Demand Flow (PCU/hr) Flow Scaling Factor (%)
A ONE HOUR ü 466.00 100.000
B ONE HOUR ü 257.00 100.000
C ONE HOUR ü 285.00 100.000
D ONE HOUR ü 60.00 100.000
To
From
A B C D
A 0.000 273.000 167.000 26.000
B 203.000 0.000 14.000 40.000
C 230.000 34.000 0.000 21.000
D 28.000 20.000 12.000 0.000
To
From
A B C D
A 0.00 0.59 0.36 0.06
B 0.79 0.00 0.05 0.16
C 0.81 0.12 0.00 0.07
D 0.47 0.33 0.20 0.00
Generated on 16/09/2014 10:49:00 using Junctions 8 (8.0.4.487)
9
Vehicle Mix
Average PCU Per Vehicle - Junction 1 (for whole period)
Heavy Vehicle Percentages - Junction 1 (for whole period)
Results
Results Summary for whole modelled period
To
From
A B C D
A 1.000 1.000 1.000 1.000
B 1.000 1.000 1.000 1.000
C 1.000 1.000 1.000 1.000
D 1.000 1.000 1.000 1.000
To
From
A B C D
A 0.0 0.0 0.0 0.0
B 0.0 0.0 0.0 0.0
C 0.0 0.0 0.0 0.0
D 0.0 0.0 0.0 0.0
Stream Max RFC Max Delay (s) Max Queue (PCU) Max LOS
B-CD 0.15 10.36 0.17 B
B-A 0.55 19.34 1.18 C
A-B - - - -
A-C - - - -
A-D - - - -
AB-CD 0.13 7.08 0.15 A
AB-C - - - -
D-AB 0.09 6.78 0.10 A
D-C 0.04 9.91 0.04 A
C-D - - - -
C-A - - - -
C-B - - - -
CD-AB 0.12 7.52 0.14 A
CD-A - - - -
Generated on 16/09/2014 10:49:00 using Junctions 8 (8.0.4.487)
10
Main Results for each time segment
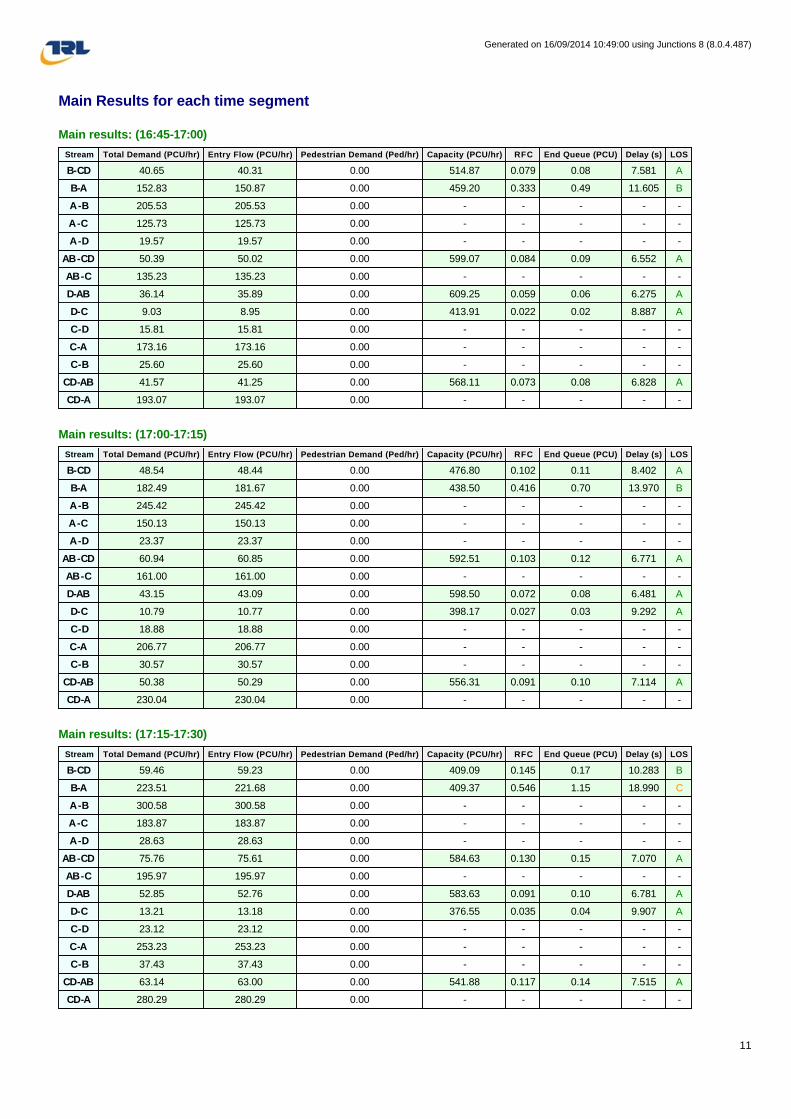
Main results: (16:45-17:00)
Main results: (17:00-17:15)
Main results: (17:15-17:30)
Stream Total Demand (PCU/hr) Entry Flow (PCU/hr) Pedestrian Demand (Ped/hr) Capacity (PCU/hr) RFC End Queue (PCU) Delay (s) LOS
B-CD 40.65 40.31 0.00 514.87 0.079 0.08 7.581 A
B-A 152.83 150.87 0.00 459.20 0.333 0.49 11.605 B
A-B 205.53 205.53 0.00 - - - - -
A-C 125.73 125.73 0.00 - - - - -
A-D 19.57 19.57 0.00 - - - - -
AB-CD 50.39 50.02 0.00 599.07 0.084 0.09 6.552 A
AB-C 135.23 135.23 0.00 - - - - -
D-AB 36.14 35.89 0.00 609.25 0.059 0.06 6.275 A
D-C 9.03 8.95 0.00 413.91 0.022 0.02 8.887 A
C-D 15.81 15.81 0.00 - - - - -
C-A 173.16 173.16 0.00 - - - - -
C-B 25.60 25.60 0.00 - - - - -
CD-AB 41.57 41.25 0.00 568.11 0.073 0.08 6.828 A
CD-A 193.07 193.07 0.00 - - - - -
Stream Total Demand (PCU/hr) Entry Flow (PCU/hr) Pedestrian Demand (Ped/hr) Capacity (PCU/hr) RFC End Queue (PCU) Delay (s) LOS
B-CD 48.54 48.44 0.00 476.80 0.102 0.11 8.402 A
B-A 182.49 181.67 0.00 438.50 0.416 0.70 13.970 B
A-B 245.42 245.42 0.00 - - - - -
A-C 150.13 150.13 0.00 - - - - -
A-D 23.37 23.37 0.00 - - - - -
AB-CD 60.94 60.85 0.00 592.51 0.103 0.12 6.771 A
AB-C 161.00 161.00 0.00 - - - - -
D-AB 43.15 43.09 0.00 598.50 0.072 0.08 6.481 A
D-C 10.79 10.77 0.00 398.17 0.027 0.03 9.292 A
C-D 18.88 18.88 0.00 - - - - -
C-A 206.77 206.77 0.00 - - - - -
C-B 30.57 30.57 0.00 - - - - -
CD-AB 50.38 50.29 0.00 556.31 0.091 0.10 7.114 A
CD-A 230.04 230.04 0.00 - - - - -
Stream Total Demand (PCU/hr) Entry Flow (PCU/hr) Pedestrian Demand (Ped/hr) Capacity (PCU/hr) RFC End Queue (PCU) Delay (s) LOS
B-CD 59.46 59.23 0.00 409.09 0.145 0.17 10.283 B
B-A 223.51 221.68 0.00 409.37 0.546 1.15 18.990 C
A-B 300.58 300.58 0.00 - - - - -
A-C 183.87 183.87 0.00 - - - - -
A-D 28.63 28.63 0.00 - - - - -
AB-CD 75.76 75.61 0.00 584.63 0.130 0.15 7.070 A
AB-C 195.97 195.97 0.00 - - - - -
D-AB 52.85 52.76 0.00 583.63 0.091 0.10 6.781 A
D-C 13.21 13.18 0.00 376.55 0.035 0.04 9.907 A
C-D 23.12 23.12 0.00 - - - - -
C-A 253.23 253.23 0.00 - - - - -
C-B 37.43 37.43 0.00 - - - - -
CD-AB 63.14 63.00 0.00 541.88 0.117 0.14 7.515 A
CD-A 280.29 280.29 0.00 - - - - -
Generated on 16/09/2014 10:49:00 using Junctions 8 (8.0.4.487)
11

Main results: (17:30-17:45)
Main results: (17:45-18:00)
Main results: (18:00-18:15)
Stream Total Demand (PCU/hr) Entry Flow (PCU/hr) Pedestrian Demand (Ped/hr) Capacity (PCU/hr) RFC End Queue (PCU) Delay (s) LOS
B-CD 59.46 59.45 0.00 406.78 0.146 0.17 10.364 B
B-A 223.51 223.41 0.00 409.31 0.546 1.18 19.337 C
A-B 300.58 300.58 0.00 - - - - -
A-C 183.87 183.87 0.00 - - - - -
A-D 28.63 28.63 0.00 - - - - -
AB-CD 75.93 75.93 0.00 584.67 0.130 0.15 7.078 A
AB-C 196.01 196.01 0.00 - - - - -
D-AB 52.85 52.85 0.00 583.60 0.091 0.10 6.781 A
D-C 13.21 13.21 0.00 376.45 0.035 0.04 9.910 A
C-D 23.12 23.12 0.00 - - - - -
C-A 253.23 253.23 0.00 - - - - -
C-B 37.43 37.43 0.00 - - - - -
CD-AB 63.18 63.18 0.00 541.90 0.117 0.14 7.522 A
CD-A 280.34 280.34 0.00 - - - - -
Stream Total Demand (PCU/hr) Entry Flow (PCU/hr) Pedestrian Demand (Ped/hr) Capacity (PCU/hr) RFC End Queue (PCU) Delay (s) LOS
B-CD 48.54 48.76 0.00 474.32 0.102 0.12 8.463 A
B-A 182.49 184.27 0.00 438.46 0.416 0.73 14.262 B
A-B 245.42 245.42 0.00 - - - - -
A-C 150.13 150.13 0.00 - - - - -
A-D 23.37 23.37 0.00 - - - - -
AB-CD 61.20 61.34 0.00 592.56 0.103 0.12 6.780 A
AB-C 161.07 161.07 0.00 - - - - -
D-AB 43.15 43.23 0.00 598.46 0.072 0.08 6.484 A
D-C 10.79 10.82 0.00 398.03 0.027 0.03 9.297 A
C-D 18.88 18.88 0.00 - - - - -
C-A 206.77 206.77 0.00 - - - - -
C-B 30.57 30.57 0.00 - - - - -
CD-AB 50.44 50.58 0.00 556.34 0.091 0.10 7.119 A
CD-A 230.12 230.12 0.00 - - - - -
Stream Total Demand (PCU/hr) Entry Flow (PCU/hr) Pedestrian Demand (Ped/hr) Capacity (PCU/hr) RFC End Queue (PCU) Delay (s) LOS
B-CD 40.65 40.77 0.00 512.80 0.079 0.09 7.627 A
B-A 152.83 153.72 0.00 459.06 0.333 0.51 11.824 B
A-B 205.53 205.53 0.00 - - - - -
A-C 125.73 125.73 0.00 - - - - -
A-D 19.57 19.57 0.00 - - - - -
AB-CD 50.74 50.83 0.00 599.13 0.085 0.09 6.566 A
AB-C 135.33 135.33 0.00 - - - - -
D-AB 36.14 36.20 0.00 609.17 0.059 0.06 6.282 A
D-C 9.03 9.06 0.00 413.70 0.022 0.02 8.896 A
C-D 15.81 15.81 0.00 - - - - -
C-A 173.16 173.16 0.00 - - - - -
C-B 25.60 25.60 0.00 - - - - -
CD-AB 41.71 41.80 0.00 568.15 0.073 0.08 6.840 A
CD-A 193.24 193.24 0.00 - - - - -
Generated on 16/09/2014 10:49:00 using Junctions 8 (8.0.4.487)
12
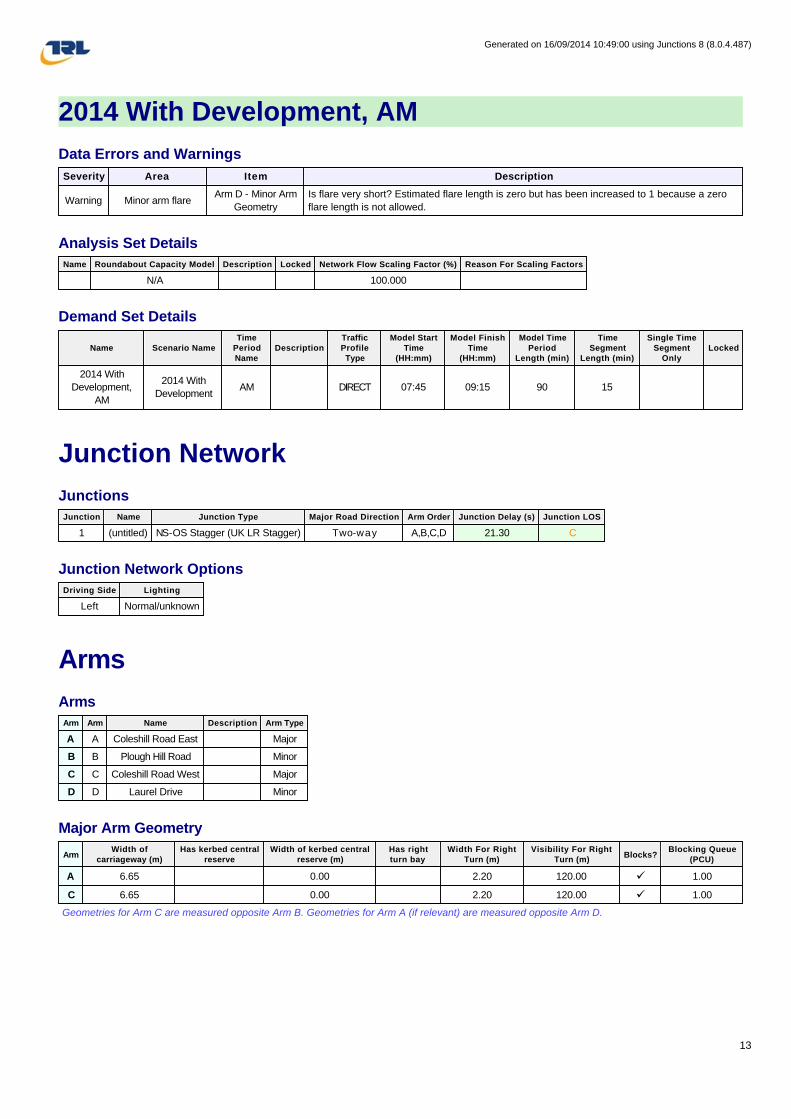
2014 With Development, AM
Data Errors and Warnings
Analysis Set Details
Demand Set Details
Junction Network
Junctions
Junction Network Options
Arms
Arms
Major Arm Geometry
Geometries for Arm C are measured opposite Arm B. Geometries for Arm A (if relevant) are measured opposite Arm D.
Severity Area Item Description
Warning Minor arm flareArm D - Minor Arm
Geometry
Is flare very short? Estimated flare length is zero but has been increased to 1 because a zero
flare length is not allowed.
Name Roundabout Capacity Model Description Locked Network Flow Scaling Factor (%) Reason For Scaling Factors
N/A 100.000
Name Scenario Name
Time
Period
Name
Description
Traffic
Profile
Type
Model Start
Time
(HH:mm)
Model Finish
Time
(HH:mm)
Model Time
Period
Length (min)
Time
Segment
Length (min)
Single Time
Segment
Only
Locked
2014 With
Development,
AM
2014 With
DevelopmentAM DIRECT 07:45 09:15 90 15
Junction Name Junction Type Major Road Direction Arm Order Junction Delay (s) Junction LOS
1 (untitled) NS-OS Stagger (UK LR Stagger) Two-way A,B,C,D 21.30 C
Driving Side Lighting
Left Normal/unknown
Arm Arm Name Description Arm Type
A A Coleshill Road East Major
B B Plough Hill Road Minor
C C Coleshill Road West Major
D D Laurel Drive Minor
ArmWidth of
carriageway (m)
Has kerbed central
reserve
Width of kerbed central
reserve (m)
Has right
turn bay
Width For Right
Turn (m)
Visibility For Right
Turn (m)Blocks?
Blocking Queue
(PCU)
A 6.65 0.00 2.20 120.00 ü 1.00
C 6.65 0.00 2.20 120.00 ü 1.00
Generated on 16/09/2014 10:49:00 using Junctions 8 (8.0.4.487)
13

Minor Arm Geometry
Slope / Intercept / Capacity
Priority Intersection Slopes and Intercepts
The slopes and intercepts shown above do NOT include any corrections or adjustments.
Streams may be combined, in which case capacity will be adjusted.
Values are shown for the first time segment only; they may differ for subsequent time segments.
Traffic Flows
Demand Set Data Options
Entry Flows
General Flows Data
ArmMinor
Arm Type
Lane
Width
(m)
Lane
Width
(Left) (m)
Lane
Width
(Right) (m)
Width at
give-way
(m)
Width at
5m (m)
Width at
10m (m)
Width at
15m (m)
Width at
20m (m)
Estimate
Flare
Length
Flare
Length
(PCU)
Visibility To
Left (m)
Visibility To
Right (m)
B
One lane
plus
flare
10.00 4.64 3.80 3.75 3.58 ü 1.00 30 18
D
One lane
plus
flare
10.00 4.64 2.88 2.75 2.75 ü 1.00 24 21
Junction StreamIntercept
(PCU/hr)
Slope
for
A-B
Slope
for
A-C
Slope
for
A-D
Slope
for
B-C
Slope
for
B-D
Slope
for
C-A
Slope
for
C-B
Slope
for
C-D
Slope
for
D-A
Slope
for
D-B
1 AB-D 643.457 - - - - - 0.242 0.242 0.242 - -
1 B-A 563.993 0.100 0.252 0.252 - - 0.159 0.360 - 0.159 0.360
1 B-CD 632.362 0.094 0.238 0.238 - - - - - - -
1 CD-B 643.457 0.242 0.242 0.242 - - - - - - -
1 D-AB 662.148 - - - - - 0.249 0.249 0.099 - -
1 D-C 497.216 - 0.140 0.318 0.140 0.318 0.222 0.222 0.088 - -
Default
Vehicle
Mix
Vehicle
Mix Varies
Over Time
Vehicle
Mix Varies
Over Turn
Vehicle
Mix Varies
Over Entry
Vehicle Mix
Source
PCU
Factor
for a HV
(PCU)
Default
Turning
Proportions
Estimate
from
entry/exit
counts
Turning
Proportions
Vary Over Time
Turning
Proportions
Vary Over Turn
Turning
Proportions
Vary Over Entry
ü üHV
Percentages2.00 ü ü ü
Arm Profile Type Use Turning Counts Average Demand Flow (PCU/hr) Flow Scaling Factor (%)
A DIRECT N/A 100.000
B DIRECT N/A 100.000
C DIRECT N/A 100.000
D DIRECT N/A 100.000
Generated on 16/09/2014 10:49:00 using Junctions 8 (8.0.4.487)
14

Turning Proportions
Turning Counts / Proportions (PCU/hr) - Junction 1 - (07:45-08:00)
Turning Proportions (PCU) - Junction 1 - (07:45-08:00)
Turning Counts / Proportions (PCU/hr) - Junction 1 - (08:00-08:15)
Turning Proportions (PCU) - Junction 1 - (08:00-08:15)
Turning Counts / Proportions (PCU/hr) - Junction 1 - (08:15-08:30)
Turning Proportions (PCU) - Junction 1 - (08:15-08:30)
To
From
A B C D
A 0.000 192.000 181.000 16.000
B 308.000 0.000 17.000 58.000
C 224.000 10.000 0.000 18.000
D 63.000 109.000 51.000 0.000
To
From
A B C D
A 0.00 0.49 0.47 0.04
B 0.80 0.00 0.04 0.15
C 0.89 0.04 0.00 0.07
D 0.28 0.49 0.23 0.00
To
From
A B C D
A 0.000 192.000 181.000 16.000
B 308.000 0.000 17.000 58.000
C 224.000 10.000 0.000 18.000
D 63.000 109.000 51.000 0.000
To
From
A B C D
A 0.00 0.49 0.47 0.04
B 0.80 0.00 0.04 0.15
C 0.89 0.04 0.00 0.07
D 0.28 0.49 0.23 0.00
To
From
A B C D
A 0.000 192.000 181.000 16.000
B 308.000 0.000 17.000 58.000
C 224.000 10.000 0.000 18.000
D 63.000 109.000 51.000 0.000
To
From
A B C D
A 0.00 0.49 0.47 0.04
B 0.80 0.00 0.04 0.15
C 0.89 0.04 0.00 0.07
D 0.28 0.49 0.23 0.00
Generated on 16/09/2014 10:49:00 using Junctions 8 (8.0.4.487)
15

Turning Counts / Proportions (PCU/hr) - Junction 1 - (08:30-08:45)
Turning Proportions (PCU) - Junction 1 - (08:30-08:45)
Turning Counts / Proportions (PCU/hr) - Junction 1 - (08:45-09:00)
Turning Proportions (PCU) - Junction 1 - (08:45-09:00)
Turning Counts / Proportions (PCU/hr) - Junction 1 - (09:00-09:15)
Turning Proportions (PCU) - Junction 1 - (09:00-09:15)
To
From
A B C D
A 0.000 192.000 181.000 16.000
B 308.000 0.000 17.000 58.000
C 224.000 10.000 0.000 18.000
D 63.000 109.000 51.000 0.000
To
From
A B C D
A 0.00 0.49 0.47 0.04
B 0.80 0.00 0.04 0.15
C 0.89 0.04 0.00 0.07
D 0.28 0.49 0.23 0.00
To
From
A B C D
A 0.000 192.000 181.000 16.000
B 308.000 0.000 17.000 58.000
C 224.000 10.000 0.000 18.000
D 63.000 109.000 51.000 0.000
To
From
A B C D
A 0.00 0.49 0.47 0.04
B 0.80 0.00 0.04 0.15
C 0.89 0.04 0.00 0.07
D 0.28 0.49 0.23 0.00
To
From
A B C D
A 0.000 192.000 181.000 16.000
B 308.000 0.000 17.000 58.000
C 224.000 10.000 0.000 18.000
D 63.000 109.000 51.000 0.000
To
From
A B C D
A 0.00 0.49 0.47 0.04
B 0.80 0.00 0.04 0.15
C 0.89 0.04 0.00 0.07
D 0.28 0.49 0.23 0.00
Generated on 16/09/2014 10:49:00 using Junctions 8 (8.0.4.487)
16

Vehicle Mix
Average PCU Per Vehicle - Junction 1 (for whole period)
Heavy Vehicle Percentages - Junction 1 (for whole period)
Results
Results Summary for whole modelled period
To
From
A B C D
A 1.000 1.000 1.000 1.000
B 1.000 1.000 1.000 1.000
C 1.000 1.000 1.000 1.000
D 1.000 1.000 1.000 1.000
To
From
A B C D
A 0.0 0.0 0.0 0.0
B 0.0 0.0 0.0 0.0
C 0.0 0.0 0.0 0.0
D 0.0 0.0 0.0 0.0
Stream Max RFC Max Delay (s) Max Queue (PCU) Max LOS
B-CD 0.29 19.98 0.41 C
B-A 0.77 39.70 3.32 E
A-B - - - -
A-C - - - -
A-D - - - -
AB-CD 0.13 6.90 0.15 A
AB-C - - - -
D-AB 0.30 8.83 0.42 A
D-C 0.13 10.86 0.15 B
C-D - - - -
C-A - - - -
C-B - - - -
CD-AB 0.22 7.85 0.31 A
CD-A - - - -
Generated on 16/09/2014 10:49:00 using Junctions 8 (8.0.4.487)
17
Main Results for each time segment
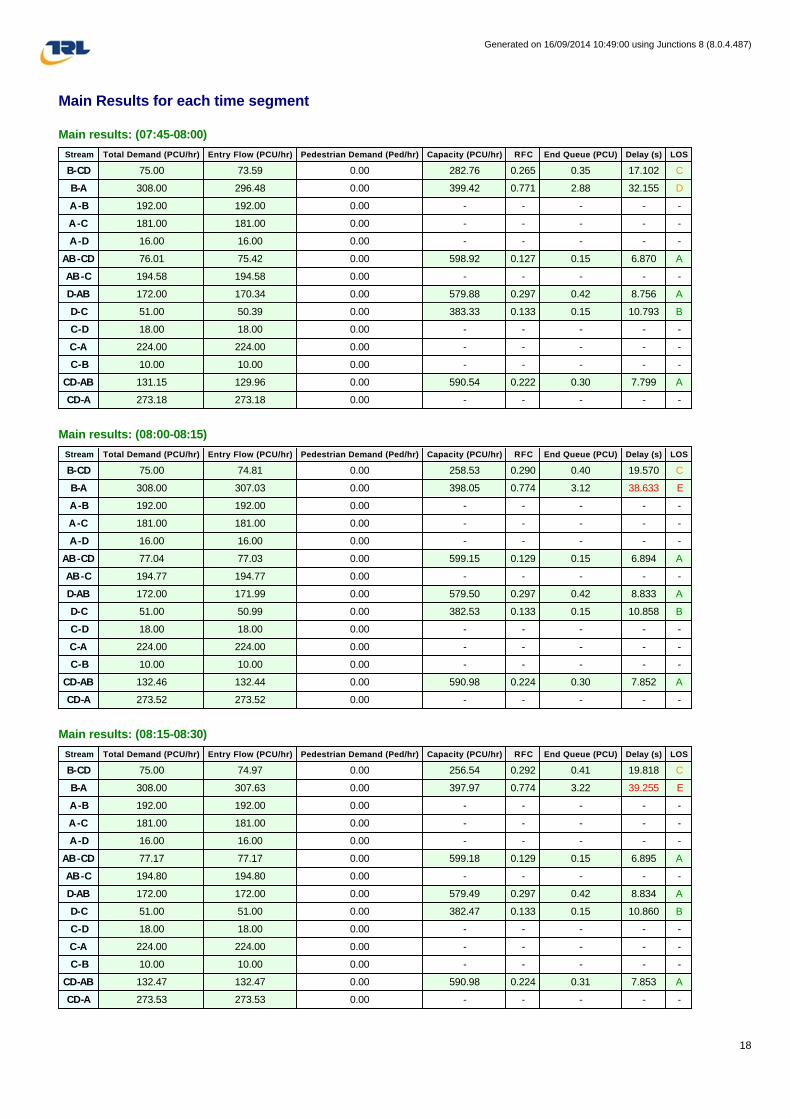
Main results: (07:45-08:00)
Main results: (08:00-08:15)
Main results: (08:15-08:30)
Stream Total Demand (PCU/hr) Entry Flow (PCU/hr) Pedestrian Demand (Ped/hr) Capacity (PCU/hr) RFC End Queue (PCU) Delay (s) LOS
B-CD 75.00 73.59 0.00 282.76 0.265 0.35 17.102 C
B-A 308.00 296.48 0.00 399.42 0.771 2.88 32.155 D
A-B 192.00 192.00 0.00 - - - - -
A-C 181.00 181.00 0.00 - - - - -
A-D 16.00 16.00 0.00 - - - - -
AB-CD 76.01 75.42 0.00 598.92 0.127 0.15 6.870 A
AB-C 194.58 194.58 0.00 - - - - -
D-AB 172.00 170.34 0.00 579.88 0.297 0.42 8.756 A
D-C 51.00 50.39 0.00 383.33 0.133 0.15 10.793 B
C-D 18.00 18.00 0.00 - - - - -
C-A 224.00 224.00 0.00 - - - - -
C-B 10.00 10.00 0.00 - - - - -
CD-AB 131.15 129.96 0.00 590.54 0.222 0.30 7.799 A
CD-A 273.18 273.18 0.00 - - - - -
Stream Total Demand (PCU/hr) Entry Flow (PCU/hr) Pedestrian Demand (Ped/hr) Capacity (PCU/hr) RFC End Queue (PCU) Delay (s) LOS
B-CD 75.00 74.81 0.00 258.53 0.290 0.40 19.570 C
B-A 308.00 307.03 0.00 398.05 0.774 3.12 38.633 E
A-B 192.00 192.00 0.00 - - - - -
A-C 181.00 181.00 0.00 - - - - -
A-D 16.00 16.00 0.00 - - - - -
AB-CD 77.04 77.03 0.00 599.15 0.129 0.15 6.894 A
AB-C 194.77 194.77 0.00 - - - - -
D-AB 172.00 171.99 0.00 579.50 0.297 0.42 8.833 A
D-C 51.00 50.99 0.00 382.53 0.133 0.15 10.858 B
C-D 18.00 18.00 0.00 - - - - -
C-A 224.00 224.00 0.00 - - - - -
C-B 10.00 10.00 0.00 - - - - -
CD-AB 132.46 132.44 0.00 590.98 0.224 0.30 7.852 A
CD-A 273.52 273.52 0.00 - - - - -
Stream Total Demand (PCU/hr) Entry Flow (PCU/hr) Pedestrian Demand (Ped/hr) Capacity (PCU/hr) RFC End Queue (PCU) Delay (s) LOS
B-CD 75.00 74.97 0.00 256.54 0.292 0.41 19.818 C
B-A 308.00 307.63 0.00 397.97 0.774 3.22 39.255 E
A-B 192.00 192.00 0.00 - - - - -
A-C 181.00 181.00 0.00 - - - - -
A-D 16.00 16.00 0.00 - - - - -
AB-CD 77.17 77.17 0.00 599.18 0.129 0.15 6.895 A
AB-C 194.80 194.80 0.00 - - - - -
D-AB 172.00 172.00 0.00 579.49 0.297 0.42 8.834 A
D-C 51.00 51.00 0.00 382.47 0.133 0.15 10.860 B
C-D 18.00 18.00 0.00 - - - - -
C-A 224.00 224.00 0.00 - - - - -
C-B 10.00 10.00 0.00 - - - - -
CD-AB 132.47 132.47 0.00 590.98 0.224 0.31 7.853 A
CD-A 273.53 273.53 0.00 - - - - -
Generated on 16/09/2014 10:49:00 using Junctions 8 (8.0.4.487)
18

Main results: (08:30-08:45)
Main results: (08:45-09:00)
Main results: (09:00-09:15)
Stream Total Demand (PCU/hr) Entry Flow (PCU/hr) Pedestrian Demand (Ped/hr) Capacity (PCU/hr) RFC End Queue (PCU) Delay (s) LOS
B-CD 75.00 74.99 0.00 255.77 0.293 0.41 19.908 C
B-A 308.00 307.80 0.00 397.96 0.774 3.26 39.492 E
A-B 192.00 192.00 0.00 - - - - -
A-C 181.00 181.00 0.00 - - - - -
A-D 16.00 16.00 0.00 - - - - -
AB-CD 77.18 77.18 0.00 599.19 0.129 0.15 6.898 A
AB-C 194.80 194.80 0.00 - - - - -
D-AB 172.00 172.00 0.00 579.49 0.297 0.42 8.834 A
D-C 51.00 51.00 0.00 382.46 0.133 0.15 10.860 B
C-D 18.00 18.00 0.00 - - - - -
C-A 224.00 224.00 0.00 - - - - -
C-B 10.00 10.00 0.00 - - - - -
CD-AB 132.47 132.47 0.00 590.99 0.224 0.31 7.855 A
CD-A 273.53 273.53 0.00 - - - - -
Stream Total Demand (PCU/hr) Entry Flow (PCU/hr) Pedestrian Demand (Ped/hr) Capacity (PCU/hr) RFC End Queue (PCU) Delay (s) LOS
B-CD 75.00 74.99 0.00 255.37 0.294 0.41 19.955 C
B-A 308.00 307.88 0.00 397.95 0.774 3.30 39.618 E
A-B 192.00 192.00 0.00 - - - - -
A-C 181.00 181.00 0.00 - - - - -
A-D 16.00 16.00 0.00 - - - - -
AB-CD 77.19 77.19 0.00 599.19 0.129 0.15 6.898 A
AB-C 194.80 194.80 0.00 - - - - -
D-AB 172.00 172.00 0.00 579.49 0.297 0.42 8.834 A
D-C 51.00 51.00 0.00 382.46 0.133 0.15 10.860 B
C-D 18.00 18.00 0.00 - - - - -
C-A 224.00 224.00 0.00 - - - - -
C-B 10.00 10.00 0.00 - - - - -
CD-AB 132.47 132.47 0.00 590.99 0.224 0.31 7.853 A
CD-A 273.53 273.53 0.00 - - - - -
Stream Total Demand (PCU/hr) Entry Flow (PCU/hr) Pedestrian Demand (Ped/hr) Capacity (PCU/hr) RFC End Queue (PCU) Delay (s) LOS
B-CD 75.00 74.99 0.00 255.12 0.294 0.41 19.981 C
B-A 308.00 307.92 0.00 397.95 0.774 3.32 39.696 E
A-B 192.00 192.00 0.00 - - - - -
A-C 181.00 181.00 0.00 - - - - -
A-D 16.00 16.00 0.00 - - - - -
AB-CD 77.19 77.19 0.00 599.19 0.129 0.15 6.896 A
AB-C 194.80 194.80 0.00 - - - - -
D-AB 172.00 172.00 0.00 579.49 0.297 0.42 8.834 A
D-C 51.00 51.00 0.00 382.45 0.133 0.15 10.860 B
C-D 18.00 18.00 0.00 - - - - -
C-A 224.00 224.00 0.00 - - - - -
C-B 10.00 10.00 0.00 - - - - -
CD-AB 132.47 132.47 0.00 590.99 0.224 0.31 7.853 A
CD-A 273.53 273.53 0.00 - - - - -
Generated on 16/09/2014 10:49:00 using Junctions 8 (8.0.4.487)
19
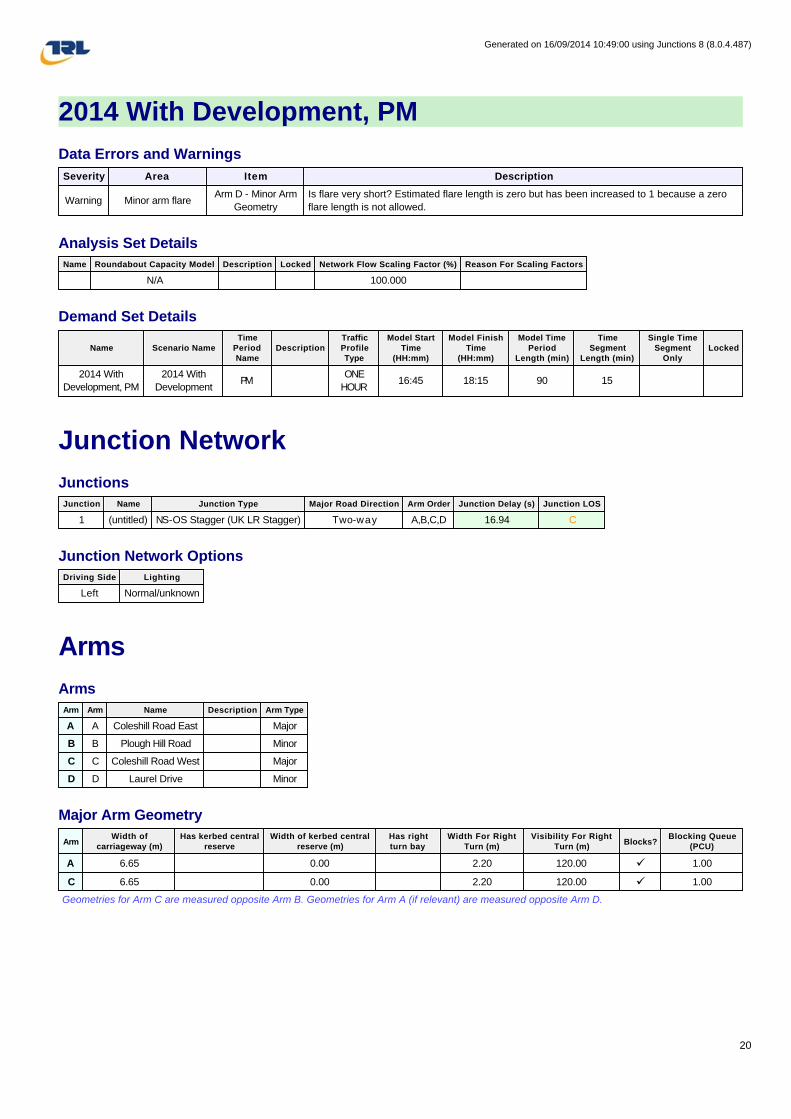
2014 With Development, PM
Data Errors and Warnings
Analysis Set Details
Demand Set Details
Junction Network
Junctions
Junction Network Options
Arms
Arms
Major Arm Geometry
Geometries for Arm C are measured opposite Arm B. Geometries for Arm A (if relevant) are measured opposite Arm D.
Severity Area Item Description
Warning Minor arm flareArm D - Minor Arm
Geometry
Is flare very short? Estimated flare length is zero but has been increased to 1 because a zero
flare length is not allowed.
Name Roundabout Capacity Model Description Locked Network Flow Scaling Factor (%) Reason For Scaling Factors
N/A 100.000
Name Scenario Name
Time
Period
Name
Description
Traffic
Profile
Type
Model Start
Time
(HH:mm)
Model Finish
Time
(HH:mm)
Model Time
Period
Length (min)
Time
Segment
Length (min)
Single Time
Segment
Only
Locked
2014 With
Development, PM
2014 With
DevelopmentPM
ONE
HOUR16:45 18:15 90 15
Junction Name Junction Type Major Road Direction Arm Order Junction Delay (s) Junction LOS
1 (untitled) NS-OS Stagger (UK LR Stagger) Two-way A,B,C,D 16.94 C
Driving Side Lighting
Left Normal/unknown
Arm Arm Name Description Arm Type
A A Coleshill Road East Major
B B Plough Hill Road Minor
C C Coleshill Road West Major
D D Laurel Drive Minor
ArmWidth of
carriageway (m)
Has kerbed central
reserve
Width of kerbed central
reserve (m)
Has right
turn bay
Width For Right
Turn (m)
Visibility For Right
Turn (m)Blocks?
Blocking Queue
(PCU)
A 6.65 0.00 2.20 120.00 ü 1.00
C 6.65 0.00 2.20 120.00 ü 1.00
Generated on 16/09/2014 10:49:00 using Junctions 8 (8.0.4.487)
20
Minor Arm Geometry
Slope / Intercept / Capacity
Priority Intersection Slopes and Intercepts
The slopes and intercepts shown above do NOT include any corrections or adjustments.
Streams may be combined, in which case capacity will be adjusted.
Values are shown for the first time segment only; they may differ for subsequent time segments.
Traffic Flows
Demand Set Data Options
Entry Flows
General Flows Data
ArmMinor
Arm Type
Lane
Width
(m)
Lane
Width
(Left) (m)
Lane
Width
(Right) (m)
Width at
give-way
(m)
Width at
5m (m)
Width at
10m (m)
Width at
15m (m)
Width at
20m (m)
Estimate
Flare
Length
Flare
Length
(PCU)
Visibility To
Left (m)
Visibility To
Right (m)
B
One lane
plus
flare
10.00 4.64 3.80 3.75 3.58 ü 1.00 30 18
D
One lane
plus
flare
10.00 4.64 2.88 2.75 2.75 ü 1.00 24 21
Junction StreamIntercept
(PCU/hr)
Slope
for
A-B
Slope
for
A-C
Slope
for
A-D
Slope
for
B-C
Slope
for
B-D
Slope
for
C-A
Slope
for
C-B
Slope
for
C-D
Slope
for
D-A
Slope
for
D-B
1 AB-D 643.457 - - - - - 0.242 0.242 0.242 - -
1 B-A 562.160 0.099 0.251 0.251 - - 0.158 0.359 - 0.158 0.359
1 B-CD 634.709 0.095 0.239 0.239 - - - - - - -
1 CD-B 643.457 0.242 0.242 0.242 - - - - - - -
1 D-AB 663.847 - - - - - 0.250 0.250 0.099 - -
1 D-C 493.912 - 0.139 0.316 0.139 0.316 0.221 0.221 0.087 - -
Default
Vehicle
Mix
Vehicle
Mix Varies
Over Time
Vehicle
Mix Varies
Over Turn
Vehicle
Mix Varies
Over Entry
Vehicle Mix
Source
PCU
Factor
for a HV
(PCU)
Default
Turning
Proportions
Estimate
from
entry/exit
counts
Turning
Proportions
Vary Over Time
Turning
Proportions
Vary Over Turn
Turning
Proportions
Vary Over Entry
ü üHV
Percentages2.00 ü ü
Arm Profile Type Use Turning Counts Average Demand Flow (PCU/hr) Flow Scaling Factor (%)
A ONE HOUR ü 468.00 100.000
B ONE HOUR ü 307.00 100.000
C ONE HOUR ü 285.00 100.000
D ONE HOUR ü 60.00 100.000
Generated on 16/09/2014 10:49:00 using Junctions 8 (8.0.4.487)
21
Turning Proportions
Turning Counts / Proportions (PCU/hr) - Junction 1 (for whole period)
Turning Proportions (PCU) - Junction 1 (for whole period)
Vehicle Mix
Average PCU Per Vehicle - Junction 1 (for whole period)
Heavy Vehicle Percentages - Junction 1 (for whole period)
To
From
A B C D
A 0.000 273.000 167.000 28.000
B 242.000 0.000 17.000 48.000
C 230.000 34.000 0.000 21.000
D 28.000 20.000 12.000 0.000
To
From
A B C D
A 0.00 0.58 0.36 0.06
B 0.79 0.00 0.06 0.16
C 0.81 0.12 0.00 0.07
D 0.47 0.33 0.20 0.00
To
From
A B C D
A 1.000 1.000 1.000 1.000
B 1.000 1.000 1.000 1.000
C 1.000 1.000 1.000 1.000
D 1.000 1.000 1.000 1.000
To
From
A B C D
A 0.0 0.0 0.0 0.0
B 0.0 0.0 0.0 0.0
C 0.0 0.0 0.0 0.0
D 0.0 0.0 0.0 0.0
Generated on 16/09/2014 10:49:00 using Junctions 8 (8.0.4.487)
22
Results
Results Summary for whole modelled period
Main Results for each time segment
Main results: (16:45-17:00)
Stream Max RFC Max Delay (s) Max Queue (PCU) Max LOS
B-CD 0.21 13.27 0.26 B
B-A 0.66 25.65 1.84 D
A-B - - - -
A-C - - - -
A-D - - - -
AB-CD 0.15 7.21 0.18 A
AB-C - - - -
D-AB 0.09 6.78 0.10 A
D-C 0.04 10.02 0.04 B
C-D - - - -
C-A - - - -
C-B - - - -
CD-AB 0.12 7.53 0.14 A
CD-A - - - -
Stream Total Demand (PCU/hr) Entry Flow (PCU/hr) Pedestrian Demand (Ped/hr) Capacity (PCU/hr) RFC End Queue (PCU) Delay (s) LOS
B-CD 48.94 48.50 0.00 493.88 0.099 0.11 8.077 A
B-A 182.19 179.61 0.00 458.05 0.398 0.65 12.821 B
A-B 205.53 205.53 0.00 - - - - -
A-C 125.73 125.73 0.00 - - - - -
A-D 21.08 21.08 0.00 - - - - -
AB-CD 58.18 57.74 0.00 600.35 0.097 0.11 6.635 A
AB-C 137.13 137.13 0.00 - - - - -
D-AB 36.14 35.89 0.00 609.23 0.059 0.06 6.276 A
D-C 9.03 8.95 0.00 411.22 0.022 0.02 8.947 A
C-D 15.81 15.81 0.00 - - - - -
C-A 173.16 173.16 0.00 - - - - -
C-B 25.60 25.60 0.00 - - - - -
CD-AB 41.57 41.26 0.00 567.75 0.073 0.08 6.832 A
CD-A 193.07 193.07 0.00 - - - - -
Generated on 16/09/2014 10:49:00 using Junctions 8 (8.0.4.487)
23

Main results: (17:00-17:15)
Main results: (17:15-17:30)
Main results: (17:30-17:45)
Stream Total Demand (PCU/hr) Entry Flow (PCU/hr) Pedestrian Demand (Ped/hr) Capacity (PCU/hr) RFC End Queue (PCU) Delay (s) LOS
B-CD 58.43 58.27 0.00 442.84 0.132 0.15 9.357 A
B-A 217.55 216.29 0.00 436.70 0.498 0.96 16.236 C
A-B 245.42 245.42 0.00 - - - - -
A-C 150.13 150.13 0.00 - - - - -
A-D 25.17 25.17 0.00 - - - - -
AB-CD 70.48 70.36 0.00 594.38 0.119 0.14 6.867 A
AB-C 163.09 163.09 0.00 - - - - -
D-AB 43.15 43.09 0.00 598.46 0.072 0.08 6.482 A
D-C 10.79 10.77 0.00 394.91 0.027 0.03 9.371 A
C-D 18.88 18.88 0.00 - - - - -
C-A 206.77 206.77 0.00 - - - - -
C-B 30.57 30.57 0.00 - - - - -
CD-AB 50.38 50.30 0.00 555.89 0.091 0.10 7.120 A
CD-A 230.04 230.04 0.00 - - - - -
Stream Total Demand (PCU/hr) Entry Flow (PCU/hr) Pedestrian Demand (Ped/hr) Capacity (PCU/hr) RFC End Queue (PCU) Delay (s) LOS
B-CD 71.57 71.15 0.00 347.97 0.206 0.25 12.985 B
B-A 266.45 263.19 0.00 406.05 0.656 1.78 24.634 C
A-B 300.58 300.58 0.00 - - - - -
A-C 183.87 183.87 0.00 - - - - -
A-D 30.83 30.83 0.00 - - - - -
AB-CD 87.74 87.57 0.00 587.48 0.149 0.18 7.200 A
AB-C 198.11 198.11 0.00 - - - - -
D-AB 52.85 52.76 0.00 583.57 0.091 0.10 6.782 A
D-C 13.21 13.18 0.00 372.55 0.035 0.04 10.017 B
C-D 23.12 23.12 0.00 - - - - -
C-A 253.23 253.23 0.00 - - - - -
C-B 37.43 37.43 0.00 - - - - -
CD-AB 63.15 63.01 0.00 541.38 0.117 0.14 7.523 A
CD-A 280.28 280.28 0.00 - - - - -
Stream Total Demand (PCU/hr) Entry Flow (PCU/hr) Pedestrian Demand (Ped/hr) Capacity (PCU/hr) RFC End Queue (PCU) Delay (s) LOS
B-CD 71.57 71.54 0.00 342.84 0.209 0.26 13.267 B
B-A 266.45 266.20 0.00 405.90 0.656 1.84 25.646 D
A-B 300.58 300.58 0.00 - - - - -
A-C 183.87 183.87 0.00 - - - - -
A-D 30.83 30.83 0.00 - - - - -
AB-CD 88.06 88.06 0.00 587.56 0.150 0.18 7.206 A
AB-C 198.18 198.18 0.00 - - - - -
D-AB 52.85 52.85 0.00 583.54 0.091 0.10 6.782 A
D-C 13.21 13.21 0.00 372.40 0.035 0.04 10.022 B
C-D 23.12 23.12 0.00 - - - - -
C-A 253.23 253.23 0.00 - - - - -
C-B 37.43 37.43 0.00 - - - - -
CD-AB 63.19 63.18 0.00 541.40 0.117 0.14 7.530 A
CD-A 280.33 280.33 0.00 - - - - -
Generated on 16/09/2014 10:49:00 using Junctions 8 (8.0.4.487)
24
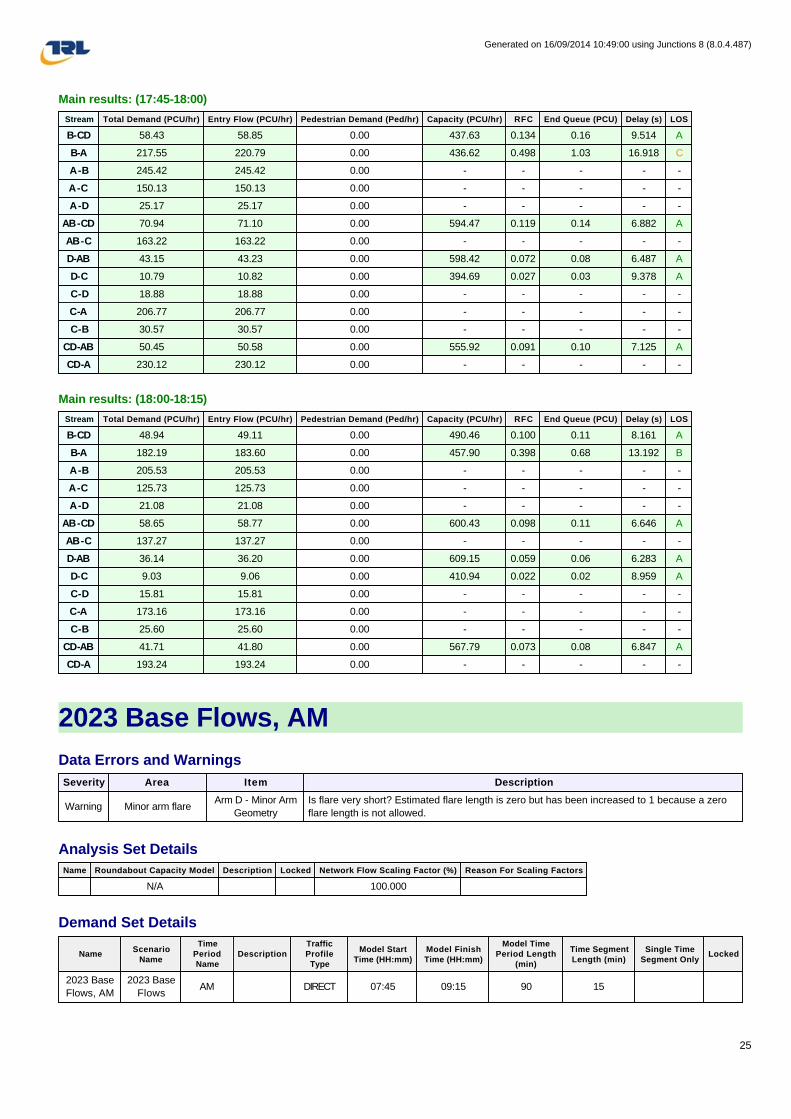
Main results: (17:45-18:00)
Main results: (18:00-18:15)
2023 Base Flows, AM
Data Errors and Warnings
Analysis Set Details
Demand Set Details
Stream Total Demand (PCU/hr) Entry Flow (PCU/hr) Pedestrian Demand (Ped/hr) Capacity (PCU/hr) RFC End Queue (PCU) Delay (s) LOS
B-CD 58.43 58.85 0.00 437.63 0.134 0.16 9.514 A
B-A 217.55 220.79 0.00 436.62 0.498 1.03 16.918 C
A-B 245.42 245.42 0.00 - - - - -
A-C 150.13 150.13 0.00 - - - - -
A-D 25.17 25.17 0.00 - - - - -
AB-CD 70.94 71.10 0.00 594.47 0.119 0.14 6.882 A
AB-C 163.22 163.22 0.00 - - - - -
D-AB 43.15 43.23 0.00 598.42 0.072 0.08 6.487 A
D-C 10.79 10.82 0.00 394.69 0.027 0.03 9.378 A
C-D 18.88 18.88 0.00 - - - - -
C-A 206.77 206.77 0.00 - - - - -
C-B 30.57 30.57 0.00 - - - - -
CD-AB 50.45 50.58 0.00 555.92 0.091 0.10 7.125 A
CD-A 230.12 230.12 0.00 - - - - -
Stream Total Demand (PCU/hr) Entry Flow (PCU/hr) Pedestrian Demand (Ped/hr) Capacity (PCU/hr) RFC End Queue (PCU) Delay (s) LOS
B-CD 48.94 49.11 0.00 490.46 0.100 0.11 8.161 A
B-A 182.19 183.60 0.00 457.90 0.398 0.68 13.192 B
A-B 205.53 205.53 0.00 - - - - -
A-C 125.73 125.73 0.00 - - - - -
A-D 21.08 21.08 0.00 - - - - -
AB-CD 58.65 58.77 0.00 600.43 0.098 0.11 6.646 A
AB-C 137.27 137.27 0.00 - - - - -
D-AB 36.14 36.20 0.00 609.15 0.059 0.06 6.283 A
D-C 9.03 9.06 0.00 410.94 0.022 0.02 8.959 A
C-D 15.81 15.81 0.00 - - - - -
C-A 173.16 173.16 0.00 - - - - -
C-B 25.60 25.60 0.00 - - - - -
CD-AB 41.71 41.80 0.00 567.79 0.073 0.08 6.847 A
CD-A 193.24 193.24 0.00 - - - - -
Severity Area Item Description
Warning Minor arm flareArm D - Minor Arm
Geometry
Is flare very short? Estimated flare length is zero but has been increased to 1 because a zero
flare length is not allowed.
Name Roundabout Capacity Model Description Locked Network Flow Scaling Factor (%) Reason For Scaling Factors
N/A 100.000
NameScenario
Name
Time
Period
Name
Description
Traffic
Profile
Type
Model Start
Time (HH:mm)
Model Finish
Time (HH:mm)
Model Time
Period Length
(min)
Time Segment
Length (min)
Single Time
Segment OnlyLocked
2023 Base
Flows, AM
2023 Base
FlowsAM DIRECT 07:45 09:15 90 15
Generated on 16/09/2014 10:49:00 using Junctions 8 (8.0.4.487)
25
Junction Network
Junctions
Junction Network Options
Arms
Arms
Major Arm Geometry
Geometries for Arm C are measured opposite Arm B. Geometries for Arm A (if relevant) are measured opposite Arm D.
Minor Arm Geometry
Slope / Intercept / Capacity
Priority Intersection Slopes and Intercepts
The slopes and intercepts shown above do NOT include any corrections or adjustments.
Streams may be combined, in which case capacity will be adjusted.
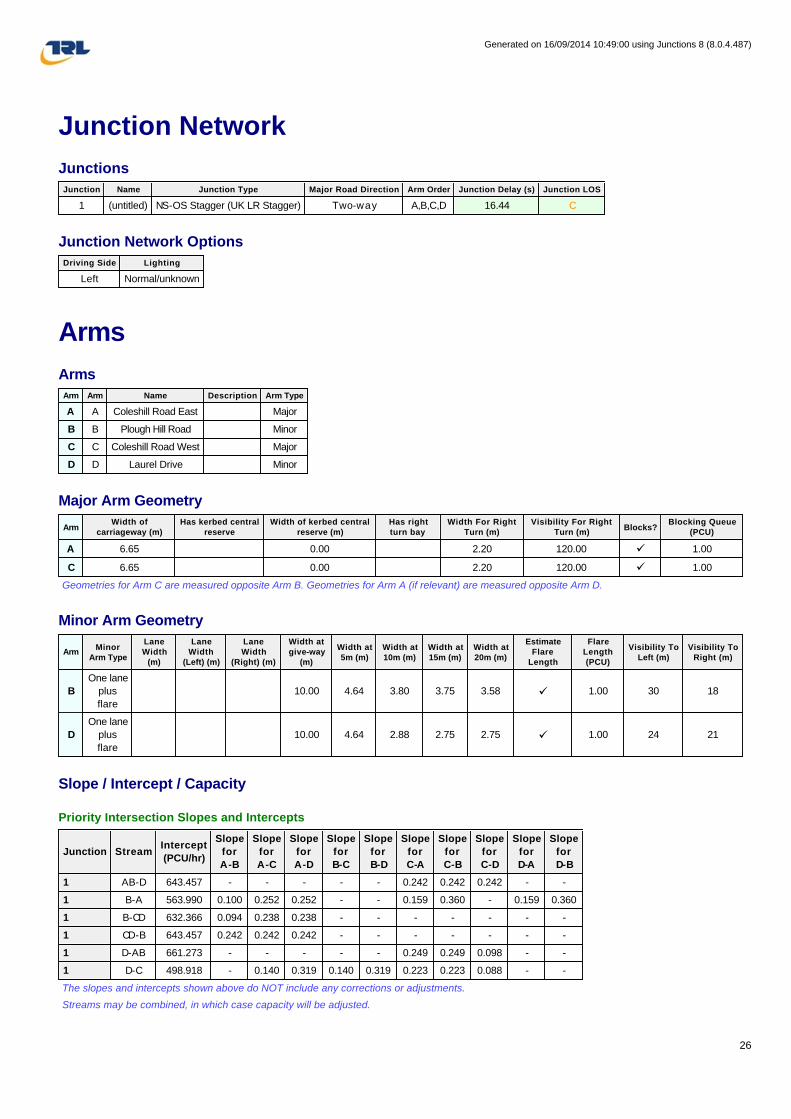
Junction Name Junction Type Major Road Direction Arm Order Junction Delay (s) Junction LOS
1 (untitled) NS-OS Stagger (UK LR Stagger) Two-way A,B,C,D 16.44 C
Driving Side Lighting
Left Normal/unknown
Arm Arm Name Description Arm Type
A A Coleshill Road East Major
B B Plough Hill Road Minor
C C Coleshill Road West Major
D D Laurel Drive Minor
ArmWidth of
carriageway (m)
Has kerbed central
reserve
Width of kerbed central
reserve (m)
Has right
turn bay
Width For Right
Turn (m)
Visibility For Right
Turn (m)Blocks?
Blocking Queue
(PCU)
A 6.65 0.00 2.20 120.00 ü 1.00
C 6.65 0.00 2.20 120.00 ü 1.00
ArmMinor
Arm Type
Lane
Width
(m)
Lane
Width
(Left) (m)
Lane
Width
(Right) (m)
Width at
give-way
(m)
Width at
5m (m)
Width at
10m (m)
Width at
15m (m)
Width at
20m (m)
Estimate
Flare
Length
Flare
Length
(PCU)
Visibility To
Left (m)
Visibility To
Right (m)
B
One lane
plus
flare
10.00 4.64 3.80 3.75 3.58 ü 1.00 30 18
D
One lane
plus
flare
10.00 4.64 2.88 2.75 2.75 ü 1.00 24 21
Junction StreamIntercept
(PCU/hr)
Slope
for
A-B
Slope
for
A-C
Slope
for
A-D
Slope
for
B-C
Slope
for
B-D
Slope
for
C-A
Slope
for
C-B
Slope
for
C-D
Slope
for
D-A
Slope
for
D-B
1 AB-D 643.457 - - - - - 0.242 0.242 0.242 - -
1 B-A 563.990 0.100 0.252 0.252 - - 0.159 0.360 - 0.159 0.360
1 B-CD 632.366 0.094 0.238 0.238 - - - - - - -
1 CD-B 643.457 0.242 0.242 0.242 - - - - - - -
1 D-AB 661.273 - - - - - 0.249 0.249 0.098 - -
1 D-C 498.918 - 0.140 0.319 0.140 0.319 0.223 0.223 0.088 - -
Generated on 16/09/2014 10:49:00 using Junctions 8 (8.0.4.487)
26
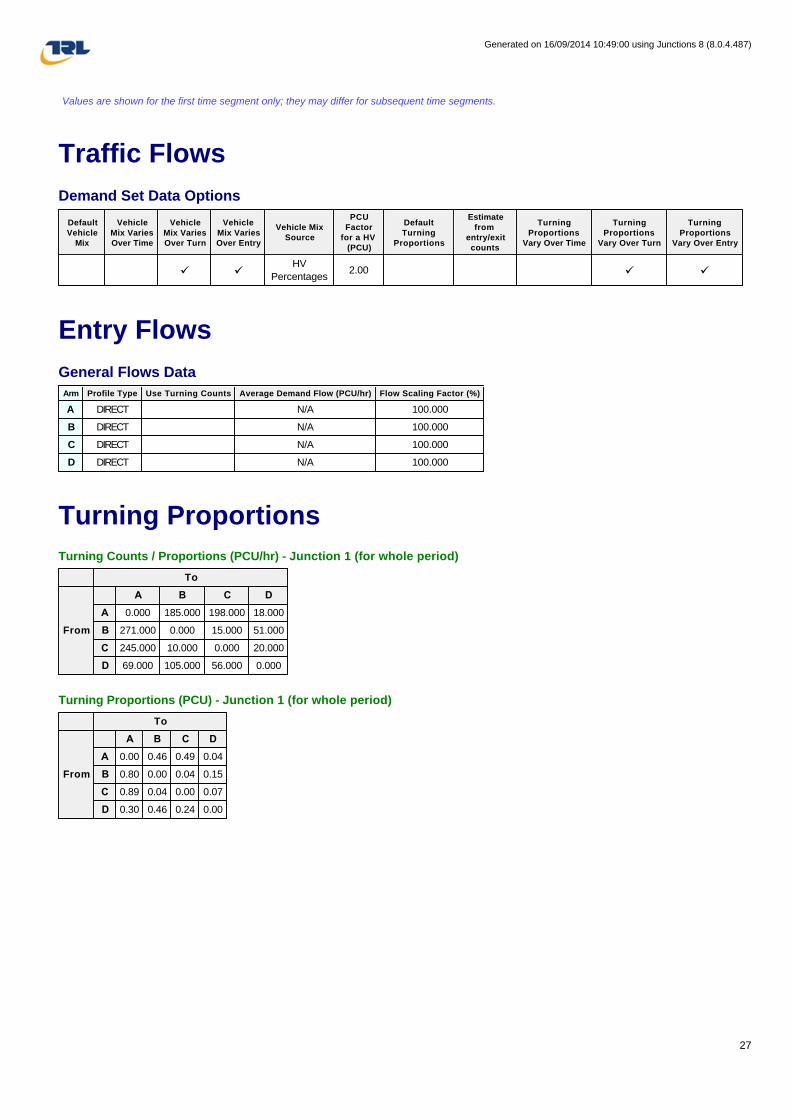
Values are shown for the first time segment only; they may differ for subsequent time segments.
Traffic Flows
Demand Set Data Options
Entry Flows
General Flows Data
Turning Proportions
Turning Counts / Proportions (PCU/hr) - Junction 1 (for whole period)
Turning Proportions (PCU) - Junction 1 (for whole period)
Default
Vehicle
Mix
Vehicle
Mix Varies
Over Time
Vehicle
Mix Varies
Over Turn
Vehicle
Mix Varies
Over Entry
Vehicle Mix
Source
PCU
Factor
for a HV
(PCU)
Default
Turning
Proportions
Estimate
from
entry/exit
counts
Turning
Proportions
Vary Over Time
Turning
Proportions
Vary Over Turn
Turning
Proportions
Vary Over Entry
ü üHV
Percentages2.00 ü ü
Arm Profile Type Use Turning Counts Average Demand Flow (PCU/hr) Flow Scaling Factor (%)
A DIRECT N/A 100.000
B DIRECT N/A 100.000
C DIRECT N/A 100.000
D DIRECT N/A 100.000
To
From
A B C D
A 0.000 185.000 198.000 18.000
B 271.000 0.000 15.000 51.000
C 245.000 10.000 0.000 20.000
D 69.000 105.000 56.000 0.000
To
From
A B C D
A 0.00 0.46 0.49 0.04
B 0.80 0.00 0.04 0.15
C 0.89 0.04 0.00 0.07
D 0.30 0.46 0.24 0.00
Generated on 16/09/2014 10:49:00 using Junctions 8 (8.0.4.487)
27

Vehicle Mix
Average PCU Per Vehicle - Junction 1 (for whole period)
Heavy Vehicle Percentages - Junction 1 (for whole period)
Results
Results Summary for whole modelled period
To
From
A B C D
A 1.000 1.000 1.000 1.000
B 1.000 1.000 1.000 1.000
C 1.000 1.000 1.000 1.000
D 1.000 1.000 1.000 1.000
To
From
A B C D
A 0.0 0.0 0.0 0.0
B 0.0 0.0 0.0 0.0
C 0.0 0.0 0.0 0.0
D 0.0 0.0 0.0 0.0
Stream Max RFC Max Delay (s) Max Queue (PCU) Max LOS
B-CD 0.21 14.13 0.26 B
B-A 0.69 29.43 2.19 D
A-B - - - -
A-C - - - -
A-D - - - -
AB-CD 0.12 6.90 0.14 A
AB-C - - - -
D-AB 0.30 9.08 0.44 A
D-C 0.15 11.19 0.17 B
C-D - - - -
C-A - - - -
C-B - - - -
CD-AB 0.22 7.80 0.30 A
CD-A - - - -
Generated on 16/09/2014 10:49:00 using Junctions 8 (8.0.4.487)
28
Main Results for each time segment
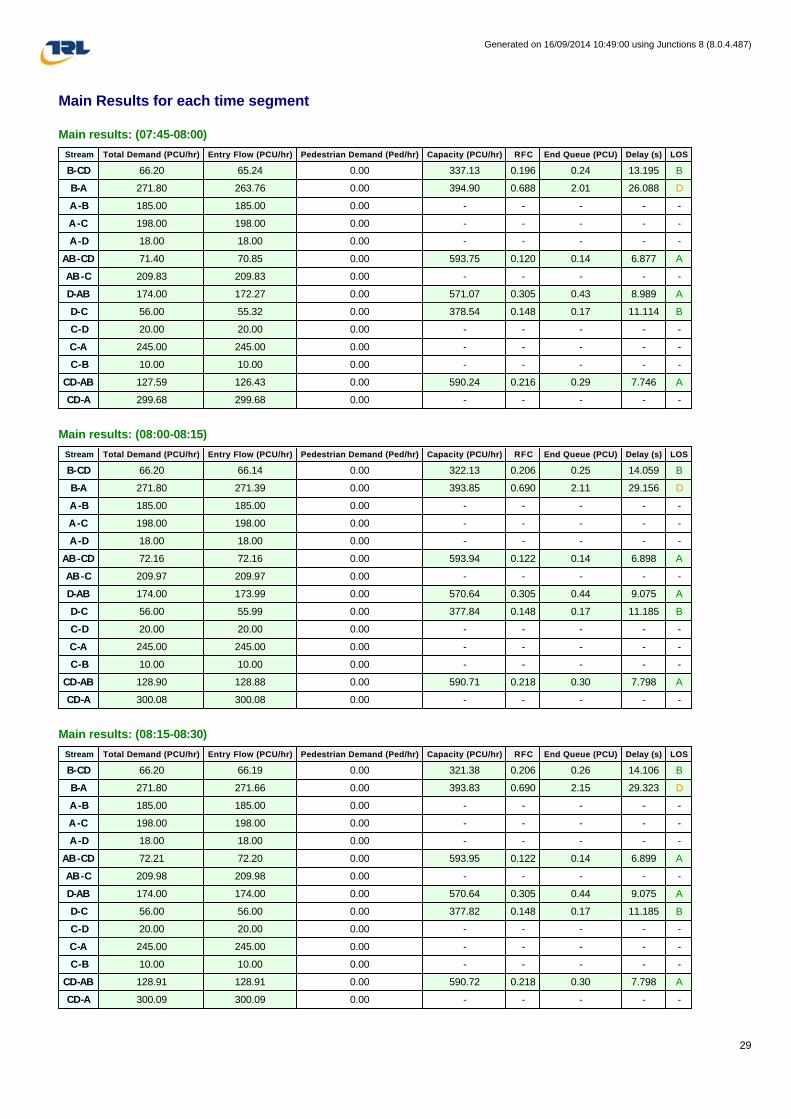
Main results: (07:45-08:00)
Main results: (08:00-08:15)
Main results: (08:15-08:30)
Stream Total Demand (PCU/hr) Entry Flow (PCU/hr) Pedestrian Demand (Ped/hr) Capacity (PCU/hr) RFC End Queue (PCU) Delay (s) LOS
B-CD 66.20 65.24 0.00 337.13 0.196 0.24 13.195 B
B-A 271.80 263.76 0.00 394.90 0.688 2.01 26.088 D
A-B 185.00 185.00 0.00 - - - - -
A-C 198.00 198.00 0.00 - - - - -
A-D 18.00 18.00 0.00 - - - - -
AB-CD 71.40 70.85 0.00 593.75 0.120 0.14 6.877 A
AB-C 209.83 209.83 0.00 - - - - -
D-AB 174.00 172.27 0.00 571.07 0.305 0.43 8.989 A
D-C 56.00 55.32 0.00 378.54 0.148 0.17 11.114 B
C-D 20.00 20.00 0.00 - - - - -
C-A 245.00 245.00 0.00 - - - - -
C-B 10.00 10.00 0.00 - - - - -
CD-AB 127.59 126.43 0.00 590.24 0.216 0.29 7.746 A
CD-A 299.68 299.68 0.00 - - - - -
Stream Total Demand (PCU/hr) Entry Flow (PCU/hr) Pedestrian Demand (Ped/hr) Capacity (PCU/hr) RFC End Queue (PCU) Delay (s) LOS
B-CD 66.20 66.14 0.00 322.13 0.206 0.25 14.059 B
B-A 271.80 271.39 0.00 393.85 0.690 2.11 29.156 D
A-B 185.00 185.00 0.00 - - - - -
A-C 198.00 198.00 0.00 - - - - -
A-D 18.00 18.00 0.00 - - - - -
AB-CD 72.16 72.16 0.00 593.94 0.122 0.14 6.898 A
AB-C 209.97 209.97 0.00 - - - - -
D-AB 174.00 173.99 0.00 570.64 0.305 0.44 9.075 A
D-C 56.00 55.99 0.00 377.84 0.148 0.17 11.185 B
C-D 20.00 20.00 0.00 - - - - -
C-A 245.00 245.00 0.00 - - - - -
C-B 10.00 10.00 0.00 - - - - -
CD-AB 128.90 128.88 0.00 590.71 0.218 0.30 7.798 A
CD-A 300.08 300.08 0.00 - - - - -
Stream Total Demand (PCU/hr) Entry Flow (PCU/hr) Pedestrian Demand (Ped/hr) Capacity (PCU/hr) RFC End Queue (PCU) Delay (s) LOS
B-CD 66.20 66.19 0.00 321.38 0.206 0.26 14.106 B
B-A 271.80 271.66 0.00 393.83 0.690 2.15 29.323 D
A-B 185.00 185.00 0.00 - - - - -
A-C 198.00 198.00 0.00 - - - - -
A-D 18.00 18.00 0.00 - - - - -
AB-CD 72.21 72.20 0.00 593.95 0.122 0.14 6.899 A
AB-C 209.98 209.98 0.00 - - - - -
D-AB 174.00 174.00 0.00 570.64 0.305 0.44 9.075 A
D-C 56.00 56.00 0.00 377.82 0.148 0.17 11.185 B
C-D 20.00 20.00 0.00 - - - - -
C-A 245.00 245.00 0.00 - - - - -
C-B 10.00 10.00 0.00 - - - - -
CD-AB 128.91 128.91 0.00 590.72 0.218 0.30 7.798 A
CD-A 300.09 300.09 0.00 - - - - -
Generated on 16/09/2014 10:49:00 using Junctions 8 (8.0.4.487)
29

Main results: (08:30-08:45)
Main results: (08:45-09:00)
Main results: (09:00-09:15)
Stream Total Demand (PCU/hr) Entry Flow (PCU/hr) Pedestrian Demand (Ped/hr) Capacity (PCU/hr) RFC End Queue (PCU) Delay (s) LOS
B-CD 66.20 66.19 0.00 321.12 0.206 0.26 14.121 B
B-A 271.80 271.73 0.00 393.82 0.690 2.17 29.381 D
A-B 185.00 185.00 0.00 - - - - -
A-C 198.00 198.00 0.00 - - - - -
A-D 18.00 18.00 0.00 - - - - -
AB-CD 72.21 72.21 0.00 593.95 0.122 0.14 6.899 A
AB-C 209.98 209.98 0.00 - - - - -
D-AB 174.00 174.00 0.00 570.64 0.305 0.44 9.075 A
D-C 56.00 56.00 0.00 377.81 0.148 0.17 11.186 B
C-D 20.00 20.00 0.00 - - - - -
C-A 245.00 245.00 0.00 - - - - -
C-B 10.00 10.00 0.00 - - - - -
CD-AB 128.91 128.91 0.00 590.72 0.218 0.30 7.799 A
CD-A 300.09 300.09 0.00 - - - - -
Stream Total Demand (PCU/hr) Entry Flow (PCU/hr) Pedestrian Demand (Ped/hr) Capacity (PCU/hr) RFC End Queue (PCU) Delay (s) LOS
B-CD 66.20 66.19 0.00 320.98 0.206 0.26 14.128 B
B-A 271.80 271.76 0.00 393.82 0.690 2.18 29.413 D
A-B 185.00 185.00 0.00 - - - - -
A-C 198.00 198.00 0.00 - - - - -
A-D 18.00 18.00 0.00 - - - - -
AB-CD 72.21 72.21 0.00 593.95 0.122 0.14 6.899 A
AB-C 209.98 209.98 0.00 - - - - -
D-AB 174.00 174.00 0.00 570.64 0.305 0.44 9.075 A
D-C 56.00 56.00 0.00 377.81 0.148 0.17 11.186 B
C-D 20.00 20.00 0.00 - - - - -
C-A 245.00 245.00 0.00 - - - - -
C-B 10.00 10.00 0.00 - - - - -
CD-AB 128.91 128.91 0.00 590.72 0.218 0.30 7.799 A
CD-A 300.09 300.09 0.00 - - - - -
Stream Total Demand (PCU/hr) Entry Flow (PCU/hr) Pedestrian Demand (Ped/hr) Capacity (PCU/hr) RFC End Queue (PCU) Delay (s) LOS
B-CD 66.20 66.19 0.00 320.90 0.206 0.26 14.133 B
B-A 271.80 271.77 0.00 393.82 0.690 2.19 29.431 D
A-B 185.00 185.00 0.00 - - - - -
A-C 198.00 198.00 0.00 - - - - -
A-D 18.00 18.00 0.00 - - - - -
AB-CD 72.21 72.21 0.00 593.95 0.122 0.14 6.902 A
AB-C 209.98 209.98 0.00 - - - - -
D-AB 174.00 174.00 0.00 570.63 0.305 0.44 9.075 A
D-C 56.00 56.00 0.00 377.81 0.148 0.17 11.186 B
C-D 20.00 20.00 0.00 - - - - -
C-A 245.00 245.00 0.00 - - - - -
C-B 10.00 10.00 0.00 - - - - -
CD-AB 128.91 128.91 0.00 590.72 0.218 0.30 7.799 A
CD-A 300.09 300.09 0.00 - - - - -
Generated on 16/09/2014 10:49:00 using Junctions 8 (8.0.4.487)
30

2023 Base Flows, PM
Data Errors and Warnings
Analysis Set Details
Demand Set Details
Junction Network
Junctions
Junction Network Options
Arms
Arms
Major Arm Geometry
Geometries for Arm C are measured opposite Arm B. Geometries for Arm A (if relevant) are measured opposite Arm D.
Severity Area Item Description
Warning Minor arm flareArm D - Minor Arm
Geometry
Is flare very short? Estimated flare length is zero but has been increased to 1 because a zero
flare length is not allowed.
Name Roundabout Capacity Model Description Locked Network Flow Scaling Factor (%) Reason For Scaling Factors
N/A 100.000
NameScenario
Name
Time
Period
Name
Description
Traffic
Profile
Type
Model Start
Time (HH:mm)
Model Finish
Time (HH:mm)
Model Time
Period Length
(min)
Time Segment
Length (min)
Single Time
Segment OnlyLocked
2023 Base
Flows, PM
2023 Base
FlowsPM
ONE
HOUR16:45 18:15 90 15
Junction Name Junction Type Major Road Direction Arm Order Junction Delay (s) Junction LOS
1 (untitled) NS-OS Stagger (UK LR Stagger) Two-way A,B,C,D 15.61 C
Driving Side Lighting
Left Normal/unknown
Arm Arm Name Description Arm Type
A A Coleshill Road East Major
B B Plough Hill Road Minor
C C Coleshill Road West Major
D D Laurel Drive Minor
ArmWidth of
carriageway (m)
Has kerbed central
reserve
Width of kerbed central
reserve (m)
Has right
turn bay
Width For Right
Turn (m)
Visibility For Right
Turn (m)Blocks?
Blocking Queue
(PCU)
A 6.65 0.00 2.20 120.00 ü 1.00
C 6.65 0.00 2.20 120.00 ü 1.00
Generated on 16/09/2014 10:49:00 using Junctions 8 (8.0.4.487)
31

Minor Arm Geometry
Slope / Intercept / Capacity
Priority Intersection Slopes and Intercepts
The slopes and intercepts shown above do NOT include any corrections or adjustments.
Streams may be combined, in which case capacity will be adjusted.
Values are shown for the first time segment only; they may differ for subsequent time segments.
Traffic Flows
Demand Set Data Options
Entry Flows
General Flows Data
ArmMinor
Arm Type
Lane
Width
(m)
Lane
Width
(Left) (m)
Lane
Width
(Right) (m)
Width at
give-way
(m)
Width at
5m (m)
Width at
10m (m)
Width at
15m (m)
Width at
20m (m)
Estimate
Flare
Length
Flare
Length
(PCU)
Visibility To
Left (m)
Visibility To
Right (m)
B
One lane
plus
flare
10.00 4.64 3.80 3.75 3.58 ü 1.00 30 18
D
One lane
plus
flare
10.00 4.64 2.88 2.75 2.75 ü 1.00 24 21
Junction StreamIntercept
(PCU/hr)
Slope
for
A-B
Slope
for
A-C
Slope
for
A-D
Slope
for
B-C
Slope
for
B-D
Slope
for
C-A
Slope
for
C-B
Slope
for
C-D
Slope
for
D-A
Slope
for
D-B
1 AB-D 643.457 - - - - - 0.242 0.242 0.242 - -
1 B-A 562.363 0.100 0.252 0.252 - - 0.158 0.359 - 0.158 0.359
1 B-CD 634.449 0.095 0.239 0.239 - - - - - - -
1 CD-B 643.457 0.242 0.242 0.242 - - - - - - -
1 D-AB 664.026 - - - - - 0.250 0.250 0.099 - -
1 D-C 493.563 - 0.139 0.315 0.139 0.315 0.221 0.221 0.087 - -
Default
Vehicle
Mix
Vehicle
Mix Varies
Over Time
Vehicle
Mix Varies
Over Turn
Vehicle
Mix Varies
Over Entry
Vehicle Mix
Source
PCU
Factor
for a HV
(PCU)
Default
Turning
Proportions
Estimate
from
entry/exit
counts
Turning
Proportions
Vary Over Time
Turning
Proportions
Vary Over Turn
Turning
Proportions
Vary Over Entry
ü üHV
Percentages2.00 ü ü
Arm Profile Type Use Turning Counts Average Demand Flow (PCU/hr) Flow Scaling Factor (%)
A ONE HOUR ü 511.00 100.000
B ONE HOUR ü 281.00 100.000
C ONE HOUR ü 310.00 100.000
D ONE HOUR ü 66.00 100.000
Generated on 16/09/2014 10:49:00 using Junctions 8 (8.0.4.487)
32

Turning Proportions
Turning Counts / Proportions (PCU/hr) - Junction 1 (for whole period)
Turning Proportions (PCU) - Junction 1 (for whole period)
Vehicle Mix
Average PCU Per Vehicle - Junction 1 (for whole period)
Heavy Vehicle Percentages - Junction 1 (for whole period)
To
From
A B C D
A 0.000 297.000 183.000 31.000
B 222.000 0.000 15.000 44.000
C 250.000 37.000 0.000 23.000
D 31.000 22.000 13.000 0.000
To
From
A B C D
A 0.00 0.58 0.36 0.06
B 0.79 0.00 0.05 0.16
C 0.81 0.12 0.00 0.07
D 0.47 0.33 0.20 0.00
To
From
A B C D
A 1.000 1.000 1.000 1.000
B 1.000 1.000 1.000 1.000
C 1.000 1.000 1.000 1.000
D 1.000 1.000 1.000 1.000
To
From
A B C D
A 0.0 0.0 0.0 0.0
B 0.0 0.0 0.0 0.0
C 0.0 0.0 0.0 0.0
D 0.0 0.0 0.0 0.0
Generated on 16/09/2014 10:49:00 using Junctions 8 (8.0.4.487)
33

Results
Results Summary for whole modelled period
Main Results for each time segment
Main results: (16:45-17:00)
Main results: (17:00-17:15)
Stream Max RFC Max Delay (s) Max Queue (PCU) Max LOS
B-CD 0.18 12.23 0.22 B
B-A 0.62 24.03 1.59 C
A-B - - - -
A-C - - - -
A-D - - - -
AB-CD 0.15 7.27 0.18 A
AB-C - - - -
D-AB 0.10 6.94 0.11 A
D-C 0.04 10.28 0.04 B
C-D - - - -
C-A - - - -
C-B - - - -
CD-AB 0.13 7.74 0.16 A
CD-A - - - -
Stream Total Demand (PCU/hr) Entry Flow (PCU/hr) Pedestrian Demand (Ped/hr) Capacity (PCU/hr) RFC End Queue (PCU) Delay (s) LOS
B-CD 44.42 44.03 0.00 497.87 0.089 0.10 7.926 A
B-A 167.13 164.81 0.00 449.06 0.372 0.58 12.566 B
A-B 223.60 223.60 0.00 - - - - -
A-C 137.77 137.77 0.00 - - - - -
A-D 23.34 23.34 0.00 - - - - -
AB-CD 57.54 57.11 0.00 596.45 0.096 0.11 6.675 A
AB-C 147.60 147.60 0.00 - - - - -
D-AB 39.90 39.62 0.00 604.61 0.066 0.07 6.369 A
D-C 9.79 9.69 0.00 405.72 0.024 0.02 9.088 A
C-D 17.32 17.32 0.00 - - - - -
C-A 188.21 188.21 0.00 - - - - -
C-B 27.86 27.86 0.00 - - - - -
CD-AB 45.67 45.31 0.00 561.96 0.081 0.09 6.963 A
CD-A 210.02 210.02 0.00 - - - - -
Generated on 16/09/2014 10:49:00 using Junctions 8 (8.0.4.487)
34

Main results: (17:00-17:15)
Main results: (17:15-17:30)
Main results: (17:30-17:45)
Stream Total Demand (PCU/hr) Entry Flow (PCU/hr) Pedestrian Demand (Ped/hr) Capacity (PCU/hr) RFC End Queue (PCU) Delay (s) LOS
B-CD 53.04 52.90 0.00 450.73 0.118 0.13 9.046 A
B-A 199.57 198.48 0.00 426.15 0.468 0.85 15.731 C
A-B 267.00 267.00 0.00 - - - - -
A-C 164.51 164.51 0.00 - - - - -
A-D 27.87 27.87 0.00 - - - - -
AB-CD 69.75 69.64 0.00 589.93 0.118 0.14 6.917 A
AB-C 175.53 175.53 0.00 - - - - -
D-AB 47.65 47.58 0.00 592.89 0.080 0.09 6.601 A
D-C 11.69 11.66 0.00 388.41 0.030 0.03 9.555 A
C-D 20.68 20.68 0.00 - - - - -
C-A 224.74 224.74 0.00 - - - - -
C-B 33.26 33.26 0.00 - - - - -
CD-AB 55.52 55.42 0.00 549.65 0.101 0.11 7.284 A
CD-A 250.07 250.07 0.00 - - - - -
Stream Total Demand (PCU/hr) Entry Flow (PCU/hr) Pedestrian Demand (Ped/hr) Capacity (PCU/hr) RFC End Queue (PCU) Delay (s) LOS
B-CD 64.96 64.63 0.00 363.32 0.179 0.21 12.039 B
B-A 244.43 241.69 0.00 393.66 0.621 1.54 23.263 C
A-B 327.00 327.00 0.00 - - - - -
A-C 201.49 201.49 0.00 - - - - -
A-D 34.13 34.13 0.00 - - - - -
AB-CD 87.03 86.85 0.00 582.41 0.149 0.18 7.263 A
AB-C 213.22 213.22 0.00 - - - - -
D-AB 58.35 58.25 0.00 576.66 0.101 0.11 6.942 A
D-C 14.31 14.27 0.00 364.64 0.039 0.04 10.273 B
C-D 25.32 25.32 0.00 - - - - -
C-A 275.26 275.26 0.00 - - - - -
C-B 40.74 40.74 0.00 - - - - -
CD-AB 69.99 69.82 0.00 534.98 0.131 0.16 7.737 A
CD-A 304.26 304.26 0.00 - - - - -
Stream Total Demand (PCU/hr) Entry Flow (PCU/hr) Pedestrian Demand (Ped/hr) Capacity (PCU/hr) RFC End Queue (PCU) Delay (s) LOS
B-CD 64.96 64.94 0.00 359.19 0.181 0.22 12.234 B
B-A 244.43 244.24 0.00 393.54 0.621 1.59 24.028 C
A-B 327.00 327.00 0.00 - - - - -
A-C 201.49 201.49 0.00 - - - - -
A-D 34.13 34.13 0.00 - - - - -
AB-CD 87.29 87.28 0.00 582.48 0.150 0.18 7.269 A
AB-C 213.27 213.27 0.00 - - - - -
D-AB 58.35 58.35 0.00 576.63 0.101 0.11 6.945 A
D-C 14.31 14.31 0.00 364.51 0.039 0.04 10.279 B
C-D 25.32 25.32 0.00 - - - - -
C-A 275.26 275.26 0.00 - - - - -
C-B 40.74 40.74 0.00 - - - - -
CD-AB 70.04 70.03 0.00 535.01 0.131 0.16 7.742 A
CD-A 304.31 304.31 0.00 - - - - -
Generated on 16/09/2014 10:49:00 using Junctions 8 (8.0.4.487)
35

Main results: (17:45-18:00)
Main results: (18:00-18:15)
Stream Total Demand (PCU/hr) Entry Flow (PCU/hr) Pedestrian Demand (Ped/hr) Capacity (PCU/hr) RFC End Queue (PCU) Delay (s) LOS
B-CD 53.04 53.37 0.00 446.54 0.119 0.14 9.165 A
B-A 199.57 202.28 0.00 426.08 0.468 0.91 16.273 C
A-B 267.00 267.00 0.00 - - - - -
A-C 164.51 164.51 0.00 - - - - -
A-D 27.87 27.87 0.00 - - - - -
AB-CD 70.13 70.30 0.00 590.01 0.119 0.14 6.931 A
AB-C 175.62 175.62 0.00 - - - - -
D-AB 47.65 47.74 0.00 592.84 0.080 0.09 6.604 A
D-C 11.69 11.72 0.00 388.22 0.030 0.03 9.564 A
C-D 20.68 20.68 0.00 - - - - -
C-A 224.74 224.74 0.00 - - - - -
C-B 33.26 33.26 0.00 - - - - -
CD-AB 55.59 55.75 0.00 549.67 0.101 0.12 7.293 A
CD-A 250.16 250.16 0.00 - - - - -
Stream Total Demand (PCU/hr) Entry Flow (PCU/hr) Pedestrian Demand (Ped/hr) Capacity (PCU/hr) RFC End Queue (PCU) Delay (s) LOS
B-CD 44.42 44.57 0.00 494.97 0.090 0.10 7.995 A
B-A 167.13 168.34 0.00 448.90 0.372 0.61 12.888 B
A-B 223.60 223.60 0.00 - - - - -
A-C 137.77 137.77 0.00 - - - - -
A-D 23.34 23.34 0.00 - - - - -
AB-CD 57.96 58.08 0.00 596.53 0.097 0.11 6.686 A
AB-C 147.72 147.72 0.00 - - - - -
D-AB 39.90 39.97 0.00 604.52 0.066 0.07 6.379 A
D-C 9.79 9.81 0.00 405.46 0.024 0.02 9.099 A
C-D 17.32 17.32 0.00 - - - - -
C-A 188.21 188.21 0.00 - - - - -
C-B 27.86 27.86 0.00 - - - - -
CD-AB 45.83 45.93 0.00 562.01 0.082 0.09 6.979 A
2023 With Development, AM
Data Errors and Warnings
Analysis Set Details
CD-AB 45.83 45.93 0.00 562.01 0.082 0.09 6.979 A
CD-A 210.21 210.21 0.00 - - - - -
Severity Area Item Description
Warning Minor arm flareArm D - Minor Arm
Geometry
Is flare very short? Estimated flare length is zero but has been increased to 1 because a zero
flare length is not allowed.
Name Roundabout Capacity Model Description Locked Network Flow Scaling Factor (%) Reason For Scaling Factors
N/A 100.000
Generated on 16/09/2014 10:49:00 using Junctions 8 (8.0.4.487)
36

Demand Set Details
Junction Network
Junctions
Junction Network Options
Arms
Arms
Major Arm Geometry
Geometries for Arm C are measured opposite Arm B. Geometries for Arm A (if relevant) are measured opposite Arm D.
Minor Arm Geometry
Name Scenario Name
Time
Period
Name
Description
Traffic
Profile
Type
Model Start
Time
(HH:mm)
Model Finish
Time
(HH:mm)
Model Time
Period
Length (min)
Time
Segment
Length (min)
Single Time
Segment
Only
Locked
2023 With
Development,
AM
2023 With
DevelopmentAM DIRECT 07:45 09:15 90 15
Junction Name Junction Type Major Road Direction Arm Order Junction Delay (s) Junction LOS
1 (untitled) NS-OS Stagger (UK LR Stagger) Two-way A,B,C,D 36.37 E
Driving Side Lighting
Left Normal/unknown
Arm Arm Name Description Arm Type
A A Coleshill Road East Major
B B Plough Hill Road Minor
C C Coleshill Road West Major
D D Laurel Drive Minor
ArmWidth of
carriageway (m)
Has kerbed central
reserve
Width of kerbed central
reserve (m)
Has right
turn bay
Width For Right
Turn (m)
Visibility For Right
Turn (m)Blocks?
Blocking Queue
(PCU)
A 6.65 0.00 2.20 120.00 ü 1.00
C 6.65 0.00 2.20 120.00 ü 1.00
ArmMinor
Arm Type
Lane
Width
(m)
Lane
Width
(Left) (m)
Lane
Width
(Right) (m)
Width at
give-way
(m)
Width at
5m (m)
Width at
10m (m)
Width at
15m (m)
Width at
20m (m)
Estimate
Flare
Length
Flare
Length
(PCU)
Visibility To
Left (m)
Visibility To
Right (m)
B
One lane
plus
flare
10.00 4.64 3.80 3.75 3.58 ü 1.00 30 18
D
One lane
plus
flare
10.00 4.64 2.88 2.75 2.75 ü 1.00 24 21
Generated on 16/09/2014 10:49:00 using Junctions 8 (8.0.4.487)
37
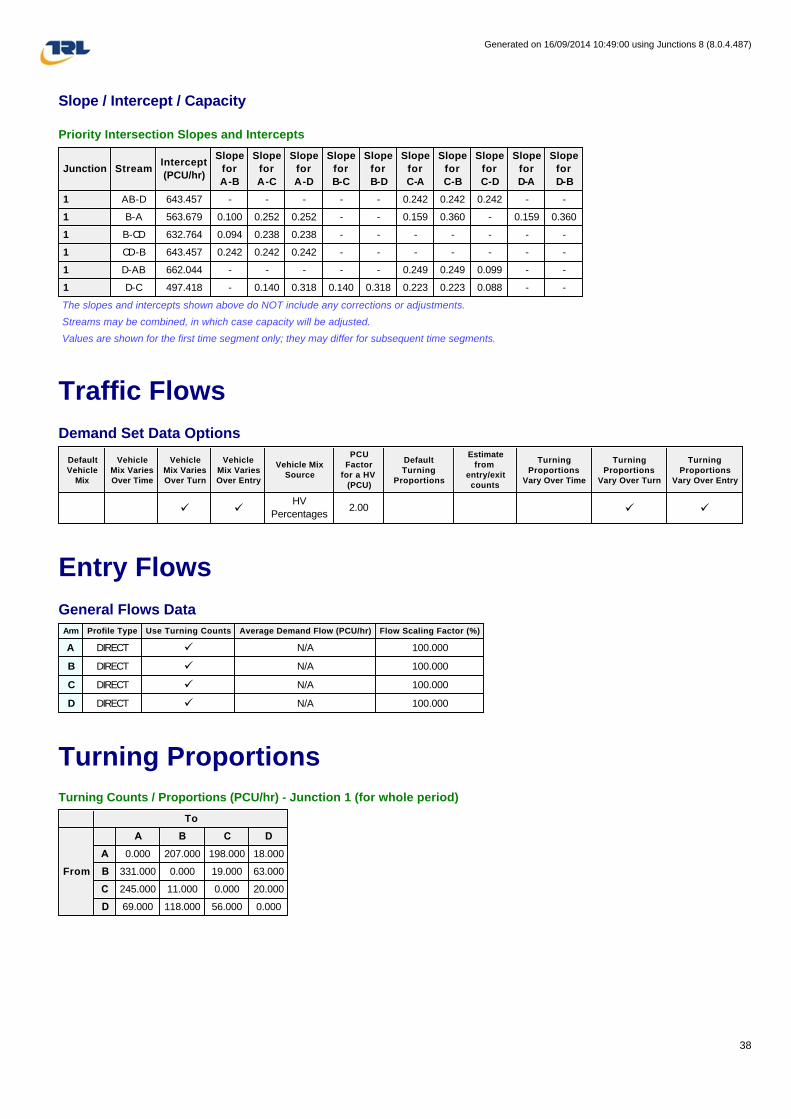
Slope / Intercept / Capacity
Priority Intersection Slopes and Intercepts
The slopes and intercepts shown above do NOT include any corrections or adjustments.
Streams may be combined, in which case capacity will be adjusted.
Values are shown for the first time segment only; they may differ for subsequent time segments.
Traffic Flows
Demand Set Data Options
Entry Flows
General Flows Data
Turning Proportions
Turning Counts / Proportions (PCU/hr) - Junction 1 (for whole period)
Junction StreamIntercept
(PCU/hr)
Slope
for
A-B
Slope
for
A-C
Slope
for
A-D
Slope
for
B-C
Slope
for
B-D
Slope
for
C-A
Slope
for
C-B
Slope
for
C-D
Slope
for
D-A
Slope
for
D-B
1 AB-D 643.457 - - - - - 0.242 0.242 0.242 - -
1 B-A 563.679 0.100 0.252 0.252 - - 0.159 0.360 - 0.159 0.360
1 B-CD 632.764 0.094 0.238 0.238 - - - - - - -
1 CD-B 643.457 0.242 0.242 0.242 - - - - - - -
1 D-AB 662.044 - - - - - 0.249 0.249 0.099 - -
1 D-C 497.418 - 0.140 0.318 0.140 0.318 0.223 0.223 0.088 - -
Default
Vehicle
Mix
Vehicle
Mix Varies
Over Time
Vehicle
Mix Varies
Over Turn
Vehicle
Mix Varies
Over Entry
Vehicle Mix
Source
PCU
Factor
for a HV
(PCU)
Default
Turning
Proportions
Estimate
from
entry/exit
counts
Turning
Proportions
Vary Over Time
Turning
Proportions
Vary Over Turn
Turning
Proportions
Vary Over Entry
ü üHV
Percentages2.00 ü ü
Arm Profile Type Use Turning Counts Average Demand Flow (PCU/hr) Flow Scaling Factor (%)
A DIRECT ü N/A 100.000
B DIRECT ü N/A 100.000
C DIRECT ü N/A 100.000
D DIRECT ü N/A 100.000
To
From
A B C D
A 0.000 207.000 198.000 18.000
B 331.000 0.000 19.000 63.000
C 245.000 11.000 0.000 20.000
D 69.000 118.000 56.000 0.000
Generated on 16/09/2014 10:49:00 using Junctions 8 (8.0.4.487)
38

Turning Proportions (PCU) - Junction 1 (for whole period)
Vehicle Mix
Average PCU Per Vehicle - Junction 1 (for whole period)
Heavy Vehicle Percentages - Junction 1 (for whole period)
Results
Results Summary for whole modelled period
To
From
A B C D
A 0.00 0.49 0.47 0.04
B 0.80 0.00 0.05 0.15
C 0.89 0.04 0.00 0.07
D 0.28 0.49 0.23 0.00
To
From
A B C D
A 1.000 1.000 1.000 1.000
B 1.000 1.000 1.000 1.000
C 1.000 1.000 1.000 1.000
D 1.000 1.000 1.000 1.000
To
From
A B C D
A 0.0 0.0 0.0 0.0
B 0.0 0.0 0.0 0.0
C 0.0 0.0 0.0 0.0
D 0.0 0.0 0.0 0.0
Stream Max RFC Max Delay (s) Max Queue (PCU) Max LOS
B-CD 0.56 55.71 1.22 F
B-A 0.87 71.03 6.24 F
A-B - - - -
A-C - - - -
A-D - - - -
AB-CD 0.14 7.04 0.17 A
AB-C - - - -
D-AB 0.33 9.39 0.49 A
D-C 0.15 11.50 0.18 B
C-D - - - -
C-A - - - -
C-B - - - -
CD-AB 0.25 8.10 0.36 A
CD-A - - - -
Generated on 16/09/2014 10:49:00 using Junctions 8 (8.0.4.487)
39
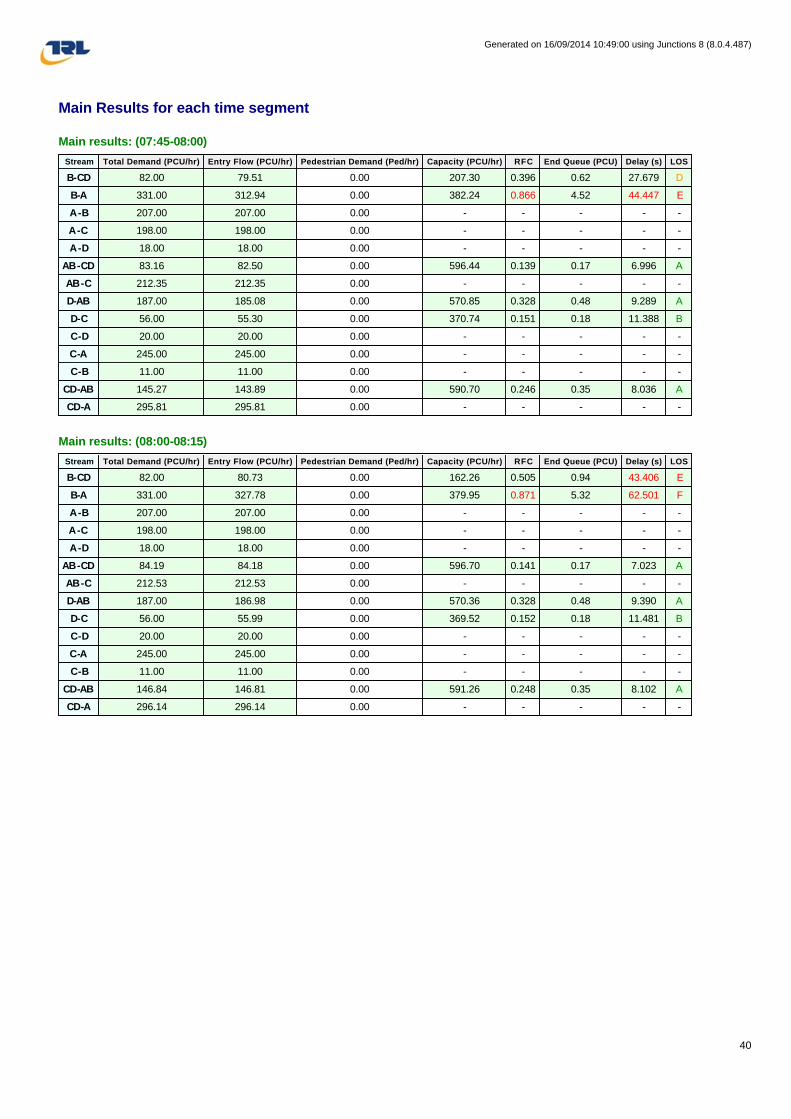
Main Results for each time segment
Main results: (07:45-08:00)
Main results: (08:00-08:15)
Stream Total Demand (PCU/hr) Entry Flow (PCU/hr) Pedestrian Demand (Ped/hr) Capacity (PCU/hr) RFC End Queue (PCU) Delay (s) LOS
B-CD 82.00 79.51 0.00 207.30 0.396 0.62 27.679 D
B-A 331.00 312.94 0.00 382.24 0.866 4.52 44.447 E
A-B 207.00 207.00 0.00 - - - - -
A-C 198.00 198.00 0.00 - - - - -
A-D 18.00 18.00 0.00 - - - - -
AB-CD 83.16 82.50 0.00 596.44 0.139 0.17 6.996 A
AB-C 212.35 212.35 0.00 - - - - -
D-AB 187.00 185.08 0.00 570.85 0.328 0.48 9.289 A
D-C 56.00 55.30 0.00 370.74 0.151 0.18 11.388 B
C-D 20.00 20.00 0.00 - - - - -
C-A 245.00 245.00 0.00 - - - - -
C-B 11.00 11.00 0.00 - - - - -
CD-AB 145.27 143.89 0.00 590.70 0.246 0.35 8.036 A
CD-A 295.81 295.81 0.00 - - - - -
Stream Total Demand (PCU/hr) Entry Flow (PCU/hr) Pedestrian Demand (Ped/hr) Capacity (PCU/hr) RFC End Queue (PCU) Delay (s) LOS
B-CD 82.00 80.73 0.00 162.26 0.505 0.94 43.406 E
B-A 331.00 327.78 0.00 379.95 0.871 5.32 62.501 F
A-B 207.00 207.00 0.00 - - - - -
A-C 198.00 198.00 0.00 - - - - -
A-D 18.00 18.00 0.00 - - - - -
AB-CD 84.19 84.18 0.00 596.70 0.141 0.17 7.023 A
AB-C 212.53 212.53 0.00 - - - - -
D-AB 187.00 186.98 0.00 570.36 0.328 0.48 9.390 A
D-C 56.00 55.99 0.00 369.52 0.152 0.18 11.481 B
C-D 20.00 20.00 0.00 - - - - -
C-A 245.00 245.00 0.00 - - - - -
C-B 11.00 11.00 0.00 - - - - -
CD-AB 146.84 146.81 0.00 591.26 0.248 0.35 8.102 A
CD-A 296.14 296.14 0.00 - - - - -
Generated on 16/09/2014 10:49:00 using Junctions 8 (8.0.4.487)
40

Main results: (08:15-08:30)
Main results: (08:30-08:45)
Main results: (08:45-09:00)
Stream Total Demand (PCU/hr) Entry Flow (PCU/hr) Pedestrian Demand (Ped/hr) Capacity (PCU/hr) RFC End Queue (PCU) Delay (s) LOS
B-CD 82.00 81.53 0.00 154.14 0.532 1.06 49.041 E
B-A 331.00 329.40 0.00 379.35 0.873 5.72 66.676 F
A-B 207.00 207.00 0.00 - - - - -
A-C 198.00 198.00 0.00 - - - - -
A-D 18.00 18.00 0.00 - - - - -
AB-CD 84.88 84.88 0.00 596.87 0.142 0.17 7.033 A
AB-C 212.65 212.65 0.00 - - - - -
D-AB 187.00 186.99 0.00 570.33 0.328 0.49 9.390 A
D-C 56.00 56.00 0.00 369.17 0.152 0.18 11.494 B
C-D 20.00 20.00 0.00 - - - - -
C-A 245.00 245.00 0.00 - - - - -
C-B 11.00 11.00 0.00 - - - - -
CD-AB 146.85 146.84 0.00 591.26 0.248 0.35 8.103 A
CD-A 296.14 296.14 0.00 - - - - -
Stream Total Demand (PCU/hr) Entry Flow (PCU/hr) Pedestrian Demand (Ped/hr) Capacity (PCU/hr) RFC End Queue (PCU) Delay (s) LOS
B-CD 82.00 81.71 0.00 150.09 0.546 1.13 52.154 F
B-A 331.00 330.04 0.00 379.11 0.873 5.96 68.807 F
A-B 207.00 207.00 0.00 - - - - -
A-C 198.00 198.00 0.00 - - - - -
A-D 18.00 18.00 0.00 - - - - -
AB-CD 85.04 85.04 0.00 596.91 0.142 0.17 7.035 A
AB-C 212.68 212.68 0.00 - - - - -
D-AB 187.00 187.00 0.00 570.32 0.328 0.49 9.391 A
D-C 56.00 56.00 0.00 369.04 0.152 0.18 11.499 B
C-D 20.00 20.00 0.00 - - - - -
C-A 245.00 245.00 0.00 - - - - -
C-B 11.00 11.00 0.00 - - - - -
CD-AB 146.85 146.85 0.00 591.26 0.248 0.35 8.105 A
CD-A 296.15 296.15 0.00 - - - - -
Stream Total Demand (PCU/hr) Entry Flow (PCU/hr) Pedestrian Demand (Ped/hr) Capacity (PCU/hr) RFC End Queue (PCU) Delay (s) LOS
B-CD 82.00 81.80 0.00 147.64 0.555 1.18 54.220 F
B-A 331.00 330.35 0.00 378.97 0.873 6.12 70.126 F
A-B 207.00 207.00 0.00 - - - - -
A-C 198.00 198.00 0.00 - - - - -
A-D 18.00 18.00 0.00 - - - - -
AB-CD 85.11 85.11 0.00 596.93 0.143 0.17 7.036 A
AB-C 212.69 212.69 0.00 - - - - -
D-AB 187.00 187.00 0.00 570.31 0.328 0.49 9.391 A
D-C 56.00 56.00 0.00 368.96 0.152 0.18 11.502 B
C-D 20.00 20.00 0.00 - - - - -
C-A 245.00 245.00 0.00 - - - - -
C-B 11.00 11.00 0.00 - - - - -
CD-AB 146.85 146.85 0.00 591.26 0.248 0.36 8.105 A
CD-A 296.15 296.15 0.00 - - - - -
Generated on 16/09/2014 10:49:00 using Junctions 8 (8.0.4.487)
41

Main results: (09:00-09:15)
2023 With Development, PM
Data Errors and Warnings
Analysis Set Details
Demand Set Details
Junction Network
Junctions
Junction Network Options
Stream Total Demand (PCU/hr) Entry Flow (PCU/hr) Pedestrian Demand (Ped/hr) Capacity (PCU/hr) RFC End Queue (PCU) Delay (s) LOS
B-CD 82.00 81.85 0.00 145.98 0.562 1.22 55.708 F
B-A 331.00 330.53 0.00 378.87 0.874 6.24 71.030 F
A-B 207.00 207.00 0.00 - - - - -
A-C 198.00 198.00 0.00 - - - - -
A-D 18.00 18.00 0.00 - - - - -
AB-CD 85.16 85.15 0.00 596.94 0.143 0.17 7.036 A
AB-C 212.70 212.70 0.00 - - - - -
D-AB 187.00 187.00 0.00 570.31 0.328 0.49 9.391 A
D-C 56.00 56.00 0.00 368.91 0.152 0.18 11.504 B
C-D 20.00 20.00 0.00 - - - - -
C-A 245.00 245.00 0.00 - - - - -
C-B 11.00 11.00 0.00 - - - - -
CD-AB 146.85 146.85 0.00 591.26 0.248 0.36 8.103 A
CD-A 296.15 296.15 0.00 - - - - -
Severity Area Item Description
Warning Minor arm flareArm D - Minor Arm
Geometry
Is flare very short? Estimated flare length is zero but has been increased to 1 because a zero
flare length is not allowed.
Name Roundabout Capacity Model Description Locked Network Flow Scaling Factor (%) Reason For Scaling Factors
N/A 100.000
Name Scenario Name
Time
Period
Name
Description
Traffic
Profile
Type
Model Start
Time
(HH:mm)
Model Finish
Time
(HH:mm)
Model Time
Period
Length (min)
Time
Segment
Length (min)
Single Time
Segment
Only
Locked
2023 With
Development, PM
2023 With
DevelopmentPM
ONE
HOUR16:45 18:15 90 15
Junction Name Junction Type Major Road Direction Arm Order Junction Delay (s) Junction LOS
1 (untitled) NS-OS Stagger (UK LR Stagger) Two-way A,B,C,D 21.71 C
Driving Side Lighting
Left Normal/unknown
Generated on 16/09/2014 10:49:00 using Junctions 8 (8.0.4.487)
42
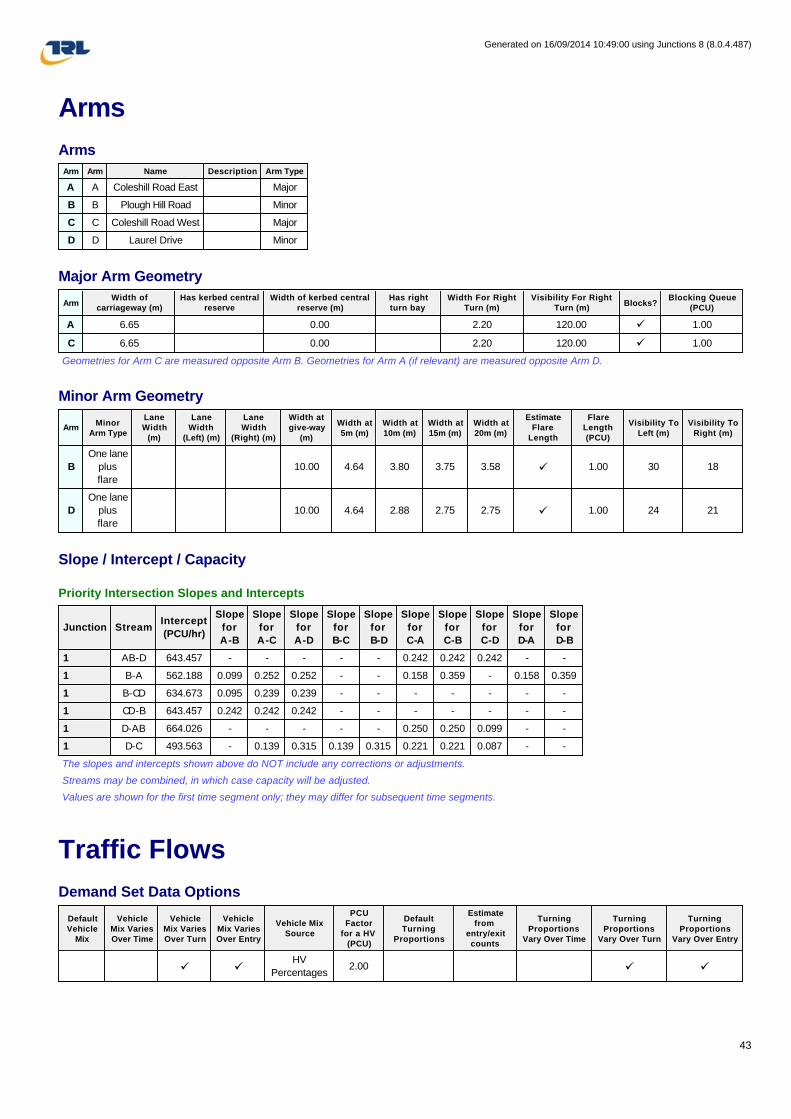
Arms
Arms
Major Arm Geometry
Geometries for Arm C are measured opposite Arm B. Geometries for Arm A (if relevant) are measured opposite Arm D.
Minor Arm Geometry
Slope / Intercept / Capacity
Priority Intersection Slopes and Intercepts
The slopes and intercepts shown above do NOT include any corrections or adjustments.
Streams may be combined, in which case capacity will be adjusted.
Values are shown for the first time segment only; they may differ for subsequent time segments.
Traffic Flows
Demand Set Data Options
Arm Arm Name Description Arm Type
A A Coleshill Road East Major
B B Plough Hill Road Minor
C C Coleshill Road West Major
D D Laurel Drive Minor
ArmWidth of
carriageway (m)
Has kerbed central
reserve
Width of kerbed central
reserve (m)
Has right
turn bay
Width For Right
Turn (m)
Visibility For Right
Turn (m)Blocks?
Blocking Queue
(PCU)
A 6.65 0.00 2.20 120.00 ü 1.00
C 6.65 0.00 2.20 120.00 ü 1.00
ArmMinor
Arm Type
Lane
Width
(m)
Lane
Width
(Left) (m)
Lane
Width
(Right) (m)
Width at
give-way
(m)
Width at
5m (m)
Width at
10m (m)
Width at
15m (m)
Width at
20m (m)
Estimate
Flare
Length
Flare
Length
(PCU)
Visibility To
Left (m)
Visibility To
Right (m)
B
One lane
plus
flare
10.00 4.64 3.80 3.75 3.58 ü 1.00 30 18
D
One lane
plus
flare
10.00 4.64 2.88 2.75 2.75 ü 1.00 24 21
Junction StreamIntercept
(PCU/hr)
Slope
for
A-B
Slope
for
A-C
Slope
for
A-D
Slope
for
B-C
Slope
for
B-D
Slope
for
C-A
Slope
for
C-B
Slope
for
C-D
Slope
for
D-A
Slope
for
D-B
1 AB-D 643.457 - - - - - 0.242 0.242 0.242 - -
1 B-A 562.188 0.099 0.252 0.252 - - 0.158 0.359 - 0.158 0.359
1 B-CD 634.673 0.095 0.239 0.239 - - - - - - -
1 CD-B 643.457 0.242 0.242 0.242 - - - - - - -
1 D-AB 664.026 - - - - - 0.250 0.250 0.099 - -
1 D-C 493.563 - 0.139 0.315 0.139 0.315 0.221 0.221 0.087 - -
Default
Vehicle
Mix
Vehicle
Mix Varies
Over Time
Vehicle
Mix Varies
Over Turn
Vehicle
Mix Varies
Over Entry
Vehicle Mix
Source
PCU
Factor
for a HV
(PCU)
Default
Turning
Proportions
Estimate
from
entry/exit
counts
Turning
Proportions
Vary Over Time
Turning
Proportions
Vary Over Turn
Turning
Proportions
Vary Over Entry
ü üHV
Percentages2.00 ü ü
Generated on 16/09/2014 10:49:00 using Junctions 8 (8.0.4.487)
43

Entry Flows
General Flows Data
Turning Proportions
Turning Counts / Proportions (PCU/hr) - Junction 1 (for whole period)
Turning Proportions (PCU) - Junction 1 (for whole period)
Vehicle Mix
Average PCU Per Vehicle - Junction 1 (for whole period)
Heavy Vehicle Percentages - Junction 1 (for whole period)
Arm Profile Type Use Turning Counts Average Demand Flow (PCU/hr) Flow Scaling Factor (%)
A ONE HOUR ü 511.00 100.000
B ONE HOUR ü 331.00 100.000
C ONE HOUR ü 310.00 100.000
D ONE HOUR ü 66.00 100.000
To
From
A B C D
A 0.000 297.000 183.000 31.000
B 261.000 0.000 18.000 52.000
C 250.000 37.000 0.000 23.000
D 31.000 22.000 13.000 0.000
To
From
A B C D
A 0.00 0.58 0.36 0.06
B 0.79 0.00 0.05 0.16
C 0.81 0.12 0.00 0.07
D 0.47 0.33 0.20 0.00
To
From
A B C D
A 1.000 1.000 1.000 1.000
B 1.000 1.000 1.000 1.000
C 1.000 1.000 1.000 1.000
D 1.000 1.000 1.000 1.000
To
From
A B C D
A 0.0 0.0 0.0 0.0
B 0.0 0.0 0.0 0.0
C 0.0 0.0 0.0 0.0
D 0.0 0.0 0.0 0.0
Generated on 16/09/2014 10:49:00 using Junctions 8 (8.0.4.487)
44
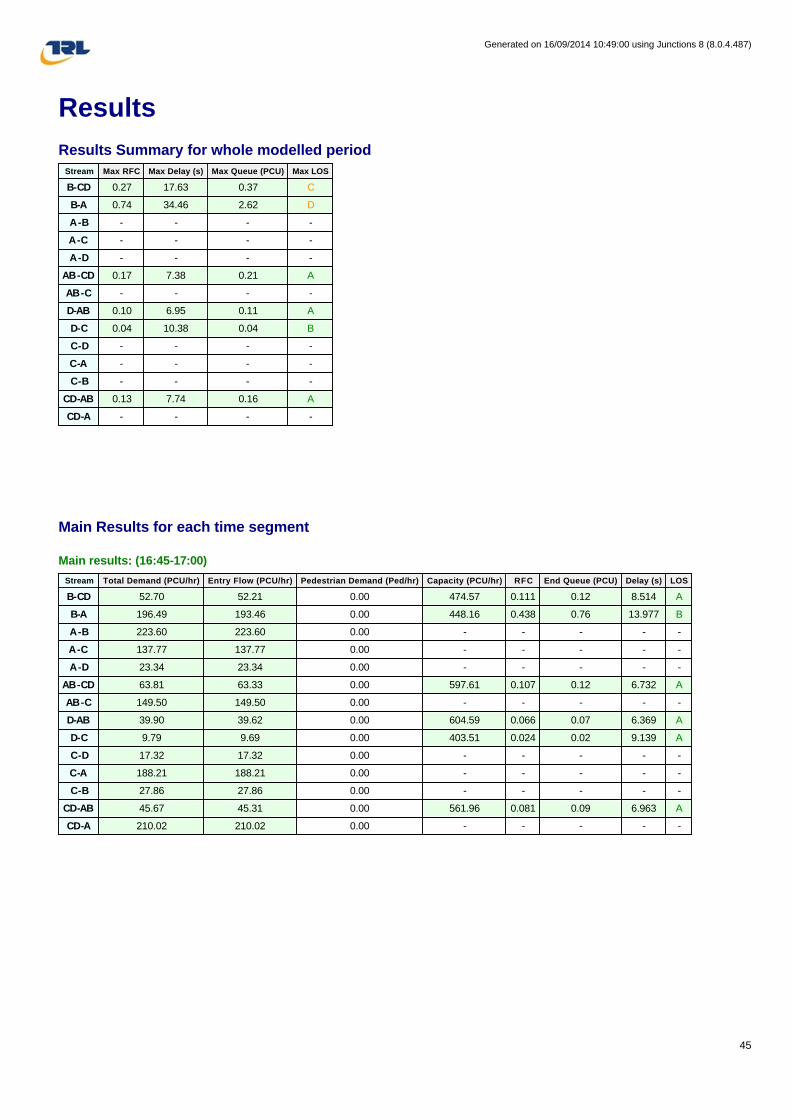
Results
Results Summary for whole modelled period
Main Results for each time segment
Main results: (16:45-17:00)
Stream Max RFC Max Delay (s) Max Queue (PCU) Max LOS
B-CD 0.27 17.63 0.37 C
B-A 0.74 34.46 2.62 D
A-B - - - -
A-C - - - -
A-D - - - -
AB-CD 0.17 7.38 0.21 A
AB-C - - - -
D-AB 0.10 6.95 0.11 A
D-C 0.04 10.38 0.04 B
C-D - - - -
C-A - - - -
C-B - - - -
CD-AB 0.13 7.74 0.16 A
CD-A - - - -
Stream Total Demand (PCU/hr) Entry Flow (PCU/hr) Pedestrian Demand (Ped/hr) Capacity (PCU/hr) RFC End Queue (PCU) Delay (s) LOS
B-CD 52.70 52.21 0.00 474.57 0.111 0.12 8.514 A
B-A 196.49 193.46 0.00 448.16 0.438 0.76 13.977 B
A-B 223.60 223.60 0.00 - - - - -
A-C 137.77 137.77 0.00 - - - - -
A-D 23.34 23.34 0.00 - - - - -
AB-CD 63.81 63.33 0.00 597.61 0.107 0.12 6.732 A
AB-C 149.50 149.50 0.00 - - - - -
D-AB 39.90 39.62 0.00 604.59 0.066 0.07 6.369 A
D-C 9.79 9.69 0.00 403.51 0.024 0.02 9.139 A
C-D 17.32 17.32 0.00 - - - - -
C-A 188.21 188.21 0.00 - - - - -
C-B 27.86 27.86 0.00 - - - - -
CD-AB 45.67 45.31 0.00 561.96 0.081 0.09 6.963 A
CD-A 210.02 210.02 0.00 - - - - -
Generated on 16/09/2014 10:49:00 using Junctions 8 (8.0.4.487)
45

Main results: (17:00-17:15)
Main results: (17:15-17:30)
Main results: (17:30-17:45)
Stream Total Demand (PCU/hr) Entry Flow (PCU/hr) Pedestrian Demand (Ped/hr) Capacity (PCU/hr) RFC End Queue (PCU) Delay (s) LOS
B-CD 62.93 62.71 0.00 411.80 0.153 0.18 10.306 B
B-A 234.63 232.93 0.00 424.51 0.553 1.18 18.618 C
A-B 267.00 267.00 0.00 - - - - -
A-C 164.51 164.51 0.00 - - - - -
A-D 27.87 27.87 0.00 - - - - -
AB-CD 77.47 77.34 0.00 591.62 0.131 0.15 6.998 A
AB-C 177.62 177.62 0.00 - - - - -
D-AB 47.65 47.58 0.00 592.86 0.080 0.09 6.602 A
D-C 11.69 11.66 0.00 385.73 0.030 0.03 9.624 A
C-D 20.68 20.68 0.00 - - - - -
C-A 224.74 224.74 0.00 - - - - -
C-B 33.26 33.26 0.00 - - - - -
CD-AB 55.52 55.42 0.00 549.65 0.101 0.11 7.284 A
CD-A 250.07 250.07 0.00 - - - - -
Stream Total Demand (PCU/hr) Entry Flow (PCU/hr) Pedestrian Demand (Ped/hr) Capacity (PCU/hr) RFC End Queue (PCU) Delay (s) LOS
B-CD 77.07 76.38 0.00 290.75 0.265 0.35 16.738 C
B-A 287.37 282.18 0.00 390.14 0.737 2.48 31.877 D
A-B 327.00 327.00 0.00 - - - - -
A-C 201.49 201.49 0.00 - - - - -
A-D 34.13 34.13 0.00 - - - - -
AB-CD 96.67 96.47 0.00 584.96 0.165 0.20 7.368 A
AB-C 215.32 215.32 0.00 - - - - -
D-AB 58.35 58.25 0.00 576.60 0.101 0.11 6.942 A
D-C 14.31 14.27 0.00 361.33 0.040 0.04 10.371 B
C-D 25.32 25.32 0.00 - - - - -
C-A 275.26 275.26 0.00 - - - - -
C-B 40.74 40.74 0.00 - - - - -
CD-AB 69.99 69.82 0.00 534.98 0.131 0.16 7.737 A
CD-A 304.26 304.26 0.00 - - - - -
Stream Total Demand (PCU/hr) Entry Flow (PCU/hr) Pedestrian Demand (Ped/hr) Capacity (PCU/hr) RFC End Queue (PCU) Delay (s) LOS
B-CD 77.07 77.00 0.00 281.10 0.274 0.37 17.628 C
B-A 287.37 286.80 0.00 389.83 0.737 2.62 34.459 D
A-B 327.00 327.00 0.00 - - - - -
A-C 201.49 201.49 0.00 - - - - -
A-D 34.13 34.13 0.00 - - - - -
AB-CD 97.20 97.19 0.00 585.09 0.166 0.21 7.381 A
AB-C 215.42 215.42 0.00 - - - - -
D-AB 58.35 58.35 0.00 576.58 0.101 0.11 6.945 A
D-C 14.31 14.31 0.00 361.10 0.040 0.04 10.380 B
C-D 25.32 25.32 0.00 - - - - -
C-A 275.26 275.26 0.00 - - - - -
C-B 40.74 40.74 0.00 - - - - -
CD-AB 70.04 70.03 0.00 535.01 0.131 0.16 7.744 A
CD-A 304.31 304.31 0.00 - - - - -
Generated on 16/09/2014 10:49:00 using Junctions 8 (8.0.4.487)
46
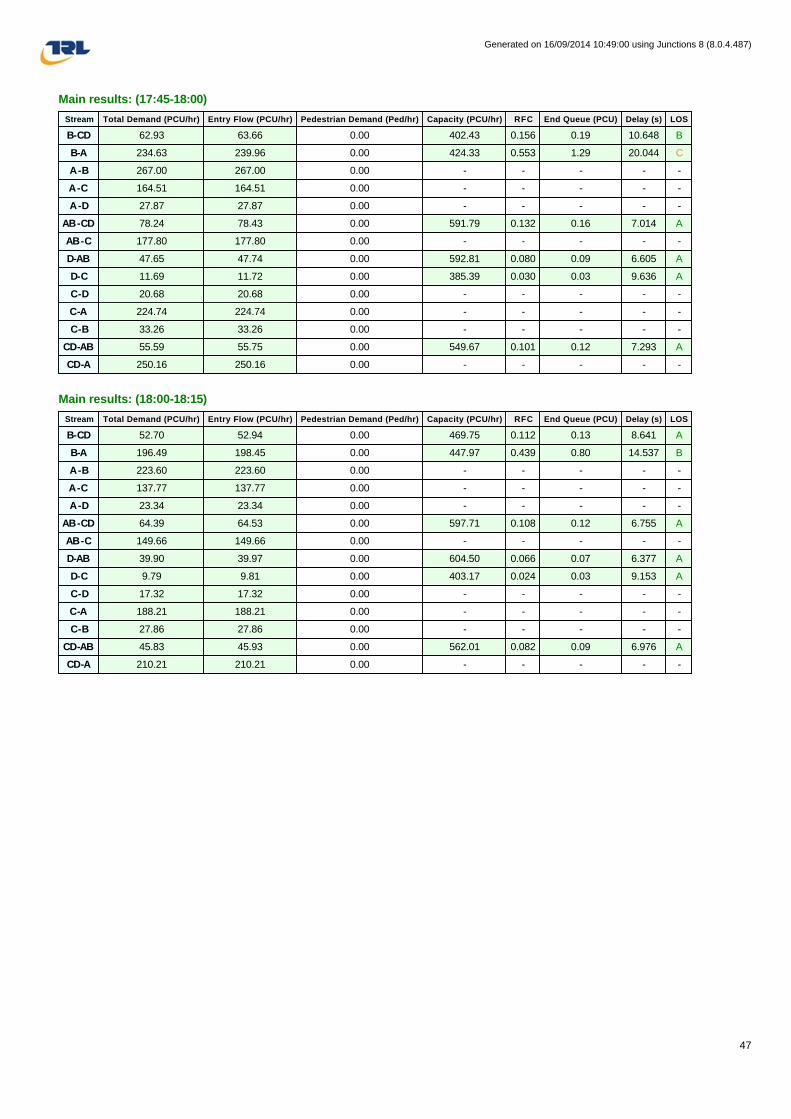
Main results: (17:45-18:00)
Main results: (18:00-18:15)
Stream Total Demand (PCU/hr) Entry Flow (PCU/hr) Pedestrian Demand (Ped/hr) Capacity (PCU/hr) RFC End Queue (PCU) Delay (s) LOS
B-CD 62.93 63.66 0.00 402.43 0.156 0.19 10.648 B
B-A 234.63 239.96 0.00 424.33 0.553 1.29 20.044 C
A-B 267.00 267.00 0.00 - - - - -
A-C 164.51 164.51 0.00 - - - - -
A-D 27.87 27.87 0.00 - - - - -
AB-CD 78.24 78.43 0.00 591.79 0.132 0.16 7.014 A
AB-C 177.80 177.80 0.00 - - - - -
D-AB 47.65 47.74 0.00 592.81 0.080 0.09 6.605 A
D-C 11.69 11.72 0.00 385.39 0.030 0.03 9.636 A
C-D 20.68 20.68 0.00 - - - - -
C-A 224.74 224.74 0.00 - - - - -
C-B 33.26 33.26 0.00 - - - - -
CD-AB 55.59 55.75 0.00 549.67 0.101 0.12 7.293 A
CD-A 250.16 250.16 0.00 - - - - -
Stream Total Demand (PCU/hr) Entry Flow (PCU/hr) Pedestrian Demand (Ped/hr) Capacity (PCU/hr) RFC End Queue (PCU) Delay (s) LOS
B-CD 52.70 52.94 0.00 469.75 0.112 0.13 8.641 A
B-A 196.49 198.45 0.00 447.97 0.439 0.80 14.537 B
A-B 223.60 223.60 0.00 - - - - -
A-C 137.77 137.77 0.00 - - - - -
A-D 23.34 23.34 0.00 - - - - -
AB-CD 64.39 64.53 0.00 597.71 0.108 0.12 6.755 A
AB-C 149.66 149.66 0.00 - - - - -
D-AB 39.90 39.97 0.00 604.50 0.066 0.07 6.377 A
D-C 9.79 9.81 0.00 403.17 0.024 0.03 9.153 A
C-D 17.32 17.32 0.00 - - - - -
C-A 188.21 188.21 0.00 - - - - -
C-B 27.86 27.86 0.00 - - - - -
CD-AB 45.83 45.93 0.00 562.01 0.082 0.09 6.976 A
CD-A 210.21 210.21 0.00 - - - - -
Generated on 16/09/2014 10:49:00 using Junctions 8 (8.0.4.487)
47
Appendix E – PARAMICS Traffic Flows

1
Reference Case AM

3
Reference Case PM

5
Development Case AM

7
Development Case PM

Appendix F – Additional PICADY Output

Filename: School Hill.Coleshill Road.arc8
Path: P:\C13742 Gladman Galley Common Nuneaton\Hydrock Docs\Transport\Junction Models
Report generation date: 16/09/2014 16:50:13
» (Default Analysis Set) - 2023 Base, AM » (Default Analysis Set) - 2023 Base, PM » (Default Analysis Set) - 2023 Base+Dev, AM » (Default Analysis Set) - 2023 Base+Dev, PM
Summary of junction performance
Values shown are the maximum values over all time segments. Delay is the maximum value of average delay per arriving vehicle.
"D1 - 2023 Base, AM " model duration: 08:00 - 09:30
"D2 - 2023 Base, PM" model duration: 17:00 - 18:30
"D3 - 2023 Base+Dev, AM" model duration: 08:00 - 09:30
"D4 - 2023 Base+Dev, PM" model duration: 17:00 - 18:30
Run using Junctions 8.0.4.487 at 16/09/2014 16:50:12
File summary
Junctions 8PICADY 8 - Priority Intersection Module
Version: 8.0.4.487 [15039,24/03/2014]
© Copyright TRL Limited, 2014
For sales and distribution information, program advice and maintenance, contact TRL:
Tel: +44 (0)1344 770758 email: [email protected] Web: http://www.trlsoftware.co.uk
The users of this computer program for the solution of an engineering problem are in no way relieved of their responsibility for the correctness of the solution
AM
Queue (PCU) Delay (s) RFC LOS
A1 - 2023 Base
Stream B-AC 23.29 188.25 0.99 F
Stream C-A - - - -
Stream C-B 0.05 7.95 0.05 A
Stream A-B - - - -
Stream A-C - - - -
Title School Hill/Colehill Road
Location
Site Number
Date 16/09/2014
Version
Status (new file)
Identifier
Client
Jobnumber C13742
Enumerator michaelchau
Description
Generated on 16/09/2014 16:50:16 using Junctions 8 (8.0.4.487)
1
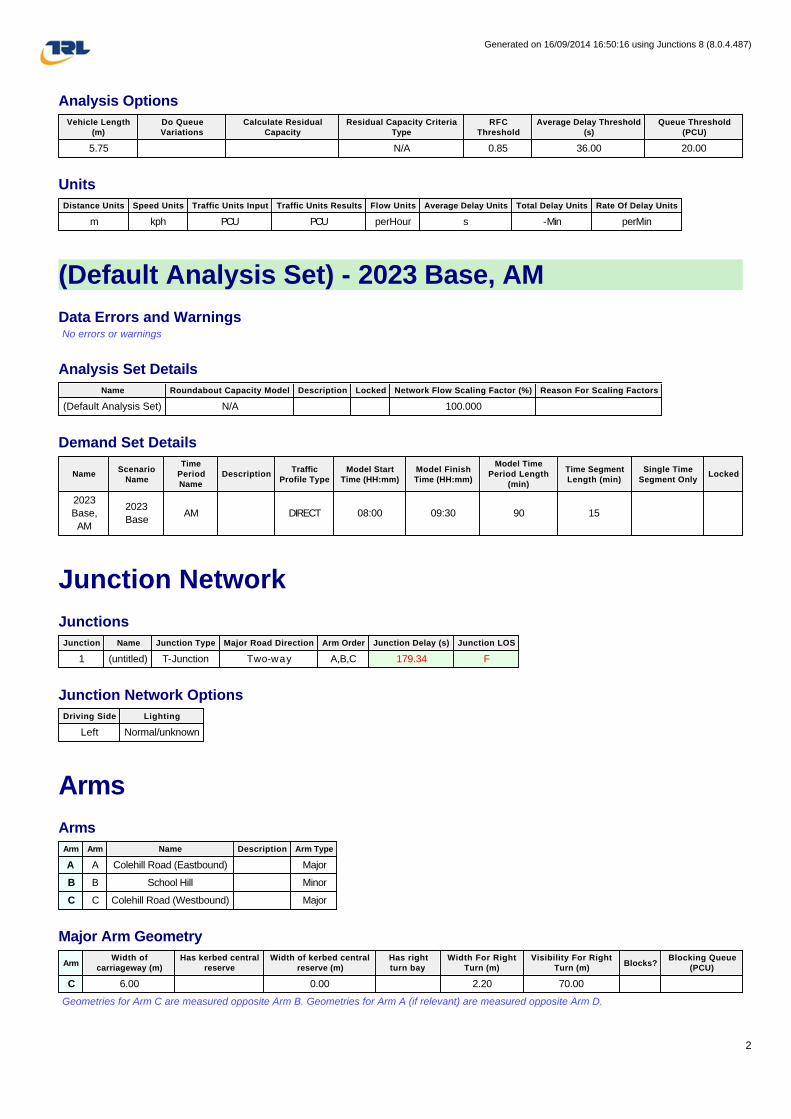
Analysis Options
Units
(Default Analysis Set) - 2023 Base, AM
Data Errors and Warnings No errors or warnings
Analysis Set Details
Demand Set Details
Junction Network
Junctions
Junction Network Options
Arms
Arms
Major Arm Geometry
Geometries for Arm C are measured opposite Arm B. Geometries for Arm A (if relevant) are measured opposite Arm D.
Vehicle Length
(m)
Do Queue
Variations
Calculate Residual
Capacity
Residual Capacity Criteria
Type
RFC
Threshold
Average Delay Threshold
(s)
Queue Threshold
(PCU)
5.75 N/A 0.85 36.00 20.00
Distance Units Speed Units Traffic Units Input Traffic Units Results Flow Units Average Delay Units Total Delay Units Rate Of Delay Units
m kph PCU PCU perHour s -Min perMin
Name Roundabout Capacity Model Description Locked Network Flow Scaling Factor (%) Reason For Scaling Factors
(Default Analysis Set) N/A 100.000
NameScenario
Name
Time
Period
Name
DescriptionTraffic
Profile Type
Model Start
Time (HH:mm)
Model Finish
Time (HH:mm)
Model Time
Period Length
(min)
Time Segment
Length (min)
Single Time
Segment OnlyLocked
2023
Base,
AM
2023
BaseAM DIRECT 08:00 09:30 90 15
Junction Name Junction Type Major Road Direction Arm Order Junction Delay (s) Junction LOS
1 (untitled) T-Junction Two-way A,B,C 179.34 F
Driving Side Lighting
Left Normal/unknown
Arm Arm Name Description Arm Type
A A Colehill Road (Eastbound) Major
B B School Hill Minor
C C Colehill Road (Westbound) Major
ArmWidth of
carriageway (m)
Has kerbed central
reserve
Width of kerbed central
reserve (m)
Has right
turn bay
Width For Right
Turn (m)
Visibility For Right
Turn (m)Blocks?
Blocking Queue
(PCU)
C 6.00 0.00 2.20 70.00
Generated on 16/09/2014 16:50:16 using Junctions 8 (8.0.4.487)
2
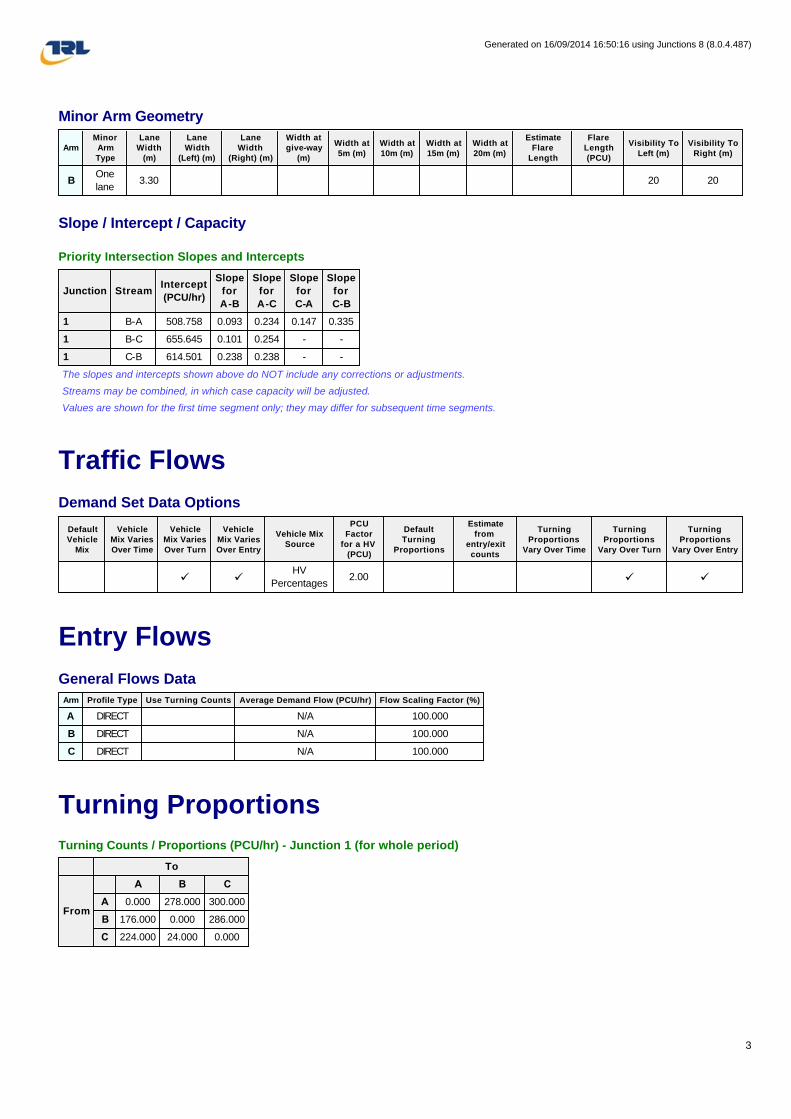
Minor Arm Geometry
Slope / Intercept / Capacity
Priority Intersection Slopes and Intercepts
The slopes and intercepts shown above do NOT include any corrections or adjustments.
Streams may be combined, in which case capacity will be adjusted.
Values are shown for the first time segment only; they may differ for subsequent time segments.
Traffic Flows
Demand Set Data Options
Entry Flows
General Flows Data
Turning Proportions
Turning Counts / Proportions (PCU/hr) - Junction 1 (for whole period)
Arm
Minor
Arm
Type
Lane
Width
(m)
Lane
Width
(Left) (m)
Lane
Width
(Right) (m)
Width at
give-way
(m)
Width at
5m (m)
Width at
10m (m)
Width at
15m (m)
Width at
20m (m)
Estimate
Flare
Length
Flare
Length
(PCU)
Visibility To
Left (m)
Visibility To
Right (m)
BOne
lane3.30 20 20
Junction StreamIntercept
(PCU/hr)
Slope
for
A-B
Slope
for
A-C
Slope
for
C-A
Slope
for
C-B
1 B-A 508.758 0.093 0.234 0.147 0.335
1 B-C 655.645 0.101 0.254 - -
1 C-B 614.501 0.238 0.238 - -
Default
Vehicle
Mix
Vehicle
Mix Varies
Over Time
Vehicle
Mix Varies
Over Turn
Vehicle
Mix Varies
Over Entry
Vehicle Mix
Source
PCU
Factor
for a HV
(PCU)
Default
Turning
Proportions
Estimate
from
entry/exit
counts
Turning
Proportions
Vary Over Time
Turning
Proportions
Vary Over Turn
Turning
Proportions
Vary Over Entry
ü üHV
Percentages2.00 ü ü
Arm Profile Type Use Turning Counts Average Demand Flow (PCU/hr) Flow Scaling Factor (%)
A DIRECT N/A 100.000
B DIRECT N/A 100.000
C DIRECT N/A 100.000
To
From
A B C
A 0.000 278.000 300.000
B 176.000 0.000 286.000
C 224.000 24.000 0.000
Generated on 16/09/2014 16:50:16 using Junctions 8 (8.0.4.487)
3
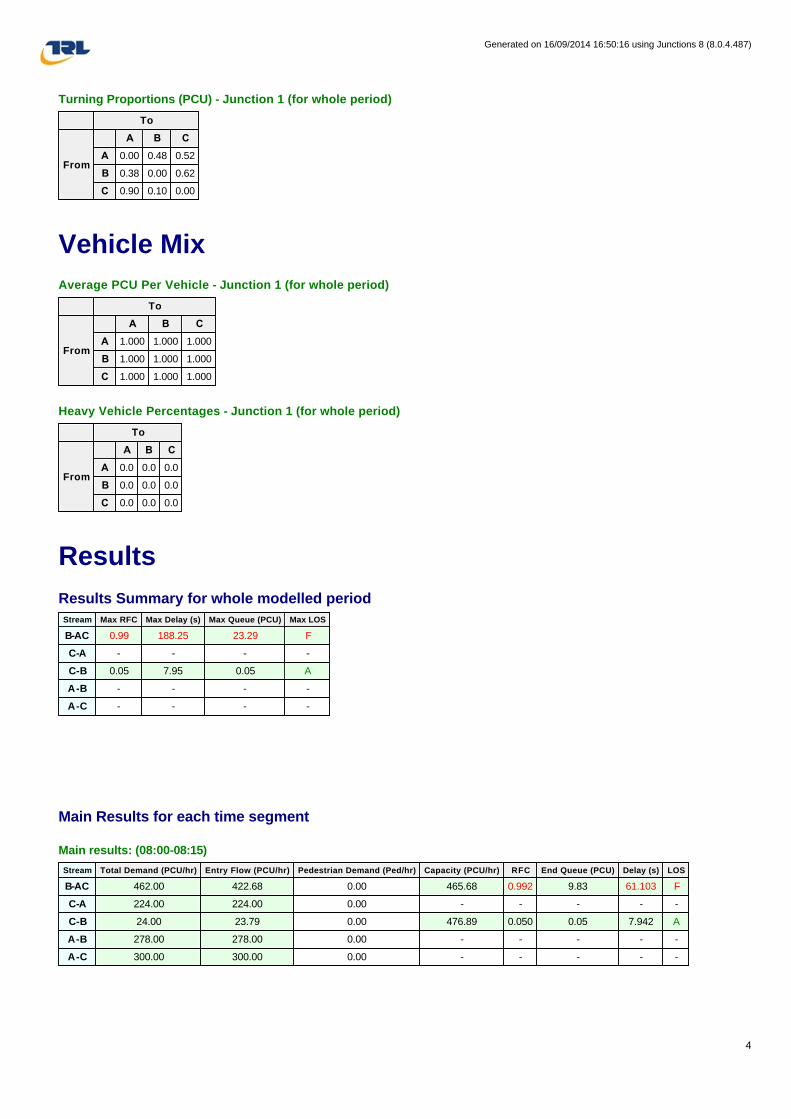
Turning Proportions (PCU) - Junction 1 (for whole period)
Vehicle Mix
Average PCU Per Vehicle - Junction 1 (for whole period)
Heavy Vehicle Percentages - Junction 1 (for whole period)
Results
Results Summary for whole modelled period
Main Results for each time segment
Main results: (08:00-08:15)
To
From
A B C
A 0.00 0.48 0.52
B 0.38 0.00 0.62
C 0.90 0.10 0.00
To
From
A B C
A 1.000 1.000 1.000
B 1.000 1.000 1.000
C 1.000 1.000 1.000
To
From
A B C
A 0.0 0.0 0.0
B 0.0 0.0 0.0
C 0.0 0.0 0.0
Stream Max RFC Max Delay (s) Max Queue (PCU) Max LOS
B-AC 0.99 188.25 23.29 F
C-A - - - -
C-B 0.05 7.95 0.05 A
A-B - - - -
A-C - - - -
Stream Total Demand (PCU/hr) Entry Flow (PCU/hr) Pedestrian Demand (Ped/hr) Capacity (PCU/hr) RFC End Queue (PCU) Delay (s) LOS
B-AC 462.00 422.68 0.00 465.68 0.992 9.83 61.103 F
C-A 224.00 224.00 0.00 - - - - -
C-B 24.00 23.79 0.00 476.89 0.050 0.05 7.942 A
A-B 278.00 278.00 0.00 - - - - -
A-C 300.00 300.00 0.00 - - - - -
Generated on 16/09/2014 16:50:16 using Junctions 8 (8.0.4.487)
4

Main results: (08:15-08:30)
Main results: (08:30-08:45)
Main results: (08:45-09:00)
Main results: (09:00-09:15)
Main results: (09:15-09:30)
(Default Analysis Set) - 2023 Base, PM
Data Errors and Warnings No errors or warnings
Analysis Set Details
Stream Total Demand (PCU/hr) Entry Flow (PCU/hr) Pedestrian Demand (Ped/hr) Capacity (PCU/hr) RFC End Queue (PCU) Delay (s) LOS
B-AC 462.00 445.92 0.00 465.64 0.992 13.85 111.430 F
C-A 224.00 224.00 0.00 - - - - -
C-B 24.00 24.00 0.00 476.89 0.050 0.05 7.948 A
A-B 278.00 278.00 0.00 - - - - -
A-C 300.00 300.00 0.00 - - - - -
Stream Total Demand (PCU/hr) Entry Flow (PCU/hr) Pedestrian Demand (Ped/hr) Capacity (PCU/hr) RFC End Queue (PCU) Delay (s) LOS
B-AC 462.00 450.04 0.00 465.64 0.992 16.84 136.739 F
C-A 224.00 224.00 0.00 - - - - -
C-B 24.00 24.00 0.00 476.89 0.050 0.05 7.948 A
A-B 278.00 278.00 0.00 - - - - -
A-C 300.00 300.00 0.00 - - - - -
Stream Total Demand (PCU/hr) Entry Flow (PCU/hr) Pedestrian Demand (Ped/hr) Capacity (PCU/hr) RFC End Queue (PCU) Delay (s) LOS
B-AC 462.00 452.17 0.00 465.64 0.992 19.30 156.620 F
C-A 224.00 224.00 0.00 - - - - -
C-B 24.00 24.00 0.00 476.89 0.050 0.05 7.948 A
A-B 278.00 278.00 0.00 - - - - -
A-C 300.00 300.00 0.00 - - - - -
Stream Total Demand (PCU/hr) Entry Flow (PCU/hr) Pedestrian Demand (Ped/hr) Capacity (PCU/hr) RFC End Queue (PCU) Delay (s) LOS
B-AC 462.00 453.53 0.00 465.64 0.992 21.41 173.455 F
C-A 224.00 224.00 0.00 - - - - -
C-B 24.00 24.00 0.00 476.89 0.050 0.05 7.948 A
A-B 278.00 278.00 0.00 - - - - -
A-C 300.00 300.00 0.00 - - - - -
Stream Total Demand (PCU/hr) Entry Flow (PCU/hr) Pedestrian Demand (Ped/hr) Capacity (PCU/hr) RFC End Queue (PCU) Delay (s) LOS
B-AC 462.00 454.49 0.00 465.64 0.992 23.29 188.248 F
C-A 224.00 224.00 0.00 - - - - -
C-B 24.00 24.00 0.00 476.89 0.050 0.05 7.948 A
A-B 278.00 278.00 0.00 - - - - -
A-C 300.00 300.00 0.00 - - - - -
Name Roundabout Capacity Model Description Locked Network Flow Scaling Factor (%) Reason For Scaling Factors
(Default Analysis Set) N/A 100.000
Generated on 16/09/2014 16:50:16 using Junctions 8 (8.0.4.487)
5
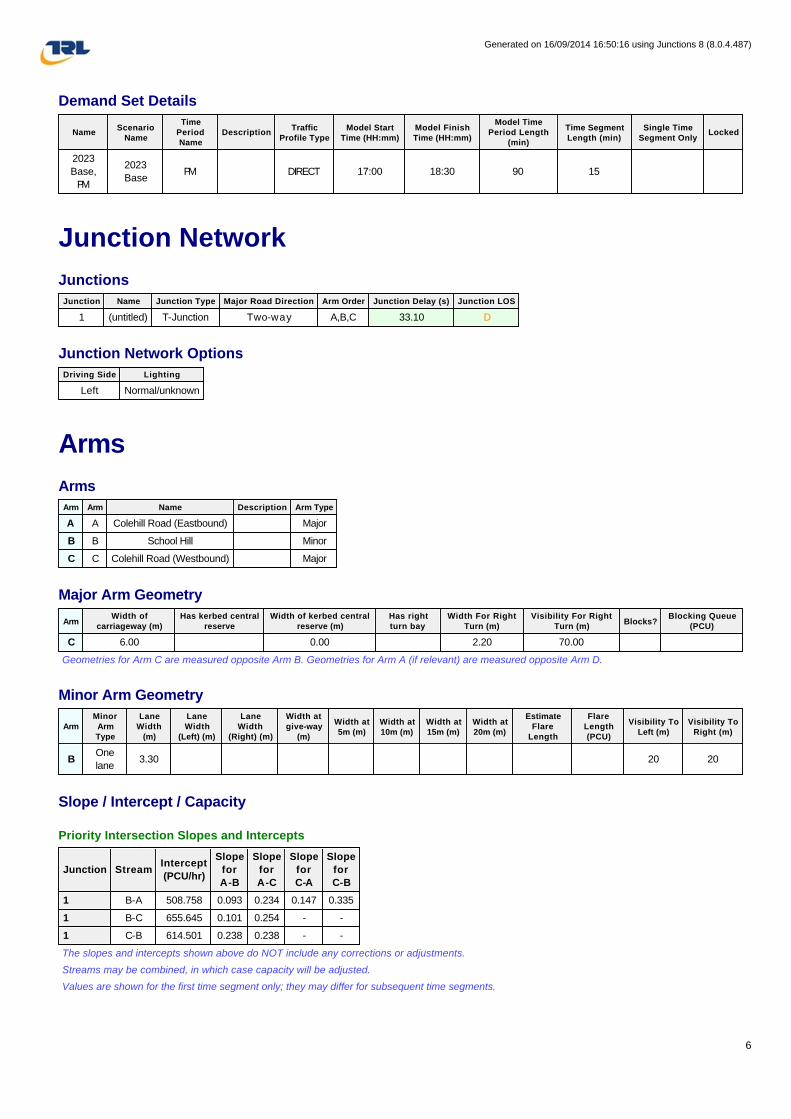
Demand Set Details
Junction Network
Junctions
Junction Network Options
Arms
Arms
Major Arm Geometry
Geometries for Arm C are measured opposite Arm B. Geometries for Arm A (if relevant) are measured opposite Arm D.
Minor Arm Geometry
Slope / Intercept / Capacity
Priority Intersection Slopes and Intercepts
The slopes and intercepts shown above do NOT include any corrections or adjustments.
Streams may be combined, in which case capacity will be adjusted.
Values are shown for the first time segment only; they may differ for subsequent time segments.
NameScenario
Name
Time
Period
Name
DescriptionTraffic
Profile Type
Model Start
Time (HH:mm)
Model Finish
Time (HH:mm)
Model Time
Period Length
(min)
Time Segment
Length (min)
Single Time
Segment OnlyLocked
2023
Base,
PM
2023
BasePM DIRECT 17:00 18:30 90 15
Junction Name Junction Type Major Road Direction Arm Order Junction Delay (s) Junction LOS
1 (untitled) T-Junction Two-way A,B,C 33.10 D
Driving Side Lighting
Left Normal/unknown
Arm Arm Name Description Arm Type
A A Colehill Road (Eastbound) Major
B B School Hill Minor
C C Colehill Road (Westbound) Major
ArmWidth of
carriageway (m)
Has kerbed central
reserve
Width of kerbed central
reserve (m)
Has right
turn bay
Width For Right
Turn (m)
Visibility For Right
Turn (m)Blocks?
Blocking Queue
(PCU)
C 6.00 0.00 2.20 70.00
Arm
Minor
Arm
Type
Lane
Width
(m)
Lane
Width
(Left) (m)
Lane
Width
(Right) (m)
Width at
give-way
(m)
Width at
5m (m)
Width at
10m (m)
Width at
15m (m)
Width at
20m (m)
Estimate
Flare
Length
Flare
Length
(PCU)
Visibility To
Left (m)
Visibility To
Right (m)
BOne
lane3.30 20 20
Junction StreamIntercept
(PCU/hr)
Slope
for
A-B
Slope
for
A-C
Slope
for
C-A
Slope
for
C-B
1 B-A 508.758 0.093 0.234 0.147 0.335
1 B-C 655.645 0.101 0.254 - -
1 C-B 614.501 0.238 0.238 - -
Generated on 16/09/2014 16:50:16 using Junctions 8 (8.0.4.487)
6
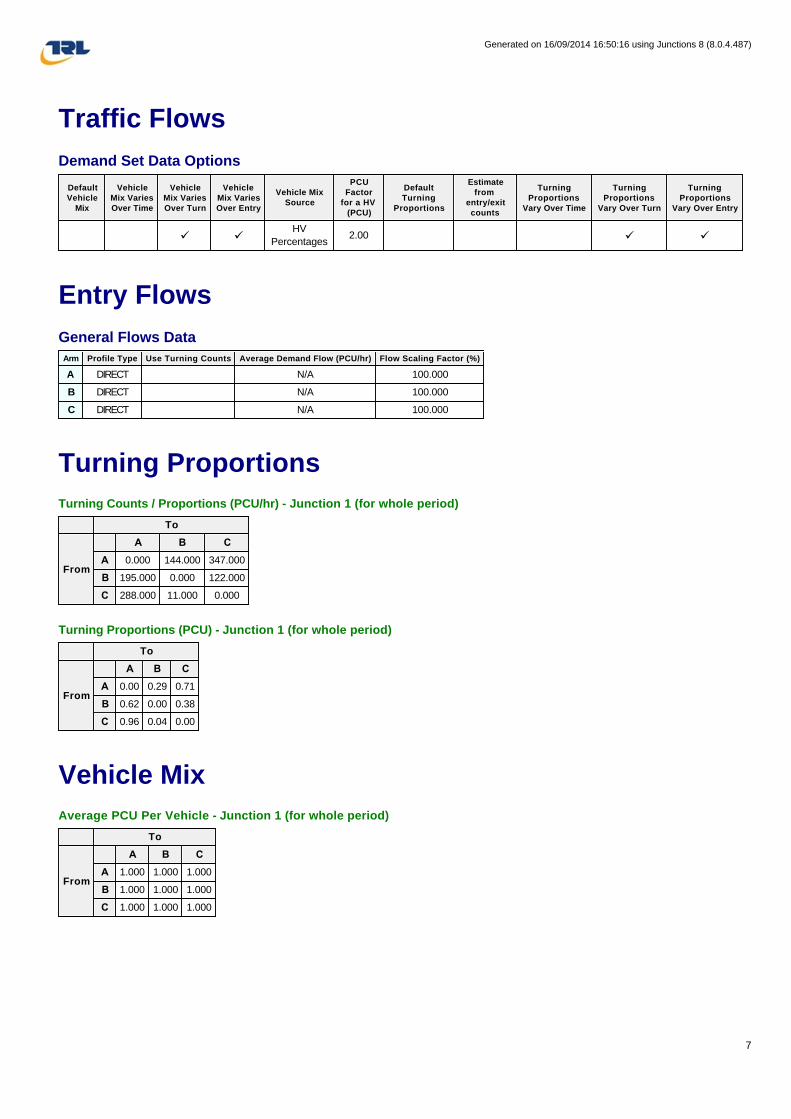
Traffic Flows
Demand Set Data Options
Entry Flows
General Flows Data
Turning Proportions
Turning Counts / Proportions (PCU/hr) - Junction 1 (for whole period)
Turning Proportions (PCU) - Junction 1 (for whole period)
Vehicle Mix
Average PCU Per Vehicle - Junction 1 (for whole period)
Default
Vehicle
Mix
Vehicle
Mix Varies
Over Time
Vehicle
Mix Varies
Over Turn
Vehicle
Mix Varies
Over Entry
Vehicle Mix
Source
PCU
Factor
for a HV
(PCU)
Default
Turning
Proportions
Estimate
from
entry/exit
counts
Turning
Proportions
Vary Over Time
Turning
Proportions
Vary Over Turn
Turning
Proportions
Vary Over Entry
ü üHV
Percentages2.00 ü ü
Arm Profile Type Use Turning Counts Average Demand Flow (PCU/hr) Flow Scaling Factor (%)
A DIRECT N/A 100.000
B DIRECT N/A 100.000
C DIRECT N/A 100.000
To
From
A B C
A 0.000 144.000 347.000
B 195.000 0.000 122.000
C 288.000 11.000 0.000
To
From
A B C
A 0.00 0.29 0.71
B 0.62 0.00 0.38
C 0.96 0.04 0.00
To
From
A B C
A 1.000 1.000 1.000
B 1.000 1.000 1.000
C 1.000 1.000 1.000
Generated on 16/09/2014 16:50:16 using Junctions 8 (8.0.4.487)
7

Heavy Vehicle Percentages - Junction 1 (for whole period)
Results
Results Summary for whole modelled period
Main Results for each time segment
Main results: (17:00-17:15)
Main results: (17:15-17:30)
Main results: (17:30-17:45)
To
From
A B C
A 0.0 0.0 0.0
B 0.0 0.0 0.0
C 0.0 0.0 0.0
Stream Max RFC Max Delay (s) Max Queue (PCU) Max LOS
B-AC 0.75 33.99 2.94 D
C-A - - - -
C-B 0.02 7.40 0.02 A
A-B - - - -
A-C - - - -
Stream Total Demand (PCU/hr) Entry Flow (PCU/hr) Pedestrian Demand (Ped/hr) Capacity (PCU/hr) RFC End Queue (PCU) Delay (s) LOS
B-AC 317.00 306.43 0.00 422.41 0.750 2.64 28.906 D
C-A 288.00 288.00 0.00 - - - - -
C-B 11.00 10.91 0.00 497.60 0.022 0.02 7.397 A
A-B 144.00 144.00 0.00 - - - - -
A-C 347.00 347.00 0.00 - - - - -
Stream Total Demand (PCU/hr) Entry Flow (PCU/hr) Pedestrian Demand (Ped/hr) Capacity (PCU/hr) RFC End Queue (PCU) Delay (s) LOS
B-AC 317.00 316.35 0.00 422.38 0.751 2.81 33.445 D
C-A 288.00 288.00 0.00 - - - - -
C-B 11.00 11.00 0.00 497.60 0.022 0.02 7.397 A
A-B 144.00 144.00 0.00 - - - - -
A-C 347.00 347.00 0.00 - - - - -
Stream Total Demand (PCU/hr) Entry Flow (PCU/hr) Pedestrian Demand (Ped/hr) Capacity (PCU/hr) RFC End Queue (PCU) Delay (s) LOS
B-AC 317.00 316.75 0.00 422.38 0.751 2.87 33.762 D
C-A 288.00 288.00 0.00 - - - - -
C-B 11.00 11.00 0.00 497.60 0.022 0.02 7.397 A
A-B 144.00 144.00 0.00 - - - - -
A-C 347.00 347.00 0.00 - - - - -
Generated on 16/09/2014 16:50:16 using Junctions 8 (8.0.4.487)
8
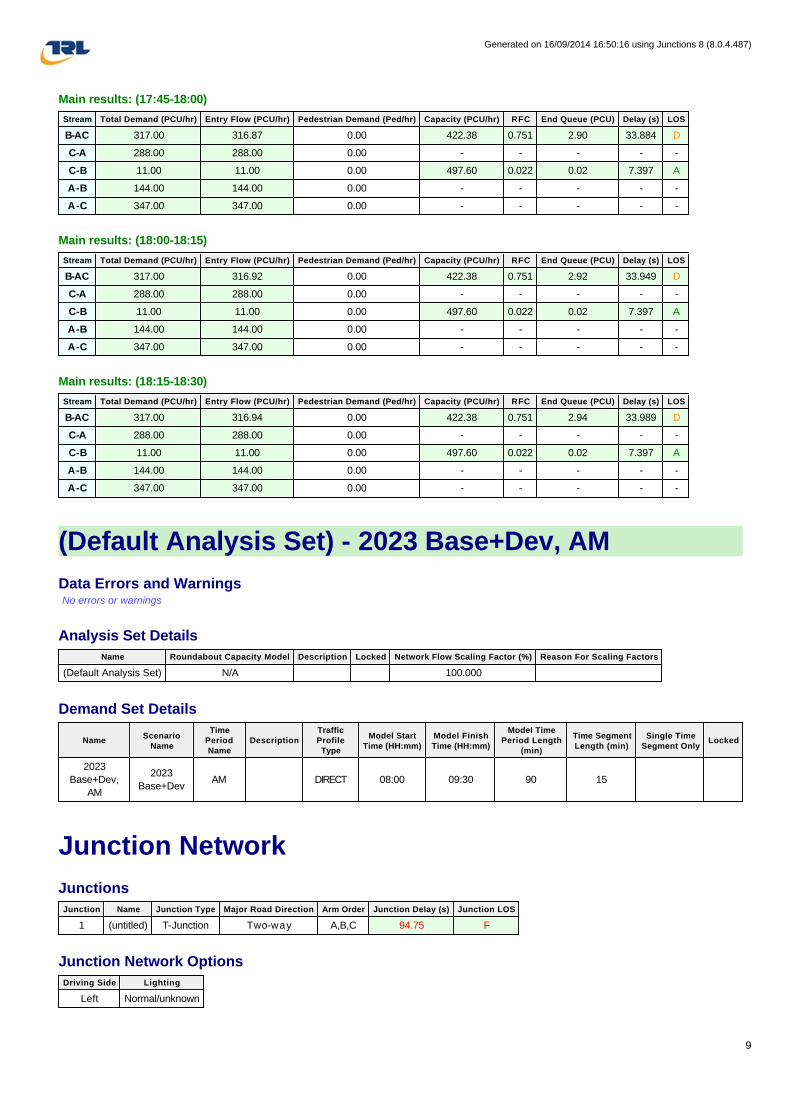
Main results: (17:45-18:00)
Main results: (18:00-18:15)
Main results: (18:15-18:30)
(Default Analysis Set) - 2023 Base+Dev, AM
Data Errors and Warnings No errors or warnings
Analysis Set Details
Demand Set Details
Junction Network
Junctions
Junction Network Options
Stream Total Demand (PCU/hr) Entry Flow (PCU/hr) Pedestrian Demand (Ped/hr) Capacity (PCU/hr) RFC End Queue (PCU) Delay (s) LOS
B-AC 317.00 316.87 0.00 422.38 0.751 2.90 33.884 D
C-A 288.00 288.00 0.00 - - - - -
C-B 11.00 11.00 0.00 497.60 0.022 0.02 7.397 A
A-B 144.00 144.00 0.00 - - - - -
A-C 347.00 347.00 0.00 - - - - -
Stream Total Demand (PCU/hr) Entry Flow (PCU/hr) Pedestrian Demand (Ped/hr) Capacity (PCU/hr) RFC End Queue (PCU) Delay (s) LOS
B-AC 317.00 316.92 0.00 422.38 0.751 2.92 33.949 D
C-A 288.00 288.00 0.00 - - - - -
C-B 11.00 11.00 0.00 497.60 0.022 0.02 7.397 A
A-B 144.00 144.00 0.00 - - - - -
A-C 347.00 347.00 0.00 - - - - -
Stream Total Demand (PCU/hr) Entry Flow (PCU/hr) Pedestrian Demand (Ped/hr) Capacity (PCU/hr) RFC End Queue (PCU) Delay (s) LOS
B-AC 317.00 316.94 0.00 422.38 0.751 2.94 33.989 D
C-A 288.00 288.00 0.00 - - - - -
C-B 11.00 11.00 0.00 497.60 0.022 0.02 7.397 A
A-B 144.00 144.00 0.00 - - - - -
A-C 347.00 347.00 0.00 - - - - -
Name Roundabout Capacity Model Description Locked Network Flow Scaling Factor (%) Reason For Scaling Factors
(Default Analysis Set) N/A 100.000
NameScenario
Name
Time
Period
Name
Description
Traffic
Profile
Type
Model Start
Time (HH:mm)
Model Finish
Time (HH:mm)
Model Time
Period Length
(min)
Time Segment
Length (min)
Single Time
Segment OnlyLocked
2023
Base+Dev,
AM
2023
Base+DevAM DIRECT 08:00 09:30 90 15
Junction Name Junction Type Major Road Direction Arm Order Junction Delay (s) Junction LOS
1 (untitled) T-Junction Two-way A,B,C 94.75 F
Driving Side Lighting
Left Normal/unknown
Generated on 16/09/2014 16:50:16 using Junctions 8 (8.0.4.487)
9

Arms
Arms
Major Arm Geometry
Geometries for Arm C are measured opposite Arm B. Geometries for Arm A (if relevant) are measured opposite Arm D.
Minor Arm Geometry
Slope / Intercept / Capacity
Priority Intersection Slopes and Intercepts
The slopes and intercepts shown above do NOT include any corrections or adjustments.
Streams may be combined, in which case capacity will be adjusted.
Values are shown for the first time segment only; they may differ for subsequent time segments.
Traffic Flows
Demand Set Data Options
Arm Arm Name Description Arm Type
A A Colehill Road (Eastbound) Major
B B School Hill Minor
C C Colehill Road (Westbound) Major
ArmWidth of
carriageway (m)
Has kerbed central
reserve
Width of kerbed central
reserve (m)
Has right
turn bay
Width For Right
Turn (m)
Visibility For Right
Turn (m)Blocks?
Blocking Queue
(PCU)
C 6.00 0.00 2.20 70.00
Arm
Minor
Arm
Type
Lane
Width
(m)
Lane
Width
(Left) (m)
Lane
Width
(Right) (m)
Width at
give-way
(m)
Width at
5m (m)
Width at
10m (m)
Width at
15m (m)
Width at
20m (m)
Estimate
Flare
Length
Flare
Length
(PCU)
Visibility To
Left (m)
Visibility To
Right (m)
BOne
lane3.30 20 20
Junction StreamIntercept
(PCU/hr)
Slope
for
A-B
Slope
for
A-C
Slope
for
C-A
Slope
for
C-B
1 B-A 508.758 0.093 0.234 0.147 0.335
1 B-C 655.645 0.101 0.254 - -
1 C-B 614.501 0.238 0.238 - -
Default
Vehicle
Mix
Vehicle
Mix Varies
Over Time
Vehicle
Mix Varies
Over Turn
Vehicle
Mix Varies
Over Entry
Vehicle Mix
Source
PCU
Factor
for a HV
(PCU)
Default
Turning
Proportions
Estimate
from
entry/exit
counts
Turning
Proportions
Vary Over Time
Turning
Proportions
Vary Over Turn
Turning
Proportions
Vary Over Entry
ü üHV
Percentages2.00 ü ü
Generated on 16/09/2014 16:50:16 using Junctions 8 (8.0.4.487)
10
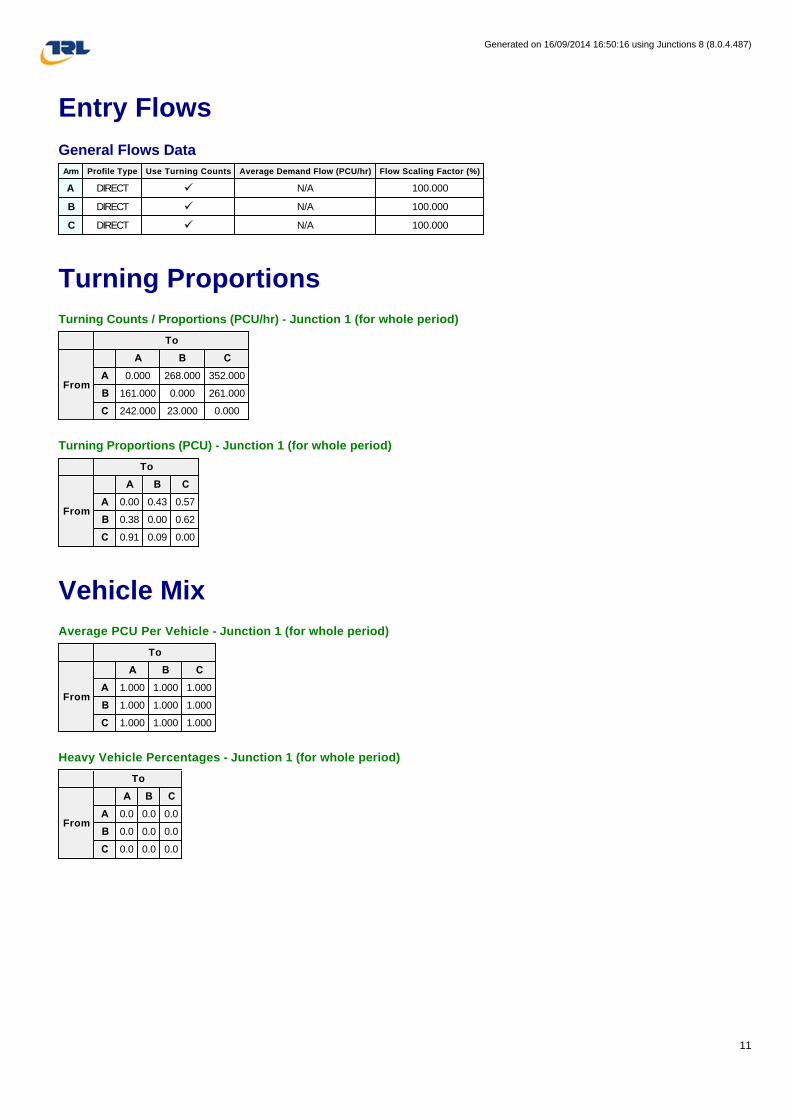
Entry Flows
General Flows Data
Turning Proportions
Turning Counts / Proportions (PCU/hr) - Junction 1 (for whole period)
Turning Proportions (PCU) - Junction 1 (for whole period)
Vehicle Mix
Average PCU Per Vehicle - Junction 1 (for whole period)
Heavy Vehicle Percentages - Junction 1 (for whole period)
Arm Profile Type Use Turning Counts Average Demand Flow (PCU/hr) Flow Scaling Factor (%)
A DIRECT ü N/A 100.000
B DIRECT ü N/A 100.000
C DIRECT ü N/A 100.000
To
From
A B C
A 0.000 268.000 352.000
B 161.000 0.000 261.000
C 242.000 23.000 0.000
To
From
A B C
A 0.00 0.43 0.57
B 0.38 0.00 0.62
C 0.91 0.09 0.00
To
From
A B C
A 1.000 1.000 1.000
B 1.000 1.000 1.000
C 1.000 1.000 1.000
To
From
A B C
A 0.0 0.0 0.0
B 0.0 0.0 0.0
C 0.0 0.0 0.0
Generated on 16/09/2014 16:50:16 using Junctions 8 (8.0.4.487)
11
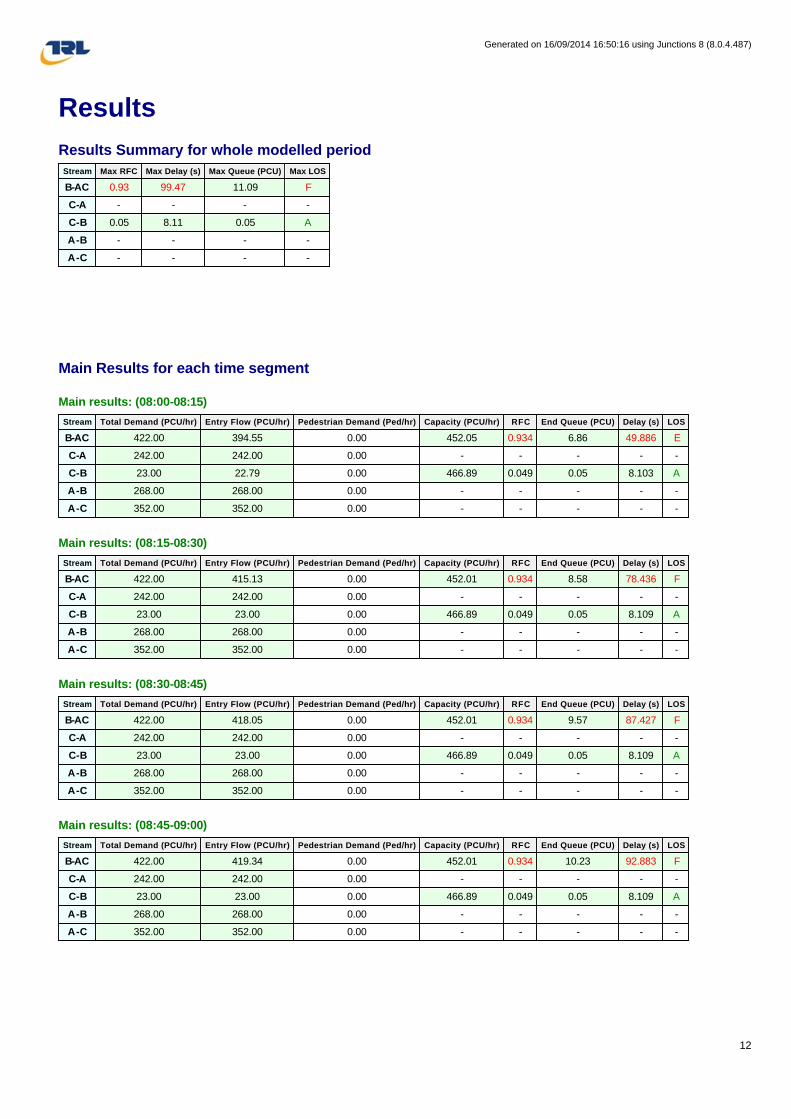
Results
Results Summary for whole modelled period
Main Results for each time segment
Main results: (08:00-08:15)
Main results: (08:15-08:30)
Main results: (08:30-08:45)
Main results: (08:45-09:00)
Stream Max RFC Max Delay (s) Max Queue (PCU) Max LOS
B-AC 0.93 99.47 11.09 F
C-A - - - -
C-B 0.05 8.11 0.05 A
A-B - - - -
A-C - - - -
Stream Total Demand (PCU/hr) Entry Flow (PCU/hr) Pedestrian Demand (Ped/hr) Capacity (PCU/hr) RFC End Queue (PCU) Delay (s) LOS
B-AC 422.00 394.55 0.00 452.05 0.934 6.86 49.886 E
C-A 242.00 242.00 0.00 - - - - -
C-B 23.00 22.79 0.00 466.89 0.049 0.05 8.103 A
A-B 268.00 268.00 0.00 - - - - -
A-C 352.00 352.00 0.00 - - - - -
Stream Total Demand (PCU/hr) Entry Flow (PCU/hr) Pedestrian Demand (Ped/hr) Capacity (PCU/hr) RFC End Queue (PCU) Delay (s) LOS
B-AC 422.00 415.13 0.00 452.01 0.934 8.58 78.436 F
C-A 242.00 242.00 0.00 - - - - -
C-B 23.00 23.00 0.00 466.89 0.049 0.05 8.109 A
A-B 268.00 268.00 0.00 - - - - -
A-C 352.00 352.00 0.00 - - - - -
Stream Total Demand (PCU/hr) Entry Flow (PCU/hr) Pedestrian Demand (Ped/hr) Capacity (PCU/hr) RFC End Queue (PCU) Delay (s) LOS
B-AC 422.00 418.05 0.00 452.01 0.934 9.57 87.427 F
C-A 242.00 242.00 0.00 - - - - -
C-B 23.00 23.00 0.00 466.89 0.049 0.05 8.109 A
A-B 268.00 268.00 0.00 - - - - -
A-C 352.00 352.00 0.00 - - - - -
Stream Total Demand (PCU/hr) Entry Flow (PCU/hr) Pedestrian Demand (Ped/hr) Capacity (PCU/hr) RFC End Queue (PCU) Delay (s) LOS
B-AC 422.00 419.34 0.00 452.01 0.934 10.23 92.883 F
C-A 242.00 242.00 0.00 - - - - -
C-B 23.00 23.00 0.00 466.89 0.049 0.05 8.109 A
A-B 268.00 268.00 0.00 - - - - -
A-C 352.00 352.00 0.00 - - - - -
Generated on 16/09/2014 16:50:16 using Junctions 8 (8.0.4.487)
12
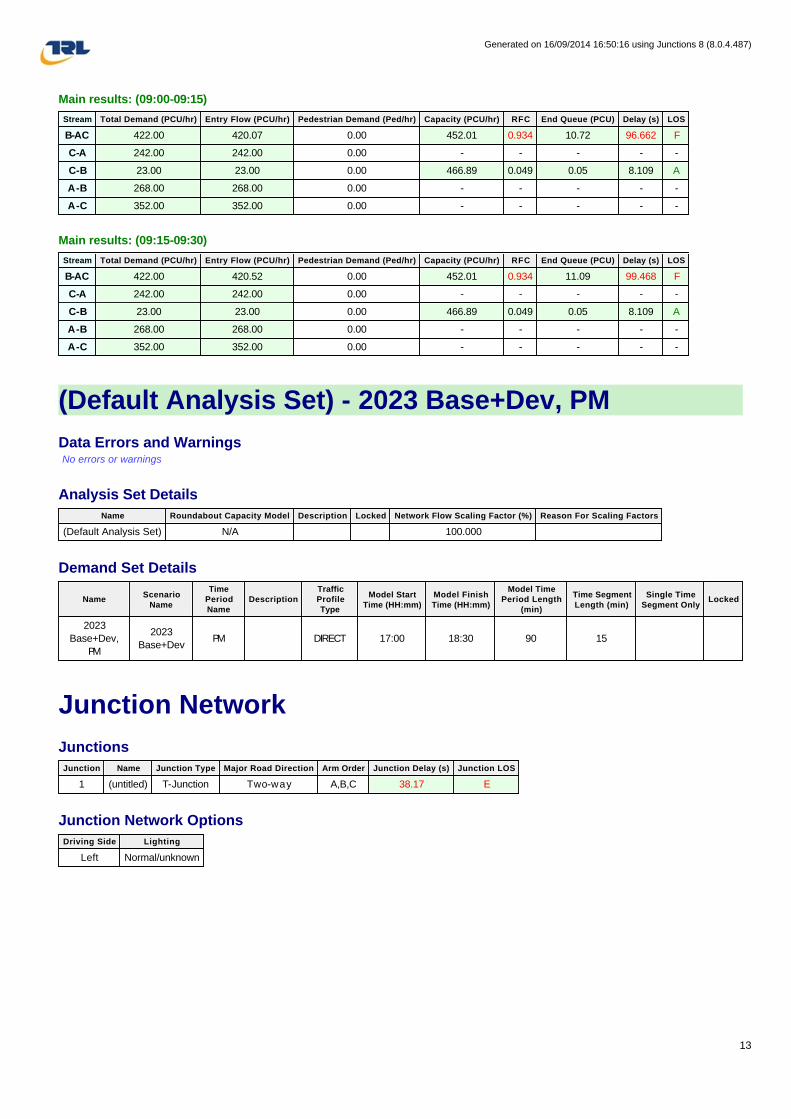
Main results: (09:00-09:15)
Main results: (09:15-09:30)
(Default Analysis Set) - 2023 Base+Dev, PM
Data Errors and Warnings No errors or warnings
Analysis Set Details
Demand Set Details
Junction Network
Junctions
Junction Network Options
Stream Total Demand (PCU/hr) Entry Flow (PCU/hr) Pedestrian Demand (Ped/hr) Capacity (PCU/hr) RFC End Queue (PCU) Delay (s) LOS
B-AC 422.00 420.07 0.00 452.01 0.934 10.72 96.662 F
C-A 242.00 242.00 0.00 - - - - -
C-B 23.00 23.00 0.00 466.89 0.049 0.05 8.109 A
A-B 268.00 268.00 0.00 - - - - -
A-C 352.00 352.00 0.00 - - - - -
Stream Total Demand (PCU/hr) Entry Flow (PCU/hr) Pedestrian Demand (Ped/hr) Capacity (PCU/hr) RFC End Queue (PCU) Delay (s) LOS
B-AC 422.00 420.52 0.00 452.01 0.934 11.09 99.468 F
C-A 242.00 242.00 0.00 - - - - -
C-B 23.00 23.00 0.00 466.89 0.049 0.05 8.109 A
A-B 268.00 268.00 0.00 - - - - -
A-C 352.00 352.00 0.00 - - - - -
Name Roundabout Capacity Model Description Locked Network Flow Scaling Factor (%) Reason For Scaling Factors
(Default Analysis Set) N/A 100.000
NameScenario
Name
Time
Period
Name
Description
Traffic
Profile
Type
Model Start
Time (HH:mm)
Model Finish
Time (HH:mm)
Model Time
Period Length
(min)
Time Segment
Length (min)
Single Time
Segment OnlyLocked
2023
Base+Dev,
PM
2023
Base+DevPM DIRECT 17:00 18:30 90 15
Junction Name Junction Type Major Road Direction Arm Order Junction Delay (s) Junction LOS
1 (untitled) T-Junction Two-way A,B,C 38.17 E
Driving Side Lighting
Left Normal/unknown
Generated on 16/09/2014 16:50:16 using Junctions 8 (8.0.4.487)
13

Arms
Arms
Major Arm Geometry
Geometries for Arm C are measured opposite Arm B. Geometries for Arm A (if relevant) are measured opposite Arm D.
Minor Arm Geometry
Slope / Intercept / Capacity
Priority Intersection Slopes and Intercepts
The slopes and intercepts shown above do NOT include any corrections or adjustments.
Streams may be combined, in which case capacity will be adjusted.
Values are shown for the first time segment only; they may differ for subsequent time segments.
Traffic Flows
Demand Set Data Options
Entry Flows
General Flows Data
Arm Arm Name Description Arm Type
A A Colehill Road (Eastbound) Major
B B School Hill Minor
C C Colehill Road (Westbound) Major
ArmWidth of
carriageway (m)
Has kerbed central
reserve
Width of kerbed central
reserve (m)
Has right
turn bay
Width For Right
Turn (m)
Visibility For Right
Turn (m)Blocks?
Blocking Queue
(PCU)
C 6.00 0.00 2.20 70.00
Arm
Minor
Arm
Type
Lane
Width
(m)
Lane
Width
(Left) (m)
Lane
Width
(Right) (m)
Width at
give-way
(m)
Width at
5m (m)
Width at
10m (m)
Width at
15m (m)
Width at
20m (m)
Estimate
Flare
Length
Flare
Length
(PCU)
Visibility To
Left (m)
Visibility To
Right (m)
BOne
lane3.30 20 20
Junction StreamIntercept
(PCU/hr)
Slope
for
A-B
Slope
for
A-C
Slope
for
C-A
Slope
for
C-B
1 B-A 508.758 0.093 0.234 0.147 0.335
1 B-C 655.645 0.101 0.254 - -
1 C-B 614.501 0.238 0.238 - -
Default
Vehicle
Mix
Vehicle
Mix Varies
Over Time
Vehicle
Mix Varies
Over Turn
Vehicle
Mix Varies
Over Entry
Vehicle Mix
Source
PCU
Factor
for a HV
(PCU)
Default
Turning
Proportions
Estimate
from
entry/exit
counts
Turning
Proportions
Vary Over Time
Turning
Proportions
Vary Over Turn
Turning
Proportions
Vary Over Entry
ü üHV
Percentages2.00 ü ü
Arm Profile Type Use Turning Counts Average Demand Flow (PCU/hr) Flow Scaling Factor (%)
A DIRECT N/A 100.000
B DIRECT N/A 100.000
C DIRECT N/A 100.000
Generated on 16/09/2014 16:50:16 using Junctions 8 (8.0.4.487)
14

Turning Proportions
Turning Counts / Proportions (PCU/hr) - Junction 1 (for whole period)
Turning Proportions (PCU) - Junction 1 (for whole period)
Vehicle Mix
Average PCU Per Vehicle - Junction 1 (for whole period)
Heavy Vehicle Percentages - Junction 1 (for whole period)
Results
Results Summary for whole modelled period
To
From
A B C
A 0.000 138.000 363.000
B 201.000 0.000 114.000
C 364.000 11.000 0.000
To
From
A B C
A 0.00 0.28 0.72
B 0.64 0.00 0.36
C 0.97 0.03 0.00
To
From
A B C
A 1.000 1.000 1.000
B 1.000 1.000 1.000
C 1.000 1.000 1.000
To
From
A B C
A 0.0 0.0 0.0
B 0.0 0.0 0.0
C 0.0 0.0 0.0
Stream Max RFC Max Delay (s) Max Queue (PCU) Max LOS
B-AC 0.78 39.25 3.35 E
C-A - - - -
C-B 0.02 7.44 0.02 A
A-B - - - -
A-C - - - -
Generated on 16/09/2014 16:50:16 using Junctions 8 (8.0.4.487)
15

Main Results for each time segment
Main results: (17:00-17:15)
Main results: (17:15-17:30)
Main results: (17:30-17:45)
Main results: (17:45-18:00)
Main results: (18:00-18:15)
Main results: (18:15-18:30)
Stream Total Demand (PCU/hr) Entry Flow (PCU/hr) Pedestrian Demand (Ped/hr) Capacity (PCU/hr) RFC End Queue (PCU) Delay (s) LOS
B-AC 315.00 303.20 0.00 406.02 0.776 2.95 32.138 D
C-A 364.00 364.00 0.00 - - - - -
C-B 11.00 10.91 0.00 495.22 0.022 0.02 7.433 A
A-B 138.00 138.00 0.00 - - - - -
A-C 363.00 363.00 0.00 - - - - -
Stream Total Demand (PCU/hr) Entry Flow (PCU/hr) Pedestrian Demand (Ped/hr) Capacity (PCU/hr) RFC End Queue (PCU) Delay (s) LOS
B-AC 315.00 314.11 0.00 406.00 0.776 3.17 38.311 E
C-A 364.00 364.00 0.00 - - - - -
C-B 11.00 11.00 0.00 495.22 0.022 0.02 7.433 A
A-B 138.00 138.00 0.00 - - - - -
A-C 363.00 363.00 0.00 - - - - -
Stream Total Demand (PCU/hr) Entry Flow (PCU/hr) Pedestrian Demand (Ped/hr) Capacity (PCU/hr) RFC End Queue (PCU) Delay (s) LOS
B-AC 315.00 314.65 0.00 406.00 0.776 3.26 38.845 E
C-A 364.00 364.00 0.00 - - - - -
C-B 11.00 11.00 0.00 495.22 0.022 0.02 7.433 A
A-B 138.00 138.00 0.00 - - - - -
A-C 363.00 363.00 0.00 - - - - -
Stream Total Demand (PCU/hr) Entry Flow (PCU/hr) Pedestrian Demand (Ped/hr) Capacity (PCU/hr) RFC End Queue (PCU) Delay (s) LOS
B-AC 315.00 314.81 0.00 406.00 0.776 3.31 39.059 E
C-A 364.00 364.00 0.00 - - - - -
C-B 11.00 11.00 0.00 495.22 0.022 0.02 7.436 A
A-B 138.00 138.00 0.00 - - - - -
A-C 363.00 363.00 0.00 - - - - -
Stream Total Demand (PCU/hr) Entry Flow (PCU/hr) Pedestrian Demand (Ped/hr) Capacity (PCU/hr) RFC End Queue (PCU) Delay (s) LOS
B-AC 315.00 314.88 0.00 406.00 0.776 3.33 39.175 E
C-A 364.00 364.00 0.00 - - - - -
C-B 11.00 11.00 0.00 495.22 0.022 0.02 7.436 A
A-B 138.00 138.00 0.00 - - - - -
A-C 363.00 363.00 0.00 - - - - -
Stream Total Demand (PCU/hr) Entry Flow (PCU/hr) Pedestrian Demand (Ped/hr) Capacity (PCU/hr) RFC End Queue (PCU) Delay (s) LOS
B-AC 315.00 314.92 0.00 406.00 0.776 3.35 39.246 E
C-A 364.00 364.00 0.00 - - - - -
C-B 11.00 11.00 0.00 495.22 0.022 0.02 7.436 A
A-B 138.00 138.00 0.00 - - - - -
A-C 363.00 363.00 0.00 - - - - -
Generated on 16/09/2014 16:50:16 using Junctions 8 (8.0.4.487)
16

Filename: Victora Road.Camp Hill Road.Bucks Hill Road.ColeHill Road.arc8
Path: P:\C13742 Gladman Galley Common Nuneaton\Hydrock Docs\Transport\Junction Models
Report generation date: 16/09/2014 17:12:09
» (Default Analysis Set) - 2023 Base, AM » (Default Analysis Set) - 2023 Base, PM » (Default Analysis Set) - 2023 Base+Dev, AM » (Default Analysis Set) - 2023 Base+Dev, PM
Summary of junction performance
Values shown are the maximum values over all time segments. Delay is the maximum value of average delay per arriving vehicle.
"D1 - 2023 Base, AM " model duration: 08:00 - 09:30
"D2 - 2023 Base, PM" model duration: 17:00 - 18:30
"D3 - 2023 Base+Dev, AM" model duration: 08:00 - 09:30
"D4 - 2023 Base+Dev, PM" model duration: 17:00 - 18:30
Run using Junctions 8.0.4.487 at 16/09/2014 17:12:07
File summary
Junctions 8PICADY 8 - Priority Intersection Module
Version: 8.0.4.487 [15039,24/03/2014]
© Copyright TRL Limited, 2014
For sales and distribution information, program advice and maintenance, contact TRL:
Tel: +44 (0)1344 770758 email: [email protected] Web: http://www.trlsoftware.co.uk
The users of this computer program for the solution of an engineering problem are in no way relieved of their responsibility for the correctness of the solution
AM
Queue (PCU) Delay (s) RFC LOS
A1 - 2023 Base
Stream B-ACD 2.80 38.74 0.74 E
Stream A-BC 0.45 3.78 0.22 A
Stream A-D 0.32 8.81 0.36 A
Stream D-ABC 0.84 15.21 0.46 C
Stream C-D - - - -
Stream C-A - - - -
Stream C-B 0.52 10.21 0.34 B
Title Camp Hill Road.Bucks Hill.Victora Rd
Location
Site Number
Date 12/09/2014
Version
Status (new file)
Identifier
Client C13742
Jobnumber
Enumerator samdenby
Description
Generated on 16/09/2014 17:12:17 using Junctions 8 (8.0.4.487)
1

Analysis Options
Units
(Default Analysis Set) - 2023 Base, AM
Data Errors and Warnings No errors or warnings
Analysis Set Details
Demand Set Details
Junction Network
Junctions
Junction Network Options
Arms
Arms
Vehicle Length
(m)
Do Queue
Variations
Calculate Residual
Capacity
Residual Capacity Criteria
Type
RFC
Threshold
Average Delay Threshold
(s)
Queue Threshold
(PCU)
5.75 N/A 0.85 36.00 20.00
Distance Units Speed Units Traffic Units Input Traffic Units Results Flow Units Average Delay Units Total Delay Units Rate Of Delay Units
m kph PCU PCU perHour s -Min perMin
NameRoundabout
Capacity ModelDescription
Include In
Report
Use Specific
Demand Set(s)
Specific
Demand Set
(s)
Locked
Network Flow
Scaling Factor
(%)
Network Capacity
Scaling Factor (%)
Reason For
Scaling
Factors
(Default
Analysis Set)N/A ü 100.000 100.000
NameScenario
Name
Time
Period
Name
Description
Traffic
Profile
Type
Model
Start
Time
(HH:mm)
Model
Finish
Time
(HH:mm)
Model
Time
Period
Length
(min)
Time
Segment
Length
(min)
Results
For
Central
Hour
Only
Single
Time
Segment
Only
LockedRun
Automatically
Use
RelationshipRelationship
2023
Base,
AM
2023
BaseAM DIRECT 08:00 09:30 90 15 ü
Junction Name Junction Type Major Road Direction Arm Order Do Geometric Delay Junction Delay (s) Junction LOS
1 (untitled) Crossroads Two-way A,B,C,D 16.62 C
Driving Side Lighting
Left Normal/unknown
Arm Arm Name Description Arm Type
A A Camp Hill Road Major
B B Bucks Hill Minor
C C Coleshill Road Major
D D Victoria Road Minor
Generated on 16/09/2014 17:12:17 using Junctions 8 (8.0.4.487)
2

Major Arm Geometry
Geometries for Arm C are measured opposite Arm B. Geometries for Arm A (if relevant) are measured opposite Arm D.
Minor Arm Geometry
Pedestrian Crossings
Pelican/ Puffin Crossings
Slope / Intercept / Capacity
Priority Intersection Slopes and Intercepts
The slopes and intercepts shown above do NOT include any corrections or adjustments.
Streams may be combined, in which case capacity will be adjusted.
Values are shown for the first time segment only; they may differ for subsequent time segments.
ArmWidth of
carriageway (m)
Has kerbed central
reserve
Width of kerbed central
reserve (m)
Has right
turn bay
Width For Right
Turn (m)
Visibility For Right
Turn (m)Blocks?
Blocking Queue
(PCU)
A 7.50 0.00 2.20 200.00
C 7.50 0.00 2.20 120.00
Arm
Minor
Arm
Type
Lane
Width
(m)
Lane
Width
(Left) (m)
Lane
Width
(Right) (m)
Width at
give-way
(m)
Width at
5m (m)
Width at
10m (m)
Width at
15m (m)
Width at
20m (m)
Estimate
Flare
Length
Flare
Length
(PCU)
Visibility To
Left (m)
Visibility To
Right (m)
BOne
lane3.20 30 20
DOne
lane3.20 40 20
Arm Crossing Type
A Puffin
B None
C None
D None
ArmAmber time
preceding red (s)
Amber time
regarded as green
(s)
Time from traffic red
start to green man start
(s)
Time period green
man shown (s)
Clearance
Period (s)
Traffic minimum
green (s)
Space between crossing
and junction entry (PCU)
A 3.00 2.90 1.00 6.00 6.00 7.00 10.00
Junction StreamIntercept
(PCU/hr)
Slope
for
A-B
Slope
for
A-C
Slope
for
A-D
Slope
for
B-A
Slope
for
B-C
Slope
for
B-D
Slope
for
C-A
Slope
for
C-B
Slope
for
C-D
Slope
for
D-A
Slope
for
D-B
Slope
for
D-C
1 A-D 689.785 - - - - - - 0.250 0.357 0.250 - - -
1 B-A 507.092 0.086 0.218 0.218 - - - 0.137 0.312 - 0.218 0.218 0.109
1 B-C 649.273 0.093 0.235 - - - - - - - - - -
1 B-D, nearside lane 507.092 0.086 0.218 0.218 - - - 0.137 0.312 0.137 - - -
1 B-D, offside lane 507.092 0.086 0.218 0.218 - - - 0.137 0.312 0.137 - - -
1 C-B 643.457 0.233 0.233 0.333 - - - - - - - - -
1 D-A 649.273 - - - - - - 0.235 - 0.093 - - -
1 D-B, nearside lane 510.370 0.138 0.138 0.314 - - - 0.220 0.220 0.087 - - -
1 D-B, offside lane 510.370 0.138 0.138 0.314 - - - 0.220 0.220 0.087 - - -
1 D-C 510.370 - 0.138 0.314 0.110 0.220 0.220 0.220 0.220 0.087 - - -
Generated on 16/09/2014 17:12:17 using Junctions 8 (8.0.4.487)
3

Traffic Flows
Demand Set Data Options
Entry Flows
General Flows Data
Pedestrian Flows
General Flows Data
Turning Proportions
Turning Counts / Proportions (PCU/hr) - Junction 1 (for whole period)
Turning Proportions (PCU) - Junction 1 (for whole period)
Default
Vehicle
Mix
Vehicle
Mix Varies
Over Time
Vehicle
Mix Varies
Over Turn
Vehicle
Mix Varies
Over Entry
Vehicle Mix
Source
PCU
Factor
for a HV
(PCU)
Default
Turning
Proportions
Estimate
from
entry/exit
counts
Turning
Proportions
Vary Over Time
Turning
Proportions
Vary Over Turn
Turning
Proportions
Vary Over Entry
ü üHV
Percentages2.00 ü ü
Arm Profile Type Use Turning Counts Average Demand Flow (PCU/hr) Flow Scaling Factor (%)
A DIRECT N/A 100.000
B DIRECT N/A 100.000
C DIRECT N/A 100.000
D DIRECT N/A 100.000
Arm Profile Type Average Pedestrian Flow (Ped/hr)
A DIRECT N/A
B - N/A
C - N/A
D - N/A
To
From
A B C D
A 0.000 118.000 146.000 131.000
B 69.000 0.000 83.000 114.000
C 411.000 185.000 0.000 11.000
D 139.000 50.000 10.000 0.000
To
From
A B C D
A 0.00 0.30 0.37 0.33
B 0.26 0.00 0.31 0.43
C 0.68 0.30 0.00 0.02
D 0.70 0.25 0.05 0.00
Generated on 16/09/2014 17:12:17 using Junctions 8 (8.0.4.487)
4

Vehicle Mix
Average PCU Per Vehicle - Junction 1 (for whole period)
Heavy Vehicle Percentages - Junction 1 (for whole period)
Results
Results Summary for whole modelled period
To
From
A B C D
A 1.000 1.000 1.000 1.000
B 1.000 1.000 1.000 1.000
C 1.000 1.000 1.000 1.000
D 1.000 1.000 1.000 1.000
To
From
A B C D
A 0.0 0.0 0.0 0.0
B 0.0 0.0 0.0 0.0
C 0.0 0.0 0.0 0.0
D 0.0 0.0 0.0 0.0
StreamMax
RFC
Max
Delay
(s)
Max
Queue
(PCU)
Max
LOS
Average
Demand
(PCU/hr)
Total
Junction
Arrivals
(PCU)
Total
Queueing
Delay (PCU-
min)
Average
Queueing
Delay (s)
Rate Of
Queueing Delay
(PCU-min/min)
Inclusive Total
Queueing Delay
(PCU-min)
Inclusive
Average
Queueing Delay
(s)
B-
ACD0.74 38.74 2.80 E 266.00 399.00 234.77 35.30 2.61 235.43 35.40
A-BC 0.22 3.78 0.45 A 264.00 396.00 40.35 6.11 0.45 40.36 6.11
A-D 0.36 8.81 0.32 A 131.00 196.50 28.48 8.70 0.32 28.49 8.70
D-
ABC0.46 15.21 0.84 C 199.00 298.50 73.60 14.79 0.82 73.65 14.80
C-D - - - - 11.00 16.50 - - - - -
C-A - - - - 411.00 616.50 - - - - -
C-B 0.34 10.21 0.52 B 185.00 277.50 46.43 10.04 0.52 46.45 10.04
Generated on 16/09/2014 17:12:17 using Junctions 8 (8.0.4.487)
5
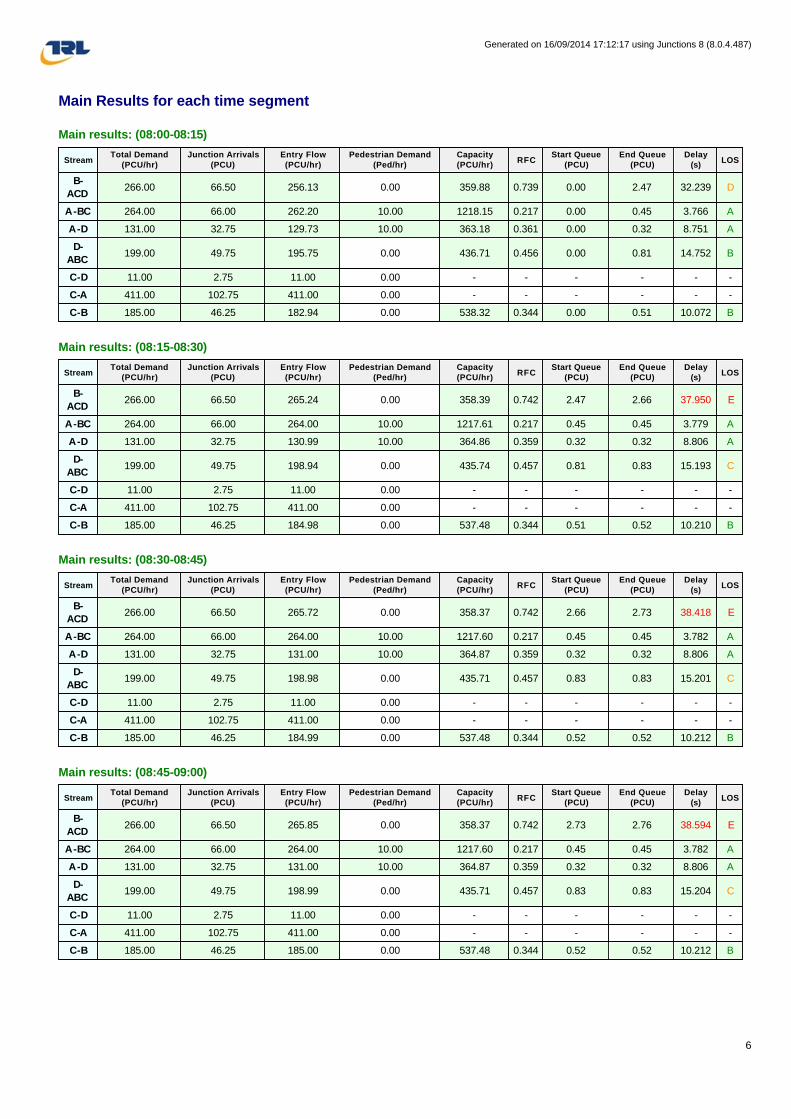
Main Results for each time segment
Main results: (08:00-08:15)
Main results: (08:15-08:30)
Main results: (08:30-08:45)
Main results: (08:45-09:00)
StreamTotal Demand
(PCU/hr)
Junction Arrivals
(PCU)
Entry Flow
(PCU/hr)
Pedestrian Demand
(Ped/hr)
Capacity
(PCU/hr)RFC
Start Queue
(PCU)
End Queue
(PCU)
Delay
(s)LOS
B-
ACD266.00 66.50 256.13 0.00 359.88 0.739 0.00 2.47 32.239 D
A-BC 264.00 66.00 262.20 10.00 1218.15 0.217 0.00 0.45 3.766 A
A-D 131.00 32.75 129.73 10.00 363.18 0.361 0.00 0.32 8.751 A
D-
ABC199.00 49.75 195.75 0.00 436.71 0.456 0.00 0.81 14.752 B
C-D 11.00 2.75 11.00 0.00 - - - - - -
C-A 411.00 102.75 411.00 0.00 - - - - - -
C-B 185.00 46.25 182.94 0.00 538.32 0.344 0.00 0.51 10.072 B
StreamTotal Demand
(PCU/hr)
Junction Arrivals
(PCU)
Entry Flow
(PCU/hr)
Pedestrian Demand
(Ped/hr)
Capacity
(PCU/hr)RFC
Start Queue
(PCU)
End Queue
(PCU)
Delay
(s)LOS
B-
ACD266.00 66.50 265.24 0.00 358.39 0.742 2.47 2.66 37.950 E
A-BC 264.00 66.00 264.00 10.00 1217.61 0.217 0.45 0.45 3.779 A
A-D 131.00 32.75 130.99 10.00 364.86 0.359 0.32 0.32 8.806 A
D-
ABC199.00 49.75 198.94 0.00 435.74 0.457 0.81 0.83 15.193 C
C-D 11.00 2.75 11.00 0.00 - - - - - -
C-A 411.00 102.75 411.00 0.00 - - - - - -
C-B 185.00 46.25 184.98 0.00 537.48 0.344 0.51 0.52 10.210 B
StreamTotal Demand
(PCU/hr)
Junction Arrivals
(PCU)
Entry Flow
(PCU/hr)
Pedestrian Demand
(Ped/hr)
Capacity
(PCU/hr)RFC
Start Queue
(PCU)
End Queue
(PCU)
Delay
(s)LOS
B-
ACD266.00 66.50 265.72 0.00 358.37 0.742 2.66 2.73 38.418 E
A-BC 264.00 66.00 264.00 10.00 1217.60 0.217 0.45 0.45 3.782 A
A-D 131.00 32.75 131.00 10.00 364.87 0.359 0.32 0.32 8.806 A
D-
ABC199.00 49.75 198.98 0.00 435.71 0.457 0.83 0.83 15.201 C
C-D 11.00 2.75 11.00 0.00 - - - - - -
C-A 411.00 102.75 411.00 0.00 - - - - - -
C-B 185.00 46.25 184.99 0.00 537.48 0.344 0.52 0.52 10.212 B
StreamTotal Demand
(PCU/hr)
Junction Arrivals
(PCU)
Entry Flow
(PCU/hr)
Pedestrian Demand
(Ped/hr)
Capacity
(PCU/hr)RFC
Start Queue
(PCU)
End Queue
(PCU)
Delay
(s)LOS
B-
ACD266.00 66.50 265.85 0.00 358.37 0.742 2.73 2.76 38.594 E
A-BC 264.00 66.00 264.00 10.00 1217.60 0.217 0.45 0.45 3.782 A
A-D 131.00 32.75 131.00 10.00 364.87 0.359 0.32 0.32 8.806 A
D-
ABC199.00 49.75 198.99 0.00 435.71 0.457 0.83 0.83 15.204 C
C-D 11.00 2.75 11.00 0.00 - - - - - -
C-A 411.00 102.75 411.00 0.00 - - - - - -
C-B 185.00 46.25 185.00 0.00 537.48 0.344 0.52 0.52 10.212 B
Generated on 16/09/2014 17:12:17 using Junctions 8 (8.0.4.487)
6

Main results: (09:00-09:15)
Main results: (09:15-09:30)
Queueing Delay Results for each time segment
Queueing Delay results: (08:00-08:15)
Queueing Delay results: (08:15-08:30)
StreamTotal Demand
(PCU/hr)
Junction Arrivals
(PCU)
Entry Flow
(PCU/hr)
Pedestrian Demand
(Ped/hr)
Capacity
(PCU/hr)RFC
Start Queue
(PCU)
End Queue
(PCU)
Delay
(s)LOS
B-
ACD266.00 66.50 265.91 0.00 358.36 0.742 2.76 2.79 38.686 E
A-BC 264.00 66.00 264.00 10.00 1217.60 0.217 0.45 0.45 3.782 A
A-D 131.00 32.75 131.00 10.00 364.87 0.359 0.32 0.32 8.805 A
D-
ABC199.00 49.75 198.99 0.00 435.70 0.457 0.83 0.84 15.205 C
C-D 11.00 2.75 11.00 0.00 - - - - - -
C-A 411.00 102.75 411.00 0.00 - - - - - -
C-B 185.00 46.25 185.00 0.00 537.48 0.344 0.52 0.52 10.212 B
StreamTotal Demand
(PCU/hr)
Junction Arrivals
(PCU)
Entry Flow
(PCU/hr)
Pedestrian Demand
(Ped/hr)
Capacity
(PCU/hr)RFC
Start Queue
(PCU)
End Queue
(PCU)
Delay
(s)LOS
B-
ACD266.00 66.50 265.94 0.00 358.36 0.742 2.79 2.80 38.742 E
A-BC 264.00 66.00 264.00 10.00 1217.60 0.217 0.45 0.45 3.779 A
A-D 131.00 32.75 131.00 10.00 364.87 0.359 0.32 0.32 8.805 A
D-
ABC199.00 49.75 199.00 0.00 435.70 0.457 0.84 0.84 15.208 C
C-D 11.00 2.75 11.00 0.00 - - - - - -
C-A 411.00 102.75 411.00 0.00 - - - - - -
C-B 185.00 46.25 185.00 0.00 537.48 0.344 0.52 0.52 10.212 B
StreamQueueing Total Delay (PCU-
min)
Queueing Rate Of Delay (PCU-
min/min)
Average Delay Per Arriving
Vehicle (s)
Unsignalised Level Of
Service
Signalised Level Of
Service
B-
ACD30.79 2.05 32.239 D C
A-BC 6.49 0.43 3.766 A A
A-D 4.53 0.30 8.751 A A
D-
ABC11.28 0.75 14.752 B B
C-D - - - - -
C-A - - - - -
C-B 7.32 0.49 10.072 B B
StreamQueueing Total Delay (PCU-
min)
Queueing Rate Of Delay (PCU-
min/min)
Average Delay Per Arriving
Vehicle (s)
Unsignalised Level Of
Service
Signalised Level Of
Service
B-
ACD38.74 2.58 37.950 E D
A-BC 6.75 0.45 3.779 A A
A-D 4.78 0.32 8.806 A A
D-
ABC12.32 0.82 15.193 C B
C-D - - - - -
C-A - - - - -
C-B 7.77 0.52 10.210 B B
Generated on 16/09/2014 17:12:17 using Junctions 8 (8.0.4.487)
7
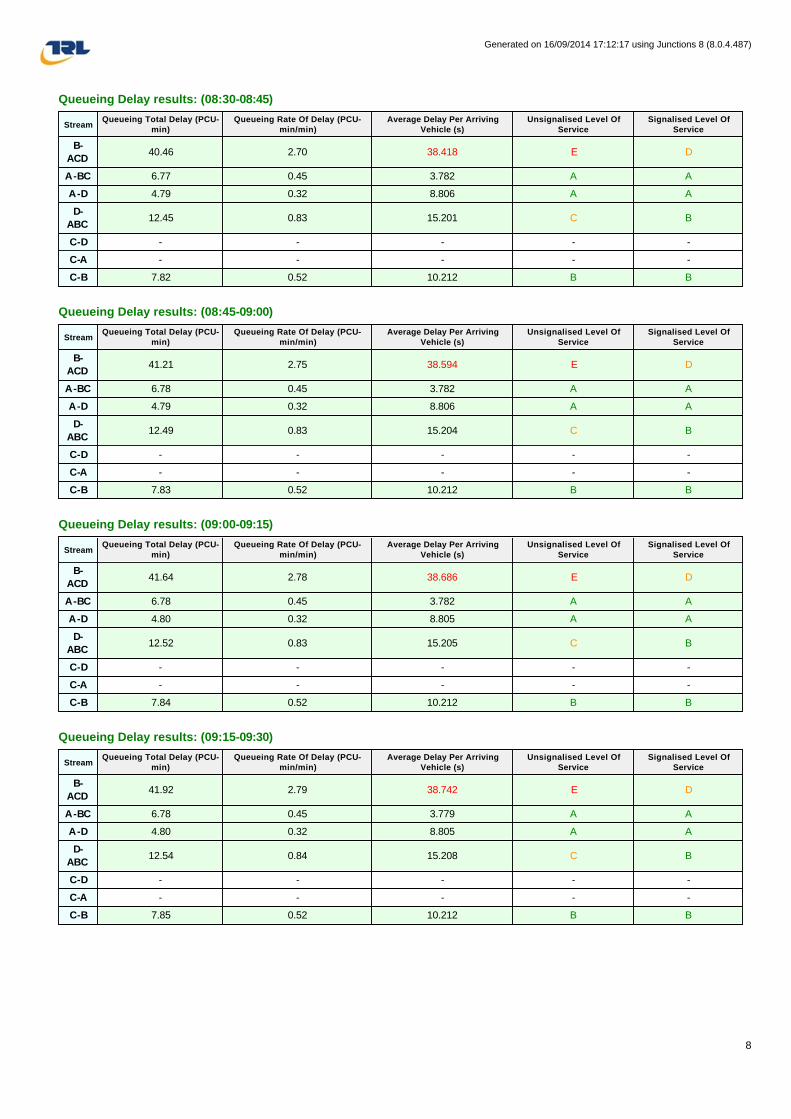
Queueing Delay results: (08:30-08:45)
Queueing Delay results: (08:45-09:00)
Queueing Delay results: (09:00-09:15)
Queueing Delay results: (09:15-09:30)
StreamQueueing Total Delay (PCU-
min)
Queueing Rate Of Delay (PCU-
min/min)
Average Delay Per Arriving
Vehicle (s)
Unsignalised Level Of
Service
Signalised Level Of
Service
B-
ACD40.46 2.70 38.418 E D
A-BC 6.77 0.45 3.782 A A
A-D 4.79 0.32 8.806 A A
D-
ABC12.45 0.83 15.201 C B
C-D - - - - -
C-A - - - - -
C-B 7.82 0.52 10.212 B B
StreamQueueing Total Delay (PCU-
min)
Queueing Rate Of Delay (PCU-
min/min)
Average Delay Per Arriving
Vehicle (s)
Unsignalised Level Of
Service
Signalised Level Of
Service
B-
ACD41.21 2.75 38.594 E D
A-BC 6.78 0.45 3.782 A A
A-D 4.79 0.32 8.806 A A
D-
ABC12.49 0.83 15.204 C B
C-D - - - - -
C-A - - - - -
C-B 7.83 0.52 10.212 B B
StreamQueueing Total Delay (PCU-
min)
Queueing Rate Of Delay (PCU-
min/min)
Average Delay Per Arriving
Vehicle (s)
Unsignalised Level Of
Service
Signalised Level Of
Service
B-
ACD41.64 2.78 38.686 E D
A-BC 6.78 0.45 3.782 A A
A-D 4.80 0.32 8.805 A A
D-
ABC12.52 0.83 15.205 C B
C-D - - - - -
C-A - - - - -
C-B 7.84 0.52 10.212 B B
StreamQueueing Total Delay (PCU-
min)
Queueing Rate Of Delay (PCU-
min/min)
Average Delay Per Arriving
Vehicle (s)
Unsignalised Level Of
Service
Signalised Level Of
Service
B-
ACD41.92 2.79 38.742 E D
A-BC 6.78 0.45 3.779 A A
A-D 4.80 0.32 8.805 A A
D-
ABC12.54 0.84 15.208 C B
C-D - - - - -
C-A - - - - -
C-B 7.85 0.52 10.212 B B
Generated on 16/09/2014 17:12:17 using Junctions 8 (8.0.4.487)
8

(Default Analysis Set) - 2023 Base, PM
Data Errors and Warnings No errors or warnings
Analysis Set Details
Demand Set Details
Junction Network
Junctions
Junction Network Options
Arms
Arms
Major Arm Geometry
Geometries for Arm C are measured opposite Arm B. Geometries for Arm A (if relevant) are measured opposite Arm D.
NameRoundabout
Capacity ModelDescription
Include In
Report
Use Specific
Demand Set(s)
Specific
Demand Set
(s)
Locked
Network Flow
Scaling Factor
(%)
Network Capacity
Scaling Factor (%)
Reason For
Scaling
Factors
(Default
Analysis Set)N/A ü 100.000 100.000
NameScenario
Name
Time
Period
Name
Description
Traffic
Profile
Type
Model
Start
Time
(HH:mm)
Model
Finish
Time
(HH:mm)
Model
Time
Period
Length
(min)
Time
Segment
Length
(min)
Results
For
Central
Hour
Only
Single
Time
Segment
Only
LockedRun
Automatically
Use
RelationshipRelationship
2023
Base,
PM
2023
BasePM DIRECT 17:00 18:30 90 15 ü
Junction Name Junction Type Major Road Direction Arm Order Do Geometric Delay Junction Delay (s) Junction LOS
1 (untitled) Crossroads Two-way A,B,C,D 19.33 C
Driving Side Lighting
Left Normal/unknown
Arm Arm Name Description Arm Type
A A Camp Hill Road Major
B B Bucks Hill Minor
C C Coleshill Road Major
D D Victoria Road Minor
ArmWidth of
carriageway (m)
Has kerbed central
reserve
Width of kerbed central
reserve (m)
Has right
turn bay
Width For Right
Turn (m)
Visibility For Right
Turn (m)Blocks?
Blocking Queue
(PCU)
A 7.50 0.00 2.20 200.00
C 7.50 0.00 2.20 120.00
Generated on 16/09/2014 17:12:17 using Junctions 8 (8.0.4.487)
9
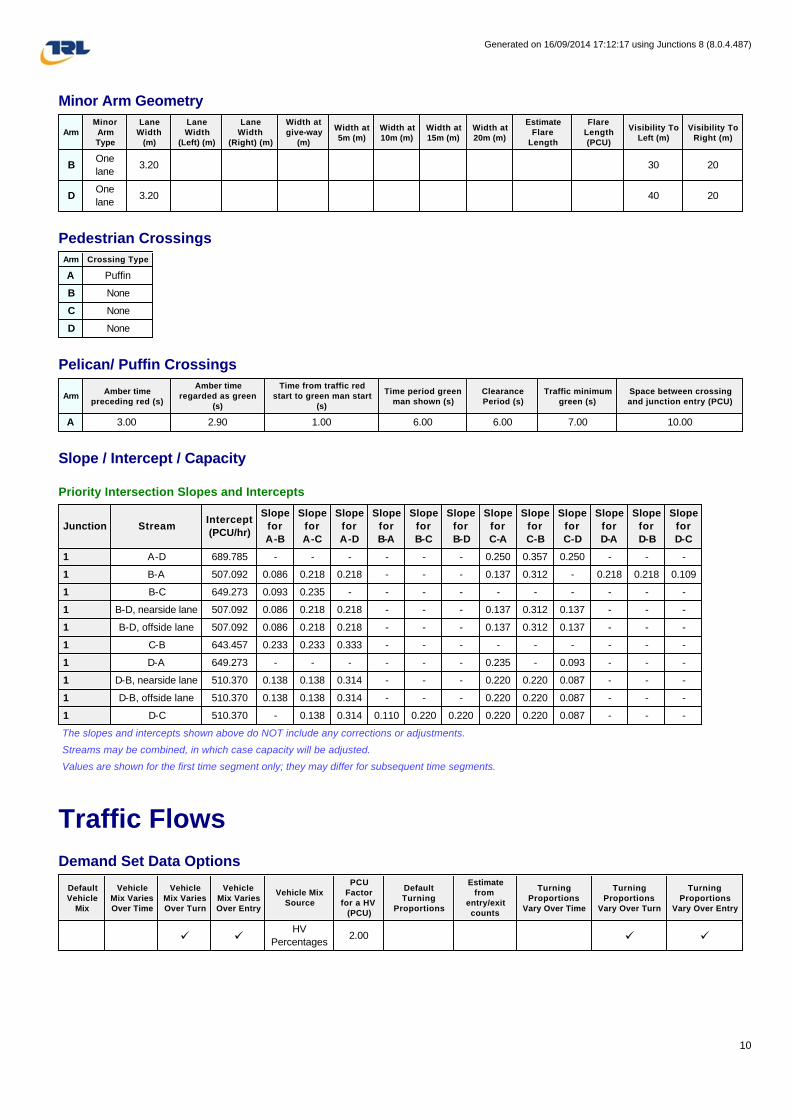
Minor Arm Geometry
Pedestrian Crossings
Pelican/ Puffin Crossings
Slope / Intercept / Capacity
Priority Intersection Slopes and Intercepts
The slopes and intercepts shown above do NOT include any corrections or adjustments.
Streams may be combined, in which case capacity will be adjusted.
Values are shown for the first time segment only; they may differ for subsequent time segments.
Traffic Flows
Demand Set Data Options
Arm
Minor
Arm
Type
Lane
Width
(m)
Lane
Width
(Left) (m)
Lane
Width
(Right) (m)
Width at
give-way
(m)
Width at
5m (m)
Width at
10m (m)
Width at
15m (m)
Width at
20m (m)
Estimate
Flare
Length
Flare
Length
(PCU)
Visibility To
Left (m)
Visibility To
Right (m)
BOne
lane3.20 30 20
DOne
lane3.20 40 20
Arm Crossing Type
A Puffin
B None
C None
D None
ArmAmber time
preceding red (s)
Amber time
regarded as green
(s)
Time from traffic red
start to green man start
(s)
Time period green
man shown (s)
Clearance
Period (s)
Traffic minimum
green (s)
Space between crossing
and junction entry (PCU)
A 3.00 2.90 1.00 6.00 6.00 7.00 10.00
Junction StreamIntercept
(PCU/hr)
Slope
for
A-B
Slope
for
A-C
Slope
for
A-D
Slope
for
B-A
Slope
for
B-C
Slope
for
B-D
Slope
for
C-A
Slope
for
C-B
Slope
for
C-D
Slope
for
D-A
Slope
for
D-B
Slope
for
D-C
1 A-D 689.785 - - - - - - 0.250 0.357 0.250 - - -
1 B-A 507.092 0.086 0.218 0.218 - - - 0.137 0.312 - 0.218 0.218 0.109
1 B-C 649.273 0.093 0.235 - - - - - - - - - -
1 B-D, nearside lane 507.092 0.086 0.218 0.218 - - - 0.137 0.312 0.137 - - -
1 B-D, offside lane 507.092 0.086 0.218 0.218 - - - 0.137 0.312 0.137 - - -
1 C-B 643.457 0.233 0.233 0.333 - - - - - - - - -
1 D-A 649.273 - - - - - - 0.235 - 0.093 - - -
1 D-B, nearside lane 510.370 0.138 0.138 0.314 - - - 0.220 0.220 0.087 - - -
1 D-B, offside lane 510.370 0.138 0.138 0.314 - - - 0.220 0.220 0.087 - - -
1 D-C 510.370 - 0.138 0.314 0.110 0.220 0.220 0.220 0.220 0.087 - - -
Default
Vehicle
Mix
Vehicle
Mix Varies
Over Time
Vehicle
Mix Varies
Over Turn
Vehicle
Mix Varies
Over Entry
Vehicle Mix
Source
PCU
Factor
for a HV
(PCU)
Default
Turning
Proportions
Estimate
from
entry/exit
counts
Turning
Proportions
Vary Over Time
Turning
Proportions
Vary Over Turn
Turning
Proportions
Vary Over Entry
ü üHV
Percentages2.00 ü ü
Generated on 16/09/2014 17:12:17 using Junctions 8 (8.0.4.487)
10

Entry Flows
General Flows Data
Pedestrian Flows
General Flows Data
Turning Proportions
Turning Counts / Proportions (PCU/hr) - Junction 1 (for whole period)
Turning Proportions (PCU) - Junction 1 (for whole period)
Vehicle Mix
Average PCU Per Vehicle - Junction 1 (for whole period)
Arm Profile Type Use Turning Counts Average Demand Flow (PCU/hr) Flow Scaling Factor (%)
A DIRECT N/A 100.000
B DIRECT N/A 100.000
C DIRECT N/A 100.000
D DIRECT N/A 100.000
Arm Profile Type Average Pedestrian Flow (Ped/hr)
A DIRECT N/A
B - N/A
C - N/A
D - N/A
To
From
A B C D
A 0.000 139.000 236.000 83.000
B 81.000 0.000 90.000 123.000
C 243.000 216.000 0.000 5.000
D 61.000 62.000 12.000 0.000
To
From
A B C D
A 0.00 0.30 0.52 0.18
B 0.28 0.00 0.31 0.42
C 0.52 0.47 0.00 0.01
D 0.45 0.46 0.09 0.00
To
From
A B C D
A 1.000 1.000 1.000 1.000
B 1.000 1.000 1.000 1.000
C 1.000 1.000 1.000 1.000
D 1.000 1.000 1.000 1.000
Generated on 16/09/2014 17:12:17 using Junctions 8 (8.0.4.487)
11

Heavy Vehicle Percentages - Junction 1 (for whole period)
Results
Results Summary for whole modelled period
Main Results for each time segment
Main results: (17:00-17:15)
To
From
A B C D
A 0.0 0.0 0.0 0.0
B 0.0 0.0 0.0 0.0
C 0.0 0.0 0.0 0.0
D 0.0 0.0 0.0 0.0
StreamMax
RFC
Max
Delay
(s)
Max
Queue
(PCU)
Max
LOS
Average
Demand
(PCU/hr)
Total
Junction
Arrivals
(PCU)
Total
Queueing
Delay (PCU-
min)
Average
Queueing
Delay (s)
Rate Of
Queueing Delay
(PCU-min/min)
Inclusive Total
Queueing Delay
(PCU-min)
Inclusive
Average
Queueing Delay
(s)
B-
ACD0.81 51.63 4.09 F 294.00 441.00 332.10 45.18 3.69 333.48 45.37
A-BC 0.26 3.39 0.61 A 375.00 562.50 54.11 5.77 0.60 54.12 5.77
A-D 0.32 7.03 0.16 A 83.00 124.50 14.44 6.96 0.16 14.44 6.96
D-
ABC0.33 13.26 0.50 B 135.00 202.50 43.80 12.98 0.49 43.82 12.98
C-D - - - - 5.00 7.50 - - - - -
C-A - - - - 243.00 364.50 - - - - -
C-B 0.41 11.55 0.69 B 216.00 324.00 61.11 11.32 0.68 61.14 11.32
StreamTotal Demand
(PCU/hr)
Junction Arrivals
(PCU)
Entry Flow
(PCU/hr)
Pedestrian Demand
(Ped/hr)
Capacity
(PCU/hr)RFC
Start Queue
(PCU)
End Queue
(PCU)
Delay
(s)LOS
B-
ACD294.00 73.50 280.56 0.00 364.08 0.808 0.00 3.36 38.587 E
A-BC 375.00 93.75 372.59 10.00 1439.91 0.260 0.00 0.60 3.371 A
A-D 83.00 20.75 82.36 10.00 258.12 0.322 0.00 0.16 6.993 A
D-
ABC135.00 33.75 133.06 0.00 407.90 0.331 0.00 0.48 13.010 B
C-D 5.00 1.25 5.00 0.00 - - - - - -
C-A 243.00 60.75 243.00 0.00 - - - - - -
C-B 216.00 54.00 213.29 0.00 528.44 0.409 0.00 0.68 11.330 B
Generated on 16/09/2014 17:12:17 using Junctions 8 (8.0.4.487)
12
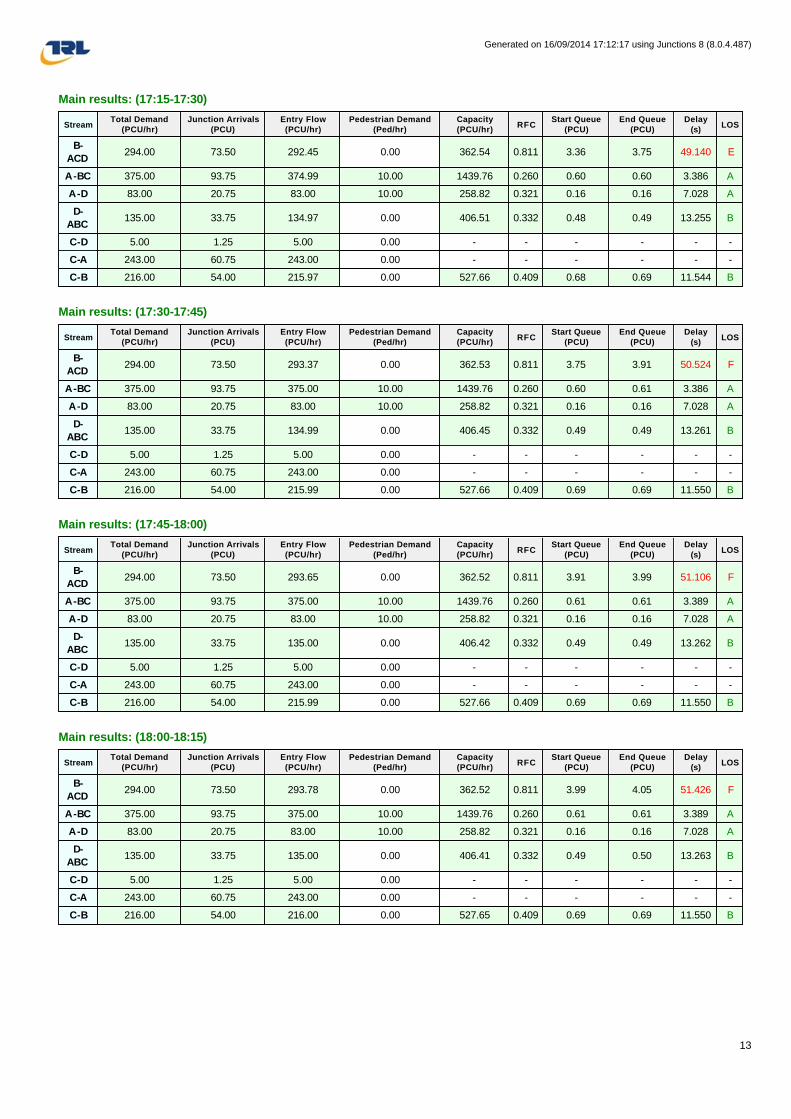
Main results: (17:15-17:30)
Main results: (17:30-17:45)
Main results: (17:45-18:00)
Main results: (18:00-18:15)
StreamTotal Demand
(PCU/hr)
Junction Arrivals
(PCU)
Entry Flow
(PCU/hr)
Pedestrian Demand
(Ped/hr)
Capacity
(PCU/hr)RFC
Start Queue
(PCU)
End Queue
(PCU)
Delay
(s)LOS
B-
ACD294.00 73.50 292.45 0.00 362.54 0.811 3.36 3.75 49.140 E
A-BC 375.00 93.75 374.99 10.00 1439.76 0.260 0.60 0.60 3.386 A
A-D 83.00 20.75 83.00 10.00 258.82 0.321 0.16 0.16 7.028 A
D-
ABC135.00 33.75 134.97 0.00 406.51 0.332 0.48 0.49 13.255 B
C-D 5.00 1.25 5.00 0.00 - - - - - -
C-A 243.00 60.75 243.00 0.00 - - - - - -
C-B 216.00 54.00 215.97 0.00 527.66 0.409 0.68 0.69 11.544 B
StreamTotal Demand
(PCU/hr)
Junction Arrivals
(PCU)
Entry Flow
(PCU/hr)
Pedestrian Demand
(Ped/hr)
Capacity
(PCU/hr)RFC
Start Queue
(PCU)
End Queue
(PCU)
Delay
(s)LOS
B-
ACD294.00 73.50 293.37 0.00 362.53 0.811 3.75 3.91 50.524 F
A-BC 375.00 93.75 375.00 10.00 1439.76 0.260 0.60 0.61 3.386 A
A-D 83.00 20.75 83.00 10.00 258.82 0.321 0.16 0.16 7.028 A
D-
ABC135.00 33.75 134.99 0.00 406.45 0.332 0.49 0.49 13.261 B
C-D 5.00 1.25 5.00 0.00 - - - - - -
C-A 243.00 60.75 243.00 0.00 - - - - - -
C-B 216.00 54.00 215.99 0.00 527.66 0.409 0.69 0.69 11.550 B
StreamTotal Demand
(PCU/hr)
Junction Arrivals
(PCU)
Entry Flow
(PCU/hr)
Pedestrian Demand
(Ped/hr)
Capacity
(PCU/hr)RFC
Start Queue
(PCU)
End Queue
(PCU)
Delay
(s)LOS
B-
ACD294.00 73.50 293.65 0.00 362.52 0.811 3.91 3.99 51.106 F
A-BC 375.00 93.75 375.00 10.00 1439.76 0.260 0.61 0.61 3.389 A
A-D 83.00 20.75 83.00 10.00 258.82 0.321 0.16 0.16 7.028 A
D-
ABC135.00 33.75 135.00 0.00 406.42 0.332 0.49 0.49 13.262 B
C-D 5.00 1.25 5.00 0.00 - - - - - -
C-A 243.00 60.75 243.00 0.00 - - - - - -
C-B 216.00 54.00 215.99 0.00 527.66 0.409 0.69 0.69 11.550 B
StreamTotal Demand
(PCU/hr)
Junction Arrivals
(PCU)
Entry Flow
(PCU/hr)
Pedestrian Demand
(Ped/hr)
Capacity
(PCU/hr)RFC
Start Queue
(PCU)
End Queue
(PCU)
Delay
(s)LOS
B-
ACD294.00 73.50 293.78 0.00 362.52 0.811 3.99 4.05 51.426 F
A-BC 375.00 93.75 375.00 10.00 1439.76 0.260 0.61 0.61 3.389 A
A-D 83.00 20.75 83.00 10.00 258.82 0.321 0.16 0.16 7.028 A
D-
ABC135.00 33.75 135.00 0.00 406.41 0.332 0.49 0.50 13.263 B
C-D 5.00 1.25 5.00 0.00 - - - - - -
C-A 243.00 60.75 243.00 0.00 - - - - - -
C-B 216.00 54.00 216.00 0.00 527.65 0.409 0.69 0.69 11.550 B
Generated on 16/09/2014 17:12:17 using Junctions 8 (8.0.4.487)
13
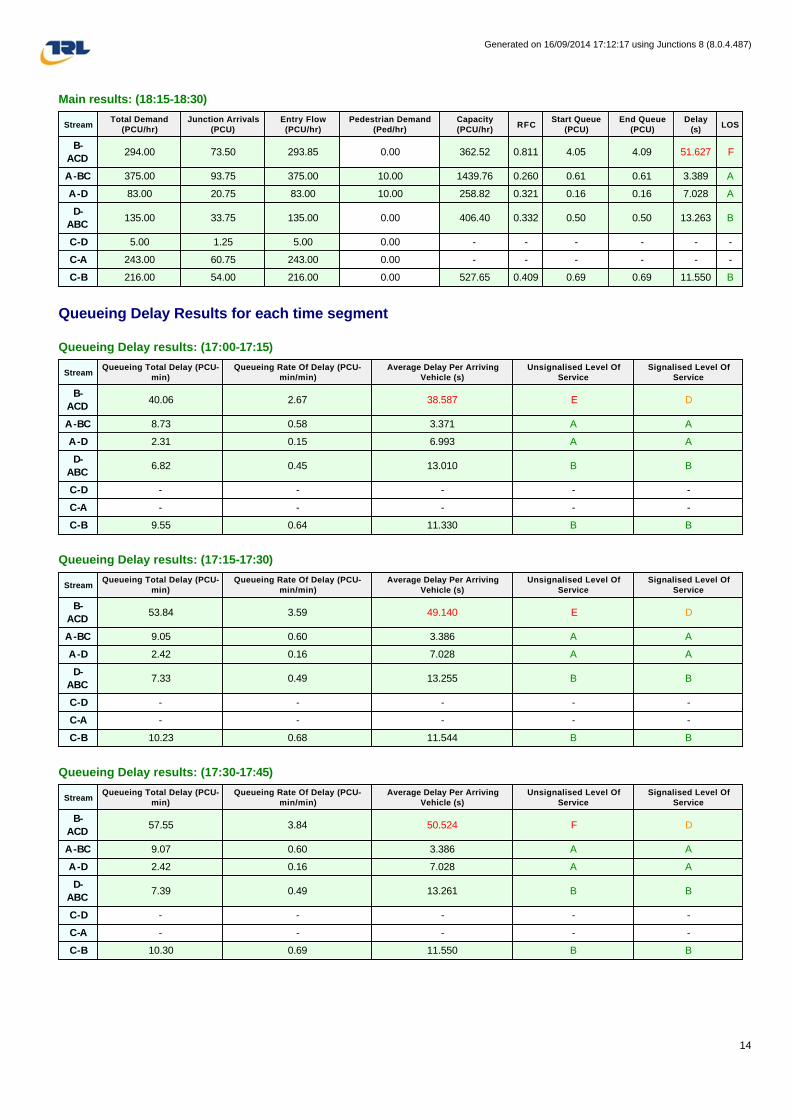
Main results: (18:15-18:30)
Queueing Delay Results for each time segment
Queueing Delay results: (17:00-17:15)
Queueing Delay results: (17:15-17:30)
Queueing Delay results: (17:30-17:45)
StreamTotal Demand
(PCU/hr)
Junction Arrivals
(PCU)
Entry Flow
(PCU/hr)
Pedestrian Demand
(Ped/hr)
Capacity
(PCU/hr)RFC
Start Queue
(PCU)
End Queue
(PCU)
Delay
(s)LOS
B-
ACD294.00 73.50 293.85 0.00 362.52 0.811 4.05 4.09 51.627 F
A-BC 375.00 93.75 375.00 10.00 1439.76 0.260 0.61 0.61 3.389 A
A-D 83.00 20.75 83.00 10.00 258.82 0.321 0.16 0.16 7.028 A
D-
ABC135.00 33.75 135.00 0.00 406.40 0.332 0.50 0.50 13.263 B
C-D 5.00 1.25 5.00 0.00 - - - - - -
C-A 243.00 60.75 243.00 0.00 - - - - - -
C-B 216.00 54.00 216.00 0.00 527.65 0.409 0.69 0.69 11.550 B
StreamQueueing Total Delay (PCU-
min)
Queueing Rate Of Delay (PCU-
min/min)
Average Delay Per Arriving
Vehicle (s)
Unsignalised Level Of
Service
Signalised Level Of
Service
B-
ACD40.06 2.67 38.587 E D
A-BC 8.73 0.58 3.371 A A
A-D 2.31 0.15 6.993 A A
D-
ABC6.82 0.45 13.010 B B
C-D - - - - -
C-A - - - - -
C-B 9.55 0.64 11.330 B B
StreamQueueing Total Delay (PCU-
min)
Queueing Rate Of Delay (PCU-
min/min)
Average Delay Per Arriving
Vehicle (s)
Unsignalised Level Of
Service
Signalised Level Of
Service
B-
ACD53.84 3.59 49.140 E D
A-BC 9.05 0.60 3.386 A A
A-D 2.42 0.16 7.028 A A
D-
ABC7.33 0.49 13.255 B B
C-D - - - - -
C-A - - - - -
C-B 10.23 0.68 11.544 B B
StreamQueueing Total Delay (PCU-
min)
Queueing Rate Of Delay (PCU-
min/min)
Average Delay Per Arriving
Vehicle (s)
Unsignalised Level Of
Service
Signalised Level Of
Service
B-
ACD57.55 3.84 50.524 F D
A-BC 9.07 0.60 3.386 A A
A-D 2.42 0.16 7.028 A A
D-
ABC7.39 0.49 13.261 B B
C-D - - - - -
C-A - - - - -
C-B 10.30 0.69 11.550 B B
Generated on 16/09/2014 17:12:17 using Junctions 8 (8.0.4.487)
14

Queueing Delay results: (17:45-18:00)
Queueing Delay results: (18:00-18:15)
Queueing Delay results: (18:15-18:30)
(Default Analysis Set) - 2023 Base+Dev, AM
Data Errors and Warnings No errors or warnings
Analysis Set Details
StreamQueueing Total Delay (PCU-
min)
Queueing Rate Of Delay (PCU-
min/min)
Average Delay Per Arriving
Vehicle (s)
Unsignalised Level Of
Service
Signalised Level Of
Service
B-
ACD59.30 3.95 51.106 F D
A-BC 9.08 0.61 3.389 A A
A-D 2.43 0.16 7.028 A A
D-
ABC7.41 0.49 13.262 B B
C-D - - - - -
C-A - - - - -
C-B 10.33 0.69 11.550 B B
StreamQueueing Total Delay (PCU-
min)
Queueing Rate Of Delay (PCU-
min/min)
Average Delay Per Arriving
Vehicle (s)
Unsignalised Level Of
Service
Signalised Level Of
Service
B-
ACD60.33 4.02 51.426 F D
A-BC 9.09 0.61 3.389 A A
A-D 2.43 0.16 7.028 A A
D-
ABC7.42 0.49 13.263 B B
C-D - - - - -
C-A - - - - -
C-B 10.34 0.69 11.550 B B
StreamQueueing Total Delay (PCU-
min)
Queueing Rate Of Delay (PCU-
min/min)
Average Delay Per Arriving
Vehicle (s)
Unsignalised Level Of
Service
Signalised Level Of
Service
B-
ACD61.02 4.07 51.627 F D
A-BC 9.09 0.61 3.389 A A
A-D 2.43 0.16 7.028 A A
D-
ABC7.43 0.50 13.263 B B
C-D - - - - -
C-A - - - - -
C-B 10.35 0.69 11.550 B B
NameRoundabout
Capacity ModelDescription
Include In
Report
Use Specific
Demand Set(s)
Specific
Demand Set
(s)
Locked
Network Flow
Scaling Factor
(%)
Network Capacity
Scaling Factor (%)
Reason For
Scaling
Factors
(Default
Analysis Set)N/A ü 100.000 100.000
Generated on 16/09/2014 17:12:17 using Junctions 8 (8.0.4.487)
15

Demand Set Details
Junction Network
Junctions
Junction Network Options
Arms
Arms
Major Arm Geometry
Geometries for Arm C are measured opposite Arm B. Geometries for Arm A (if relevant) are measured opposite Arm D.
Minor Arm Geometry
Pedestrian Crossings
NameScenario
Name
Time
Period
Name
Description
Traffic
Profile
Type
Model
Start
Time
(HH:mm)
Model
Finish
Time
(HH:mm)
Model
Time
Period
Length
(min)
Time
Segment
Length
(min)
Results
For
Central
Hour
Only
Single
Time
Segment
Only
LockedRun
Automatically
Use
RelationshipRelat
2023
Base+Dev,
AM
2023
Base+DevAM DIRECT 08:00 09:30 90 15 ü
Junction Name Junction Type Major Road Direction Arm Order Do Geometric Delay Junction Delay (s) Junction LOS
1 (untitled) Crossroads Two-way A,B,C,D 16.56 C
Driving Side Lighting
Left Normal/unknown
Arm Arm Name Description Arm Type
A A Camp Hill Road Major
B B Bucks Hill Minor
C C Coleshill Road Major
D D Victoria Road Minor
ArmWidth of
carriageway (m)
Has kerbed central
reserve
Width of kerbed central
reserve (m)
Has right
turn bay
Width For Right
Turn (m)
Visibility For Right
Turn (m)Blocks?
Blocking Queue
(PCU)
A 7.50 0.00 2.20 200.00
C 7.50 0.00 2.20 120.00
Arm
Minor
Arm
Type
Lane
Width
(m)
Lane
Width
(Left) (m)
Lane
Width
(Right) (m)
Width at
give-way
(m)
Width at
5m (m)
Width at
10m (m)
Width at
15m (m)
Width at
20m (m)
Estimate
Flare
Length
Flare
Length
(PCU)
Visibility To
Left (m)
Visibility To
Right (m)
BOne
lane3.20 30 20
DOne
lane3.20 40 20
Arm Crossing Type
A Puffin
B None
C None
D None
Generated on 16/09/2014 17:12:17 using Junctions 8 (8.0.4.487)
16

Pelican/ Puffin Crossings
Slope / Intercept / Capacity
Priority Intersection Slopes and Intercepts
The slopes and intercepts shown above do NOT include any corrections or adjustments.
Streams may be combined, in which case capacity will be adjusted.
Values are shown for the first time segment only; they may differ for subsequent time segments.
Traffic Flows
Demand Set Data Options
Entry Flows
General Flows Data
ArmAmber time
preceding red (s)
Amber time
regarded as green
(s)
Time from traffic red
start to green man start
(s)
Time period green
man shown (s)
Clearance
Period (s)
Traffic minimum
green (s)
Space between crossing
and junction entry (PCU)
A 3.00 2.90 1.00 6.00 6.00 7.00 10.00
Junction StreamIntercept
(PCU/hr)
Slope
for
A-B
Slope
for
A-C
Slope
for
A-D
Slope
for
B-A
Slope
for
B-C
Slope
for
B-D
Slope
for
C-A
Slope
for
C-B
Slope
for
C-D
Slope
for
D-A
Slope
for
D-B
Slope
for
D-C
1 A-D 689.785 - - - - - - 0.250 0.357 0.250 - - -
1 B-A 507.092 0.086 0.218 0.218 - - - 0.137 0.312 - 0.218 0.218 0.109
1 B-C 649.273 0.093 0.235 - - - - - - - - - -
1 B-D, nearside lane 507.092 0.086 0.218 0.218 - - - 0.137 0.312 0.137 - - -
1 B-D, offside lane 507.092 0.086 0.218 0.218 - - - 0.137 0.312 0.137 - - -
1 C-B 643.457 0.233 0.233 0.333 - - - - - - - - -
1 D-A 649.273 - - - - - - 0.235 - 0.093 - - -
1 D-B, nearside lane 510.370 0.138 0.138 0.314 - - - 0.220 0.220 0.087 - - -
1 D-B, offside lane 510.370 0.138 0.138 0.314 - - - 0.220 0.220 0.087 - - -
1 D-C 510.370 - 0.138 0.314 0.110 0.220 0.220 0.220 0.220 0.087 - - -
Default
Vehicle
Mix
Vehicle
Mix Varies
Over Time
Vehicle
Mix Varies
Over Turn
Vehicle
Mix Varies
Over Entry
Vehicle Mix
Source
PCU
Factor
for a HV
(PCU)
Default
Turning
Proportions
Estimate
from
entry/exit
counts
Turning
Proportions
Vary Over Time
Turning
Proportions
Vary Over Turn
Turning
Proportions
Vary Over Entry
ü üHV
Percentages2.00 ü ü
Arm Profile Type Use Turning Counts Average Demand Flow (PCU/hr) Flow Scaling Factor (%)
A DIRECT N/A 100.000
B DIRECT N/A 100.000
C DIRECT N/A 100.000
D DIRECT N/A 100.000
Generated on 16/09/2014 17:12:17 using Junctions 8 (8.0.4.487)
17
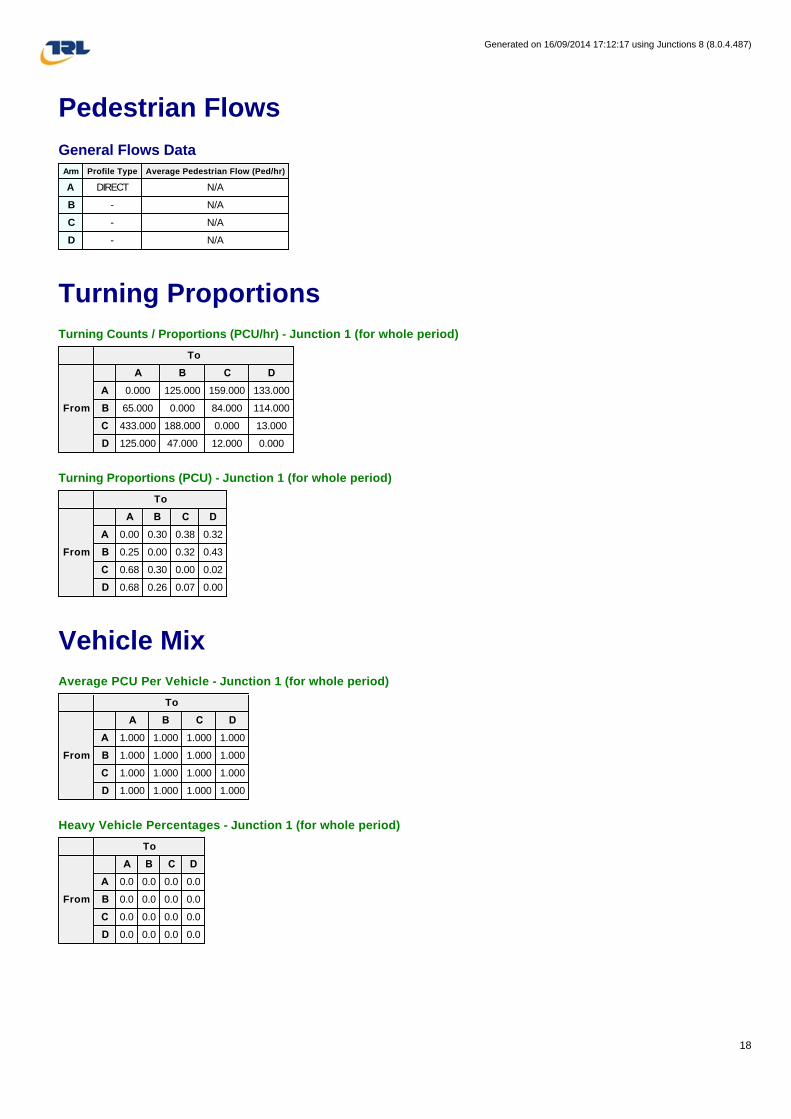
Pedestrian Flows
General Flows Data
Turning Proportions
Turning Counts / Proportions (PCU/hr) - Junction 1 (for whole period)
Turning Proportions (PCU) - Junction 1 (for whole period)
Vehicle Mix
Average PCU Per Vehicle - Junction 1 (for whole period)
Heavy Vehicle Percentages - Junction 1 (for whole period)
Arm Profile Type Average Pedestrian Flow (Ped/hr)
A DIRECT N/A
B - N/A
C - N/A
D - N/A
To
From
A B C D
A 0.000 125.000 159.000 133.000
B 65.000 0.000 84.000 114.000
C 433.000 188.000 0.000 13.000
D 125.000 47.000 12.000 0.000
To
From
A B C D
A 0.00 0.30 0.38 0.32
B 0.25 0.00 0.32 0.43
C 0.68 0.30 0.00 0.02
D 0.68 0.26 0.07 0.00
To
From
A B C D
A 1.000 1.000 1.000 1.000
B 1.000 1.000 1.000 1.000
C 1.000 1.000 1.000 1.000
D 1.000 1.000 1.000 1.000
To
From
A B C D
A 0.0 0.0 0.0 0.0
B 0.0 0.0 0.0 0.0
C 0.0 0.0 0.0 0.0
D 0.0 0.0 0.0 0.0
Generated on 16/09/2014 17:12:17 using Junctions 8 (8.0.4.487)
18

Results
Results Summary for whole modelled period
Main Results for each time segment
Main results: (08:00-08:15)
Main results: (08:15-08:30)
StreamMax
RFC
Max
Delay
(s)
Max
Queue
(PCU)
Max
LOS
Average
Demand
(PCU/hr)
Total
Junction
Arrivals
(PCU)
Total
Queueing
Delay (PCU-
min)
Average
Queueing
Delay (s)
Rate Of
Queueing Delay
(PCU-min/min)
Inclusive Total
Queueing Delay
(PCU-min)
Inclusive
Average
Queueing Delay
(s)
B-
ACD0.74 39.42 2.82 E 263.00 394.50 235.87 35.87 2.62 236.54 35.98
A-BC 0.23 3.83 0.50 A 284.00 426.00 44.22 6.23 0.49 44.22 6.23
A-D 0.37 9.02 0.33 A 133.00 199.50 29.62 8.91 0.33 29.63 8.91
D-
ABC0.44 15.22 0.77 C 184.00 276.00 68.12 14.81 0.76 68.16 14.82
C-D - - - - 13.00 19.50 - - - - -
C-A - - - - 433.00 649.50 - - - - -
C-B 0.35 10.46 0.54 B 188.00 282.00 48.31 10.28 0.54 48.32 10.28
StreamTotal Demand
(PCU/hr)
Junction Arrivals
(PCU)
Entry Flow
(PCU/hr)
Pedestrian Demand
(Ped/hr)
Capacity
(PCU/hr)RFC
Start Queue
(PCU)
End Queue
(PCU)
Delay
(s)LOS
B-
ACD263.00 65.75 253.09 0.00 355.30 0.740 0.00 2.48 32.694 D
A-BC 284.00 71.00 282.03 10.00 1224.92 0.232 0.00 0.49 3.816 A
A-D 133.00 33.25 131.68 10.00 354.76 0.375 0.00 0.33 8.964 A
D-
ABC184.00 46.00 180.99 0.00 421.75 0.436 0.00 0.75 14.779 B
C-D 13.00 3.25 13.00 0.00 - - - - - -
C-A 433.00 108.25 433.00 0.00 - - - - - -
C-B 188.00 47.00 185.86 0.00 533.00 0.353 0.00 0.54 10.310 B
StreamTotal Demand
(PCU/hr)
Junction Arrivals
(PCU)
Entry Flow
(PCU/hr)
Pedestrian Demand
(Ped/hr)
Capacity
(PCU/hr)RFC
Start Queue
(PCU)
End Queue
(PCU)
Delay
(s)LOS
B-
ACD263.00 65.75 262.22 0.00 353.76 0.743 2.48 2.67 38.589 E
A-BC 284.00 71.00 283.99 10.00 1224.36 0.232 0.49 0.49 3.833 A
A-D 133.00 33.25 132.99 10.00 356.53 0.373 0.33 0.33 9.025 A
D-
ABC184.00 46.00 183.95 0.00 420.62 0.437 0.75 0.77 15.201 C
C-D 13.00 3.25 13.00 0.00 - - - - - -
C-A 433.00 108.25 433.00 0.00 - - - - - -
C-B 188.00 47.00 187.98 0.00 532.10 0.353 0.54 0.54 10.459 B
Generated on 16/09/2014 17:12:17 using Junctions 8 (8.0.4.487)
19
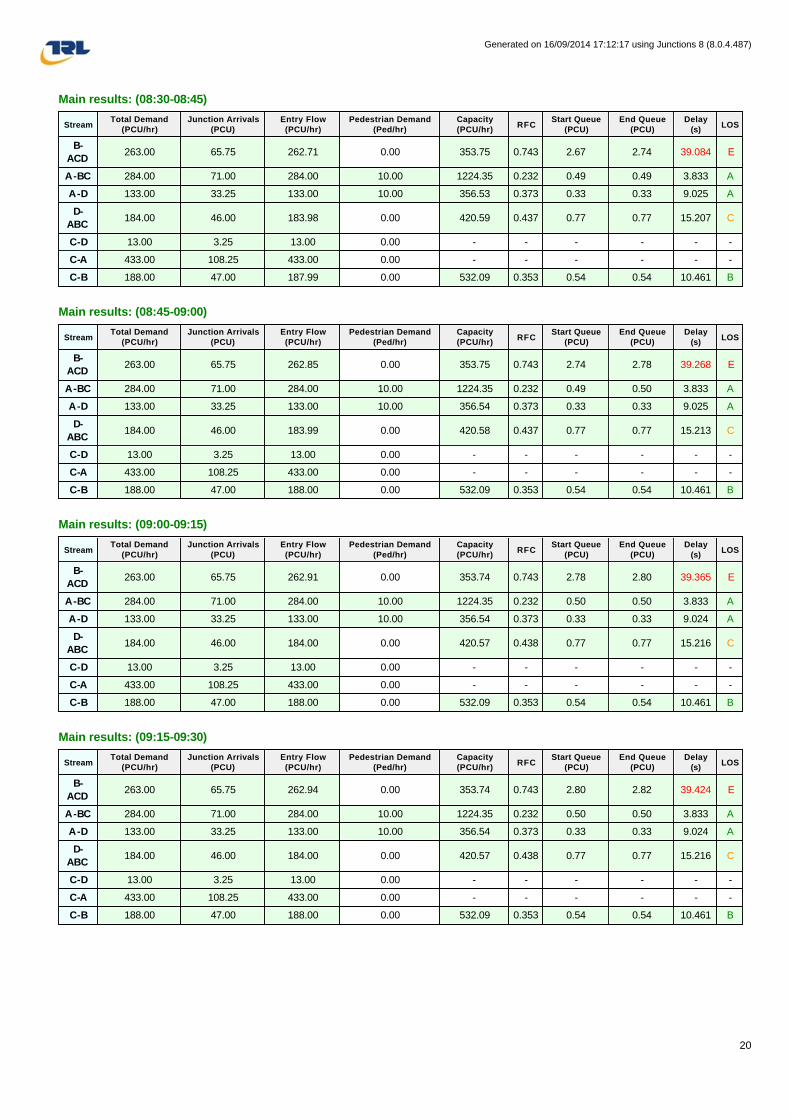
Main results: (08:30-08:45)
Main results: (08:45-09:00)
Main results: (09:00-09:15)
Main results: (09:15-09:30)
StreamTotal Demand
(PCU/hr)
Junction Arrivals
(PCU)
Entry Flow
(PCU/hr)
Pedestrian Demand
(Ped/hr)
Capacity
(PCU/hr)RFC
Start Queue
(PCU)
End Queue
(PCU)
Delay
(s)LOS
B-
ACD263.00 65.75 262.71 0.00 353.75 0.743 2.67 2.74 39.084 E
A-BC 284.00 71.00 284.00 10.00 1224.35 0.232 0.49 0.49 3.833 A
A-D 133.00 33.25 133.00 10.00 356.53 0.373 0.33 0.33 9.025 A
D-
ABC184.00 46.00 183.98 0.00 420.59 0.437 0.77 0.77 15.207 C
C-D 13.00 3.25 13.00 0.00 - - - - - -
C-A 433.00 108.25 433.00 0.00 - - - - - -
C-B 188.00 47.00 187.99 0.00 532.09 0.353 0.54 0.54 10.461 B
StreamTotal Demand
(PCU/hr)
Junction Arrivals
(PCU)
Entry Flow
(PCU/hr)
Pedestrian Demand
(Ped/hr)
Capacity
(PCU/hr)RFC
Start Queue
(PCU)
End Queue
(PCU)
Delay
(s)LOS
B-
ACD263.00 65.75 262.85 0.00 353.75 0.743 2.74 2.78 39.268 E
A-BC 284.00 71.00 284.00 10.00 1224.35 0.232 0.49 0.50 3.833 A
A-D 133.00 33.25 133.00 10.00 356.54 0.373 0.33 0.33 9.025 A
D-
ABC184.00 46.00 183.99 0.00 420.58 0.437 0.77 0.77 15.213 C
C-D 13.00 3.25 13.00 0.00 - - - - - -
C-A 433.00 108.25 433.00 0.00 - - - - - -
C-B 188.00 47.00 188.00 0.00 532.09 0.353 0.54 0.54 10.461 B
StreamTotal Demand
(PCU/hr)
Junction Arrivals
(PCU)
Entry Flow
(PCU/hr)
Pedestrian Demand
(Ped/hr)
Capacity
(PCU/hr)RFC
Start Queue
(PCU)
End Queue
(PCU)
Delay
(s)LOS
B-
ACD263.00 65.75 262.91 0.00 353.74 0.743 2.78 2.80 39.365 E
A-BC 284.00 71.00 284.00 10.00 1224.35 0.232 0.50 0.50 3.833 A
A-D 133.00 33.25 133.00 10.00 356.54 0.373 0.33 0.33 9.024 A
D-
ABC184.00 46.00 184.00 0.00 420.57 0.438 0.77 0.77 15.216 C
C-D 13.00 3.25 13.00 0.00 - - - - - -
C-A 433.00 108.25 433.00 0.00 - - - - - -
C-B 188.00 47.00 188.00 0.00 532.09 0.353 0.54 0.54 10.461 B
StreamTotal Demand
(PCU/hr)
Junction Arrivals
(PCU)
Entry Flow
(PCU/hr)
Pedestrian Demand
(Ped/hr)
Capacity
(PCU/hr)RFC
Start Queue
(PCU)
End Queue
(PCU)
Delay
(s)LOS
B-
ACD263.00 65.75 262.94 0.00 353.74 0.743 2.80 2.82 39.424 E
A-BC 284.00 71.00 284.00 10.00 1224.35 0.232 0.50 0.50 3.833 A
A-D 133.00 33.25 133.00 10.00 356.54 0.373 0.33 0.33 9.024 A
D-
ABC184.00 46.00 184.00 0.00 420.57 0.438 0.77 0.77 15.216 C
C-D 13.00 3.25 13.00 0.00 - - - - - -
C-A 433.00 108.25 433.00 0.00 - - - - - -
C-B 188.00 47.00 188.00 0.00 532.09 0.353 0.54 0.54 10.461 B
Generated on 16/09/2014 17:12:17 using Junctions 8 (8.0.4.487)
20

Queueing Delay Results for each time segment
Queueing Delay results: (08:00-08:15)
Queueing Delay results: (08:15-08:30)
Queueing Delay results: (08:30-08:45)
Queueing Delay results: (08:45-09:00)
StreamQueueing Total Delay (PCU-
min)
Queueing Rate Of Delay (PCU-
min/min)
Average Delay Per Arriving
Vehicle (s)
Unsignalised Level Of
Service
Signalised Level Of
Service
B-
ACD30.84 2.06 32.694 D C
A-BC 7.11 0.47 3.816 A A
A-D 4.71 0.31 8.964 A A
D-
ABC10.45 0.70 14.779 B B
C-D - - - - -
C-A - - - - -
C-B 7.61 0.51 10.310 B B
StreamQueueing Total Delay (PCU-
min)
Queueing Rate Of Delay (PCU-
min/min)
Average Delay Per Arriving
Vehicle (s)
Unsignalised Level Of
Service
Signalised Level Of
Service
B-
ACD38.90 2.59 38.589 E D
A-BC 7.40 0.49 3.833 A A
A-D 4.97 0.33 9.025 A A
D-
ABC11.40 0.76 15.201 C B
C-D - - - - -
C-A - - - - -
C-B 8.08 0.54 10.459 B B
StreamQueueing Total Delay (PCU-
min)
Queueing Rate Of Delay (PCU-
min/min)
Average Delay Per Arriving
Vehicle (s)
Unsignalised Level Of
Service
Signalised Level Of
Service
B-
ACD40.66 2.71 39.084 E D
A-BC 7.42 0.49 3.833 A A
A-D 4.98 0.33 9.025 A A
D-
ABC11.52 0.77 15.207 C B
C-D - - - - -
C-A - - - - -
C-B 8.13 0.54 10.461 B B
StreamQueueing Total Delay (PCU-
min)
Queueing Rate Of Delay (PCU-
min/min)
Average Delay Per Arriving
Vehicle (s)
Unsignalised Level Of
Service
Signalised Level Of
Service
B-
ACD41.44 2.76 39.268 E D
A-BC 7.43 0.50 3.833 A A
A-D 4.99 0.33 9.025 A A
D-
ABC11.56 0.77 15.213 C B
C-D - - - - -
C-A - - - - -
C-B 8.15 0.54 10.461 B B
Generated on 16/09/2014 17:12:17 using Junctions 8 (8.0.4.487)
21
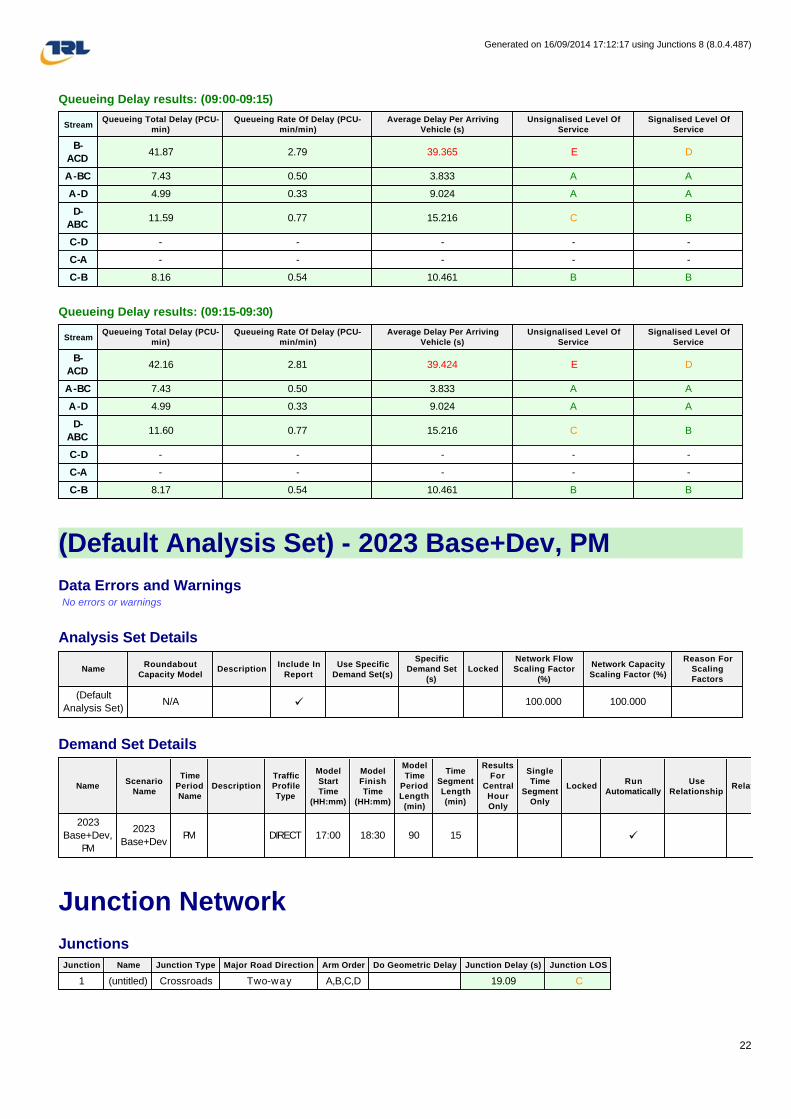
Queueing Delay results: (09:00-09:15)
Queueing Delay results: (09:15-09:30)
(Default Analysis Set) - 2023 Base+Dev, PM
Data Errors and Warnings No errors or warnings
Analysis Set Details
Demand Set Details
Junction Network
Junctions
StreamQueueing Total Delay (PCU-
min)
Queueing Rate Of Delay (PCU-
min/min)
Average Delay Per Arriving
Vehicle (s)
Unsignalised Level Of
Service
Signalised Level Of
Service
B-
ACD41.87 2.79 39.365 E D
A-BC 7.43 0.50 3.833 A A
A-D 4.99 0.33 9.024 A A
D-
ABC11.59 0.77 15.216 C B
C-D - - - - -
C-A - - - - -
C-B 8.16 0.54 10.461 B B
StreamQueueing Total Delay (PCU-
min)
Queueing Rate Of Delay (PCU-
min/min)
Average Delay Per Arriving
Vehicle (s)
Unsignalised Level Of
Service
Signalised Level Of
Service
B-
ACD42.16 2.81 39.424 E D
A-BC 7.43 0.50 3.833 A A
A-D 4.99 0.33 9.024 A A
D-
ABC11.60 0.77 15.216 C B
C-D - - - - -
C-A - - - - -
C-B 8.17 0.54 10.461 B B
NameRoundabout
Capacity ModelDescription
Include In
Report
Use Specific
Demand Set(s)
Specific
Demand Set
(s)
Locked
Network Flow
Scaling Factor
(%)
Network Capacity
Scaling Factor (%)
Reason For
Scaling
Factors
(Default
Analysis Set)N/A ü 100.000 100.000
NameScenario
Name
Time
Period
Name
Description
Traffic
Profile
Type
Model
Start
Time
(HH:mm)
Model
Finish
Time
(HH:mm)
Model
Time
Period
Length
(min)
Time
Segment
Length
(min)
Results
For
Central
Hour
Only
Single
Time
Segment
Only
LockedRun
Automatically
Use
RelationshipRelat
2023
Base+Dev,
PM
2023
Base+DevPM DIRECT 17:00 18:30 90 15 ü
Junction Name Junction Type Major Road Direction Arm Order Do Geometric Delay Junction Delay (s) Junction LOS
1 (untitled) Crossroads Two-way A,B,C,D 19.09 C
Generated on 16/09/2014 17:12:17 using Junctions 8 (8.0.4.487)
22
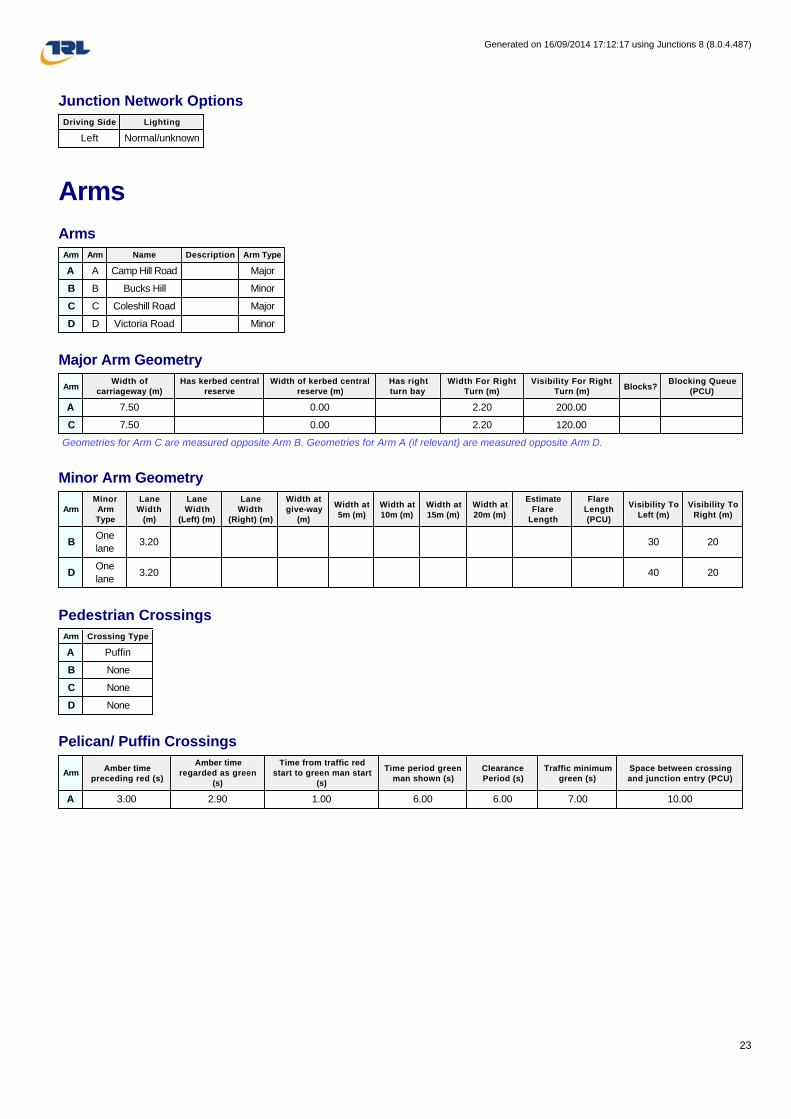
Junction Network Options
Arms
Arms
Major Arm Geometry
Geometries for Arm C are measured opposite Arm B. Geometries for Arm A (if relevant) are measured opposite Arm D.
Minor Arm Geometry
Pedestrian Crossings
Pelican/ Puffin Crossings
Driving Side Lighting
Left Normal/unknown
Arm Arm Name Description Arm Type
A A Camp Hill Road Major
B B Bucks Hill Minor
C C Coleshill Road Major
D D Victoria Road Minor
ArmWidth of
carriageway (m)
Has kerbed central
reserve
Width of kerbed central
reserve (m)
Has right
turn bay
Width For Right
Turn (m)
Visibility For Right
Turn (m)Blocks?
Blocking Queue
(PCU)
A 7.50 0.00 2.20 200.00
C 7.50 0.00 2.20 120.00
Arm
Minor
Arm
Type
Lane
Width
(m)
Lane
Width
(Left) (m)
Lane
Width
(Right) (m)
Width at
give-way
(m)
Width at
5m (m)
Width at
10m (m)
Width at
15m (m)
Width at
20m (m)
Estimate
Flare
Length
Flare
Length
(PCU)
Visibility To
Left (m)
Visibility To
Right (m)
BOne
lane3.20 30 20
DOne
lane3.20 40 20
Arm Crossing Type
A Puffin
B None
C None
D None
ArmAmber time
preceding red (s)
Amber time
regarded as green
(s)
Time from traffic red
start to green man start
(s)
Time period green
man shown (s)
Clearance
Period (s)
Traffic minimum
green (s)
Space between crossing
and junction entry (PCU)
A 3.00 2.90 1.00 6.00 6.00 7.00 10.00
Generated on 16/09/2014 17:12:17 using Junctions 8 (8.0.4.487)
23

Slope / Intercept / Capacity
Priority Intersection Slopes and Intercepts
The slopes and intercepts shown above do NOT include any corrections or adjustments.
Streams may be combined, in which case capacity will be adjusted.
Values are shown for the first time segment only; they may differ for subsequent time segments.
Traffic Flows
Demand Set Data Options
Entry Flows
General Flows Data
Pedestrian Flows
General Flows Data
Junction StreamIntercept
(PCU/hr)
Slope
for
A-B
Slope
for
A-C
Slope
for
A-D
Slope
for
B-A
Slope
for
B-C
Slope
for
B-D
Slope
for
C-A
Slope
for
C-B
Slope
for
C-D
Slope
for
D-A
Slope
for
D-B
Slope
for
D-C
1 A-D 689.785 - - - - - - 0.250 0.357 0.250 - - -
1 B-A 507.092 0.086 0.218 0.218 - - - 0.137 0.312 - 0.218 0.218 0.109
1 B-C 649.273 0.093 0.235 - - - - - - - - - -
1 B-D, nearside lane 507.092 0.086 0.218 0.218 - - - 0.137 0.312 0.137 - - -
1 B-D, offside lane 507.092 0.086 0.218 0.218 - - - 0.137 0.312 0.137 - - -
1 C-B 643.457 0.233 0.233 0.333 - - - - - - - - -
1 D-A 649.273 - - - - - - 0.235 - 0.093 - - -
1 D-B, nearside lane 510.370 0.138 0.138 0.314 - - - 0.220 0.220 0.087 - - -
1 D-B, offside lane 510.370 0.138 0.138 0.314 - - - 0.220 0.220 0.087 - - -
1 D-C 510.370 - 0.138 0.314 0.110 0.220 0.220 0.220 0.220 0.087 - - -
Default
Vehicle
Mix
Vehicle
Mix Varies
Over Time
Vehicle
Mix Varies
Over Turn
Vehicle
Mix Varies
Over Entry
Vehicle Mix
Source
PCU
Factor
for a HV
(PCU)
Default
Turning
Proportions
Estimate
from
entry/exit
counts
Turning
Proportions
Vary Over Time
Turning
Proportions
Vary Over Turn
Turning
Proportions
Vary Over Entry
ü üHV
Percentages2.00 ü ü
Arm Profile Type Use Turning Counts Average Demand Flow (PCU/hr) Flow Scaling Factor (%)
A DIRECT N/A 100.000
B DIRECT N/A 100.000
C DIRECT N/A 100.000
D DIRECT N/A 100.000
Arm Profile Type Average Pedestrian Flow (Ped/hr)
A DIRECT N/A
B - N/A
C - N/A
D - N/A
Generated on 16/09/2014 17:12:17 using Junctions 8 (8.0.4.487)
24
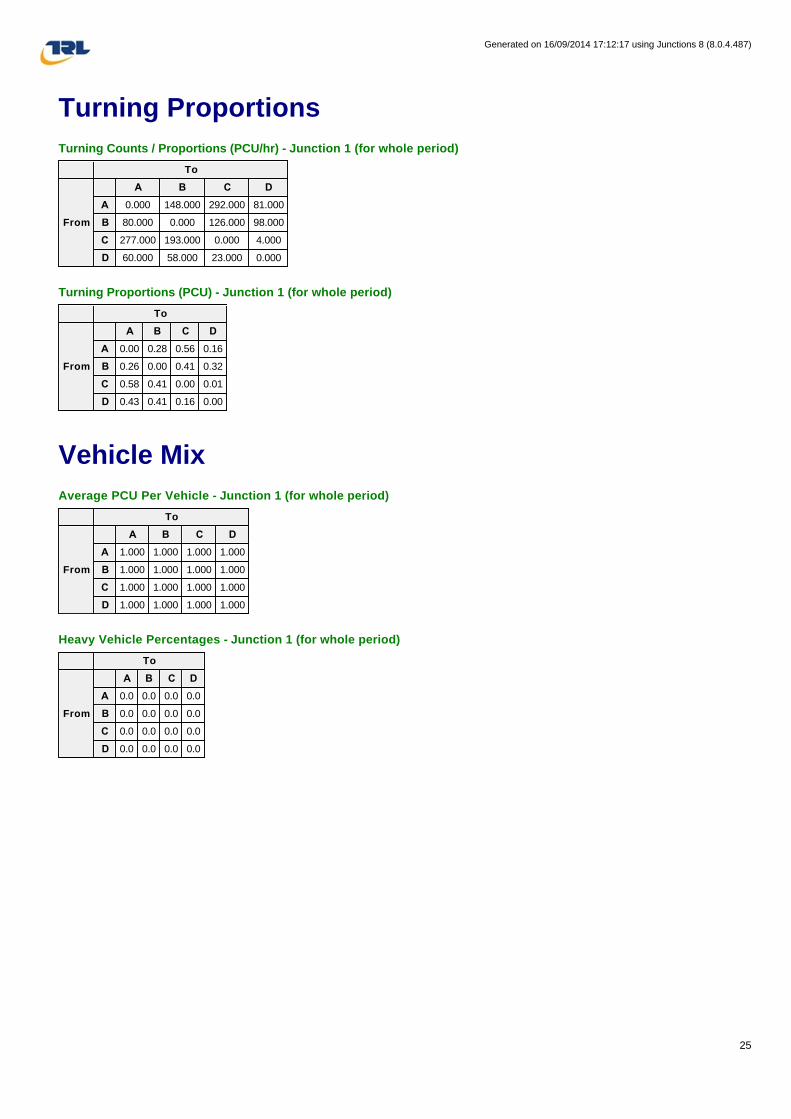
Turning Proportions
Turning Counts / Proportions (PCU/hr) - Junction 1 (for whole period)
Turning Proportions (PCU) - Junction 1 (for whole period)
Vehicle Mix
Average PCU Per Vehicle - Junction 1 (for whole period)
Heavy Vehicle Percentages - Junction 1 (for whole period)
To
From
A B C D
A 0.000 148.000 292.000 81.000
B 80.000 0.000 126.000 98.000
C 277.000 193.000 0.000 4.000
D 60.000 58.000 23.000 0.000
To
From
A B C D
A 0.00 0.28 0.56 0.16
B 0.26 0.00 0.41 0.32
C 0.58 0.41 0.00 0.01
D 0.43 0.41 0.16 0.00
To
From
A B C D
A 1.000 1.000 1.000 1.000
B 1.000 1.000 1.000 1.000
C 1.000 1.000 1.000 1.000
D 1.000 1.000 1.000 1.000
To
From
A B C D
A 0.0 0.0 0.0 0.0
B 0.0 0.0 0.0 0.0
C 0.0 0.0 0.0 0.0
D 0.0 0.0 0.0 0.0
Generated on 16/09/2014 17:12:17 using Junctions 8 (8.0.4.487)
25
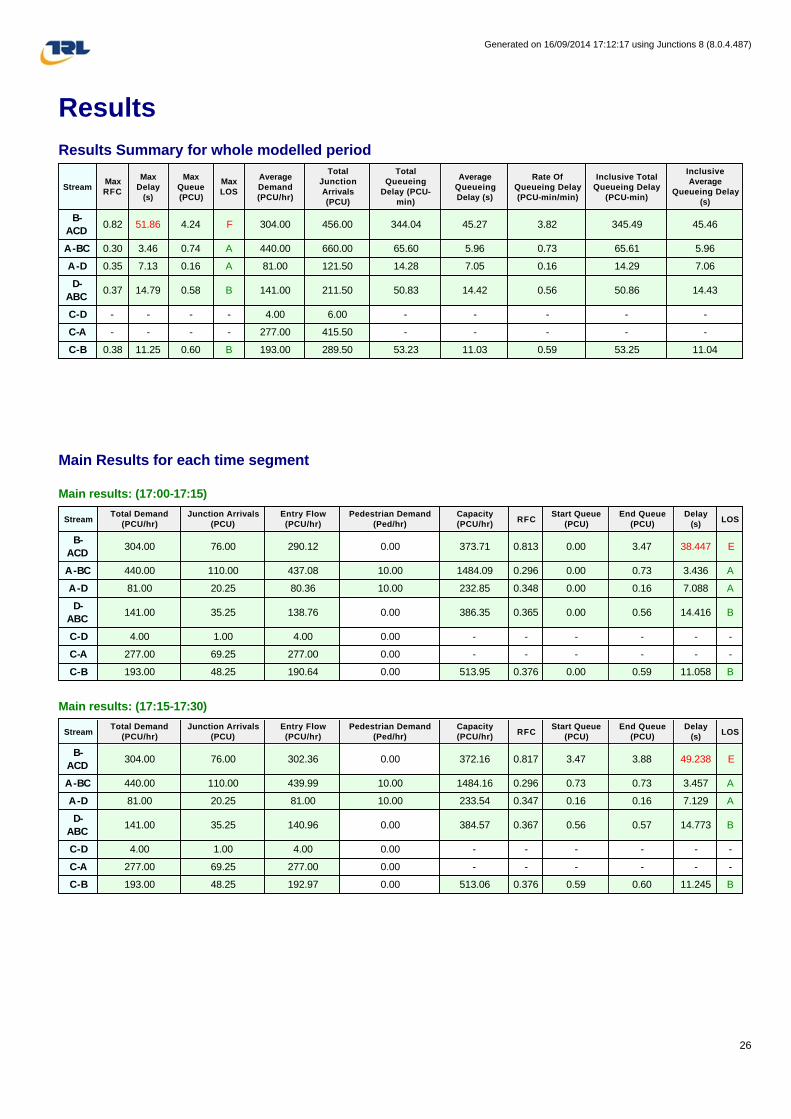
Results
Results Summary for whole modelled period
Main Results for each time segment
Main results: (17:00-17:15)
Main results: (17:15-17:30)
StreamMax
RFC
Max
Delay
(s)
Max
Queue
(PCU)
Max
LOS
Average
Demand
(PCU/hr)
Total
Junction
Arrivals
(PCU)
Total
Queueing
Delay (PCU-
min)
Average
Queueing
Delay (s)
Rate Of
Queueing Delay
(PCU-min/min)
Inclusive Total
Queueing Delay
(PCU-min)
Inclusive
Average
Queueing Delay
(s)
B-
ACD0.82 51.86 4.24 F 304.00 456.00 344.04 45.27 3.82 345.49 45.46
A-BC 0.30 3.46 0.74 A 440.00 660.00 65.60 5.96 0.73 65.61 5.96
A-D 0.35 7.13 0.16 A 81.00 121.50 14.28 7.05 0.16 14.29 7.06
D-
ABC0.37 14.79 0.58 B 141.00 211.50 50.83 14.42 0.56 50.86 14.43
C-D - - - - 4.00 6.00 - - - - -
C-A - - - - 277.00 415.50 - - - - -
C-B 0.38 11.25 0.60 B 193.00 289.50 53.23 11.03 0.59 53.25 11.04
StreamTotal Demand
(PCU/hr)
Junction Arrivals
(PCU)
Entry Flow
(PCU/hr)
Pedestrian Demand
(Ped/hr)
Capacity
(PCU/hr)RFC
Start Queue
(PCU)
End Queue
(PCU)
Delay
(s)LOS
B-
ACD304.00 76.00 290.12 0.00 373.71 0.813 0.00 3.47 38.447 E
A-BC 440.00 110.00 437.08 10.00 1484.09 0.296 0.00 0.73 3.436 A
A-D 81.00 20.25 80.36 10.00 232.85 0.348 0.00 0.16 7.088 A
D-
ABC141.00 35.25 138.76 0.00 386.35 0.365 0.00 0.56 14.416 B
C-D 4.00 1.00 4.00 0.00 - - - - - -
C-A 277.00 69.25 277.00 0.00 - - - - - -
C-B 193.00 48.25 190.64 0.00 513.95 0.376 0.00 0.59 11.058 B
StreamTotal Demand
(PCU/hr)
Junction Arrivals
(PCU)
Entry Flow
(PCU/hr)
Pedestrian Demand
(Ped/hr)
Capacity
(PCU/hr)RFC
Start Queue
(PCU)
End Queue
(PCU)
Delay
(s)LOS
B-
ACD304.00 76.00 302.36 0.00 372.16 0.817 3.47 3.88 49.238 E
A-BC 440.00 110.00 439.99 10.00 1484.16 0.296 0.73 0.73 3.457 A
A-D 81.00 20.25 81.00 10.00 233.54 0.347 0.16 0.16 7.129 A
D-
ABC141.00 35.25 140.96 0.00 384.57 0.367 0.56 0.57 14.773 B
C-D 4.00 1.00 4.00 0.00 - - - - - -
C-A 277.00 69.25 277.00 0.00 - - - - - -
C-B 193.00 48.25 192.97 0.00 513.06 0.376 0.59 0.60 11.245 B
Generated on 16/09/2014 17:12:17 using Junctions 8 (8.0.4.487)
26
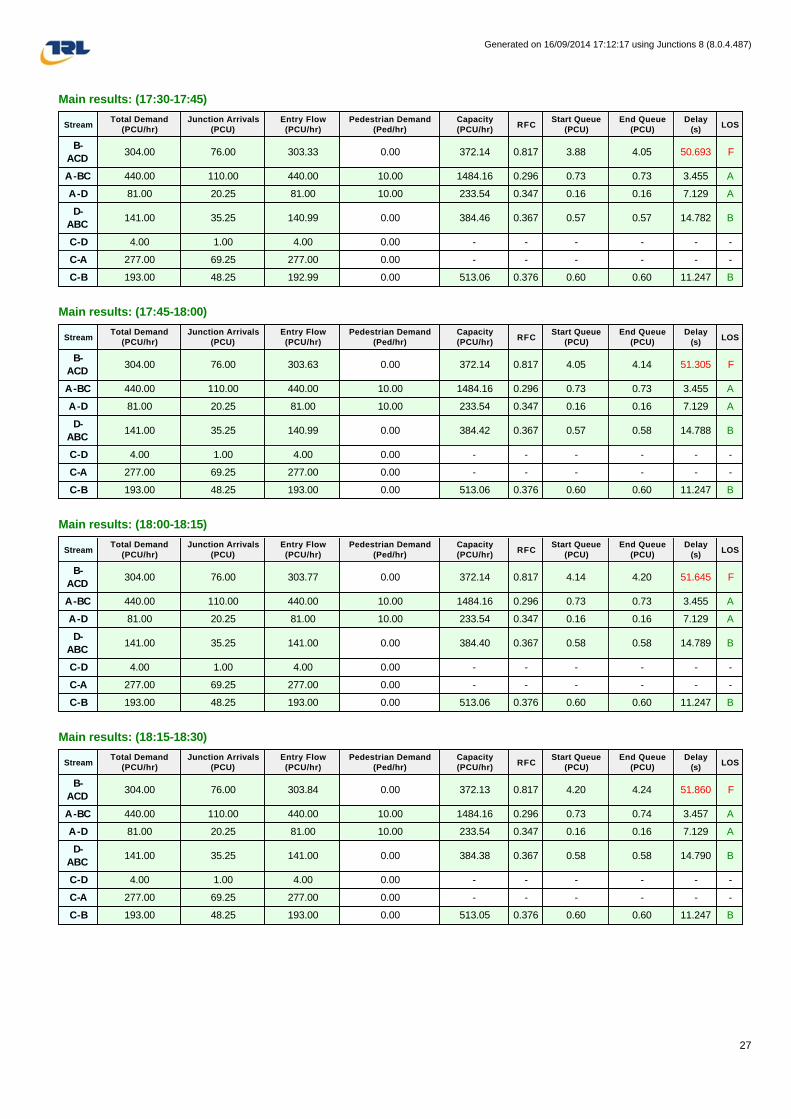
Main results: (17:30-17:45)
Main results: (17:45-18:00)
Main results: (18:00-18:15)
Main results: (18:15-18:30)
StreamTotal Demand
(PCU/hr)
Junction Arrivals
(PCU)
Entry Flow
(PCU/hr)
Pedestrian Demand
(Ped/hr)
Capacity
(PCU/hr)RFC
Start Queue
(PCU)
End Queue
(PCU)
Delay
(s)LOS
B-
ACD304.00 76.00 303.33 0.00 372.14 0.817 3.88 4.05 50.693 F
A-BC 440.00 110.00 440.00 10.00 1484.16 0.296 0.73 0.73 3.455 A
A-D 81.00 20.25 81.00 10.00 233.54 0.347 0.16 0.16 7.129 A
D-
ABC141.00 35.25 140.99 0.00 384.46 0.367 0.57 0.57 14.782 B
C-D 4.00 1.00 4.00 0.00 - - - - - -
C-A 277.00 69.25 277.00 0.00 - - - - - -
C-B 193.00 48.25 192.99 0.00 513.06 0.376 0.60 0.60 11.247 B
StreamTotal Demand
(PCU/hr)
Junction Arrivals
(PCU)
Entry Flow
(PCU/hr)
Pedestrian Demand
(Ped/hr)
Capacity
(PCU/hr)RFC
Start Queue
(PCU)
End Queue
(PCU)
Delay
(s)LOS
B-
ACD304.00 76.00 303.63 0.00 372.14 0.817 4.05 4.14 51.305 F
A-BC 440.00 110.00 440.00 10.00 1484.16 0.296 0.73 0.73 3.455 A
A-D 81.00 20.25 81.00 10.00 233.54 0.347 0.16 0.16 7.129 A
D-
ABC141.00 35.25 140.99 0.00 384.42 0.367 0.57 0.58 14.788 B
C-D 4.00 1.00 4.00 0.00 - - - - - -
C-A 277.00 69.25 277.00 0.00 - - - - - -
C-B 193.00 48.25 193.00 0.00 513.06 0.376 0.60 0.60 11.247 B
StreamTotal Demand
(PCU/hr)
Junction Arrivals
(PCU)
Entry Flow
(PCU/hr)
Pedestrian Demand
(Ped/hr)
Capacity
(PCU/hr)RFC
Start Queue
(PCU)
End Queue
(PCU)
Delay
(s)LOS
B-
ACD304.00 76.00 303.77 0.00 372.14 0.817 4.14 4.20 51.645 F
A-BC 440.00 110.00 440.00 10.00 1484.16 0.296 0.73 0.73 3.455 A
A-D 81.00 20.25 81.00 10.00 233.54 0.347 0.16 0.16 7.129 A
D-
ABC141.00 35.25 141.00 0.00 384.40 0.367 0.58 0.58 14.789 B
C-D 4.00 1.00 4.00 0.00 - - - - - -
C-A 277.00 69.25 277.00 0.00 - - - - - -
C-B 193.00 48.25 193.00 0.00 513.06 0.376 0.60 0.60 11.247 B
StreamTotal Demand
(PCU/hr)
Junction Arrivals
(PCU)
Entry Flow
(PCU/hr)
Pedestrian Demand
(Ped/hr)
Capacity
(PCU/hr)RFC
Start Queue
(PCU)
End Queue
(PCU)
Delay
(s)LOS
B-
ACD304.00 76.00 303.84 0.00 372.13 0.817 4.20 4.24 51.860 F
A-BC 440.00 110.00 440.00 10.00 1484.16 0.296 0.73 0.74 3.457 A
A-D 81.00 20.25 81.00 10.00 233.54 0.347 0.16 0.16 7.129 A
D-
ABC141.00 35.25 141.00 0.00 384.38 0.367 0.58 0.58 14.790 B
C-D 4.00 1.00 4.00 0.00 - - - - - -
C-A 277.00 69.25 277.00 0.00 - - - - - -
C-B 193.00 48.25 193.00 0.00 513.05 0.376 0.60 0.60 11.247 B
Generated on 16/09/2014 17:12:17 using Junctions 8 (8.0.4.487)
27
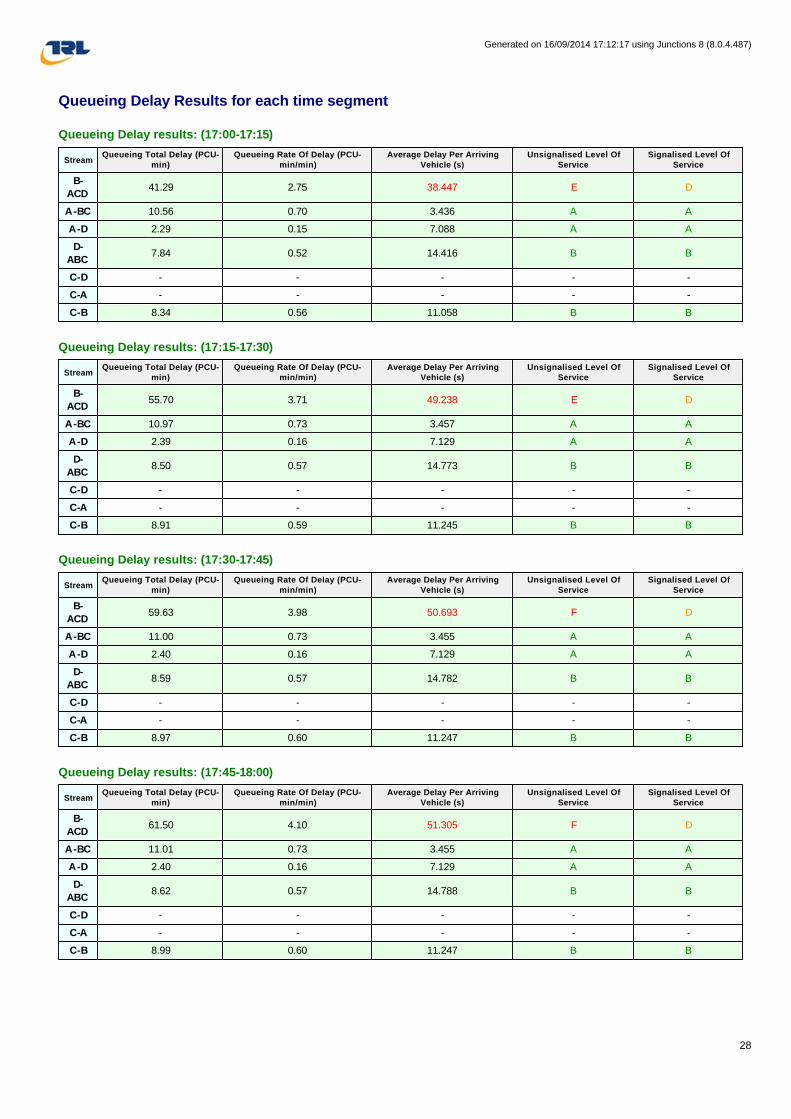
Queueing Delay Results for each time segment
Queueing Delay results: (17:00-17:15)
Queueing Delay results: (17:15-17:30)
Queueing Delay results: (17:30-17:45)
Queueing Delay results: (17:45-18:00)
StreamQueueing Total Delay (PCU-
min)
Queueing Rate Of Delay (PCU-
min/min)
Average Delay Per Arriving
Vehicle (s)
Unsignalised Level Of
Service
Signalised Level Of
Service
B-
ACD41.29 2.75 38.447 E D
A-BC 10.56 0.70 3.436 A A
A-D 2.29 0.15 7.088 A A
D-
ABC7.84 0.52 14.416 B B
C-D - - - - -
C-A - - - - -
C-B 8.34 0.56 11.058 B B
StreamQueueing Total Delay (PCU-
min)
Queueing Rate Of Delay (PCU-
min/min)
Average Delay Per Arriving
Vehicle (s)
Unsignalised Level Of
Service
Signalised Level Of
Service
B-
ACD55.70 3.71 49.238 E D
A-BC 10.97 0.73 3.457 A A
A-D 2.39 0.16 7.129 A A
D-
ABC8.50 0.57 14.773 B B
C-D - - - - -
C-A - - - - -
C-B 8.91 0.59 11.245 B B
StreamQueueing Total Delay (PCU-
min)
Queueing Rate Of Delay (PCU-
min/min)
Average Delay Per Arriving
Vehicle (s)
Unsignalised Level Of
Service
Signalised Level Of
Service
B-
ACD59.63 3.98 50.693 F D
A-BC 11.00 0.73 3.455 A A
A-D 2.40 0.16 7.129 A A
D-
ABC8.59 0.57 14.782 B B
C-D - - - - -
C-A - - - - -
C-B 8.97 0.60 11.247 B B
StreamQueueing Total Delay (PCU-
min)
Queueing Rate Of Delay (PCU-
min/min)
Average Delay Per Arriving
Vehicle (s)
Unsignalised Level Of
Service
Signalised Level Of
Service
B-
ACD61.50 4.10 51.305 F D
A-BC 11.01 0.73 3.455 A A
A-D 2.40 0.16 7.129 A A
D-
ABC8.62 0.57 14.788 B B
C-D - - - - -
C-A - - - - -
C-B 8.99 0.60 11.247 B B
Generated on 16/09/2014 17:12:17 using Junctions 8 (8.0.4.487)
28

Queueing Delay results: (18:00-18:15)
Queueing Delay results: (18:15-18:30)
StreamQueueing Total Delay (PCU-
min)
Queueing Rate Of Delay (PCU-
min/min)
Average Delay Per Arriving
Vehicle (s)
Unsignalised Level Of
Service
Signalised Level Of
Service
B-
ACD62.60 4.17 51.645 F D
A-BC 11.02 0.73 3.455 A A
A-D 2.40 0.16 7.129 A A
D-
ABC8.64 0.58 14.789 B B
C-D - - - - -
C-A - - - - -
C-B 9.00 0.60 11.247 B B
StreamQueueing Total Delay (PCU-
min)
Queueing Rate Of Delay (PCU-
min/min)
Average Delay Per Arriving
Vehicle (s)
Unsignalised Level Of
Service
Signalised Level Of
Service
B-
ACD63.33 4.22 51.860 F D
A-BC 11.03 0.74 3.457 A A
A-D 2.40 0.16 7.129 A A
D-
ABC8.65 0.58 14.790 B B
C-D - - - - -
C-A - - - - -
C-B 9.01 0.60 11.247 B B
Generated on 16/09/2014 17:12:17 using Junctions 8 (8.0.4.487)
29