Embed Size (px)
Citation preview

C10G-E038
Analytical and Testing Instruments for Artificial Photosynthesis

Index
Analysis of Reaction Products
Analysis of CO Generated from CO2 Reduction Reactions (GC)
Analysis of Formic Acid Generated from CO2 Reduction Reactions (GC)
Confirmation of Reaction Mechanism Using 13CO2 (GC-MS)
Simultaneous Analysis of Formic Acid and Formaldehyde (HPLC)
Analysis of Hydrogen Peroxide (HPLC)
Catalyst Characterization
Light Irradiation In-Situ Measurement of Semiconductor Photocatalyst (SPM)
Band Gap Measurement of Titanium Oxide (UV)
Measurement of Trace Semiconductor Photocatalyst Powder (XRD)
Evaluation of Photoreaction Quantum Yield of Supermolecular Complex (QYM)
Particle Size Measurement of Titanium Oxide (Particle Size Analyzer)
P 4
P 6
P 8
P 10
P 12
P 14
P 16
P 18
P 20
P 23

Semiconductor Catalyst Systems (Heterogeneous Systems)These systems use oxides or nitrides of titanium (Ti), tantalum (Ta) or other metals as
photocatalysts. Because they do not dissolve uniformly in solution, they are referred to as
heterogeneous catalysts. There is a wide variety of types with different reactivity. In an effort to
develop a photocatalyst with higher reaction efficiency, a variety of structures have been studied.
Supermolecular Systems (Homogenous Systems)These systems use metal complexes or supermolecular metal complexes of
ruthenium (Ru), rhenium (Re) or other metals as photocatalysts. Because they
dissolve uniformly in solution, they are referred to as homogeneous catalysts.
Hybrid Systems (Hybrid of Semiconductor and Supermolecular Metal Complex Systems)Hybrid systems improve reaction efficiency by using a combination of
semiconductor materials and (supermolecular) metal complexes.
Biological SystemsBiological systems use the photosynthesis reaction of bacteria, algae, or other organisms.
Example ofHomogeneousPhotocatalyst
What is Artificial Photosynthesis?
Artificial photosynthesis is technology that uses a photocatalyst and sunlight to perform photosynthesis artificially. It allows converting light energy into useful compounds for use as a next-generation renewable energy source.
More specifically, it uses a water-splitting reaction to generate hydrogen (H2) and oxygen (O2) from water or uses a reduction reaction to generate organic compounds such as carbon monoxide (CO), formic acid (HCOOH), methanol (CH3OH), and methane (CH4) from carbon dioxide (CO2). Artificial photosynthesis is a clean environmentally friendly technology that generates energy from ingredients such as water and carbon dioxide.
Artificial Photosynthesis Research
Water (H2O)
Carbon Dioxide (CO2)Sugars, Oxygen (O2)
Photocatalyst
Plant
Water-Splitting ReactionWater (H2O)
CO2 Reduction ReactionCarbon Dioxide (CO2)
Hydrogen (H2), Oxygen (O2)
Carbon Monoxide (CO)Formic acid (HCOOH)Methanol (CH3OH)Methane (CH4)
Pho
tosyn
thesis
Artifi
cial Pho
tosyn
thesis
4
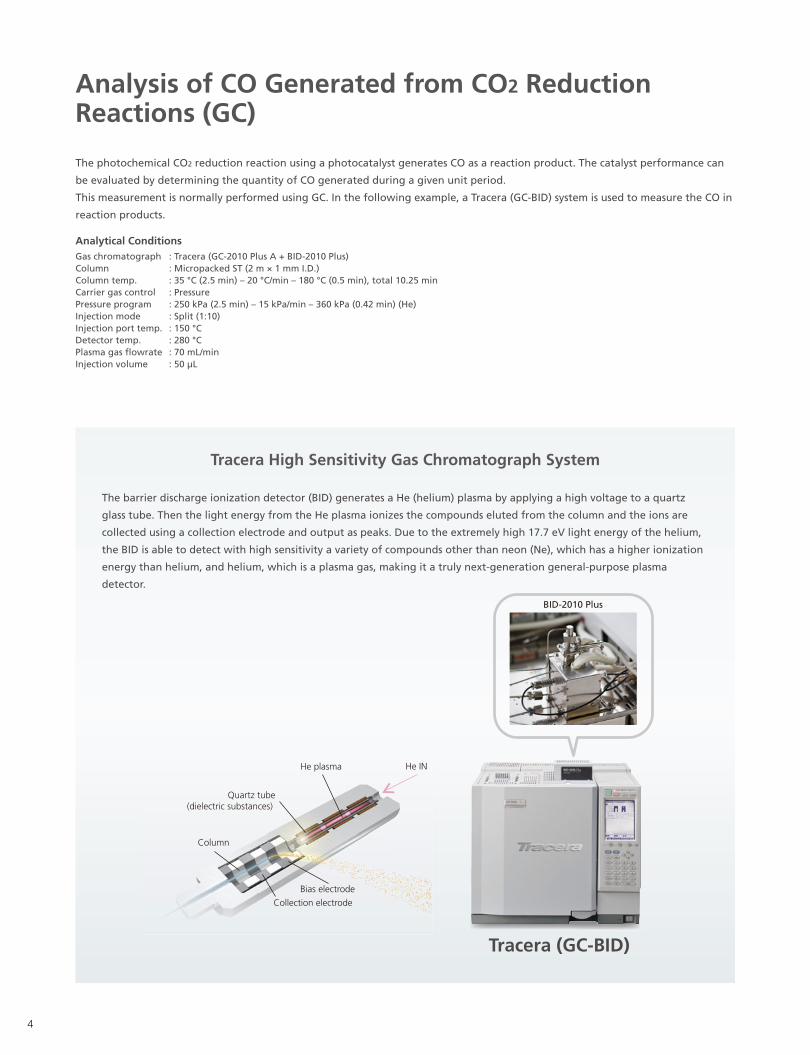
The photochemical CO2 reduction reaction using a photocatalyst generates CO as a reaction product. The catalyst performance can
be evaluated by determining the quantity of CO generated during a given unit period.
This measurement is normally performed using GC. In the following example, a Tracera (GC-BID) system is used to measure the CO in
reaction products.
Tracera High Sensitivity Gas Chromatograph System
Tracera (GC-BID)
Column
Bias electrode
Collection electrode
BID-2010 Plus
Gas chromatographColumnColumn temp.Carrier gas controlPressure programInjection modeInjection port temp.Detector temp.Plasma gas flowrateInjection volume
: Tracera (GC-2010 Plus A + BID-2010 Plus): Micropacked ST (2 m × 1 mm I.D.): 35 °C (2.5 min) – 20 °C/min – 180 °C (0.5 min), total 10.25 min: Pressure: 250 kPa (2.5 min) – 15 kPa/min – 360 kPa (0.42 min) (He): Split (1:10): 150 °C: 280 °C: 70 mL/min: 50 μL
Analytical Conditions
The barrier discharge ionization detector (BID) generates a He (helium) plasma by applying a high voltage to a quartz
glass tube. Then the light energy from the He plasma ionizes the compounds eluted from the column and the ions are
collected using a collection electrode and output as peaks. Due to the extremely high 17.7 eV light energy of the helium,
the BID is able to detect with high sensitivity a variety of compounds other than neon (Ne), which has a higher ionization
energy than helium, and helium, which is a plasma gas, making it a truly next-generation general-purpose plasma
detector.
He IN He plasma
Quartz tube(dielectric substances)
Analysis of CO Generated from CO2 ReductionReactions (GC)

5
Reactio
n Pro
du
ct An
alysisC
atalyst Characterization
Analytical Data
Chromatogram of Components in Gas Phase of Photochemical CO2 Reduction Reaction
Reaction Time (min)
Source: Associate Professor Hitoshi Ishida and Assistant Professor Yusuke Kuramochi, School of Science, Kitasato University, Japan Science and Technology Agency (JST), PRESTO
H2O2
N2
CO
CO H2
CO2
1.0 2.0 3.0 4.0 5.0 6.0 7.0 8.0 min
H2
Quantity of CO and H2 Generated Versus Reaction Time
Qua
ntity
of
Reac
tion
Prod
ucts
(μm
ol)
0
20
40
60
80
100
0 20 40 60 80 100 120 140
CO and also H2, O2, and N2 were all measured simultaneously with high sensitivity.
The BID allows measuring all sorts of components, except for helium and neon to obtain a wide variety of information
with a single measurement.

6
The photochemical CO2 reduction reaction using a photocatalyst generates formic acid as a reaction product.
Normally instruments such as liquid chromatographs, ion chromatographs, or capillary electrophoresis systems are used to analyze
formic acid. However, analyzing the formic acid dissolved in organic solvents requires diluting the solution by at least a factor of ten,
with water or mobile phase, which makes it difficult to analyze low concentrations in some cases.
However, gas chromatography (GC) allows measuring organic solvents directly without dilution. Furthermore, using a BID detector,
which is capable of detecting formic acid with high sensitivity, allows analyzing concentrations down to ppm levels.
This example describes using a GC-BID system to analyze formic acid in organic solvent.
Sample Pretreatment Using Cation-Exchange Cartridge
Alltech Maxi-Clean 0.5 mL IC-H50 pk P/N: 30264Strong cation exchangeRetention volume 1.9 meq/mL, which allows processing about 9 mL, given a sample containing 0.1 M of a monovalent salt
Gas chromatographColumnColumn temp.Carrier gasInjection modeInjection port temp.Detector temp.Plasma gas flowrateInjection volume
: Tracera (GC-2010 Plus A + BID-2010 Plus): RESTEK Rtx-WAX (60 m × 0.53 mmI.D., df = 1.0 μm): 80 °C – 5 °C/min – 130 °C – 15 °C/min – 230 °C (3 min): He at 50 cm/sec (constant linear velocity): Split (1:2): 240 °C: 240 °C: 50 mL/min: 1 μL
Analytical Conditions
If samples (or reaction solutions) contain salts or other contaminants, they must be removed by pretreatment. In this case,
a cation-exchange cartridge was used to pretreat an actual sample with 0.1 M dissolved NEt4BF4.
Cartridge conditioning
Inject sample
GC analysis
5 mL DMA at 2 mL/min or less
3 mL (dispose of 2 mL and recover 1 mL) at maximum 1 mL/min
Analysis of Formic Acid Generated from CO2
Reduction Reactions (GC)

7
Sample source: Professor Osamu Ishitani, Graduate School of Science and Engineering, Tokyo Institute of Technology
When conducting GC measurement of formic acid at low concentrations, care must be taken to prevent adsorption to the
various component surfaces. To prevent adsorption at the injection port and column, phosphoric acid treatment of the
glass insert and column is conducted. Detailed information can be found in Shimadzu Application News G279.
Also, if samples (or reaction solutions) contain salts or other contaminants, they must be removed by pretreatment prior to
GC measurement. Because it is considered that the adsorption of formic acid in the GC injection unit is due to
accumulation of salts which coexists with the sample in the injection unit. Detailed information can be found in Shimadzu
Application News G280.
Analytical Data
Chromatogram After Pretreating Actual Sample (DMA solvent and 0.1 M NEt4BF4)
2.5 5.0 7.5 10.0 12.5 15.0 17.5 min
11.75 12.00min
10 p
pm f
orm
ic a
cid
Form
ic a
cid
−250000
0
250000
500000
750000
1000000
1250000
1500000
1750000
μV
10 ppm of formic acid in the actual sample was detectable with high sensitivity.
Reactio
n Pro
du
ct An
alysisC
atalyst Characterization

8
The photochemical CO2 reduction reaction using a photocatalyst generates CO as a reaction product.
It is necessary to confirm whether the resulting CO was generated from the CO2 reduction reaction, as predicted, or entered the
reaction system or was generated from another source.
The occurrence of an expected reaction can be confirmed by causing a reduction reaction using 13CO2 labeled with 13C and
measuring the resulting 13CO with a GC-MS system.
This example describes 13CO measurements using a GC-MS system.
GCMS-QP2010 Ultra model features a newly designed electronic control platform that achieves the fastest scan speeds in
their class.
Furthermore, improved functionality allows shorter analytical cycle times and faster GC maintenance, increasing analytical
productivity in the laboratory.
In addition, an ECO mode reduces the power and carrier gas consumption when in standby mode, lowering operating
costs and the environmental impact.ironmenm tal impact.
GCMS-QP2010 Ultra Gas Chromatograph Mass Spectrometer
GC-MSColumn
[GC]Injection unit temp.Column oven temp.Injection modeControl modeCarrier gasInjection volume[MS]Interface temp.Ion source temp.Measurement modeMeasurement rangeEvent timeIonization methodIonization voltageEmission current
: GCMS-QP2010 Ultra: RT®-Msieve 5A (30 m L, 0.32 mm I.D., df = 30 μm, RESTEK P/N 19722) + Rtx®-1 (5 m × 0.25 mmI.D., df = 0.5 μm, particle trap)
: 200°C: 35 °C (2 min) → (10 °C /min) → 150 °C (5 min): Split (50:1): Pressure (100 kPa): Helium: 100 μL (injected using a gas-tight syringe)
: 200°C: 200°C: Scan: m/z 10 to 100: 0.3 sec: EI: 70 eV: 150 μA
Analytical Conditions
Confirmation of Reaction Mechanism Using13CO2 (GC-MS)

9
Reactio
n Pro
du
ct An
alysisC
atalyst Characterization
A is an extracted ion chromatogram of CO obtained with an experimental system using unlabeled CO2 (methanol solvent),
whereas B was obtained using 13CO2 (methanol solvent). B shows a peak at m/z 29 (13CO), but it also shows a peak at m/z
28 (CO). Therefore, it indicates that the CO generated from CO2 in this reaction is only a portion of the total CO.
Analytical Data
Fig. 1 Extracted Ion Chromatogram from Measuring Photocatalyst Reaction Products in Gas Phase Sample(A) Experiment using regular CO2 (B) Experiment using 13CO2
Source: Professor Osamu Ishitani, Graduate School of Science and Engineering, Tokyo Institute of Technology
Sekizawa, K; Maeda, K; Domen, K; Koike, K; Ishitani, O. J. Am. Chem. Soc., 2013, 135, 4596.Artificial Z-Scheme Constructed with a Supramolecular Metal Complex and Semiconductor for the Photocatalytic Reduction of CO2
m/z 28
m/z 29
Inte
nsity
/a.u
.
4.6 4.8 5.0 5.2
A
m/z 28
m/z 29
Inte
nsity
/a.u
.
4.6 4.8 5.0 5.2
Using 13CO2 (13C 99%)
B
Using regular CO2

10
Some reaction systems using photocatalysts simultaneously produce both formic acid and formaldehyde in the reaction solution.
This example describes using a Shimadzu organic acid analysis system to analyze formic acid and other organic acids based on the pH
buffering method and simultaneously analyze formaldehyde using a differential refractive index detector.
Maximizing the Potential of UHPLC/HPLC AnalysisThe Nexera X2 is a UHPLC system that is even more advanced than the Nexera. The flexible system design achieves a true
fusion between UHPLC and HPLC, which means the Nexera X2 can be used for a much broader range of applications.
The Nexera X2 is a completely new UHPLC system that offers the highest levels of speed, sensitivity, separation, stability,
and reliability.
Nexera X2 Ultra High Performance Liquid Chromatograph
Column
Mobile phaseFlowrateColumn temp.Reaction reagent
FlowrateReaction temp.DetectorsInjection volume
: YMC Hydrosphere C18 (150 mmL. × 4.6 mmI.D.) Shim-pack SCR-102H (300 mmL. × 8.0 mmI.D.) × 2: 5 mmol/L Perchloric Acid: 0.6 mL/min: 40°C: 5 mmol/L Perchloric Acid 20 mmol/L Bis-Tris 0.1 mmol/L EDTA-4H: 0.6 mL/min: 40°C: Electrical conductivity and reflective index: 100 μL
Analytical Conditions
Simultaneous Analysis of Formic Acid andFormaldehyde (HPLC)

11
Reactio
n Pro
du
ct An
alysisC
atalyst Characterization
Analytical Data
Analysis of Formaldehyde and Organic Acids Using a Differential Refractive Index Detector
Analysis of Organic Acids Using an Electrical Conductivity Detector
Shimadzu's organic acid analysis system is often used to analyze organic acids based on the pH buffering method, which
offers superior separation and selectivity. However, the Shim-pack SCR-102H ion-exclusion column used with that system
results in overlapping between formic acid and formaldehyde peaks. Therefore, a reversed-phase YMC Hydrosphere C18
column was added to improve separation.
In addition, because formaldehyde cannot be detected with an electrical conductivity detector, a differential refractive
index detector was also connected in series.
The figures show an example from analyzing a standard sample containing a few hundred ppm of each component. Note
that differential refractive index detectors are inferior to other detectors both in terms of sensitivity and selectivity.
Peaks:1. Formic Acid2. Acetic Acid3. Propionic Acid4. Formaldehyde
μS/cm
μRIU

12
In some cases hydrogen peroxide is produced in reaction systems using photocatalysts.
To analyze hydrogen peroxide in reaction solutions with high sensitivity, it is useful to use an HPLC system equipped with an
electrochemical detector (ECD).
In this example, hydrogen peroxide is detected with high sensitivity in water.
Electrochemical detectors use a redox reaction. Due to high selectivity, it is able to detect target components with high
sensitivity even in samples with large numbers of contaminants.
HPLC Equipped With Electrochemical Detector (ECD)
Mobile phaseColumnFlowrateInjection volumeColumn temp.Detector
Standard sampleConcentration of standard
samples for calibration curve
Analytical Conditions
Eicom Brand
ECD-700S / ATC-700Nexera X2
: 50 mmol/L sodium sulfate + 100 μmol/L aqueous EDTA 2Na solution: Inertsil CX (250 mmL. × 4.6 mmI.D., 5 μm): 0.8 mL/min: 10 μL: 40°C: Eicom-ECD + 500 mV vs. Ag/AgCl 1.0 sec time constant, 25 °C
: Hydrogen peroxide (30 % aqueous hydrogen peroxide), Wako Pure Chemical Industries super special grade
: 0.001, 0.004, 0.04, 0.4, 4 mg/L (prepared with mobile phase)
Materials provided by:Materials provid
Analysis of Hydrogen Peroxide (HPLC)
* ECD-700S/ATC-700 may not be sold in your country. Please contact us to check the availability in your country.

13
Reactio
n Pro
du
ct An
alysisC
atalyst Characterization
Hydrogen peroxide was measured with high sensitivity in water at μg/L level concentrations. The results showed good
linearity and reproducibility.
Analytical Data
Calibration Curve
Summary of Results
Chromatograms for Different Concentrations
Chromatograms
Level Conc. Avg. Area Area %RSD Area 1 Area 2 Area 3
1
2
3
4
5
4
0.4
0.04
0.004
0.001
6584697
856046
92544
13715
7873
0.076
0.399
0.177
0.265
0.324
6579170
852120
92722
13713
7858
6585967
857648
92509
13752
7902
6588953
858370
92400
13679
7859
Chromatograms for Different Concentrations(Overlaid)
Area
Calibration Curve InformationY = aX + ba = 2.18074e+006b = 52520.7R2 = 0.9991648R = 0.9995823
External standard methodCalibration curve: Straight lineIntercept at origin: NoWeighted: No
Calibration Curve

14
Light source
In addition to observing the shape of micro areas of a sample surface, scanning probe microscopes (SPM) can also be used to acquire
various information about the properties of the surface, such as phase, magnetic force, and viscoelasticity.
In this example, the electrical potential on a surface irradiated with light was measured to determine the excitation level of a
photocatalyst.
Light Irradiation-Scanning Probe Microscope System allow observing the shape of surfaces and measuring surface
properties with the surface illuminated with light. Because it allows performing in situ measurements while illuminated, it
can be used to analyze the sample that is absorbing light, such as to measure the photocatalyst excitation status or
electrical generation status of solar cells. Therefore, it is ideal for monitoring and evaluating changes in sample status in
response to photoirradiation.
Optical fiber is routed to the sample surface to illuminate
it with light from above.
Irradiated light is introduced via various external sources,
such as laser, high-pressure mercury lamp, or LED.
SPM-9700 Light Irradiation-Scanning Probe Microscope System
SPM-9700
Light Irradiation Unit(Top Surface)
Sample Bottom Surface Laser Illumination Kit(Bottom Surface)
InstrumentsAtmosphereScan speedPixelsModeUV exposure
: SPM-9700 and light irradiation unit (top surface irradiation): Atmospheric air: 0.3 Hz: 256 × 256: KFM: Ozone-free mercury-xenon lamp, 300 to 450 nm
Measurement Conditions
Optical fiber
Light Irradiation In-Situ Measurement ofSemiconductor Photocatalyst (SPM)

15
Platinum supported titanium (TiO2) microparticles used as semiconductor catalysts were secured to a glass substrate and
then the surface potential and shape were observed using a scanning probe microscope (SPM).
The left image was obtained in atmospheric air, whereas the right image was obtained from the identical location
illuminated with UV light from above.
In the atomic force microscope (AFM) 3D contour images (lower left and right), the shape of the catalyst particles does
not change by UV irradiation.
However, the surface potential images (upper left and right) indicate that the surface potential of the catalyst particles
increases by an average 130 mV after exposure to UV light, which was a reversible change. This indicates that charge
separation occurs at the catalyst surface by photoirradiation.
Measurement Data
Sample source: Associate Professor Kazuhiko Maeda, Department of Chemistry, Graduate School of Science and Engineering, Tokyo Institute of Technology
Surface Potential Image Before UV Irradiation200 mV Average Difference in Potential Between
Glass Substrate and Catalyst Particles
AFM Profile Image Before UV Irradiation
Surface Potential Image Under UV Irradiation330 mV Average Difference in Potential Between
Glass Substrate and Catalyst Particles
AFM Profile Image Under UV Irradiation
0.26500.00 nm 1.00 × 1.00 μm
UVirradiation
UVirradiation
0.66[V]
TiO2/glass Before UV Irradiation
0.92500.00 nm 1.00 × 1.00 μm
1.32[V]
TiO2/glass Under UV Irradiation
0.00500.00 nm 1.00 × 1.00 μm
190.00[nm]
TiO2/glass Before UV Irradiation
0.00500.00 nm 1.00 × 1.00 μm
190.00[nm]
TiO2/glass Under UV Irradiation
Reaction Product Analysis
Catalyst C
haracterizatio
n
Surface potentialchangedsignificantly byUV irradiation.
The profiledid not changeby UV irradiation.
Surface Potential Image
AFM Profile Image

16
Photocatalysts provide catalytic effects when they absorb light and become excited. Because each photocatalyst has a characteristic
band gap, they are excited in different wavelength regions.
Since UV-visible absorption spectra are used to confirm the excitation wavelengths, they serve as the most fundamental of tools for
evaluating photocatalysts.
In this example, the band gap of titanium oxide was measured using a UV spectrophotometer.
Titanium oxide, which is a material typically used in photocatalysts, has three types of crystal structures— anatase, rutile, and
brookite forms. Each type has different density, refractive index, and other properties.
The band gap was determined for anatase and rutile type titanium oxide powders, the types mostly commonly used for industrial
applications, by measuring the diffuse reflectance.
UV-2600 UV-VIS Spectrophotometer
UV-2600 + ISR-2600Plus
• Featuring a compact size and a proprietary Lo-Ray-Ligh grade diffraction grating, the UV-2600 achieves
especially high efficiency and low stray light levels.
• The ISR-2600 Plus integrating sphere unit includes two detectors, a photomultiplier tube and InGaAs detector,
for high sensitivity measurement capability over a wavelength range from 220 to 1400 nm.
• Combination of the UV-2600 and ISR-2600 Plus, which allows measuring wavelengths ranging from UV to near
infrared, is ideal for evaluating the wavelengths absorbed by photocatalysts.
Instruments used
Measurement wavelength rangeScan speedSampling pitchPhotometric valueSlit widthDetector switchover wavelength
: UV-2600 UV-VIS Spectrophotometer ISR-2600 Plus Integrating Sphere Attachment: 200 to 1400 nm: Medium: 1.0 nm: Reflectance: 5 nm: 830 nm
Measurement Conditions
Band Gap Measurement of Titanium Oxide (UV)

17
Reaction Product Analysis
Catalyst C
haracterizatio
n
Analytical Data
BandGap Calculation ResultsRutile: 3.20 eVAnatase: 3.49 eV
Diffuse Reflectance Spectra of Titanium Oxide
The band gap was determined from the diffuse reflectance spectra. The Excel band gap calculation macro is used by
loading spectral data, selecting [Measuring mode (Transmittance/Reflectance)] and [Value of n] (type of transition
process), and then specifying the range that can be approximated as a straight line near the inflection point as the
tangent line. This makes it easy to determine the band gap value using a Tauc plot.
Anatase
Rutileu
Excel Macro Program for Calculating Band Gap
Calculation Results Window
Settings Window

18
Semiconductor photocatalysts such as metal oxides and nitrides are identified, qualified, or their crystallinity evaluated using X-ray
diffractometers (XRD).
XRD results show diffraction patterns that are plotted with diffraction angle on the horizontal axis and diffraction intensity on the
vertical axis. Then these patterns are compared to the diffraction patterns for known substances for identification and qualification.
However, because the sample surface shape can affect diffraction pattern results, sufficient sample quantity is generally required for
powder samples, so that a flat surface can be formed for measurement.
However, polycapillary parallel beam optics system reduces such problems and enables high measurement sensitivity and precision
even with small sample quantities.
In this example, multiple semiconductor photocatalysts were measured and compared.
XRD was used to measure KCa2Nb3O10, which is a layered ion-exchange material comprising calcium niobate perovskite layers and
potassium ion layers, used as a semiconductor photocatalyst.
5.6 mg of the powder sample was placed on the non-reflective sample plate for measurement.
Polycapillaries are multiple narrow glass tubes used to guide X-rays. These capillary tubes guide the X-rays emitted from a
point-source at a very high solid angle into parallel beams at the output port on the opposite end.
Compared to a standard optics system (Bragg–Brentano method), this system utilizes the X-rays emitted from the X-ray
tube more efficiently, which allows achieving higher diffracted X-ray intensities. Furthermore, because the optical system
uses parallel beams, the diffraction angle remains unchanged even if the sample measurement surface shift positions.
Consequently, it resolves problems that standard optics systems can have with separation of diffracted rays or angle
shifting and it allows measuring small quantities of powder samples without a flat surface or curved samples with high
sensitivity and precision.
XRD Polycapillary Optics System
SEM ImageXRD-7000
Item
Instruments
Goniometer Radius
X-Ray Source
Tube Voltage/Current
Anti-Scattering Plate Height
Slit
Monochromator
Stage
Scan Range
Scan Step Size
Scan Speed
Integration Time
Polycapillary Optical System
XRD-7000
200 mm
LFF Cu tube + polycapillary
40 kV / 40 mA
4 mm
None
Yes
Standard sample stand
5 to 35 deg
0.02 deg
2 deg/min
0.6 sec/step
Focused Beam Optical System
XRD-7000
200 mm
LFF Cu tube
40 kV / 40 mA
None
DS 1 deg., SS 1 deg., RS 0.3 mm
Yes
Standard sample stand
5 to 35 deg
0.02 deg
2 deg/min
0.6 sec/step
Measurement Conditions
Powder Sample on Non-Reflective Sample Plate
Anti-scatteringplate (polycapillary optics system only)
Sample (5.6 mg)
Non-reflectivesample plate
30 % take-outefficiency
X-ray tubeUnit comprising hundredsof thousands of fibers
0.22 degree angleof divergence
Output beam10 × 10 mm
Polycapillary Parallel Beam Optics System
Measurement of Trace SemiconductorPhotocatalyst Powder (XRD)

19
Reaction Product Analysis
Catalyst C
haracterizatio
n
Analytical Data
Sample source: Associate Professor Kazuhiko Maeda, Department of Chemistry, Graduate School of Science and Engineering, Tokyo Institute of Technology
The figure shows results from using polycapillary and standard optics systems to measure KCa2Nb3O10 powder synthesized
by baking at 1423 K for 10 hours using the SSR (solid state reaction) method.
The polycapillary optics system resulted in about three times higher intensity levels than the standard optics system, where
the error in 2θ due to sample status (height) is assumed to be small.
The figure shows results from using the polycapillary optics system to measure KCa2Nb3O10 powder samples prepared
using four different synthesis conditions. At 823 K, the peaks are much broader than the other three samples, which
indicates low crystallinity. Based on the measurement results for the samples synthesized using the PC (polymerized
complex) method at 1123 K for 2 hours and at 1423 K for 2 hours, increasing the heating temperature resulted in a
smaller FWHM value, which is presumably due to higher crystallinity. The results also showed a difference in FWHM
between 1423 K 2-hour PC and 1423 K 10-hour SSR methods, which confirms that the differences in synthesis parameters
affected crystallinity.
1423K 10h SSR
1423K 2h PC
1123K 2h PC
823K 2h PC
002
004
006
100
110
107
106
105
104 00
8
Diffraction Pattern from Polycapillary and Focused Beam Optical Systems
Polycapillary
Standard
Inte
nsi
ty/c
ps
Diffraction Patterns for KCa2Nb3O10 Powder Samples Prepared Using Different Synthesis Parameters
(deg.)
(deg.)

20
The photoreaction quantum yield is one performance indicator for photochemical reactions or photocatalysts. It is the ratio between
the number of reaction product molecules from a photochemical reaction (or alternatively the reduction in number of molecules in
the substrate) and the number of photons absorbed.
Conventionally, chemical actinometers based on substances with known quantum yield, such as iron oxalate, were used. However,
this method requires performing experiments for long periods in a dark room by skilled personnel and also requires repeating the
experiments if irradiation parameters are changed. It also has other problems, such as not being able to compensate for changes in
light absorption by samples due to reactions.
Therefore, we developed the QYM-01 photoreaction quantum yield evaluation system which permits accurate and easy quantitation
measurements of absorbed photons in conjunction with Professor Osamu Ishitani, Graduate School of Science and Engineering,
Tokyo Institute of Technology.
In this example, we confirmed how results from the new system correlate with the conventional method.
Accurately and Easily measurement of the number of photons absorbed by Sample SolutionsAllows simultaneously measuring changes in UV-VIS absorption spectra in photoreaction solutions
QYM-01 Photoreaction Quantum Yield Evaluation System
QYM-01 QYM-01 OverviewAllows continuous measurement of UV-VIS absorption spectra during photoreactions
Capable of sample cell temperature control, sample solution stirring,and automatic excitation light shuttering
The QYM-01 was developed jointly with Ishitani–Maeda Laboratory, Department of Chemistry, Graduate School of Science and Engineering,Tokyo Institute of Technology.
Accommodates a wide range of photoreaction excitation light conditions (wavelength and light level).
• Allows changing the excitation wavelength and measuring the number of absorbed photons anywhere between 250 nm to 800 nm.
• The excitation light level can be adjusted and set by adjusting the number of photons irradiated.
Easy Measurements
• Includes a built-in spectrometer which has been calibrated using a NIST (National Institute of Standards and Technology)-traceable actinometer of which absolute light quantity is managed.
• Eliminates the need for calibration using a chemical actinometer.
• The excitation light level and wavelength switching is controlled via computer software.
• Includes simple computer software. Measures the number of photons using optimal measurement parameters.
Supports accurate measurements.
• Simultaneous UV-VIS absorption spectra measurement capability, a correction function for changes in the light level of the excitation light source, and other features ensure the number of absorbed photons can be measured accurately.
• Displays the photo count in real time. Allows confirming the current measurement status.
Features
Evaluation of Photoreaction Quantum Yield ofSupermolecular Complex (QYM)
Photoreactionexcitationlight source
Powermeter Shutter
Shutter
Detector
Light sourcefor measuringspectra
Power meter
ND filter

21
-3.00E-07
2.00E-07
7.00E-07
1.20E-06
1.70E-06
2.20E-06
2.70E-06
3.20E-06
3.70E-06
-1.00E-06
0.00E-06
1.00E-06
2.00E-06
3.00E-06
4.00E-06
5.00E-06
Chemical actinometer
QYM-01
Irradiation time (min)
Chemical actinometer
QYM-01
Irradiation time (min)
y = 3.73E-07xR2 = 1.00 y = 3.48E-07x
R2 = 1.00
Experiment 1 Light Intensity Measurement Result (at 365 nm)
Nu
mb
er o
f Ph
oto
ns
Ab
sorb
ed b
y So
luti
on
(Ei
nst
ein
)
Analytical Data
Reaction Product Analysis
Catalyst C
haracterizatio
n
Chemical ActinometerQYM-01
Number of Absorbed Photons (Einstein/s)
Experiment 2
5.40 × 10⁻⁸
5.78 × 10⁻⁸
Experiment 1
5.84 × 10⁻⁹
6.19 × 10⁻⁹
Number of Absorbed Photons
Excitation Light WavelengthSample ConcentrationPhoton Yield(value indicated in the fifthedition of "Jikken Kagaku Koza")
Experiment 1
365 nm (Xenon lamp)6 mM1.22
Experiment 2
480 nm (Xenon lamp)150 mM0.94
Experiment Conditions
Source: Ishitani−Maeda Laboratory, Department of Chemistry, Graduate School of Science and Engineering, Tokyo Institute of Technology.
y = 3.45E-06xR2 = 0.99 y = 3.25E-06x
R2 = 0.98
Experiment 2 Light Intensity Measurement Result (at 480 nm)
Nu
mb
er o
f Ph
oto
ns
Ab
sorb
ed b
y So
luti
on
(Ei
nst
ein
)
The QYM-01 was verified by comparing measurements of the absorbed light intensity by the QYM-01 and a chemical
actinometer. The QYM-01 was used to irradiate an aqueous potassium trioxalatoferrate (III) sample with photoreaction
excitation light and measure the photons absorbed. Then the number of photons absorbed was determined from the
amount of iron (II) produced in solutions with different irradiation periods in accordance to the relevant section in the
fifth edition of "Jikken Kagaku Koza" (Series of Experimental Chemistry), published by the Chemical Society of Japan.
Comparison of QYM-01 and Chemical Actinometer (Iron Oxalate)by Measuring Light Intensities
22
References 1) Y. Tamaki, K. Watanabe, K. Koike, H. Inoue, T. Morimoto, O. Ishitani, Faraday Discuss. 2012, 155, 115.
Source: Ishitani–Maeda Laboratory, Department of Chemistry, Graduate School of Science and Engineering, Tokyo Institute of Technology.
Analytical Data
Experiment ConditionsPhotocatalyst
Reaction Conditions
Operating Procedure
PhotocatalystDonor reducing agentSolventSolution volumeIrradiation lightReaction vessel
Ru-Re (FPh) (0.3 mM)BNAH (0.1 M)DMF-triethanolamine (5:1 v/v solvent mixture)4 mL480 nm xenon lampQuartz cell with branch (4 polished windows)
(11 mL volume, 7 mL gas phase, 4 mL liquid phase)
Transfer the prepared solution to the 4-sided quartz cell with branch using a 4-mL transfer pipette.Bubble with CO2 for 30 minutes and then seal the cell with a septum (prepare 3).Then after irradiating with light for 1, 2, or 2.5 hours, use a gas-tight syringe to acquire 100 μL of gas from the gas phase and quantitate the CO by GC.
Ru-Re (FPh) (From Tokyo Chemical Industry, Product No. R0100, used without purification)
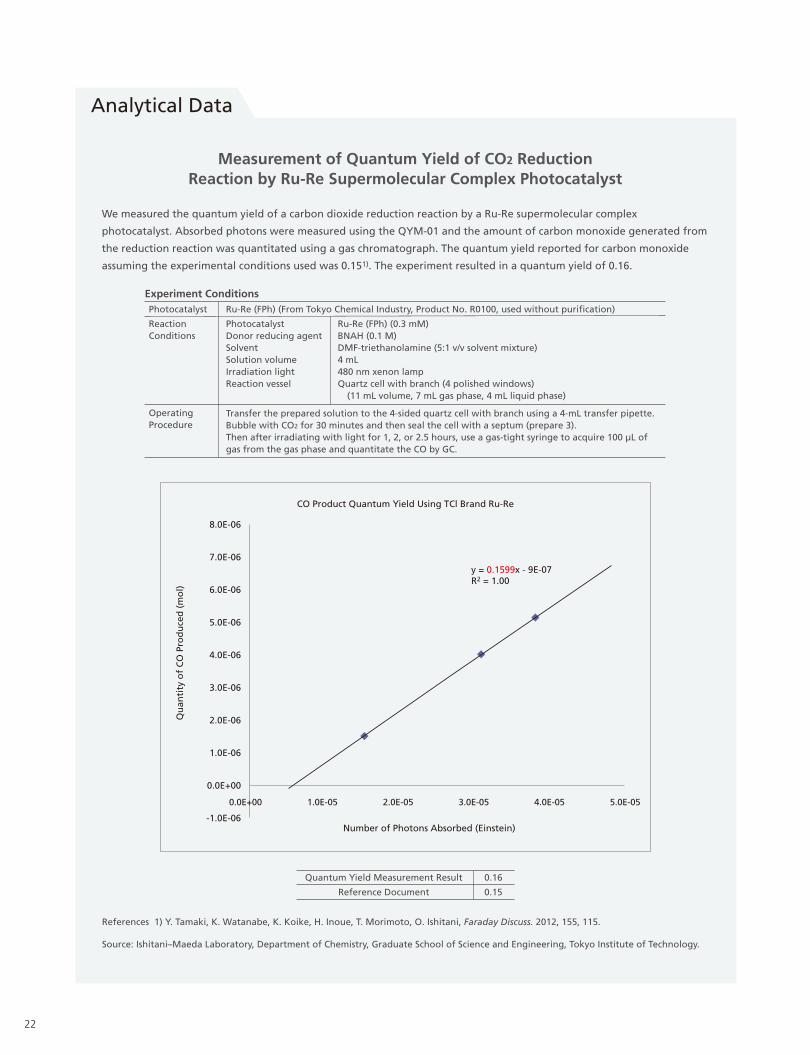
CO Product Quantum Yield Using TCl Brand Ru-Re
y = 0.1599x - 9E-07R2 = 1.00
Qu
anti
ty o
f C
O P
rod
uce
d (
mo
l)
8.0E-06
7.0E-06
6.0E-06
5.0E-06
4.0E-06
3.0E-06
2.0E-06
1.0E-06
0.0E+00
-1.0E-06Number of Photons Absorbed (Einstein)
We measured the quantum yield of a carbon dioxide reduction reaction by a Ru-Re supermolecular complex
photocatalyst. Absorbed photons were measured using the QYM-01 and the amount of carbon monoxide generated from
the reduction reaction was quantitated using a gas chromatograph. The quantum yield reported for carbon monoxide
assuming the experimental conditions used was 0.151). The experiment resulted in a quantum yield of 0.16.
Measurement of Quantum Yield of CO2 ReductionReaction by Ru-Re Supermolecular Complex Photocatalyst
Quantum Yield Measurement Result
Reference Document
0.16
0.15
0.0E+00 1.0E-05 2.0E-05 3.0E-05 4.0E-05 5.0E-05

23
Reactions that generate hydrogen, formic acid, or other products, in artificial photosynthesis with photocatalysts occur at the
surface of the photocatalyst. Therefore, an understanding of the particle size distribution is needed for evaluating reaction
efficiency and other purposes.
In addition, semiconductor photocatalysts used in self-cleaning glass, antimicrobial coatings, and other products related to
preventing contamination or cleaning the environment are created by dispersing catalyst powder in liquid, which requires
controlling the particle size distribution.
In this example, Titanium dioxide was measured using a particle size analyzer.
Analytical Data
The SALD-2300 laser diffraction particle size analyzer is capable of
measuring a very wide range of particle diameters, from 17 nm to
2500 μm.
Furthermore, it can be used not only for wet-mode measurements,
with powder samples dispersed in liquid, but also for dry-mode
measurements of powders as they are.
SALD-2300 Laser Diffraction Particle Size Analyzer
SALD-2300
IG-1000 Plus
The IG-1000 Plus uses a new IG (induced grating) measurement principle to analyze
particle diameters ranging from 0.5 nm to 200 nm.
In particular, it achieves high reproducibility when measuring particles smaller than
10 nm, which were difficult to measure using conventional dynamic light scattering
methods.
IG-1000 Plus Single Nano Particle Size Analyzer
Titanium Dioxide Particle Size Measurement Results (up to 1 μm diameter particles)
Titanium Dioxide Particle Size Measurement Results (particles with diameters in the tens of nm)
Reaction Product Analysis
Catalyst C
haracterizatio
n
T
2
w
SALD-2300 Laser Dif
SALDD-22330000
P i l Si M R l ( i l i h di
No
rmal
ized
Par
ticl
e A
mo
un
t
Particle Diameter (μm)
Particle Size Distribution (Volume Dimension)
Particle Diameter (μm)
Particle Size Measurement of Titanium Oxide(Particle Size Analyzer)
No
rmal
ized
Par
ticl
e A
mo
un
t

3655-10408-10ANS
Company names, product/service names and logos used in this publication are trademarks and trade names of Shimadzu Corporation or its affiliates, whether or not they are used with trademark symbol “TM” or “®”.Third-party trademarks and trade names may be used in this publication to refer to either the entities or their products/services. Shimadzu disclaims any proprietary interest in trademarks and trade names other than its own.
For Research Use Only. Not for use in diagnostic procedures. The contents of this publication are provided to you “as is” without warranty of any kind, and are subject to change without notice. Shimadzu does not assume any responsibility or liability for any damage, whether direct or indirect, relating to the use of this publication.
© Shimadzu Corporation, 2014www.shimadzu.com/an/
Analytical and Testing Instrum
ents for Artificial Photosynthesis