Embed Size (px)
Citation preview

[Computerized analysis of Vincent van Gogh’s painting brushstrokes]
s image data acquisition technology has advanced in the past decade, museums haveroutinely begun to assemble vast digital libraries of images of their collections. The
cross-disciplinary interaction of image analysis researchers andart historians has reached a stage where technology devel-opers can focus on image analysis tasks supportive
of the art historian’s mission of painting analysis in addition toactivities in image acquisition, storage, and database search[2], [20].
In particular, the problem of artist identificationseems ripe for the use of image processing tools. Inmaking an attribution, experts often use not onlycurrent knowledge of the artist’s common prac-tices, in combination with meticulous com-parisons of a variety of technical data(acquired, e.g., through ultraviolet fluores-cence, infrared reflectography, x-radiogra-phy, paint sampling, and/or canvas weavecount), but they also include a visualassessment of the presence of the artist’s“handwriting” in the brushwork. This sug-gests that mathematical analysis of a paint-ing’s digital representation could assist theart expert in the process of attribution.
A survey of the literature [3], [17], [19],[22], [26], [30] reveals that image processingtools aimed at supplementing the art historian’stoolbox are currently in the earliest stages of devel-opment. In part, this is because the necessary data forresearch has not been made widely available. To jump-start the development of such methods, the Van Gogh andKröller-Müller Museums in The Netherlands graciouslyagreed to make a data set of 101 high-resolution gray-scale scans
[C. Richard Johnson, Jr., Ella Hendriks, Igor J. Berezhnoy, Eugene Brevdo,
Shannon M. Hughes, Ingrid Daubechies, Jia Li, Eric Postma, and James Z. Wang]
Image Processing forArtist Identification
Digital Object Identifier 10.1109/MSP.2008.923513
© 1995 MASTER SERIES
1053-5888/08/$25.00©2008IEEE IEEE SIGNAL PROCESSING MAGAZINE [37] JULY 2008
A

of paintings within their collections available to groups of imageprocessing researchers from several different universities. Toour knowledge, this is the first time that a data set of such sizeand quality has been available for this purpose or that such adata set has been available simultaneously to multiple researchgroups, so that results of the different approaches in develop-ment can be compared directly. For more details, see [14]. Thisarticle describes the approaches to brushwork analysis and artistidentification developed by three research groups, within theframework of this data set.
ART HISTORICAL BRUSHSTROKE ANALYSISIt is important to understand what the art specialist currentlyconsiders when visually assessing brushwork in paintings. A lit-erature search shows that few art specialists have attempted todescribe a method or provide guidelines for the visible analysisof brushwork in paintings. Differences in individual perception,viewing conditions, and knowledge of the picture’s materials,state of preservation, and the painter’s common working meth-ods are just some factors that play a role.
A first step is to establish which parts of a painting shouldbe discounted in an evaluation of brushwork, since they maynot be due to the artist’s hand. A variety of imaging techniquescan be used to discriminate and document additions by restor-ers, including high resolution digital photographs of the paint-ing captured at different spectral wavelengths [23]. Visualinspection can also be useful. For instance, original parts ofthe painting have also changed in appearance due to the dete-rioration of materials used. An example is color shift and fad-ing as a consequence of van Gogh’s use of poor quality paints;this can have a substantial impact on the perceived clarity andstyle of brushwork (see, e.g., [28]). Brushstrokes may also bedisrupted by the formation of drying cracks. For example, invan Gogh’s Paris works the drying cracks are usually associat-ed with the presence of an underlying, slow-drying oil filmwith zinc white pigment, applied by the artist to cover up anabandoned design [13]. Another frequent change is the flat-tened texture of impasto (thickly textured) brushwork, due tolater lining treatment (adhesion of a second canvas to thereverse of the original picture support using a heated iron orhot table), or to the painter’s own habit of leaning, rolling orpiling freshly painted canvases while the paint was still soft[Figure 1(b)]. These fine-scale “original damages” influencethe reading of brushwork detail but may also be consideredcharacteristic of the painter’s working method.
The next step is to describe original brushwork characteris-tics observed across the remainder of the painting surface. Onelarger scale feature to look for is the recurrent use of certainbrushstroke patterns, involving a series of fast rhythmic touchesarranged in a particular way. Especially in his later Frenchpaintings, van Gogh seems to have developed a consistentvocabulary of graphic touches that range from “elbow-strokes,”to “serial dabs,” to “halo” and “brickwork” patterns, for example.It would seem useful to pinpoint key moments when these char-acteristic brushwork configurations were first introduced, or the
periods in which they prevailed, providing a framework to assistwith the dating of van Gogh’s oeuvre. At present, though refer-ences to these various patterns of brushwork may be found scat-tered throughout the art historical literature, there is nocommon procedure used to gather data or descriptive terminol-ogy used. The most thorough descriptions are to be found inexhibition catalogues, such as [24].
Painting analysts also attempt to identify the specific size andshape of the individual brushes that a painter used in eachpainting from the marks that they have left behind. X-rayimages can be useful for this purpose, or examination in so-called raking light, low-angled light that skims the picture sur-face, enhancing its topography. Still there are many instanceswhere the brushmarks are too indistinct to measure anddescribe. Some indeterminate passages are a deliberate conse-quence of van Gogh’s technique of diffusing crisp brushstrokesthat were still wet, by wiping with a cloth, scrubbing with a drybristle brush, or dabbing with the fingertips. Even when legible,the shape of marks made by a single brush will vary somewhat.This may be due to features such as non-uniform profile of thehair bundle, variable paint loading, wrist action, and pressureexerted on the brush. Though uncommon, occasional marksindicate the use of a palette knife instead of a brush to executeselect details or parts of a painting.
Importantly, brushwork examination should take intoaccount the visual impact of the painting materials used.Observation of van Gogh’s impasto generally points toward theuse of a paint of fluid consistency, but with strong internal cohe-sion or “tenacity” that leaves the marks standing as applied [29].This combination explains characteristic fine trails of paintformed where the brush was lifted from the canvas, perhaps car-ried across from one touch to the next, as well as ridges of sur-plus paint flowing out toward the edges of brushstrokes. This isall visible in Figure 1(c).
Van Gogh used ready-made tube colors, so that the rheologyof his paints was largely determined by their methods of com-mercial preparation. Recent attempts to replicate the manufac-ture of colors (and picture supports) used by van Gogh usinghistorically accurate techniques pinpointed the particular oilbinding medium and its way of preparation as a critical factor[6]. A mixture of poppy oil and water-washed linseed oil wasfound to provide a lead white oil paint with a character thatmost closely resembled what was seen on van Gogh’s paintings[6]. Since van Gogh used the same types of commercial paints ashis French contemporaries, it is not surprising that similarpaint flow features may be seen in their pictures too. Still,artists of van Gogh’s own generation could manipulate similarpaints in individual ways that define a personal “handwriting,”so that stylistic assessment remains of paramount importance toidentify the artist’s hand.
Another critical factor affecting the appearance of brush-strokes is the surface onto which they are applied. Technical andanalytical studies have disclosed the diversity of van Gogh’stechnique across time (e.g., [12]), ranging from his practice ofoiling out the surface of ready-primed canvas to facilitate
IEEE SIGNAL PROCESSING MAGAZINE [38] JULY 2008

brushstrokes gliding out into the wet layer of the medium [13],to his use of a thinly primed and coarsely woven jute fabric thatimpeded fluent brushwork to a large extent [18]. Alternatively,there are many known examples where van Gogh simply painteda new picture on top of an existing one to reuse the canvas, per-haps allowing the rough texture of the underlying painting toplay through to the surface of the current picture to a fairextent. Also significant is whether brushstrokes were applied onto a wet paint surface (so-called wet-on-wet technique) or on toone that was already dry (wet-on-dry) since each method ofpaint application leads to a quite different look, as illustrated intwo of the details in Figure 1(c) and (d). Van Gogh’s picturestend to show predominantly, but not exclusively, wet-on-wetbrushwork, helping to create the highly sculptured surfaces andcolor marbling effects that we generally associate with hismature technique.
DESCRIPTION OF THE DATA SET AND ANALYSIS TOOLSThe data set provided by the Van Gogh and Kröller-MüllerMuseums consists of high resolution gray-scale scans of existingEktachrome films of 101 paintings, scaled (via bi-cubic resam-pling) to a uniform density of 196.3 dots per painted-inch anddigitized to 16 b/channel [14]. Of the 101 paintings, 82 haveconsistently been attributed tovan Gogh, six have always beenknown to be non-van Gogh,and 13 have been or are cur-rently questioned by experts.
The results presented belowwere obtained with severaltypes of wavelet transform.Wavelets can capture local fea-tures in a wide range of scales.That this is potentially usefulin the present context is sug-gested by the variety of differ-ent scales used in the arthistorians’ visual inspection ofthe brushwork in a van Goghpainting, as described above.
Wavelet transforms for two-dimensional (2-D) images usetemplates (wavelets) thatexhibit different scales and ori-entations. Arbitrary imagescan be written as a superposi-tion of such templates locatedon a grid(s), weighted appro-priately. There are many waysto choose these templates andassociated grids; three differ-ent choices are representedbelow, labeled by the homeinstitution of the authors whohave used them for this study.
The first approach (Penn State or PS) uses an orthonormalwavelet basis, for which the transform is implemented via fastsubband filtering and has the virtue of providing a criticallysampled representation of the data; the second (Princeton orPr) abandons critical sampling (but not subband filtering) toobtain a greater orientation selectivity via the use of complexwavelets [15], [27]; the third (Maastricht or Ma) opts for a familyof wavelets with the same orientation selectivity as Pr, but witha (Gabor, or modulated Gaussian) wavelet that is close to physio-logically suggested templates [11]. Figure 2 illustrates these dif-ferent wavelet choices.
Because the individual paintings, at the fine discretizationlevel provided, are very large, they must be divided in patchesfor analysis purposes. These patches are analyzed individually,and the statistics obtained for the patches are then used to clas-sify the paintings.
Classification is done in various ways. Both PS and Pr use ahidden Markov model (HMM) approach [7], [25]. In a Markovmodel, variables are correlated to their predecessors (or neigh-bors); typically the variables can be in several possible states(each with its corresponding probability distribution), and thebehavior of the model is characterized by the matrix p, in whicheach entry ps,s′ is the probability that a variable in state s is
[FIG1] Portions of van Gogh paintings. (a) Detail of flattened impasto with weave imprint in F779(Crows in the Wheatfields, July 1890). A loss occurred in the green brushstroke where fresh paintstuck and was pulled off. (b) Detail of false weave imprint in a Wacker forgery, F614 (Cypresses). (c)Raking light detail of paint in F779 (Crows in the Wheatfields, July 1890) showing wet-on-wet,drippy brush marks. (d) Detail of wet-on-dry touches in F659 (The Garden of Saint Paul’s Hospital,November 1889). Final red accents were applied onto dry paint, leaving the underlying impastoundisturbed. [(a), (c), and (d) used with permission from the Van Gogh Museum, Amsterdam,Vincent Van Gogh Foundation and (b) from a private owner.]
(a) (b)
(c) (d)
IEEE SIGNAL PROCESSING MAGAZINE [39] JULY 2008

“followed by” another in state s ′. In an HMM, the states areassumed to be “hidden,” meaning that the transition probabili-ties ps,s′ and the probability distributions of the observations areunknown for each state and have to be inferred from the data.These parameters, which characterize the model to some extent,can then be used for classification purposes. Other classificationtools used in this study include support vector machines thatare trained on histograms of energy values.
Table 1 gives an overview of the different approachesdescribed below: patch sizes, the wavelets used, the highlightedfeatures in the paintings, the models and the classifiers used.
SIMILARITY ASSESSMENT VIA TEXTUREAND BRUSHSTROKE GEOMETRY MODELING—THE WORK OF THE PENN STATE GROUPFor the PS development of statistical models of wavelet-basedtexture and brushstroke geometry for van Gogh’s paintings,art historians first selected, in the 101-painting data set, 23works that are unquestionably by van Gogh and that representdifferent periods of his art life and different painting tech-niques. They are F25 (Coming Out of Church in Neunen),F61v (Self Portrait), F76 (Still Life: Satin Flowers and a Bowlwith Leaves and Flowers), F82 (The Potato Eaters), F160(Peasant Woman in a Red Bonnet), F206 (Head of a Woman:Nearly Full Face), F208 (Self Portrait with Pipe: ThreeQuarters to the Right), F215 (Nude Study: Little Girl Seated),F234 (Still Life: One-Eared Vase with Asters and Phlox), F256(Mussels and Shrimp), F260 (Houses in Antwerp), F261 (Viewof Paris), F266a (Factories Seen from a Hillside in
Moonlight), F292 (Boulevard de Clichy), F293 (The Banks ofthe Seine), F309a (Undergrowth), F316 (View fromMontmarte), F344 (Self Portrait in a Gray Felt Hat: ThreeQuarters to the Left), F371 (Japonaiserie: The FloweringPlum Tree), F423 (A Bugler of the Zouave Regiment), F522(Self Portrait in Front of the Easel), F632 (The Plow and theHarrow), and F779 (Crows in the Wheatfields). The paintingID numbers are based on the original attempt, published in1928, at compilation of all of van Gogh’s works by J-B. de laFaille, revised in 1970 in The Works of Vincent van Gogh: HisPaintings and Drawings (Reynal and Company). Thumbnailsof the 101 paintings are available in [14].
These 23 paintings serve as training set for the PS analysis;every other painting is then compared with each of the 23 train-ing paintings. A low average distance (in a sense defined below)indicates a measure of stylistic proximity to the work of van Gogh.
Note that only van Gogh examples are used in this trainingprocess. This differs from standard classification methods,where distinction is learned from both positive and negativeexamples. Not using negative (non-van Gogh) examples in thetraining process makes this a more highly stringent assessmentof the proposed methods.
Next, the methods to compare paintings, specifically, to com-pute the distances, are described.
FEATURE EXTRACTIONThe paintings are divided into patches of about 512 × 512 pix-els, corresponding to roughly 2.5 in × 2.5 in on the canvas. Toensure that patches from the same painting are of the same size,
[FIG2] The three different choices for the wavelet templates (shown at the same size); in each case, wavelets are shown for twosuccessive scales and at all the orientations.
PS: D–4 Pr: Complex Wavelet Ma: Gabor Wavelet(a) (b) (c)
GROUP ANALYSIS PATCH SIZE (PIXELS) DECOMPOSITION MATHEMATICAL MODEL CLASSIFIERPS TEXTURE 512 × 512 D4 WAVELETS 2-D HMM LIKELIHOOD
GEOMETRY 512 × 512 CONTOURS (EDGES) CLUSTERING MALLOWS DISTANCEPR STYLE 512 × 512 COMPLEX WAVELETS HMM MDS
FLUENCY 128 × 128 SCALE MEDIANS THRESHOLDINGMA TEXTURE 256 × 256 GABOR WAVELETS SCALE ENERGIES SVM
[TABLE 1] THE BASIC PREPROCESSING AND STATISTICAL METHODS USED BY THE THREE GROUPS. ABBREVIATIONS: HMM:HIDDEN MARKOV MODELS, MDS: MULTIDIMENSIONAL SCALING, SVM: SUPPORT VECTOR MACHINES.
IEEE SIGNAL PROCESSING MAGAZINE [40] JULY 2008
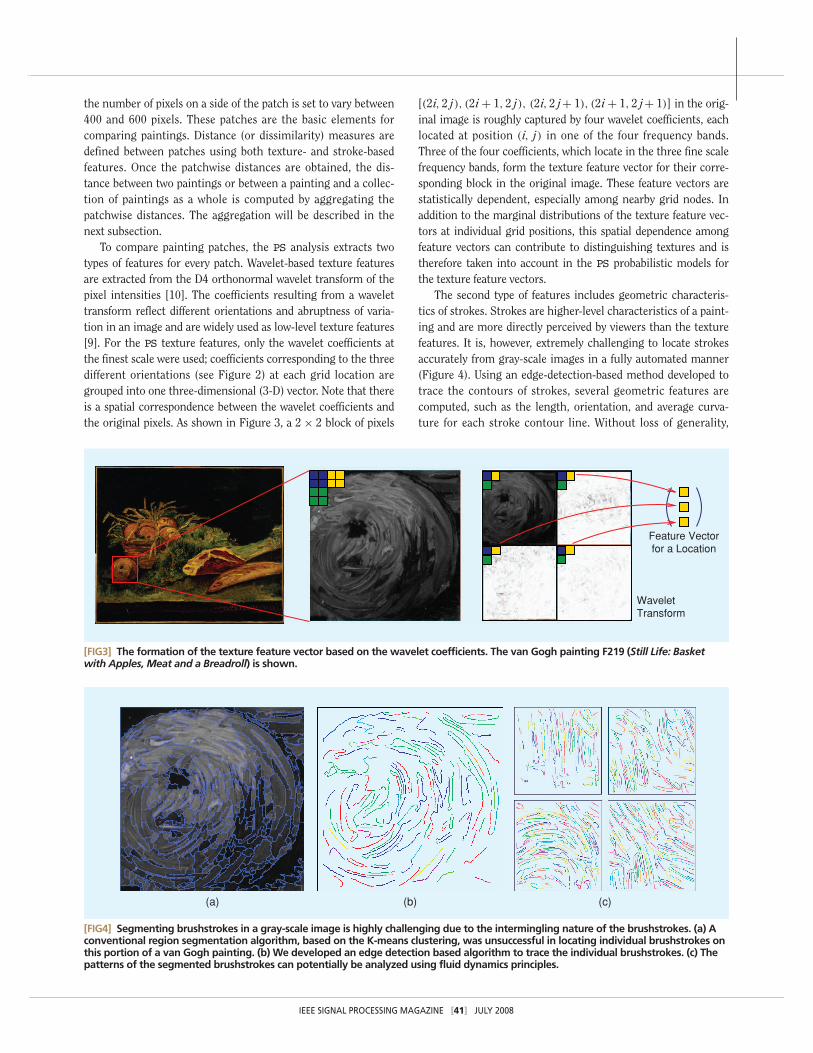
the number of pixels on a side of the patch is set to vary between400 and 600 pixels. These patches are the basic elements forcomparing paintings. Distance (or dissimilarity) measures aredefined between patches using both texture- and stroke-basedfeatures. Once the patchwise distances are obtained, the dis-tance between two paintings or between a painting and a collec-tion of paintings as a whole is computed by aggregating thepatchwise distances. The aggregation will be described in thenext subsection.
To compare painting patches, the PS analysis extracts twotypes of features for every patch. Wavelet-based texture featuresare extracted from the D4 orthonormal wavelet transform of thepixel intensities [10]. The coefficients resulting from a wavelettransform reflect different orientations and abruptness of varia-tion in an image and are widely used as low-level texture features[9]. For the PS texture features, only the wavelet coefficients atthe finest scale were used; coefficients corresponding to the threedifferent orientations (see Figure 2) at each grid location aregrouped into one three-dimensional (3-D) vector. Note that thereis a spatial correspondence between the wavelet coefficients andthe original pixels. As shown in Figure 3, a 2 × 2 block of pixels
[(2i, 2 j), (2i + 1, 2 j), (2i, 2 j+ 1), (2i + 1, 2 j+ 1)] in the orig-inal image is roughly captured by four wavelet coefficients, eachlocated at position (i, j) in one of the four frequency bands.Three of the four coefficients, which locate in the three fine scalefrequency bands, form the texture feature vector for their corre-sponding block in the original image. These feature vectors arestatistically dependent, especially among nearby grid nodes. Inaddition to the marginal distributions of the texture feature vec-tors at individual grid positions, this spatial dependence amongfeature vectors can contribute to distinguishing textures and istherefore taken into account in the PS probabilistic models forthe texture feature vectors.
The second type of features includes geometric characteris-tics of strokes. Strokes are higher-level characteristics of a paint-ing and are more directly perceived by viewers than the texturefeatures. It is, however, extremely challenging to locate strokesaccurately from gray-scale images in a fully automated manner(Figure 4). Using an edge-detection-based method developed totrace the contours of strokes, several geometric features arecomputed, such as the length, orientation, and average curva-ture for each stroke contour line. Without loss of generality,
[FIG3] The formation of the texture feature vector based on the wavelet coefficients. The van Gogh painting F219 (Still Life: Basketwith Apples, Meat and a Breadroll) is shown.
WaveletTransform
Feature Vectorfor a Location
IEEE SIGNAL PROCESSING MAGAZINE [41] JULY 2008
[FIG4] Segmenting brushstrokes in a gray-scale image is highly challenging due to the intermingling nature of the brushstrokes. (a) Aconventional region segmentation algorithm, based on the K-means clustering, was unsuccessful in locating individual brushstrokes onthis portion of a van Gogh painting. (b) We developed an edge detection based algorithm to trace the individual brushstrokes. (c) Thepatterns of the segmented brushstrokes can potentially be analyzed using fluid dynamics principles.
(a) (b) (c)

consider one specific feature and denote it by xi , wherei = 1, . . . , k is the index for extracted brushstroke contourlines. A probabilistic model is built based on each feature set{xi, i = 1, . . . , k}, where xi s are treated as independent sam-ples from the same distribution.
STOCHASTIC MODEL BASED COMPARISONAs mentioned earlier, statistical models are constructed for bothtexture-based and stroke-based features. The model for texturefeatures is a spatial model, specifically, a variation of the 2-D HMM[16]; for stroke features i.i.d. (independent and identically distrib-uted) models are used. The 2-D HMM models an array of vectors{ui, j, i = 1, . . . , n, j = 1, . . . , m} by assuming an underlyingspatial state process {si, j, i = 1, . . . , n, j = 1, . . . , m}. Becauseit is difficult to flexibly model spatial dependence among continu-ous random variables, the states are introduced to “discretize” thedependence. The state process is assumed to follow a Markovmesh (a discrete causal Markov random field) [1], an extension ofthe Markov chain from one dimensional (a sequence) to 2-D (agrid). Since the model is ultimately for continuous vectors ui, j, aGaussian distribution is assumed for ui, j when si, j is given.Moreover, to retain a tractable model, ui, j is assumed to be condi-tionally independent from other ui ′, j ′ given si, j.
Spatial relationship is less of a concern for the stroke fea-tures because they capture relatively large-scale characteristicsin an image. Consider one stroke feature, e.g., average curva-ture. Let the set of features for a patch be {xi, i = 1, . . . , k}.We form a discrete distribution for the patch by quantizing thexi s. Here, we used the Lloyd algorithm or K-means clusteringto partition the feature space and calculate the centroids ofeach partition. Suppose after quantization, the xi s are dividedinto K groups, each with an average feature value zj. The pro-portion of xi s in the jth group is pj, j = 1, . . . , K. We thenform a discrete distribution {(z1, p1), (z2, p2), . . . , (zK, pK)},where zj s are the support points of the distribution and pj s arethe corresponding probabilities. We adopt a simple discrete dis-tribution here because the number of stroke lines k varies dra-matically among patches. The number of support values, K, isdynamically determined by the closeness between the xi s. Weuse the Mallows distance [21] for the discrete distributions.
To aggregate the patchwise distance into imagewise distance,we employ the following scheme. Let I1 be the test image and I2
be the reference image. For every patch P in I1, the patch in I2
that is closest to it is found, and the associated distance is record-ed for P. The average of these distances across all the patches inI1 is taken as the distance from I2 to I1. A similar technique formerging patchwise distances is used when comparing one imagewith several images as an entity. When the number of patches inthe reference images is large, for any patch P in I1, one can alsofind the k closest patches to it and compute the average of the kdistances as the recorded value for P.
EXPERIMENTAL RESULTSAfter removing the 23 paintings of the training set, 78 otherpaintings remain in the data set, including all the paintings that
have at one time been, but are no longer, attributed to vanGogh, as well as the six paintings that have always been identi-fied as produced by van Gogh’s peers. The distance between eachof the 78 images and the training set as an entity is then com-puted; the 78 paintings are ranked according to these distances.
The PS group has developed an online system that cancompare any painting against any subset of training paintings,using any or all types of the features extracted. (The URL of theonline system is available to researchers upon request.) Forinstance, when the van Gogh paintings F632 (The Plow andthe Harrow) and F779 (Crows in the Wheatfields) are used astraining, the system indicated that the test paintings F304(Pont de la Grande Jatte), F418 (The Sea at Saintes-Maries, aWacker forgery) and F511 (Orchard in Blossom) all resemblethe styles of the two training paintings according to the stan-dard deviations of the brushstroke curvatures. [A Wacker for-gery is a fake van Gogh painting commissioned or sold by theGerman art dealer Otto Wacker (1898–1970).] However, whencompared using the lower-level texture features, F418 isshown to be unlike the two training paintings, while F511 isshown to be similar to the two. As another example, when apointillism painting F309a (Undergrowth) is used as the onlytraining painting, the system identified F341 (View fromVincent’s Room in the Rue Lepic), upper portion of F734 (TheGarden of Saint Paul’s Hospital), F314 (Voyer-D’ArgensonPark at Asnières), and F342 (Interior of a Restaurant) as paint-ings of a similar pointillism style based on brushstrokelengths. In contrast, F482 (Vincent’s Bedroom in Arles) andF260 (Houses in Antwerp) were selected as those differentiat-ing the most from pointillism. Space limitations prevent amore extensive description of the results obtained.
Some of the results, based only on the texture modeling,are illustrated in Figure 5, which displays the five paintings(among the 78) that are closest to the 23-painting training setas well as the five paintings furthest from the training set.Among the five least similar ones, three are non-van Gogh; theother two, F267 (Self Portrait: Three Quarters to the Left) andF572 (Willows at Sunset), are deemed authentic; among themost similar ones, S225V (Portrait of Van Gogh Painting theSunflowers) is by Gauguin, while the other four are true vanGoghs. The 23 van Gogh paintings, which serve as the solesource of knowledge in the computerized learning process,may not be sufficiently representative for covering the range ofbrushstroke styles of van Gogh. Further, these inconsistencieswithin the sets of the most and least similar images under-score the need for refinement of our comparison methods.
CHARACTERIZING SCALES AT WHICH TELLING DETAILSEMERGE—THE WORK OF THE PRINCETON GROUPThe Pr analysis focuses on 76 paintings from the data set: 65from van Gogh’s Paris period onward, the six consistentlyattributed to other artists, and five (of the 13 questioned ones)formerly considered van Goghs but since definitively deattrib-uted. The 17 remaining van Goghs (early period) are excludedbecause they are very dark; their digitization is concentrated in
IEEE SIGNAL PROCESSING MAGAZINE [42] JULY 2008

too small a portion of the full range of gray-scale values to pro-vide useful information for the Pr analysis. Figure 6 illustratesthe Pr decomposition of a van Gogh painting, using waveletswith six orientations.
DATA ANALYSIS AND FEATURE EXTRACTIONTo analyze each 512 × 512 patch p, its wavelet coefficients aremodeled by a hidden Markov tree (HMT, a special kind ofHMM). In this model, each coefficient is associated with a hid-den state, taking one of two values, edge or nonedge, indicat-ing whether the coefficient’s wavelet template overlaps anedge in the image. All the coefficients of scale s and orienta-tion α with hidden state edge (respectively, nonedge) are thenmodeled by a zero-mean Gaussian distribution, with a vari-ance σ edge
s,α (respectively, σnonedges,α ) that will likely be large
(respectively, small). Dependencies between coefficients withthe (scale, orientation) pairs (s, α) and (s − 1, α) at the samelocation are modeled by the 2 × 2 matrix εα
s,s−1 of transitionprobabilities between hidden states. Transitions between thetwo states occur often; for example, a smooth gradientbetween solid regions corresponds to an edge state at coarsescales and a nonedge at finer scales. HMT models of this typewere used successfully for the characterization and separationof texture in images [25]. For each patch p, the four model
parameters (two transition probabilities, two variances) foreach (s, α) (108 in total) are learned from p, and combinedinto a feature vector v[p] ∈ R108.
EXAMINATION OF THE BRUSHSTROKE SCALE: VAN GOGH’S STYLE EMERGES?The 108 features are ranked and then renumbered according totheir effectiveness in distinguishing van Gogh and non-vanGogh patches. The features that dominate in this ranking (andthus come first after renumbering) are systematically transitionprobabilities from nonedge to edge states (from coarser to finerscales), identifying the scales at which detail informationemerges, as one gradually zooms in, in van Gogh more so thanin non-van Gogh paintings. These characteristic scales turn outto be different for different orientations; their identity seemscharacteristic for van Gogh’s style.
Setting the m-feature vector v[p|m] ∈ Rm of a patch p to bethe truncation of the feature vector v[p] to its first m (renum-bered) entries, an m-similarity distance between paintings isdefined by adding, for all pairings of a patch p of one paintingwith a patch p′ of the other, the weighted distances
dm(p, p′) =[
m∑�=1
w�
∣∣∣v[p|m]� − v[p′|m]
�
∣∣∣2]1/2
[FIG5] (a) Paintings ranked as most similar and (b) least similar to van Gogh’s brushstroke styles learned from the 23 training imagesusing wavelet-based texture features. F314 (Voyer-D’Argenson Park at Asnières), S225V (Portrait of Van Gogh Painting the Sunflowers),F511 (Orchard in Blossom), F464 (Vincent’s House on the Place Lamartine, Arles), F555 (The Pink Orchard), F572 (Willows at Sunset),S218V (View from Montmartre), F253 (Still Life: A Bottle, Two Glasses and a Plate of Bread), F267 (Self Portrait: Three Quarters to theLeft), S251V (Vase with Flowers).
S251V by Monticelli F267
F572
F314
F511
Paintings Closestto the 23 Training van
Gogh Paintings
S218V by FabianS225V by Gauguin
F555
F464
F253 − not by van Gogh
Paintings Least Similarto the 23 Training van Gogh Paintings
(a) (b)
IEEE SIGNAL PROCESSING MAGAZINE [43] JULY 2008

between their m-feature vectors, where the weight w� of the�th feature is proportional to its effectiveness in the van Goghversus non-van Gogh classification process.
A multidimensional scaling algorithm is used to find thearrangement of 76 points in 3-D space (with every point repre-senting one painting) most in accordance with the pairwise m-similarity distances between the 76 paintings; in thisrepresentation, the center CvG of the van Gogh cluster is deter-mined (all van Goghs weighted equally). Even for small values ofm, this 3-D representation gives a visualization with good sepa-ration between van Goghs and non-van Goghs in the data set; seeFigure 7. This visualization is an effective tool in the communi-cation between the technical team and art historians. (A movie ofthis spatial arrangement can be found at http://www.digital-paintinganalysis.org/Princeton/demos.htm.) The separation ismade quantitative by using a radius classifier: for an appropriateradius r, points closer to CvG than r overwhelmingly representvan Goghs; points further from CvG than r more likely corre-spond to non-van Goghs. Additionally, stylistically similar vanGogh paintings tend to cluster in this analysis, with stylisticallyless typical van Gogh paintings tending toward non-van Goghregions; the results of this analysis can thus be interpreted as acharacterization of a painting’s style. Testing this classifierthrough leave-one-out cross-validation (i.e., classifying eachpainting according to CvG and r calculated from the other 75
paintings) shows that it generalizes well to new examples. In adifferent classification scheme, boosting a distance classifier ofthe 16-feature vectors leads to even better results under crossvalidation. (See Table 2 for all numerical results).
EXAMINATION OF EXTREMELYFINE-SCALE: COPIES EXPOSEDTo pinpoint paintings, such as copies or forgeries of true vanGoghs, that are stylistically similar but are not authentic,much finer scales in the wavelet decomposition are used, onpatches of 128 × 128 pixels. The Ma group had observed ear-lier [3] that the infamous Wacker forgeries of van Goghpaintings had many more large-valued wavelet coefficientsthan true van Gogh paintings. Wavelet transforms typicallyuse fewer coefficients at coarse than at fine scales; in particu-lar, there are, in the Pr wavelet transform, four times asmany coefficients in each scale as in the next coarser scale(see Figure 6). It follows that the two finest scales contributea fraction of 15/16 = 93.75% of the total number of all thewavelet coefficients (for all scales combined) for each patch; asurfeit of large-valued wavelet coefficients is thus possibleonly if there is an overabundance of large coefficients at thefinest scales. This can (tentatively) be attributed to more hes-itant brushstrokes, caused by a reduction in motion fluiditywhen copying another painting or another painter’s manner.
IEEE SIGNAL PROCESSING MAGAZINE [44] JULY 2008
RADIUS CLASSIFIER GENERALIZATION SUCCESS
BOOSTED DISTANCE CL. CASE m = 1 CASE m = 2 RADIUS CL. m = 1 m = 16
VAN GOGH CLOSER TO CvG THAN r (OUT OF 65) 51 55 50 54NON-VAN GOGH FURTHER FROM CvG THAN r (OUT OF 11) 9 9 8 8
[TABLE 2] RESULTS FOR THE Pr CLASSIFIERS: RADIUS CLASSIFIER FOR A 3-D REALIZATION CONSTRUCTED FROM THE PAIRWISE m-SIMILARITY DISTANCES, FOR m = 1, 2 ; SUCCESS AT GENERALIZATION (UNDER LEAVE-ONE-OUT CROSS-VALIDATION) FOR RADIUS CLASSIFIER AND A BOOSTED DISTANCE CLASSIFIER BASED ON THE 16-FEATURE VECTORS.
[FIG6] One patch in F469 (Self Portrait with Straw Hat) by van Gogh and two layers of its wavelet transform, along the six orientations,and its subsampled low-pass version. (Wavelet coefficients with larger/smaller magnitudes in darker/lighter gray.) For each scale s,there are four times more wavelet coefficients than for the next coarser scale (s − 1).

IEEE SIGNAL PROCESSING MAGAZINE [45] JULY 2008
To quantify this, the Pr analy-sis measures the median waveletcoefficient strength at each of thetwo finest scales; this does indeedbring out copies and forgeries inthe data set from most of theauthentic, original van Goghs:they have an excess of features ofwidth 0.25–0.5 mm (two to fourpixels only), at the very limit ofthe spatial resolution in the dataset. Out of all 76 paintings, sixhave their wavelet coefficientmedians in the top eight for boththe finest scale S and the second-finest (S − 1).
In particular, the one knowndeliberate forgery in the data set
[FIG7] Two views (different angles) of the 3-D representation of the 76 paintings obtained form = 1. The 11 non-van Gogh paintings (among the 76 paintings considered by Pr) have red dots;they are systematically further from CvG than most van Goghs.
[FIG8] The image patch on the left, taken from F482 (Vincent’s Bedroom in Arles), is decomposed by the Gabor wavelet transform intofour scales and six orientations visualized on the right, where the rows represent scales (top to bottom: fine to coarse) and the columnsorientations (left to right: counterclockwise from horizontal to almost horizontal). The numbers in each scale-orientation square givethe energy value in each orientation-scale combination.
Fine.03 .02 .02 .02 .02 .02
.15 .10 .09 .12 .06 .07
.52 .37 .34 .39 .21 .25
1.18 .95 .86 .95 .54 .61Coarse
Energy
Fine
Coarse
Gabor Wavelet Coefficients

(F418, The Sea at Saintes-Maries) places second at scale Sand fourth at scale (S − 1). More intriguingly, the other five(of the six) include one copy by van Gogh himself (F634,Sheep Shearers, after Millet) and two paintings in which,experimenting with technique, he had traced over his ownbrushstrokes again after the paint had dried (F652, Fir Woodsat the Fall of Day, and F734, The Garden of Saint Paul’sHospital); the lack of fluency has therefore a natural explana-tion for them as well. This observed feature of copies of (andby) van Gogh warrants further study. The remaining two out-liers are F742 (A Clump of Trees in the Garden of SaintPaul’s Hospital), which shows a very strong canvas artifact atthe extra-fine scale, and F377 (Still Life: Sunflower), a smallstudy with atypical brushwork, in which van Gogh was study-ing color more closely than form.
BIOLOGICALLY INSPIRED PAINTING ANALYSIS—THE WORK OF THE MAASTRICHT GROUP
PAINTING ANALYSIS WITH GABOR WAVELETSThe purpose of the digital analysis is to compare (parts of) paint-ings in terms of perceptually meaningful similarities. Althoughperceptual meaningfulness is a subjective concept, it can bemeasured with a computer by using techniques derived frombiological and psychological models of the human visual system.The Ma analysis is guided by the following three principles: 1)contours are important, 2) images must be analyzed at multiplescales, and 3) similarities between paintings are reflected in thelocal texture (i.e., patterns of brushstrokes).
These principles are implemented by convolving the paint-ings with multiscale-oriented Gabor wavelet filters [11] and byhistogramming the resulting coefficients. The Gabor wavelet fil-
ters come in pairs; Geven(x, y, σ, α, ω) and Godd(x, y, σ, α, ω)
are, respectively, the real and imaginary parts of the function
e2π iω(xsin α+ycos α) e− x2+y2
2σ2 ,
where x and y are the spatial coordinates assuming the filtersare centered at the origin, α sets the spatial orientation and ωthe spatial frequency of the filter pair. Each pair of filters“responds” to the presence of an intensity transition in a partic-ular orientation-scale combination. We apply a set of filters thatcovers a range of orientations and scales: six orientations(α = (k/6)π , for k ∈ {0, 1, 2, 3, 4, 5}) and four scales (ω and σset to values so that the smallest and largest filters roughlymatch the smallest and largest brushstrokes). Convolving thesefilter pairs with an image yields a decomposition of the imagestructure into “energy values,” one energy value for each pixel,orientation, and scale. The Gabor wavelet energy value of animage patch is defined as the sum of the squared valuesobtained by convolving both components with an image patch.
Figure 8 is an example of an image patch (left) and theresponses of the filters (right; dark to bright indicate low tohigh energy). Each row represents a scale, from fine (toprow) to coarse (bottom), each column an orientation fromhorizontal (left column) with steps of 60◦ counterclockwiseto almost horizontal (right). The total image energy of eachorientation-scale filter, obtained by summing the energy val-ues for the entire patch, is given on top of each subimage.The largest image energy is associated with the horizontalorientation that matches the main orientation of the strokesin the image patch (first column). The finest scale of analy-sis as displayed in the top row corresponds to strokes orother visual structure with a diameter as small as two tothree pixels (0.3–0.4 mm).
Intuitively speaking, measuring the total energy by simplysumming the energy values of all constituent patches of a paint-ing (one of the simplest forms of analysis) corresponds to count-ing the contours (light-dark transitions) in the painting. Byselecting the appropriate scale of analysis, i.e., the very fine scaleat which the Gabor wavelet filters highlight (parts of) brush-strokes, we can make a computational analysis of the brush-strokes in a painting. More visible brushstrokes give rise to morecontours, leading to large energy values. Even this straightfor-ward analysis technique makes the well-known Wacker forgeryF418 (The Sea at Saintes-Maries) pop out in the analysis, asillustrated in Figure 9, showing the energy values for five paint-ings, including F418. Large energy values, possibly indicative ofmore hesitant brushstrokes, are characteristic of copies and for-geries of van Gogh paintings; as in the Pr analysis, a few true vanGoghs are found to stand out in the Ma analysis as well.
A more informative representation of the paintings isobtained by creating a multidimensional histogram that cap-tures information on the configuration of spatial frequenciesand orientations within a patch. In such a histogram, the 24N2
energy values obtained for a patch of N × N pixels are aggregat-ed in 4 × 6 bins, one for each scale-orientation combination.
IEEE SIGNAL PROCESSING MAGAZINE [46] JULY 2008
[FIG9] Normalized energy for six paintings, one of which is aforgery, measured with Gabor wavelet filters. The Wackerforgery F418 (The Sea at Saintes-Maries) clearly stands out interms of energy.
1.5
2
0.5
1
2.5
3.5
4
4.5
0
3
F451 F458F218 F270a F415 F418
Normalized Energy per Painting

Using such multidimensional histogram representations ofpaintings, the Ma analysis induces a model by performing auto-matic classification experiments with a support vectormachine or SVM (an automatic learning technique for thebinary classification of input vectors [8]). The SVM requires atraining set consisting of input vectors and labels indicatingtheir class. In this case, the input vectors are the 24-dimen-sional-vector histograms; the labels represent the authorshipof the painting from which the histograms were extracted, i.e.,van Gogh and non-van Gogh. The SVM learns to map the inputvectors from the training set onto their appropriate classes.After training, the SVM is used on test paintings, i.e., paintingsoutside the training set.
The leaving-one-out validation procedure is employed fortesting the generalization performance of the trained SVM,which trains the classifier on the histograms of all but onepainting, and subsequently tests the SVM on the histograms ofthe one remaining painting; the training and testing are repeat-ed for all combinations and the test results are averaged. Thismeans that for 101-painting data set, 101 experiments are per-formed in which the SVM is trained on 100 paintings and testedon a single painting. The SVM generates a label for each patch ofthe test painting; the overall label for the test painting is thenthe most frequently returned label.
RESULTSUsing the multidimensional histograms in combination withSVMs on the full data set, four out of the six non-van Gogh paint-ings were detected, at the cost of wrongly classifying two vanGogh paintings.
These results suggest that the Ma method can detect dissimi-larities in the brushstroke texture of paintings and could there-fore support art experts in their assessment of the authenticityof paintings. More subtle differences require more advancedapproaches. The Ma group has begun to apply its techniques tocolor reproductions of van Gogh’s paintings [4], the automaticdetermination and validation of brushstroke orientation [5], andis developing and testing advanced approaches that analyze con-figurations of brushstrokes.
CONCLUDING REMARKSSophisticated image processing in painting analysis is becom-ing possible, as high resolution and richer data are becomingavailable. The signal processing algorithms performing suchanalysis are in the early stages of development; this articlesummarizes the results obtained by several groups usingwavelet decompositions of the same data set, consisting of 16-bgray-scale digitized representations of very high spatial resolu-tion (196.3 dpi) of 101 paintings, mostly by van Gogh. Allgroups obtained encouraging but not perfect results. Using awider range of signal analysis tools, starting from a richer rep-resentations of the paintings (including color or multispectralinformation), and more nuanced mathematical models (possi-bly reflecting the more subtle visual assessment described inthe first section), better results can certainly be achieved. The
number of interested researchers, targeted conference ses-sions, and specialist workshops devoted to the developmentand evaluation of signal processing algorithms for paintinganalysis, in particular in support of artist identification, anenduring task of art historians and conservation specialists, isgrowing. It is an exciting time for this emerging area.
ACKNOWLEDGMENTSThe authors thank the Van Gogh and Kröller-Müller Museumsfor granting access to such a rich data set and for their continu-ing support of this cross-disciplinary interaction. They acknowl-edge the constructive comments of the anonymous reviewers. J.Li and J. Wang would like to thank their former student WeinaGe for assistance in implementing the geometric analysis andconducting the related experiments. National ScienceFoundation Grants IIS0347148 and EIA0202007 provided partialfunding for their research. S.M. Hughes and E. Brevdo thankPeter Ramadge for many interesting discussions and sugges-tions. I. Daubechies gratefully acknowledges partial support ofNSF grants DMS0245566 and DMS0354464. The research ofI. Berezhnoy and E. Postma was carried out within theNetherlands Organization for Scientific Research (NWO) ToKeNproject Authentic (grant 634.000.015). C.R. Johnson, Jr. wassupported in part by a Fulbright Fellowship (2005) and aStephen H. Weiss Presidential Fellowship (2005–2009).
AUTHORSC. Richard Johnson, Jr. ([email protected]) received aPh.D. in electrical engineering from Stanford University, alongwith the first Ph.D. minor in art history granted by Stanford, in1977. He joined the Cornell University faculty in 1981, where heis a Stephen H. Weiss Presidential Fellow and professor of electri-cal and computer engineering. His previous principal researchinterests have been adaptive feedback systems theory (1977–1991)and blind equalization algorithm analysis and creation(1991–2005). In 2007, he accepted a five-year appointment as anadjunct research fellow of the Van Gogh Museum in Amsterdam.
Ella Hendriks ([email protected]) graduated inart history at the University of Manchester, U.K., in 1982. In1986 she completed the post-graduate training in theConservation of Easel Paintings at the Hamilton Kerr Institute,University of Cambridge, U.K. From 1988 to 1999 she was headof conservation at the Frans Halsmuseum in Haarlem, TheNetherlands. Since 1999, she has been head of conservation atthe Van Gogh Museum in Amsterdam, and in 2006 received aPh.D. in art history.
Igor J. Berezhnoy ([email protected]) has anM.Sc. degree in applied mathematics and machine learning. Heis pursuing a Ph.D. in artist identification. Currently, he is aresearch scientist at Philips Research Europe, in Eindhoven,The Netherlands.
Eugene Brevdo ([email protected]) is a graduate stu-dent in electrical engineering at Princeton University. Hisresearch interests include signal processing and machine learn-ing, with applications to computer vision and inverse problems
IEEE SIGNAL PROCESSING MAGAZINE [47] JULY 2008

in medical imaging. His work is supported by the NDSEG andGordon Wu fellowships.
Shannon M. Hughes ([email protected]) is a Ph.D. stu-dent in electrical engineering at Princeton University. Her thesisresearch focuses on the development of mathematical methods forthe analysis of complex data, with applications to problems in bothneuroscience and art history. She has received an NSF GraduateFellowship, a Princeton University Gordon S. Wu Fellowship, andan NIH Ruth L. Kirchstein National Research Service Award.
Ingrid Daubechies ([email protected]) is the William R.Kenan, Jr. Professor of Mathematics at Princeton University,where she has been since 1994. Her research interests includeapplications of time-frequency analysis in a wide range offields, many related to electrical engineering. She is an IEEEFellow and a member of the National Academy of Sciences.She has received the Eduard Rhein Foundation Basic ResearchAward, a MacArthur Fellowship and the National Academy ofSciences Medal in Mathematics.
Jia Li ([email protected]) is an associate professor of statis-tics and by courtesy appointment in computer science and engi-neering at The Pennsylvania State University, University Park.She received the M.Sc. degree in electrical engineering, theM.Sc. degree in statistics, and the Ph.D. degree in electricalengineering from Stanford University. She was a visiting scien-tist at Google Labs in Pittsburgh (2007–2008), a research associ-ate in the Computer Science Department at Stanford University(1999), and a researcher at the Xerox Palo Alto Research Center(1999–2000). Her research interests include statistical modelingand learning, data mining, computational biology, image pro-cessing, and image annotation and retrieval.
Eric Postma ([email protected]) is a professor inartificial intelligence at Maastricht University, The Netherlands.His research interests are machine learning and biologicallyinspired image processing. Together with his group he works onadaptive active vision, manifold learning, and cognitive modelsof visual perception. His application-oriented work focuses onthe development of techniques to support experts in thedomains of the cultural heritage and medicine.
James Z. Wang ([email protected]) is a visiting professor atthe Robotics Institute, Carnegie Mellon University. He has beenon faculty at the College of Information Sciences andTechnology of Penn State since 2000. His research interests areimage database retrieval, computational aesthetics, image tag-ging, and biomedical informatics. He has received an NSFCareer award and the endowed PNC Technologies CareerDevelopment Professorship. He received a bachelor’s degree(summa cum laude) from University of Minnesota and an M.Sc.in mathematics, an M.Sc. in computer science, and a Ph.D. inmedical information sciences from Stanford University.
REFERENCES[1] K. Abend, T. Harley, and L. Kanal, “Classification of binary random patterns,”IEEE Trans. Inform. Theory, vol. 11, no. 4, pp. 538–544, 1965.
[2] M. Barni, A. Pelagotti, and A. Piva, “Image processing for the analysis and con-servation of paintings: Opportunities and challenges,” IEEE Signal ProcessingMag., vol. 22, no. 5, pp. 141–144, Sept. 2005.
[3] I.E. Berezhnoy, E.O. Postma, and H.J. van den Herik, “Computerized visualanalysis of paintings,” in Proc. Int. Conf. Association for History and Computing,Sept. 2005, pp. 28–32.
[4] I.E. Berezhnoy, E.O. Postma, and H.J. van den Herik, “Computer analysis ofvan Gogh’s complementary colours,” Pattern Recognit. Lett., vol. 28, no. 6, pp.703–709, 2007.
[5] I.E. Berezhnoy, E.O. Postma, and H.J. van den Herik, “Automatic extraction ofbrushstroke orientation from paintings,” Mach. Vis Appl. [Online] Mar. 2008.
[6] L. Carlyle, “Historically accurate reconstructions techniques) of oil painters’ mate-rials: An overview of the Hart project 2002–2005,” in Reporting Highlights of the DeMayerne Programme, J.J. Boon and E.S.B. Ferrera, Eds. Den Haag, The Netherlands:The Netherlands Organisation for Scientific Research (NWO), pp. 63–76.
[7] H. Choi, J. Romberg, R. Baraniuk, and N.G. Kingsbury, “Hidden Markov treemodelling of complex wavelet transforms,” in Proc. Int. Conf. Acoustics, Speechand Signal Processing (ICASSP), vol. 1, Istanbul, Turkey, 2000, pp 133–136.
[8] N. Cristianini and B. Schölkopf, “Support vector machines and Kernel methods:The new generation of learning machines,” AI Mag., vol. 23, no. 3, pp. 31–41, 2002.
[9] R. Datta, D. Joshi, J. Li, and J.Z. Wang, “Image retrieval: Ideas, influences, andtrends of the new age,” ACM Comput. Surv., vol. 40, no. 2, Apr. 2008.
[10] I. Daubechies, Ten Lectures on Wavelets. Philadelphia, PA: SIAM (Soc. Ind.Appl. Math.), June 1992.
[11] J.G. Daugman, “Complete discrete 2-D Gabor transforms by neural networksfor image analysis and compression,” IEEE Trans. Signal Processing, vol. 36, no.7, pp. 1169–1179, July 1988.
[12] E. Hendriks and M. Geldof, “Van Gogh’s Antwerp and Paris picture supports(1885–1888): Reconstructing choices,” Art Matters: Netherlands Technical Studiesin Art History, vol. 2, pp. 39–75, 2005.
[13] E. Hendriks and L. van Tilborgh, “New views on Van Gogh’s development inAntwerp and Paris: An integrated art historical and technical study of his paintingsin the Van Gogh Museum,” Ph.D. dissertation, Faculty of Humanities, Univ.Amsterdam, vol. 1, p. 132, and vol. 2, p. 62, cat. 72, Nov. 2006.
[14] C.R. Johnson, Jr., Ed., Proc. 1st Int. Workshop Image Processing for ArtistIdentification. Amsterdam, The Netherlands, May 2007 [Online]. Available: http://digi-talpaintinganalysis.org/literature/ProceedingsIA4AI-1.pdf
[15] N.G. Kingsbury, “Complex wavelets for shift invariant analysis and filtering ofsignals,” Appl. Comput. Harmon. Anal., vol. 10, no 3, pp. 234–253, 2001.
[16] J. Li, A. Najmi, and R.M. Gray, “Image classification by a two dimensional hid-den Markov model,” IEEE Trans. Signal Processing, vol. 48, no. 2, pp. 517–533,Feb. 2000.
[17] J. Li and J.Z. Wang, “Studying digital imagery of ancient paintings by mixturesof stochastic models,” IEEE Trans. Image Processing, vol. 13, no. 3, pp. 340–353,Mar. 2004.
[18] K.H. Lister, C. Peres, and I. Fiedler, “Tracing an interaction: Supporting evidence,experimental grounds,” in Van Gogh and Gauguin: The Studio of the South, D.W.Druick and P.K. Zegers. London: Thames and Hudson, 2001, pp. 354–369.
[19] S. Lyu, D. Rockmore, and H. Farid, “A digital technique for art authenti-cation,” Proc. Nat. Acad. Sci., vol. 101, no. 49, pp. 17006–17010, Dec. 2004.
[20] H. Maitre, F. Schmitt, and C. Lahanier, “15 years of image processing andthe fine arts,” in Proc. IEEE Int. Conf. Image Processing, Oct. 2001, vol. 1, pp.557–561.
[21] C.L. Mallows, “A note on asymptotic joint normality,” Ann. Math. Statistics,vol. 43, no. 2, pp. 508–515, 1972.
[22] T. Melzer, P. Kammerer, and E. Zolda, “Stroke detection of brush strokes inportrait miniatures using a semi-parametric and a model based approach,” in Proc.Int. Conf. Pattern Recognition, Aug. 1998, pp. 172–174.
[23] J.-P. Mohen, M. Menu, and B. Mottin, Mona Lisa: Inside the Painting. NewYork: Abrams, 2006.
[24] R. Pickvance, Van Gogh in Arles. Metropolitan Museum of Art: New York, 1984.
[25] J. Romberg, H. Choi, and R. Baraniuk, “Bayesian tree-structured image mod-eling using wavelet-domain hidden Markov models,” IEEE Trans. ImageProcessing, vol. 10, no. 7, pp. 1056–1068, July 2001.
[26] R. Sablatnig, P. Kammerer, and E. Zolda, “Hierarchical classification of paint-ings using face- and brush stroke models,” in Proc. Int. Conf. Pattern Recognition,Aug. 1998, pp. 172–174.
[27] I.W. Selesnick, “A new complex-directional wavelet transform and its applicationto image denoising,” in Proc. Int. Conf. Image Processing, 2002, vol. 3, pp. 573–576.
[28] M. van Bommel, M. Geldof, and E. Hendriks, “An investigation of organic redpigments used in paintings by Vincent van Gogh (November 1885–February 1888),”Art Matters: Netherlands Technical Studies in Art, vol. 3, pp. 111–137, 2005.
[29] M.M. Van Dantzig, Vincent? A New Method of Identifying the Artist and HisWork and of Unmasking the Forger and His Products. Amsterdam, TheNetherlands: Keesing, 1952, pp. 24–25.
[30] M. Yelizaveta, C. Tat-Seng, and R. Jain, “Semi-supervised annotation of brush-work in paintings domain using serial combinations of multiple experts,” in Proc.ACM Multimedia, Oct. 2006, pp. 529–538.
IEEE SIGNAL PROCESSING MAGAZINE [48] JULY 2008
[SP]