Embed Size (px)
Citation preview

c h a p t e rc h a p t e r
twenty-fourtwenty-four
© 2006 Prentice Hall Business Publishing Economics R. Glenn Hubbard, Anthony Patrick O’Brien—1 st ed.
Prepared by: Fernando & Yvonn Quijano
Aggregate Demand andAggregate Supply Analysis
Modified by Chris Ball

© 2006 Prentice Hall Business Publishing Economics R. Glenn Hubbard, Anthony Patrick O’Brien—1 st ed.
CH
AP
TE
R 2
4:
Ag
gre
gat
e D
eman
d a
nd
Ag
gre
gat
e S
up
ply
An
alys
is
2 of 34
After studying this chapter, you should be able to:
Discuss the determinants of aggregate demand, and distinguish between a movement along the aggregate demand curve and a shift of the curve.
Discuss the determinants of aggregate supply, and distinguish between a movement along the short-run aggregate supply curve and a shift of the curve.
Use the aggregate demand and aggregate supply model to illustrate the difference between short-run and long-run macroeconomic equilibrium.
Use the dynamic aggregate demand and aggregate supply model to analyze macroeconomic conditions.
Caterpillar Recovers Slowly from the 2001 Recession
LE
AR
NIN
G O
BJE
CT
IVE
S
1
2
3
4
Caterpillar is a multinational corporation, so its sales are affected by factors that are unimportant for firms that sell only in the domestic markets.

© 2006 Prentice Hall Business Publishing Economics R. Glenn Hubbard, Anthony Patrick O’Brien—1 st ed.
CH
AP
TE
R 2
4:
Ag
gre
gat
e D
eman
d a
nd
Ag
gre
gat
e S
up
ply
An
alys
is
3 of 34
Aggregate demand and aggregate supply model A model that explains short-run fluctuations in real GDP and the price level.
Aggregate demand curve (AD) A curve showing the relationship between the price level and the quantity of real GDP demanded by households, firms, and the government.
Short-run aggregate supply curve (SRAS) A curve showing the relationship in the short run between the price level and the quantity of real GDP supplied by firms.
Aggregate Demand
LEARNING OBJECTIVE1

© 2006 Prentice Hall Business Publishing Economics R. Glenn Hubbard, Anthony Patrick O’Brien—1 st ed.
CH
AP
TE
R 2
4:
Ag
gre
gat
e D
eman
d a
nd
Ag
gre
gat
e S
up
ply
An
alys
is
4 of 34
Aggregate Demand
24 - 1
Aggregate Demand and Aggregate Supply

© 2006 Prentice Hall Business Publishing Economics R. Glenn Hubbard, Anthony Patrick O’Brien—1 st ed.
CH
AP
TE
R 2
4:
Ag
gre
gat
e D
eman
d a
nd
Ag
gre
gat
e S
up
ply
An
alys
is
5 of 34
Aggregate Demand
Why is the Aggregate Demand Curve Downward Sloping?
Y = C + I + G + NX
THE WEALTH EFFECT: HOW A CHANGE IN THE PRICE
LEVEL AFFECTS CONSUMPTION
THE INTEREST-RATE EFFECT: HOW A CHANGE IN THE
PRICE LEVEL AFFECTS INVESTMENT
THE INTERNATIONAL-TRADE EFFECT: HOW A CHANGE IN
THE PRICE LEVEL AFFECTS NET EXPORTS
Be Clear Why the Aggregate Demand Curve Is Downward Sloping

© 2006 Prentice Hall Business Publishing Economics R. Glenn Hubbard, Anthony Patrick O’Brien—1 st ed.
CH
AP
TE
R 2
4:
Ag
gre
gat
e D
eman
d a
nd
Ag
gre
gat
e S
up
ply
An
alys
is
6 of 34
Aggregate Demand
Shifts of the Aggregate Demand Curve versus Movements Along It
The Variables That Shift the Aggregate Demand Curve
CHANGES IN GOVERNMENT POLICIES
CHANGES IN THE EXPECTATIONS OF
HOUSEHOLDS AND FIRMS
CHANGES IN FOREIGN VARIABLES
© 2006 Prentice Hall Business Publishing Economics R. Glenn Hubbard, Anthony Patrick O’Brien—1 st ed.
CH
AP
TE
R 2
4:
Ag
gre
gat
e D
eman
d a
nd
Ag
gre
gat
e S
up
ply
An
alys
is
7 of 30
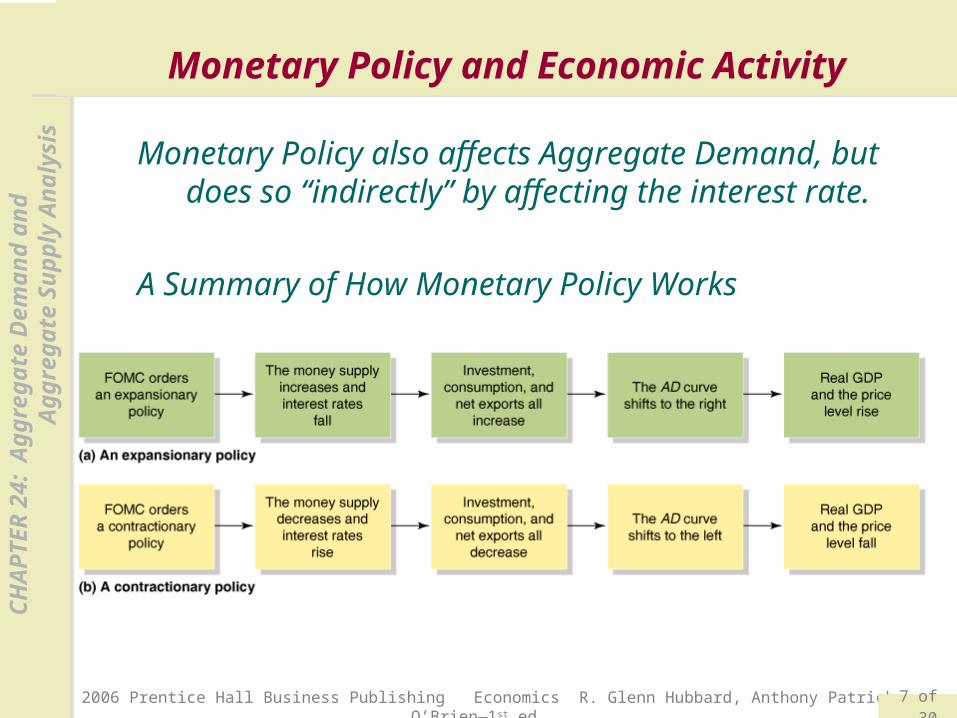
Monetary Policy and Economic Activity
Monetary Policy also affects Aggregate Demand, but does so “indirectly” by affecting the interest rate.
A Summary of How Monetary Policy Works

© 2006 Prentice Hall Business Publishing Economics R. Glenn Hubbard, Anthony Patrick O’Brien—1 st ed.
CH
AP
TE
R 2
4:
Ag
gre
gat
e D
eman
d a
nd
Ag
gre
gat
e S
up
ply
An
alys
is
8 of 34
Movements along the Aggregate Demand Curve versus Shifts of the Aggregate Demand Curve
24 - 1
LEARNING OBJECTIVE1
© 2006 Prentice Hall Business Publishing Economics R. Glenn Hubbard, Anthony Patrick O’Brien—1 st ed.
CH
AP
TE
R 2
4:
Ag
gre
gat
e D
eman
d a
nd
Ag
gre
gat
e S
up
ply
An
alys
is
9 of 34
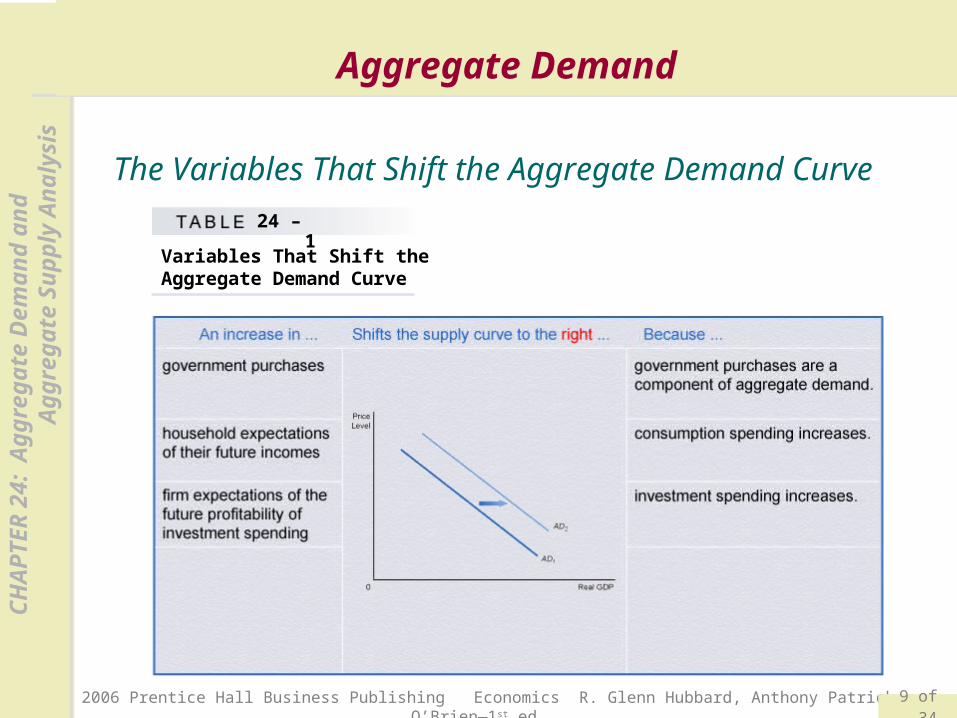
Aggregate Demand
The Variables That Shift the Aggregate Demand Curve
Variables That Shift the Aggregate Demand Curve
24 – 1

© 2006 Prentice Hall Business Publishing Economics R. Glenn Hubbard, Anthony Patrick O’Brien—1 st ed.
CH
AP
TE
R 2
4:
Ag
gre
gat
e D
eman
d a
nd
Ag
gre
gat
e S
up
ply
An
alys
is
10 of 34
Aggregate Demand
The Variables That Shift the Aggregate Demand Curve
Variables That Shift the Aggregate Demand Curve
24 – 1

© 2006 Prentice Hall Business Publishing Economics R. Glenn Hubbard, Anthony Patrick O’Brien—1 st ed.
CH
AP
TE
R 2
4:
Ag
gre
gat
e D
eman
d a
nd
Ag
gre
gat
e S
up
ply
An
alys
is
11 of 34
Aggregate Supply
LEARNING OBJECTIVE2
The Long-Run Aggregate Supply Curve
Long-run aggregate supply (LRAS) A curve showing the relationship in the long run between the price level and the quantity of real GDP supplied.

© 2006 Prentice Hall Business Publishing Economics R. Glenn Hubbard, Anthony Patrick O’Brien—1 st ed.
CH
AP
TE
R 2
4:
Ag
gre
gat
e D
eman
d a
nd
Ag
gre
gat
e S
up
ply
An
alys
is
12 of 34
Aggregate Supply
The Long-Run Aggregate Supply Curve24 - 2
The Long-Run Aggregate Supply Curve

© 2006 Prentice Hall Business Publishing Economics R. Glenn Hubbard, Anthony Patrick O’Brien—1 st ed.
CH
AP
TE
R 2
4:
Ag
gre
gat
e D
eman
d a
nd
Ag
gre
gat
e S
up
ply
An
alys
is
13 of 34
Aggregate Supply
The Short-Run Aggregate Supply Curve
1. CONTRACTS MAKE SOME WAGES AND PRICES “STICKY”
2. FIRMS ARE OFTEN SLOW TO ADJUST WAGES
3. MENU COSTS MAKE SOME PRICES STICKY
Menu costs The costs to firms of changing prices
The three most common explanations as to why a short-run aggregate supply curve slopes upward include:

© 2006 Prentice Hall Business Publishing Economics R. Glenn Hubbard, Anthony Patrick O’Brien—1 st ed.
CH
AP
TE
R 2
4:
Ag
gre
gat
e D
eman
d a
nd
Ag
gre
gat
e S
up
ply
An
alys
is
14 of 34
Aggregate Supply
Shifts of the Short-Run Aggregate Supply Curve versus Movements Along It
INCREASES IN THE LABOR FORCE AND IN THE
CAPITAL STOCK
TECHNOLOGICAL CHANGE
EXPECTED CHANGES IN THE FUTURE PRICE LEVEL
Variables That Shift the Short-Run Aggregate Supply Curve

© 2006 Prentice Hall Business Publishing Economics R. Glenn Hubbard, Anthony Patrick O’Brien—1 st ed.
CH
AP
TE
R 2
4:
Ag
gre
gat
e D
eman
d a
nd
Ag
gre
gat
e S
up
ply
An
alys
is
15 of 34
Aggregate Supply
How Expectations of the Future Price Level Affect the Short-Run Aggregate Supply Curve
24 - 3

© 2006 Prentice Hall Business Publishing Economics R. Glenn Hubbard, Anthony Patrick O’Brien—1 st ed.
CH
AP
TE
R 2
4:
Ag
gre
gat
e D
eman
d a
nd
Ag
gre
gat
e S
up
ply
An
alys
is
16 of 34
Aggregate Supply
Variables That Shift the Short-Run Aggregate Supply Curve
ADJUSTMENTS OF WORKERS AND FIRMS TO
ERRORS IN PAST EXPECTATIONS ABOUT THE
PRICE LEVEL
UNEXPECTED CHANGES IN THE PRICE OF AN
IMPORTANT NATURAL RESOURCE
Supply shock An unexpected event
that causes the short-run aggregate
supply curve to shift.

© 2006 Prentice Hall Business Publishing Economics R. Glenn Hubbard, Anthony Patrick O’Brien—1 st ed.
CH
AP
TE
R 2
4:
Ag
gre
gat
e D
eman
d a
nd
Ag
gre
gat
e S
up
ply
An
alys
is
17 of 34
Macroeconomic Equilibrium in the Long Run and the Short Run
LEARNING OBJECTIVE3
Variables That Shift the Short-Run Aggregate Supply Curve
24 – 2

© 2006 Prentice Hall Business Publishing Economics R. Glenn Hubbard, Anthony Patrick O’Brien—1 st ed.
CH
AP
TE
R 2
4:
Ag
gre
gat
e D
eman
d a
nd
Ag
gre
gat
e S
up
ply
An
alys
is
18 of 34
Macroeconomic Equilibriumin the Long Run and the Short Run
Variables That Shift the Short-Run Aggregate Supply Curve
24 – 2

© 2006 Prentice Hall Business Publishing Economics R. Glenn Hubbard, Anthony Patrick O’Brien—1 st ed.
CH
AP
TE
R 2
4:
Ag
gre
gat
e D
eman
d a
nd
Ag
gre
gat
e S
up
ply
An
alys
is
19 of 34
Macroeconomic Equilibriumin the Long Run and the Short Run
24 - 4Long-Run Macroeconomic Equilibrium

© 2006 Prentice Hall Business Publishing Economics R. Glenn Hubbard, Anthony Patrick O’Brien—1 st ed.
CH
AP
TE
R 2
4:
Ag
gre
gat
e D
eman
d a
nd
Ag
gre
gat
e S
up
ply
An
alys
is
20 of 34
Macroeconomic Equilibriumin the Long Run and the Short Run
Recessions, Expansions, and Supply Shocks
Because the full analysis of the aggregate demand and aggregate supply model can be complicated, we begin with a simplified case, using two assumptions:
1. The economy has not been experiencing any inflation. The price level is currently 100, and workers and firms expect it to remain at 100 in the future.
2. The economy is not experiencing any long-run growth. Potential real GDP is $10.0 trillion and will remain at that level in the future.

© 2006 Prentice Hall Business Publishing Economics R. Glenn Hubbard, Anthony Patrick O’Brien—1 st ed.
CH
AP
TE
R 2
4:
Ag
gre
gat
e D
eman
d a
nd
Ag
gre
gat
e S
up
ply
An
alys
is
21 of 34
Macroeconomic Equilibriumin the Long Run and the Short Run
Recessions, Expansions, and Supply Shocks
RECESSION
The Short-Run and Long-RunEffects of a Decrease inAggregate Demand
24 - 5
© 2006 Prentice Hall Business Publishing Economics R. Glenn Hubbard, Anthony Patrick O’Brien—1 st ed.
CH
AP
TE
R 2
4:
Ag
gre
gat
e D
eman
d a
nd
Ag
gre
gat
e S
up
ply
An
alys
is
22 of 34
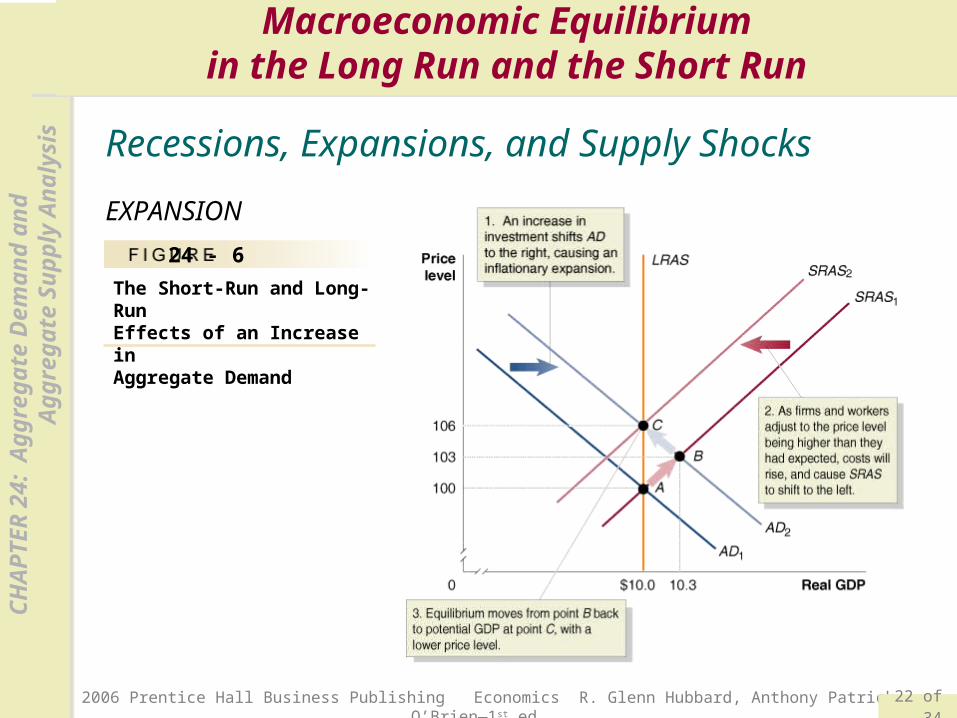
Macroeconomic Equilibriumin the Long Run and the Short Run
Recessions, Expansions, and Supply Shocks
EXPANSION
The Short-Run and Long-RunEffects of an Increase inAggregate Demand
24 - 6

© 2006 Prentice Hall Business Publishing Economics R. Glenn Hubbard, Anthony Patrick O’Brien—1 st ed.
CH
AP
TE
R 2
4:
Ag
gre
gat
e D
eman
d a
nd
Ag
gre
gat
e S
up
ply
An
alys
is
23 of 34
Macroeconomic Equilibriumin the Long Run and the Short Run
Recessions, Expansions, and Supply Shocks
SUPPLY SHOCK
The Short-Run and Long-Run Effects of a Supply Shock
24 - 7

© 2006 Prentice Hall Business Publishing Economics R. Glenn Hubbard, Anthony Patrick O’Brien—1 st ed.
CH
AP
TE
R 2
4:
Ag
gre
gat
e D
eman
d a
nd
Ag
gre
gat
e S
up
ply
An
alys
is
24 of 34
Macroeconomic Equilibriumin the Long Run and the Short Run
Recessions, Expansions, and Supply Shocks
SUPPLY SHOCK
Stagflation A combination of inflation and recession, usually resulting from a supply shock.

© 2006 Prentice Hall Business Publishing Economics R. Glenn Hubbard, Anthony Patrick O’Brien—1 st ed.
CH
AP
TE
R 2
4:
Ag
gre
gat
e D
eman
d a
nd
Ag
gre
gat
e S
up
ply
An
alys
is
25 of 34
A Dynamic Aggregate Demand and Aggregate Supply Model
We can create a dynamic aggregate demand and aggregate supply model by making three changes to the basic model:
Potential real GDP increases continually, shifting the
long-run aggregate supply curve (LRAS) to the right.
During most years, the aggregate demand curve
(AD) will be shifting to the right.
Except during periods when workers and firms
expect high rates of inflation, the short-run aggregate
supply curve (SRAS) will be shifting to the right.
LEARNING OBJECTIVE4

© 2006 Prentice Hall Business Publishing Economics R. Glenn Hubbard, Anthony Patrick O’Brien—1 st ed.
CH
AP
TE
R 2
4:
Ag
gre
gat
e D
eman
d a
nd
Ag
gre
gat
e S
up
ply
An
alys
is
26 of 34
A Dynamic Aggregate Demandand Aggregate Supply Model
24 - 8An Increase in Potential Real GDP

© 2006 Prentice Hall Business Publishing Economics R. Glenn Hubbard, Anthony Patrick O’Brien—1 st ed.
CH
AP
TE
R 2
4:
Ag
gre
gat
e D
eman
d a
nd
Ag
gre
gat
e S
up
ply
An
alys
is
27 of 34
A Dynamic Aggregate Demandand Aggregate Supply Model
Using Dynamic Aggregate Demand and Aggregate Supply to Understand Inflation
24 - 9
What Is the Usual Cause of Inflation?