Embed Size (px)
Citation preview

CAFR ComprehensiveAnnual
Financial ReportFiscal Year JulY 1, 2014 - June 30, 2015
City of tuCson, ArizonA

City of Tucson, Arizona
Comprehensive Annual Financial Report
Fiscal Year Ended June 30, 2015
Prepared by: The Department of Finance, Accounting Operations Division


CITY OF TUCSON, ARIZONA
INTRODUCTORY SECTION
Introd
uctory Se
ction

INTRODUCTORY SECTION
Letter of Transmittal vCity of Tucson Officials xiCity of Tucson Organizational Chart xiiCertificate of Achievement for Excellence in Financial Reporting xiii
FINANCIAL SECTION
Independent Auditors' Report 1
Management's Discussion and Analysis (Required Supplementary Information) 5
Basic Financial StatementsGovernment-wide Financial Statements
Statement of Net Position 17Statement of Activities 18
Fund Financial StatementsGovernmental Funds:
Balance Sheet 20Reconciliation of the Balance Sheet for Governmental Funds to the Statement of Net Position 21Statement of Revenues, Expenditures, and Changes in Fund Balances - Governmental Funds 22Reconciliation of the Statement of Revenues, Expenditures, and Changes in Fund Balances of Governmental Funds to the Statement of Activities 23
Proprietary Funds:Statement of Net Position 24Statement of Revenues, Expenses, and Changes in Fund Net Position 26Statement of Cash Flows 27
Fiduciary Funds:Statement of Fiduciary Net Position 29Statement of Changes in Fiduciary Net Position 30
Notes to Basic Financial Statements
Note 1 - Summary of Significant Accounting Policies 31Note 2 - Property Tax 41Note 3 - Individual Fund Disclosures 42Note 4 - Deposits and Investments 42Note 5 - Interfund Balances and Transfers 51Note 6 - Capital Assets 53Note 7 - Changes in Long-term Debt and Liabilities 54Note 8 - Lease Obligations 55Note 9 - Bond Issues 56Note 10 - Advance Refunding/Defeasance of Debt 59Note 11 - Landfills 59Note 12 - Pension Plans 60Note 13 - Other Post Employment Benefits 76Note 14 - Self Insurance Program 78Note 15 - Pledged Revenues 79Note 16 - Contigencies and Commitments 79Note 17 - Remediation Liability 82Note 18 - Credit Card Payments by the City of Tucson 83Note 19 - Potential Streetcar Claims 83Note 20 - Restatement 83Note 21 - New Governmental Accounting Standard Board (GASB) Pronouncements 84
CITY OF TUCSON, ARIZONAComprehensive Annual Financial Report
Table of ContentsFor the Year Ended June 30, 2015
Page
i

REQUIRED SUPPLEMENTARY INFORMATION
Schedule of Revenues, Expenditures, and Changes in Fund Balance - Budget and ActualGeneral Fund 87Mass Transit Special Revenue Fund 88Note to Required Supplementary Information 89
Pension Plans DisclosuresSchedule of Changes in the City's Net Pension Liability and Related Ratios - TSRS 92Schedule of the Pension Net Pension Position Liability - TSRS 93Schedule of Contributions - TSRS 94Notes to Schedule of Contributions - TSRS 94Schedule of Pension Investment Returns - TSRS 95Schedule of Changes in the City's Net Pension Liability and Related Ratios - PSPRS 96Schedule of Contributions - PSPRS 98Notes to Schedule of Contributions - PSPRS 99Schedule of the City's Proportionate Share of the Net Pension Liability - Elected Official 100Schedule of Contributions - Elected Official 101Schedule of Agent OPEB Plan's Funding Progress 102
COMBINING STATEMENTS AND INDIVIDUAL FUND STATEMENTS AND SCHEDULES
Combining StatementsNonmajor Governmental Funds:
Balance Sheet 103Statement of Revenues, Expenditures, and Changes in Fund Balances 110
Nonmajor Enterprise Funds:Statement of Net Position 118Statement of Revenues, Expenses, and Changes in Fund Net Position 119Statement of Cash Flows 120
Internal Service Funds:Statement of Net Position 121Statement of Revenues, Expenses, and Changes in Fund Net Position 122Statement of Cash Flows 123
Fiduciary Funds:Statement of Fiduciary Assets and Liabilities - All Agency Funds 124
Combining Schedule of Revenues, Expenditures, and Changes in Fund Balance Budget and Actual - Nonmajor Governmental Funds:
Parkwise 126Convention Center Fund 127H.U.R.F. Fund 127Civic Contribution Fund 128Community Development Block Grants Fund 129Miscellaneous Housing Grant Fund 129Public Housing Section 8 Fund 130HOME Affordable Housing Fund 131Other Federal Grants Fund 131Non-Federal Grants Fund 132Sun Link Fund 133Special Assessment Bond and Interest Debt Service Fund 134General Obligation Bond and Interest Debt Service Fund 135Street and Highway Bond and Interest Debt Service Fund 135Capital Improvements Fund 138Regional Transportation Authority Fund 1392012 General Obligation Streets Improvements Fund 139Development Fee Fund 140
Page
For the Year Ended June 30, 2015
Comprehensive Annual Financial ReportTable of Contents
CITY OF TUCSON, ARIZONA
ii

Page
Schedule of Revenues, Expenses, and Changes in Net Position - Budget to ActualEnvironmental Services Fund 142Tucson Golf Enterprise Fund 143Public Housing Fund 144HCD Non-PHA Asset Management Fund 145Water Utility Fund 146
Revenues, Expenses and Flow of Funds Per Ordinance No. 6347: Water Utility Fund 148
STATISTICAL SECTION (UNAUDITED) Table
Expenditures/Expenses by Department I 152Net Position by Component II 153Changes in Net Position III 154Fund Balances, Governmental Funds IV 156Tax and Other Agency Revenues, General Fund V 157Changes in Fund Balances, Governmental Funds VI 158Taxable Sales by Category VII 160Business Privilege Taxes VIII 161Principal Business Privilege Tax Remitters by Activity IX 162Ratios of Outstanding Debt by Type X 163Ratios of Net General Bonded Debt Outstanding XI 164Direct and Overlapping Governmental Activities Debt XII 165Legal Debt Margin Information XIII 166Pledged Revenue Coverage XIV 167Demographic and Economic Statistics XV 168Principal Employers XVI 169Adopted Budget Full-time-Equivalent City Employees by Function XVII 170Capital Asset Statistics by Function XVIII 171Operating Indicators by Function XIX 172
GLOSSARY 173
CITY OF TUCSON, ARIZONAComprehensive Annual Financial Report
Table of ContentsFor the Year Ended June 30, 2015
iii


v

vi

vii

viii

ix

x

City of Tucson Officials
HONORABLE JONATHAN ROTHSCHILD
Mayor
REGINA ROMEROWard One
PAUL CUNNINGHAMWard Two
KARIN UHLICHWard Three
SHIRLEY SCOTTWard Four
RICHARD FIMBRESWard Five
STEVE KOZACHIKWard Six
Mayor and Council
City Administration
SILVIA AMPARANO, CPA Finance Director
SHANE OMANFinance Administrator
KAREN TENACE, CPADeputy Finance Director
MICHAEL J. ORTEGA, P.E. City Manager July 1, 2015
MARTHA DURKIN Interim City Manager
At June 30, 2015
xi

Finance
Assistant City Managerr
Emergency Management
Police
Assistant City Manager
City Manager City Clerk
CITY OF TUCSON ORGANIZATION CHART
FISCAL YEAR 2015
City Attorney
Mayor and Council
Budget and Internal Audit
Fire
Tucson Water
Transportation
Procurement
Zoning Examiner
Environmental Services
Assistant City Manager
General Services
Planning and Development Services
Citizens
Real Estate
Economic Initiatives
Human Resources
Information Technology
Public Defender
Golf
Tucson Convention Center
Parks and Recreation
Risk Management Constituent Services and Management Reporting
Annexation
Housing and Community
Development
Planning and Policy Development
Intergovernmental Relations
City Court
Integrated Planning
ParkWise
Communication and
Public Information
Economic Development
Small Business Enterprise and Disadvantage
Business Programs
International Trade
xii

xiii


CITY OF TUCSON, ARIZONA
Financial Sectio
n
FINANCIAL SECTION

INDEPENDENT AUDITORS' REPORT
The Honorable Mayor and Members of the City CouncilCity of Tucson, Arizona
Report on the Financial StatementsWe have audited the accompanying financial statements of the governmental activities, the business-type activities, each major fund, and the aggregate remaining fund information of the City of Tucson, Arizona (the “City”), as of and for the year ended June 30, 2015, and the related notes to the financial statements, which collectively comprise the City’s basic financial statements as listed in the table of contents.
Management’s Responsibility for the Financial StatementsManagement is responsible for the preparation and fair presentation of these financial statements in accordance with accounting principles generally accepted in the United States of America; this includes the design, implementation, and maintenance of internal control relevant to the preparation and fair presentation of financial statements that are free from material misstatement, whether due to fraud or error.
Auditors’ ResponsibilityOur responsibility is to express opinions on these financial statements based on our audit. We conducted our audit in accordance with auditing standards generally accepted in the United States of America and the standards applicable to financial audits contained in Government Auditing Standards, issued by the Comptroller General of the United States. Those standards require that we plan and perform the audit to obtain reasonable assurance about whether the financial statements are free frommaterial misstatement.
An audit involves performing procedures to obtain audit evidence about the amounts and disclosures in the financial statements. The procedures selected depend on the auditors’ judgment, including the assessment of the risks of material misstatement of the financial statements, whether due to fraud or error. In making those risk assessments, the auditor considers internal control relevant to the entity’s preparation and fair presentation of the financial statements in order to design audit procedures that are appropriate in the circumstances, but not for the purpose of expressing an opinion on the effectiveness of the entity’s internal control. Accordingly, we express no such opinion. An audit also includes evaluating the appropriateness of accounting policies used and the reasonableness of significant accounting estimates made by management, as well as evaluating the overall presentation of the financial statements.
We believe that the audit evidence we have obtained is sufficient and appropriate to provide a basis for our audit opinions.
OpinionsIn our opinion, the financial statements referred to above present fairly, in all material respects, the respective financial position of the governmental activities, the business-type activities, each major fund, and the aggregate remaining fund information of the City of Tucson, Arizona as of June 30, 2015, and the respective changes in financial position and, where applicable, cash flows thereof for the year then ended in accordance with accounting principles generally accepted in the United States of America.
1
The Honorable Mayor and Members of the City CouncilCity of Tucson, Arizona
Emphasis of a Matter
During fiscal year ended June 30, 2015, the City adopted GASB Statement No. 68, Accounting and Financial Reporting for Pensions and the related GASB Statement No. 71 Pension Transition for Contributions Made Subsequent to the Measurement Date—an amendment of GASB Statement No. 68.As a result of the implementation of these standards, the City reported a restatement for the change in accounting principle (see Note 20). Our auditors’ opinion was not modified with respect to the restatement.
Other MattersRequired Supplementary InformationAccounting principles generally accepted in the United States of America require that the management’sdiscussion and analysis on pages 5 through 16 and budgetary comparison information on pages 87through 89 and the pension plan disclosures on pages 92 through 102 be presented to supplement the basic financial statements. Such information, although not a part of the basic financial statements, is required by the Governmental Accounting Standards Board who considers it to be an essential part of financial reporting for placing the basic financial statements in an appropriate operational, economic, or historical context. We have applied certain limited procedures to the required supplementary information in accordance with auditing standards generally accepted in the United States of America, which consisted of inquiries of management about the methods of preparing the information and comparing the information for consistency with management’s responses to our inquiries, the basic financial statements, and other knowledge we obtained during our audit of the basic financial statements. We do not express an opinion or provide any assurance on the information because the limited procedures do not provide us with sufficient evidence to express an opinion or provide any assurance.
Other InformationOur audit was conducted for the purpose of forming opinions on the financial statements that collectivelycomprise the City of Tucson, Arizona’s basic financial statements. The combining and individual fund financial statements and schedules on pages 103 through 146 are presented for purposes of additional analysis and are not a required part of the basic financial statements.
The combining and individual fund financial statements and schedules are the responsibility of management and were derived from and relate directly to the underlying accounting and other records used to prepare the basic financial statements. Such information has been subjected to the auditing procedures applied in the audit of the basic financial statements and certain additional procedures, including comparing and reconciling such information directly to the underlying accounting and other records used to prepare the basic financial statements or to the basic financial statements themselves, and other additional procedures in accordance with auditing standards generally accepted in the United States of America. In our opinion, the combining and individual fund financial statements are fairly stated, in all material respects, in relation to the basic financial statements as a whole.
The introductory section and statistical tables listed in the table of contents and supplemental schedules on pages 148 and 149 have not been subjected to the auditing procedures applied in the audit of the basic financial statements, and accordingly, we do not express an opinion or provide any assurance on them.
2

The Honorable Mayor and Members of the City CouncilCity of Tucson, Arizona
Other Reporting Required by Government Auditing StandardsIn accordance with Government Auditing Standards, we have also issued our report dated January 27, 2016, on our consideration of the City’s internal control over financial reporting and on our tests of its compliance with certain provisions of laws, regulations, contracts, and grant agreements and other matters. The purpose of that report is to describe the scope of our testing of internal control over financial reporting and compliance and the result of that testing, and not to provide an opinion on internal control over financial reporting or on compliance. That report is an integral part of an audit performed in accordance with Government Auditing Standards in considering the City’s internal control over financial reporting and compliance.
aCliftonLarsonAllen LLP
Tucson, ArizonaJanuary 27, 2016
3


CITY OF TUCSON, ARIZONA
MANAGEMENT’S DISCUSSIONAND ANALYSIS
Manag
em
ent’s D
iscussion
and A
nalysis
CITY OF TUCSON, ARIZONAMANAGEMENT’S DISCUSSION AND ANALYSIS
For the Year Ended June 30, 2015
INTRODUCTION
The Management’s Discussion and Analysis (MD&A) section of the City’s Comprehensive Annual Financial Report (CAFR) presents discussion and analysis of the City’s financial performance during the fiscal year that ended on June 30, 2015. Please read it in conjunction with the transmittal letter at the beginning of the CAFR and the City’s financial statements which immediately follow this section. The purpose of the MD&A is to (1) focus on significant financial issues, (2) provide an overview of the City’s financial activity, (3) identify changes in the City’s financial position, (4) identify any individual fund issues or concerns, and (5) provide descriptions of significant asset and debt activity.
FINANCIAL HIGHLIGHTS
The City’s financial position improved over last fiscal year with an increase in total net position. The highlights are explained below:
• At fiscal year end, the City’s assets and deferred outflows exceeded its liabilities and deferred inflows by $1.6 billion—reported as net position. Assets and deferred outflows totaled $4.3 billion while liabilities and deferred inflows were $2.7 billion.
• In comparing fiscal year 2015 to fiscal year 2014, total net position (restated) increased by $7.1 million. Governmental activities decreased $20.0 million, while business-type activities increased $27.1 million. Within the governmental activities, unrestricted net position decreased by $52.7 million and net investment in capital assets increased $40.2 million. Within the business-type activities, unrestricted net position increased by $12.8 million and net investment in capital assets increased $13.5 million.
• The cash and cash equivalents for the governmental and business-type activities decreased a combined total of $6.9 million over last year.
• The City’s governmental funds reported a combined fund balance of $165.6 million, a decrease of $16.3 million from last fiscal year.
• The General Fund reported a fund balance of $65.7 million. This is a decrease of $1.0 million (1.5%) over the last fiscal year.
• The City implemented Governmental Accounting Standard Board Statement 68, Accounting and Financial Reporting for Pensions, as amended by Governmental Accounting Standard Board Statement 71, Pension Transition for Contributions Made Subsequent to the Measurement Date causing an overall decrease to beginning net position of $891.9 million. See Note 20.
5

CITY OF TUCSON, ARIZONAMANAGEMENT’S DISCUSSION AND ANALYSIS
For the Year Ended June 30, 2015
OVERVIEW OF FINANCIAL STATEMENTS
Required Components of Annual Financial Report
This annual report consists of a series of financial statements that are categorized as either government-wide financial statements or fund financial statements. The government-wide financial statements include the Statement of Net Position and the Statement of Activities, which provide information about the activities of the City as a whole and present a long-term view of the City’s finances. The fund financial statements represent how services were financed in the short-term as well as what remains for future spending. Fund financial statements also report the City’s operations in more detail than the government-wide financial statements by providing information about the City’s most significant funds. Also included in the fund financial statements are the fiduciary funds. These include financial information about activities for which the City acts solely as a trustee or agent for the benefit of those outside the government. Finally, the notes to the financial statements should be read in conjunction with the financial statements as they are an integral part to fully understand the statements.
Basic Financial Statements
The Basic Financial Statements section contains two types of statements that present financial data in different manners. The first two statements represent the government-wide financial statements, which provide short and long-term information about the City’s overall financial status comparable to a private-sector business. Following the government-wide statements are the fund financial statements which provide a short-term view of the City’s operations at a more detailed level.
The financial statements also include notes that provide more detailed data for some of the figures in the financial statements. The statements are followed by the “Required Supplementary Information” section that provides budgetary analysis for the major governmental funds. The “Combining Statements and Individual Fund Statements and Schedules” section presents combining statements for non-major governmental funds, non- major enterprise funds, and non-major internal service funds, along with budget to actual comparisons for individual funds.
Government-wide Financial Statements
The government-wide financial statements report information about the City as a whole using accounting methods similar to those used by private-sector companies. The Statement of Net Position includes all of the government’s assets, deferred outflows, liabilities and deferred inflows. The Statement of Activities includes all revenues and expenses regardless of when cash is received or dispersed. These two statements report the City’s net position and its change during the fiscal year. Net position, the residual amount of assets
6

CITY OF TUCSON, ARIZONAMANAGEMENT’S DISCUSSION AND ANALYSIS
For the Year Ended June 30, 2015
and deferred outflows less liabilities and deferred inflows, is one way to measure financial health. An increase of net position shows financial improvement, while a decrease indicates financial decline.
To assess the overall health of the City, additional non-financial factors, such as changes in bond ratings, changes in the City’s property tax base, projected business privilege tax collection trends, and the condition of the City’s infrastructure are also considered.
There are two types of activities in the government-wide financial statements. The first activity, governmental, represents most of the City’s basic services such as police, fire, transportation, and parks. Business privilege taxes, property taxes, state revenue sharing, fines, customer service fees, grants and contributions from agencies finance most of these activities. The second activity, business-type, or enterprise funds, represents those areas in which the City charges fees to customers to cover the costs of certain services it provides. The City’s enterprise funds are Environmental Services, Water Utility, Tucson Golf Enterprise, Non-Public Housing Asset (PHA) Management, and Public Housing Asset Management Properties (AMP).
Fund Financial Statements
The fund financial statements provide more detailed information about the City’s major and non-major funds rather than the City as a whole. Funds are groups of related accounts used to maintain control over resources that have been segregated for specific activities or purposes. The funds have specific funding sources and expenditures/expenses for particular programs. Some funds are required by state law or by bond covenants, while Mayor and Council establish other funds for management purposes.
There are three types of fund financial statements: governmental, proprietary, and fiduciary. As described below, the governmental fund statements use a different accounting approach from the proprietary and fiduciary statements.
• Governmental fund statements disclose how general government services, such as police, fire, transportation, and parks and recreation, were financed in the short-term as well as what remains for future expenditures. These funds are reported using the modified accrual basis of accounting, which measures cash and all other financial assets that can readily be converted to cash. Consequently, the governmental fund statements provide a detailed short-term view that helps determine whether there are more or fewer financial resources that can be spent in the near future to finance the City’s programs. The relationship (or differences) between governmental activities, reported in the government-wide financial statements, and governmental funds is provided in a reconciliation following the respective fund financial statements. Reconciling items include: converting fund capital expenditures to capital assets, reducing long-term debt by debt service principal expenditures, and establishing liabilities for issuing new debt such as bonds and capital leases.
• Proprietary fund statements report revenues from fees charged to customers for services provided by the City and are reported in the same manner as the government-wide financial statements. Because both types of statements adhere to the full accrual basis of accounting standards, the total enterprise column on the Statement of Net Position and the Statement of Revenues, Expenses, and Changes in Net Position for proprietary funds provides the same financial information as the business-type activity columns in the government-wide financial statements. In addition, a Statement of Cash Flows is provided. Internal service funds are combined into a single column on these statements, and they are reported as part of both the governmental and business-type activities in the government-wide financial statements.
• Fiduciary fund statements represent funds for which the City acts as a trustee. Like the proprietary funds, they follow the standards for full accrual basis of accounting. The City is responsible for ensuring that the assets reported in these funds are used for their intended purposes. These activities are excluded
7

CITY OF TUCSON, ARIZONAMANAGEMENT’S DISCUSSION AND ANALYSIS
For the Year Ended June 30, 2015
from the City’s government-wide financial statements because the City cannot use these assets to finance its operations.
FINANCIAL ANALYSIS OF THE CITY AS A WHOLE
The combined net position for the City increased 0.4% over the course of the year to $1.6 billion; an increase of $7.1 million. Governmental activities decreased $20.0 million while business-type net position increased $27.1 million. As shown in Figure 2, the largest component of net position represents the City’s investment in capital assets, i.e., land, buildings, equipment and infrastructure, net of accumulated depreciation and related debt. The second largest component of net position represents restricted net position, the use of which is restricted by external sources such as debt covenants, enabling legislation or grant stipulations. The final component of net position is unrestricted.
The change in net position for Governmental Activities was largely due to an increase of $52.7 million in unrestricted deficit, and $40.2 million increase in net investment in capital assets. The increase in net investment in capital assets is primarily due to continued corridor widening projects. The implementation of GASB 68, which included a restatement of net position, significantly contributed to a $161.7 million increase to deferred outflows, $135.7 million increase to long-term liabilities and a $52.7 million increase in unrestricted deficit.
The change in net position for Business-type activities is due to a decrease of $12.8 million in unrestricted deficit, and $13.5 million increase in net investment in capital assets. The $13.5 million increase is due to capital asset activity exceeding debt activity mostly in the Water Utility fund. The $12.8 million net decrease in the unrestricted deficit is primarily due to the improvement in working capital (current assets minus current liabilities) of both Environmental Services and Water Utility funds.
Figure 2 is a comparative summary of the City’s net position for fiscal years 2015 and 2014:
Net Position Figure 2Governmental Activities Business-type Activities Total
2015 2014 Restated* 2015 2014 Restated* 2015 2014 Restated*
Current and Other Assets $ 382,936,566 $ 377,296,069 $ 252,820,116 $ 235,293,370 $ 635,756,682 $ 612,589,439
Capital Assets 2,095,350,226 2,085,549,257 1,361,273,746 1,346,701,930 3,456,623,972 3,432,251,187
Deferred Outflows 174,152,064 12,479,350 21,853,333 13,017,331 196,005,397 25,496,681
Total Assets and Deferred Outflows 2,652,438,856 2,475,324,676 1,635,947,195 1,595,012,631 4,288,386,051 4,070,337,307
Current and Other Liabilities 186,576,406 168,984,708 89,518,956 79,774,112 276,095,362 248,758,820
Long-term Liabilities 1,568,142,993 1,432,388,252 678,818,996 687,219,402 2,246,961,989 2,119,607,654
Deferred Inflows 44,244,990 426,725 79,914,537 67,461,903 124,159,527 67,888,628
Total Liabilities and Deferred Inflow 1,798,964,389 1,601,799,685 848,252,489 834,455,417 2,647,216,878 2,436,255,102
Net Position:
Net Investment in Capital Assets 1,539,250,781 1,499,029,239 825,087,980 811,642,121 2,364,338,761 2,310,671,360
Restricted 147,289,613 154,849,334 39,601,012 38,724,476 186,890,625 193,573,810
Unrestricted (Deficit) (833,065,927) (780,353,582) (76,994,286) (89,809,383) (910,060,213) (870,162,965)
Total net position $ 853,474,467 $ 873,524,991 $ 787,694,706 $ 760,557,214 $1,641,169,173 $1,634,082,205
*Beginning net position as restated June 30, 2014, due to the provisions of GASB 68.
8

CITY OF TUCSON, ARIZONAMANAGEMENT’S DISCUSSION AND ANALYSIS
For the Year Ended June 30, 2015
Figure 3 shows condensed financial information derived from the government-wide Statement of Activities and reflects how the City’s net position changed during the course of the fiscal year:
Changes in Net Position Figure 3Governmental Activities Business-type Activities Total
2015 2014 2015 2014 2015 2014
Revenues:Program Revenues:
Charges for Services $ 114,680,412 $ 104,412,957 $ 242,991,704 $ 231,559,735 $ 357,672,116 $ 335,972,692
Operating Grants and Contributions 118,631,887 108,429,579 6,110,015 6,077,057 124,741,902 114,506,636
Capital Grants and Contributions 81,649,759 123,245,299 7,631,102 8,463,198 89,280,861 131,708,497
Total Program Revenues 314,962,058 336,087,835 256,732,821 246,099,990 571,694,879 582,187,825
General Revenues:
Taxes:
Property 44,992,133 43,912,695 44,992,133 43,912,695
Business Privilege 194,523,190 193,235,470 194,523,190 193,235,470
Public Utility 21,791,368 20,886,226 21,791,368 20,886,226
Hotel/Transient Occupancy 13,397,772 12,290,994 13,397,772 12,290,994
Occupational 87,846 87,846
Liquor 750,481 750,481
Unrestricted Grants and Contributions 131,349,102 124,171,684 131,349,102 124,171,684
Investment Income (Loss) 988,190 1,127,524 1,761,345 2,079,879 2,749,535 3,207,403
Miscellaneous 1,225,842 14,843,790 1,225,842 14,843,790
Total General Revenues 408,267,597 411,306,710 1,761,345 2,079,879 410,028,942 413,386,589
Total Revenues 723,229,655 747,394,545 258,494,166 248,179,869 981,723,821 995,574,414
Expenses:Elected and Official 20,624,381 22,266,302 20,624,381 22,266,302
Support Services 50,308,291 48,948,932 50,308,291 48,948,932
Public Safety and Justice Services 323,811,440 260,591,927 323,811,440 260,591,927
Community Enrichment andDevelopment 297,437,927 271,590,886 297,437,927 271,590,886
Non-Departmental 25,615,851 28,356,640 25,615,851 28,356,640
Interest on Long-term Debt 25,387,637 24,236,525 25,387,637 24,236,525
Fiscal Agent and Other Fees 1,880,263 1,868,185 1,880,263 1,868,185
Public Housing AMP 9,974,288 10,257,513 9,974,288 10,257,513
Non-PHA Asset Management 2,267,351 1,383,356 2,267,351 1,383,356
Environmental Services 41,611,732 57,226,295 41,611,732 57,226,295
Tucson Golf Enterprise Fund 8,276,232 6,753,158 8,276,232 6,753,158
Water Utility 167,441,460 151,980,908 167,441,460 151,980,908
Total Expenses 745,065,790 657,859,397 229,571,063 227,601,230 974,636,853 885,460,627
Changes in Net Position beforeTransfers (21,836,135) 89,535,148 28,923,103 20,578,639 7,086,968 110,113,787
Transfers 1,785,611 957,697 (1,785,611) (957,697)
Changes in Net Position $ (20,050,524) $ 90,492,845 $ 27,137,492 $ 19,620,942 $ 7,086,968 $ 110,113,787
9
CITY OF TUCSON, ARIZONAMANAGEMENT’S DISCUSSION AND ANALYSIS
For the Year Ended June 30, 2015
Governmental Activities
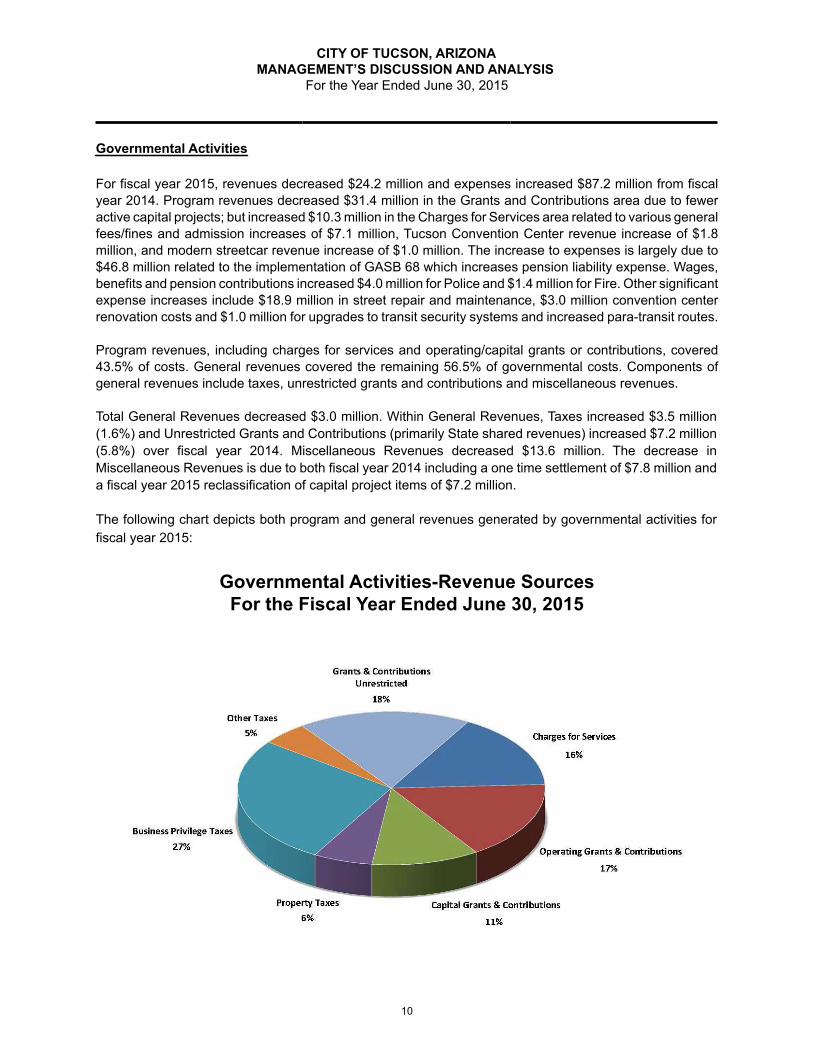
For fiscal year 2015, revenues decreased $24.2 million and expenses increased $87.2 million from fiscal year 2014. Program revenues decreased $31.4 million in the Grants and Contributions area due to fewer active capital projects; but increased $10.3 million in the Charges for Services area related to various general fees/fines and admission increases of $7.1 million, Tucson Convention Center revenue increase of $1.8 million, and modern streetcar revenue increase of $1.0 million. The increase to expenses is largely due to $46.8 million related to the implementation of GASB 68 which increases pension liability expense. Wages, benefits and pension contributions increased $4.0 million for Police and $1.4 million for Fire. Other significant expense increases include $18.9 million in street repair and maintenance, $3.0 million convention center renovation costs and $1.0 million for upgrades to transit security systems and increased para-transit routes.
Program revenues, including charges for services and operating/capital grants or contributions, covered 43.5% of costs. General revenues covered the remaining 56.5% of governmental costs. Components of general revenues include taxes, unrestricted grants and contributions and miscellaneous revenues.
Total General Revenues decreased $3.0 million. Within General Revenues, Taxes increased $3.5 million (1.6%) and Unrestricted Grants and Contributions (primarily State shared revenues) increased $7.2 million (5.8%) over fiscal year 2014. Miscellaneous Revenues decreased $13.6 million. The decrease in Miscellaneous Revenues is due to both fiscal year 2014 including a one time settlement of $7.8 million and a fiscal year 2015 reclassification of capital project items of $7.2 million.
The following chart depicts both program and general revenues generated by governmental activities for fiscal year 2015:
Governmental Activities-Revenue SourcesFor the Fiscal Year Ended June 30, 2015
10
CITY OF TUCSON, ARIZONAMANAGEMENT’S DISCUSSION AND ANALYSIS
For the Year Ended June 30, 2015
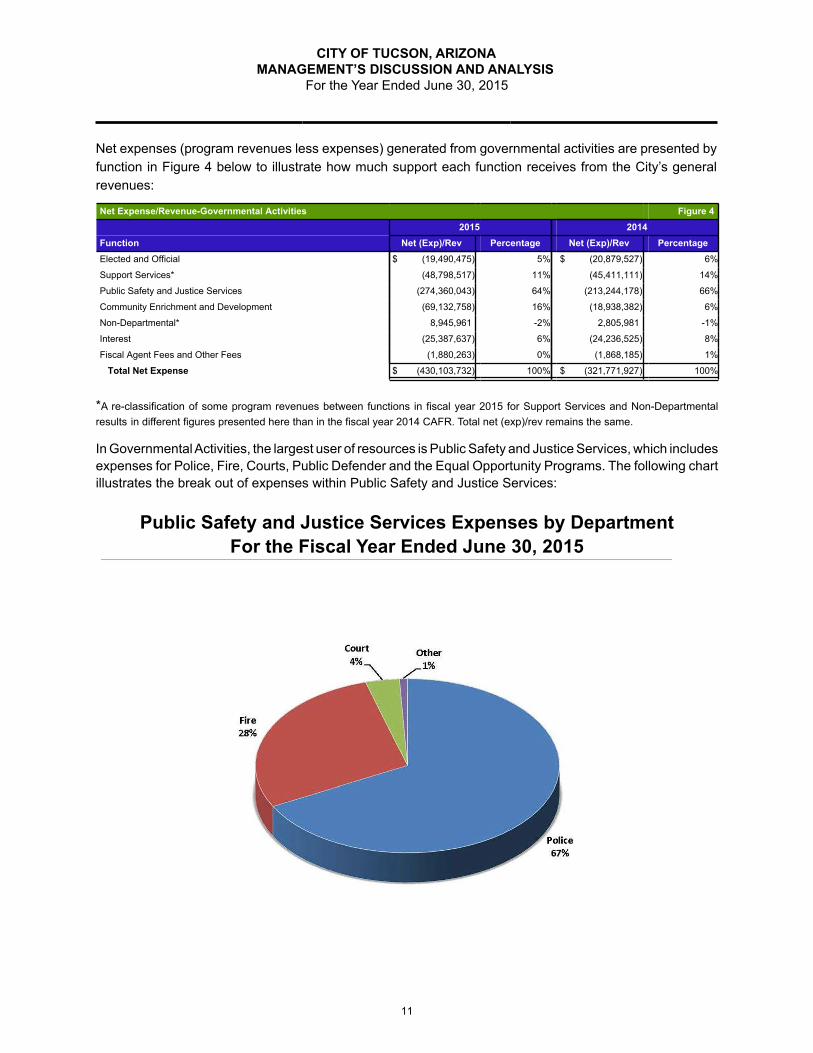
Net expenses (program revenues less expenses) generated from governmental activities are presented by function in Figure 4 below to illustrate how much support each function receives from the City’s general revenues:
Net Expense/Revenue-Governmental Activities Figure 42015 2014
Function Net (Exp)/Rev Percentage Net (Exp)/Rev PercentageElected and Official $ (19,490,475) 5% $ (20,879,527) 6%
Support Services* (48,798,517) 11% (45,411,111) 14%
Public Safety and Justice Services (274,360,043) 64% (213,244,178) 66%
Community Enrichment and Development (69,132,758) 16% (18,938,382) 6%
Non-Departmental* 8,945,961 -2% 2,805,981 -1%
Interest (25,387,637) 6% (24,236,525) 8%
Fiscal Agent Fees and Other Fees (1,880,263) 0% (1,868,185) 1%
Total Net Expense $ (430,103,732) 100% $ (321,771,927) 100%
*A re-classification of some program revenues between functions in fiscal year 2015 for Support Services and Non-Departmental results in different figures presented here than in the fiscal year 2014 CAFR. Total net (exp)/rev remains the same.
In Governmental Activities, the largest user of resources is Public Safety and Justice Services, which includes expenses for Police, Fire, Courts, Public Defender and the Equal Opportunity Programs. The following chart illustrates the break out of expenses within Public Safety and Justice Services:
Public Safety and Justice Services Expenses by DepartmentFor the Fiscal Year Ended June 30, 2015
11

CITY OF TUCSON, ARIZONAMANAGEMENT’S DISCUSSION AND ANALYSIS
For the Year Ended June 30, 2015
Business-type Activities
The following funds comprise the Business-type Activities: Water Utility, Environmental Services, Tucson Golf Enterprise, Public Housing Asset Management Properties (AMP) and Non-PHA Asset Management. The Environmental Services Fund and the Water Utility Fund are major funds for the City’s business-type (or enterprise) activity. In fiscal year 2015 the business-type net position increased $27.1 million or 3.5%. Net investment in capital assets increased $13.5 million and the unrestricted net position deficit decreased $12.9 million. The largest changes were an increase to the net investment in capital assets in both the Environmental Services fund, $9.4 million and the Water Utility fund, $6.1 million.
Water Utility Revenues
Total operating revenues increased by $9.9 million or 5.8%. A Central Arizona Project (CAP) water surcharge rate increase resulted in an increase in CAP revenue of $2.2 million in fiscal year 2015 over fiscal year 2014. Water rates also increased, resulting in a revenue increase of $2.5 million. Additionally, ground water credits were sold for $3.0 million and a one-time settlement of $2.6 million was received.
Water Utility Expenses
Total operating expenses increased by $6.7 million in fiscal year 2015 compared to fiscal year 2014. The main operating expense increases are professional services and utilities $1.3 million, tax adjustments $2.0 million and depreciation $3.4 million.
Environmental Services Revenues
Total operating revenues increased slightly over fiscal year 2015 and continue to support operations.
Environmental Services Expenses
Total expenses decreased $15.5 million, primarily due to fiscal year 2014 recording a one-time $12.2 million liability catch up for remediation activities at the Silverbell Landfill. The Los Reales Cell Three capital asset became fully depreciated during fiscal year 2014; this resulted in $1.6 million lower depreciation expense in fiscal year 2015 .
FINANCIAL ANALYSIS OF THE CITY’S FUNDS
The City has two major governmental funds: the General Fund and the Mass Transit Fund. The General Fund fund balance decreased by $1.1 million during fiscal year 2015 and the Mass Transit Fund fund balance increased $1.4 million. The General Fund $2.2 million decrease to the assigned fund balance is to meet potential revenue shortfalls projected in FY 2016. The committed fund balance increase of $1.2 million is attributed to slight increases in restricted funds for Court's case processing fees and restricted annexation reserve. The increased fund balance in the Mass Transit Fund is due to an increase in non-spendable prepayments.
General Fund Revenues
• Total General Fund revenues increased $14.9 million, or 3.3%. Tax revenues, which represent 51.9% of total revenues, increased $5.1 million. The City’s business privilege tax (sales tax) increased $1.6 million and use tax increased $2.1 million.
• Other agency revenues, which include state shared and other intergovernmental agreement revenues, increased $8.2 million. The state revenue-sharing revenues, which represent 28.1% of general fund
12

CITY OF TUCSON, ARIZONAMANAGEMENT’S DISCUSSION AND ANALYSIS
For the Year Ended June 30, 2015
revenues, increased $7.2 million. This increase is mainly due to higher state income tax revenue collected by Arizona, which is shared with local governments.
• Charges for Service revenues represent 8.2% of total revenues and increased $2.3 million from last fiscal year. This increase is made from small increases across multiple service categories. A few of the larger revenue increases are in paramedic ambulance revenues, $0.5 million; zoo admissions, $0.5 million; planning and review fees, $0.5 million.
General Fund Expenditures
• General Fund expenditures increased by $24.4 million from fiscal year 2014, or 6.1%.
• Police expenditures increased $4.0 million related to wages, benefits and pension contribution increases.
• Fire expenditures increased $2.7 million. The majority is related to wages, benefits and pension contribution increases of $1.4 million. Minor additional expenditures are in ambulance supplies and fleet repairs.
• Capital expenditures increased $4.3 million due to replacement vehicles of $2.5 million, election equipment of $1.3 million and system upgrades of $1.0 million.
Mass Transit Fund Revenues
• Total revenues increased by $7.9 million. The majority of the increase is attributed to additional federal grant and contributions revenue to purchase replacement buses.
Mass Transit Fund Expenditures
• Total expenditures increased $10.1 million. Capital outlay and capital projects, which are primarily federally funded, accounted for the increase. The majority of this increase is for purchase of replacement buses, transit center facility and security upgrades and additional para-transit routes.
General Fund Budgetary Highlights
The annual budget is the legally adopted expenditure control document of the City. The budgetary comparison schedule for the General Fund shows the original budget (adopted), the final budget (revised), and actual revenues and expenditures for the fiscal year.
• Tax revenue is $5.4 million below the final budget. Projections were based on an increase of 3% over fiscal year 2014 projected revenues.
• Licenses and Permits revenue is $1.3 million over the final budget. Planning and review fees increased more than expected.
• Increased issuance of citations and tax intercepts led to Fines and Forfeitures revenue to exceed the final budget by $1.3 million.
• Charges for Services revenue is $1.5 million above final budget due to increased Zoo attendance, purchase card rebates and paramedic services.
• Salary and benefit savings across all departments resulted in expenditure savings of $6.3 million.
13

CITY OF TUCSON, ARIZONAMANAGEMENT’S DISCUSSION AND ANALYSIS
For the Year Ended June 30, 2015
CAPITAL ASSET AND DEBT ADMINISTRATION
Capital Assets
Figure 5 provides details of the City’s capital assets as of June 30, 2015 and June 30, 2014:
Capital Assets ( Net of Depreciation) Figure 5Governmental Activities Business-type Activities Total
2015 2014 2015 2014 2015 2014Land $ 745,031,654 $ 731,192,594 $ 70,633,929 $ 70,534,092 $ 815,665,583 $ 801,726,686
Buildings and Improvements 397,913,109 373,611,408 106,868,359 101,822,120 504,781,468 475,433,528
Equipment 85,694,271 82,325,046 26,510,525 23,132,679 112,204,796 105,457,725
Infrastructure/Distribution and
Collections Systems 354,191,644 379,041,294 972,952,655 943,188,704 1,327,144,299 1,322,229,998
Construction in Progress 512,519,548 519,378,915 132,181,310 155,897,367 644,700,858 675,276,282
Water Rights 52,126,968 52,126,968 52,126,968 52,126,968
Total $ 2,095,350,226 $ 2,085,549,257 $ 1,361,273,746 $ 1,346,701,930 $ 3,456,623,972 $ 3,432,251,187
Additional information regarding capital assets can be found in Note 6.
Governmental Activities
Capital assets in the Governmental Activities represent 60.6% of the City’s capital assets. Total assets increased by $9.8 million.
• Land represents 35.6% of capital assets and had a net increase of $13.8 million from fiscal year 2014. This increase is due to routine acquisition of easements for $8.6 million combined with land sales of $5.0 million.
• Building and improvements represent 19.0% of capital assets and had a net increase of $24.3 million from fiscal year 2014. The increase includes $19.3 million of improvements related to Parks and Recreation locations and $9.7 million of solar panels.
Business-type Activities
Business-type activities assets represent 39.4% of the City’s capital assets. Business-type activities had a net increase of $14.6 million in capital assets during the fiscal year.
• Construction in Progress represents 9.7% of capital assets, which decreased by a net of $23.7 million. This decrease represents the difference of capital assets that are not fully completed and completed assets that have been added to other asset groups such as Infrastructure.
• Infrastructure represents 71.5% of capital assets. The Distribution and Collection System, which is included in these assets and recorded primarily in the Water Utility Fund, increased by $29.8 million.
Long-term Debt and Liabilities
Figure 6 illustrates the City’s debt as of June 30, 2015 and June 30, 2014. Additional information regarding long-term debt can be found in Note 7.
14
CITY OF TUCSON, ARIZONAMANAGEMENT’S DISCUSSION AND ANALYSIS
For the Year Ended June 30, 2015
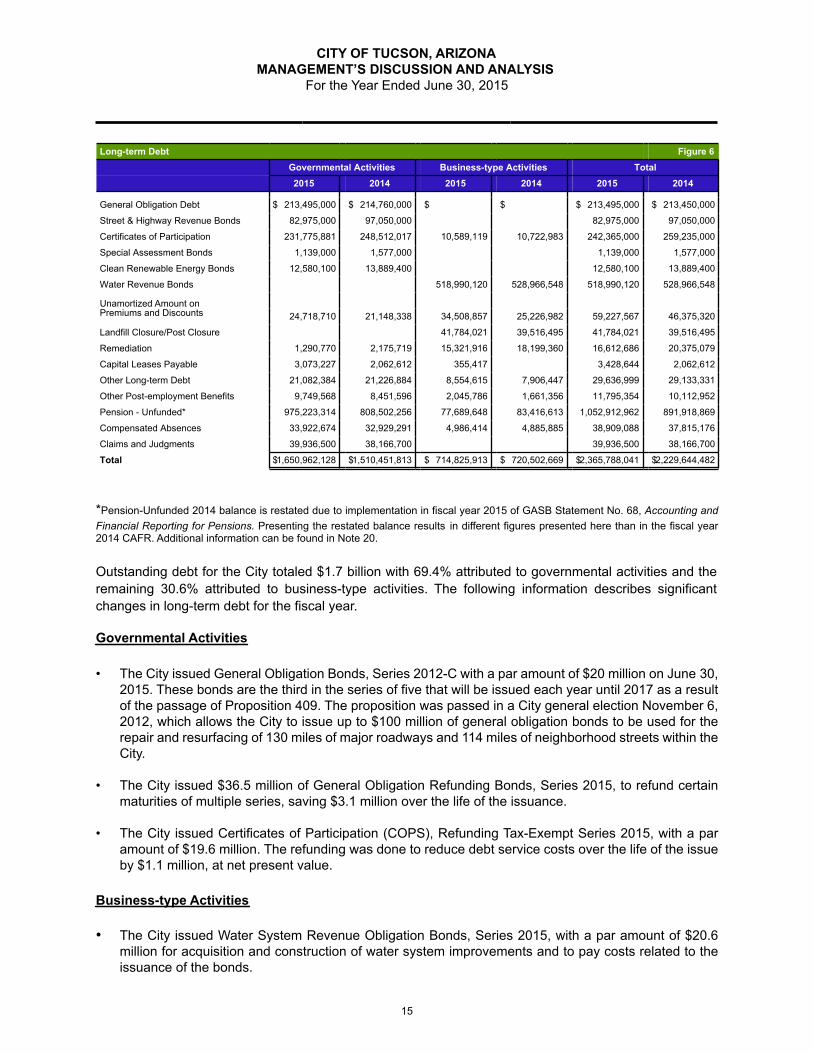
Long-term Debt Figure 6Governmental Activities Business-type Activities Total2015 2014 2015 2014 2015 2014
General Obligation Debt $ 213,495,000 $ 214,760,000 $ $ $ 213,495,000 $ 213,450,000
Street & Highway Revenue Bonds 82,975,000 97,050,000 82,975,000 97,050,000
Certificates of Participation 231,775,881 248,512,017 10,589,119 10,722,983 242,365,000 259,235,000
Special Assessment Bonds 1,139,000 1,577,000 1,139,000 1,577,000
Clean Renewable Energy Bonds 12,580,100 13,889,400 12,580,100 13,889,400
Water Revenue Bonds 518,990,120 528,966,548 518,990,120 528,966,548
Unamortized Amount onPremiums and Discounts 24,718,710 21,148,338 34,508,857 25,226,982 59,227,567 46,375,320
Landfill Closure/Post Closure 41,784,021 39,516,495 41,784,021 39,516,495
Remediation 1,290,770 2,175,719 15,321,916 18,199,360 16,612,686 20,375,079
Capital Leases Payable 3,073,227 2,062,612 355,417 3,428,644 2,062,612
Other Long-term Debt 21,082,384 21,226,884 8,554,615 7,906,447 29,636,999 29,133,331
Other Post-employment Benefits 9,749,568 8,451,596 2,045,786 1,661,356 11,795,354 10,112,952
Pension - Unfunded* 975,223,314 808,502,256 77,689,648 83,416,613 1,052,912,962 891,918,869
Compensated Absences 33,922,674 32,929,291 4,986,414 4,885,885 38,909,088 37,815,176
Claims and Judgments 39,936,500 38,166,700 39,936,500 38,166,700
Total $1,650,962,128 $1,510,451,813 $ 714,825,913 $ 720,502,669 $2,365,788,041 $2,229,644,482
*Pension-Unfunded 2014 balance is restated due to implementation in fiscal year 2015 of GASB Statement No. 68, Accounting and Financial Reporting for Pensions. Presenting the restated balance results in different figures presented here than in the fiscal year 2014 CAFR. Additional information can be found in Note 20.
Outstanding debt for the City totaled $1.7 billion with 69.4% attributed to governmental activities and the remaining 30.6% attributed to business-type activities. The following information describes significant changes in long-term debt for the fiscal year.
Governmental Activities
• The City issued General Obligation Bonds, Series 2012-C with a par amount of $20 million on June 30, 2015. These bonds are the third in the series of five that will be issued each year until 2017 as a result of the passage of Proposition 409. The proposition was passed in a City general election November 6, 2012, which allows the City to issue up to $100 million of general obligation bonds to be used for the repair and resurfacing of 130 miles of major roadways and 114 miles of neighborhood streets within the City.
• The City issued $36.5 million of General Obligation Refunding Bonds, Series 2015, to refund certain maturities of multiple series, saving $3.1 million over the life of the issuance.
• The City issued Certificates of Participation (COPS), Refunding Tax-Exempt Series 2015, with a par amount of $19.6 million. The refunding was done to reduce debt service costs over the life of the issue by $1.1 million, at net present value.
Business-type Activities
• The City issued Water System Revenue Obligation Bonds, Series 2015, with a par amount of $20.6 million for acquisition and construction of water system improvements and to pay costs related to the issuance of the bonds.
15
CITY OF TUCSON, ARIZONAMANAGEMENT’S DISCUSSION AND ANALYSIS
For the Year Ended June 30, 2015
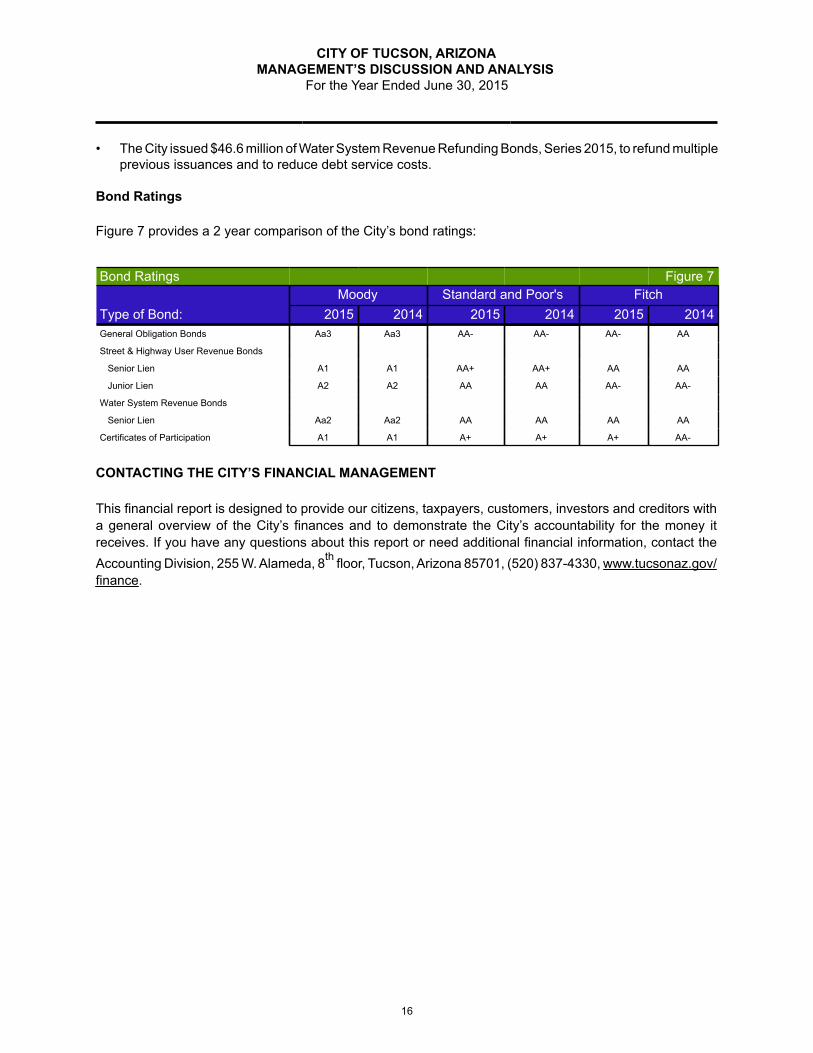
• The City issued $46.6 million of Water System Revenue Refunding Bonds, Series 2015, to refund multiple previous issuances and to reduce debt service costs.
Bond Ratings
Figure 7 provides a 2 year comparison of the City’s bond ratings:
Bond Ratings Figure 7Moody Standard and Poor's Fitch
Type of Bond: 2015 2014 2015 2014 2015 2014General Obligation Bonds Aa3 Aa3 AA- AA- AA- AA
Street & Highway User Revenue Bonds
Senior Lien A1 A1 AA+ AA+ AA AA
Junior Lien A2 A2 AA AA AA- AA-
Water System Revenue Bonds
Senior Lien Aa2 Aa2 AA AA AA AA
Certificates of Participation A1 A1 A+ A+ A+ AA-
CONTACTING THE CITY’S FINANCIAL MANAGEMENT
This financial report is designed to provide our citizens, taxpayers, customers, investors and creditors with a general overview of the City’s finances and to demonstrate the City’s accountability for the money it receives. If you have any questions about this report or need additional financial information, contact the Accounting Division, 255 W. Alameda, 8th floor, Tucson, Arizona 85701, (520) 837-4330, www.tucsonaz.gov/finance.
16

CITY OF TUCSON, ARIZONA
Basic Financial State
me
nts
BASIC FINANCIALSTATEMENTS

CITY OF TUCSON, ARIZONASTATEMENT OF NET POSITION
JUNE 30 2015Governmental Business-type
TotalActivities ActivitiesASSETSCurrent assets:
Cash and Cash Equivalents $ 104,734,267 $ 69,867,365 $ 174,601,632Cash & Investments - Restricted 36,045,695 36,045,695Cash & Investments with Fiscal Agent - Restricted 57,693,537 35,345,628 93,039,165Taxes Receivable, Net 17,985,457 17,985,457Accounts Receivable, Net 19,644,818 26,623,863 46,268,681Special Assessments Receivable 613,027 613,027Internal Balances (5,127,886) 5,127,886Due from Other Agencies 68,352,635 592,954 68,945,589Interest Receivable 6,224,936 184,619 6,409,555Inventories 3,980,418 4,439,403 8,419,821Other Assets 3,758,129 2,541,530 6,299,659
Total current assets 277,859,338 180,768,943 458,628,281Noncurrent assets:
Long Term Accounts Receivable 24,602,337 208,172 24,810,509Long Term Notes Receivable 36,831,313 71,590,530 108,421,843Long Term Investments 12,398,941 12,398,941Other Assets - Restricted 31,244,637 252,471 31,497,108Land & Construction in Progress 1,257,551,202 202,815,239 1,460,366,441Other Capital Assets, Net 837,799,024 1,106,331,539 1,944,130,563Water Rights 52,126,968 52,126,968
Total noncurrent assets 2,200,427,454 1,433,324,919 3,633,752,373Total assets 2,478,286,792 1,614,093,862 4,092,380,654
DEFERRED OUTFLOWSLoss on Refunding of Debt 13,657,475 17,092,599 30,750,074Pension Plans 160,494,589 4,760,734 165,255,323
Total deferred outflows 174,152,064 21,853,333 196,005,397LIABILITIESCurrent liabilities:
Accounts Payable 41,160,166 6,254,657 47,414,823Accrued Payroll Liabilities 14,966,344 2,517,481 17,483,825Accrued Interest Payable 24,218 1,495 25,713Due to Other Agencies 1,865,464 4,650,102 6,515,566Refundable Deposits 5,467,636 1,623,017 7,090,653Customer Advances 77,199 77,199Liabilities Payable from Restricted Assets 40,273,443 38,388,088 78,661,531Current Portion of Long Term Liabilities 82,819,135 36,006,917 118,826,052
Total current liabilities 186,576,406 89,518,956 276,095,362Noncurrent liabilities:
Long Term Liabilities 1,568,142,993 678,818,996 2,246,961,989Total non-current liabilities 1,568,142,993 678,818,996 2,246,961,989
Total liabilities 1,754,719,399 768,337,952 2,523,057,351DEFERRED INFLOWS
Advance Federal Project Grants 34,565 34,565Deferred Revenue 1,355,390 71,691,773 73,047,163Pension Plans 42,855,035 8,222,764 51,077,799
Total deferred inflows 44,244,990 79,914,537 124,159,527NET POSITIONNet Investment in Capital Assets 1,539,250,781 825,087,980 2,364,338,761Restricted for:
Debt Service 4,230,490 35,345,628 39,576,118Capital 67,387,652 67,387,652Self-Insurance Mandates 31,244,637 31,244,637Transportation 11,434,839 11,434,839Grants and Entitlements 27,499,060 4,255,384 31,754,444Other Purposes 5,492,935 5,492,935
Unrestricted (833,065,927) (76,994,286) (910,060,213)Total net position $ 853,474,467 $ 787,694,706 $ 1,641,169,173
The notes to the basic financial statements are an integral part of this statement.17
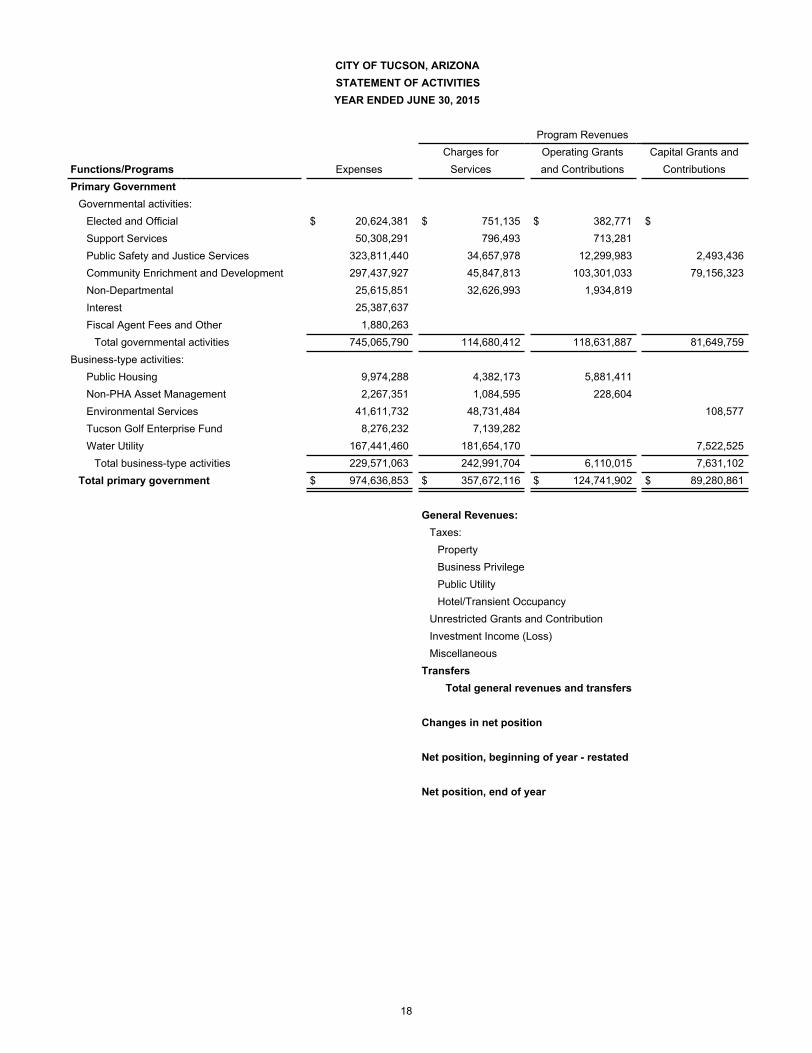
CITY OF TUCSON, ARIZONASTATEMENT OF ACTIVITIESYEAR ENDED JUNE 30, 2015
Program RevenuesCharges for Operating Grants Capital Grants and
Functions/Programs Expenses Services and Contributions ContributionsPrimary Government
Governmental activities:Elected and Official $ 20,624,381 $ 751,135 $ 382,771 $Support Services 50,308,291 796,493 713,281Public Safety and Justice Services 323,811,440 34,657,978 12,299,983 2,493,436Community Enrichment and Development 297,437,927 45,847,813 103,301,033 79,156,323Non-Departmental 25,615,851 32,626,993 1,934,819Interest 25,387,637Fiscal Agent Fees and Other 1,880,263
Total governmental activities 745,065,790 114,680,412 118,631,887 81,649,759Business-type activities:
Public Housing 9,974,288 4,382,173 5,881,411Non-PHA Asset Management 2,267,351 1,084,595 228,604Environmental Services 41,611,732 48,731,484 108,577Tucson Golf Enterprise Fund 8,276,232 7,139,282Water Utility 167,441,460 181,654,170 7,522,525
Total business-type activities 229,571,063 242,991,704 6,110,015 7,631,102Total primary government $ 974,636,853 $ 357,672,116 $ 124,741,902 $ 89,280,861
General Revenues:Taxes:
PropertyBusiness PrivilegePublic UtilityHotel/Transient Occupancy
Unrestricted Grants and ContributionInvestment Income (Loss)Miscellaneous
TransfersTotal general revenues and transfers
Changes in net position
Net position, beginning of year - restated
Net position, end of year
18

Net (Expense) Revenue and Changes in Net PositionGovernmental Business-type
Activities Activities Totals
$ (19,490,475) $ $ (19,490,475)(48,798,517) (48,798,517)
(274,360,043) (274,360,043)(69,132,758) (69,132,758)
8,945,961 8,945,961(25,387,637) (25,387,637)
(1,880,263) (1,880,263)
(430,103,732) (430,103,732)
289,296 289,296(954,152) (954,152)
7,228,329 7,228,329(1,136,950) (1,136,950)21,735,235 21,735,23527,161,758 27,161,758
(430,103,732) 27,161,758 (402,941,974)
44,992,133 44,992,133194,523,190 194,523,190
21,791,368 21,791,36813,397,772 13,397,772
131,349,102 131,349,102988,190 1,761,345 2,749,535
1,225,842 1,225,8421,785,611 (1,785,611)
410,053,208 (24,266) 410,028,942
(20,050,524) 27,137,492 7,086,968
873,524,991 760,557,214 1,634,082,205
$ 853,474,467 $ 787,694,706 $ 1,641,169,173
The notes to the basic financial statements are an integral part of this statement.
19

CITY OF TUCSON, ARIZONABALANCE SHEET - GOVERNMENTAL FUNDS
JUNE 30 2015
Non-Major TotalMass Transit Governmental Governmental
General Fund Fund Funds Funds
ASSETSAssets:
Cash and Cash Equivalents $ $ 259,200 $ 89,386,434 $ 89,645,634Cash & Investments with Fiscal Agents 953,936 82,315 39,949,104 40,985,355Cash & Investments with Fiscal Agents - Restricted 16,708,182 16,708,182Taxes Receivable, Net 17,985,457 17,985,457Accounts Receivable, Net 32,178,686 1,056,966 518,590 33,754,242Special Assessments Receivable 613,027 613,027Notes & Loans Receivable 1,505,145 26,771,553 28,276,698Due from Other Agencies 22,223,245 3,481,219 43,504,859 69,209,323Interfund Receivable 43,142,404 43,142,404Grants & Entitlements Receivable 6,381,313 8,916,655 15,297,968Interest Receivable 137,649 137,649Inventories 322,998 2,750,309 46,230 3,119,537Interfund Loans Receivable 8,554,615 8,554,615Long Term Investments 12,398,941 12,398,941Other Assets 228,686 3,080,899 21,778 3,331,363
Total assets $ 139,494,113 $ 17,092,221 $ 226,574,061 $ 383,160,395
LIABILITIES, DEFERRED INFLOWS AND FUND BALANCES
Liabilities:Accounts Payable $ 6,235,713 $ 6,518,344 $ 26,562,443 $ 39,316,500Accrued Payroll Liabilities 12,861,678 128,333 1,307,178 14,297,189Interfund Payable 22,929,670 3,779,301 39,363,103 66,072,074Due to Other Agencies 1,567,610 224,377 72,799 1,864,786Refundable Deposits 5,017,627 419 449,590 5,467,636Bonds & Interest Payable, including Special Assessments 38,525,691 38,525,691Advances from Grantors 1,747,752 1,747,752
Total liabilities 48,612,298 10,650,774 108,028,556 167,291,628
Deferred inflows:Advance Federal Project Grants 34,565 34,565Deferred Revenues 25,172,968 268,724 24,832,415 50,274,107
Total deferred inflows 25,172,968 268,724 24,866,980 50,308,672
Fund balances:Nonspendable 11,175,121 5,831,208 17,006,329Restricted 4,876,013 89,416,493 94,292,506Committed 29,635,059 82,315 22,639 29,740,013Assigned 4,285,870 259,200 4,239,393 8,784,463Unassigned 15,736,784 15,736,784
Total fund balances 65,708,847 6,172,723 93,678,525 165,560,095
Total liabilities, deferred inflows and fund balances $ 139,494,113 $ 17,092,221 $ 226,574,061 $ 383,160,395
The notes to the basic financial statements are an integral part of this statement.
20

CITY OF TUCSON, ARIZONAReconciliation of the Balance Sheet for
Governmental Funds to the Statement of Net PositionJune 30, 2015
Total Governmental Fund Balances (pg.20) $ 165,560,095
Capital assets used in governmental activities are not current financialresources and, therefore, are not reported in the funds. These assets consistof:
Capital Assets Net of Accumulated Depreciation 2,085,704,000Deferred Inflows not recognized in the current period and, therefore, are not reported in thegovernmental funds
Loss on Refunding of Debt 13,657,475Liabilities that are not due and payable in the current period and, therefore, are not reportedin the governmental funds. These liabilities consist of:
Bonds and Notes Payable (322,327,711)Capital Leases (234,849,108)Compensated Absences (33,922,674)OPEB Liabilities (9,749,568)Other Long-term Debt (21,082,384)
Total Long-term Liabilities (621,931,445)
Interest payable on long-term debt is not reported in governmental funds. (24,218)
Unavailable revenue is shown in the governmental statements, because it will not beavailable as a current financial resource. Since this revenue is earned, it isrecognized in the government-wide statements. 48,918,718
Internal service funds are used by management to charge the costs of fleetmaintenance, self-insurance, and facilities management. The assets andliabilities of the internal service funds are included in governmentalactivities in the Statement of Net Position. 19,173,602
Pension related items are not reported in the governmental fund financialstatements since they are not related to current financial resources. Thepension related items included in governmental activities (excludinginternal service funds) consist of:
Net Pension Liability (975,223,314)
Deferred Inflow of Rescources (42,855,035)
Deferred Outflow of Resources 160,494,589
(857,583,760)
Net Position of Governmental Activities $ 853,474,467
The notes to the basic financial statements are an integral part of this statement.
21

CITY OF TUCSON, ARIZONASTATEMENT OF REVENUES, EXPENDITURES AND CHANGES IN FUND BALANCES -
GOVERNMENTAL FUNDSYEAR ENDED JUNE 30, 2015
Non-Major TotalMass Transit Governmental Governmental
General Fund Fund Funds FundsRevenues:
Taxes $ 243,058,369 $ $ 30,148,102 $ 273,206,471Licenses and Permits 28,226,186 378,391 28,604,577Fines and Forfeitures 16,062,876 768,774 16,831,650Developer Fees 1,522,640 1,522,640Use of Money and Property 467,589 514,633 1,458,878 2,441,100Federal Grants and Contributions 5,100 22,475,522 66,655,935 89,136,557Other Agencies 136,956,086 13,320,084 90,723,606 240,999,776Charges for Services 38,532,303 13,674,426 10,439,588 62,646,317Special Assessments 323,164 323,164Contributions from Outside Sources 401,711 401,711Miscellaneous 5,077,423 563,386 2,041,476 7,682,285
Total revenues 468,385,932 50,548,051 204,862,265 723,796,248
Expenditures:Current -
Elected and Official 20,744,170 379,604 21,123,774Support Services 45,101,531 142,591 45,244,122Public Safety and Justice Services 249,939,175 11,710,927 261,650,102Community Enrichment and Development 52,282,125 75,323,604 119,532,326 247,138,055Non-Departmental 22,572,002 1,440,378 24,012,380
Capital Outlay 5,836,400 15,237,225 6,338,119 27,411,744Capital Projects 683,119 2,371,372 60,012,318 63,066,809Debt service -
Principal 14,965,385 34,778,000 49,743,385Interest 9,537,333 16,001,791 25,539,124Fiscal Agent Fees 19,650 3,975 23,625Debt Issuance Costs 486,625 710,642 1,197,267Total expenditures 422,167,515 92,932,201 251,050,671 766,150,387
Excess (deficiency) of revenues overexpenditures 46,218,417 (42,384,150) (46,188,406) (42,354,139)
Other financing sources (uses):Bond Issuance 83,950,000 83,950,000Capital Leases/Certificates of Participation 20,659,864 20,659,864Premium on Debt Issuance 2,579,091 5,708,191 8,287,282Refunded Bond Escrow Agent (21,487,330) (66,938,954) (88,426,284)Transfers In 1,600,000 43,725,841 26,299,578 71,625,419Transfers Out (50,613,653) (19,411,766) (70,025,419)
Total other financing sources (uses) (47,262,028) 43,725,841 29,607,049 26,070,862
Changes in fund balances (1,043,611) 1,341,691 (16,581,357) (16,283,277)
Fund balances, beginning of year 66,752,458 4,831,032 110,259,882 181,843,372
Fund balances, end of year $ 65,708,847 $ 6,172,723 $ 93,678,525 $ 165,560,095
The notes to the basic financial statements are an integral part of this statement.22

CITY OF TUCSON, ARIZONAReconciliation of the Statement of Revenues, Expenditures,
and Changes in Fund Balances of the Governmental Funds to theStatement of Activities
Year Ended June 30, 2015
Net Change in Fund Balances - Total Governmental Funds (pg. 22) $ (16,283,277)
Governmental funds report capital outlays as expenditures. However, in the Statement ofActivities, the cost of those assets are allocated over their estimated useful lives asdepreciation expense. This is the amount by which capital outlay exceeded depreciation inthe current period:Capital Expenditures 90,478,553Depreciation Expense (67,763,523)
22,715,030
Only gains or losses on sale of capital assets are reported in the Statement of Activities,whereas total proceeds are recorded in the governmental funds. The change in netposition differs by the cost of the assets sold.Proceeds on the sale of an asset (5,002,334)Gain on the sale of an asset 1,569,387Loss on the sale of an asset (3,825,062)
(7,258,009)Net changes in the Statement of Activities that do not provide/(use) current financialresources are not reported as revenue/(expenditures) in the governmental funds. (1,869,970)
Transfer of Assets to Enterprise Funds (3,536,837)
Debt proceeds provide current financial resources to governmental funds, but issuing debtincreases long-term liabilities in the Statement of Net Position. Repayment of bondprincipal is an expenditure in the governmental funds, but the repayment reduces long-term liabilities in the Statement of Net Position. This is the amount by which proceedsexceeded repayments:Debt Proceeds (104,609,864)Repayment of Debt Principal 49,743,385
(54,866,479)Refunding of debt is an expenditure in the governmental funds. However, these
expenditures represent a reduction of a liability on the Statement of Net Position.Extinguishment of Debt 91,058,624
Accrued interest expense is not recorded in the governmental funds. The following amountrepresents the amount by which the premium on debt exceeds a discount, accrued interestexpense and the amortization of the premium:Premium on Issuance of Debt (8,287,281)Accrued Interest Expense 5,304Amortization of Premium/Discount on Debt 1,206,409
(7,075,568)Expenses in the Statement of Activities that do not use current financial resources are not
reported as expenditures in the funds.Change in Other Long-term Debt 144,500Change in Compensated Absences Liability (993,383)Change in OPEB Liability (1,297,972)Change in Pension Liability (49,081,504)
Internal service funds are used by management to charge the costs of certain activities,such as insurance and fleet services, to individual funds. A portion of the net revenue(expense) of the internal service funds is reported within governmental activities. 8,294,321
Change in Net Position of Governmental Activities $ (20,050,524)
The notes to the basic financial statements are an integral part of this statement.
23

CITY OF TUCSON, ARIZONASTATEMENT OF NET POSITION
PROPRIETARY FUNDSJUNE 30 2015
GovernmentalBusiness-type Activities Activities
Environmental Water Utility Non-Major Internal ServiceServices Fund Enterprise Funds Total Funds
ASSETSCurrent assets:
Cash and Cash Equivalents $ 9,263,754 $ 48,306,690 $ 12,296,921 $ 69,867,365 $ 15,088,633Cash & Investments - Restricted 36,045,695 36,045,695Cash & Investments with Fiscal Agent - Restricted 35,345,628 35,345,628Accounts Receivable, Net 3,138,169 23,431,202 54,492 26,623,863 127,882Interfund Receivable 22,929,670 22,929,670Due from Other Agencies 11,381 581,573 592,954 16,509Interest Receivable 63,877 100,618 20,124 184,619 281,153Inventories 4,214,997 224,406 4,439,403 860,881Other Assets 2,502,583 38,947 2,541,530 426,766
Total current assets 35,406,851 149,947,413 13,216,463 198,570,727 16,801,824
Noncurrent assets:Long Term Accounts Receivable 208,172 208,172Long Term Notes Receivable 71,590,530 71,590,530Other Assets - Restricted 252,471 252,471 31,244,637Land & Construction in Progress 19,341,519 169,874,132 13,599,588 202,815,239 668,364Other Capital Assets, Net 21,064,371 1,052,901,434 32,365,734 1,106,331,539 8,977,862Water Rights 52,126,968 52,126,968
Total noncurrent assets 40,405,890 1,275,363,177 117,555,852 1,433,324,919 40,890,863Total assets 75,812,741 1,425,310,590 130,772,315 1,631,895,646 57,692,687
DEFERRED OUTFLOWSLoss on Refunding of Debt 17,092,599 17,092,599Pension Plans 1,205,606 3,162,060 393,068 4,760,734
Total deferred outflows 1,205,606 20,254,659 393,068 21,853,333
LIABILITIESCurrent liabilities:
Accounts Payable 1,958,500 3,319,058 977,099 6,254,657 1,843,666Accrued Payroll Liabilities 613,465 1,656,406 247,610 2,517,481 669,155Accrued Interest Payable 1,495 1,495Due to Other Agencies 5,755 4,606,354 37,993 4,650,102 678Refundable Deposits 74,651 1,034,193 514,173 1,623,017Current Portion of Bonds Payable 32,420,907 32,420,907 1,319,300Current Portion of Contracts Payable 268,000 81,954 349,954Claims Payable 9,422,515Remediation Obligations 348,305Current Portion of Compensated Absences 609,062 1,760,284 116,159 2,485,505Liabilities Payable from Restricted Assets 38,388,088 38,388,088Customer Advances 77,199 77,199Current portion of Long Term Liabilities 750,551 750,551
Total current liabilities 4,279,984 83,185,290 2,053,682 89,518,956 13,603,619
Noncurrent liabilities:Bonds Payable 521,050,072 521,050,072 11,260,800Contracts Payable 10,349,118 273,463 10,622,581Interfund Loans Payable 8,554,615 8,554,615Claims Payable 30,513,985Remediation Obligations 942,465Compensated Absences 663,493 1,734,448 102,967 2,500,908Pension Liability 19,674,093 51,601,140 6,414,415 77,689,648Other Post-employment Benefits 598,024 1,447,762 2,045,786Long Term Liabilities 56,355,386 56,355,386
Total non-current liabilities 87,640,114 575,833,422 15,345,460 678,818,996 42,717,250Total liabilities 91,920,098 659,018,712 17,399,142 768,337,952 56,320,869
24

CITY OF TUCSON, ARIZONASTATEMENT OF NET POSITION (continued)
PROPRIETARY FUNDSJune 30, 2015
DEFERRED INFLOWSDeferred revenue 90,766 71,601,007 71,691,773Pension Plans 2,082,329 5,461,526 678,909 8,222,764
Total deferred inflows 2,082,329 5,552,292 72,279,916 79,914,537
NET POSITIONNet Investment in Capital Assets 29,788,772 749,689,303 45,609,905 825,087,980 (2,933,875)Restricted for Debt Service 35,345,628 35,345,628Restricted for Self Insurance Mandates 31,244,637Restricted for Grants and Entitlements 4,255,384 4,255,384Unrestricted (46,772,852) (4,040,686) (8,378,964) (59,192,502) (26,938,944)
Total net position $ (16,984,080) $ 780,994,245 $ 41,486,325 $ 805,496,490 $ 1,371,818
Reconciliation to Government-Wide Statement of Net PositionAdjustment to consolidate internal service activities (15,839,003) (1,623,347) (339,434) (17,801,784)Total Net Position - Business Type $ (32,823,083) $ 779,370,898 $ 41,146,891 $ 787,694,706
The notes to the basic financial statements are an integral part of this statement.
25

CITY OF TUCSON, ARIZONA
STATEMENT OF REVENUES, EXPENSES, AND CHANGES IN NET POSITION
PROPRIETARY FUNDS
FOR THE YEAR ENDED JUNE 30, 2015
Business-type ActivitiesGovernmental
ActivitiesEnvironmental Water Utility Non-Major Internal Service
Services Fund Enterprise Funds Total FundsOperating revenues:
Charges for Services $ 47,936,869 $ 175,426,614 $ 12,002,642 $ 235,366,125 $ 60,137,237
Federal Grants and Contributions 6,110,015 6,110,015
Miscellaneous 794,615 6,227,556 603,408 7,625,579 368,481
Total operating revenues 48,731,484 181,654,170 18,716,065 249,101,719 60,505,718
Operating expenses:Salaries, Wages and Benefits 15,006,999 30,922,125 5,504,774 51,433,898 15,666,049
Contractual Services 17,671,960 65,207,482 10,285,580 93,165,022 15,881,268
Commodities 4,284,730 8,243,561 2,104,245 14,632,536 14,299,461
Cost of Goods Sold 597,432 597,432
Benefits and Claims 10,126,137
Depreciation 3,706,588 35,205,332 1,937,189 40,849,109 1,768,496
Total operating expenses 40,670,277 139,578,500 20,429,220 200,677,997 57,741,411
Operating income (loss) 8,061,207 42,075,670 (1,713,155) 48,423,722 2,764,307
Nonoperating revenues (expenses): Property Taxes 1,430,708
Other Agencies 310,729
Investment Income 278,597 893,175 128,408 1,300,180 93,800
Gain (loss) on Sale of Property/Equipment 358,000 (230,052) 333,217 461,165 268,750
Federal Grants and Contributions 108,577 108,577
Non-Grant Contributions 734,619 734,619
Interest Expense (481,451) (18,967,617) (79,757) (19,528,825) (513,188)
Debt Issuance Costs 9,864 (1,458,631) (1,448,767)
Other Non-operating Income (Expense) (7,698,707) (7,698,707)
Total nonoperating revenues (expenses) 273,587 (26,727,213) 381,868 (26,071,758) 1,590,799
Income (loss) before capital contributions andtransfers 8,334,794 15,348,457 (1,331,287) 22,351,964 4,355,106
Capital Contributions 6,787,906 (185,611) 6,602,295 3,722,448
Transfers In 80,000 80,000
Transfers Out (1,600,000) (80,000) (1,680,000)
Changes in net position 8,334,794 20,536,363 (1,516,898) 27,354,259 8,077,554
Total net position, beginning of year- restated (25,318,874) 760,457,882 43,003,223 778,142,231 (6,705,736)
Total net position, end of year $ (16,984,080) $ 780,994,245 $ 41,486,325 $ 805,496,490 $ 1,371,818
Reconciliation to government-wide Statement of Activities
Changes in net position 8,334,794 20,536,363 (1,516,898) 27,354,259
Adjustment to consolidate internal service activities (469,868) 261,995 (8,894) (216,767)
Changes in net position - Business-type activities $ 7,864,926 $ 20,798,358 $ (1,525,792) $ 27,137,492
The notes to the basic financial statements are an integral part of this statement.
26

CITY OF TUCSON, ARIZONASTATEMENT OF CASH FLOWS
PROPRIETARY FUNDSFOR THE YEAR ENDED JUNE 30, 2015
Business-type ActivitiesGovernmental
Activities
Non-Major
Environmental Water Utility Enterprise Internal Service
Services Fund Funds Total Funds
Cash Flows from Operating Activities:Cash Received from Customers $ 47,813,581 $ 182,031,611 $ 12,931,367 $ 242,776,559 $ 60,263,128
Cash Payments to Suppliers for Goods and Services (21,558,460) (72,769,334) (12,964,973) (107,292,767) (30,729,415)
Cash Payments to Employees for Services (15,053,978) (33,406,625) (5,119,582) (53,580,185) (15,708,619)
Subsidy from Federal Grant 6,011,202 6,011,202
Other Operating Revenues 794,615 1,202 795,817 238,714
Cash Payments to Claimants (8,356,337)
Net Cash Provided (Used) by Operating Activities 11,995,758 75,855,652 859,216 88,710,626 5,707,471
Cash Flows from Noncapital Financing ActivitiesProperty Taxes 1,297,995
Interfund Transfers (22,929,671) (1,600,000) (24,529,671)
Advances from Other Funds 648,168 648,168
Subsidy from Federal Grant 104,984 734,619 839,603 310,729
Interest Paid on Advances (5,616) (5,616)
Net Cash Provided (Used)by Noncapital Financing Activities (22,824,687) (865,381) 642,552 (23,047,516) 1,608,724
Cash Flows from Capital and Related Financing Activities
Proceeds from Leasing Activities 423,050 423,050
Bond Issuance 11,516,131 11,516,131
Premium on Bonds 12,368,357 12,368,357
Acquisition and Construction of Capital Assets (12,287,613) (41,270,589) (436,516) (53,994,718) (69,755)
Principal Paid on Capital Debt (26,636,001) (67,633) (26,703,634) (1,309,300)
Interest Paid on Capital Debt (607,605) (20,983,770) (75,894) (21,667,269) (513,188)
Fiscal Agent Fees Paid on Capital Debt (1,458,633) (1,458,633)
Capital Contributions-System Equity fee 2,342,320 2,342,320
Proceeds from Sale of Assets/Equipment (321,589) (230,052) 381,580 (170,061) 280,190
Net Cash Provided (Used) by Capital and Related Financing Activities (13,216,807) (64,352,237) 224,587 (77,344,457) (1,612,053)
Cash Flows from Investing Activities:Interest on Investments 282,806 881,099 128,888 1,292,793 201,886
Proceeds from Sale of Investments 33,941,230
Purchase of Investments (31,467,899)
Net Cash Provided (Used) byInvesting Activities 282,806 881,099 128,888 1,292,793 2,675,217
Net Increase (Decrease) inCash and Cash Equivalents (23,762,930) 11,519,133 1,855,243 (10,388,554) 8,379,359
Cash and Cash Equivalents - July 1 33,026,684 108,178,880 10,441,678 151,647,242 6,709,274
Cash and Cash Equivalents - June 30 $ 9,263,754 $ 119,698,013 $ 12,296,921 $ 141,258,688 $ 15,088,633
27

CITY OF TUCSON, ARIZONASTATEMENT OF CASH FLOWS
PROPRIETARY FUNDSFOR THE YEAR ENDED JUNE 30, 2015
Business-type ActivitiesGovernmental
Activities
Non-Major
Environmental Water Utility Enterprise Internal Service
Services Fund Funds Total Funds
Reconciliation of Operating Income to Net CashProvided (Used) by Operating Activities:Operating Income (Loss) $ 8,061,207 $ 42,075,670 $ (1,713,155) $ 48,423,722 $ 2,764,307
Adjustments to Reconcile Operating Income to Net CashProvided (Used) by Operating Activities:
Depreciation and Amortization 3,706,588 35,205,332 1,937,189 40,849,109 1,768,496
Provision for Landfill Closure (609,916) (609,916)
Other Adjustments:
Decrease (Increase) in Assets / Deferred Outflows:
Accounts Receivable (133,782) 1,539,594 10,066 1,415,878 (3,709)
Pension Plans (1,205,606) (3,162,060) (393,068) (4,760,734)
Inventory and Prepaids (154,595) (106,626) (261,221) 434,990
Due from Other Agencies (98,813) (98,813) (167)
Other Assets (2,088,951) (2,088,951)
Increase (Decrease) in Liabilities / Deferred Inflows:
Accounts Payable 1,003,511 21,463 120,602 1,145,576 (99,404)
Accrued Payroll Liabilities (44,251) (98,401) 34,113 (108,539) (42,570)
Accrued Compensated Absences 20,039 59,914 20,575 100,528
Pension Plans 2,082,329 5,461,526 678,909 8,222,764
Pension Liability (1,019,779) (5,009,621) 302,435 (5,726,965)
Accrued Other Post-Employment Benefits 120,289 264,142 384,431
Deferred Revenue 60,015 60,015
Customer/Refundable Deposits 10,493 (1,162,153) 2,600 (1,149,060)
Claims and Judgments Payable 1,769,800
Remediation Obligation (884,950)
Due to Other Agencies 4,636 2,903,792 8,050 2,916,478 678
Other Operating Liabilities (3,676) (3,676)
Net Cash Provided (Used) by OperatingActivities $ 11,995,758 $ 75,855,652 $ 859,216 $ 88,710,626 $ 5,707,471
Noncash Investing, Capital, and Financing Activities:Contributions of capital assets $ $ 4,445,586 $ $ 4,445,586 $ 3,736,252
Refunding Bonds 255,136 255,136
Defeased Bonds (265,000) (265,000)
Total Noncash Investing, Capital, and FinancingActivities: $ (9,864) $ 4,445,586 $ $ 4,435,722 $ 3,736,252
The notes to the basic financial statements are an integral part of this statement.
28

CITY OF TUCSON, ARIZONASTATEMENT OF FIDUCIARY NET POSITION
JUNE 30 2015
Pension Trust AgencyASSETSCash and Cash Equivalents $ 2,567,105 $ 1,859,195Accounts Receivable, Net 11,788,284Employer Contributions Receivable 1,281,772Employee Contributions Receivable 255,796Interest & Dividends Receivable 1,707,713Due from Brokers 946,994Short Term Investments 8,958,665Securities Lending Cash Collateral 19,876,248U.S. Treasuries, Agencies & Other Governmental Bonds 62,887,490Bonds and Preferred Stock 55,247,455U.S. Equity 372,249,062International Bonds & Other Fixed Income Instrument 39,885,129International Equity & Comingled Equity Funds 97,369,073Real Estate & Comingled Real Estate Funds 58,761,226Infrastructure Investment Funds 40,220,260
Total assets 762,213,988 13,647,479
LIABILITIESAccounts Payable 384,773 767,567Accrued Payroll Liabilities 15,459Due to Other Agencies 12,879,912Due to Securities Borrowers 19,876,248Due to Brokers 2,143,655Refundable Deposits 306
Total liabilities 22,420,441 13,647,479
NET POSITIONHeld in trust $ 739,793,547 $
The notes to the basic financial statements are an integral part of this statement.
29

CITY OF TUCSON, ARIZONASTATEMENT OF CHANGES IN FIDUCIARY NET POSITION
FIDUCIARY FUNDYEAR ENDED JUNE 30, 2015
Pension TrustAdditions:
Employer Contributions $ 33,985,523Employee Contributions 7,531,845Net Increase (Decrease) in Fair Value of investment 22,467,139Interest, Dividends and Other Income 12,309,498Securities Lending Income 163,140Less: Investment Activity Expense (4,092,449)Less: Securities Lending Expense (65,676)Miscellaneous Additions 20,783
Total additions 72,319,803
Deductions:Payments to Participants 65,216,458Refunds and Transfers to Other Plans 2,395,893Administrative Expense 650,405
Total deductions 68,262,756
Changes in net position 4,057,047
Net position, beginning of year 735,736,500
Net position, end of year $ 739,793,547
The notes to the basic financial statements are an integral part of this statement.
30

CITY OF TUCSON, ARIZONA NOTES TO BASIC FINANCIAL STATEMENTS
For the Year Ended June 30, 2015
Note 1 - SUMMARY OF SIGNIFICANT ACCOUNTING POLICIES The accounting and reporting framework and the significant accounting principles and practices of the City of Tucson (City) are discussed in subsequent sections of this note. The accounting policies of the City conform to accounting principles generally accepted in the United States of America as applicable to governments. The following is a summary of the significant policies: A. Reporting Entity The accompanying financial statements include the City and all of its component units, collectively referred to as
“the financial reporting entity”. The component unit discussed below has been included in the City’s reporting entity because of the significance of its operational or financial relationship with the City.
Tucson Supplemental Retirement System The Tucson Supplemental Retirement System (TSRS or System) is a single-employer defined benefit plan
established by the City and administered by a seven-member Board of Trustees. Although the system is a separate legal entity, its sole purpose is to provide services exclusively to the City; therefore, it is included as a Pension Trust Fund in these basic financial statements. Separately issued financial statements are prepared and may be requested by contacting the City of Tucson, Finance Department, PO Box 27450, Tucson, AZ 85726.
B. Government-wide and Fund Financial Statements The government-wide financial statements (i.e., Statement of Net Position and Statement of Activities) report
information on all nonfiduciary activities of the primary government. Governmental activities, which are normally supported by taxes and intergovernmental revenues, include all governmental funds, along with internal service funds. Business-type activities, which rely to a significant extent on fees and charges for services, include the enterprise funds and are reported separately from the governmental activities.
The Statement of Net Position reports the assets, deferred outflows, deferred inflows, and liabilities of the
primary government. The net position section of this statement represents the residual amount of assets plus deferred outflows less their associated liabilities and deferred inflows. The net position section is divided into three categories. The first category is Net Investment in Capital Assets, which includes capital assets, deferred outflows, inflows attributable to the acquisition, construction, or improvement of capitals, net of accumulated depreciation, and any outstanding debt associated with the capital assets. Capital assets cannot readily be sold and converted into cash. The second category is Restricted Net Position, which includes those assets, net of their related debt, that have a constraint placed on their use. The constraints are either: 1) externally imposed by creditors, such as through debt covenants, grantors, contributors, or laws and regulations of other governments, or 2) imposed by law through constitutional provisions or enabling legislation. The final section is Unrestricted Net Position, and this represents resources that generally can be used for any purpose. However, they are not necessarily in a spendable form, such as cash.
The Statement of Activities shows the degree to which direct expenses of various City functions are offset by
program revenues. Direct expenses are those that are clearly identifiable with a specific function or segment. Program revenues include: 1) charges for services, fines and forfeitures, and licenses and fees, and 2) grants and contributions that are restricted to meeting the operational or capital requirements of a particular function or segment. Taxes and other items, which are not specifically identifiable with a particular function or segment, are reported as general revenues at the bottom of the statement. The general revenues support the net costs of the functions and segments not covered by program revenues.
Separate financial statements are provided for the governmental funds, proprietary funds, and fiduciary funds
even though the latter are excluded from the government-wide financial statements. In general, major individual funds are reported as separate columns in the fund financial statements, while non-major funds are displayed in aggregate.
31

CITY OF TUCSON, ARIZONA NOTES TO BASIC FINANCIAL STATEMENTS
For the Year Ended June 30, 2015
Note 1 - SUMMARY OF SIGNIFICANT ACCOUNTING POLICIES (Continued) C. Basis of Presentation The accounts of the City are organized on the basis of funds, each of which is considered a separate accounting
entity. The City accounts for the operations of each fund through a separate set of self-balancing accounts that comprise its assets, deferred outflows, liabilities, deferred inflows, and fund balance/net position, revenues, and expenditures or expenses, as appropriate. Government resources are allocated to and accounted for in individual funds based upon the purposes for which they are to be spent and the means by which spending activities are controlled. 1. Governmental Funds Major Funds: General Fund - This fund is the main operating fund of the City that is used to account for and report all
financial resources not accounted for and reported in another fund. Mass Transit Fund - This fund is used to account for and report all the revenues and other financial
resources necessary to operate fixed route and paratransit services within the Tucson metropolitan area. The main sources of revenue are Charge for Services from customers and Other Agencies, such as other cities and Pima County, federal grants and contributions, and an investment from the General Fund for fiscal year 2015 of $43,725,841.
Non-major Funds: Special Revenue Funds - These funds are used to account for and report the proceeds of specific revenue
sources (other than proprietary and fiduciary functions) that are restricted to expenditures for specified purposes other than debt service and capital projects. Resources must be derived from one or more specific revenue sources. This includes federal grants and various City functions such as Tucson Convention Center, Highway User Revenue, Streetcar Operating, and Housing and Community Development Funds.
Debt Service Funds - These funds are used to account for and report the accumulation of resources that are
restricted, committed, or assigned for the payment of long-term debt principal, interest, and other related costs for General Obligation, Street and Highway, and Special Assessment Bonds.
Capital Project Funds - These funds are used to account for and report financial resources that are
restricted, committed, or assigned to be used for the acquisition or construction of major capital facilities and other capital assets. This includes the General Obligation, Capital Improvement, Development Fee, and the Regional Transportation Authority Fee Funds.
2. Enterprise Funds The City has five enterprise funds which are used to account for certain operations that provide services to
the general public for a fee. Enterprise funds are required for any activity whose principal revenue sources meet any of the following criteria: 1) any activity that has issued debt backed solely by the fees and charges of the activity; 2) if the cost of providing services for an activity, including capital costs such as depreciation or debt service, must legally be recovered through fees and charges; or 3) it is the policy of the City to establish activity fees or charges to recover the cost of providing services, including capital costs.
32

CITY OF TUCSON, ARIZONA NOTES TO BASIC FINANCIAL STATEMENTS
For the Year Ended June 30, 2015
Note 1 - SUMMARY OF SIGNIFICANT ACCOUNTING POLICIES (Continued) Major Funds:
The Water Utility Fund accounts for the financing and operation of all activities necessary to provide water
services to the Tucson metropolitan area. Since the Water Utility is a segment accounted for within an individual fund, no further segment information is presented in these notes.
The Environmental Services Fund accounts for the financing and operation of all activities necessary to
provide solid waste services to residential and commercial customers in the City of Tucson. Since the Environmental Services Fund is a segment accounted for within an individual fund, no further segment information is presented in these notes.
Non-major Funds: The Non-Public Housing Authority (Non-PHA) Asset Management Fund accounts for all operating activities
necessary to support non-public housing assets. Since the Non-PHA Asset Management Fund is a segment accounted for within an individual fund, no further segment information is presented.
The Public Housing Fund accounts for the operating and capital activities necessary to support public
housing programs. Since the Public Housing Fund is a segment accounted for within an individual fund, no further segment information is presented.
The Tucson Golf Enterprise Fund accounts for the financing and operation of the City's golf courses, driving
ranges, pro shops and clubhouses. Since the Golf Fund is a segment accounted for within an individual fund, no further segment information is presented in these notes. Effective February 1, 2014, all 5 City golf courses are now managed by OB Sports, an independent contractor.
3. Internal Service Funds These funds are used to account for the financing of self-insurance and facilities and fleet maintenance
services provided to City departments on a cost-reimbursement basis. The costs of the internal service fund services are spread to the appropriate functions on the government-wide Statement of Activities, and the revenues and expenses within the internal service funds are eliminated from the government-wide financial statements to avoid any "doubling-up" effect of these revenues and expenses.
4. Fiduciary Funds These funds are used to account for assets held by the City in a trustee capacity or as an agent for
individuals, private organizations, other governments, and/or other funds. These include Pension Trust and Agency Funds. The Pension Trust Fund is accounted for in the same manner as proprietary funds. Agency Funds, which include collections for payment of medical insurance premiums, grant fiduciary and Pima County sewer collections, are custodial in nature (assets equal liabilities) and do not involve the measurement of results of operations.
D. Basis of Accounting The accounting and reporting treatment applied to a fund is determined by its measurement focus. The
government-wide financial statements are reported on the flow of economic resources measurement focus and the accrual basis of accounting, as are the proprietary and pension trust fund financial statements. Revenues are recorded when earned and expenses are recorded when a liability is incurred, regardless of the timing of the related cash flows.
33

CITY OF TUCSON, ARIZONA NOTES TO BASIC FINANCIAL STATEMENTS
For the Year Ended June 30, 2015
Note 1 - SUMMARY OF SIGNIFICANT ACCOUNTING POLICIES (Continued) Governmental fund financial statements are reported using the current financial resources measurement focus
and the modified accrual basis of accounting. Revenues are recognized as soon as they are susceptible to accrual, i.e., when they are both "measurable and available". "Measurable" means that the amount of the transaction can be determined, and "available" means collectible within the current period or soon enough thereafter to be used to pay liabilities of the current period. For this purpose, the City considers specific revenues to be available if they are collected within sixty days of the end of the current fiscal year. Expenditures generally are recorded when the related liability is incurred. However, principal and interest on long-term debt are recorded as fund liabilities when the payment is due or when amounts have been accumulated in the debt service fund for payment early in the following fiscal year. Certain compensated absences and claims and judgment expenditures are recorded when payment is due. In general, only matured assets and liabilities are shown on the balance sheets, and unassigned fund balance is considered a measure of "available spendable resources."
Major revenue sources susceptible to accrual are business privilege and other taxes and grants and similar
items when all eligibility requirements are met. Other receipts become measurable and available when cash is received by the City and are recognized as revenue at that time.
Governmental fund inventories, deposits, and long-term advances receivable do not represent "available
spendable resources" and are offset by fund balance primarily nonspendable accounts. On the proprietary fund financial statements, operating revenues are those that flow directly from the operations
of that activity, (i.e., charges to customers or users who purchase or use the goods or services of that activity). Operating expenses are those that are incurred to provide those goods or services. Non-operating revenues and expenses are items like investment income and interest expense that are not a result of the direct operations of the activity. Water connection fees for the Water Utility are established at an amount necessary to recover related costs and are recorded as capital contributions.
The City does not currently employ an indirect cost allocation system. The General Fund and certain other funds
charge service fees to other operating funds to support general services used by the operating funds (like accounting and maintenance).
E. Reserve for Loss and Loss Adjustment Expenses The Self-Insurance Fund establishes claim liabilities based on actuarial estimates of the ultimate cost of claims
(including future claim adjustment expenses) that have been reported but not settled, and of claims that have been incurred but not reported. Adjustments to claim liabilities are charged or credited to expense in the periods in which they are made.
F. Budgetary Information On June 3, 1980, the voters of the State of Arizona approved an expenditure limitation that is applicable to all
local governments. This limitation, based on expenditures of the 1979-80 fiscal year, restricts the growth of expenditures based on a factor of increases in population and inflation, which are adjusted annually. Under the State statutes, the City must either use the State’s expenditure limitation or follow an alternative expenditure limitation, which must be voter approved. The City is under the State approved expenditure limitation that includes three voter approved increases in the base. The voters passed an increase of $800 thousand in November 1981 and an additional $46.9 million permanent adjustment in November 1987. In November 2013, voters approved a $50 million permanent adjustment effective July 1, 2014.
34
CITY OF TUCSON, ARIZONA NOTES TO BASIC FINANCIAL STATEMENTS
For the Year Ended June 30, 2015
Note 1 - SUMMARY OF SIGNIFICANT ACCOUNTING POLICIES (Continued) The City formulates its budget to ensure compliance with the applicable provisions of this limitation. The City
uses the following procedures and policies in establishing the budgetary data reflected in the financial statements:
1. The City Charter requires the City Manager to prepare a written estimate of the funds required to conduct
the business and affairs of the City. The estimate, which is the recommended budget, is due on or before the first Monday in May of each year or on such date fixed by the Mayor and Council. The recommended budget may be increased or decreased until tentatively adopted by Mayor and Council.
2. Public hearings are conducted on the recommended budget.
3. State statutes require the City to prepare a full and complete statement of the estimated expenditures and
revenues for the fiscal year. Mayor and Council tentatively adopt the budget for the following fiscal year. After the adoption of the tentative budget, total appropriations cannot be increased.
4. A Public hearing is held on the budget as tentatively adopted and on the proposed property tax levy.
5. Prior to July 1, Mayor and Council legally enact the budget through passage of a resolution. Legal control over the budget derives from State statutes that prohibit the City from exceeding its adopted budget by purpose. Purpose is defined as a series of departments/offices categorized as follows: Elected Officials, Public Safety and Justice Services, Community Enrichment and Development, Support Services, Public Utilities and Non-Departmental. Transfers between purposes, such as Public Safety and Justice Services and Support Services, can be made upon Mayor and Council approval.
6. All appropriations lapse at year-end.
7. Supplementary budgetary appropriations would require approval of Mayor and Council; none were necessary during the fiscal year ended June 30, 2015.
G. Cash and Cash Equivalents For purposes of the statements of cash flows, which are prepared for the enterprise and internal service funds,
the City considers all highly-liquid investments (including the funds' participation in the investment pool account and appropriate restricted assets) to be cash equivalents. Individual fund investments with an initial maturity of 12 months or less when purchased are considered to be cash equivalents.
H. Method used to Value Investments Investments are reported at fair value. The fair value of the pooled investments is based on current market
prices. Securities traded on a national or international exchange are valued at the last reported sales price at current exchange rates. Investments that do not have an established market price are reported at estimated fair value. Estimated fair value for real estate and infrastructure investments are established by third party appraisers.
Interest and dividend income is recognized on the modified accrual basis, except for proprietary funds that are
on the accrual basis. Changes in the fair value of investments are recognized as revenue on a monthly basis. Income from pooled investments is allocated to the individual funds based on each fund's monthly average cash
balance in relation to the total pooled investments. City management has determined that the investment income related to certain funds should be allocated to the General Fund. This is the case for certain special revenue funds. Income from non-pooled investments is recorded based on the specific investments held by the fund. All other interest income is recorded in the fund that earned the interest.
35
CITY OF TUCSON, ARIZONA NOTES TO BASIC FINANCIAL STATEMENTS
For the Year Ended June 30, 2015
Note 1 - SUMMARY OF SIGNIFICANT ACCOUNTING POLICIES (Continued) I. Accounts/Notes Receivable The Water Utility Funds’ assets and revenues include $11,894,260 for water sales delivered, but unbilled at June
30, 2015. General Fund accounts receivables of $32,178,686 are net of allowance for doubtful accounts of $305,970. The
Water Utility and Environment Services accounts receivable of $23,431,202 and $3,138,169, respectively, are net of allowance for doubtful accounts of $796,939 and $285,347, respectively.
The Housing and Community Development Department provides many loans to homeowners through Housing
and Urban Development financing. The loans are placed on each homeowner's title as a lien against the property naming the City as the lien holder. Dependent upon the homeowner's qualification, an affordability period (from 5 to 20 years) is determined. Each lien is forgiven evenly over the determined affordability period. The City only receives a payoff if a property is sold prior to the end of the affordability period (some sales do not result in payment to the City). Less than 10% of these liens have resulted in payoffs to the City in the past 5 years. As of June 30, 2015, these loans totaled $6,216,914. Due to the infrequent payoff of these loans, notes receivable are not recorded, and the revenues for such amounts are recorded when payments are received.
J. Inventories/Prepaids Inventories and prepaid items are reported using the consumption method. Inventories of the governmental and
enterprise funds consist primarily of expendable supplies held for consumption. These inventories are maintained on a perpetual system and are primarily valued using the weighted-average cost method, which is not in excess of market. At the time inventories/prepaids are consumed, expenditures are recorded in the governmental funds and expenses are recorded in the enterprise funds. In the governmental funds, a nonspendable fund balance account is established for the inventory amount. Certain payments to vendors reflect costs applicable to future accounting periods and are recorded as prepaid items. A nonspendable fund balance account is established for prepaid items that are material.
K. Restricted Assets/Liabilities In accordance with applicable covenants of enterprise fund bond issues or other agreements, appropriate assets
and liabilities have been restricted. When both restricted and unrestricted resources are available for use, it is the City's policy to use restricted resources first, then unrestricted resources, as they are needed.
L. Capital Assets Capital assets, which include property, equipment, buildings, and infrastructure assets (such as roads, bridges,
curbs and gutters, streets and sidewalks, drainage systems, and lighting systems), are depreciated and reported in the applicable governmental or business-type activity columns in the government-wide financial statements. Capital assets and depreciation expense are not shown in the governmental fund financial statements.
Capital assets have an estimated useful life greater than one year and are valued at historical cost or estimated
historical cost if actual historical cost is not available. The estimated useful lives for City assets are determined on a variety of methods that include engineering estimates, industry standards, and replacement cycles. Additions subsequent to that date are stated at cost. Donated capital assets are valued at their estimated fair value on the date donated. The capitalization threshold for equipment is $5,000.
The cost of normal maintenance and repairs that do not add to the value of the asset or materially extend asset
lives is not capitalized. Construction costs of capital assets and improvements are capitalized when the project is completed.
36

CITY OF TUCSON, ARIZONA NOTES TO BASIC FINANCIAL STATEMENTS
For the Year Ended June 30, 2015
Note 1 - SUMMARY OF SIGNIFICANT ACCOUNTING POLICIES (Continued) Capital assets are depreciated using the straight-line method over the following estimated useful lives. Land and
construction-in-progress are not depreciated. Estimated
Useful Life (Years)
Buildings and Building Improvements 20 – 40Improvements Other Than Buildings 10 – 40Wells, Tanks and Improvements 40 – 100 Machinery and Equipment 3 – 20
The City's policy is to capitalize interest on proprietary fund capital projects if it is material, based upon GASB
Statement No. 62, Codification of Accounting and Financial Reporting Guidance. Interest costs capitalized during the fiscal year for the City’s water utility fund was $582,719. Interest on general government capital projects is not capitalized.
The enterprise funds do not levy special assessments to construct or purchase capital assets. M. Water Rights The City does not place a limitation on the useful life of the water rights. The water rights are recorded at
historical cost and are considered to have an indefinite useful life. The total book value for water rights for the Water Utility Fund is $52,126,968 at June 30, 2015.
N. Compensated Absences
Vacation and compensatory time benefits are accrued as liabilities as employees earn the benefits to the extent that they meet both of the following criteria: 1) the City’s obligation is attributable to employees’ services already rendered; and 2) it is probable that the City will compensate the employees for the benefits through paid time off or some other means, such as cash payments. Sick leave benefits are accrued as a liability as the benefits are earned by employees, but only to the extent that it is probable that the City will compensate the employees through cash payments conditioned on the employees’ retirement. For governmental funds, a liability for these amounts is reported only if they have matured, for example, as a result of employee resignations and retirements. For the government-wide financial statements, as well as the enterprise fund financial statements, all of the outstanding compensated absences are recorded as a liability.
O. Long-term Obligations In the government-wide financial statements and for the proprietary fund types in the fund financial statements,
long-term debt and other long-term obligations are reported as liabilities on the appropriate Statement of Net Position. Bond premiums and discounts, as well as the difference between the reacquisition price and the net carrying amount of the old debt, are deferred and amortized over the life of the bonds using the straight-line method. Bond issue costs are expensed to the period incurred. Bonds payable are reported net of the applicable bond premium or discount.
In the fund financial statements, governmental fund types recognize bond premiums and discounts, as well as
bond issuance costs, during the current period. The face amount of debt issued is reported as other financing sources. Premiums received on debt issuances are reported as other financing sources, while discounts are reported as other financing uses. Issuance costs, whether or not withheld from the actual debt proceeds received, are reported as debt service expenditures.
37

CITY OF TUCSON, ARIZONA NOTES TO BASIC FINANCIAL STATEMENTS
For the Year Ended June 30, 2015
Note 1 - SUMMARY OF SIGNIFICANT ACCOUNTING POLICIES (Continued) The amount capitalized under capital leases is the lesser of the present value of the minimum lease payments or
the fair value of the leased properties at the beginning of the respective lease terms. When a governmental fund type acquires a capital asset through a capital lease agreement, the acquisition is reflected as an expenditure and other financing source. Capitalized leases of proprietary funds are accounted for entirely within the respective proprietary fund by capitalizing the asset acquired and recording the lease obligation as a liability.
Bonds and other long-term liabilities expected to be financed from proprietary fund operations are accounted for
in those funds. P. Deferred Outflows/Inflows of Resources Deferred outflow of resources represents a consumption of net position that applies to a future period and so will
not be recognized as an outflow of resources (expense/expenditure) until then. Deferred inflow of resources represents an acquisition of net position that applies to a future period and so will not be recognized as an inflow of resources (revenue) until that time.
Q. Fund Balance Policies In the fund financial statements, fund balance is reported in classifications that comprise a hierarchy based on
the extent to which the City is bound to honor constraints on the specific purposes for which amounts in those funds can be spent. The classifications of fund balance are Nonspendable, Restricted, Committed, Assigned, and Unassigned. Unrestricted fund balance is the total fund balance less Nonspendable and Restricted fund balances. The Unrestricted fund balance includes Committed, Assigned and Unassigned classifications.
Nonspendable – The nonspendable fund balance includes amounts that cannot be spent because either: 1) it is
not in a spendable form, such as inventory or prepaid items, or 2) legally or contractually required to be maintained intact.
Restricted – Restricted fund balance is externally (outside the City) enforceable constraints imposed by
creditors, grantors, contributors, laws and regulations of other governments, or laws through constitutional provisions or enabling legislation (changes by City Charter).
Committed – Committed fund balance is self-imposed constraints imposed at the highest level of decision
making authority, namely, Mayor and Council. Mayor and Council approval through an ordinance or resolution is required to commit resources or to rescind the commitment. Although an ordinance is the most binding, it is equally difficult to commit/rescind the commitment using either process. A Stabilization Fund, or “Rainy Day Fund”, is included as a subset of committed fund balance. As of June 30, 2015, this fund is approximately five percent (5%) of General Fund revenues, short of the ten percent (10%) target goal included in the City’s comprehensive financial policies (Resolution No. 22319). These policies were first adopted in January 2011, by Mayor and Council, post 2008-2009 recession, with the goal to restore fund balance within five years of revenue stabilization.
Assigned – Assigned fund balance represents constraints imposed by management. The City’s financial
policies approved by Mayor and Council designated the Finance Director as the approver of any designations to Assigned fund balance as deemed appropriate to meet potential future needs.
38

CITY OF TUCSON, ARIZONA NOTES TO BASIC FINANCIAL STATEMENTS
For the Year Ended June 30, 2015
Note 1 - SUMMARY OF SIGNIFICANT ACCOUNTING POLICIES (Continued)
Unassigned – Unassigned fund balance represents the residual net resources in excess of the other classifications. The General Fund is the only fund that can report a positive unassigned fund balance and any governmental fund can report a negative unassigned fund balance.
Mayor and Council established a Community Banking Program on May 29, 2013. In July 2013, $5 million was
transferred from the City’s Investment Pool account to Alliance Bank to begin participation in a two year Certificate of Deposit Account Registry Service (CDARS) program. This is a reciprocal program whereby funds are placed in CDs of various banks across the county up to amounts insured by the Federal Deposit Insurance Corporation. All funds deposited are reciprocally deposited back to Alliance Bank to be used locally. CDARS is a viable source of deposit placement for public funds under ARS 35-323.01 and allowed in the City’s investment policy. Ten million dollars of the Stabilization Fund is now held in a 2-year CDARS investment.
A target of a minimum of seven percent of General Fund revenues will be “Unassigned/contingency”, with the
intention to provide additional stability to the General Fund recognizing the cyclical nature of the economy and the volatility of the major revenue sources of the City. Funds in excess of the minimum targets will be retained in the Unassigned General Fund Balance to supplement “pay as you go” requirements.
When both restricted and unrestricted resources are available for specific expenditures, restricted resources are
considered spent before unrestricted resources. Within unrestricted resources, committed and assigned are considered spent (if available) before unassigned amounts.
As of June 30, 2015, the fund balance details by classification are listed on the next page:
39

CITY OF TUCSON, ARIZONA NOTES TO BASIC FINANCIAL STATEMENTS
For the Year Ended June 30, 2015
Note 1 - SUMMARY OF SIGNIFICANT ACCOUNTING POLICIES (Continued)
Non-Major TotalGeneral Fund Mass Transit Governmental Funds Governmental Funds
Fund Balances: Nonspendable: Inventory 323,000$ 2,750,309$ $ 3,073,309$ Prepaid Expenditures 3,080,899 3,080,899 Long-term Investment 2,297,506 2,297,506 Golf Long-term Loan 8,554,615 8,554,615Total Nonspendable 11,175,121 5,831,208 17,006,329
Restricted: Debt Service 3,306,319 3,306,319 Transportation 62,687,735 62,687,735 Parks and Recreation 5,825,892 5,825,892 Capital Projects 7,655,128 7,655,128 Donations 616,922 616,922 Federal Grants 6,670,761 6,670,761 Public Safety 4,876,013 2,653,736 7,529,749Total Restricted 4,876,013 89,416,493 94,292,506
Committed To: Transportation 2,273,745 19,278 2,293,023 Parks and Recreation 1,227,504 1,227,504 Public Housing 341,074 341,074 Public Safety 1,662,646 1,662,646 Economic Development 1,011,636 1,011,636 Stabilization Fund 22,836,507 22,836,507 Transit 82,315 82,315 Other Purposes 281,947 3,361 285,308Total Committed 29,635,059 82,315 22,639 29,740,013
Assigned To: Transportation 1,695,786 1,695,786 Management Contingencies 3,711,430 3,711,430 Parks and Recreation Transit 259,200 2,519,107 2,778,307 Other Purposes 574,440 24,500 598,940Total Assigned 4,285,870 259,200 4,239,393 8,784,463
Unassigned: 15,736,784 15,736,784 Total Fund Balances 65,708,847$ 6,172,723$ 93,678,525$ 165,560,095$
R. Interfund Transactions Transactions that would be treated as revenue, expenditures or expenses if they involved organizations external
to the governmental unit are accounted for as revenue, expenditures or expenses in the funds involved. Transactions which constitute reimbursements of a fund for expenditures or expenses initially made from that fund which are properly applicable to another fund are recorded as expenditures or expenses in the reimbursing fund and as reductions of the expenditures or expenses in the fund that is reimbursed.
Generally, the effect of interfund activity has been removed from the government-wide financial statements. Net
interfund activity and balances between governmental activities and business-type activities are shown in the Statement of Net Position as Internal Balances. The "doubling-up" effect of internal service fund activity has been removed by adjusting the expenses shown in the various functions within the Statement of Activities.
40

CITY OF TUCSON, ARIZONA NOTES TO BASIC FINANCIAL STATEMENTS
For the Year Ended June 30, 2015
Note 1 - SUMMARY OF SIGNIFICANT ACCOUNTING POLICIES (Continued) S. Donor-Restricted Endowments
The City receives gifts and donations from individuals and/or organizations to support various City functions. The net appreciation of investments in fiscal year 2015 was $2,911 and is included in restricted net position as Restricted for Donations. There are no state laws governing the expenditure of investment income for City donations.
T. Use of Estimates The preparation of basic financial statements in conformity with generally accepted accounting principles
requires management to make a number of estimates and assumptions that affect the reported amounts of assets and liabilities and disclosure of contingent assets and liabilities at the date of the financial statements and the reported amounts of revenue and expenses/expenditures during the reporting period. Actual results could differ from those estimates.
Note 2 - PROPERTY TAX: Property taxes are levied and collected by the Pima County Treasurer on behalf of the City. Property taxes are levied no later than the third Monday in August and are payable in two installments. Taxes become delinquent after the first business day of both November and May, respectively, and a lien against real and personal property attaches on the first day of January preceding assessment and levy. The State Constitution and State law specify a property tax levy limitation system. The system consists of two levies: a limited levy known as the primary property tax levy and an unlimited levy referred to as the secondary levy, which may be used only to retire bond indebtedness. The primary property tax levy is limited to an increase of 2% over the previous year's maximum allowable primary levy, plus an increased dollar amount due to a net gain in property not taxed the previous year. Also, the primary property tax from all taxing jurisdictions for homeowners may not exceed 1% of their homes' market values. If the combined primary property tax (for the City, County, etc.) exceeds 1% of the market value of the homes, the school districts will reduce their rates until the homeowners' aggregate rate is equal to or less than the allowable 1%. The State or County will then subsidize the school districts for the reduced revenue. This 1% limitation applies to primary property taxes and does not affect the secondary property tax levy. The City Charter sets an upper property tax limit of $1.75 per $100 of assessed value. Therefore, the City cannot levy a combined primary and secondary property tax that exceeds $1.75. There is also a control on the assessed value of property for primary tax purposes. The base year for the tax system is fiscal year 1978-79, which was recalculated in 2006 due to a subsequent constitutional amendment. From this base year, two assessed values evolve. The primary assessed values are allowed to grow or increase by no more than 10% a year. The dollar amount of the secondary property tax levy is unlimited, and the actual full cash value of property is used in determining the tax rate. Arizona State law allows cities and towns to include tort claim reimbursements in the primary tax levy. The property tax revenue represents a reimbursement to the City’s Self-Insurance Fund for the actual cost of liability claim judgments exceeding $20,000 paid during the prior fiscal year.
41

CITY OF TUCSON, ARIZONA NOTES TO BASIC FINANCIAL STATEMENTS
For the Year Ended June 30, 2015
Note 3 - INDIVIDUAL FUND DISCLOSURES At June 30, 2015, the following funds had deficit fund balances or net position:
Environmental Services $ (16,984,080) General Services Fund $ (10,781,094)
The deficit in the Environmental Services fund is primarily due to the increase in remediation obligations of the Silverbell landfill remediation site and the unfunded pension liability. The deficit in the General Services Fund is due to the incurrence of debt to solar panel capital assets that have been transferred to other functions. This fund has revenue sources from department charges and utility solar rebates to pay the debt service. Note 4 - DEPOSITS AND INVESTMENTS The City maintains an investment pool that is available for use by all City funds. Each fund's portion of this pool is reported on the financial statements as "Cash and Cash Equivalents." A single master custodian holds all assets of the investment pool. In addition, certain cash deposits and investments are also held separately by various City funds in separate accounts. The majority of deposits and investments of the Tucson Supplemental Retirement System (TSRS), a defined benefit pension plan, are held in trust separately from those of other City funds by a master custodian. However, biweekly contributions to the fund for this plan are held in the investment pool to cover recurring expenditures. The following is a reconciliation of the City’s deposit and investment balances as of June 30, 2015:
Cash and Reconciling
Cash Equivalents Adjustments TotalBank Deposits 233,687,278$ (18,613,650)$ 215,073,628$ Investments 798,986,505 111,680 799,098,185 Total 1,032,673,783$ (18,501,970)$ 1,014,171,813$
Government-wide Fiduciary FundsStatement Statement
of Net Position of Net Position TotalCash and Cash Equivalents 174,601,632$ 4,426,300$ 179,027,932$ Noncurrent Investments 43,643,578 755,454,608 799,098,186 Cash & Investments Restricted 36,045,695 36,045,695 Total 254,290,905$ 759,880,908$ 1,014,171,813$
A. Deposits
Reconciling items in the previous table are made up of outstanding checks, deposits in transit and other miscellaneous items. Bank balances are covered by federal depository insurance or collateral (if applicable) held by the City’s agents in the City’s name.
B. Investments
For the City investment pool, the City Charter and State Statutes authorize the City to invest in obligations typically rated by one or more nationally recognized statistical-rating organizations (NRSROs) i.e., Moody’s/Standard & Poors. These obligations may consist of the U.S. Government Treasuries, Agencies and instrumentalities, money market funds consisting of primarily U.S. Governmental issues, repurchase
42
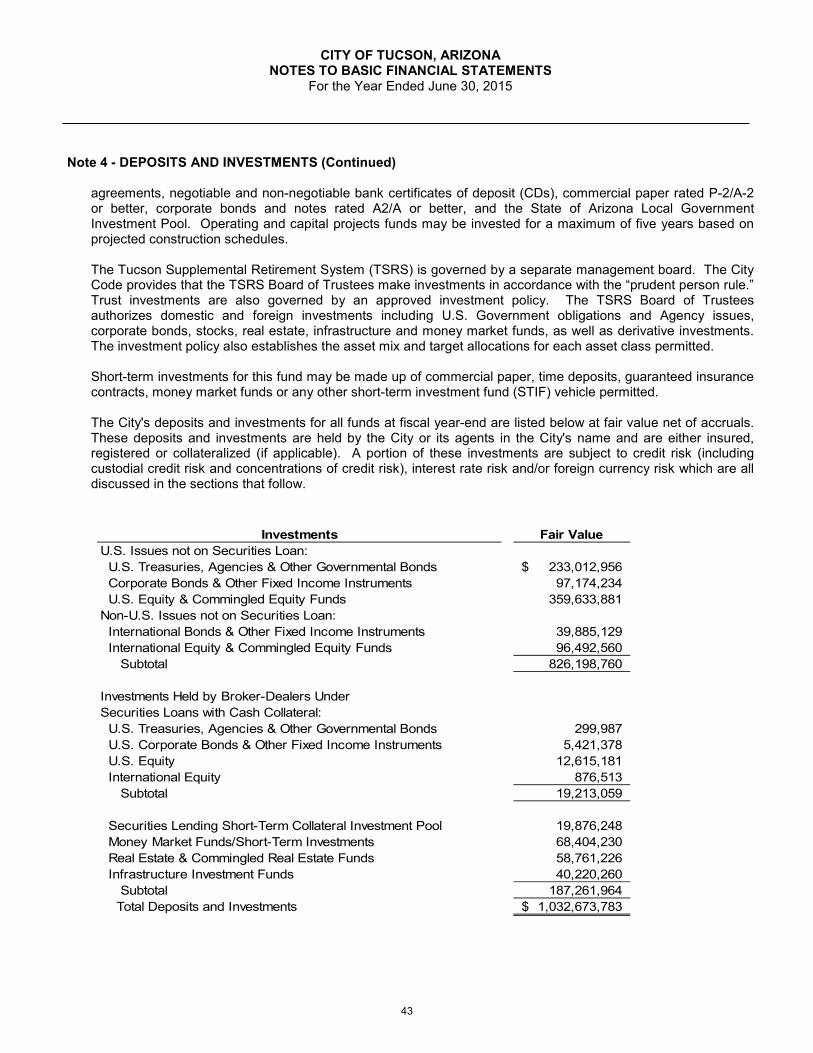
CITY OF TUCSON, ARIZONA NOTES TO BASIC FINANCIAL STATEMENTS
For the Year Ended June 30, 2015
Note 4 - DEPOSITS AND INVESTMENTS (Continued)
agreements, negotiable and non-negotiable bank certificates of deposit (CDs), commercial paper rated P-2/A-2 or better, corporate bonds and notes rated A2/A or better, and the State of Arizona Local Government Investment Pool. Operating and capital projects funds may be invested for a maximum of five years based on projected construction schedules. The Tucson Supplemental Retirement System (TSRS) is governed by a separate management board. The City Code provides that the TSRS Board of Trustees make investments in accordance with the “prudent person rule.” Trust investments are also governed by an approved investment policy. The TSRS Board of Trustees authorizes domestic and foreign investments including U.S. Government obligations and Agency issues, corporate bonds, stocks, real estate, infrastructure and money market funds, as well as derivative investments. The investment policy also establishes the asset mix and target allocations for each asset class permitted. Short-term investments for this fund may be made up of commercial paper, time deposits, guaranteed insurance contracts, money market funds or any other short-term investment fund (STIF) vehicle permitted. The City's deposits and investments for all funds at fiscal year-end are listed below at fair value net of accruals. These deposits and investments are held by the City or its agents in the City's name and are either insured, registered or collateralized (if applicable). A portion of these investments are subject to credit risk (including custodial credit risk and concentrations of credit risk), interest rate risk and/or foreign currency risk which are all discussed in the sections that follow.
Investments Fair ValueU.S. Issues not on Securities Loan: U.S. Treasuries, Agencies & Other Governmental Bonds 233,012,956$ Corporate Bonds & Other Fixed Income Instruments 97,174,234 U.S. Equity & Commingled Equity Funds 359,633,881 Non-U.S. Issues not on Securities Loan: International Bonds & Other Fixed Income Instruments 39,885,129 International Equity & Commingled Equity Funds 96,492,560 Subtotal 826,198,760
Investments Held by Broker-Dealers Under Securities Loans with Cash Collateral: U.S. Treasuries, Agencies & Other Governmental Bonds 299,987 U.S. Corporate Bonds & Other Fixed Income Instruments 5,421,378 U.S. Equity 12,615,181 International Equity 876,513 Subtotal 19,213,059
Securities Lending Short-Term Collateral Investment Pool 19,876,248 Money Market Funds/Short-Term Investments 68,404,230 Real Estate & Commingled Real Estate Funds 58,761,226 Infrastructure Investment Funds 40,220,260 Subtotal 187,261,964 Total Deposits and Investments 1,032,673,783$
43

CITY OF TUCSON, ARIZONA NOTES TO BASIC FINANCIAL STATEMENTS
For the Year Ended June 30, 2015
Note 4 - DEPOSITS AND INVESTMENTS (Continued) C. Credit Risk
As defined by the Governmental Accounting Standards Board (GASB) in Statement 40, credit risk is the risk that an issuer or other counterparty to an investment will not fulfill its obligations. Associated with credit risk is concentration of credit risk and custodial credit risk. Concentration of credit risk is the risk of loss attributed to the magnitude of a government’s investment in a single issuer. Custodial credit risk for deposits is the risk that, in the event of the failure of a depository financial institution, a government will not be able to recover deposits or will not be able to recover collateral securities that are in the possession of an outside party. The custodial credit risk for investments is the risk that, in the event of the failure of the counterparty to a transaction, a government will not be able to recover the value of investment or collateral securities that are in the possession of an outside party. The City has the following investment policies governing the City’s investment pool account that addresses the various credit risks defined above. Investments shall be limited to the following instruments and percentages: 1) Obligations of the U.S. Government, its Agencies and instrumentalities; 2) Repurchase agreements whose underlying collateral is commercial paper rated P-1/A-1 (Moody’s/Standard & Poors) with maturities not to exceed 180 days or rated P-2/A-2 with maturities not to exceed 90 days; 3) Bonds, notes and debentures issued by U.S. corporations rated at least A2/A; 4) Money market funds, non-negotiable CDs, etc., that are either insured by an Agency of the federal government or collateralized (if applicable) by obligations of the U.S. Government, its Agencies and instrumentalities or General Obligation municipal bonds rated A2/A or better at the minimum State of Arizona mandated required amount on deposit, calculated on market values. The collateral must be held by the Trust department of the financial institution or delivered to the City’s agent; 5) Except for direct obligations of the U.S. Treasury or a U.S. Agency, not more than 5% of the portfolio shall be invested in securities of any one issuer; 6) A minimum of 15% of the portfolio shall be invested in highly liquid securities such as money market funds; 7) Not more than 25% of the portfolio shall be invested in medium-term corporate notes, commercial paper and negotiable CDs; 8) not more than 20% of the portfolio shall be invested in Arizona municipal securities; 9) not more than 25% of the portfolio shall be invested in 144A securities (applicable to large institutional investors only), subject to meeting all the investment policy requirements described above. The City’s investment pool account had the following credit risk structure as of June 30, 2015:
44

CITY OF TUCSON, ARIZONA NOTES TO BASIC FINANCIAL STATEMENTS
For the Year Ended June 30, 2015
Note 4 - DEPOSITS AND INVESTMENTS (Continued)
The City also maintains investments and cash funds in specific accounts outside of the investment pool account to meet certain operational and legal requirements which are reported as follows, at fair value net of accruals. As of June 30, 2015, these funds consisted of: a U.S. Treasury Note with a fair value of $31,244,637, a U.S. Agency Bond with a fair value of $2,297,506 and various other operational accounts totaling $14,554,485. The City of Tucson banking policy for these cash accounts are consistent with the investment pool account policy described above. During the fiscal year, the City funded an additional Community Banking Deposit program. The objective of the program is to help spur local economic activity by depositing funds with “local” financial institutions to be subsequently lent out locally for new consumer and small business loans. After completion of a solicitation for offers from local institutions, the City made an additional deposit of five million dollars in a FDIC insured-type Certificate of Deposit Account Registry Service (CDARS) investment product. As of June 30, 2015, the fair value of this investment was $10,101,434. The TSRS pension fund presently maintains two externally managed fixed income (bond) accounts which are exposed to some form of credit risk. The assets in the first account are actively managed while the assets in the second account are invested in a commingled bond index fund (passively managed). The TSRS Board has given the actively managed account manager discretion to invest in a broad array of public and private asset classes, instruments and investment vehicles in order to meet or exceed the agreed upon investment return custom benchmark. However, the following specific investment policy guidelines pertain to this manager. 1) The maximum position in a single issuer (excluding obligations of U.S. Government and its Agencies) should not exceed 5% of the portfolio’s assets at current market value; 2) The portfolio should maintain an average quality of a least Ba1/BB+; 3) Money market instruments must be rated in one of the two highest categories by a NRSRO; 4) The minimum rating of individual issues should be Caa2/CCC as rated by Moody’s, Standard & Poors or Fitch; 5) Should an issue be downgraded below the minimum, the manager will determine the appropriate action to be taken. The passive fund is expected to replicate, as close as possible, the characteristics, quality and performance of its underlying index, the BC aggregate Bond Index. The table on the following page provides the TSRS pension fund credit risk structure as of June 30, 2015:
45
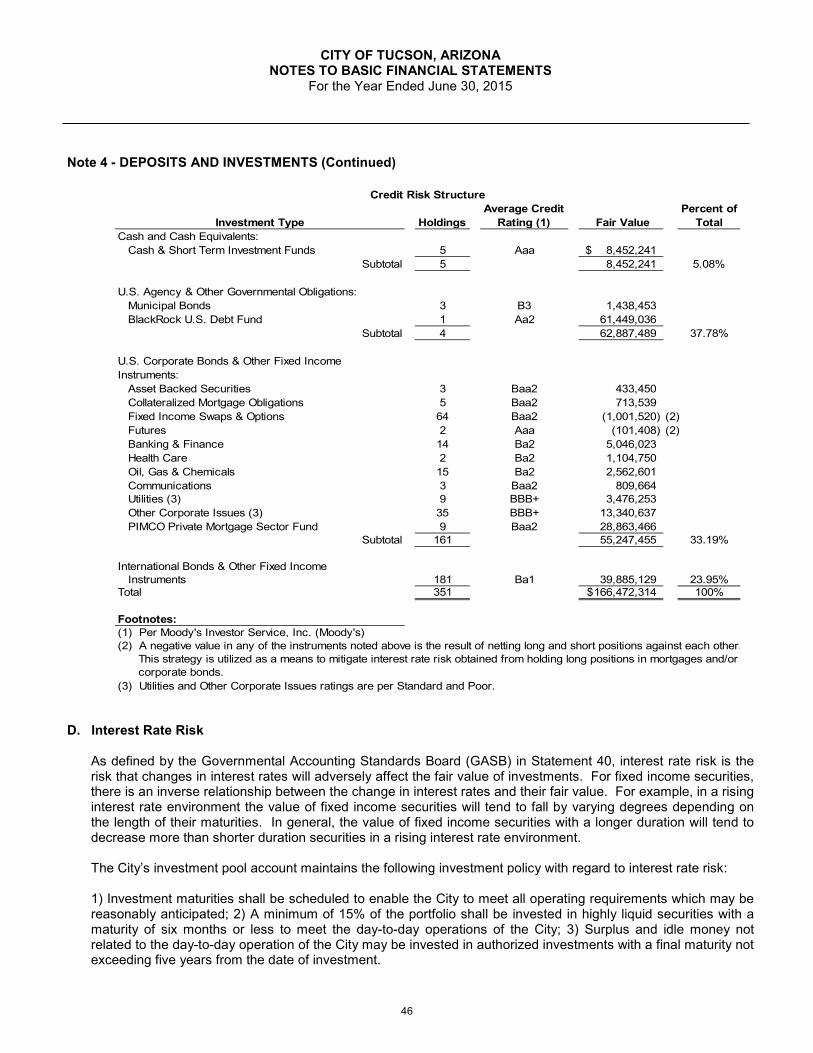
CITY OF TUCSON, ARIZONA NOTES TO BASIC FINANCIAL STATEMENTS
For the Year Ended June 30, 2015
Note 4 - DEPOSITS AND INVESTMENTS (Continued)
Investment Type HoldingsAverage Credit
Rating (1) Fair Value Percent of
TotalCash and Cash Equivalents: Cash & Short Term Investment Funds 5 Aaa 8,452,241$
Subtotal 5 8,452,241 5.08%
U.S. Agency & Other Governmental Obligations: Municipal Bonds 3 B3 1,438,453 BlackRock U.S. Debt Fund 1 Aa2 61,449,036
Subtotal 4 62,887,489 37.78%
U.S. Corporate Bonds & Other Fixed Income Instruments: Asset Backed Securities 3 Baa2 433,450 Collateralized Mortgage Obligations 5 Baa2 713,539 Fixed Income Swaps & Options 64 Baa2 (1,001,520) (2) Futures 2 Aaa (101,408) (2) Banking & Finance 14 Ba2 5,046,023 Health Care 2 Ba2 1,104,750 Oil, Gas & Chemicals 15 Ba2 2,562,601 Communications 3 Baa2 809,664 Utilities (3) 9 BBB+ 3,476,253 Other Corporate Issues (3) 35 BBB+ 13,340,637 PIMCO Private Mortgage Sector Fund 9 Baa2 28,863,466
Subtotal 161 55,247,455 33.19%
International Bonds & Other Fixed Income Instruments 181 Ba1 39,885,129 23.95%
Total 351 166,472,314$ 100%
Footnotes:(1) Per Moody's Investor Service, Inc. (Moody's)(2) A negative value in any of the instruments noted above is the result of netting long and short positions against each other.
This strategy is utilized as a means to mitigate interest rate risk obtained from holding long positions in mortgages and/orcorporate bonds.
(3) Utilities and Other Corporate Issues ratings are per Standard and Poor.
Credit Risk Structure
D. Interest Rate Risk
As defined by the Governmental Accounting Standards Board (GASB) in Statement 40, interest rate risk is the risk that changes in interest rates will adversely affect the fair value of investments. For fixed income securities, there is an inverse relationship between the change in interest rates and their fair value. For example, in a rising interest rate environment the value of fixed income securities will tend to fall by varying degrees depending on the length of their maturities. In general, the value of fixed income securities with a longer duration will tend to decrease more than shorter duration securities in a rising interest rate environment.
The City’s investment pool account maintains the following investment policy with regard to interest rate risk: 1) Investment maturities shall be scheduled to enable the City to meet all operating requirements which may be reasonably anticipated; 2) A minimum of 15% of the portfolio shall be invested in highly liquid securities with a maturity of six months or less to meet the day-to-day operations of the City; 3) Surplus and idle money not related to the day-to-day operation of the City may be invested in authorized investments with a final maturity not exceeding five years from the date of investment.
46

CITY OF TUCSON, ARIZONA NOTES TO BASIC FINANCIAL STATEMENTS
For the Year Ended June 30, 2015
Note 4 - DEPOSITS AND INVESTMENTS (Continued)
The City’s investment pool account had the following maturity structure as of June 30, 2015:
The TSRS pension fund’s investment policy regarding interest rate risk for the actively managed fixed income account, is to limit duration to within 30% of the custom benchmark which is defined as 25% BC Mortgage Index, 25% BC Credit index, 25% BC High Yield Index and 25% JPM EMBI Global Index. The passive fund should match, as close as possible, the maturity structure and duration of the BC Aggregate Bond Index.
47

CITY OF TUCSON, ARIZONA NOTES TO BASIC FINANCIAL STATEMENTS
For the Year Ended June 30, 2015
Note 4 - DEPOSITS AND INVESTMENTS (Continued) The TSRS fund had the following maturity structure as of June 30, 2015:
Investment Type Less Than 1 1 - 5 6 - 10 More Than 10 Fair ValueCash & Short Term Investment Fund 8,452,241$ $ $ $ 8,452,241$
U.S. Agency & Other Governmental Obligations 1,438,453 1,438,453
BlackRock U.S. Debt Fund 61,449,036 61,449,036
U.S. Corporate & Other Fixed Income Instruments 1,587,259 37,955,112 6,552,303 9,152,781 55,247,455
International Bonds & Other Fixed Income Instruments 142,091 16,414,650 11,183,394 12,144,994 39,885,129
TOTAL 10,181,591$ 54,369,762$ 79,184,733$ 22,736,228$ 166,472,314$
Effective Duration:
Active Account 4.9 years
Passive Account 5.23 years
Note: The information indicated has been presented using the specific identification method
Maturity StructureInvestment Maturities (in Years)
E. Foreign Currency Risk
As defined by the Governmental Accounting Standards Board (GASB) in Statement 40, foreign currency risk is the risk that changes in exchange rates will adversely affect the fair value of an investment or a deposit. The exposure to foreign currency risk is currently limited to some of the investments within the TSRS pension fund. The TSRS Board has given the fund’s international equity managers discretion to invest in a broad array of common and preferred stocks, convertibles and warrants of companies headquartered outside of the United States in order to meet or exceed their agreed upon investment return benchmarks. However, the following specific investment policy guidelines pertain to these managers: 1) Investments in any single country market should not exceed more than 4 times the weight of the country in the benchmark index or 50% of portfolio assets, whichever is lower; 2) If a country has a greater than 50% weight in the index, the maximum exposure to that country in the portfolio may be as high as its weight in the index; 3) No more than 35% of each manager’s portfolio should be invested in “emerging markets” (i.e., markets that are not included in the Morgan Stanley Capital International Europe, Australia and Far East index); 4) Managers are permitted to enter into hedging strategies, including cross-currency hedges, using forward currency exchange contracts and currency options; 5) Derivatives should not be used for the purpose of speculation or for leveraging the portfolio. The following table provides the TSRS fund foreign currency risk exposure as of June 30, 2015:
48

CITY OF TUCSON, ARIZONA NOTES TO BASIC FINANCIAL STATEMENTS
For the Year Ended June 30, 2015
Note 4 - DEPOSITS AND INVESTMENTS (Continued)
Currency Type
Cash & Cash
Equivalents (1)
Fixed Income (1) Equity Real Estate
Infra-structure
Foreign Exchange Contracts
(2) Fair ValuePercent of
TotalAustralian Dollar (15,744)$ $ $ $ $ $ $ (15,744) -0.002%
Brazil Real 15,949 262,489 (285,126) (6,688) -0.001%
Canadian Dollar 410 1,577,768 1,578,178 0.215%
Euro Currency Unit 5,649,816 9,180,109 17,428,648 20,839,504 (15,677,073) 37,421,004 5.100%
Hong Kong Dollar 4,273,802 4,273,802 0.582%
Indian Rupee (30,582) (30,582) -0.004%
Japanese Yen 19,018 9,036,536 (1,003,122) 8,052,432 1.097%
Mexican New Peso 23 23 0.000%
Polish Zloty 12,285 12,285 0.002%
British Pound Sterling 10,393 5,254,153 11,841,930 (5,403,875) 11,702,601 1.595%
S. African Comm Rand 9,904 9,904 0.001%
South Korean Won 3,140,118 3,140,118 0.428%
Swiss Franc 754 7,466,704 (99,665) 7,367,793 1.004%
Currency Subtotals 5,702,808 14,696,751 54,765,506 20,839,504 (22,499,443) 73,505,126 10.017%
U.S. Dollar (5,247,302) 153,197,495 412,975,192 58,761,226 19,380,756 21,244,235 660,311,602 89.984%
TOTAL 455,506$ 167,894,246$ 467,740,698$ 58,761,226$ 40,220,260$ (1,255,208)$ 733,816,728$ 100%0.06% 22.88% 63.74% 8.01% 5.48% -0.17% 100%
Footnotes:(1) A negative value in the instruments noted above is the result of netting long and short positions against each other. This strategy is utilized as a means to mitigate interest rate risk obtained from holding long positions in mortgages and/or corporate bonds.(2) A negative currency position is obtained by accepting an obligation to deliver the designated currency to a counterparty at a specified date in the future. This position is favorable for portfolio returns if the currency depreciates in value versus the U.S. dollar over the period of the contract.
Foreign Currency Risk Exposure
F. Securities Lending
The Board of Trustees for the Tucson Supplemental Retirement System permits the custodian bank, BNY Mellon, to lend securities to broker-dealers and other entities. Each loan is executed with a simultaneous agreement to return the collateral for the same securities in the future. The custodian bank lends U.S. securities for collateral initially valued at 102% of the fair value of the securities plus any accrued interest. Non-U.S. securities are loaned for collateral initially valued at 105% of the fair value of the securities plus any accrued interest. Collateral is marked-to-market daily. As of June 30, 2015, the carrying amount and fair value of securities on loan was $19,876,248. If the fair value of the pledged collateral falls below the specified levels, additional collateral is required to be pledged by the close of the next business day.
49
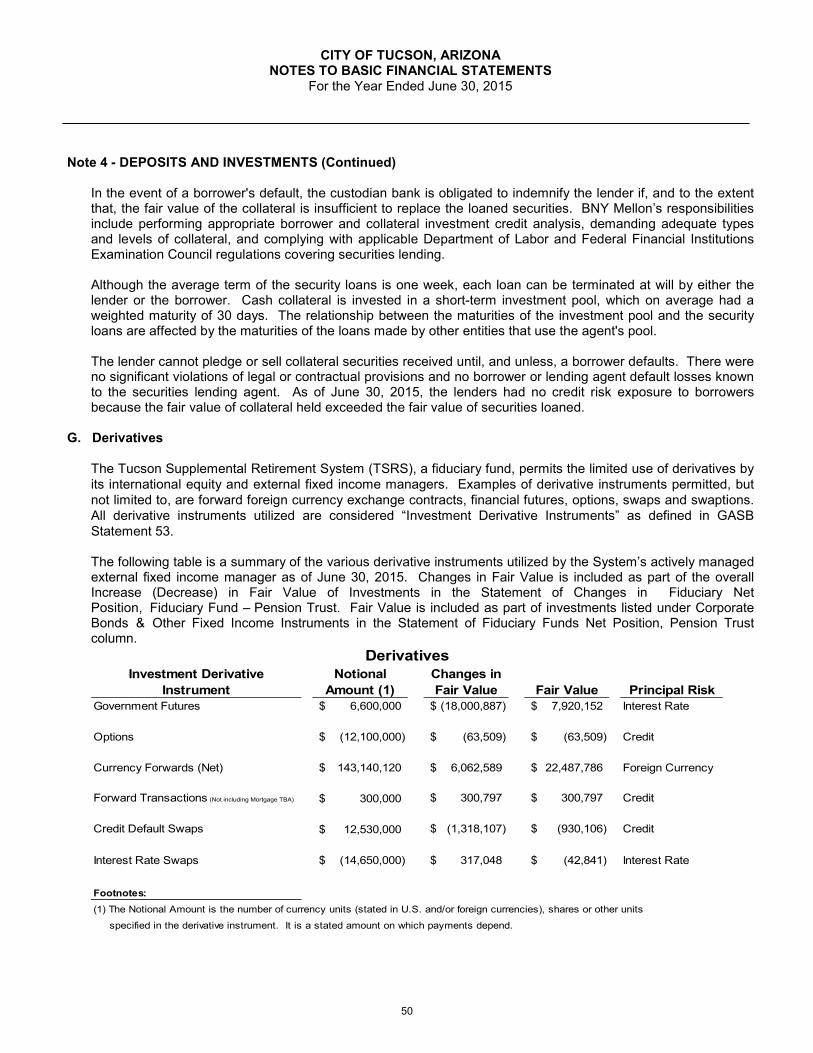
CITY OF TUCSON, ARIZONA NOTES TO BASIC FINANCIAL STATEMENTS
For the Year Ended June 30, 2015
Note 4 - DEPOSITS AND INVESTMENTS (Continued)
In the event of a borrower's default, the custodian bank is obligated to indemnify the lender if, and to the extent that, the fair value of the collateral is insufficient to replace the loaned securities. BNY Mellon’s responsibilities include performing appropriate borrower and collateral investment credit analysis, demanding adequate types and levels of collateral, and complying with applicable Department of Labor and Federal Financial Institutions Examination Council regulations covering securities lending.
Although the average term of the security loans is one week, each loan can be terminated at will by either the lender or the borrower. Cash collateral is invested in a short-term investment pool, which on average had a weighted maturity of 30 days. The relationship between the maturities of the investment pool and the security loans are affected by the maturities of the loans made by other entities that use the agent's pool.
The lender cannot pledge or sell collateral securities received until, and unless, a borrower defaults. There were no significant violations of legal or contractual provisions and no borrower or lending agent default losses known to the securities lending agent. As of June 30, 2015, the lenders had no credit risk exposure to borrowers because the fair value of collateral held exceeded the fair value of securities loaned.
G. Derivatives
The Tucson Supplemental Retirement System (TSRS), a fiduciary fund, permits the limited use of derivatives by its international equity and external fixed income managers. Examples of derivative instruments permitted, but not limited to, are forward foreign currency exchange contracts, financial futures, options, swaps and swaptions. All derivative instruments utilized are considered “Investment Derivative Instruments” as defined in GASB Statement 53.
The following table is a summary of the various derivative instruments utilized by the System’s actively managed external fixed income manager as of June 30, 2015. Changes in Fair Value is included as part of the overall Increase (Decrease) in Fair Value of Investments in the Statement of Changes in Fiduciary Net Position, Fiduciary Fund – Pension Trust. Fair Value is included as part of investments listed under Corporate Bonds & Other Fixed Income Instruments in the Statement of Fiduciary Funds Net Position, Pension Trust column.
Investment Derivative Instrument
Notional Amount (1)
Changes in Fair Value Fair Value Principal Risk
Government Futures 6,600,000$ (18,000,887)$ 7,920,152$ Interest Rate
Options (12,100,000)$ (63,509)$ (63,509)$ Credit
Currency Forwards (Net) 143,140,120$ 6,062,589$ 22,487,786$ Foreign Currency
Forward Transactions (Not including Mortgage TBA) 300,000$ 300,797$ 300,797$ Credit
Credit Default Swaps 12,530,000$ (1,318,107)$ (930,106)$ Credit
Interest Rate Swaps (14,650,000)$ 317,048$ (42,841)$ Interest Rate
Footnotes:(1) The Notional Amount is the number of currency units (stated in U.S. and/or foreign currencies), shares or other units
specified in the derivative instrument. It is a stated amount on which payments depend.
Derivatives
50

CITY OF TUCSON, ARIZONA NOTES TO BASIC FINANCIAL STATEMENTS
For the Year Ended June 30, 2015
Note 4 - DEPOSITS AND INVESTMENTS (Continued)
Whenever possible, the investment manager will base the valuation of derivatives on market information; however, where market quotes are not readily available, an independent third party pricing vendor will be utilized. Exchange traded derivatives are an example of derivatives where market quotes are available, whereas over-the counter (OTC) securities are not traded over standardized markets.
In addition to the principal risks noted above, Forward Foreign Currencies, Credit Default Swaps and Interest Rate Swaps are also subject to counterparty risk. In general, counterparty risk is the risk of loss of an amount expected to be delivered under an agreement in the event of the default or bankruptcy of the counterparty. Generally, counterparty risk is controlled through dealing with a number of different counterparties reasonably deemed to be creditworthy by the investment manager and using agreements with counterparties that permit netting of obligations. Counterparty risk with swaps is limited by execution under standardized International Swap and Derivatives Association Agreements. These contracts allow for the mutual exchange of collateral should an overall unsecured market value exceed a certain threshold (e.g., $250,000).
Credit, interest rate and foreign currency risks are addressed in previous sections of this Note. These risks, applicable to other fixed income and foreign investments, are not substantially different from principal risks associated with derivative instruments.
Note 5 - INTERFUND BALANCES AND TRANSFERS
Interfund receivables/payables represent cash transfers between funds as of June 30, 2015. These are necessary to cover short term timing differences between cash outflows and inflows for specific funds. The following governmental interfund receivables/payables are eliminated in the government-wide financial statements.
Interfund InterfundFund Receivables PayablesGovernmental Funds:
General Fund 43,142,404$ 22,929,670$ Mass Transit Fund 3,779,301Other Non-major Governmental Funds 39,363,103
Total Governmental Funds 43,142,404 66,072,074
Enterprise Funds:Environmental Services 22,929,670
Total All Funds 66,072,074 66,072,074
The Due from/to Other Agencies balances at June 30, 2015 are listed on the next page. These represent receivables/payables to federal, state, or local governmental agencies. Fiduciary Fund due from/to are not shown on the government-wide financial Statement of Net Position.
51
$$

CITY OF TUCSON, ARIZONA NOTES TO BASIC FINANCIAL STATEMENTS
For the Year Ended June 30, 2015
Note 5 - INTERFUND BALANCES AND TRANSFERS (Continued)
Due From Due ToFund Other Agencies Other AgenciesGovernmental Funds: General Fund 22,223,245$ 1,567,610$ Mass Transit Fund 3,481,219 224,377 Other Non-major Governmental Funds 42,625,278 72,799Total Governmental Funds 68,329,742 1,864,786
Internal Service Funds: Self Insurance 52 General Services 476 Fleet Services 16,509 150Total Internal Service Funds 16,509 678
Enterprise Funds: Water Utility 4,606,354 Environmental Services 11,381 5,755 Other Non-major Enterprise Funds 581,573 37,993Total Enterprise Funds 592,954 4,650,102
Fiduciary Funds: Sewer User Fee Fund 12,807,194 HIDTA Fund 72,718Total Fiduciary Funds 12,879,912
Total All Funds 68,939,205$ 19,395,478$
Transfers are primarily: 1) Operational subsidies from the General Fund to various funds. 2) Payment in lieu of taxes from the Water Utility Fund to the General Fund. Capital asset and other transfers between the Internal Service Funds, Enterprise Funds, and Governmental Funds of $3,920,404 are not included. All transfers are consistent with the operation of the governmental funds.
Transfers made during the year ended June 30, 2015, were as follows:
Fund Transfers In Transfers OutGovernmental Funds:
General Fund 1,600,000$ 50,613,653$ Mass Transit Fund 43,725,841 Other Non-major Governmental Funds 26,299,578 19,411,766
Total Governmental Funds 71,625,419 70,025,419
Enterprise Funds:Water Utility 1,600,000 Other Non-major Enterprise Funds 80,000 80,000
Total Enterprise Funds 80,000 1,680,000
Total All Funds 71,705,419$ 71,705,419$
52
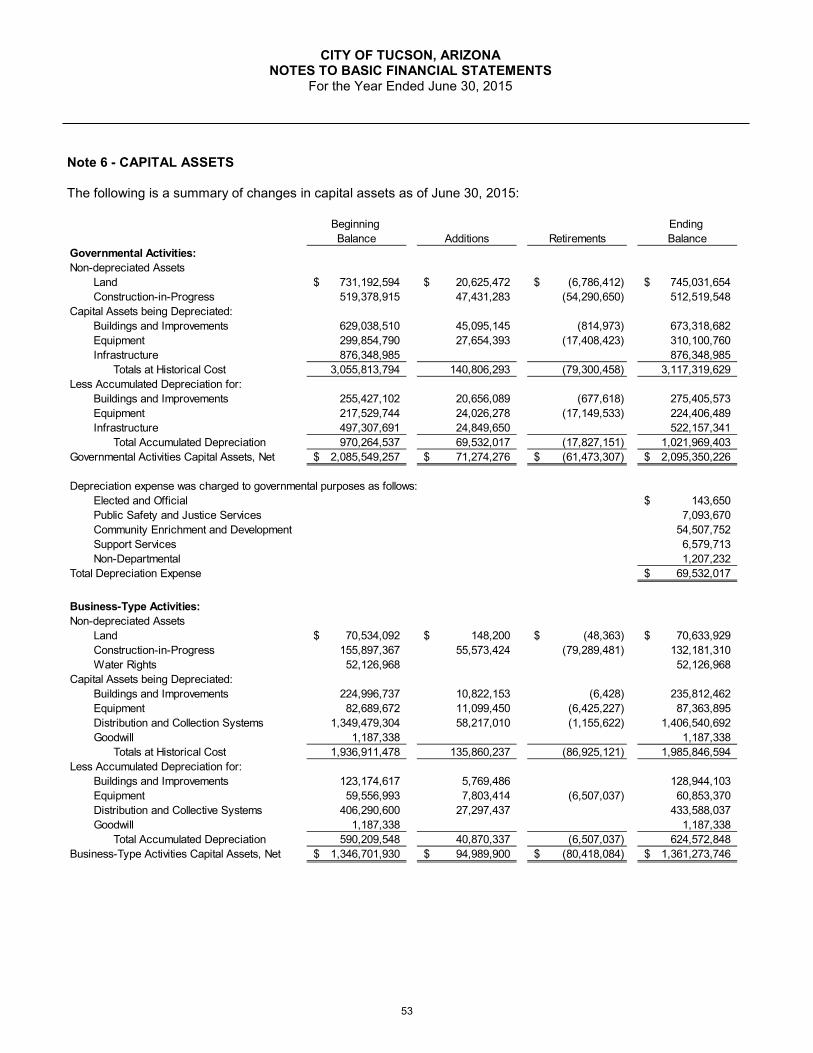
CITY OF TUCSON, ARIZONA NOTES TO BASIC FINANCIAL STATEMENTS
For the Year Ended June 30, 2015
Note 6 - CAPITAL ASSETS
The following is a summary of changes in capital assets as of June 30, 2015:
Beginning Ending Balance Additions Retirements Balance
Governmental Activities:Non-depreciated Assets
Land 731,192,594$ 20,625,472$ (6,786,412)$ 745,031,654$ Construction-in-Progress 519,378,915 47,431,283 (54,290,650) 512,519,548
Capital Assets being Depreciated:Buildings and Improvements 629,038,510 45,095,145 (814,973) 673,318,682Equipment 299,854,790 27,654,393 (17,408,423) 310,100,760Infrastructure 876,348,985 876,348,985
Totals at Historical Cost 3,055,813,794 140,806,293 (79,300,458) 3,117,319,629Less Accumulated Depreciation for:
Buildings and Improvements 255,427,102 20,656,089 (677,618) 275,405,573Equipment 217,529,744 24,026,278 (17,149,533) 224,406,489Infrastructure 497,307,691 24,849,650 522,157,341
Total Accumulated Depreciation 970,264,537 69,532,017 (17,827,151) 1,021,969,403Governmental Activities Capital Assets, Net 2,085,549,257$ 71,274,276$ (61,473,307)$ 2,095,350,226$
Depreciation expense was charged to governmental purposes as follows:Elected and Official 143,650$ Public Safety and Justice Services 7,093,670 Community Enrichment and Development 54,507,752 Support Services 6,579,713 Non-Departmental 1,207,232
Total Depreciation Expense 69,532,017$
Business-Type Activities:Non-depreciated Assets
Land 70,534,092$ 148,200$ (48,363)$ 70,633,929$ Construction-in-Progress 155,897,367 55,573,424 (79,289,481) 132,181,310 Water Rights 52,126,968 52,126,968
Capital Assets being Depreciated:Buildings and Improvements 224,996,737 10,822,153 (6,428) 235,812,462 Equipment 82,689,672 11,099,450 (6,425,227) 87,363,895 Distribution and Collection Systems 1,349,479,304 58,217,010 (1,155,622) 1,406,540,692 Goodwill 1,187,338 1,187,338
Totals at Historical Cost 1,936,911,478 135,860,237 (86,925,121) 1,985,846,594 Less Accumulated Depreciation for:
Buildings and Improvements 123,174,617 5,769,486 128,944,103 Equipment 59,556,993 7,803,414 (6,507,037) 60,853,370 Distribution and Collective Systems 406,290,600 27,297,437 433,588,037 Goodwill 1,187,338 1,187,338
Total Accumulated Depreciation 590,209,548 40,870,337 (6,507,037) 624,572,848 Business-Type Activities Capital Assets, Net 1,346,701,930$ 94,989,900$ (80,418,084)$ 1,361,273,746$
53
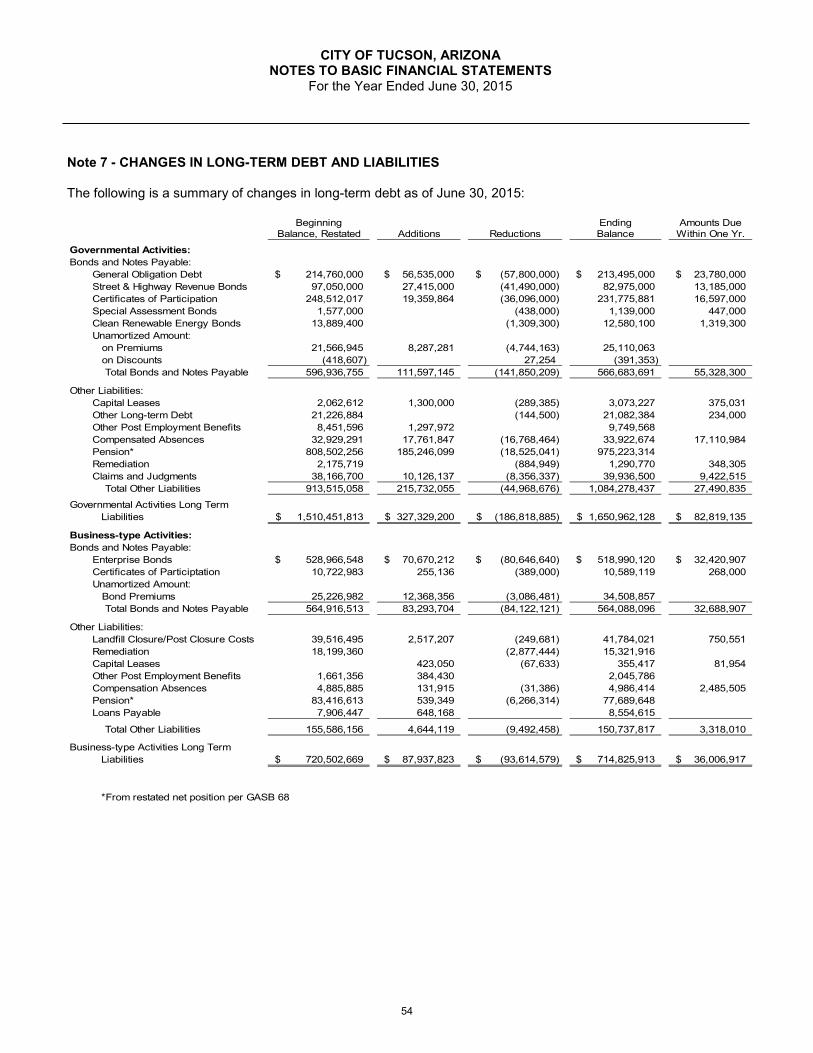
CITY OF TUCSON, ARIZONA NOTES TO BASIC FINANCIAL STATEMENTS
For the Year Ended June 30, 2015
Note 7 - CHANGES IN LONG-TERM DEBT AND LIABILITIES
The following is a summary of changes in long-term debt as of June 30, 2015:
Beginning Ending Amounts DueBalance, Restated Additions Reductions Balance Within One Yr.
Governmental Activities:Bonds and Notes Payable:
General Obligation Debt 214,760,000$ 56,535,000$ (57,800,000)$ 213,495,000$ 23,780,000$ Street & Highway Revenue Bonds 97,050,000 27,415,000 (41,490,000) 82,975,000 13,185,000 Certificates of Participation 248,512,017 19,359,864 (36,096,000) 231,775,881 16,597,000 Special Assessment Bonds 1,577,000 (438,000) 1,139,000 447,000 Clean Renewable Energy Bonds 13,889,400 (1,309,300) 12,580,100 1,319,300 Unamortized Amount: on Premiums 21,566,945 8,287,281 (4,744,163) 25,110,063 on Discounts (418,607) 27,254 (391,353) Total Bonds and Notes Payable 596,936,755 111,597,145 (141,850,209) 566,683,691 55,328,300
Other Liabilities:Capital Leases 2,062,612 1,300,000 (289,385) 3,073,227 375,031 Other Long-term Debt 21,226,884 (144,500) 21,082,384 234,000 Other Post Employment Benefits 8,451,596 1,297,972 9,749,568 Compensated Absences 32,929,291 17,761,847 (16,768,464) 33,922,674 17,110,984 Pension* 808,502,256 185,246,099 (18,525,041) 975,223,314 Remediation 2,175,719 (884,949) 1,290,770 348,305 Claims and Judgments 38,166,700 10,126,137 (8,356,337) 39,936,500 9,422,515 Total Other Liabilities 913,515,058 215,732,055 (44,968,676) 1,084,278,437 27,490,835
Governmental Activities Long TermLiabilities 1,510,451,813$ 327,329,200$ (186,818,885)$ 1,650,962,128$ 82,819,135$
Business-type Activities:Bonds and Notes Payable:
Enterprise Bonds 528,966,548$ 70,670,212$ (80,646,640)$ 518,990,120$ 32,420,907$ Certificates of Participtation 10,722,983 255,136 (389,000) 10,589,119 268,000 Unamortized Amount: Bond Premiums 25,226,982 12,368,356 (3,086,481) 34,508,857 Total Bonds and Notes Payable 564,916,513 83,293,704 (84,122,121) 564,088,096 32,688,907
Other Liabilities:Landfill Closure/Post Closure Costs 39,516,495 2,517,207 (249,681) 41,784,021 750,551 Remediation 18,199,360 (2,877,444) 15,321,916 Capital Leases 423,050 (67,633) 355,417 81,954 Other Post Employment Benefits 1,661,356 384,430 2,045,786 Compensation Absences 4,885,885 131,915 (31,386) 4,986,414 2,485,505 Pension* 83,416,613 539,349 (6,266,314) 77,689,648 Loans Payable 7,906,447 648,168 8,554,615
Total Other Liabilities 155,586,156 4,644,119 (9,492,458) 150,737,817 3,318,010
Business-type Activities Long TermLiabilities 720,502,669$ 87,937,823$ (93,614,579)$ 714,825,913$ 36,006,917$
*From restated net position per GASB 68
54

CITY OF TUCSON, ARIZONA NOTES TO BASIC FINANCIAL STATEMENTS
For the Year Ended June 30, 2015
Note 8 - LEASE OBLIGATIONS
A. Certificates of Participation/Capital Leases
The City has entered into several long-term capital leases involving the acquisition of real estate and equipment for general city purposes; these commitments are expected to be funded by the City's General, Special Revenue and Internal Service Funds.
Below is a schedule by years of future minimum lease payments as of June 30, 2015:
Governmental Business-TypeYears ending June 30, Activites Activites2016 28,073,787$ 846,685$ 2017 27,808,272 847,428 2018 28,157,500 792,521 2019 28,158,663 786,370 2020 26,580,061 1,112,941 2021-2025 115,024,559 6,578,343 2026-2030 61,385,445 4,517,425 2031-2034 6,786,594Total Minimum Lease Payments 321,974,881 15,481,713 Less: Amount Representing Interest (interest rates range: 1.101% to 6.52%) 87,125,773 4,537,177 Total Less Interest 234,849,108$ 10,944,536$
Assets purchased through capital leases for Governmental Activities include buildings ($161,951,065), improvements other than buildings ($21,235,088), equipment ($19,739,899), and streets ($65,193,265).
Assets purchased through capital leases for Business-Type Activities include equipment ($4,669,050).
B. Operating Leases
Operating lease expenditures for the fiscal year were $2,442,331. Minimum future lease payments on non-cancelable operating leases for Governmental Activities at June 30, 2015, were as follows:
Years ending June 30, 2016 2,429,201$ 2017 1,884,505 2018 1,876,924 2019 1,580,763 2020 1,517,065 2021-2025 6,869,544 2026-2030 469,299 2031-2035 465,723 2036-2040 455,214 2041-2045 466,595 2046-2050 478,259 Total Minimum Future Lease Payments 18,493,092$
55

CITY OF TUCSON, ARIZONA NOTES TO BASIC FINANCIAL STATEMENTS
For the Year Ended June 30, 2015
Note 9 - BOND ISSUES
A. Governmental Funds
General Obligation Bonds provide funds for construction of police and fire facilities, street maintenance, lighting and sidewalk improvements, drainage system improvements, environmental safety improvements, parks improvements and the payment of costs relating to the issuance of the bonds. Debt service payments are scheduled semi-annually from July 1, 2015 to July 1, 2027. General Obligation Bonds are payable from property taxes.
Street and Highway User Revenue Bonds provide funds to improve, construct and reconstruct streets and highways in the City, to acquire rights-of-way for such purposes by purchase, condemnation or otherwise, and to pay costs relating to the issuance of the bonds. Debt service payments are scheduled semi-annually from July 1, 2015 to July 1, 2022. All Street and Highway Revenue Bonds are payable from state motor vehicle fuel taxes.
At June 30, 2015 bonds payable were:
Interest Maturity Original Par Balance OutstandingSeries Rates Date Amount June 30, 20151994 Series C (1997) 7.00 2016 10,510,000$ 1,000,000$ 1998 Refunding 5.38-5.50 2021 26,470,000 22,505,000 2000 Series B (2001) 5.75 2016 26,680,000 2,000,000 2003 Refunding 3.60 2016 22,465,000 145,000 2000-E Series (2005) 3.75 2016 25,815,000 4,000,000 2006 Series Refunding 4.00-5.00 2021 50,525,000 49,525,000 2007 Series Refunding 5.00 2019 19,190,000 15,140,000 2000-F Series (2007) 4.00-5.00 2023 13,325,000 4,575,000 2012-A Series Refunding 3.00-5.00 2021 11,745,000 11,745,000 2012-B Series Refunding 1.49-3.22 2020 11,315,000 6,325,000 2012-A Series (2013) 4.00-5.00 2026 20,000,000 20,000,000 2012-B Series (2014) 3.00-5.00 2027 20,000,000 20,000,000 2012-C Series (2015) 2.00-3.00 2023 20,000,000 20,000,000 2015 Series Refunding 2.00-5.00 2023 36,535,000 36,535,000 Total 314,575,000$ 213,495,000$
General Obligation Bonds Issued and Outstanding
Interest Maturity Original Par Balance OutstandingSeries Rates Date Amount June 30, 2015
2000-D Series (2005) 5.00 2016 6,000,000$ 250,000$ 2009 Refunding 5.00 2019 10,130,000 10,130,000 2010 Refunding 4.00-5.00 2020 10,560,000 10,560,000 2011 Refunding 5.00 2021 10,730,000 10,730,000 2013 Refunding 3.00-5.00 2022 34,500,000 23,890,000 2015 Series 3.00-5.00 2018 27,415,000 27,415,000 Total 99,335,000$ 82,975,000$
Street and Highway Issued and Outstanding
56

CITY OF TUCSON, ARIZONA NOTES TO BASIC FINANCIAL STATEMENTS
For the Year Ended June 30, 2015
Note 9 - BOND ISSUES (Continued)
B. Enterprise Funds
Water revenue bonds, obligations, and loans provide funds for the purpose of the acquisition and construction of water system improvements.
Interest Maturity Original Par Balance OutstandingSeries Rates Date Amount June 30, 2015
1994 Series A (1996) 6.00 - 8.00 2018 33,000,000$ 750,000$ 2009 Refunding 5.00 2019 2,815,000 2,305,0002007 Refunding 5.00 2021 31,460,000 30,605,0002005 Refunding 5.00 2022 55,110,000 6,430,0002006 Refunding 3.50 - 4.25 2024 85,460,000 80,950,0002005 Series A (2005) 3.50 - 4.45 2025 31,665,000 800,0002005 Series C (2008) 4.00 - 5.00 2026 20,425,000 4,625,000Water System Revenue Obligations 2009 5.00 2029 35,635,000 34,365,000Water System Revenue Obligations 2010 6.00 2030 38,510,000 38,510,000Water System Revenue Obligations 2011 2.75 - 5.00 2032 30,965,000 30,215,000Water System Revenue Obligations 2012 2.00 - 5.00 2033 31,555,000 28,485,0002012 Refunding Series A 4.00 - 5.00 2018 36,120,000 36,120,0002012 Refunding Series B .57 - 1.80 2016 14,635,000 550,0002013A Refunding 2.00 - 5.00 2025 34,280,000 24,700,0002013B Refunding .61 - 2.75 2022 18,825,000 18,650,000Water System Revenue Obligation, Series 2013 1.50 - 5.00 2030 21,065,000 20,565,000Water System Revenue Obligation, Series 2014 3.00 - 5.00 2033 35,630,000 35,630,0002015 Refunding 3.00 - 5.00 2032 46,640,000 46,640,000Water System Revenue Obligation, Series 2015 2.00 - 5.00 2033 20,570,000 20,570,000Jr Lien Water System Refunding Bond 2012 1.90 2021 15,245,000 9,225,0002003 Water Infrastructure Finance Authority (WIF4) 3.44 2022 8,300,000 3,691,2572004 Water Infrastructure Finance Authority (WIF5) 3.15 - 3.15 2023 3,000,000 1,480,1872004 Water Infrastructure Finance Authority (WIF6) 3.26 2023 2,500,000 1,246,0202005 Water Infrastructure Finance Authority (WIF7) 3.11 2024 2,997,000 1,636,7742006 Water Infrastructure Finance Authority (WIF8) 3.42 2026 2,500,000 1,579,0802006 Water Infrastructure Finance Authority (WIF9) 3.21 2026 2,000,000 1,253,4942007 Water Infrastructure Finance Authority (WIF10) 3.21 2026 6,500,000 4,073,9072008 Water Infrastructure Finance Authority (WIF11) 3.55 2027 17,800,000 12,122,5352009A Water Infrastructure Finance Authority (WIF13) 3.38 2028 2,500,000 1,894,8382009B Water Infrastructure Finance Authority (WIF12) 3.60 2028 1,000,000 726,9002010 Water Infrastructure Finance Authority (WIF14) 2.93 2030 2,750,000 1,928,4422011 Water Infrastructure Finance Authority (WIF15) 2.80 2031 16,000,000 13,135,3142012 Water Infrastructure Finance Authority (WIF16) 2.80 2032 4,000,000 3,531,372Total 711,457,000$ 518,990,120$
Water Utility Revenue Bonds Issued and Outstanding
57

CITY OF TUCSON, ARIZONA NOTES TO BASIC FINANCIAL STATEMENTS
For the Year Ended June 30, 2015
Note 9 - BOND ISSUES (Continued)
C. Special Assessments
The principal amount of the City’s special assessment debt outstanding at June 30, 2015 was $1,139,000 that is being retired with the proceeds from special assessments levied against benefited property owners. The City is obligated to repay the debt irrespective of the amount of special assessments collected from property owners. The fund balance of $1,300,773 in the Special Assessment Bond & Interest Fund at June 30, 2015 is restricted for the retirement of outstanding special assessment bonds.
D. Clean Renewable Energy Bonds (CREBS)
The City entered into lease agreements with Bank of America to issue the City CREBS to install additional solar panels on various City buildings. The bonds were issued under the Build America Bond program, with interest subsidized, partially or entirely, by the US Treasury. The bonds will mature on January 1, 2026.
E. Annual Principal and Interest Requirements
Following is a summary of debt service requirements to maturity, including principal and interest:
Governmental ActivitiesYears Ending General Obligation Street and Highway Special AssessmentJune 30, Principal Interest Principal Interest Principal Interest
2016 23,780,000$ 8,891,481$ 13,185,000$ 3,855,618$ 447,000$ 47,072$ 2017 25,655,000 7,825,596 13,610,000 3,400,250 399,000 25,125 2018 24,720,000 6,745,178 14,145,000 2,757,450 257,000 8,340 2019 26,380,000 5,740,486 10,130,000 2,090,250 36,000 946 2020 28,225,000 4,569,658 10,560,000 1,583,750 2021-2025 67,235,000 9,813,888 21,345,000 1,598,000 2026-2030 17,500,000 750,000 Totals 213,495,000$ 44,336,287$ 82,975,000$ 15,285,318$ 1,139,000$ 81,483$
Years EndingJune 30, Principal Interest Principal Interest
2016 1,319,300$ 471,866$ 32,420,907$ 22,150,662$ 2017 1,334,300 429,834 33,919,941 20,895,725 2018 1,349,300 387,092 34,812,527 19,664,751 2019 1,364,300 343,356 37,203,779 18,351,589 2020 1,379,300 298,910 38,633,818 16,942,780 2021-2025 5,388,600 794,632 181,079,341 60,590,091 2026-2030 445,000 12,638 123,927,142 25,257,907 2030-2033 36,992,665 2,865,949 Totals 12,580,100$ 2,738,328$ 518,990,120$ 186,719,454$
Clean Renewable Water UtilityEnergy Bonds Revenue Bonds
Business-type ActivitiesGovernmental Activities
58

CITY OF TUCSON, ARIZONA NOTES TO BASIC FINANCIAL STATEMENTS
For the Year Ended June 30, 2015
Note 10 - ADVANCE REFUNDING/DEFEASANCE OF DEBT On June 24, 2015, the City issued $19,615,000 in tax-exempt Certificates of Participation to refund and restructure the Series 2006 and 2006-A bonds and to pay costs associated with the issuance of the bonds. Interest rates on the refunding bonds range from 4% to 5% with maturity dates from July 1, 2018 to July 1, 2026. Debt service payments are scheduled semi-annually with amounts ranging from $932,894 to $4,238,100 (including interest). The City realized net present value savings of $1,077,494 over the life of the issuance, as a result of the refunding/restructuring. On June 17, 2015, the City issued $36,535,000 General Obligation Bonds to refund Series 2005A, 2005A Refunding, 2005B, 2005B Refunding and 2000-F (2007) bonds and to pay costs associated with the issuance of the bonds. Interest rates on the refunding bonds range from 2% to 5% with maturity dates from July 1, 2016 to July 1, 2023. Debt service payments are scheduled semi-annually with amounts ranging from $58,875 to $8,416,800 (including interest). The City realized net present value savings of $3,054,537 over the life of the issuance, as a result of the refunding. On June 17, 2015, the City issued $27,415,000 Senior Lien Street and Highway Bonds to refund Series 2005 and 2005 Refunding bonds and to pay costs associated with the issuance of the bonds. Interest rates on the refunding bonds range from 3% to 5% with maturity dates from July 1, 2016 to July 1, 2018. Debt service payments are scheduled semi-annually with amounts ranging from $253,500 to $10,393,500 (including interest). The City realized net present value savings of $2,007,567 over the life of the issuance, as a result of the refunding. On February 25, 2015 the City issued $46,640,000 Water System Revenue Refunding Bonds, Series 2015, to refund Water System Revenue Bonds, Series 2005-B (2007) and Water System Revenue Bonds, Series 2005-C (2008) and to pay costs related to the issuance of the bonds. The interest rates on the refunding bonds ranges from 3% to 5% with maturity dates from July 1, 2022 to July 1, 2032. Debt service payments are scheduled semi-annually at amounts ranging from $765,520 to $7,865,475 (including interest). The economic gain resulting from the refunded bonds is $5,507,973, based on the net present value from delivery date. The difference in cash flow requirements to service the prior debt of $80,508,188 and the cash flows to service the new debt of $73,376,220 is $7,131,968. Note 11 - LANDFILLS The U.S. Environmental Protection Agency ruling "Solid Waste Disposal Facility Criteria" requires the City to incur specified landfill closure and post-closure care costs. Closure requirements have been established for municipal landfills that received solid waste after October 9, 1991. Additional thirty-year post-closure monitoring and maintenance functions are required of landfills that accepted solid waste after October 9, 1993. Although closure and post-closure care costs will be paid only near or after the date that the landfill stops accepting waste, the City records a liability for these required costs based upon each landfill's percentage of capacity used through June 30, 2015. The total closure and post-closure cost estimates are based on what it would cost to perform those functions in 2015. Actual costs will likely vary due to inflation, changes in technology, or changes in regulations. In addition to the federal requirements discussed above, the City must comply with certain Federal/State requirements dealing with aquifer protection or clean-up. The recognition of this liability is also based on the percentage of landfill capacity used, and cost estimates are in current dollars.
59

CITY OF TUCSON, ARIZONA NOTES TO BASIC FINANCIAL STATEMENTS
For the Year Ended June 30, 2015
Note 11 - LANDFILLS (Continued)
Total liability for closure/post-closure costs, including aquifer protection and clean-up, is as follows:
Estimated Closure/Estimated Liability Post closure Cost Estimated
Closure/Post- Recognized to be Recognized RemainingLandfill Site Closure Costs* at 6/30/15 in Future Years Life in YearsLos Reales 93.9 % 34,663,000$ 32,552,021$ 2,110,978$ 30Harrison 100 % 4,113,000 4,113,000 Irvington 100 % 2,443,000 2,443,000 Mullins 100 % 2,676,000 2,676,000 Totals 43,895,000$ 41,784,021$ 2,110,978$
Used as of6/30/2015
Landfill Capacity
*Revised estimates of closure and post-closure costs are made annually.
Environmental Service’s ten year financial plan included amounts to meet future capital projects and long-term liabilities such as landfill closure and post-closure. Specific amounts within Environmental Service’s Net Position have been set aside to cover these costs. As of June 30, 2015, $11,146,600 was restricted for future capital projects and $7,894,247 was restricted for future landfill closure/post-closure needs.
The June 30, 2015, liability for closure and post-closure costs is $41,784,021 which represents the cumulative amount reported to date based on the estimated capacity of the landfills.
Note 12 – PENSION PLANS
The City contributes to the Tucson Supplemental Retirement System (TSRS), the Public Safety Personnel Retirement System (PSPRS), and the Elected Officials Retirement Plan (EORP). At June 30, 2015, the City reported the following aggregate amounts related to these pension plans:
Statement of Net Position and Statement of Activities
Governmental Activities
Business-Type Activities Total
Net pension liabilities 975,223,314$ 77,689,648$ 1,052,912,962$ Deferred outflows of resources 160,494,589 4,760,734 165,255,323 Deferred inflows of resources 42,855,035 8,222,764 51,077,799 Pension expense 118,812,806 7,175,428 125,988,234
A. Tucson Supplemental Retirement System Pension Plan
The Tucson Supplemental Retirement System (System or TSRS) plan is a single-employer defined benefit plan for City of Tucson (“City”) employees. It was established in the City Charter to provide its members with a supplement to the retirement and disability benefits of the social security system. The System is governed by a seven member Board of Trustees: a chairman who is appointed by the Mayor and Council, the City’s directors of Human Resources and of Finance, two members elected by the membership of the System, a retired member elected by the System’s retirees, and one member appointed by the City Manager. Benefit provisions and changes in benefits or funding are recommended by the Board of Trustees and must be approved by Mayor and Council.
The System covers substantially all City of Tucson, Arizona, employees, except for appointed officials and staff who may elect not to join, and commissioned police and fire personnel and elected officials, who are covered
60

CITY OF TUCSON, ARIZONA NOTES TO BASIC FINANCIAL STATEMENTS
For the Year Ended June 30, 2015
Note 12 – PENSION PLANS (Continued)
under other plans. Employees participate in the System immediately upon beginning employment with the City. Employee membership data as of June 30, 2015 is as follows:
Active plan members 2,665Inactive plan members (or their beneficiaries) currently receiving benefits 2,809Inactive plan members entitled to but not yet receiving benefits 328Total active plan participants 5,802
Active Plan Participants
Tier I benefit plan: Any employee hired prior to July 1, 2011, who has attained the earlier of age 62, or a combination of the employee’s age and years of creditable service equaling the sum of 80, is entitled to receive monthly retirement benefits calculated at 2.25% of average final monthly compensation multiplied by the number of years of creditable service. Employees hired after July 1, 2009 receive the same benefit, but are required to have a minimum of five years accrued service. Average final monthly compensation is defined as the highest compensation of 36 consecutive months during the 120 months immediately preceding retirement. Accrued unused sick leave and vacation leave at the final salary is included in the member’s service period and is substituted for an equal number of hours at the beginning of the 36 month period for determining the average final salary calculation.
Tier II benefit plan: Any employee hired after June 30, 2011, who has attained the minimum retirement age of age 60, and who also has a combination of employee age and years of service equaling the sum of 85, is entitled to receive monthly retirement benefits calculated at 2.00% of average final monthly compensation multiplied by the number of years of creditable service. Average final monthly compensation is defined as the highest compensation of 60 consecutive months during the 120 months immediately preceding retirement. Accrued unused sick leave and vacation leave at the final salary is not included for member service credits or as a substitution for an equal number of hours at the beginning of the 60 month period final average salary calculation.
An employee who retires after attaining age 55 with 20 or more years of creditable service under Tier I; or after attaining age 60 with 20 or more years of credited service under Tier II, is entitled to early retirement benefits reduced to the actuarial equivalent of the amount to which the employee would have been entitled upon attaining normal retirement.
An employee is always fully vested in his/her individual contributions. Upon termination of employment for reasons other than retirement, employees having five or more years of creditable service (terminated vested participants) may leave their contributions in the System as a deferred retirement, and begin drawing a retirement allowance when they reach either their normal or early retirement eligibility date.
Employees with ten or more years of creditable service, who are not yet eligible to retire and who have a total and permanent disability may apply for disability retirement.
The beneficiary of an employee who pre-selected a retirement option and died while eligible to retire, shall receive a benefit based upon the selected option if the member has made such an election by June 30, 2009.
The spousal beneficiary of an employee who died while eligible to receive benefits but who had not pre-selected a benefit option by June 30, 2009, may choose to receive a benefit equal to a 100% joint and survivor annuity based on the member’s years of credited service and average final monthly compensation at the time of the
61
CITY OF TUCSON, ARIZONA NOTES TO BASIC FINANCIAL STATEMENTS
For the Year Ended June 30, 2015
Note 12 – PENSION PLANS (Continued)
member’s death, or may elect to receive a lump sum payment of twice the members account balance plus interest, measured on the date of death.
The named beneficiary of an employee who is other than the spouse of the employee who died while eligible to receive benefits but who had not pre-selected a benefit option by June 30, 2009, may choose to receive a benefit equal to a 15 year term certain benefit to the named beneficiary, or the beneficiary may elect to receive a lump sum payment of twice the members account balance plus interest, measured on the date of death.
Multiple designated beneficiaries of an employee who died while eligible to receive benefits but who had not pre-selected a benefit option by June 30, 2009, receive a lump sum payment of twice the members account balance plus interest, measured on the date of death.
The beneficiary of an employee who was not eligible for any retirement benefits, but had more than five years of creditable service, may receive a lump sum payment of twice the member account balance plus interest, measured on the date of death.
Employee Contributions - Employee contributions are 5% of active member covered payroll for employees hired prior to July 1, 2006. Employees hired after June 30, 2006 contribute an amount equal to 40% of the actuarially required contribution rate determined annually by the system actuary. All member contributions are made by payroll deductions applied to regular pay, based on the approved contribution rates established by the system actuary, applied as a percent of payroll.
Effective July 1, 2013, the funding policy changed for employees hired after June 30, 2006; requiring a contribution rate that is equal to a range of between 50% and 100% of the normal cost of the members benefit Tier. For Tier I members (hired between July 1, 2006 and June 30, 2011), the contribution rate is 6.715%. For Tier II members (hired after July 1, 2011), the contribution rate is 5.06%. A reserve is established for contributions and earnings allocations, less amounts transferred to the reserve for retirement benefits which includes retirement and disability and amounts reserved for terminated employees. If an employee leaves covered employment before attaining five years’ service credit, the accumulated contributions plus interest are refunded to the employee or his designated beneficiary. There are no long-term contracts for employee contributions to the plan, and all contributions are made on a bi-weekly basis.
Employer Contributions – Employer contributions are based on the annual required contribution rate determined by the Actuary, and are equal to the difference between the recommended total contribution rate and the employee rates, based on a level percentage of payroll method. The contribution rate is determined by the actuary at a level necessary to finance employee participation in the System and to fund the costs of administering the System. The annual rate determined by the Actuary is recommended to the Board of Trustees and considered for approval and adoption. There are no long-term contracts for employer contributions to the plan, and all contributions are made on a bi-weekly basis.
Two general types of net position reserves are maintained within the System. The Reserve for Employee Contributions contains the employee contributions for all contributing members of the System, plus allocated interest earnings. At the time an employee retires or defers retirement, the actuarial value of the individual’s retirement benefits is transferred to the Reserve for Retirement Benefits, which is decreased by payments to retirees and increased by interest earnings. The reserves are fully funded.
Earnings of the System are allocated semi-annually (at June 30 and December 31) to the reserves which comprise net position. At the year ended June 30, 2015, allocations were based on rates of return of 6.00% per annum. Any unallocated earnings remain in unreserved net position.
62

CITY OF TUCSON, ARIZONA NOTES TO BASIC FINANCIAL STATEMENTS
For the Year Ended June 30, 2015
Note 12 – PENSION PLANS (Continued)
The net position at June 30, 2015, consisted of the following components:
Reserved for employee contributions 143,648,835$ Reserved for retirement benefits 661,292,061 Unreserved net position (deficit) (65,147,349) Net Position 739,793,547$
The System is governed by a Board of Trustees. The Board of Trustees is required by City Code in making investment decisions, to exercise the judgment and care under the circumstances then prevailing which persons of ordinary prudence, discretion and intelligence exercise in management of their own affairs, not in regard to speculation, but in regard to the permanent disposition of their funds, considering the probable income there from, as well as the probable safety of the capital. Investments of the System are held separately from those of other City funds by investment custodians. Quoted market prices have been used to value investments as of June 30, 2015.
For those investments that do not have established market exchanges, the fair value is estimated as objectively as possible by third party appraisals. Real Estate and Infrastructure investment managers utilize third party appraisals to determine fair market value of assets under investment. Infrastructure investments pertain to forms of “real” property used for general public purposes that typically involve partnerships between governmental and private entities. Examples of infrastructure investments are toll roads, bridges, pipelines, airports, shipping ports, etc. The System currently participates in two pooled infrastructure funds as well as three real estate funds.
These investments are either held by the System or its agent in the System’s name and are insured, registered or collateralized. A portion of these investments is subject to credit risk (including custodial credit risk and concentrations of credit risk), interest rate risk and/or foreign currency risk. The Government Accounting Standards Board (GASB) Statement 40 requires the System to disclose such risks which are all discussed in the sections that follow.
All System investments are reflected in the following schedule with the exception of amounts held in the City’s investment pool account and certain deposits of $111,680. The City maintains an investment pool account for City funds. Bi-weekly contributions for the Tucson Supplemental Retirement System are held in the City’s investment pool account and are used to pay recurring expenditures. The $2,567,105 cash balance in the investment pool account, as well as, current deposits to the City’s investment pool account are invested in money market funds consisting of U.S. Treasuries and Agencies and separately held issues of federal agency and U.S. corporate bonds with ratings no lower than A2 as reported by Moody’s.
The components of the net pension liability at June 30, 2015 are as follows:
Total Pension Liability $ 1,021,377,564Plan's Fiduciary Net Position 739,793,547 Net Pension Liability $ 281,584,017
Plan Fiduciary Net Position as aPercentage of Total Pension Liability 72.43%
63

CITY OF TUCSON, ARIZONA NOTES TO BASIC FINANCIAL STATEMENTS
For the Year Ended June 30, 2015
Note 12 – PENSION PLANS (Continued)
Pension Expense and Deferred Outflows/Inflows of Resources—For the year ended June 30, 2015, the City recognized pension expense for TSRS of $22,163,305. At June 30, 2015 the City reported deferred outflows of resources and deferred inflows of resources related to pensions from the following sources:
Deferred Outflows of Resources
Deferred Inflows of Resources
Differences between expected and actual experience $ $ 5,968,431 Assumption changes 23,834,757 Net Difference between projected and actual earnings
on pension plan investments 17,255,153 Total $ 17,255,153 $ 29,803,188 Amounts reported as deferred outflows of resources and deferred inflows of resources related to the TSRS will be recognized in pension expense as follows: Year ended June 30
2016 (4,908,351)$ 2017 (4,908,351) 2018 (4,908,351) 2019 2,177,018 2020
Total (12,548,035)$ The actuarial assumptions used in the June 30, 2015 valuation covering the plan year July 1, 2014 through June 30, 2015 are as follows:
Actuarial Cost Method Entry Age NormalAmortization Method Level Percentage of Payroll, OpenRemaining Amortization Period 20 yearsAsset Valuation Method 5 year smoothed marketInflation 3.00%Salary Increases 3.00% to 6.50% including inflationInvestment Rate of Return 7.25%Retirement Age Age-based table of rates that are specific to the type of
eligibility condition. Last updated for the 2009 valuation pursuant to an experience study of the period 2009-2013.
Mortality Pre and Post-retirement: RP-2000 Combined Mortality Table for males and females projected with Scale BB to 2020.Disabled retirement: RP-2000 Disabled Mortality Table for males and Females.
64

CITY OF TUCSON, ARIZONA NOTES TO BASIC FINANCIAL STATEMENTS
For the Year Ended June 30, 2015
Note 12 – PENSION PLANS (Continued)
The long-term expected rate of return on pension plan investments was determined using a building-block method which best estimates ranges of expected future real rates of return, (expected returns, net of pension plan investment expense and inflation), are developed for each major asset class. These ranges are combined to produce the long-term expected rate of return by weighting the expected future real rates of return by the target asset allocation percentage and by adding expected inflation. Best estimates of arithmetic real rates of return were adopted by the plan’s trustees after considering input from the plan’s investment consultant(s) and actuary. The major asset class allocation is listed below for June 30, 2015:
Expected Return
Asset Class Target ArithmeticLarge Cap Equities 36% 8.90%Small/Mid Cap Equities 10% 10.15%International Equities 15% 9.25%Fixed Income 26% 3.05%Real Estate 8% 7.35%Infrastructure 5% 8.90%Total 100%Average Arithmetic Return 7.43%
The discount rate is used in the measurement of the Total Pension Liability. This rate considers the ability of the fund to meet benefit obligation in the future. To make this determination, employer contributions, employee contribution, benefit payments, expenses and investment returns are projected into the future. The Plan Net Position (assets) in future years can then be determined and compared to its obligation to make benefit payments in those years. As long as assets are projected to be on hand in a future year, the assumed valuation discount rate is used. In years where assets are not projected to be sufficient to meet benefit payments, the use of a “risk free” rate is required as described below.
Projected benefit payments are required to be discounted to their actuarial present values using a single discount rate that reflects a long-term expected rate of return on pension plan investments (to the extent that the plan’s fiduciary net position is projected to be sufficient to pay benefits) and tax-exempt municipal bond rate base on an index of 20-year general obligation bonds with an average AA credit rating as of the measurement date (to the extent that the contribution for use with the long-term expected rate of return are not met).For this valuation, the expected rate of return on pension plan investments is 7.25%; the municipal bond rate is 3.8%; and the resulting single discount rate is 7.25%. The following provides the sensitivity of the net pension liability to changes in the discount rate. The information below presents the plan’s net pension liability. It is calculated using a single discount rate that is 1-percentage-point lower or 1-percentage-point higher than the single discount rate:
1% Decrease Current
Discount Rate 1% Increase6.25% 7.25% 8.25%
Net Pension Liability 387,785,524$ 281,584,017$ 192,147,703$
TSRS did not hold investments (other than those explicitly guaranteed by the U.S. Government) in any one organization that represent 5% or more of the Plan’s fiduciary net position at June 30, 2015.
65

CITY OF TUCSON, ARIZONA NOTES TO BASIC FINANCIAL STATEMENTS
For the Year Ended June 30, 2015
Note 12 – PENSION PLANS (Continued)
For the year ended June 30, 2015, the annual money-weighted rate of return on the Plan’s investments, net of pension plan investment expenses, was 4.17%. The money-weighted rate of return expresses investment performance, net of investment expense, adjusted for the changing amounts actually invested.
B. Public Safety Personnel Retirement System
Plan description—City public safety employees (Tucson Police and Tucson Fire) who are regularly assigned hazardous duty participate in the Public Safety Personnel Retirement System (PSPRS). The PSPRS administers an agent multiple-employer defined benefit pension plan and an agent multiple-employer defined benefit health insurance premium benefit (OPEB) plan (agent plans). A seven-member board known as the Board of Trustees and the participating local boards govern the PSPRS according to the provisions of A.R.S. Title 38, Chapter 5, Article 4. The PSPRS issues publicly available financial reports that include financial statements and required supplementary information. Financial statements are issued by PSPRS and are available online at www.psprs.com. Benefits provided—The PSPRS provides retirement, health insurance premium supplement, disability, and survivor benefits. State statute establishes benefit terms. Retirement, disability, and survivor benefits are calculated on the basis of age, average monthly compensation, and service credit as follows:
Before January 1, 2012 On or after January 1, 2012
Retirement and Disability
Years of service and age required to receive benefit
20 years any age 15 years age 62
25 years and age 52.5
Final average salary is based on
Highest 36 months of last 20 years
Highest 60 months of last 20 years
Benefit percent
Normal Retirement 50% less 2.0% for each year of credited service less than 20 years OR plus 2.0% to 2.5% for each year of credited service over 20 years, not to exceed 80%
2.5% per year of credited service, not to exceed 80%
Accidental Disability Retirement
Catastrophic Disability Retirement
Ordinary Disability Retirement
Survivor Benefit
Retired Members
Active Members
50% or normal retirement, whichever is greater
90% for the first 60 months then reduced to either 62.5% or normal retirement, whichever is greater
Normal retirement calculated with actual years of credited service or 20 years of credited service, whichever is greater, multiplied by years of
credited service (not to exceed 20 years) divided by 20
80% of accidental disability retirement benefit or 100% of average monthly compensation if death was the result of injuries received on the job
80% of retired member’s pension benefit
66
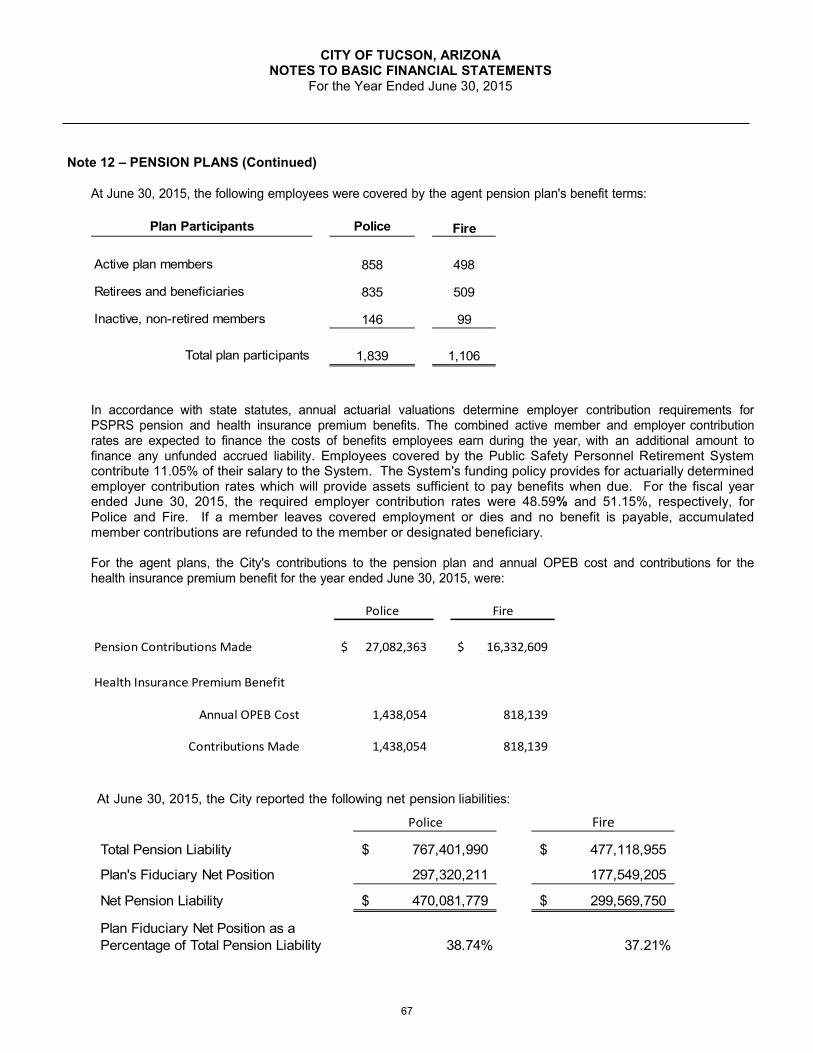
CITY OF TUCSON, ARIZONA NOTES TO BASIC FINANCIAL STATEMENTS
For the Year Ended June 30, 2015
Note 12 – PENSION PLANS (Continued)
At June 30, 2015, the following employees were covered by the agent pension plan's benefit terms:
Plan Participants Police Fire
Active plan members 858 498
Retirees and beneficiaries 835 509
Inactive, non-retired members 146 99
Total plan participants 1,839 1,106
In accordance with state statutes, annual actuarial valuations determine employer contribution requirements for PSPRS pension and health insurance premium benefits. The combined active member and employer contribution rates are expected to finance the costs of benefits employees earn during the year, with an additional amount to finance any unfunded accrued liability. Employees covered by the Public Safety Personnel Retirement System contribute 11.05% of their salary to the System. The System's funding policy provides for actuarially determined employer contribution rates which will provide assets sufficient to pay benefits when due. For the fiscal year ended June 30, 2015, the required employer contribution rates were 48.59% and 51.15%, respectively, for Police and Fire. If a member leaves covered employment or dies and no benefit is payable, accumulated member contributions are refunded to the member or designated beneficiary. For the agent plans, the City's contributions to the pension plan and annual OPEB cost and contributions for the health insurance premium benefit for the year ended June 30, 2015, were:
Police Fire
Pension Contributions Made 27,082,363$ 16,332,609$
Health Insurance Premium Benefit
Annual OPEB Cost 1,438,054 818,139
Contributions Made 1,438,054 818,139
At June 30, 2015, the City reported the following net pension liabilities:
Police Fire
Total Pension Liability 767,401,990$ 477,118,955$
Plan's Fiduciary Net Position 297,320,211 177,549,205
Net Pension Liability 470,081,779$ 299,569,750$
Plan Fiduciary Net Position as aPercentage of Total Pension Liability 38.74% 37.21%
67

CITY OF TUCSON, ARIZONA NOTES TO BASIC FINANCIAL STATEMENTS
For the Year Ended June 30, 2015
Note 12 – PENSION PLANS (Continued)
The net pension liabilities were measured as of June 30, 2014, and the total pension liability used to calculate the net pension liability was determined by an actuarial valuation as of that date.
The significant actuarial assumptions used to measure the total pension liability are as follows:
Actuarial Valuation Date June 30, 2014
Actuarial Cost Method Individual Entry Age Normal
Amortization Method Level Percentage of Payroll, Closed
Remaining Amortization Period 21 Years
Asset Valuation Method 7-Year smoothed market; 80%/120% corridor
Price Inflation 4.0%; No explicit price inflation assumption is used in this valuation.
Salary Increases 4.00% to 8.00% including inflation
Investment Rate of Return 7.85%, net of investment and administrative expenses
Retirement Age Experience-based table of rates that is specific to the type of eligibility condition.
Mortality RP-2000 mortality table projected to 2015 using projection scale AA (adjusted by 105% for both males and females).
Actuarial assumptions used in the June 30, 2014 valuation were based on the results of an actuarial experience study for the 5-year period ended June 30, 2011.
The long-term expected rate of return on PSPRS pension plan investments was determined to be 7.85 percent using a building-block method in which best-estimate ranges of expected future real rates of return (expected returns, net of pension plan investment expenses and inflation) are developed for each major asset class. The target allocation and best estimates of geometric real rates of return for each major asset class are summarized in the table on the next page:
68

CITY OF TUCSON, ARIZONA NOTES TO BASIC FINANCIAL STATEMENTS
For the Year Ended June 30, 2015
Note 12 – PENSION PLANS (Continued)
Asset Class Target AllocationLong-term Expected Real Rate of Return
U.S. Equity 16.00% 7.60%Non-U.S. Equity 14.00% 8.63%Private Equity 11.00% 9.50%Fixed Income 7.00% 4.75%Credit Opportunities 13.00% 8.00%Absolute Return 4.00% 6.75%GTAA 10.00% 5.73%Real Assets 8.00% 5.96%Real Estate 11.00% 6.50%Risk Parity 4.00% 6.04%Short Term Investments 2.00% 3.25%Total 100.00%
The projection of cash flows used to determine the PSPRS discount rates assumed that plan member contributions will be made at the current contribution rate and that employer contributions will be made at rates equal to the difference between the actuarially determined contribution rate and the member rate. Based on those assumptions, the pension plan's fiduciary net position was projected to be available to make all projected future benefit payments of current plan members. Therefore, the long-term expected rate of return on pension plan investments was applied to all periods of projected benefit payments to determine the total pension liability.
The Changes in the Net Pension Liability (next page):
69

CITY OF TUCSON, ARIZONA NOTES TO BASIC FINANCIAL STATEMENTS
For the Year Ended June 30, 2015
Note 12 – PENSION PLANS (Continued)
Tucson Police Total Pension Plan Fiduciary Net PensionLiability Net Position Liability
(a) (b) (a) - (b)Balances at June 30, 2014 651,957,100$ 288,161,213$ 363,795,887$
Changes for the year:Service cost 11,720,855 11,720,855 Interest on the total pension liability 49,886,649 49,886,649 Changes of benefit terms 17,350,937 17,350,937 Differences between the expected and
actual experience in the measurement (1,845,566) (1,845,566) of the pension liability
Changes of assumptions 82,969,636 82,969,636 Contributions--employer 25,050,303 (25,050,303) Contributions--employee 6,411,220 (6,411,220) Net investment income 36,646,985 (36,646,985) Benefits payments, including refunds of
employee contributions (44,637,621) (44,637,621) Other changes (Net transfer) (14,311,889) 14,311,889
Net changes 115,444,890$ 9,158,998$ 106,285,892$
Balances at June 30, 2015 767,401,990$ 297,320,211$ 470,081,779$
Increase (Decrease)
Tucson Fire Total Pension Plan Fiduciary Net PensionLiability Net Position Liability
(a) (b) (a) - (b)Balances at June 30, 2014 413,654,974$ 174,841,394$ 238,813,580$
Changes for the year:Service cost 7,175,895 7,175,895 Interest on the total pension liability 31,594,819 31,594,819 Changes of benefit terms 9,902,338 9,902,338 Differences between the expected and
actual experience in the measurementof the pension liability 99,733 99,733
Changes of assumptions 44,213,488 44,213,488 Contributions--employer 15,972,870 (15,972,870) Contributions--employee 3,849,878 (3,849,878) Net investment income 22,057,153 (22,057,153) Benefits payments, including refunds of (29,522,292) (29,522,292)
employee contributionsOther changes (9,649,798) 9,649,798
Net changes 63,463,981$ 2,707,811$ 60,756,170$
Balances at June 30, 2015 477,118,955$ 177,549,205$ 299,569,750$
Increase (Decrease)
70

CITY OF TUCSON, ARIZONA NOTES TO BASIC FINANCIAL STATEMENTS
For the Year Ended June 30, 2015
Note 12 – PENSION PLANS (Continued)
Sensitivity of the City's Net Pension Liability to Changes in the Discount Rate— The following table presents the City's net pension liabilities calculated using the discount rates noted above, as well as what the City’s net pension liability would be if it were calculated using a discount rate that is 1 percentage point lower or 1 percentage point higher than the current rate:
1% Decrease Current
Discount Rate 1% Increase
Tucson PoliceRate 6.85% 7.85% 8.85%Net Pension liability 555,526,068$ 470,081,779$ 398,399,039$
Tucson FireRate 6.85% 7.85% 8.85%Net Pension liability 350,348,355$ 299,569,750$ 256,721,791$
Pension Plan Fiduciary Net Position—Detailed information about the pension plan's fiduciary net position is available in the separately issued PSPRS financial reports.
Pension Expense—For the year ended June 30, 2015, the City recognized $58,105,894 in PSPRS pension expense.
Pension Deferred Outflows/Inflows of Resources—At June 30, 2015, the City reported deferred outflows of resources and deferred inflows of resources related to pensions from the following sources:
Tucson PoliceDeferred Outflows of
ResourcesDeferred Inflows of
Resources
Differences between expected and actual experience $ $ 1,503,027 Assumption changes 67,570,383 Net Difference between projected and actual earnings
on pension plan investments 12,084,186 City contributions subsequent to measurement date 27,082,363 Total $ 94,652,746 $ 13,587,213
Tucson FireDeferred Outflows of
ResourcesDeferred Inflows of
Resources
Differences between expected and actual experience $ 82,136 $Assumption changes 36,412,393 Net Difference between projected and actual earnings
on pension plan investments 7,273,252 City contributions subsequent to measurement date 16,332,609 Total $ 52,827,138 $ 7,273,252
71

CITY OF TUCSON, ARIZONA NOTES TO BASIC FINANCIAL STATEMENTS
For the Year Ended June 30, 2015
Note 12 – PENSION PLANS (Continued)
The amounts reported as deferred outflows of resources related to pensions resulting from City contributions subsequent to the measurement date will be recognized as a reduction of the net pension liability (or an increase in the net pension asset) in the year ended June 30, 2016. Other amounts reported as deferred outflows of resources and deferred inflows of resources related to pensions will be recognized in pension expense as follows:
Tucson TucsonPolice Fire
Year ended June 30
2016 12,035,667$ 6,000,379$ 2017 12,035,667 6,000,379 2018 12,035,667 6,000,379 2019 12,035,667 6,000,379 2020 5,840,502 5,219,761
Total 53,983,170$ 29,221,277$
C. Elected Officials Retirement Plan
Plan Description—Elected officials and judges participate in the Elected Officials Retirement Plan (EORP). EORP administers a cost-sharing multiple-employer defined benefit pension plan and a cost-sharing multiple-employer defined benefit health insurance premium benefit (OPEB) plan for elected officials and judges who were members of the plan on December 31, 2013. This plan was closed to new members as of January 1, 2014. The PSPRS Board of Trustees governs the EORP according to the provisions of A.R.S. Title 38, Chapter 5, Article 3. The EORP issues a publicly available financial report that includes its financial statements and required supplementary information. The report is available on PSPRS’s Web site at www.psprs.com.
Benefits Provided—The EORP provides retirement, health insurance premium supplement, disability, and survivor benefits. State statute establishes benefits terms. Retirement, disability, and survivor benefits are calculated on the basis of age, average yearly compensation, and service credit as follows on the next page:
72

CITY OF TUCSON, ARIZONA NOTES TO BASIC FINANCIAL STATEMENTS
For the Year Ended June 30, 2015
Note 12 – PENSION PLANS (Continued)
Before January 1, 2012
On or after January 1, 2012
Retirement and Disability
Years of service and age required to receive benefit
20 years any age 10 years age 62 5 years and age 65 5 years any age* any years and age if disabled
10 years age 62 5 years and age 65 Any years and age if disabled
Final average salary is based on
Highest 36 months of last 10 years Highest 60 months of last 10 years
Benefit percent
Normal Retirement
4% per year of service, not to exceed 80%
3% per year of service, not to exceed 75%
Disability Retirement 80% with 10 or more years of service 40 % with 5 to 10 years of service 20% with less than 5 years of service
75% with 10 or more years of service 37.5% with 5 to 10 years of service 18.75% with less than 5 years of service
Survivor Benefit
Retired Members 75% of retired member's benefit 50% of retired member's benefit Active Members and Other Inactive Members
75% of disability retirement benefit 50% of disability retirement benefit
*With reduced benefits of 0.25% for each month early retirement precedes the member's normal retirement age, with a maximum reduction of 30%.
Retirement and survivor benefits are subject to automatic cost-of-living adjustments based on excess investment earnings.
Contributions—State statutes establish active member and employer contribution requirements. Statute also appropriates $5 million annually through fiscal year 2043 for the EORP from the State of Arizona to supplement the normal cost plus an amount to amortize the unfunded accrued liability and designates a portion of certain court fees for the EORP. For the year ended June 30, 2015, active EORP members were required by statute to contribute 13 percent of the members’ annual covered payroll, and the City was required to contribute 23.5 percent of active EORP members’ annual covered payroll. In addition, the City was required by statute to contribute 23.5 percent of annual covered payroll of retired members who worked for the City in positions that would typically be filled by an employee who contributes to the EORP. The City's contributions to the pension plan for the year ended June 30, 2015, were $43,829.
Pension Liability—At June 30, 2015, the City reported a liability for its proportionate share of the net pension liability of the EORP that reflected a reduction for the C i ty ’s proportionate share of the State’s appropriation for EORP. The
73

CITY OF TUCSON, ARIZONA NOTES TO BASIC FINANCIAL STATEMENTS
For the Year Ended June 30, 2015
Note 12 – PENSION PLANS (Continued)
amounts the City recognized as its proportionate share of the net pension liability, the related state support, and the total portion of the net pension liability that was associated with the City were as follows:
City's proportionate share of the EORPnet pension liability 1,732,465$
State's proportionate share of the EORPnet pension liability associated with
the City 531,189 Total 2,263,654$
The net pension liability was measured as of June 30, 2014, and the total pension liability used to calculate the net pension liability was determined by an actuarial valuation as of that date. In February 2014, the Arizona Supreme Court affirmed a Superior Court ruling that a 2011 law that changed the mechanism for funding permanent benefit increases was unconstitutional. As a result, for the June 30, 2014, actuarial valuation, the plan changed benefit terms to reflect the prior mechanism for funding permanent benefit increases and revised actuarial assumptions to explicitly value future permanent benefit increases.
The City's proportion of the net pension liability as of June 30, 2013 and 2014 was based on the City's actual contributions to the plan relative to the total of all participating employers’ actual contributions for the year ended June 30, 2014. The City's proportion measured as of June 30, 2013 and 2014 was 0.26%.
Pension expense and deferred outflows/inflows of resources—For the year ended June 30, 2015, the City recognized pension expense for EORP of $670,974 and revenue of $157,451 for the City's proportionate share of the State’s appropriation to EORP. At June 30, 2015, the County reported deferred outflows of resources and deferred inflows of resources related to pensions from the following sources:
Deferred Outflows of Resources
Deferred Inflows of Resources
Differences between expected and actual experience $ 7,612 $Assumption changes 468,845 Net Difference between projected and actual earnings 32,846
on pension plan investmentsCity contributions subsequent to measurement date 43,829 Total $ 520,286 $ 32,846
74
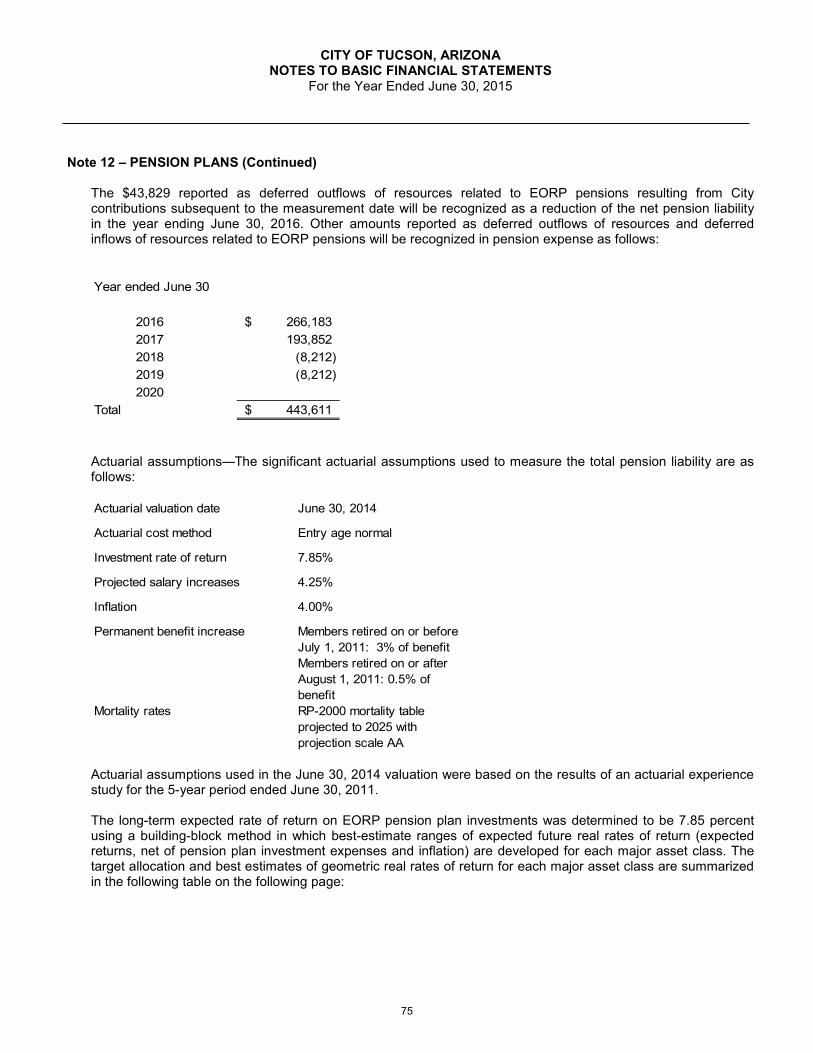
CITY OF TUCSON, ARIZONA NOTES TO BASIC FINANCIAL STATEMENTS
For the Year Ended June 30, 2015
Note 12 – PENSION PLANS (Continued)
The $43,829 reported as deferred outflows of resources related to EORP pensions resulting from City contributions subsequent to the measurement date will be recognized as a reduction of the net pension liability in the year ending June 30, 2016. Other amounts reported as deferred outflows of resources and deferred inflows of resources related to EORP pensions will be recognized in pension expense as follows: Year ended June 30
2016 266,183$ 2017 193,852 2018 (8,212) 2019 (8,212) 2020
Total 443,611$
Actuarial assumptions—The significant actuarial assumptions used to measure the total pension liability are as follows: Actuarial valuation date June 30, 2014
Actuarial cost method Entry age normal
Investment rate of return 7.85%
Projected salary increases 4.25%
Inflation 4.00%
Permanent benefit increase Members retired on or before July 1, 2011: 3% of benefit Members retired on or after August 1, 2011: 0.5% of benefit
Mortality rates RP-2000 mortality table projected to 2025 with projection scale AA
Actuarial assumptions used in the June 30, 2014 valuation were based on the results of an actuarial experience study for the 5-year period ended June 30, 2011. The long-term expected rate of return on EORP pension plan investments was determined to be 7.85 percent using a building-block method in which best-estimate ranges of expected future real rates of return (expected returns, net of pension plan investment expenses and inflation) are developed for each major asset class. The target allocation and best estimates of geometric real rates of return for each major asset class are summarized in the following table on the following page:
75

CITY OF TUCSON, ARIZONA NOTES TO BASIC FINANCIAL STATEMENTS
For the Year Ended June 30, 2015
Note 12 – PENSION PLANS (Continued)
Asset ClassTarget
AllocationReal Return
Geometric Basis
Short term investments 2% 3.25%Absolute return 4% 6.75%Risk parity 4% 6.04%Fixed income 7% 4.75%Real assets 8% 5.96%GTAA 10% 5.73%Private equity 11% 9.50%Real estate 11% 6.50%Credit opportunities 13% 8.00%Non-U.S. equity 14% 8.63%U.S. equity 16% 7.60%Total 100% Sensitivity of the City's proportionate share of the EORP net pension liability to changes in the discount rate—The following table presents the City's proportionate share of the net pension liability calculated using the discount rate of 5.67 percent, as well as what the City's proportionate share of the net pension liability would be if it were calculated using a discount rate that is 1 percentage point lower (4.67 percent) or 1 percentage point higher (6.67 percent) than the current rate:
1% Decrease Current
Discount Rate 1% Increase4.67% 5.67% 6.67%
Net Pension Liability 2,022,508$ 1,732,465$ 1,487,569$
Pension Plan Fiduciary Net Position—Detailed information about the pension plan’s fiduciary net position is available in the separately issued EORP financial report.
Note 13 – OTHER POST EMPLOYMENT BENEFITS
Plan Description—The City contributes to the plans described below. Benefits are established by City Charter and State Statute and the plans generally provide retirement, long-term disability, and health insurance premium benefits. Post–employment health care and life insurance benefits (OPEB) are provided in addition to the pension benefits described. The City provides OPEB for retired employees through a single-employer defined benefit plan. The benefits, benefits levels, employee contributions and employer contributions are governed by the City and can be amended by the City through management approval. This benefit is offered to retirees who have qualified to receive a monthly retirement allowance from either the Tucson Supplemental Retirement System or from the Arizona Public Safety Retirement System. The City contribution to medical premiums ends when the retiree reaches age 65 and becomes eligible for Medicare. Separate financial statements are not issued. The City contributed towards the medical premiums of 1,234 participants as of June 30, 2014. Depending upon the date of retirement, the City generally pays between 75% and 100% of the medical insurance premiums for eligible retirees and their dependents. City of Tucson employees retiring or entering a Deferred Retirement Option Plan program after January 1, 2011, will receive a fixed retiree health subsidy based on their plan choice.
76

CITY OF TUCSON, ARIZONA NOTES TO BASIC FINANCIAL STATEMENTS
For the Year Ended June 30, 2015
Note 13 – OTHER POST EMPLOYMENT BENEFITS (Continued)
Funding Policy—The City’s policy for other post-employment benefits is to contribute 75% of the cost of retiree medical premiums prior to Medicare eligibility (age 65) for retirements that occurred prior to January 1, 2011. Effective January 1, 2011, the employer contribution changed to a flat rate. Contribution amounts will vary based on plan options. The City also provides a life insurance benefit of $7,500 to all retirees, regardless of age. Currently the costs associated with this retirement benefit are expended as the appropriate medical and life insurance premiums are paid. For fiscal year 2015 the City’s portion of the retiree medical insurance was $8,352,718 and the retiree life insurance was $286,660. The City’s annual OPEB cost plan is financed on a pay-as-you-go basis. The City’s annual ARC, employer contributions, OPEB adjustments, percentage of annual OPEB cost contributed to the plan, and the net OPEB obligation for the last three fiscal years are listed below:
Fiscal Year ended,
June 30
Annual Required
Contribution (ARC)
Employer contributions
Interest on Net OPEB
ARC Adjustment
Annual OPEB Cost
Percentage of Annual OPEB
Cost Contributed
Net OPEB Obligation (Liability)
2015 15,497,550$ 13,866,659$ 455,083$ (403,572)$ 15,549,061$ 89.51% 11,795,354$ 2014 15,291,809 13,797,801 385,887 (342,209) 15,335,487$ 90.23% 10,112,9522013 17,005,336 15,481,278 315,696 (279,963) 17,041,069$ 91.04% 8,575,266
OPEB Cost Plan for the Last Three Fiscal Years
Funding Status—The following table provides the funded status of the plans as of the most recent valuation date
of June 30, 2015 and two prior years. The purpose of the valuation is to measure the funding progress of the plan and to establish contribution rates for the 2015 - 2016 fiscal year.
ActuarialValuation
Date CreditJune 30
OPEB (City)2015 0 213,318$ 213,318$ 0.00 225,458$ 2014 0 213,216 213,216 0.00 240,171 2013 0 239,474 239,474 0.00 227,365
94.6%88.8%105.0%
(a) (b) (b) - (a) (a) / (b) (c) (b-a) / (c)
Member CoveredAssets AAL Ratio Payroll PayrollValue of Projected Unit (Overfunded) Funded Covered Actuarial Entry Age / Unfunded Member of Active Annual
Schedule of Funding Progress with Dollar Amounts in Thousands(Excluding Health Insurance Subsidy - Police & Fire)Actuarial Unfunded(Overfunded)
Accrued Liability Active AAL as a Percentage
77

CITY OF TUCSON, ARIZONA NOTES TO BASIC FINANCIAL STATEMENTS
For the Year Ended June 30, 2015
Note 13 – OTHER POST EMPLOYMENT BENEFITS (Continued)
Trend Information—OPEB cost information for the current and two preceding years for each of the agent plans is detailed below. In addition, actuarial methods and assumptions for each plan are also described.
AnnualFiscal Year Required Percentage of Net OPEBEnded 6/30 Contribution ARC Contributed Obligation
2015 15,498$ 89.5% $ 11,7952014 15,292 90.2% 10,1132013 17,005 91.0% 8,575
OPEB Three Year Trend Information with Dollar Amounts in Thousands
Actuarial Valuation Date July 1, 2014Actuarial Cost Method Projected Unit CreditAmortization Method 30-year open, level % of payRemaining Amortization Period 30 years as of July 1, 2014Asset Valuation Method N/A. No assets in OPEB trust.
Actuarial Assumptions:Investment Rate of Return 4.50%Projected Payroll Increases 3.50%Medical/Drug cost trend rate 10.50% in 2014/2015, then 7.0% in 2015/2016 grading down by 0.5% per
year until ultimate rate of 5.0%
OPEB Actuarial Information
Note 14 – SELF INSURANCE PROGRAM
The City is exposed to various risks of losses related to tort; theft of, damage to, and destruction of assets; errors and omissions; injuries to employees; and natural disasters. The City has obtained commercial coverage for Property Insurance, Public Employee Fidelity Bonds, Crime Insurance, Aircraft Insurance and Miscellaneous Insurance (i.e., surety bonds, special event insurance as needed, and fine arts coverage). The City retains all of the risk not covered by commercial carriers and has effectively managed risk through various employee education and prevention programs.
All risk management activities are accounted for in the Self Insurance Internal Service Fund that has an appointed Board of Trustees. There have not been any settlements in excess of the insurance coverage provided by this fund in the previous three years.
The estimated outstanding losses are the cost of unpaid claims, which are calculated on a present value basis based on a 3% discount rate. Claims and expenses are recognized when it is probable that a loss has been incurred and the amount of the loss can be reasonably estimated. Claims accounted for include reported and paid claims, reported but unpaid claims, and incurred but not reported (IBNR) claims.
78

CITY OF TUCSON, ARIZONA NOTES TO BASIC FINANCIAL STATEMENTS
For the Year Ended June 30, 2015
Note 14 – SELF INSURANCE PROGRAM (Continued)
Changes in the Self Insurance Fund's aggregate claims liabilities for the fiscal years ended June 30, 2015, and 2014, are as follows:
2015 2014
Beginning of fiscal year liability 38,166,700$ 43,820,846$ Current year claims and changes in estimates 10,126,137 5,396,530 Claim payments (8,356,337) (11,050,676) Balance at fiscal year end 39,936,500$ 38,166,700$
Note 15 – PLEDGED REVENUES
The City has pledged future Water utility revenues, net of specified operating expenses, to repay $711,457,000 in utility system revenue outstanding bonds and obligations. Proceeds from the bonds provided financing for the construction of various utility related projects including new water pipelines and water treatment plants. The bonds are payable solely from utility customer net revenues and are payable through June 2033. Annual principal and interest payments on the bonds are expected to require less than 55.0 percent of net revenues. The total principal and interest remaining to be paid on the bonds is $705,709,574. Principal and interest paid for the current year and total customer net revenues were $49,318,757 and $89,138,858, respectively.
The City has pledged future Highway User Tax (H.U.R.F.) Revenues distributed from the State to repay $82,975,000 in outstanding Street and Highway Bonds. Proceeds from the bonds provided financing for the construction, acquiring rights-of-way and for maintaining City streets and highways. The bonds are payable solely from H.U.R.F. revenues and are payable through 2022. Fiscal Year 2015 annual principal and interest payments on the bonds required 39.0% of H.U.R.F. revenues. The total principal and interest remaining to be paid on the bonds is $98,260,318. Principal and interest paid for the current year and total H.U.R.F. revenues were $17,509,350 and $44,846,287, respectively.
Note 16 – CONTINGENCIES AND COMMITMENTS
A. Litigation
The City is subject to a number of lawsuits, investigations and other claims (some of which involve substantial amounts) that are incidental to the ordinary course of its operations, including those related to wrongful death and personal injury matters. Although the City Attorney does not currently possess sufficient information to reasonably estimate the amounts of the liabilities to be recorded upon the settlement of such claims and lawsuits, some claims could be significant to the City's operations. While the ultimate resolution of such lawsuits, investigations, and claims cannot be determined at this time, in the opinion of City management, based on the advice of the City Attorney, the resolution of these matters will not have a material adverse effect on the City's financial position.
B. Central Arizona Project Water Purchase Contract
The Central Arizona Water Conservation District (CAWCD) is the entity responsible for contracting with the Secretary of Interior for Central Arizona Project (CAP) water and for subcontracting with users within the State of Arizona. Under a contract between the City, CAWCD and the Department of the Interior, the City currently has the right to receive 144,172 acre-feet of CAP water each year. In return, the City agreed to pay a capital financing charge that is designed to recover a portion of the Federal Government's CAP construction costs. This charge, which must be paid regardless of whether the City orders any CAP water, is adjusted annually and is on a per-acre-foot allocation basis; the CAP capital financing for the year was $3,171,784. In addition, commodity charges, which are designed to cover CAWCD operating and maintenance expenses, are based on the quantity of CAP water taken by the City. The commodity charge for the year was $23,604,242.
79

CITY OF TUCSON, ARIZONA NOTES TO BASIC FINANCIAL STATEMENTS
For the Year Ended June 30, 2015
Note 16 – CONTINGENCIES AND COMMITMENTS (Continued)
C. Construction and Other Commitments
In governmental fund types, construction and other commitments, if significant, are appropriately identifiable through constraints on specific uses of fund balance.
D. Federal and State Grants
Accounts received or receivable from grantor agencies are subject to audit and adjustment by grantor agencies, principally the Federal government. Any disallowed claims, including amounts already collected, may constitute a liability of the applicable funds. The amount, if any, of expenditures which may be disallowed by the grantor cannot be determined at this time, although the City expects such amounts, if any, to be immaterial.
E. Sale of Tucson House
On November 1, 1997, the City sold the Tucson House, a public housing apartment complex, to a limited partnership that has renovated the complex with money obtained through Federal Home Loan Bank (FHLB) subsidies and low-income housing tax credits from the State of Arizona. Notes and interest receivables have been established for: the sales price, certain construction costs paid by the City, and accrued interest due on the notes at 7.5%. The note balance, with accrued interest at 7.5% thereon, totaled $31,015,072 at June 30, 2015.
According to the terms of the regulatory and operating agreement with the U.S. Department of Housing, the Tucson House units must be operated as affordable housing for a period of not less than the compliance period, as defined in Section 42 of the Internal Revenue Code. The tax credit compliance period ended in 2014 and the City is assessing its option to repurchase the Tucson House in exchange for forgiveness of the debt. The Extended Land Use Agreement requires continued affordability for a 40 year period ending in 2039. In addition, the Agreement Concerning the Affordable Housing Program Loan with the Federal Home Loan Bank (FHLB) requires the units be operated as low-income housing for period a 50 year period ending in 2049 with the subsidy being forgiven annually over that period. If the terms are violated, the City will be jointly liable (with the limited partnership) for repayment of the subsidy to the FHLB. The City has made certain commitments to ensure affordability, and therefore, has potential associated liability. The likelihood of such liabilities occurring is considered remote by the City.
F. Financing of Posadas Sentinel Low-income Housing
On November 1, 1999, the City entered into a capital lease with Posadas Sentinel LLLP (Posadas), whereby the City leased various properties to Posadas for 75 years. Under the terms of the lease, Posadas will develop and operate the properties solely as low-income residential housing facilities. Posadas is financing this development through low-income housing tax credits from the State of Arizona, and through a line of credit from the City, which has been recorded by the City as notes receivable. The note balance, with accrued interest at 7.5% thereon, was $26,841,388 at June 30, 2015.
Eligibility of Posadas Sentinel LLLP for the tax credits requires that the properties be operated as affordable housing during the compliance period, as defined in Section 42 of the Internal Revenue Code. The compliance period is expected to end in 2017, at the end of which time the lease agreement may be terminated in exchange for forgiveness of the associated debt. The City has made certain commitments to ensure eligibility for the tax credits, and therefore has potential associated liability. The likelihood of such liability occurring is considered remote by the City.
80

CITY OF TUCSON, ARIZONA NOTES TO BASIC FINANCIAL STATEMENTS
For the Year Ended June 30, 2015
Note 16 – CONTINGENCIES AND COMMITMENTS (Continued)
G. Financing of South Park Low-income Housing
On December 2, 2002 and as amended on September 1, 2003, the City entered into a capital lease with South Park Development Partners LLLP (South Park), whereby the City leased various properties to South Park for 75 years. Under the terms of the lease, South Park will develop and operate the properties solely as low-income residential housing facilities. South Park is financing this development through low-income housing tax credits from the State of Arizona, and through a line of credit from the City, which has been recorded by the City as a notes receivable. The note balance, with accrued interest at various rates, was $3,961,351 at June 30, 2015.
Eligibility of South Park Development Partners LLLP for the tax credits requires that the properties be operated as affordable housing during the compliance period, as defined in Section 42 of the Internal Revenue Code. The compliance period is expected to end in 2019, at the end of which time the lease agreement may be terminated in exchange for forgiveness of the associated debt. The City has made certain commitments to ensure eligibility for the tax credit, and therefore has potential associated liability. The likelihood of such liability occurring is considered remote by the City.
H. Financing of Silverbell Homes Low-income Housing
On November 15, 2005 and as amended on September 6, 2006, the City entered into a capital lease with Silverbell Homes Limited Partnership (Silverbell Homes), whereby the City leased various parcels to Silverbell Homes for a period of 89 years. Under the terms of the lease Silverbell Homes will develop and operate the properties solely as low-income residential housing facilities. Silverbell Homes financed this development through low-income housing tax credits from the State of Arizona, and through a line of credit from the City, which has been recorded by the City as a notes receivable. The note balance, with accrued interest, was $2,227,669 at June 30, 2015.
Eligibility of Silverbell Homes for the tax credits requires that the properties be operated as affordable housing as defined in Section 42 of the Internal Revenue Code. The compliance period is expected to end in 2022, at the end of which time the lease agreement may be terminated in exchange for forgiveness of the associated debt. The City has made certain commitments to ensure eligibility for the tax credit, and therefore has potential associated liability. The likelihood of such liability occurring is considered remote by the City.
I. Financing of Martin Luther King Low-income Housing
On September 22, 2009, the City amended a ground lease for 89 years with MLK I, LLC (MLK) to include only an above ground condominium unit for development of low-income residential housing units. MLK financed this development though Low-Income Housing Tax Credit Exchange funds and State Housing Funds from the State of Arizona, Federal Home Loan Bank funds from Alliance Bank, and through a line of credit from the City, which has been recorded by the City as a notes receivable. The note balance was $7,499,217 at June 30, 2015.
Eligibility of MLK for the tax credit exchange funds requires that the properties be operated as affordable housing during the compliance period, as defined in Section 42 of the Internal Revenue Code. The compliance period is expected to end in 2025, at the end of which time the lease agreement may be terminated in exchange for forgiveness of the associated debt. The City has made certain commitments to ensure eligibility, and therefore has potential associated liability. The likelihood of such liability occurring is considered remote by the City.
J. Starr Pass Resort Developments Lease
On May 11, 2005, the City entered into a sublease agreement with Starr Pass Resort Developments LLC. The City acquired, among other property, an interest in the real property and the improvements to a parking garage structure located on the Starr Pass grounds. The City issued Certificates of Participation for $2,640,000 to pay
81

CITY OF TUCSON, ARIZONA NOTES TO BASIC FINANCIAL STATEMENTS
For the Year Ended June 30, 2015
Note 16 – CONTINGENCIES AND COMMITMENTS (Continued)
ground rent to Starr Pass Resort Developments. Under the terms of the lease, Starr Pass developed and operates the properties. The Resort is paying the City under the sublease the amount equal to the debt service. The notes receivable balance due to the City was $1,645,000 at June 30, 2015.
The proceeds from the 2007 Taxable Certificates of Participation in the amount of $2,545,000 will be used by the City to acquire a leasehold interest in the 2007 Taxable Property, which consists of certain real property and a parking garage to be constructed thereon, from Starr Pass pursuant to the 2007 Starr Pass Lease. Starr Pass will use such amount to finance the construction of a second parking garage for use by guests of the JW Marriott Starr Pass Resort located in the City. The City will assign its interest in the 2007 Starr Pass Lease and the 2007 Taxable Property to the Trustee. The Trustee will, in turn, lease its interest in the 2007 Taxable Property to the City pursuant to the Series 2007 Lease. The City will then sublease the 2007 Taxable Property to Starr Pass to manage and operate the second public parking garage over a 20-year period. The Resort is paying the City under the sublease the amount equal to the debt service. The notes receivable balance due to the City was $1,845,000 at June 30, 2015.
K. Rio Nuevo Multipurpose Facilities District
In order to resolve variety of lawsuits between the City and the Rio Nuevo Multipurpose Facilities District (the District”), the City Mayor and Council and the District Board signed an agreement of February 7, 2013. In this agreement, the City will pay the District, in recognition for monies spent for the construction of the garage and to relinquish any claims on future revenues, $21,279,884 between fiscal year 2013 through 2050. The terms of the agreement specifies that the City will retain ownership, be solely responsible for the operation and maintenance, and shall be solely responsible for any issues with all third parties relating to the design, construction and operation of the garage. The City will not sell or lease the entire garage without prior written consent from the District. The District will continue to satisfy the existing debt service obligation. As of June 30, 2015, the notes receivable balance due is $21,082,384.
L. Encumbrances
The City of Tucson utilizes an encumbrance accounting system under which purchase orders, contracts and other commitments for the expenditure of monies are recorded in order to reserve that portion of the applicable appropriation. All appropriations lapse on the last day of the fiscal year. Any outstanding commitments that the City intends to honor are re-budgeted in the new fiscal year. At June 30, 2015, the City intended to honor $80,549,051 of outstanding encumbrances in the new fiscal year.
General Fund 4,891,152$ Mass Transit 14,571,697 Nonmajor Governmental Funds 61,086,202
80,549,051$
Note 17 – REMEDIATION LIABILITY
The City owned and operated fueling facilities that are now closed. When the underground storage tanks were removed, evidence was found that contaminants had leaked into the ground creating a possible hazard to our groundwater resources. In accordance with state statutes, the City started remediation actions to clear, remove, and monitor the sites. Cost estimates are based on actual monthly expenditures annualized for the ten year estimate. Changes to the estimates will depend on the periodic sampling of the affected areas. See Note 7 for liability information.
82

CITY OF TUCSON, ARIZONA NOTES TO BASIC FINANCIAL STATEMENTS
For the Year Ended June 30, 2015
Note 18 – CREDIT CARD PAYMENTS BY THE CITY OF TUCSON The City of Tucson requires some vendors to accept payment only through credit cards. In such cases Arizona Revised Statutes requires the City to disclose the requirement during the bid process or amend the contract under a mutual agreement with the vendor. The statute also requires disclosure of the incentive received by the City resulting from credit card payments. For fiscal year 2015 the City received rebate revenues of $722,216. Note 19 – POTENTIAL STREETCAR CLAIMS After completion of the Modern Streetcar project, the City and Old Pueblo Trackworks are in negotiations regarding potential claims based on a request for additional compensation for extended project overhead, additional supervision and production inefficiencies. As of June 30, 2015, a resolution had not been reached and an amount, if any, cannot be estimated at this time. Note 20 – RESTATEMENT For fiscal year 2015, the City implemented GASB Statement No. 68, Accounting and Financial Report for Pensions. This standard establishes standards for governmental employer recognition, measurement, and presentation of information about pensions provided through pension plans. It also establishes requirements for reporting information about pension-related financial support provided by entities that make contributions to pension plans that are used to provide pensions to the employees of other entities. To establish beginning balances for the net pension liability, the fiscal year 2014 ending net positions for the City's government-wide and enterprise fund financial statements were restated as follows: Government-Wide Finance Statements
Governmental Activities
Business-Type Activities Total
Net Position, June 30, 2014, as Previously Reported 1,682,027,247$ 843,973,827$ 2,526,001,074$ Cumulative Affect of Application of GASB 68, Net Pension Liability (849,580,478) (83,416,613) (932,997,091) Cumulative Affect of Application of GASB 71, Deferred Outflow of Resources for Contributions Made to the Plan During Fiscal Year Ending June 30, 2014 41,078,222 41,078,222 Net Position, June 30, 2014, as Restated 873,524,991$ 760,557,214$ 1,634,082,205$
Enterprise Fund Financial StatementsEnvironmental
Services Water Utility Fund Non-Major EnterpriseNet Position, June 30, 2014, as Previously Reported (4,625,002)$ 817,068,643$ 49,115,203$ Cumulative Affect of Application of GASB 68, Net Pension Liability (20,693,872) (56,610,761) (6,111,980) Net Position, June 30, 2014, as Restated (25,318,874)$ 760,457,882$ 43,003,223$
83

CITY OF TUCSON, ARIZONA NOTES TO BASIC FINANCIAL STATEMENTS
For the Year Ended June 30, 2015
Note 20 – RESTATEMENT (Continued)
The restatement required by GASB Statement No. 68 affected unrestricted net position category as presented below:
Previously Reported Restated
Previously Reported Restated
Previously Reported Restated
Net Investment in Capital Assets 1,499,029,239$ 1,499,029,239$ 811,642,121$ 811,642,121$ 2,310,671,360$ 2,310,671,360$ Restricted for:
Debt Service 3,052,237 3,052,237 29,403,200 29,403,200 32,455,437 32,455,437 Capital 83,597,648 83,597,648 83,597,648 83,597,648 Self-Insurance Mandates 33,941,230 33,941,230 33,941,230 33,941,230 Grants and Entitlements 28,305,979 28,305,979 9,321,276 9,321,276 37,627,255 37,627,255 Other Purposes 5,952,240 5,952,240 5,952,240 5,952,240
Unrestricted 28,148,674 (780,353,582) (6,392,770) (89,809,383) 21,755,904 (870,162,965) Total Net Position 1,682,027,247$ 873,524,991$ 843,973,827$ 760,557,214$ 2,526,001,074$ 1,634,082,205$
Previously Reported Restated
Previously Reported Restated
Previously Reported Restated
Net Investment in Capital Assets 20,392,140$ 20,392,140$ 743,550,012$ 743,550,012$ 47,699,969$ 47,699,969$ Restricted for Debt Service 29,403,200 29,403,200 Restricted for CapitalRestricted for Grants and Entitlements 2,554,209 2,554,209 Unrestricted (25,017,142) (45,711,014) 44,115,431 (12,495,330) (1,138,975) (7,250,955)
Total Net Position (4,625,002)$ (25,318,874)$ 817,068,643$ 760,457,882$ 49,115,203$ 43,003,223$
Governmental Activities Business-type Activities
Water Utility Fund
Total
Environmental Services Non-Major Enterprise Funds
Note 21 – NEW GOVERNMENTAL ACCOUNTING STANDARD BOARD (GASB) PRONOUNCEMENTS
In January 2013, the GASB issued Statement No. 69, Government Combinations and Disposals of Government Operations, which is intended to improve accounting and financial reporting for U.S. state and local governments’ combinations and disposals of government operations. This statement provides guidance for determining whether a specific government combination is a government merger, a government acquisition, or a transfer of operations. On July 1, 2014, the City adopted this Statement which had no impact on its financial statements and, thus, no additional note disclosures were required.
In November 2013, the GASB issued Statement No. 71, Pension Transition for Contributions Made Subsequent to the Measurement Date – an amendment of GASB Statement No. 68. This statement is intended to address an issue regarding application of the transition provisions of Statement No. 68, Accounting and Financial Reporting for Pensions. The issues relate to amounts associated with contributions, if any, made by a state or local government employer or non-employer contributing entity to a defined benefit pension plan after the measurement date of the government’s beginning net pension liability. On July 1, 2014, the City adopted this Statement, which had an significant impact on its financial statements as explained in Note 12 and Note 20.
In February 2015, the GASB issued Statement No. 72, Fair Value Measurement and Application. The definition of fair value is the price that would be received to sell an asset or paid to transfer a liability in an orderly transaction between market participants at the measurement date. This Statement provides guidance for determining a fair value measurement for financial reporting purposes. This Statement also provides guidance for applying fair value to certain investments and disclosures related to all fair value measurements. The requirements of this Statement are effective for financial statements for periods beginning after June 15, 2015.
In June 2015, the GASB issued Statement No. 73, Accounting and Financial Reporting for Pensions and Related Assets That Are Not within the Scope of GASB Statement 68, and Amendments to Certain Provisions of GASB Statements 67 and 68, which completes the suite of pension standards. Statement 73 establishes requirements for those pensions and pension plans that are not administered through a trust meeting specified criteria (in other words, those not covered by Statements 67 and 68). The requirements in Statement 73 for reporting pensions
84

CITY OF TUCSON, ARIZONA NOTES TO BASIC FINANCIAL STATEMENTS
For the Year Ended June 30, 2015
Note 21 – NEW GOVERNMENTAL ACCOUNTING STANDARD BOARD (GASB) PRONOUNCEMENTS (Cont.)
generally are the same as in Statement 68. However, the lack of a pension plan that is administered through a trust that meets specified criteria is reflected in the measurements. The provisions in Statement 73 are effective for fiscal years beginning after June 15, 2015—except those provisions that address employers and governmental non-employer contributing entities for pensions that are not within the scope of Statement 68, which are effective for financial statements for fiscal years beginning after June 15, 2016.
In June 2015, the GASB issued Statement No. 74, Financial Reporting for Postemployment Benefit Plans Other Than Pension Plans. This statement addresses reporting by OPEB plans that administer benefits on behalf of governments and parallels the pension standards issued in 2012—GASB Statement No. 67, Financial Reporting for Pension Plans. The requirements of this Statement are effective for financial statements for periods beginning after June 15, 2016.
In June 2015, the GASB issued Statement No. 75, Accounting and Financial Reporting for Postemployment Benefits Other Than Pensions. This statement addresses reporting by governments that provide OPEB to their employees and for governments that finance OPEB for employees of other governments and parallels the pension standards issued in 2012—GASB Statement No. 68, Accounting and Financial Reporting for Pensions. Together, these pension and OPEB standards provide consistent and comprehensive guidance for all postemployment benefits. The requirements of this Statement are effective for financial statements for periods beginning after June 15, 2017.
In June 2015, the GASB issued Statement No. 76, The Hierarchy of Generally Accepted Accounting Principles for State and Local Governments. This statement reduces the hierarchy of generally accepted accounting principles (GAAP) to two categories of authoritative GAAP and addresses the use of authoritative and non-authoritative literature in the event that the accounting treatment for a transaction or other event is not specified within a source of authoritative GAAP. The requirements of this Statement are effective for financial statements for periods beginning after June 15, 2015.
In August 2015, the GASB issued Statement No. 77, Tax Abatement Disclosures. This statement defines a tax abatement as resulting from an agreement between a government and an individual or entity in which the government promises to forgo tax revenues and the individual or entity promises to subsequently take a specific action that contributes to economic development or otherwise benefits the government or its citizens. This statement specifies information that the government must disclose about the agreements. The requirements of this Statement are effective for financial statements for periods beginning after December 15, 2015.
85

CITY OF TUCSON, ARIZONA
Re
quire
d Sup
ple
me
ntaryInfo
rmatio
n
REQUIRED SUPPLEMENTARYINFORMATION

CITY OF TUCSON, ARIZONASCHEDULE OF REVENUES, EXPENDITURES AND
CHANGES IN FUND BALANCES - BUDGET AND ACTUAL - GENERAL FUNDYEAR ENDED JUNE 30, 2015
Budgeted AmountsVariance withFinal Budget
PositiveOriginal Final Actual (Negative)
Revenues:Taxes $ 248,482,190 $ 248,482,190 $ 243,058,369 $ (5,423,821)Licenses and Permits 26,369,430 26,959,430 28,226,186 1,266,756Fines and Forfeitures 14,799,250 14,766,250 16,062,876 1,296,626Use of Money and Property 525,270 433,020 467,589 34,569Federal Grants and Contributions 5,100 5,100Other Agencies 136,125,230 136,125,230 136,956,086 830,856Charges for Services 37,017,990 37,017,990 38,532,303 1,514,313Miscellaneous 4,613,640 4,613,640 5,077,423 463,783
Total revenues 467,933,000 468,397,750 468,385,932 (11,818)
Expenditures:Current -
Elected and Official 22,334,550 21,955,066 20,744,170 1,210,896Support Services 46,079,950 45,719,190 45,101,531 617,659Public Safety/Justice Services 250,971,070 252,470,940 249,939,175 2,531,765Community Enrichment and Development 52,078,320 53,281,090 52,282,125 998,965Non-Departmental 22,815,750 22,827,750 22,572,002 255,748
Capital Outlay 4,998,010 5,093,634 5,836,400 (742,766)Capital Projects 900,000 888,000 683,119 204,881Debt service -
Principal 15,605,390 14,870,390 14,965,385 (94,995)Interest 11,138,260 10,361,480 9,537,333 824,147Fiscal Agent Fees 19,650 (19,650)Issuance Costs of Debt 486,625 (486,625)
Total expenditures 426,921,300 427,467,540 422,167,515 5,300,025
Excess (deficiency) of revenues over expenditures 41,011,700 40,930,210 46,218,417 5,288,207
Other financing sources (uses):Refunding Proceeds 20,659,864 20,659,864Premium on Debt Issuance 2,579,091 2,579,091Refunded Bond Escrow Agent (21,487,330) (21,487,330)Transfers In 1,600,000 1,600,000 1,600,000Transfers Out (50,017,190) (50,017,190) (50,613,653) (596,463)
Total other financing sources (uses) (48,417,190) (48,417,190) (47,262,028) 1,155,162
Change in fund balances $ (7,405,490) $ (7,486,980) (1,043,611) $ 6,443,369
Fund balance, beginning of year 66,752,458
Fund balance, end of year $ 65,708,847
The notes to the basic financial statements are an integral part of this statement.
87

CITY OF TUCSON, ARIZONASCHEDULE OF REVENUES, EXPENDITURES AND
CHANGES IN FUND BALANCES - BUDGET AND ACTUAL - MASS TRANSIT FUNDYEAR ENDED JUNE 30, 2015
Budgeted AmountsVariance withFinal Budget
PositiveOriginal Final Actual (Negative)
Revenues:Use of Money and Property $ 366,400 $ 366,400 $ 514,633 $ 148,233Federal Grants and Contributions 26,415,740 26,415,740 22,475,522 (3,940,218)Other Agencies 13,044,510 12,454,510 13,320,084 865,574Charges for Services 15,253,680 15,253,680 13,674,426 (1,579,254)Miscellaneous 70,200 70,200 563,386 493,186
Total revenues 55,150,530 54,560,530 50,548,051 (4,012,479)
Expenditures:Current -
Community Enrichment and Development 77,507,270 78,739,550 75,323,604 3,415,946Capital Outlay 19,193,800 16,168,940 15,237,225 931,715Capital Projects 2,728,600 2,519,830 2,371,372 148,458
Total expenditures 99,429,670 97,428,320 92,932,201 4,496,119
Excess (deficiency) of revenues over expenditures (44,279,140) (42,867,790) (42,384,150) 483,640
Other financing sources (uses):Transfers In 44,279,140 44,279,140 43,725,841 (553,299)
Total other financing sources (uses) 44,279,140 44,279,140 43,725,841 (553,299)
Changes in fund balances $ $ 1,411,350 1,341,691 $ (69,659)
Fund balance, beginning of year 4,831,032
Fund balance, end of year $ 6,172,723
The notes to the basic financial statements are an integral part of this statement.
88

CITY OF TUCSON, ARIZONA NOTE TO REQUIRED SUPPLEMENTARY INFORMATION
For the Year Ended June 30, 2015
NOTE - BUDGET INFORMATION:
The City prepares a legally adopted annual operating budget for the General Fund and Mass Transit fund. The City’s budget is adopted using a basis of accounting consistent with generally accepted accounting principles (GAAP), with immaterial exceptions (e.g., beginning fund balance is budgeted as a revenue source). The City’s actuals are presented on a GAAP basis; therefore, no reconciliation is necessary.
89


PENSION
PLANS
DISCLOSURES
91

2015 2014Total Pension Liability
Service Cost 15,753,944$ 14,825,019$ Interest 70,688,775 66,915,612 Differences Between Expected and Actual Experience (7,815,270) 325,890 Changes of Assumptions (31,210,057) 76,945,563 Benefit Payments, Including Refunds of Member Contributions (67,612,351) (66,002,013)
Net Change in Total Pension Liability (20,194,959) 93,010,071
Total Pension Liability - Beginning 1,041,572,523 948,562,453 Total Pension Liability - Ending 1,021,377,564$ 1,041,572,524$
Plan Fiduciary Net PositionContributions - Employer 33,985,523$ 34,189,288$ Contributions - Member 7,531,845 7,338,543 Net Investment Income 30,684,188 119,729,154 Benefit Payments, Including Refunds of Member Contributions (67,612,351) (66,002,013) Administrative Expense (650,405) (735,739) Other 118,247 171,077
Net Change in Plan Fiduciary Net Position 4,057,047 94,690,310
Plan Fiduciary Net Position - Beginning 735,736,500 641,046,190 Plan Fiduciary Net Position - Ending 739,793,547$ 735,736,500$
City's Net Position Liability - Ending 281,584,017$ 305,836,024$
72.43% 70.64%
Covered-Employee Payroll 123,414,560$ 126,639,423$
228.16% 241.50%
Plan Fiduciary Net Position as a Percentage of the Total Pension Liability
City's Net Position Liability as a Percentage of Covered Employee Payroll
CITY OF TUCSON, ARIZONAREQUIRED SUPPLEMENTARY INFORMATION
SCHEDULE OF CHANGES IN THE CITY'S NET PENSION LIABILITY AND RELATED RATIOSTUCSON SUPPLEMENTAL RETIREMENT SYSTEM (TSRS)
Last 10 Fiscal Years (Built Prospectively)
92

Fiscal Year Total Plan Net Position Net Pension LiabilityEnding Pension Plan Net Net Pension as a % of Total Covered as a % of
June 30, Liability Position Liability Pension Liability Payroll Covered Payroll2015 1,021,377,564$ 739,793,547$ 281,584,017$ 72.43% 123,414,560$ 228.16%2014 1,041,572,524 735,736,500 305,836,024 70.64% 126,639,423 241.50%
CITY OF TUCSON, ARIZONAREQUIRED SUPPLEMENTARY INFORMATION
SCHEDULE OF THE PENSION NET POSITION LIABILITYTUCSON SUPPLEMENTAL RETIREMENT SYSTEM (TSRS)
93

Actual Fiscal Year Actuarially Actuarially Contribution Contribution Covered
Valuation Ending Determined Determined as a % of Actual Deficiency Covered EmployeeDate June 30, Rate Contribution covered payroll Contributions (Excess) Payroll Payroll
6/30/2013 2015 26.95% 34,129,324$ 27.50% 33,985,523$ 143,801$ 125,857,903$ 126,639,423$ 6/30/2012 2014 27.09% 34,094,906 27.09% 34,189,288 (94,382) 125,003,023 125,857,903
Valuation Date: June 30, 2015
Notes
Methods and Assumptions Used to Determine Contribution Rates:
Actuarial Cost Method Entry Age NormalAmortization Method Level Percentage of Payroll, OpenRemaining Amortization Period 20 yearsAsset Valuation Method 5 year smoothed marketInflation 3.00%Salary Increases 3.00% to 6.50% including inflationInvestment Rate of Return 7.25%Retirement Age
Mortality
Actuarially determined contribution rates are calculated for the fiscal year beginning one year after the valuation date (one year lag).
Age-based table of rates that are specific to the type of eligibility condition. Last updated for the 2009 valuation pursuant to an experience study of the period 2009-2013.
Pre and Post-retirement: RP-2000 Combined Mortality Table for males and females projected with Scale BB to 2020. Disabled retirement: RP-2000 Disabled Mortality Table for males and Females.
SUMMARY OF ACTUARIAL METHODS AND ASSUMPTIONSNOTES TO SCHEDULE OF CONTRIBUTIONS
SCHEDULE OF CONTRIBUTIONS
CITY OF TUCSON, ARIZONAREQUIRED SUPPLEMENTARY INFORMATION
TUCSON SUPPLEMENTAL RETIREMENT SYSTEM (TSRS)
TUCSON SUPPLEMENTAL RETIREMENT SYSTEM (TSRS)
94

2015 2014
Annual Money-Weighted Rate of Return, Net of Investment Expense 4.17% 19.11%
SCHEDULE OF PENSION INVESTMENT RETURNS
CITY OF TUCSON, ARIZONAREQUIRED SUPPLEMENTARY INFORMATION
TUCSON SUPPLEMENTAL RETIREMENT SYSTEM (TSRS)
95

Reporting Fiscal Year(Measurement Date)
2015(2014)
Total Pension LiabilityService Cost 11,720,855$ Interest 49,886,649 Changes of Benefit Terms 17,350,937 Differences Between Expected and Actual Experience (1,845,566) Changes of Assumptions 82,969,636 Benefit Payments, Including Refunds of Member Contributions (44,637,621)
Net Change in Total Pension Liability 115,444,890
Total Pension Liability - Beginning 651,957,100 Total Pension Liability - Ending 767,401,990$
Plan Fiduciary Net PositionContributions - Employer 25,050,303$ Contributions - Member 6,411,220 Net Investment Income 36,646,985 Benefit Payments, Including Refunds of Member Contributions (44,637,621) Other (Net Transfer) (14,311,889)
Net Change in Plan Fiduciary Net Position 9,158,998
Plan Fiduciary Net Position - Beginning 288,161,213 Plan Fiduciary Net Position - Ending 297,320,211$
City's Net Position Liability - Ending 470,081,779$
38.74%
Covered-Employee Payroll 57,677,943$
815.01%
Plan Fiduciary Net Position as a Percentage of the Total Pension Liability
City's Net Position Liability as a Percentage of Covered Employee Payroll
CITY OF TUCSON, ARIZONAREQUIRED SUPPLEMENTARY INFORMATION
SCHEDULE OF CHANGES IN THE CITY'S NET PENSION LIABILITY AND RELATED RATIOSPUBLIC SAFETY PERSONNEL RETIREMENT SYSTEM (PSPRS)
Last 10 Fiscal Years (Built Prospectively)
TUCSON POLICE
96

Reporting Fiscal Year(Measurement Date)
2015(2014)
Total Pension LiabilityService Cost 7,175,895$ Interest 31,594,819 Changes of Benefit Terms 9,902,338 Differences Between Expected and Actual Experience 99,733 Changes of Assumptions 44,213,488 Benefit Payments, Including Refunds of Member Contributions (29,522,292)
Net Change in Total Pension Liability 63,463,981
Total Pension Liability - Beginning 413,654,974 Total Pension Liability - Ending 477,118,955$
Plan Fiduciary Net PositionContributions - Employer 15,972,870$ Contributions - Member 3,849,878 Net Investment Income 22,057,153 Benefit Payments, Including Refunds of Member Contributions (29,522,292) Other (Net Transfer) (9,649,798)
Net Change in Plan Fiduciary Net Position 2,707,811
Plan Fiduciary Net Position - Beginning 174,841,394 Plan Fiduciary Net Position - Ending 177,549,205$
City's Net Position Liability - Ending 299,569,750$
37.21%
Covered-Employee Payroll 35,105,468$
853.34%
TUCSON FIRE
Plan Fiduciary Net Position as a Percentage of the Total Pension Liability
City's Net Position Liability as a Percentage of Covered Employee Payroll
CITY OF TUCSON, ARIZONAREQUIRED SUPPLEMENTARY INFORMATION
SCHEDULE OF CHANGES IN THE CITY'S NET PENSION LIABILITY AND RELATED RATIOSPUBLIC SAFETY PERSONNEL RETIREMENT SYSTEM (PSPRS)
Last 10 Fiscal Years (Built Prospectively)
97

Fiscal Year Actuarially Contribution Covered Actual ContributionValuation Ending Determined Actual Deficiency Payroll as a % of Covered
Date June 30, Contribution Contributions (Excess) at Val Date Employee Payroll
2014 2015 25,050,303$ 25,050,303$ 57,677,943$ 43.43%
Fiscal Year Actuarially Contribution Covered Actual ContributionValuation Ending Determined Actual Deficiency Payroll as a % of Covered
Date June 30, Contribution Contributions (Excess) at Val Date Employee Payroll
2014 2015 15,972,870$ 15,972,870$ 35,105,468$ 45.50%
TUCSON POLICE
TUCSON FIRE
CITY OF TUCSON, ARIZONAREQUIRED SUPPLEMENTARY INFORMATION
SCHEDULE OF CONTRIBUTIONSPUBLIC SAFETY PERSONNEL RETIREMENT SYSTEM (PSPRS)
98

Valuation Date:Notes
Methods and Assumptions Used to Determine Fiscal Year 2014 Contribution Rates:Actuarial Cost Method Amortization Method Remaining Amortization Period
Asset Valuation Method Wage growth
Price Inflation
Salary Increases
Investment Rate of Return
Retirement Age
Mortality
Individual Entry Age Normal
RP-2000 mortality table projected to 2015 using projection scale AA (adjusted by 105% for both males and females).
CITY OF TUCSON, ARIZONAREQUIRED SUPPLEMENTARY INFORMATIONNOTES TO SCHEDULE OF CONTRIBUTIONS
PUBLIC SAFETY PERSONNEL RETIREMENT SYSTEM (PSPRS)SUMMARY OF ACTUARIAL METHODS AND ASSUMPTIONS
Actuarially determined contribution rates are calculated as of June 30 each year, which are 12 months prior to the beginning of the fiscal year in which contributions are reported.
24 years; if the actuarial value of assets exceeded the actuarial accrued liability, the excess was amortized over an open period of 20 years and applied as a credit to reduce the normal cost which otherwise would be payable.
Experience-based table of rates that is specific to the type of eligibility condition. Last updated for the 2012 valuation pursuant to an experience study of the period July 1, 2006 - June 30, 2011.
8.00%, net of investment and administrative expenses
5.00% to 9.00% including inflation
3.0% - 4.0% -- approximate; No explicit price inflation assumption is used in this valuation.
5.00%7-Year smoothed market; 20% corridor
Level Percentage of Payroll, Closed
99

Fiscal Year City's Proportion City's Proportionate State's Prop Net Pension LiabilityEnding of Net Pension Share of Net Net Pension Covered as a % of
June 30, Liability Pension Liability Liability TOTAL Payroll Covered Payroll2015 0.258% 1,732,465$ 531,189$ 2,263,654$ 186,000$ 1217.02%
CITY OF TUCSON, ARIZONAREQUIRED SUPPLEMENTARY INFORMATION
SCHEDULE OF THE CITY'S PROPORTIONATE SHARE OF THE NET PENSION LIABILITYCOST-SHARING PENSION PLAN - ELECTED OFFICIAL
100

City's Contributions City's ContributionsFiscal Year Statutorily in Relation to City's as a Percentage
Valuation Ending Required Statutorily Required Contribution Covered of Covered EmployeeDate June 30, Contribution Contribution Deficiency (Excess) Payroll Payroll
6/30/2014 2015 43,829$ 43,829$ $ 186,000$ 23.56%6/30/2013 2014 55,049 55,049 186,000 29.60%
CITY OF TUCSON, ARIZONAREQUIRED SUPPLEMENTARY INFORMATION
SCHEDULE OF CONTRIBUTIONSCOST-SHARING PENSION PLAN - ELECTED OFFICIAL
101
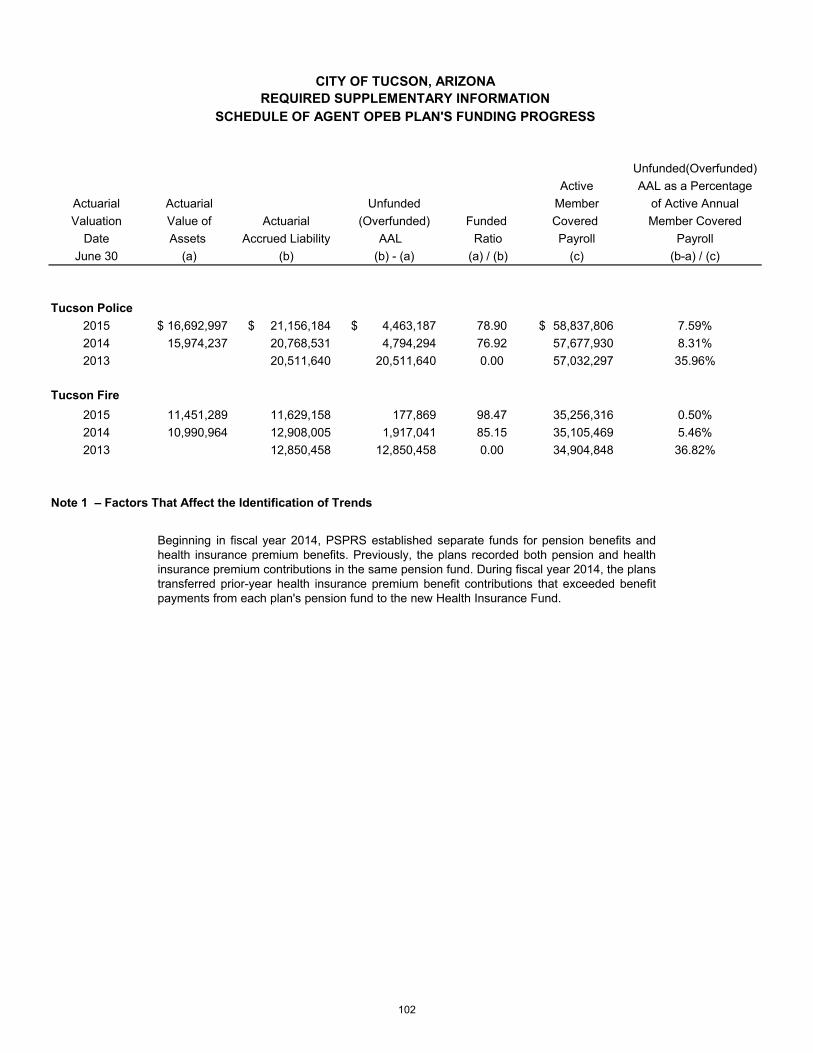
Unfunded(Overfunded)AAL as a Percentage
Actuarial of Active AnnualValuation Member Covered
Date PayrollJune 30 (b-a) / (c)
Tucson Police2015 16,692,997$ 21,156,184$ 4,463,187$ 78.90 58,837,806$ 7.59%2014 15,974,237 20,768,531 4,794,294 76.92 57,677,930 8.31%2013 20,511,640 20,511,640 0.00 57,032,297 35.96%
Tucson Fire2015 11,451,289 11,629,158 177,869 98.47 35,256,316 0.50%2014 10,990,964 12,908,005 1,917,041 85.15 35,105,469 5.46%2013 12,850,458 12,850,458 0.00 34,904,848 36.82%
Note 1 – Factors That Affect the Identification of Trends
(c)
ActuarialValue of Funded
(a) / (b)(b) - (a)
CITY OF TUCSON, ARIZONAREQUIRED SUPPLEMENTARY INFORMATION
SCHEDULE OF AGENT OPEB PLAN'S FUNDING PROGRESS
ActuarialAssets
(a)
ActiveMemberCovered
Accrued Liability(b)
RatioAAL Payroll
Unfunded(Overfunded)
Beginning in fiscal year 2014, PSPRS established separate funds for pension benefits and health insurance premium benefits. Previously, the plans recorded both pension and health insurance premium contributions in the same pension fund. During fiscal year 2014, the plans transferred prior-year health insurance premium benefit contributions that exceeded benefit payments from each plan's pension fund to the new Health Insurance Fund.
102
CITY OF TUCSON, ARIZONA
Co
mb
ining State
me
nts and Ind
ividual
Fund State
me
nts and Sche
dule
s
COMBINING STATEMENTS AND INDIVIDUALFUND STATEMENTS AND SCHEDULES
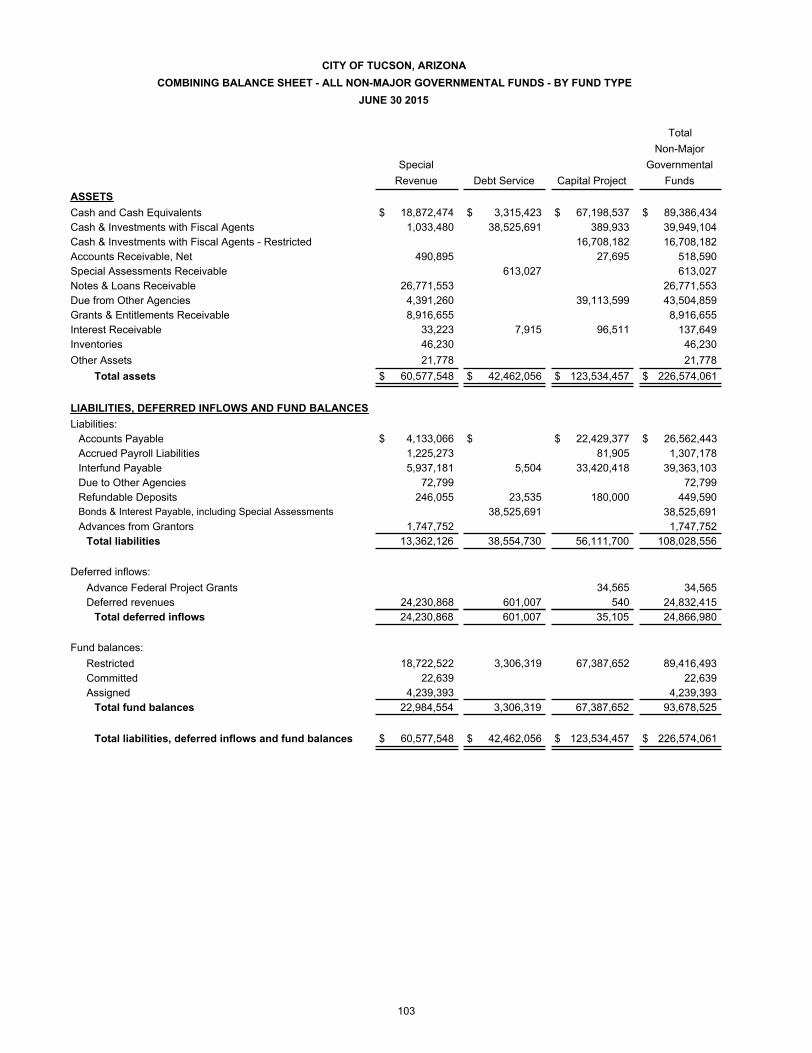
CITY OF TUCSON, ARIZONACOMBINING BALANCE SHEET - ALL NON-MAJOR GOVERNMENTAL FUNDS - BY FUND TYPE
JUNE 30 2015
TotalNon-Major
Special GovernmentalRevenue Debt Service Capital Project Funds
ASSETSCash and Cash Equivalents $ 18,872,474 $ 3,315,423 $ 67,198,537 $ 89,386,434Cash & Investments with Fiscal Agents 1,033,480 38,525,691 389,933 39,949,104Cash & Investments with Fiscal Agents - Restricted 16,708,182 16,708,182Accounts Receivable, Net 490,895 27,695 518,590Special Assessments Receivable 613,027 613,027Notes & Loans Receivable 26,771,553 26,771,553Due from Other Agencies 4,391,260 39,113,599 43,504,859Grants & Entitlements Receivable 8,916,655 8,916,655Interest Receivable 33,223 7,915 96,511 137,649Inventories 46,230 46,230Other Assets 21,778 21,778
Total assets $ 60,577,548 $ 42,462,056 $ 123,534,457 $ 226,574,061
LIABILITIES, DEFERRED INFLOWS AND FUND BALANCESLiabilities:
Accounts Payable $ 4,133,066 $ $ 22,429,377 $ 26,562,443Accrued Payroll Liabilities 1,225,273 81,905 1,307,178Interfund Payable 5,937,181 5,504 33,420,418 39,363,103Due to Other Agencies 72,799 72,799Refundable Deposits 246,055 23,535 180,000 449,590Bonds & Interest Payable, including Special Assessments 38,525,691 38,525,691Advances from Grantors 1,747,752 1,747,752
Total liabilities 13,362,126 38,554,730 56,111,700 108,028,556
Deferred inflows:Advance Federal Project Grants 34,565 34,565Deferred revenues 24,230,868 601,007 540 24,832,415
Total deferred inflows 24,230,868 601,007 35,105 24,866,980
Fund balances:Restricted 18,722,522 3,306,319 67,387,652 89,416,493Committed 22,639 22,639Assigned 4,239,393 4,239,393
Total fund balances 22,984,554 3,306,319 67,387,652 93,678,525
Total liabilities, deferred inflows and fund balances $ 60,577,548 $ 42,462,056 $ 123,534,457 $ 226,574,061
103

CITY OF TUCSON, ARIZONA
COMBINING BALANCE SHEET - NON-MAJOR SPECIAL REVENUE FUNDS
JUNE 30 2015
Convention
ParkWise Center Fund H.U.R.F. Fund
ASSETS
Cash and Cash Equivalents $ 1,904,415 $ 1,773,427 $ 8,633,579
Cash & Investments with Fiscal Agents 19,278 433,502
Accounts Receivable, Net 109,943 63,661 277,983
Notes & Loans Receivable
Due from Other Agencies 3,473,927
Grants & Entitlements Receivable
Interest Receivable 5,163 28,060
Inventories 46,230
Other Assets 20,650
Total assets $ 2,038,799 $ 1,903,968 $ 12,847,051
LIABILITIES, DEFERRED INFLOWS AND FUND BALANCES
Liabilities:
Accounts Payable $ 281,722 $ 831,155 $ 703,721
Accrued Payroll Liabilities 38,536 2,209 689,056
Interfund Payable
Due to Other Agencies 586 58,637 935
Refundable Deposits 2,891 158 18,500
Advances from Grantors
Total liabilities 323,735 892,159 1,412,212
Deferred inflows:
Deferred revenues 987,309
Total deferred inflows 987,309
Fund balances:
Restricted 11,434,839
Committed 19,278
Assigned 1,695,786 24,500
Total fund balances 1,715,064 24,500 11,434,839
Total liabilities, deferred inflows and fund balances $ 2,038,799 $ 1,903,968 $ 12,847,051
104

Community
Development Miscellaneous HOME
Civic Block Grants Housing Grant Public Housing Affordable Other Federal
Contribution Fund Fund Fund Section 8 Fund Housing Fund Grants Fund
$ 621,514 $ 50,000 $ $ 3,162,061 $ $
580,700
29,303 73 9,932
5,518,013 21,253,540
37,752
1,313,592 1,179,907 2,060 614,962 5,806,134
1,128
$ 622,642 $ 6,910,908 $ 1,217,659 $ 3,164,194 $ 21,878,434 $ 6,386,834
$ 2,359 $ 639,968 $ 353,450 $ 138,589 $ 277,743 $ 674,037
52,803 25,010 58,188 17,544 307,887
510,611 839,199 180,311 4,235,681
17 11,384
25,385 169,146 12,757 17,218
24,433 1,072,348
2,359 1,253,217 1,217,659 365,923 488,355 6,318,555
1,993,162 21,250,397
1,993,162 21,250,397
616,922 3,664,529 2,798,271 139,682 68,279
3,361
620,283 3,664,529 2,798,271 139,682 68,279
$ 622,642 $ 6,910,908 $ 1,217,659 $ 3,164,194 $ 21,878,434 $ 6,386,834
(Continued)
105

CITY OF TUCSON, ARIZONA
COMBINING BALANCE SHEET - NON-MAJOR SPECIAL REVENUE FUNDS
JUNE 30 2015
(Concluded)
Non-FederalGrants Fund Sun Link Fund Totals
ASSETS Cash and Cash Equivalents $ $ 2,727,478 $ 18,872,474
Cash & Investments with Fiscal Agents 1,033,480Accounts Receivable, Net 490,895Notes & Loans Receivable 26,771,553Due from Other Agencies 879,581 4,391,260Grants & Entitlements Receivable 8,916,655Interest Receivable 33,223Inventories 46,230Other Assets 21,778Total assets $ 879,581 $ 2,727,478 $ 60,577,548
LIABILITIES, DEFERRED INFLOWS AND FUND BALANCESLiabilities:
Accounts Payable $ 23,159 $ 207,163 $ 4,133,066Accrued Payroll Liabilities 34,040 1,225,273Interfund Payable 171,379 5,937,181Due to Other Agencies 32 1,208 72,799Refundable Deposits 246,055Advances from Grantors 650,971 1,747,752
Total liabilities 879,581 208,371 13,362,126
Deferred inflows:Deferred revenues 24,230,868
Total deferred inflows 24,230,868
Fund balances:Restricted 18,722,522Committed 22,639Assigned 2,519,107 4,239,393
Total fund balances 2,519,107 22,984,554
Total liabilities, deferred inflows and fund balances $ 879,581 $ 2,727,478 $ 60,577,548
106

CITY OF TUCSON, ARIZONACOMBINING BALANCE SHEET - NON-MAJOR DEBT SERVICE FUNDS
JUNE 30 2015
Special GeneralAssessment Obligation Street &
Bond & Interest Bond & Interest Highway BondFund Fund & Interest Fund Totals
ASSETSCash and Cash Equivalents $ 1,309,877 $ 2,005,546 $ $ 3,315,423Cash & Investments with Fiscal Agents 29,340 23,972,785 14,523,566 38,525,691Special Assessments Receivable 613,027 613,027Interest Receivable 2,411 5,504 7,915
Total assets $ 1,954,655 $ 25,978,331 $ 14,529,070 $ 42,462,056
LIABILITIES, DEFERRED INFLOWS AND FUND BALANCESLiabilities:
Interfund Payable $ $ $ 5,504 $ 5,504Refundable Deposits 23,535 23,535Bonds & Interest Payable, including Special Assessments 29,340 23,972,785 14,523,566 38,525,691
Total liabilities 52,875 23,972,785 14,529,070 38,554,730
Deferred inflows:
Deferred revenues 601,007 601,007Total deferred inflows 601,007 601,007
Fund balances:
Restricted 1,300,773 2,005,546 3,306,319Total fund balances 1,300,773 2,005,546 3,306,319
Total liabilities, deferred inflows and fund balances $ 1,954,655 $ 25,978,331 $ 14,529,070 $ 42,462,056
107
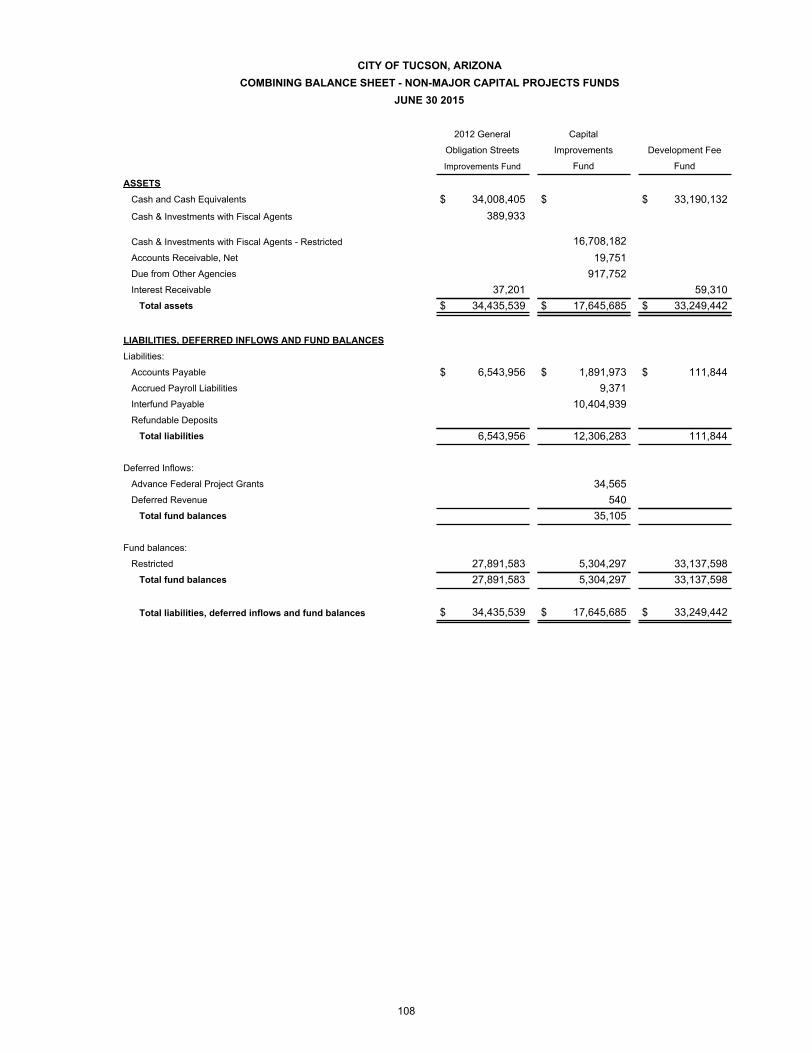
CITY OF TUCSON, ARIZONACOMBINING BALANCE SHEET - NON-MAJOR CAPITAL PROJECTS FUNDS
JUNE 30 2015
2012 General Capital
Obligation Streets Improvements Development Fee
Improvements Fund Fund Fund
ASSETSCash and Cash Equivalents $ 34,008,405 $ $ 33,190,132Cash & Investments with Fiscal Agents 389,933
Cash & Investments with Fiscal Agents - Restricted 16,708,182Accounts Receivable, Net 19,751Due from Other Agencies 917,752Interest Receivable 37,201 59,310
Total assets $ 34,435,539 $ 17,645,685 $ 33,249,442
LIABILITIES, DEFERRED INFLOWS AND FUND BALANCESLiabilities:
Accounts Payable $ 6,543,956 $ 1,891,973 $ 111,844Accrued Payroll Liabilities 9,371Interfund Payable 10,404,939Refundable Deposits
Total liabilities 6,543,956 12,306,283 111,844
Deferred Inflows:
Advance Federal Project Grants 34,565Deferred Revenue 540
Total fund balances 35,105
Fund balances:
Restricted 27,891,583 5,304,297 33,137,598Total fund balances 27,891,583 5,304,297 33,137,598
Total liabilities, deferred inflows and fund balances $ 34,435,539 $ 17,645,685 $ 33,249,442
108

Regional
Transportation
Authority Fund Totals
$ $ 67,198,537389,933
16,708,1827,944 27,695
38,195,847 39,113,59996,511
$ 38,203,791 $ 123,534,457
$ 13,881,604 $ 22,429,37772,534 81,905
23,015,479 33,420,418180,000 180,000
37,149,617 56,111,700
34,565540
35,105
1,054,174 67,387,6521,054,174 67,387,652
$ 38,203,791 $ 123,534,457
109

CITY OF TUCSON, ARIZONACOMBINING STATEMENT OF REVENUES, EXPENDITURES AND CHANGES IN FUND BALANCES -
ALL NON-MAJOR GOVERNMENTAL FUNDS - BY FUND TYPEYEAR ENDED JUNE 30, 2015
TotalNon-Major
GovernmentalSpecial Revenue Debt Service Capital Projects Funds
Revenues:Taxes $ $ 30,148,102 $ $ 30,148,102Licenses and Permits 378,391 378,391Fines and Forfeitures 766,145 2,629 768,774Developer Fees 1,522,640 1,522,640Use of Money and Property 902,605 29,784 526,489 1,458,878Federal Grants and Contributions 66,636,184 19,751 66,655,935Other Agencies 40,959,615 7,900,509 41,863,482 90,723,606Charges for Services 10,439,588 10,439,588Special Assessments 323,164 323,164Contributions from Outside Sources 401,711 401,711Miscellaneous 940,581 1,100,895 2,041,476
Total revenues 121,424,820 38,404,188 45,033,257 204,862,265
Expenditures:Current -
Elected and Official 379,604 379,604Public Safety and Justice Services 11,710,844 83 11,710,927Community Enrichment and Development 96,115,936 23,416,390 119,532,326Support Services 142,591 142,591Non-Departmental 1,440,378 1,440,378
Capital Outlay 3,834,251 2,503,868 6,338,119Capital Projects 5,076,502 54,935,816 60,012,318Debt service -
Principal 1,315,000 33,463,000 34,778,000Interest 1,087,732 14,254,688 659,371 16,001,791Fiscal Agent Fees 3,975 3,975Debt Issuance Costs 562,055 148,587 710,642Total expenditures 120,960,247 48,283,718 81,806,706 251,050,671
Excess (deficiency) of revenues over expenditures 464,573 (9,879,530) (36,773,449) (46,188,406)
Other financing sources (uses):Bond Issuance 63,950,000 20,000,000 83,950,000Capital LeasesPremium on Debt Issuance 5,169,671 538,520 5,708,191Refunded Bond Escrow Agent (66,938,954) (66,938,954)Transfers In 6,862,879 8,877,066 10,559,633 26,299,578Transfers Out (8,877,066) (10,534,700) (19,411,766)
Total other financing sources (uses) (2,014,187) 11,057,783 20,563,453 29,607,049
Change in fund balances (1,549,614) 1,178,253 (16,209,996) (16,581,357)
Fund balances, beginning of year 24,534,168 2,128,066 83,597,648 110,259,882
Fund balances, end of year $ 22,984,554 $ 3,306,319 $ 67,387,652 $ 93,678,525
110

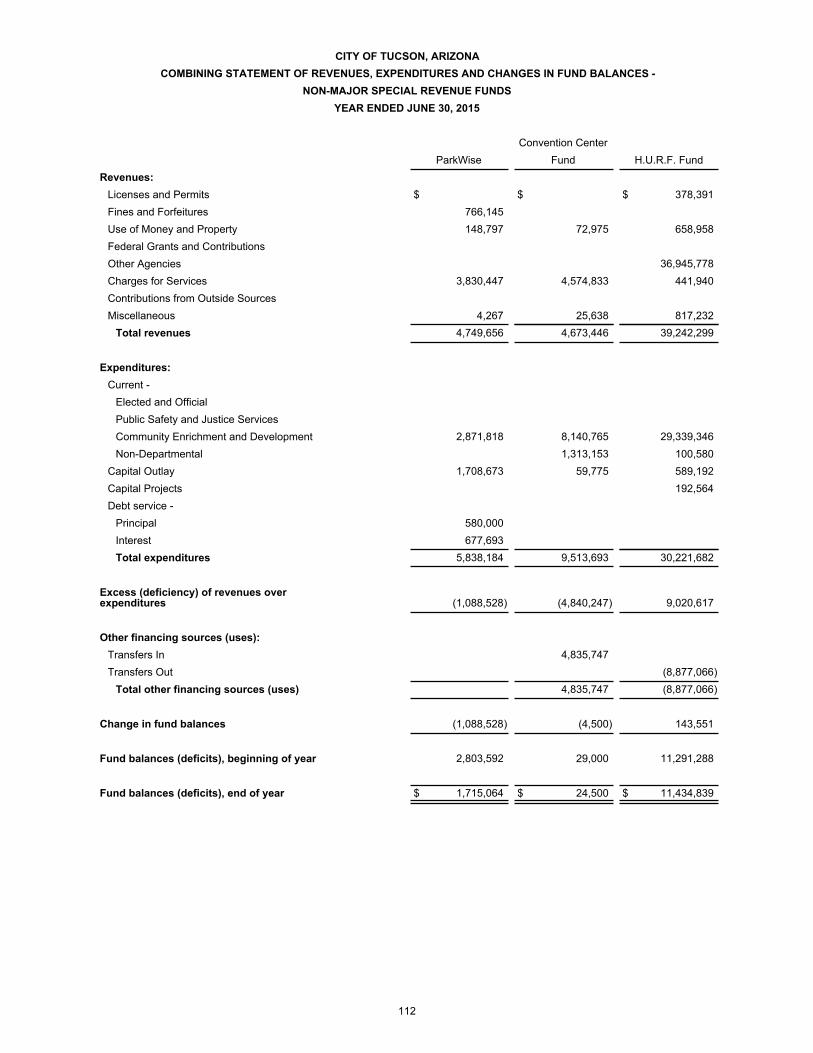
CITY OF TUCSON, ARIZONACOMBINING STATEMENT OF REVENUES, EXPENDITURES AND CHANGES IN FUND BALANCES -
NON-MAJOR SPECIAL REVENUE FUNDSYEAR ENDED JUNE 30, 2015
Convention CenterParkWise Fund H.U.R.F. Fund
Revenues:Licenses and Permits $ $ $ 378,391Fines and Forfeitures 766,145Use of Money and Property 148,797 72,975 658,958Federal Grants and ContributionsOther Agencies 36,945,778Charges for Services 3,830,447 4,574,833 441,940Contributions from Outside SourcesMiscellaneous 4,267 25,638 817,232
Total revenues 4,749,656 4,673,446 39,242,299
Expenditures:Current -
Elected and OfficialPublic Safety and Justice ServicesCommunity Enrichment and Development 2,871,818 8,140,765 29,339,346Non-Departmental 1,313,153 100,580
Capital Outlay 1,708,673 59,775 589,192Capital Projects 192,564Debt service -
Principal 580,000Interest 677,693Total expenditures 5,838,184 9,513,693 30,221,682
Excess (deficiency) of revenues over expenditures (1,088,528) (4,840,247) 9,020,617
Other financing sources (uses):Transfers In 4,835,747Transfers Out (8,877,066)
Total other financing sources (uses) 4,835,747 (8,877,066)
Change in fund balances (1,088,528) (4,500) 143,551
Fund balances (deficits), beginning of year 2,803,592 29,000 11,291,288
Fund balances (deficits), end of year $ 1,715,064 $ 24,500 $ 11,434,839
112
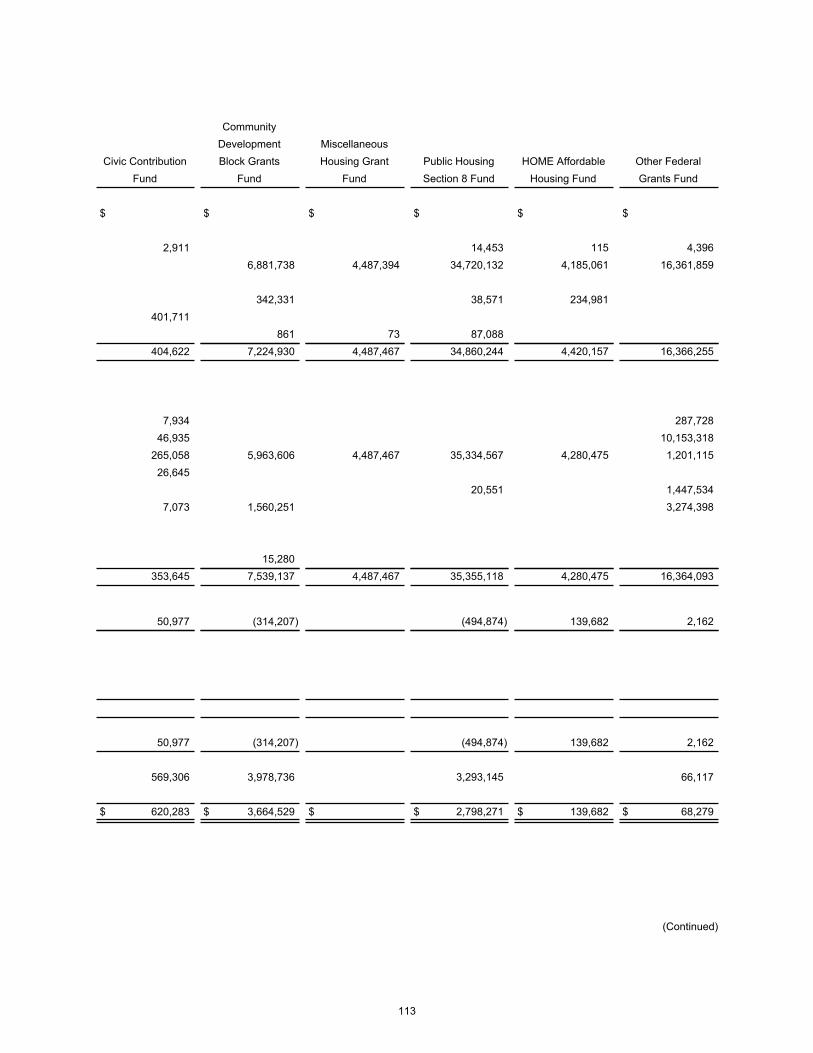
CommunityDevelopment Miscellaneous
Civic Contribution Block Grants Housing Grant Public Housing HOME Affordable Other FederalFund Fund Fund Section 8 Fund Housing Fund Grants Fund
$ $ $ $ $ $
2,911 14,453 115 4,3966,881,738 4,487,394 34,720,132 4,185,061 16,361,859
342,331 38,571 234,981401,711
861 73 87,088404,622 7,224,930 4,487,467 34,860,244 4,420,157 16,366,255
7,934 287,72846,935 10,153,318
265,058 5,963,606 4,487,467 35,334,567 4,280,475 1,201,11526,645
20,551 1,447,5347,073 1,560,251 3,274,398
15,280353,645 7,539,137 4,487,467 35,355,118 4,280,475 16,364,093
50,977 (314,207) (494,874) 139,682 2,162
50,977 (314,207) (494,874) 139,682 2,162
569,306 3,978,736 3,293,145 66,117
$ 620,283 $ 3,664,529 $ $ 2,798,271 $ 139,682 $ 68,279
(Continued)
113

CITY OF TUCSON, ARIZONACOMBINING STATEMENT OF REVENUES, EXPENDITURES AND CHANGES IN FUND BALANCES -
NON-MAJOR SPECIAL REVENUE FUNDSYEAR ENDED JUNE 30, 2015
(Concluded)
Non-FederalGrants Fund Sun Link Fund Totals
Revenues:Licenses and Permits $ $ $ 378,391Fines and Forfeitures 766,145Use of Money and Property 902,605Federal Grants and Contributions 66,636,184Other Agencies 2,012,209 2,001,628 40,959,615Charges for Services 976,485 10,439,588Contributions from Outside Sources 401,711Miscellaneous 5,422 940,581
Total revenues 2,012,209 2,983,535 121,424,820
Expenditures:Current -
Elected and Official 83,942 379,604Public Safety and Justice Services 1,510,591 11,710,844Community Enrichment and Development 375,460 3,856,259 96,115,936Non-Departmental 1,440,378Capital Outlay 8,526 3,834,251Capital Projects 42,216 5,076,502
Debt service -Principal 735,000 1,315,000Interest 394,759 1,087,732Total expenditures 2,012,209 4,994,544 120,960,247
Excess (deficiency) of revenues overexpenditures (2,011,009) 464,573
Other financing sources (uses):Transfers In 2,027,132 6,862,879Transfers Out (8,877,066)
Total other financing sources (uses) 2,027,132 (2,014,187)
Change in fund balances 16,123 (1,549,614)
Fund balances (deficits), beginning of year 2,502,984 24,534,168
Fund balances (deficits), end of year $ $ 2,519,107 $ 22,984,554
114

CITY OF TUCSON, ARIZONACOMBINING STATEMENT OF REVENUES, EXPENDITURES AND CHANGES IN FUND BALANCES -
NON-MAJOR DEBT SERVICE FUNDSYEAR ENDED JUNE 30, 2015
SpecialAssessment General Street & Highway
Bond & Interest Obligation Bond Bond & InterestFund & Interest Fund Fund Totals
Revenues:Taxes $ $ 30,148,102 $ $ 30,148,102Fines and Forfeitures 2,629 2,629Use of Money and Property 10,134 19,650 29,784Other Agencies 7,900,509 7,900,509Special Assessments 323,164 323,164
Total revenues 335,927 30,148,102 7,920,159 38,404,188
Expenditures:Debt service -
Principal 438,000 20,060,000 12,965,000 33,463,000Interest 70,064 9,640,274 4,544,350 14,254,688Fiscal Agent Fees 1,500 1,475 1,000 3,975Debt Issuance Costs 303,819 258,236 562,055Total expenditures 509,564 30,005,568 17,768,586 48,283,718
Excess (deficiency) of revenues over expenditures (173,637) 142,534 (9,848,427) (9,879,530)
Other financing sources (uses):Bond Issuance 36,535,000 27,415,000 63,950,000Premium on Debt Issuance 3,088,310 2,081,361 5,169,671Refunded Bond Escrow Agent (38,413,954) (28,525,000) (66,938,954)Transfers In 8,877,066 8,877,066
Total other financing sources (uses) 1,209,356 9,848,427 11,057,783
Change in fund balances (173,637) 1,351,890 1,178,253
Fund balances, beginning of year 1,474,410 653,656 2,128,066
Fund balances (deficits), end of year $ 1,300,773 $ 2,005,546 $ $ 3,306,319
115

CITY OF TUCSON, ARIZONACOMBINING STATEMENT OF REVENUES, EXPENDITURES AND CHANGES IN FUND BALANCES -
NON-MAJOR CAPITAL PROJECTS FUNDSYEAR ENDED JUNE 30, 2015
Capital 2012 GeneralImprovements Obligation Streets
Fund Improvements FundRevenues:
Developer Fees $ $Use of Money and Property 2,046 192,306Grants and Contributions 19751Other Agencies 1,505,122Miscellaneous 80,118
Total revenues 1,607,037 192,306
Expenditures:Current -
Public Safety and Justice Services 83Community Enrichment and Development 49,839 23,014,670Support Services 45,649Capital Outlay 284,811Capital Projects 2,781,997
Debt service -Interest 659,371Debt Issuance Costs 148,587Total expenditures 3,821,750 23,163,257
Excess (deficiency) of revenues over expenditures (2,214,713) (22,970,951)
Other financing sources (uses):Bond Issuance 20,000,000Capital LeasesPremium on Debt Issuance 538,520Transfers InTransfers Out (10,534,700)
Total other financing sources (uses) (10,534,700) 20,538,520
Change in fund balances (12,749,413) (2,432,431)
Fund balances, beginning of year 18,053,710 30,324,014
Fund balances, end of year $ 5,304,297 $ 27,891,583
116

RegionalDevelopment Fee Transportation
Fund Authority Fund Totals
$ 1,522,640 $ $ 1,522,640260,956 71,181 526,489
19,75140,358,360 41,863,482
1,020,777 1,100,8951,783,596 41,450,318 45,033,257
83351,881 23,416,390
96,942 142,5912,219,057 2,503,868
3,760,516 48,393,303 54,935,816
659,371148,587
3,857,458 50,964,241 81,806,706
(2,073,862) (9,513,923) (36,773,449)
20,000,000
538,52024,933 10,534,700 10,559,633
(10,534,700)24,933 10,534,700 20,563,453
(2,048,929) 1,020,777 (16,209,996)
35,186,527 33,397 83,597,648
$ 33,137,598 $ 1,054,174 $ 67,387,652
117
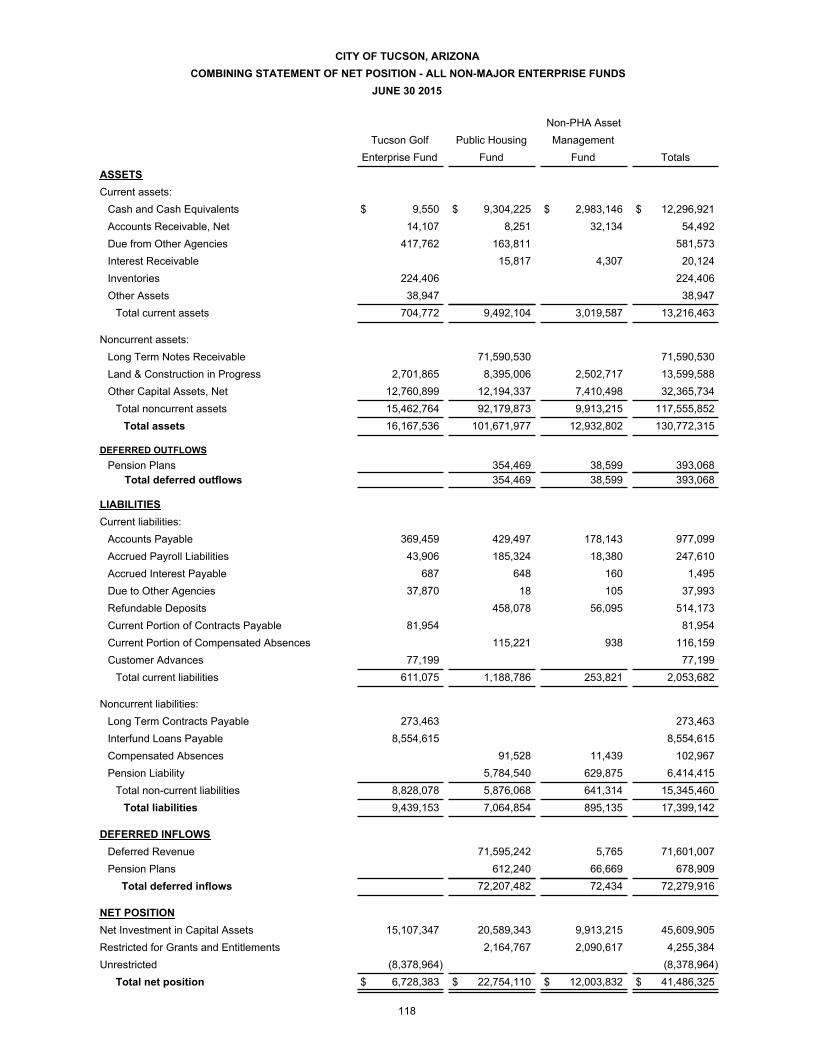
CITY OF TUCSON, ARIZONACOMBINING STATEMENT OF NET POSITION - ALL NON-MAJOR ENTERPRISE FUNDS
JUNE 30 2015
Non-PHA AssetTucson Golf Public Housing Management
Enterprise Fund Fund Fund TotalsASSETSCurrent assets:
Cash and Cash Equivalents $ 9,550 $ 9,304,225 $ 2,983,146 $ 12,296,921Accounts Receivable, Net 14,107 8,251 32,134 54,492Due from Other Agencies 417,762 163,811 581,573Interest Receivable 15,817 4,307 20,124Inventories 224,406 224,406Other Assets 38,947 38,947
Total current assets 704,772 9,492,104 3,019,587 13,216,463
Noncurrent assets:Long Term Notes Receivable 71,590,530 71,590,530Land & Construction in Progress 2,701,865 8,395,006 2,502,717 13,599,588Other Capital Assets, Net 12,760,899 12,194,337 7,410,498 32,365,734
Total noncurrent assets 15,462,764 92,179,873 9,913,215 117,555,852Total assets 16,167,536 101,671,977 12,932,802 130,772,315
DEFERRED OUTFLOWSPension Plans 354,469 38,599 393,068
Total deferred outflows 354,469 38,599 393,068
LIABILITIESCurrent liabilities:
Accounts Payable 369,459 429,497 178,143 977,099Accrued Payroll Liabilities 43,906 185,324 18,380 247,610Accrued Interest Payable 687 648 160 1,495Due to Other Agencies 37,870 18 105 37,993Refundable Deposits 458,078 56,095 514,173Current Portion of Contracts Payable 81,954 81,954Current Portion of Compensated Absences 115,221 938 116,159Customer Advances 77,199 77,199
Total current liabilities 611,075 1,188,786 253,821 2,053,682
Noncurrent liabilities:Long Term Contracts Payable 273,463 273,463Interfund Loans Payable 8,554,615 8,554,615Compensated Absences 91,528 11,439 102,967Pension Liability 5,784,540 629,875 6,414,415
Total non-current liabilities 8,828,078 5,876,068 641,314 15,345,460Total liabilities 9,439,153 7,064,854 895,135 17,399,142
DEFERRED INFLOWSDeferred Revenue 71,595,242 5,765 71,601,007Pension Plans 612,240 66,669 678,909
Total deferred inflows 72,207,482 72,434 72,279,916
NET POSITIONNet Investment in Capital Assets 15,107,347 20,589,343 9,913,215 45,609,905Restricted for Grants and Entitlements 2,164,767 2,090,617 4,255,384Unrestricted (8,378,964) (8,378,964)
Total net position $ 6,728,383 $ 22,754,110 $ 12,003,832 $ 41,486,325
118

CITY OF TUCSON, ARIZONACOMBINING STATEMENT OF REVENUES, EXPENSES, AND CHANGES IN FUND NET POSITION -
ALL NON-MAJOR ENTERPRISE FUNDSFOR THE YEAR ENDED JUNE 30, 2015
Non-PHA AssetTucson Golf Public Housing Management
Enterprise Fund Fund Fund TotalsOperating revenues:
Charges for Services $ 7,138,080 $ 3,779,967 $ 1,084,595 $ 12,002,642Federal Grants and Contributions 5,881,411 228,604 $ 6,110,015Miscellaneous 1,202 602,206 $ 603,408
Total operating revenues 7,139,282 10,263,584 1,313,199 18,716,065
Operating expenses:Salaries, Wages and Benefits 43,685 4,693,815 767,274 5,504,774Contractual Services 5,711,867 3,528,255 1,045,458 10,285,580Commodities 1,180,419 763,214 160,612 2,104,245Cost of Goods Sold 597,432 597,432Depreciation 722,768 920,414 294,007 1,937,189
Total operating expenses 8,256,171 9,905,698 2,267,351 20,429,220
Operating loss (1,116,889) 357,886 (954,152) (1,713,155)
Nonoperating revenues (expenses):Investment Income 53,329 75,079 128,408Gain (loss) on Sale of Property/Equipment 7,051 326,166 333,217Interest Expense (11,167) (68,590) (79,757)
Total nonoperating revenues (expense) (11,167) (8,210) 401,245 381,868
Income (loss) before capital contributions,transfers and special items (1,128,056) 349,676 (552,907) (1,331,287)
Capital Contributions (185,611) (185,611)Transfers In 80,000 80,000Transfers Out (80,000) (80,000)
Change in net position (1,128,056) 84,065 (472,907) (1,516,898)
Total net position, beginning of year - Restated 7,856,439 22,670,045 12,476,739 43,003,223
Total net position, end of year $ 6,728,383 $ 22,754,110 $ 12,003,832 $ 41,486,325
119

CITY OF TUCSON, ARIZONACOMBINING STATEMENT OF CASH FLOWS - ALL NON-MAJOR ENTERPRISE FUNDS
FOR THE YEAR ENDED JUNE 30, 2015
Tucson Golf Public Housing Non-PHA AssetEnterprise Fund Fund Management Total
Cash Flows from Operating Activities:Cash Received from Customers $ 7,165,177 $ 4,672,148 $ 1,094,042 $12,931,367Cash Payments to Suppliers for Goods and Services (7,729,785) (4,160,658) (1,074,530) (12,964,973)Cash Payments to Employees for Services (4,209) (4,677,698) (437,675) (5,119,582)Subsidy from Federal Grant 5,782,598 228,604 6,011,202Other Operating Revenues 1,202 1,202
Net Cash Provided (Used) by Operating Activities (567,615) 1,616,390 (189,559) 859,216
Cash Flows from Noncapital Financing ActivitiesInterfund Transfers (80,000) 80,000Advances from Other Funds 648,168 648,168Interest Paid on Advances (5,616) (5,616)
Net Cash Provided (Used) by Noncapital FinancingActivities 642,552 (80,000) 80,000 642,552
Cash Flows from Capital and Related FinancingActivities:
Proceeds from Leasing Activities 423,050 423,050Acquisition and Construction of Capital Assets (423,050) (13,466) (436,516)Principal Paid on Capital Debt (67,633) (67,633)Interest Paid on Capital Debt (7,304) (68,590) (75,894)Proceeds from Sale of Assets/Equipment 7,051 374,529 381,580
Net Cash Provided (Used) by Capital and RelatedFinancing Activities (74,937) (75,005) 374,529 224,587
Cash Flows from Investing Activities:Interest on Investments 56,018 72,870 128,888Net Cash Provided (Used) by Investing Activities 56,018 72,870 128,888
Net Increase (Decrease) in Cash and CashEquivalents 1,517,403 337,840 1,855,243Cash and Cash Equivalents - July 1 9,550 7,786,822 2,645,306 10,441,678Cash and Cash Equivalents - June 30 $ 9,550 $ 9,304,225 $ 2,983,146 12,296,921
Reconciliation of Operating Income to Net CashProvided (Used )by Operating Activities:Operating Income (Loss) $ (1,116,889) $ 357,886 $ (954,152) $ (1,713,155)Adjustments to Reconcile Operating Income to
Net Cash Provided (Used) by Operating Activities:Depreciation and Amortization 722,768 920,414 294,007 1,937,189
Other Adjustments:Decrease (Increase) in Assets:
Accounts Receivable 30,773 1,049 (21,756) 10,066Deferred Outflow of Resources - Pension Plan (354,469) (38,599) (393,068)Due from Other Agencies (98,813) (98,813)Inventory and Prepaids (106,626) (106,626)
Increase (Decrease) in Liabilities:Accounts Payable (142,051) 131,114 131,539 120,602Accrued Payroll Liabilities 39,476 (13,636) 8,273 34,113Accrued Compensated Absences 24,138 (3,563) 20,575Deferred Inflow of Resources - Pension Plan 612,240 66,669 678,909Unfunded Pension Liability 5,615 296,820 302,435Deferred Revenue 55,267 4,748 60,015Customer/Refundable Deposits 683 (24,433) 26,350 2,600Due to Other Agencies 7,927 18 105 8,050Other Operating Liabilities (3,676) (3,676)Net Cash Provided (Used ) by Operating Activities $ (567,615) $ 1,616,390 $ (189,559) $ 859,216
120

CITY OF TUCSON, ARIZONACOMBINING STATEMENT OF NET POSITION - ALL INTERNAL SERVICE FUNDS
JUNE 30 2015
Self Insurance General ServicesFleet Services Fund Fund Totals
ASSETSCurrent assets:
Cash and Cash Equivalents $ 2,207,855 $ 10,317,635 $ 2,563,143 $ 15,088,633Accounts Receivable, Net 121,498 6,384 127,882Due from Other Agencies 16,509 16,509Interest Receivable 2,043 273,737 5,373 281,153Inventories 860,881 860,881Other Assets 426,766 426,766
Total current assets 3,208,786 11,018,138 2,574,900 16,801,824
Noncurrent assets:Other Assets - Restricted 31,244,637 31,244,637Land & Construction in Progress 317,073 30,242 321,049 668,364Other Capital Assets, Net 8,663,569 99,704 214,589 8,977,862
Total noncurrent assets 8,980,642 31,374,583 535,638 40,890,863Total assets 12,189,428 42,392,721 3,110,538 57,692,687
LIABILITIESCurrent liabilities:
Accounts Payable 617,014 284,996 941,656 1,843,666Accrued Payroll Liabilities 250,226 49,529 369,400 669,155Current Portion of Bonds Payable 1,319,300 1,319,300Due to Other Agencies 150 52 476 678Claims Payable 9,422,515 9,422,515Remediation Obligations 348,305 348,305
Total current liabilities 867,390 10,105,397 2,630,832 13,603,619
Noncurrent liabilities:Bonds Payable 11,260,800 11,260,800Claims Payable 30,513,985 30,513,985Remediation Obligations 942,465 942,465
Total non-current liabilities 31,456,450 11,260,800 42,717,250Total liabilities 867,390 41,561,847 13,891,632 56,320,869
NET POSITIONNet Investment in Capital Assets 8,980,641 129,945 (12,044,461) (2,933,875)Restricted for Self Insurance Mandates 31,244,637 31,244,637Unrestricted 2,341,397 (30,543,708) 1,263,367 (26,938,944)
Total net position $ 11,322,038 $ 830,874 $ (10,781,094) $ 1,371,818
121

CITY OF TUCSON, ARIZONACOMBINING STATEMENT OF REVENUES, EXPENSES, AND CHANGES IN FUND NET POSITION -
ALL INTERNAL SERVICE FUNDSFOR THE YEAR ENDED JUNE 30, 2015
Self Insurance General ServicesFleet Services Fund Fund Totals
Operating revenues:Charges for Services $ 23,116,489 $ 16,960,158 $ 20,060,590 $ 60,137,237Miscellaneous 238,714 111,049 18,718 368,481
Total operating revenues 23,355,203 17,071,207 20,079,308 60,505,718
Operating expenses:Salaries, Wages and Benefits 5,879,344 1,187,766 8,598,939 15,666,049Contractual Services 4,919,537 3,954,089 7,007,642 15,881,268Commodities 12,228,510 79,318 1,991,633 14,299,461Benefits and Claims 10,126,137 10,126,137Depreciation 1,686,390 15,519 66,587 1,768,496
Total operating expenses 24,713,781 15,362,829 17,664,801 57,741,411
Operating income (loss) (1,358,578) 1,708,378 2,414,507 2,764,307
Nonoperating revenues (expenses):Property Taxes 1,430,708 1,430,708Other Agencies 310,729 310,729Investment Income 325 78,438 15,037 93,800Gain (loss) on Sale of Property/ Equipment 318,872 (50,122) 268,750Interest Expense (513,188) (513,188)
Total nonoperating revenues (expenses) 319,197 1,509,146 (237,544) 1,590,799
Income (loss) before capital contributions andtransfers (1,039,381) 3,217,524 2,176,963 4,355,106
Capital Contributions 3,729,350 (6,902) 3,722,448
Change in net position 2,689,969 3,217,524 2,170,061 8,077,554
Total net position, beginning of year 8,632,069 (2,386,650) (12,951,155) (6,705,736)
Total net position, end of year $ 11,322,038 $ 830,874 $ (10,781,094) $ 1,371,818
122

CITY OF TUCSON, ARIZONACOMBINING STATEMENT OF CASH FLOWS
ALL INTERNAL SERVICE FUNDSFOR THE YEAR ENDED JUNE 30, 2015
Self Insurance General ServicesFleet Services Fund Fund Total
Cash Flows from Operating Activities:Cash Received from Customers $ 23,112,271 $ 17,071,207 $ 20,079,650 $ 60,263,128Cash Payments to Suppliers for Goods and Services (17,377,760) (4,473,822) (8,877,833) (30,729,415)Cash Payments to Employees for Services (5,891,770) (1,182,686) (8,634,163) (15,708,619)Other Operating Revenues 238,714 238,714Cash Payments to Claimants (8,356,337) (8,356,337)
Net Cash Provided (Used) by Operating Activities 81,455 3,058,362 2,567,654 5,707,471
Cash Flows from Noncapital Financing Activities:Property Taxes 1,297,995 1,297,995Federal Subsidy for Energy Bonds Interest 310,729 310,729
Net Cash Provided (Used) byNoncapital Financing Activities 1,297,995 310,729 1,608,724
Cash Flows from Capital and Related Financing Activities:Acquisition and Construction of Capital Assets (90,745) 20,990 (69,755)Principal Paid on Capital Debt (1,309,300) (1,309,300)Interest Paid on Capital Debt (513,188) (513,188)Proceeds from Sale of Assets/Equipment 330,313 (50,123) 280,190
Net Cash Provided (Used) by Capital and Related Financing Activities 239,568 (1,851,621) (1,612,053)
Cash Flows from Investing Activities:Interest on Investments 157 188,502 13,227 201,886Proceeds from Sale of Investments 33,941,230 33,941,230Purchase of Investments (31,467,899) (31,467,899)
Net Cash Provided (Used) by Investing Activities 157 2,661,833 13,227 2,675,217
Net Increase (Decrease) in Cash and Cash Equivalents 321,180 7,018,190 1,039,989 8,379,359
Cash and Cash Equivalents - July 1 1,886,675 3,299,445 1,523,154 6,709,274
Cash and Cash Equivalents - June 30 $ 2,207,855 $ 10,317,635 $ 2,563,143 $ 15,088,633
Reconciliation of Operating Income (Loss) to NetCash Provided (Used )by Operating Activities:Operating Income (Loss) $ (1,358,578) $ 1,708,378 $ 2,414,507 $ 2,764,307Adjustments to Reconcile Operating Income toNet Cash Provided (Used) by Operating Activities:
Depreciation and Amortization 1,686,390 15,519 66,587 1,768,496Other Adjustments:
Decrease (Increase) in Assets:Accounts Receivable (4,052) 343 (3,709)Inventory (76,885) (76,885)Due from Other Agencies (167) (167)
Prepaid Expense 511,875 511,875Increase (Decrease) in Liabilities:
Accounts Payable (152,977) (67,392) 120,965 (99,404)Accrued Payroll Liabilities (12,426) 5,080 (35,224) (42,570)Claims and Judgments Payable 1,769,800 1,769,800Remediation Obligation (884,950) (884,950)Due to Other Agencies 150 52 476 678
Net Cash Provided (Used ) by Operating Activities 81,455 3,058,362 2,567,654 5,707,471
Noncash Investing, Capital,and Financing Activities:
Contributions of Capital Assets 3,729,350 6,902 3,736,252Total Noncash Investing, Capital and Financing Activities: $ 3,729,350 $ $ 6,902 $ 3,736,252
123

CITY OF TUCSON, ARIZONACOMBINING STATEMENT OF CHANGES IN ASSETS AND LIABILITIES
ALL AGENCY FUNDSJUNE 30 2015
Balance BalanceJuly 1, 2014 Additions Deductions June 30, 2015
Sewer User Fee FundAssetsCash and Cash Equivalents $ 4,298,705 $ 138,803,359 $ 141,583,922 $ 1,518,142Accounts Receivable, Net 10,236,490 142,916,337 141,863,775 11,289,052
Total assets $ 14,535,195 $ 281,719,696 $ 283,447,697 $ 12,807,194
LiabilitiesDue to Other Agencies $ 14,535,195 $ 421,494,746 $ 423,222,747 $ 12,807,194
Total liabilities $ 14,535,195 $ 421,494,746 $ 423,222,747 $ 12,807,194
Employee Prepaid Insurance FundAssetsCash and Cash Equivalents $ 5,878,130 $ 63,704,847 $ 69,314,642 $ 268,335Accounts Receivable, Net 499,232 499,232
Total assets $ 5,878,130 $ 64,204,079 $ 69,314,642 $ 767,567
LiabilitiesAccounts Payable $ 5,878,130 $ 63,659,539 $ 68,770,102 $ 767,567
Total liabilities $ 5,878,130 $ 63,659,539 $ 68,770,102 $ 767,567
High-Intensity Drug Trafficking (HIDTA)AssetsCash and Cash Equivalents $ 75,235 $ 5,249,333 $ 5,251,850 $ 72,718
Total assets $ 75,235 $ 5,249,333 $ 5,251,850 $ 72,718
LiabilitiesDue to Other Agencies $ 75,235 $ 5,249,333 $ 5,251,850 $ 72,718Total liabilities $ 75,235 $ 5,249,333 $ 5,251,850 $ 72,718
TotalsAssetsCash and Cash Equivalents $ 10,252,070 $ 207,757,539 $ 216,150,414 $ 1,859,195Accounts Receivable, Net 10,236,490 143,415,569 141,863,775 11,788,284
Total assets $ 20,488,560 $ 351,173,108 $ 358,014,189 $ 13,647,479
LiabilitiesAccounts Payable $ 5,878,130 $ 63,659,539 $ 68,770,102 $ 767,567Due to Other Agencies 14,610,430 426,744,079 428,474,597 12,879,912
Total liabilities $ 20,488,560 $ 490,403,618 $ 497,244,699 $ 13,647,479
124

BUDGET AND ACTUALNONMAJOR
GOVERNMENTAL FUNDS
125

CITY OF TUCSON, ARIZONACOMBINING SCHEDULE OF REVENUES, EXPENDITURES AND CHANGES IN
FUND BALANCES - BUDGET AND ACTUAL - NON-MAJOR SPECIAL REVENUE FUNDSYEAR ENDED JUNE 30, 2015
ParkWise
Variance -
Positive
Budget Actual (Negative)Revenues:
Licenses and Permits $ $ $Fines and Forfeitures 693,240 766,145 72,905Use of Money and Property 102,110 148,797 46,687Federal Grants and Contributions 0Other Agencies 0Charges for Services 3,686,640 3,830,447 143,807Contributions from Outside Sources 0Miscellaneous 4,267 4,267
Total revenues 4,481,990 4,749,656 267,666
Expenditures:Current -
Elected and OfficialPublic Safety and Justice ServicesCommunity Enrichment and Development 2,861,600 2,871,818 (10,218)Non-Departmental
Capital Outlay 1,676,450 1,708,673 (32,223)Capital ProjectsDebt service -
Principal 580,000 580,000Interest 668,040 677,693 (9,653)
Total expenditures 5,786,090 5,838,184 (52,094)
Excess (deficiency) of revenues overexpenditures (1,304,100) (1,088,528) 215,572
Other financing sources (uses):Transfers InTransfers Out
Total other financing sources (uses)
Change in fund balances $ (1,304,100) (1,088,528) $ 215,572
Fund balances, beginning of year 2,803,592
Fund balances (deficits), end of year $ 1,715,064
126
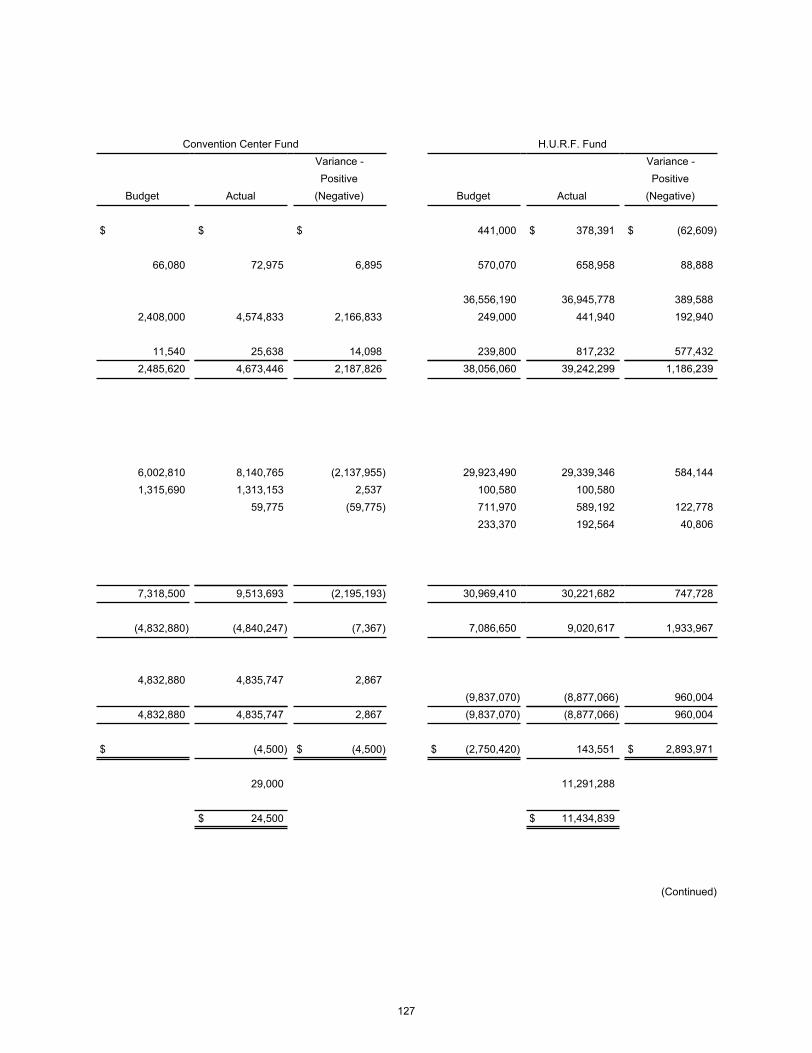
Convention Center Fund H.U.R.F. FundVariance - Variance -Positive Positive
Budget Actual (Negative) Budget Actual (Negative)
$ $ $ 441,000 $ 378,391 $ (62,609)
66,080 72,975 6,895 570,070 658,958 88,888
36,556,190 36,945,778 389,5882,408,000 4,574,833 2,166,833 249,000 441,940 192,940
11,540 25,638 14,098 239,800 817,232 577,4322,485,620 4,673,446 2,187,826 38,056,060 39,242,299 1,186,239
6,002,810 8,140,765 (2,137,955) 29,923,490 29,339,346 584,1441,315,690 1,313,153 2,537 100,580 100,580
59,775 (59,775) 711,970 589,192 122,778233,370 192,564 40,806
7,318,500 9,513,693 (2,195,193) 30,969,410 30,221,682 747,728
(4,832,880) (4,840,247) (7,367) 7,086,650 9,020,617 1,933,967
4,832,880 4,835,747 2,867(9,837,070) (8,877,066) 960,004
4,832,880 4,835,747 2,867 (9,837,070) (8,877,066) 960,004
$ (4,500) $ (4,500) $ (2,750,420) 143,551 $ 2,893,971
29,000 11,291,288
$ 24,500 $ 11,434,839
(Continued)
127

CITY OF TUCSON, ARIZONACOMBINING SCHEDULE OF REVENUES, EXPENDITURES AND CHANGES IN
FUND BALANCES - BUDGET AND ACTUAL - NON-MAJOR SPECIAL REVENUE FUNDSYEAR ENDED JUNE 30, 2015
(Continued)
Civic Contribution FundVariance -Positive
Budget Actual (Negative)Revenues:
Licenses and Permits $ $ $Fines and ForfeituresUse of Money and Property 8,000 2,911 (5,089)Federal Grants and ContributionsOther AgenciesCharges for ServicesContributions from Outside Sources 324,550 401,711 77,161Miscellaneous
Total revenues 332,550 404,622 72,072
Expenditures:Current -
Elected and Official 7,934 (7,934)Public Safety and Justice Services 21,000 46,935 (25,935)Community Enrichment and Development 670,570 265,058 405,512Non-Departmental 26,645 (26,645)
Capital OutlayCapital Projects 158,860 7,073 151,787Debt service -
PrincipalInterest
Total expenditures 850,430 353,645 496,785
Excess (deficiency) of revenues overexpenditures (517,880) 50,977 568,857
Other financing sources (uses):Transfers InTransfers OutTotal other financing sources (uses)
Change in fund balances $ (517,880) 50,977 $ 568,857
Fund balances, beginning of year 569,306
Fund balances (deficits), end of year $ 620,283
128

Community Development Block Grants Fund Miscellaneous Housing Grant FundVariance - Variance -Positive Positive
Budget Actual (Negative) Budget Actual (Negative)
$ $ $ $ $ $
9,888,260 6,881,738 (3,006,522) 4,870,890 4,487,394 (383,496)
336,000 342,331 6,331
861 861 73 7310,224,260 7,224,930 (2,999,330) 4,870,890 4,487,467 (383,423)
8,271,780 5,963,606 2,308,174 4,870,890 4,487,467 383,423
1,743,300 1,560,251 183,049
15,280 (15,280)10,015,080 7,539,137 2,475,943 4,870,890 4,487,467 383,423
209,180 (314,207) (523,387)
$ 209,180 (314,207) $ (523,387) $ $
3,978,736
$ 3,664,529 $
129
(Continued)

COMBINING SCHEDULE OF REVENUES, EXPENDITURES AND CHANGES IN FUND BALANCES - BUDGET AND ACTUAL - NON-MAJOR SPECIAL REVENUE FUNDS
YEAR ENDED JUNE 30, 2015
(Continued)
Public Housing Section 8 Fund
Variance -
Positive
Budget Actual (Negative)Revenues:
Licenses and Permits $ $ $Fines and ForfeituresUse of Money and Property 20,000 14,453 (5,547)Federal Grants and Contributions 38,115,670 34,720,132 (3,395,538)Other AgenciesCharges for Services 38,571 38,571Contributions from Outside SourcesMiscellaneous 87,088 87,088
Total revenues 38,135,670 34,860,244 (3,275,426)
Expenditures:Current -
Elected and OfficialPublic Safety and Justice ServicesCommunity Enrichment and Development 37,778,190 35,334,567 2,443,623Non-Departmental
Capital Outlay 23,480 20,551 2,929Capital ProjectsDebt service -
PrincipalInterest
Total expenditures 37,801,670 35,355,118 2,446,552
Excess (deficiency) of revenues overexpenditures 334,000 (494,874) (828,874)
Other financing sources (uses):Transfers InTransfers Out
Total other financing sources (uses)
Change in fund balances $ 334,000 (494,874) $ (828,874)
Fund balances, beginning of year 3,293,145
Fund balances (deficits), end of year $ 2,798,271
130

HOME Affordable Housing Fund Other Federal Grants FundVariance - Variance -Positive Positive
Budget Actual (Negative) Budget Actual (Negative)
$ $ $ $ $ $
115 115 4,396 4,3966,065,920 4,185,061 (1,880,859) 32,447,400 16,361,859 (16,085,541)
234,981 234,981
6,065,920 4,420,157 (1,645,763) 32,447,400 16,366,255 (16,081,145)
303,640 287,728 15,91213,246,450 10,153,318 3,093,132
6,065,920 4,280,475 1,785,445 2,893,660 1,201,115 1,692,545
2,448,070 1,447,534 1,000,5363,373,590 3,274,398 99,192
6,065,920 4,280,475 1,785,445 22,265,410 16,364,093 5,901,317
139,682 139,682 10,181,990 2,162 (10,179,828)
$ 139,682 $ 139,682 $ 10,181,990 2,162 $ (10,179,828)
66,117
$ 139,682 $ 68,279
(Continued)
131

CITY OF TUCSON, ARIZONACOMBINING SCHEDULE OF REVENUES, EXPENDITURES AND CHANGES IN
FUND BALANCES - BUDGET AND ACTUAL - NON-MAJOR SPECIAL REVENUE FUNDSYEAR ENDED JUNE 30, 2015
(Concluded)
Non-Federal Grants Fund
Variance -
Positive
Budget Actual (Negative)Revenues:
Licenses and Permits $ $ $Fines and ForfeituresUse of Money and PropertyFederal Grants and ContributionsOther Agencies 2,379,790 2,012,209 (367,581)Charges for ServicesContributions from Outside SourcesMiscellaneous
Total revenues 2,379,790 2,012,209 (367,581)
Expenditures:Current -
Elected and Official 80,740 83,942 (3,202)Public Safety and Justice Services 1,248,990 1,510,591 (261,601)Community Enrichment and Development 600,570 375,460 225,110Non-Departmental
Capital Outlay 179,820 179,820Capital Projects 26,000 42,216 (16,216)Debt service -
PrincipalInterest
Total expenditures 2,136,120 2,012,209 123,911
Excess (deficiency) of revenues overexpenditures 243,670 (243,670)
Other financing sources (uses):Transfers InTransfers Out
Total other financing sources (uses)
Change in fund balances $ 243,670 $ (243,670)
Fund balances, beginning of year
Fund balances (deficits), end of year $
132

Sun Link Fund TotalsVariance - Variance -Positive Positive
Budget Actual (Negative) Budget Actual (Negative)
$ $ $ 441,000 $ 378,391 $ (62,609)693,240 766,145 72,905766,260 902,605 136,345
91,388,140 66,636,184 (24,751,956)2,000,000 2,001,628 1,628 40,935,980 40,959,615 23,6351,296,390 976,485 (319,905) 7,976,030 10,439,588 2,463,558
324,550 401,711 77,1615,422 5,422 251,340 940,581 689,241
3,296,390 2,983,535 (312,855) 142,776,540 121,424,820 (21,351,720)
384,380 379,604 4,77614,516,440 11,710,844 2,805,596
4,120,560 3,856,259 264,301 104,060,040 96,115,936 7,944,1041,416,270 1,440,378 (24,108)
80,000 8,526 71,474 5,119,790 3,834,251 1,285,5395,535,120 5,076,502 458,618
735,000 735,000 1,315,000 1,315,000776,780 394,759 382,021 1,444,820 1,087,732 357,088
5,712,340 4,994,544 717,796 133,791,860 120,960,247 12,831,613
(2,415,950) (2,011,009) 404,941 8,984,680 464,573 (8,520,107)
905,170 2,027,132 1,121,962 5,738,050 6,862,879 1,124,829(9,837,070) (8,877,066) 960,004
905,170 2,027,132 1,121,962 (4,099,020) (2,014,187) 2,084,833
$ (1,510,780) 16,123 $ 1,526,903 $ 4,885,660 (1,549,614) $ (6,435,274)
2,502,984 24,534,168
$ 2,519,107 $ 22,984,554
133
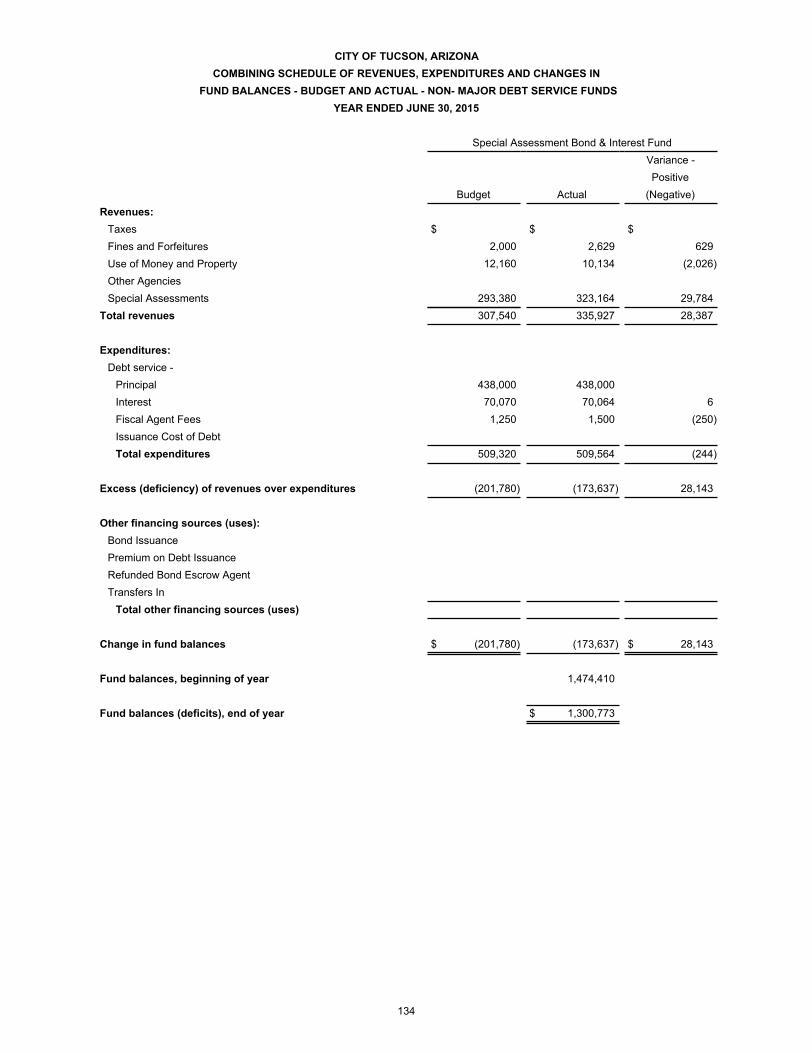
CITY OF TUCSON, ARIZONACOMBINING SCHEDULE OF REVENUES, EXPENDITURES AND CHANGES IN
FUND BALANCES - BUDGET AND ACTUAL - NON- MAJOR DEBT SERVICE FUNDSYEAR ENDED JUNE 30, 2015
Special Assessment Bond & Interest FundVariance -Positive
Budget Actual (Negative)Revenues:
Taxes $ $ $Fines and Forfeitures 2,000 2,629 629Use of Money and Property 12,160 10,134 (2,026)Other AgenciesSpecial Assessments 293,380 323,164 29,784
Total revenues 307,540 335,927 28,387
Expenditures:Debt service -
Principal 438,000 438,000Interest 70,070 70,064 6Fiscal Agent Fees 1,250 1,500 (250)Issuance Cost of DebtTotal expenditures 509,320 509,564 (244)
Excess (deficiency) of revenues over expenditures (201,780) (173,637) 28,143
Other financing sources (uses):Bond IssuancePremium on Debt IssuanceRefunded Bond Escrow AgentTransfers In
Total other financing sources (uses)
Change in fund balances $ (201,780) (173,637) $ 28,143
Fund balances, beginning of year 1,474,410
Fund balances (deficits), end of year $ 1,300,773
134

General Obligation Bond & Interest Fund Street & Highway Bond & Interest FundVariance - Variance -Positive Positive
Budget Actual (Negative) Budget Actual (Negative)
$ 30,622,420 $ 30,148,102 $ (474,318) $ $ $
20,000 19,650 (350)7,652,830 7,900,509 247,679
30,622,420 30,148,102 (474,318) 7,672,830 7,920,159 247,329
20,060,000 20,060,000 12,965,000 12,965,0009,762,310 9,640,274 122,036 4,544,350 4,544,350
2,900 1,475 1,425 1,000 (1,000)303,819 (303,819) 550 258,236 (257,686)
29,825,210 30,005,568 (180,358) 17,509,900 17,768,586 (258,686)
797,210 142,534 (654,676) (9,837,070) (9,848,427) (11,357)
36,535,000 36,535,000 27,415,000 27,415,0003,088,310 3,088,310 2,081,361 2,081,361
(38,413,954) (38,413,954) (28,525,000) (28,525,000)9,837,070 8,877,066 (960,004)
1,209,356 1,209,356 9,837,070 9,848,427 11,357
$ 797,210 1,351,890 $ 554,680 $ $
653,656
$ 2,005,546 $
(Continued)
135

CITY OF TUCSON, ARIZONACOMBINING SCHEDULE OF REVENUES, EXPENDITURES AND CHANGES IN
FUND BALANCES - BUDGET AND ACTUAL - NON- MAJOR DEBT SERVICE FUNDSYEAR ENDED JUNE 30, 2015
(Concluded)
TotalsVariance -Positive
Budget Actual (Negative)Revenues:
Taxes $ 30,622,420 $ 30,148,102 $ (474,318)Fines and Forfeitures 2,000 2,629 629Use of Money and Property 32,160 29,784 (2,376)Other Agencies 7,652,830 7,900,509 247,679Special Assessments 293,380 323,164 29,784
Total revenues 38,602,790 38,404,188 (198,602)
Expenditures:Debt service -
Principal 33,463,000 33,463,000Interest 14,376,730 14,254,688 122,042Fiscal Agent Fees 4,150 3,975 175Issuance Cost of Debt 550 562,055 (561,505)Total expenditures 47,844,430 48,283,718 (439,288)
Excess (deficiency) of revenues over expenditures (9,241,640) (9,879,530) (637,890)
Other financing sources (uses):Bond Issuance 63,950,000 (63,950,000)Premium on Debt Issuance 5,169,671 (5,169,671)Refunded Bond Escrow Agent (66,938,954) 66,938,954Transfers In 9,837,070 8,877,066 960,004
Total other financing sources (uses) 9,837,070 11,057,783 (1,220,713)
Change in fund balances $ 595,430 1,178,253 $ (1,858,603)
Fund balances, beginning of year 2,128,066
Fund balances (deficits), end of year $ 3,306,319
136


CITY OF TUCSON, ARIZONA
COMBINING SCHEDULE OF REVENUES, EXPENDITURES AND CHANGES IN FUND
BALANCES - BUDGET AND ACTUAL - NON-MAJOR CAPITAL PROJECTS FUNDS
YEAR ENDED JUNE 30, 2015
Capital Improvements Fund
Variance -
PositiveBudget Actual (Negative)
Revenues:Developer Fees $ $ $
Use of Money and Property 2,046 2,046
Grants and Contributions 19,751 19,751
Other Agencies 1,060,300 1,505,122 444,822
Miscellaneous 80,118 80,118
Total revenues 1,060,300 1,607,037 546,737
Expenditures:
Current -
City Court 83 (83)
Community Enrichment and Development 90,000 49,839 40,161
Support Services 75,000 45,649 29,351
Capital Outlay 19,750 284,811 (265,061)
Capital Projects 15,216,960 2,781,997 12,434,963
Debt Service -
Interest 659,371 (659,371)
Debt Issuance Costs
Total expenditures 15,401,710 3,821,750 11,579,960
Excess (deficiency) of revenues over
expenditures (14,341,410) (2,214,713) 12,126,697
Other financing sources (uses):
Bond Issuance
Capital Leases
Premium on Debt Issuance
Transfers In
Transfers Out (10,534,700) (10,534,700)
Total other financing sources (uses) (10,534,700) (10,534,700)
Change in fund balances $ (14,341,410) (12,749,413) $ 1,591,997
Fund balances, beginning of year 18,053,710
Fund balances (deficits), end of year $ 5,304,297
138

Regional Transportation Authority Fund 2012 General Obligation Streets Improvements Fund
Variance - Variance -
Positive Positive
Budget Actual (Negative) Budget Actual (Negative)
$ $ $ $ $ $
95,130 71,181 (23,949) 150,000 192,306 42,306
38,747,970 40,358,360 1,610,390
1,020,777 1,020,777
38,843,100 41,450,318 2,607,218 150,000 192,306 42,306
374,500 351,881 22,619 26,771,940 23,014,670 3,757,270
2,219,057 (2,219,057)
44,840,440 48,393,303 (3,552,863)
148,587 (148,587)
45,214,940 50,964,241 (5,749,301) 26,771,940 23,163,257 3,608,683
(6,371,840) (9,513,923) (3,142,083) (26,621,940) (22,970,951) 3,650,989
20,000,000 20,000,000
538,520 538,520
10,534,700 10,534,700
10,534,700 10,534,700 20,000,000 20,538,520 538,520
$ (6,371,840) 1,020,777 $ 7,392,617 $ (6,621,940) (2,432,431) $ 4,189,509
33,397 30,324,014
$ 1,054,174 $ 27,891,583
139

CITY OF TUCSON, ARIZONA
COMBINING SCHEDULE OF REVENUES, EXPENDITURES AND CHANGES IN
FUND BALANCES - BUDGET AND ACTUAL - NON-MAJOR CAPITAL PROJECTS FUNDS
YEAR ENDED JUNE 30, 2015
(Concluded)
Development Fee Fund
Variance -
PositiveBudget Actual (Negative)
Revenues:Developer Fees $ 5,700,000 $ 1,522,640 $ (4,177,360)
Use of Money and Property 400,000 260,956 (139,044)
Grants and Contributions
Other Agencies
Miscellaneous
Total revenues 6,100,000 1,783,596 (4,316,404)
Expenditures:
Current -
City Court
Community Enrichment and Development
Support Services 134,600 96,942 37,658
Capital Outlay 71,320 71,320
Capital Projects 4,243,790 3,760,516 483,274
Debt Service -
Interest
Debt Issuance Costs
Total expenditures 4,449,710 3,857,458 592,252
Excess (deficiency) of revenues over
expenditures 1,650,290 (2,073,862) (3,724,152)
Other financing sources (uses):
Bond Issuance
Capital Leases
Premium on Debt Issuance
Transfers In 24,933 24,933
Transfers Out
Total other financing sources (uses) 24,933 24,933
Change in fund balances $ 1,650,290 (2,048,929) $ (3,699,219)
Fund balances, beginning of year 35,186,527
Fund balances (deficits), end of year $ 33,137,598
140

Totals
Variance -
Positive
Budget Actual (Negative)
$ 5,700,000 1,522,640 (4,177,360)
645,130 526,489 (118,641)
19,751 19,751
39,808,270 41,863,482 2,055,212
0 1,100,895 1,100,895
46,153,400 45,033,257 (1,120,143)
83 (83)
27,236,440 23,416,390 3,820,050
209,600 142,591 67,009
91,070 2,503,868 (2,412,798)
64,301,190 54,935,816 9,365,374
659,371 (659,371)
148,587 (148,587)
91,838,300 81,806,706 10,031,594
(45,684,900) (36,773,449) 8,911,451
20,000,000 20,000,000
538,520 538,52010,559,633 10,559,633
(10,534,700) (10,534,700)
20,000,000 20,563,453 563,453
$ (25,684,900) (16,209,996) $ 9,474,904
83,597,648
$ 67,387,652
141

CITY OF TUCSON, ARIZONASCHEDULE OF REVENUES, EXPENSES, AND CHANGES IN FUND NET POSITION
ENVIRONMENTAL SERVICES - BUDGET TO ACTUALFOR THE YEAR ENDED JUNE 30, 2015
Environmental ServicesVariance -Positive
Budget Actual (Negative)Operating revenues:
Charges for Services $ 46,959,000 $ 47,936,869 $ 977,869Miscellaneous 919,000 794,615 (124,385)
Total operating revenues 47,878,000 48,731,484 853,484
Operating expenses:Salaries, Wages and Benefits 15,584,210 15,006,999 577,211Contractual Services 20,746,480 17,671,960 3,074,520Commodities 5,417,800 4,284,730 1,133,070Depreciation 3,706,588 (3,706,588)
Total operating expenses 41,748,490 40,670,277 1,078,213
Operating Income (Loss) 6,129,510 8,061,207 1,931,697
Nonoperating revenues (expenses):Investment Income 50 278,597 278,547Gain (Loss) on Sale of Property/Equipment 67,630 358,000 290,370Federal Grants and Contributions 150,000 108,577 (41,423)Interest Expense (490,430) (481,451) 8,979Debt Issuance Costs 9,864 9,864Lease Agreement Principal (124,000) 124,000
Total nonoperating revenues (expenses) (396,750) 273,587 670,337
Income (Loss) before capital contributions and transfers 5,732,760 8,334,794 2,602,034
Changes in net Position $ 5,732,760 8,334,794 $ 2,602,034
Total net position, beginning of year - Restated (25,318,874)
Total net position (deficit), end of year $ (16,984,080)
142

CITY OF TUCSON, ARIZONASCHEDULE OF REVENUES, EXPENSES, AND CHANGES IN FUND NET POSITION
TUCSON GOLF ENTERPRISE FUND - BUDGET TO ACTUALFOR THE YEAR ENDED JUNE 30, 2015
Tucson Golf Enterprise FundVariance -Positive/
Budget Actual NegativeOperating revenues:
Charges for Services $ 8,130,050 $ 7,138,080 $ (991,970)Miscellaneous Revenue 1,202 1,202
Total operating revenues 8,130,050 7,139,282 (990,768)
Operating expenses:Salaries, Wages and Benefits 43,685 (43,685)Contractual Services 6,048,720 5,711,867 336,853Commodities 1,238,130 1,180,419 57,711Cost of Goods Sold 709,240 597,432 111,808Depreciation 722,768 (722,768)
Total operating expenses 7,996,090 8,256,171 (260,081)
Operating income (loss) 133,960 (1,116,889) (1,250,849)
Nonoperating revenues (expenses):Interest Expense (11,167) (11,167)
Total nonoperating revenues (expenses) (11,167) (11,167)
Income (loss) before capital contributions and transfers 133,960 (1,128,056) (1,262,016)
Transfers OutSpecial Items
Changes in net position $ 133,960 (1,128,056) $ (1,262,016)
Total net position, beginning of year 7,856,439
Total net position, end of year $ 6,728,383
143

CITY OF TUCSON, ARIZONA
SCHEDULE OF REVENUES, EXPENSES, AND CHANGES IN FUND NET POSITION
PUBLIC HOUSING FUND - BUDGET TO ACTUAL
FOR THE YEAR ENDED JUNE 30, 2015
Public Housing FundVariance -Positive
Budget Actual (Negative)Operating revenues:
Charges for Services $ 6,476,690 $ 3,779,967 $ (2,696,723)Federal Grants and Contributions 6,207,480 5,881,411 (326,069)Miscellaneous 51,880 602,206 550,326
Total operating revenues 12,736,050 10,263,584 (2,472,466)
Operating expenses:Salaries, Wages and Benefits 5,119,810 4,693,815 425,995Contractual Services 6,979,500 3,528,255 3,451,245Commodities 1,050,450 763,214 287,236Depreciation 920,414 (920,414)
Total operating expenses 13,149,760 9,905,698 3,244,062
Operating Income (Loss) (413,710) 357,886 771,596
Nonoperating revenues (expenses):Investment Income 38,890 53,329 14,439Gain (Loss) on Sale of Property/Equipment 7,051 7,051Other Nonoperating Income (Expenses) (68,590) (68,590)
Total nonoperating revenues (expenses) 38,890 (8,210) (47,100)
Income (Loss) before capital contributions and transferes (374,820) 349,676 724,496
Capital Contributions (185,611) (185,611)Transfers Out (80,000) (80,000)Changes in net position $ (374,820) 84,065 $ 458,885
Total net position, beginning of year - Restated 22,670,045
Total net position, end of year $ 22,754,110
144

CITY OF TUCSON, ARIZONASCHEDULE OF REVENUES, EXPENSES, AND CHANGES IN FUND NET POSITION
HCD NON-PHA ASSET MGMT FUND - BUDGET TO ACTUALFOR THE YEAR ENDED JUNE 30, 2015
HCD Non-PHA Asset Management FundVariance -Positive
Budget Actual (Negative)Operating revenues:
Charges for Services $ 1,027,930 $ 1,084,595 $ 56,665Federal Grants and Contributions 208,200 228,604 20,404Miscellaneous
Total operating revenues 1,236,130 1,313,199 77,069
Operating expenses:Salaries, Wages and Benefits 425,210 767,274 (342,064)Contractual Services 1,099,020 1,045,458 53,562Commodities 170,510 160,612 9,898Depreciation 294,007 (294,007)
Total operating expenses 1,694,740 2,267,351 (572,611)
Operating Income (Loss) (458,610) (954,152) (495,542)
Nonoperating revenues (expenses):Investment Income 68,200 75,079 6,879Gain (loss) on Sale of Property/Equipment 326,166 326,166
Total nonoperating revenues (expenses) 68,200 401,245 333,045
Income (Loss) before capital contributions and transfers (390,410) (552,907) (162,497)
Transfers In 80,000 80,000
Changes in net position $ (390,410) (472,907) $ (82,497)
Total net position, beginning of year - Restated 12,476,739
Total net position, end of year $ 12,003,832
145

CITY OF TUCSON, ARIZONASCHEDULE OF REVENUES, EXPENSES, AND CHANGES IN FUND NET POSITION
WATER UTILITY - BUDGET TO ACTUALFOR THE YEAR ENDED JUNE 30, 2015
Water Utility FundVariance -
Budget ActualPositive
(Negative)Operating revenues:Charges for Services $ 182,602,550 $ 175,426,614 $ (7,175,936)Miscellaneous 2,340,000 6,227,556 3,887,556
Total operating revenues 184,942,550 181,654,170 (3,288,380)
Operating expenses:Salaries, Wages and Benefits 35,267,090 30,922,125 4,344,965Contractual Services 67,466,390 65,207,482 2,258,908Commodities 9,092,230 8,243,561 848,669Depreciation 35,205,332 (35,205,332)
Total operating expenses 111,825,710 139,578,500 (27,752,790)
Operating Income (Loss) 73,116,840 42,075,670 (31,041,170)
Nonoperating revenues (expenses):Investment Income 314,250 893,175 578,925Gain (Loss) on Sale of Property/Equipment (230,052) (230,052)Non-Grant Contributions 750,000 734,619 (15,381)Interest Expense (23,374,080) (18,967,617) 4,406,463Issuance Costs (280,000) (1,458,631) (1,178,631)Other Nonoperating Income (Expenses) (7,698,707) (7,698,707)
Total nonoperating revenues (expenses) (22,589,830) (26,727,213) (4,137,383)
Income (Loss) before capital contributions and transfers 50,527,010 15,348,457 (35,178,553)
Capital Contributions 2,983,000 6,787,906 3,804,906Transfers Out (1,600,000) (1,600,000)
Changes in net position $ 53,510,010 20,536,363 $ (32,973,647)
Total net position, beginning of year - Restated 760,457,882
Total net position, end of year $ 780,994,245
146


CITY OF TUCSON, ARIZONAWATER UTILITY FUND
REVENUES, EXPENSES AND FLOWS OF FUNDSPER ORDINANCE NO. 6347 (1)YEAR ENDED JUNE 30, 2015
(UNAUDITED)
Revenues:Sale of Water:
Potable Water Sales $ 133,493,366Reclaimed Water Sales 9,070,375Central Arizona Project Charge 21,410,392Connection Fees 1,444,549Environmental and Sewer Billing Services 4,074,528
TCE Clean Up Reimbursement 979,441Plan Review and Inspection Fees 583,543Other 10,597,977
Non-Operating Income:Impact Fees $ 2,481,092Investment Earnings - Operating Fund 483,101Investment Earnings - Debt Service 125,803Federal Non-Grant Contributions (BABS) 734,619Proceeds from Sale of Property/Equipment 373,780Proceeds from Property Equipment Rental 284,271
Total Non-Operating Income 4,482,666Total Revenues 186,136,837
Operation and Maintenance Expenses:Director's Office 7,001,646Business Services 4,387,520Customer Services 7,852,208Water Operations 21,392,395Planning and Engineering 6,523,342Quality Management 10,259,536Power - Potable System 13,226,848Power - Reclaimed System 1,613,250CAP Water Purchases:
Commodity 23,604,242Capital Charges 3,171,784
Total CAP Water Purchases 26,776,026General Expenses 3,402,348Capitalized Operation and Maintenance Expense (5,437,140)
Total Operation and Maintenance Expense 96,997,979
Net Revenue Available After Operations (2) $ 89,138,858
148

CITY OF TUCSON, ARIZONAWATER UTILITY FUND
REVENUES, EXPENSES AND FLOWS OF FUNDSPER ORDINANCE NO. 6347 (1)YEAR ENDED JUNE 30, 2015
(UNAUDITED)
Bond Debt Service:Senior Liens
Interest $ 20,073,447Principal 24,900,000
Total Debt Service for Water Revenue Bonds 44,973,447
Junior Liens (Water Infrastructure Finance Authority)Interest 1,043,670Principal 3,301,640
Total Debt Service for Water Infrastructure Finance Authority 4,345,310
Combined Senior and Junior LiensInterest 21,117,117Principal 28,201,640
Total Debt Service 49,318,757
Net Revenue Available After OperationsBond Debt Service for Senior Liens $ 44,165,411
Net Revenue Available After Operations andBond Debt Service for Combined Liens $ 39,820,101
(1) This is a special purpose financial statement intended to show compliance with Ordinance 6347. It is not prepared in accordance with Generally Accepted Accounting Principles (GAAP). Financials statements are presented on a GAAP basis.
(2) Section 5.02 (b) of Ordinance 6347 covenants that the City will issue additional senior lien bonds only if Net Revenue Available After Operations has been at least equal to 120% of the maximum future annual debt service requirement of $48,430,572. The City's experience has shown that more favorable interest rates (and thus lower debt service costs) can be attained if such coverage is 150% to 200%. For the period ended June 30, 2015, maximum future annual debt service coverage of senior lien debt is 184%.
An amendment to Section 7.01 of Ordinance 6347 further requires that if the Net Revenue of any fiscal year does not equal or exceed 175% of the Senior Lien Annual Debt Service Requirement for that fiscal year, the City will deposit additional monies into a reserve account. For the fiscal year ended June 30, 2015, the debt coverage on Senior Lien Annual Debt Service Requirement was 198% .
The Water Utility's Junior Lien Debt has requirements that Net Revenues Available After Operations and Senior Lien debt service payments for any fiscal year must equal or exceed 175% of the Annual Debt Service Requirement for that fiscal year. If this requirement is not met, the City will deposit additional monies into a reserve account. For the fiscal year ended June 30, 2015, the debt coverage for the Annual Debt Service Requirement for the Junior Lien is 1092%.
In Comprehensive Annual Financial Reports for prior fiscal years, the debt coverage ratio was calculated on combined Senior and Junior Lien coverage ratio. For comparative purposes, the combined Annual Debt Service coverage ratio for the fiscal year period ended June 30, 2015, is 181%. The maximum future debt service coverage is 160%.
149


CITY OF TUCSON, ARIZONA
STATISTICAL SECTION
Statistical Sectio
n

Statistical Section - Unaudited
This part of the City of Tucson's Comprehensive Annual Financial Report presents detailed information as a context for understanding what the information in the financial statements, note disclosures, and required supplementary information says about the City's overall financial health.
Contents Page
Financial Trends 152 These schedules contain trend information to help the reader understand how the City's financial performance and well-being have changed over time.
Revenue Capacity 160 These schedules contain information to help the reader assess the factors affecting the City's ability to generate its sales taxes.
Debt Capacity 163 These schedules present information to help the reader assess the affordability of the City's current levels of outstanding debt and the City's ability to issue additional debt in the future.
Demographic and Economic Information 168 These schedules offer demographic and economic indicators to help the reader understand the environment within which the City's financial activities take place and to help make comparisons over time and with other governments.
Operating Information 170 These schedules contain information about the City's operations and resources to help the reader understand how the City's financial information relates to the services the City provides and the activities it performs.
Sources: Unless otherwise noted, the information in these schedules is derived from the Comprehensive Annual Financial Reports for the relevant year.
151

TABLE I
Note: (1) Not all capital expenditures/expenses become City Assets
$147,802,181
Information Technology
$1,611,368Procurement
Operating
$962,382
Expenditures/Expenses
City Clerk$1,334,942
Public Defender
Capital (1)
$955,582,022
City Court
City Golf
$12,519,273
City of TucsonExpenditures/Expenses by Department
Fiscal Year 2015
TotalExpenditures/Expenses
General Services
Debt Service$97,994,181
Expenditures/Expenses
$2,145,809General Government
$3,146,528
$683,119
Transportation
$1,103,384,203
$108
$157,626,313
$3,220,828
Police
City Attorney Intregrated Planning
Mayor and Council Fire
Budget & Internal Audit Finance
$2,485,929 $89,383,922
$17,295,889$1,299,480
Convention Center
Fire
Parks and Recreation$433,442
$5,032,837Outside Agencies
Transportation$59,775
Environmental Services$139,632,861
$139,004,801
Water
Water$43,385,973
General Services$3,356,953
$1,683,964
$9,360,938
Parks and Recreation
Information Technology
Police Department
General Expense
Other Departments
Human Resources
$65,808,783
City Golf
Housing & Comm. Dev
$8,256,172
$423,050 $1,016,543$2,972,398
Housing & Comm. Dev
$76,722,916
$53,817,565
Environmental Services$40,697,035
$16,918,106
$36,858,526
$8,448,952
$8,717,454
$18,952,898
City Clerk
Convention Center
City Manager
Development Services
$8,160,808
$2,496,289
$11,756,798
$7,698,295
City Court
152

CITY OF TUCSON TABLE IINet Position by ComponentLast Ten Fiscal Years(Accrual Basis of Accounting)
2006 (1) 2007 (2) 2008 2009 2010 2011 2012 2013 (3) 2014 (4) 2015
Governmental Activities
$ 976,649,504 959,636,068 1,048,004,576 1,128,906,123 1,231,660,136 1,244,170,566 1,350,013,946 1,450,248,757 1,499,029,239 1,539,250,781
Restricted 138,645,084 177,158,918 164,195,246 154,738,778 129,992,175 159,017,958 118,633,469 141,695,269 154,849,334 147,289,613
Unrestricted 42,058,585 28,276,910 (2,780,426) (24,665,404) (13,022,236) 24,382,059 33,108,497 (409,624) (780,353,582) (833,065,927)
Total Net position $ 1,157,353,173 1,165,071,896 1,209,419,396 1,258,979,497 1,348,630,075 1,427,570,583 1,501,755,912 1,591,534,402 873,524,991 853,474,467
Business-type Activities
$ 583,166,485 681,599,255 696,128,404 727,347,232 737,714,049 752,837,699 769,213,845 788,088,044 811,642,121 825,087,980
Restricted 3,254,815 25,024,209 26,615,863 33,361,233 35,566,434 35,160,494 36,339,552 37,933,738 38,724,476 39,601,012
Unrestricted (20,024,020) (42,876,565) (60,875,072) (37,020,962) (36,777,570) (26,949,353) (10,391,767) (1,669,897) (89,809,383) (76,994,286)
Total Net position $ 566,397,280 663,746,899 661,869,195 723,687,503 736,502,913 761,048,840 795,161,630 824,351,885 760,557,214 787,694,706
Primary Government
$ 1,559,815,989 1,641,235,323 1,744,132,980 1,856,253,355 1,969,374,185 1,997,008,265 2,119,227,791 2,238,336,801 2,310,671,360 2,364,338,761
Restricted 141,899,899 202,183,127 190,811,109 188,100,011 165,558,609 194,178,452 154,973,021 179,629,007 193,573,810 186,890,625
Unrestricted 22,034,565 (14,599,655) (63,655,498) (61,686,366) (49,799,806) (2,567,294) 22,716,730 (2,079,521) (870,162,965) (910,060,213) Total Net position $ 1,723,750,453 1,828,818,795 1,871,288,591 1,982,667,000 2,085,132,988 2,188,619,423 2,296,917,542 2,415,886,287 1,634,082,205 1,641,169,173
Notes: (1) Restated ending FY 2006/beginning FY 2007 Governmental Activities net position because of an error due to reporting of constructionin progress. This caused the Invested in Capital Assets, Net of Related Debt to decrease by $9,009,120. The ending FY 2006/beginning FY 2007 Business-type Activities were restated because of an asset impairment. The Invested in Capital Assets, Net of Related Debt decreased by $32,225,361.
(2) Restated ending FY 2007/beginning FY 2008 Net Position for Governmental and Business-type Activities to meet new HUD reporting requirements.
(3) The implementation of GASB Statements 63 and 65 added the new balance sheet components of deferred inflows/outflows, changed Net Assetsto Net Postion, and changed the name of the Capital Asset component of Net Position.
(4) The implementation of GASB Statement 68 requires the City to recognize pension liabilities and related expenses on the fiancial statements.The restatement affected the unrestricted net position. (See Note 20)
Net Investment in Capital Assets
Fiscal Year
Net Investment in Capital Assets
Net Investment in Capital Assets
153

CITY OF TUCSON TABLE IIIChanges in Net PositionLast Ten Fiscal Years(Accrual Basis of Accounting)
2006 2007 2008 2009 2010 2011 2012 2013 (3) 2014 (4) 2015ExpensesGovernmental Activities
Elected and Official $ 17,443,632 18,282,947 20,700,143 18,779,409 18,771,020 22,071,179 22,496,102 22,380,772 22,266,302 20,624,381Support Services 58,092,060 48,489,229 47,471,907 42,727,879 44,550,729 42,164,837 35,118,839 39,001,414 48,948,932 50,308,291Neighborhood Services 341,517,918 359,333,504 372,033,490 366,985,315 354,449,593 340,720,803 497,892,563 Public Safety and Justice Services 260,591,927 323,811,440Public Safety/ Neighborhood Services 373,619,042 Operations and Development 137,175,591 153,134,680 156,511,559 143,961,284 137,548,043 146,488,882 12,266,031 170,562,802 Community Enrichment and Development 271,590,886 297,437,927Strategic Initiatives 12,499,925 8,156,745 7,217,537 6,517,311 5,538,870 Non-Departmental 14,972,390 35,332,418 46,693,111 43,079,731 29,756,362 27,175,033 27,092,579 45,134,817 28,356,640 25,615,851Interest on Long-term Debt 24,108,533 27,227,363 27,105,560 27,364,406 27,605,603 27,880,687 32,242,741 30,428,436 24,236,525 25,387,637Fiscal Agent Fees and Other 74,613 43,875 41,025 327,635 801,342 1,803,136 58,676 2,419,872 1,868,185 1,880,263
Total Governmental Activities 605,884,662 650,000,761 677,774,332 649,742,970 619,021,562 608,304,557 627,167,531 683,547,155 657,859,397 745,065,790 Business-type Activities
Public Housing (1) 11,184,715 11,006,286 12,370,229 12,138,321 11,062,401 11,866,322 10,257,513 9,974,288Non-PHA Asset Management (2) 1,120,698 1,409,258 1,383,356 2,267,351Environmental Services 42,987,747 46,037,471 53,420,043 44,676,920 48,824,879 45,752,439 48,122,885 44,760,999 57,226,295 41,611,732Tucson Golf Enterprise Fund 9,003,837 9,692,464 10,847,587 9,864,806 9,184,549 8,452,760 7,371,311 6,650,603 6,753,158 8,276,232Water Utility 119,187,111 118,221,611 130,340,130 125,467,271 127,688,652 130,382,350 140,597,834 138,822,228 151,980,908 167,441,460
Total Business-type Activities 171,178,695 173,951,546 205,792,475 191,015,283 198,068,309 196,725,870 208,275,129 203,509,410 227,601,230 229,571,063Total Primary Government Expenses $ 777,063,357 823,952,307 883,566,807 840,758,253 817,089,871 805,030,427 835,442,660 887,056,565 885,460,627 974,636,853
Program RevenuesGovernmental Activities:
Charges for Services:Permits/Review fees $ 12,359,186 10,190,224 10,160,837 6,901,801 6,472,160 7,969,980 8,179,531 8,909,982 6,681,559 7,829,176Recreation Fees 4,388,275 4,240,903 4,302,267 4,256,646 4,558,748 5,024,093 5,108,831 5,631,054 5,569,954 5,634,416Paramedic Services Fees 7,184,801 7,243,133 8,510,101 8,830,533 10,921,989 12,111,479 7,856,194 12,098,585 10,616,793 11,155,836Transit Fees 8,879,486 9,576,722 10,205,276 11,058,854 11,896,786 11,273,379 14,315,113 13,940,587 13,689,563 14,650,911Other Charges for Service 67,970,643 59,651,892 68,504,419 70,813,426 68,746,501 70,395,491 65,894,543 64,077,153 67,855,088 75,410,073
Operating Grants & Contributions 134,853,525 119,726,357 112,001,911 119,638,739 124,171,155 119,655,515 118,671,770 131,713,221 108,429,579 118,631,887Capital Grants and Contributions 36,449,563 56,340,464 87,427,159 124,734,954 116,859,034 95,761,089 122,030,260 153,546,244 123,245,664 81,649,759
Total Governmental Activities Program Revenues 272,085,479 266,969,695 301,111,970 346,234,953 343,626,373 322,191,026 342,056,242 389,916,826 336,088,200 314,962,058Business-type Activities:
Charges for Services:Public Housing AMP (1) 7,415,970 3,454,415 3,575,243 3,894,804 4,337,148 4,006,300 3,881,856 4,382,173Non-PHA Asset Management (2) 728,920 1,093,525 1,008,228 1,084,595Environmental Services 39,809,587 42,960,815 42,533,898 43,888,522 40,998,260 48,442,224 50,327,999 48,646,855 48,788,808 48,731,484Water Utility 119,838,422 115,937,118 122,794,083 126,998,731 135,055,480 143,991,812 151,809,779 158,996,999 171,755,468 181,654,170Tucson Golf Enterprise Fund 8,230,509 8,900,670 9,284,924 7,861,067 7,341,967 7,015,322 6,126,611 6,011,381 6,125,375 7,139,282
Operating Grants and Contributions 6,761,845 7,762,635 6,769,831 6,876,004 6,511,555 6,077,057 6,110,015Capital Grants and Contributions 23,309,465 18,305,223 18,768,422 16,126,145 10,190,038 10,963,141 11,214,120 9,214,121 8,463,198 7,631,102
Total Business-type Activities Program Revenues 191,187,983 186,103,826 200,797,297 205,090,725 204,923,623 221,077,134 231,420,581 234,480,736 246,099,990 256,732,821 Total Primary Government Program Revenues $ 463,273,462 453,073,521 501,909,267 551,325,678 548,549,996 543,268,160 573,476,823 624,397,562 582,188,190 571,694,879
Fiscal Year
154

2006 2007 2008 2009 2010 2011 2012 2013 (3) 2014 (4) 2015 (5)Net (Expenses) RevenueGovernmental Activities $ (333,799,183) (383,031,066) (376,662,362) (303,508,017) (275,395,189) (286,113,531) (285,111,289) (293,630,329) (321,771,197) (430,103,732) Business-type Activities 20,009,288 12,152,280 (4,995,178) 14,075,442 6,855,314 24,351,264 23,145,452 30,971,326 18,498,760 27,161,758 Total Primary Government Net Expense $ (313,789,895) (370,878,786) (381,657,540) (289,432,575) (268,539,875) (261,762,267) (261,965,837) (262,659,003) (303,272,437) (402,941,974)
General Revenues and Other Changes in Net PositionGovernmental Activities:
TaxesProperty Taxes $ 33,669,712 37,669,367 38,247,154 36,427,562 33,033,945 36,313,914 39,869,881 41,787,498 43,912,695 44,992,133 Business Privilege Taxes 195,790,010 209,180,346 204,012,348 184,328,136 172,738,382 175,207,546 182,474,594 189,238,160 193,235,470 194,523,190 Public Utility Taxes 7,585,462 7,176,742 7,048,842 6,711,441 18,216,381 25,291,168 22,175,162 26,717,576 20,886,226 21,791,368 Hotel/Transient Occupancy Taxes 12,276,201 12,979,893 12,367,631 10,987,895 11,692,050 12,524,705 12,411,247 12,217,409 12,290,994 13,397,772 Occupational Taxes 2,044,040 2,124,410 881,679 86,868 127,851 86,091 84,690 102,558 87,846 Liquor Taxes 721,117 731,380 670,480 702,523 732,622 760,615 743,322 749,028 750,481
Unrestricted Grants and Contributions 129,370,825 136,287,823 148,335,159 141,187,557 125,011,993 110,567,181 105,988,454 115,792,652 124,171,684 131,349,102 Investment Income (Loss) 3,932,688 11,613,881 6,480,118 2,505,708 1,086,559 718,308 916,820 227,689 1,127,524 988,190 Miscellaneous 15,542,035 8,370,501 3,750,250 2,082,053 7,500,061 1,966,010 3,860,699 5,756,461 14,843,790 1,225,842 Transfers 59,894 (410,991) (783,799) (1,031,319) (5,094,077) 1,618,501 (9,228,249) (1,410,120) 957,697 1,785,611
Total Governmental Activities 400,991,984 425,723,352 421,009,862 383,988,424 365,045,767 365,054,039 359,296,620 391,178,911 412,264,407 410,053,208 Business-type Activities:
Unrestricted Grants and ContributionsInvestment Income (Loss) 2,809,904 3,586,680 2,633,875 1,752,143 866,019 1,813,164 1,739,089 1,226,119 2,079,879 1,761,345 MiscellaneousTransfers (59,894) 410,991 783,799 1,031,319 5,094,077 (1,618,501) 9,228,249 1,410,120 (957,697) (1,785,611)
Total Business-type Activities 2,750,010 3,997,671 3,417,674 2,783,462 5,960,096 194,663 10,967,338 2,636,239 1,122,182 (24,266)
Total Primary Government $ 403,741,994 429,721,023 424,427,536 386,771,886 371,005,863 365,248,702 370,263,958 393,815,150 413,386,589 410,028,942
Change in Net PositionGovernmental Activities $ 67,192,801 42,692,286 44,347,500 80,480,407 89,650,578 78,940,508 74,185,331 97,548,582 90,493,210 (20,050,524) Business-type Activities 22,759,298 16,149,951 (1,577,504) 16,858,904 12,815,410 24,545,927 34,112,790 33,607,565 19,620,942 27,137,492
Total Primary Government $ 89,952,099 58,842,237 42,769,996 97,339,311 102,465,988 103,486,435 108,298,121 131,156,147 110,114,152 7,086,968
Notes: (1) Conventional Public Housing accounting moved from governmental funds to enterprise funds.
(2) This fund is used to manage non-public housing assets that were moved from governmental funds.
(3) The implementation of GASB Statements 63 and 65 added the new balance sheet components of deferred inflows/outflows, changed Net Assets to Net Postion, and changed the name of the Capital Assset component of Net Position.
(4) Public Safety/Neighborhood Services and Operations and Development functions were re-organized into the Public Safety and Justice Services and Community Enrichment and Development functions.
(5) Beginning in fiscal year 2015, liquor and occupational fees are categorized as a charge for service as they are permits, not taxes.
Fiscal Year
155

CITY OF TUCSON TABLE IVFund Balances, Governmental FundsLast Ten Fiscal Years(Modified Accrual Basis of Accounting)
2006 2007 2008 2009 2010 (1) 2011 2012 2013 (2) 2014 2015General Fund
Reserved $ 101,993,894 116,841,230 26,948,312 22,727,163 Unreserved 62,715,037 50,947,576 31,124,703 17,000,405 Nonspendable 3,091,091 2,725,063 2,736,679 7,885,432 10,539,014 11,175,121Restricted 4,288,438 5,477,328 4,875,762 4,337,530 5,401,397 4,876,013Committed 5,412,146 28,162,175 28,074,273 27,692,762 28,356,051 29,635,059Assigned 11,523,823 13,264,761 18,056,275 1,680,900 6,464,860 4,285,870Unassigned 22,836,507 11,107,980 8,668,230 12,765,747 15,991,136 15,736,784
Total General Fund $ 164,708,931 167,788,806 58,073,015 39,727,568 47,152,005 60,737,307 62,411,219 54,362,371 66,752,458 65,708,847
All Other Governmental FundsReserved $ 53,211,786 58,199,299 128,066,834 103,582,644 Unreserved, Reported In:
Special Revenue Funds 4,648,468 (487,809) (11,863,316) 1,099,433 Capital Project Funds (3,140,518) (2,508,873) (528,205) Debt Service Funds
Total Unreserved 1,507,950 (2,996,682) (12,391,521) 1,099,433 Nonspendable 5,014,035 4,186,004 4,115,915 4,505,250 5,831,208Restricted 68,556,717 85,453,622 59,880,453 76,975,091 93,614,555 89,416,493Committed 3,284,544 3,360,321 3,142,812 5,187,925 1,611,378 104,954Assigned 13,779,239 18,901,488 9,861,655 9,559,070 15,359,731 4,498,593Unassigned (1,540,527) (177,479) (421,037) (96,591)
Total All Other Governmental Funds $ 54,719,736 55,202,617 115,675,313 104,682,077 89,094,008 111,723,956 72,463,883 95,741,410 115,090,914 99,851,248
Notes: (1) For FY 2010 GASB Statement No. 54 was implemented. See Note 1.Q. of the Notes to Basic Financial Statements.
(2) The implementation of GASB Statements 63 and 65 added the new balance sheet components of deferred inflows/outflows, changed Net Assets to Net Postion, and changed the name of the Capital Assset component of Net Position.
Fiscal Year
156

CITY OF TUCSON TABLE VTax and Other Agency Revenues, General FundLast Ten Fiscal Years(Modified Accrual Basis of Accounting)
2006 2007 2008 2009 2010 2011 2012 2013 2014 2015Tax Revenues
Property Taxes $ 9,727,445 9,975,822 10,122,161 11,568,247 11,633,043 12,034,959 12,048,032 12,467,667 12,993,033 13,413,323Public Utility Taxes (1) 7,585,462 7,176,742 7,048,842 6,711,442 18,216,381 25,291,168 22,175,162 26,717,576 20,886,226 21,791,368Local Use Taxes 5,406,243 6,839,887 7,949,205 8,770,451 6,688,928 6,361,392 5,229,898 4,332,206 3,275,783 5,336,256Business Privilege Taxes 190,383,766 202,340,460 196,063,144 169,708,658 166,573,329 168,139,915 176,758,407 182,861,378 187,178,747 188,784,244Transient Occupancy Taxes 10,206,786 10,963,953 10,488,453 9,270,796 8,578,730 8,865,662 8,881,638 9,018,728 8,853,403 9,743,022Other Taxes 4,869,058 4,871,730 3,431,368 2,511,727 3,977,799 4,793,061 4,704,477 4,280,298 4,788,139 3,990,156
Total Tax Revenues $ 228,178,760 242,168,594 235,103,173 208,541,321 215,668,210 225,486,157 229,797,614 239,677,853 237,975,331 243,058,369
Other Agency RevenuesAuto Lieu Taxes - State $ 23,134,336 23,429,781 23,445,568 22,114,531 20,318,278 19,718,347 19,743,016 19,090,499 20,030,860 20,709,722Sales Tax - State 51,801,435 50,310,855 48,272,651 41,597,129 38,800,312 40,564,009 40,807,325 42,757,073 45,344,556 47,733,015Urban Revenue Sharing - State 52,493,683 62,547,187 75,343,982 77,475,899 65,593,404 50,284,825 45,438,112 53,945,081 58,796,268 62,906,365Contributions and Agency Billings 10,784,563 1,262,098 2,663,381 1,564,782 1,570,211 3,862,945 4,855,284 4,486,826 4,563,843 5,606,984
Total Other Agency Revenue $ 138,214,017 137,549,921 149,725,582 142,752,341 126,282,205 114,430,126 110,843,737 120,279,479 128,735,527 136,956,086
Notes: (1) Public Utility Tax rate increased from 2% to 4% effective January 1, 2010
Fiscal Year
157

CITY OF TUCSON TABLE VIChanges in Fund Balances, Governmental FundsLast Ten Fiscal Years(Modified Accrual Basis of Accounting)
2006 2007 2008 2009 2010 2011 2012 2013 (2) 2014 (3) 2015Revenues
Taxes $ 252,399,097 268,850,174 262,850,771 233,356,179 237,065,108 249,762,745 255,269,345 267,885,494 265,975,961 273,206,471Licenses and Permits 21,014,411 22,211,469 23,372,170 22,067,281 21,851,480 22,480,422 22,566,668 20,660,558 20,271,165 28,604,577Fines and Forfeitures 12,536,270 13,025,976 13,688,009 15,945,245 14,591,212 14,656,099 13,845,465 12,852,016 15,761,622 16,831,650Developer Fees 8,585,307 6,985,561 5,936,592 6,782,474 3,617,096 4,923,737 6,435,351 7,865,777 5,198,521 1,522,640Use of Money and Property 5,515,756 13,645,750 8,564,946 4,763,576 3,069,974 2,812,446 2,822,212 2,475,035 3,185,971 2,248,794Federal Grants and Contributions 80,001,063 88,800,500 75,144,483 97,791,606 108,297,296 98,431,053 130,698,957 147,167,365 81,133,301 89,328,863Other Agencies 209,999,995 210,751,555 256,350,134 266,729,414 242,284,368 228,230,267 205,536,890 232,434,327 259,994,992 240,999,776Charges for Services 60,290,340 47,584,931 56,153,508 55,590,055 59,108,565 60,487,549 59,580,884 63,383,040 61,868,702 62,646,317Special Assessments 1,337,976 873,801 1,712,882 1,155,596 652,683 598,613 523,362 390,049 355,263 323,164Miscellaneous 9,704,478 6,046,159 4,916,002 5,188,266 3,912,511 3,798,046 3,162,594 6,856,402 14,916,576 8,083,996
Total Revenues 661,384,693 678,775,876 708,689,497 709,369,692 694,450,293 686,180,977 700,441,728 761,970,063 728,662,074 723,796,248
ExpendituresCurrent
Elected and Official 17,638,983 18,113,339 20,547,490 18,326,961 18,435,544 21,539,110 22,745,526 22,220,220 22,491,683 21,123,774 Support Services 56,762,595 45,444,738 43,182,510 37,623,756 38,293,888 37,282,485 32,198,197 33,533,949 44,022,242 45,244,122 Neighborhood Services 338,648,790 336,416,150 354,437,324 355,353,344 334,874,173 328,579,562 446,212,801 Environment and Development 111,266,055 119,417,994 125,894,170 112,662,056 101,757,866 110,638,943 12,266,031 Public Safety/Neighborhood Services 359,047,300 Public Safety and Justice Services 255,356,475 261,650,102 Operations and Development 133,123,134 Community Enrichment and Development 223,217,451 247,138,055 Strategic Initiatives 12,368,978 7,760,831 7,017,029 6,298,094 5,378,320 Non-Departmental 12,349,781 34,744,063 39,918,390 36,356,093 30,409,258 22,190,452 26,530,390 25,093,204 26,787,570 24,012,380
Capital Outlay 22,131,307 11,767,166 20,350,305 27,979,817 22,206,864 15,074,167 16,464,806 31,567,755 25,149,554 27,411,744 Capital Projects 58,419,415 84,542,323 94,607,634 109,248,633 95,859,440 120,926,947 105,148,263 114,500,756 81,701,341 63,066,809 Debt Service
Principal 28,092,430 32,408,561 39,356,327 27,609,139 26,767,636 20,722,468 38,542,247 27,754,913 33,961,609 49,743,385 Interest 24,108,533 27,227,363 27,105,560 27,276,527 27,614,317 27,928,190 31,471,681 29,846,761 24,241,560 25,539,124 Fiscal Agent Fees 74,613 43,875 41,025 49,197 209,780 31,250 40,800 6,138 37,850 23,625 Issuance Cost of Debt 1,334,278 1,512,249 1,183,612 422,079 1,774,291 1,093,410 643,784 1,276,819 1,197,267
Total Expenditures 683,195,758 719,398,652 772,457,764 759,967,229 702,229,165 706,687,865 732,714,152 777,337,914 738,244,154 766,150,387
Excess of Revenues Over (Under) Expenditures $ (21,811,065) (40,622,776) (63,768,267) (50,597,537) (7,778,872) (20,506,888) (32,272,424) (15,367,851) (9,582,080) (42,354,139)
(Continued)
Fiscal Year
158
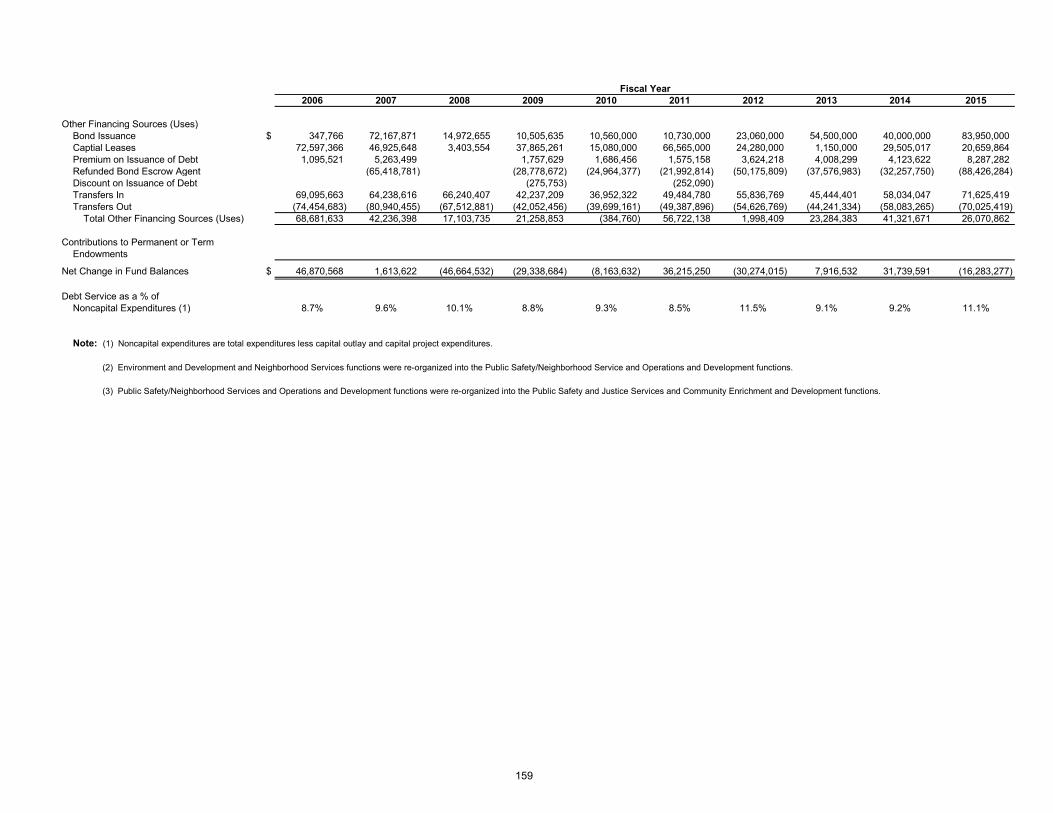
2006 2007 2008 2009 2010 2011 2012 2013 2014 2015
Other Financing Sources (Uses)Bond Issuance $ 347,766 72,167,871 14,972,655 10,505,635 10,560,000 10,730,000 23,060,000 54,500,000 40,000,000 83,950,000 Captial Leases 72,597,366 46,925,648 3,403,554 37,865,261 15,080,000 66,565,000 24,280,000 1,150,000 29,505,017 20,659,864 Premium on Issuance of Debt 1,095,521 5,263,499 1,757,629 1,686,456 1,575,158 3,624,218 4,008,299 4,123,622 8,287,282 Refunded Bond Escrow Agent (65,418,781) (28,778,672) (24,964,377) (21,992,814) (50,175,809) (37,576,983) (32,257,750) (88,426,284) Discount on Issuance of Debt (275,753) (252,090) Transfers In 69,095,663 64,238,616 66,240,407 42,237,209 36,952,322 49,484,780 55,836,769 45,444,401 58,034,047 71,625,419 Transfers Out (74,454,683) (80,940,455) (67,512,881) (42,052,456) (39,699,161) (49,387,896) (54,626,769) (44,241,334) (58,083,265) (70,025,419)
Total Other Financing Sources (Uses) 68,681,633 42,236,398 17,103,735 21,258,853 (384,760) 56,722,138 1,998,409 23,284,383 41,321,671 26,070,862
Contributions to Permanent or TermEndowments
Net Change in Fund Balances $ 46,870,568 1,613,622 (46,664,532) (29,338,684) (8,163,632) 36,215,250 (30,274,015) 7,916,532 31,739,591 (16,283,277)
Debt Service as a % of Noncapital Expenditures (1) 8.7% 9.6% 10.1% 8.8% 9.3% 8.5% 11.5% 9.1% 9.2% 11.1%
Note: (1) Noncapital expenditures are total expenditures less capital outlay and capital project expenditures.
(2) Environment and Development and Neighborhood Services functions were re-organized into the Public Safety/Neighborhood Service and Operations and Development functions.
(3) Public Safety/Neighborhood Services and Operations and Development functions were re-organized into the Public Safety and Justice Services and Community Enrichment and Development functions.
Fiscal Year
159

CITY OF TUCSON TABLE VIITaxable Sales by CategoryLast Ten Fiscal Years
Activity (1) 2006 2007 2008 2009 2010 2011 2012 2013 2014 2015
Utilities (2) $ 665,840,100 685,494,200 754,333,550 720,709,200 790,046,950 718,552,700 750,007,650 753,704,450 761,478,800 782,177,122Communications 288,738,150 309,965,250 314,494,025 234,427,450 240,025,429 267,402,622 227,677,700 232,882,104 201,169,667 184,659,928Publishing & Printing 56,622,550 56,808,850 55,307,570 44,152,529 54,591,885 46,369,408 50,777,500 47,314,952 46,030,420 46,225,728Restaurants 950,077,050 1,006,900,500 966,255,780 909,165,921 912,271,846 913,184,999 996,147,700 1,031,086,030 1,053,054,171 1,116,095,399Amusements 60,073,700 68,246,600 62,898,805 56,520,306 80,315,638 81,730,112 84,884,600 88,969,460 85,607,140 85,427,724Rentals 1,473,847,350 1,576,227,300 1,051,928,291 967,460,437 969,092,254 971,487,214 985,211,000 1,015,055,763 998,954,427 972,479,203Contracting 898,467,650 1,103,554,400 1,180,979,287 926,838,539 674,230,827 707,955,711 745,759,900 835,481,024 862,574,090 654,854,410Retail 5,769,134,550 5,861,941,200 5,745,480,498 4,882,756,145 4,668,578,836 4,793,591,280 5,062,139,300 5,336,970,626 5,455,905,198 5,804,257,368Use Tax 252,770,250 311,142,550 342,690,041 437,398,000 335,281,026 325,202,306 256,853,800 219,717,771 208,957,129 274,254,592Other 2,148,900 9,693,050 4,337,849 3,459,309 2,332,375 2,324,982 2,051,050 2,812,713 1,388,506 1,711,651
$ 10,417,720,250 10,989,973,900 10,478,705,696 9,182,887,836 8,726,767,066 8,827,801,334 9,161,510,200 9,563,994,893 9,675,119,548 9,922,143,125
City's Tax Rate 2% 2% 2% 2% 2% 2% 2% 2% 2% 2%
Notes: (1) Tax activity reporting were re-calculated for fiscal years 2006-2014 due to changes in tax software collection systems.
Fiscal Year
Total Business Privilege Activity
(2) The utility activity is split into three categories with different tax rates: utility tax, 2%; public utility tax, 4%; and utility right-of-way tax, 1.5%. The public utility tax is assessed against both the utility and communication activites net of any franchise tax. In fiscal year 2012, the calculation of the utility revenue base was changed because the various tax rates apply to the same revenue base. In previous years an average rate was used, which resulted in using a calculated revenue base.
160
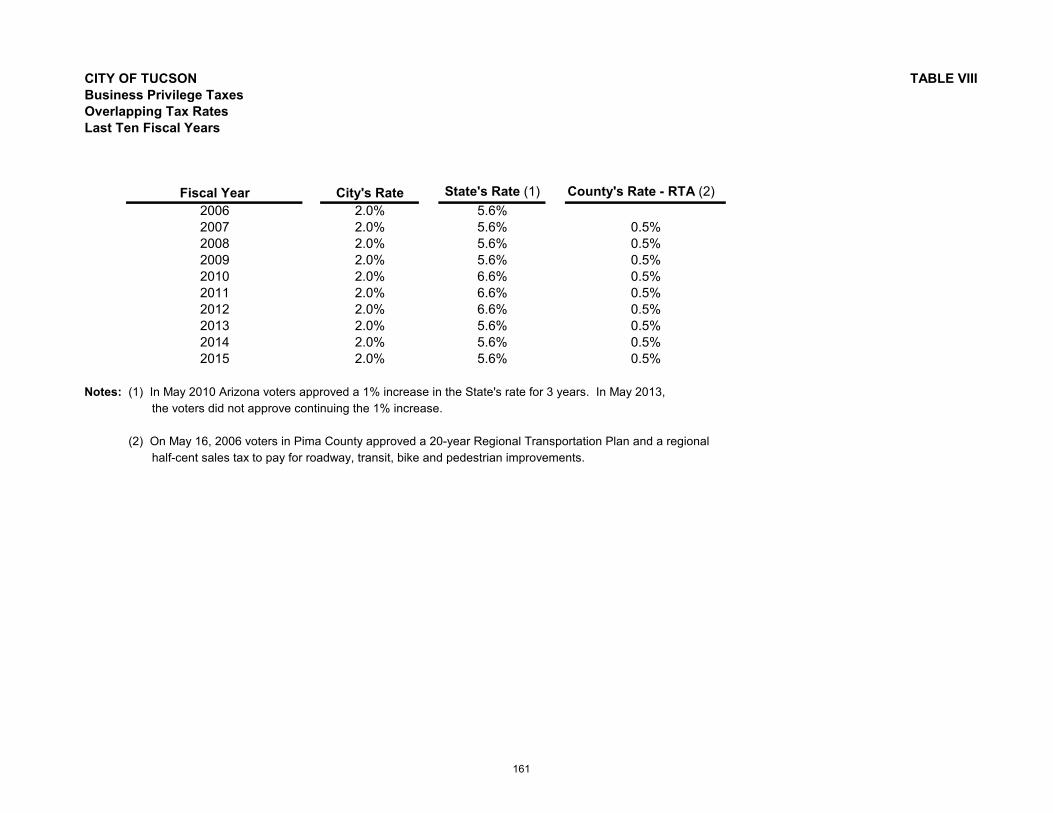
CITY OF TUCSON TABLE VIIIBusiness Privilege TaxesOverlapping Tax RatesLast Ten Fiscal Years
Fiscal Year City's Rate State's Rate (1) County's Rate - RTA (2)2006 2.0% 5.6%2007 2.0% 5.6% 0.5%2008 2.0% 5.6% 0.5%2009 2.0% 5.6% 0.5%2010 2.0% 6.6% 0.5%2011 2.0% 6.6% 0.5%2012 2.0% 6.6% 0.5%2013 2.0% 5.6% 0.5%2014 2.0% 5.6% 0.5%2015 2.0% 5.6% 0.5%
Notes: (1) In May 2010 Arizona voters approved a 1% increase in the State's rate for 3 years. In May 2013, the voters did not approve continuing the 1% increase.
(2) On May 16, 2006 voters in Pima County approved a 20-year Regional Transportation Plan and a regional half-cent sales tax to pay for roadway, transit, bike and pedestrian improvements.
161

CITY OF TUCSON TABLE IXPrincipal Business Privilege Tax Remitters By ActivityCurrent Year and Nine Years Ago
Business Sector Tax Paid % of Total Tax Paid % of Total
Utility $ 13,316,802 6.2% $ 15,654,120 7.1%Public Utility 7,229,078 3.3% 21,206,714 9.7%Public Utility (Right of Way) 242,975 0.1% 712,773 0.3%Communications 5,774,763 2.7% 3,745,576 1.7%Publishing & Printing 1,132,451 0.5% 921,730 0.4%Restaurants 19,001,541 8.8% 22,300,451 10.2%Amusements 1,201,474 0.6% 1,690,378 0.8%Rentals 29,476,947 13.7% 19,419,007 8.9%Contracting 17,969,353 8.3% 12,634,392 5.8%Retail 115,382,691 53.5% 115,714,650 52.8%Use Tax 5,055,405 2.3% 5,301,358 2.4%Other Activities 42,978 0.0% 34,568 0.0% Total (1) $ 215,826,458 100% $ 219,335,717 100%
Notes: (1) Total does not include refunds and other reductions.
Fiscal Year 2006 Fiscal Year 2015
162

CITY OF TUCSON TABLE XRatios of Outstanding Debt by TypeLast Ten Fiscal Years
Street & Highway Clean General Highway Expansion Certificates Special Renewable Total
Fiscal Obligation Revenue Loan of Assessment Capital Energy GovernmentalYear Bonds Bonds Program Participation Debt Leases Bonds Activities2006 244,179,667$ 151,604,194$ $ 154,668,013$ 3,482,290$ 7,218,103$ $ 561,152,267$ 2007 245,941,434 141,039,342 187,546,573 3,331,922 11,505,815 566,450,190 2008 231,335,000 130,074,491 13,400,000 175,822,401 4,333,598 11,484,700 604,261,902 2009 262,210,644 129,612,924 5,900,000 194,647,929 4,192,893 7,697,512 7,595,900 611,857,802 2010 245,618,295 129,386,496 194,509,665 3,626,171 5,687,600 7,011,600 585,839,827 2011 228,830,948 129,040,167 250,893,995 3,052,000 2,875,924 17,662,300 632,355,334 2012 215,939,228 115,753,502 243,748,461 2,469,000 1,660,877 16,458,000 596,029,068 2013 220,197,706 116,685,796 236,008,762 2,006,000 2,340,221 15,178,700 592,417,185 2014 221,448,585 103,815,714 256,206,057 1,577,000 2,062,612 13,889,400 598,999,368 2015 221,866,839 89,760,231 241,337,521 1,139,000 3,073,227 12,580,100 569,756,918
Water TotalSystem General Certificates Business- Total Percentage
Fiscal Revenue Obligation Capital of type Primary of Personnel Per Year Bonds Bonds (1) Leases Participation Activities Government Income (2) Capita (2)2006 393,737,686 42,386,887 6,787,833 5,471,613 448,384,019 1,009,536,286 3.27% 1,023.66 2007 423,770,161 45,835,796 7,096,351 5,060,079 481,762,387 1,048,212,577 3.17% 1,052.42 2008 448,147,196 45,515,223 7,687,215 4,628,544 505,978,178 1,110,240,080 3.38% 1,095.99 2009 472,246,885 5,028,084 14,559,976 491,834,945 1,103,692,747 3.16% 1,084.39 2010 495,077,420 2,738,197 14,557,161 512,372,778 1,098,212,605 3.12% 1,060.36 2011 508,483,331 1,261,542 14,554,345 524,299,218 1,156,654,552 3.14% 1,187.53 2012 530,725,708 517,185 14,429,000 545,671,893 1,141,700,961 3.10% 1,152.07 2013 543,238,800 10,714,000 553,952,800 1,146,369,985 3.11% 1,150.05 2014 554,163,377 10,753,136 564,916,513 1,163,915,881 3.16% 1,168.54 2015 553,470,977 10,617,119 564,088,096 1,133,845,014 2.96% 1,125.74
Notes: Details regarding the City's outstanding debt can be found in the notes to the financial statements.
(1) Debt service is paid and bond liability reported in the Environmental Services Enterprise Fund. A restatment was done in FY 2009.
(2) Population and personal income information can be found on Table XV
Business-type Activities
Governmental Activities
163

CITY OF TUCSON TABLE XIRatios of Net General Bonded Debt OutstandingLast Ten Fiscal Years
Net Estimated PercentageGeneral General Net Full of Actual
Fiscal Obligation Obligation Cash Property Per Year Bonds Bonds Value Value Capita 2006 (1) 286,566,554$ 7,839,739$ 278,726,815$ 19,785,493,382$ 1.41% 282.63$ 2007 (2) 291,777,230 10,833,913 280,943,317 22,220,936,879 1.26% 282.07 2008 (3) 276,850,223 13,842,695 263,007,528 26,219,680,375 1.00% 259.63 2009 (4) 262,210,644 10,742,199 251,468,445 30,304,695,215 0.83% 247.07 2010 245,618,295 4,234,358 241,383,937 30,988,293,628 0.78% 233.06 2011 228,830,948 1,101,917 227,729,031 29,724,994,272 0.77% 233.81 2012 215,939,228 215,939,228 26,361,320,625 0.82% 217.90 2013 220,197,706 220,197,706 25,277,236,323 0.87% 220.90 2014 221,448,585 221,448,585 23,573,852,432 0.94% 222.332015 221,866,839 221,866,839 23,621,125,299 0.94% 220.28
Source: Estimated net full cash value is from the General Obligations, Series 2012-C (2015) Official Statement.
Notes: Details regarding the City's outstanding debt can be found in the notes to the financial statements.
(1) Includes $42,386,887 of General Bonded debt in the Environment Services Fund.
(2) Includes $45,835,796 of General Bonded debt in the Environment Services Fund.
(3) Includes $45,515,223 of General Bonded debt in the Environment Services Fund.
(4) General Bonded debt no longer in the Environment Services Fund.
Less: AmountsAvailable inDebt Service
Fund
164

CITY OF TUCSON TABLE XIIDirect and Overlapping Governmental Activities DebtAs of June 30, 2015
EstimatedEstimated Share of
Debt Percentage OverlappingOverlapping Jurisdiction Outstanding Applicable Debt (1)
Debt Paid with Property Taxes Pima County, Arizona 383,935,000$ 41.32% 158,641,942$ Tucson Unified School District No. 1 186,990,000 76.00% 142,112,400 Flowing Wells Unified School District No. 8 17,455,000 6.02% 1,050,791 Amphitheater Unified School District No. 10 97,530,000 8.20% 7,997,460 Sunnyside Unified School District No. 12 60,830,000 13.13% 7,986,979 Tanque Verde Unified School District No. 13 12,335,000 5.40% 666,090 Vail Unified School District No. 20 61,390,000 13.42% 8,238,538 Sahuarita Unified School District No. 30 38,215,000 27.00% 10,318,050
Other DebtPima County Capital Leases 178,156,361 41.32% 73,614,208 Tucson Unified School District No. 1 Capital Leases 47,666,654 76.00% 36,226,657 Flowing Wells Unified School District No. 8 Capital Leases 62,147 6.02% 3,741 Sunnyside Unified School District No. 12 Capital Leases 2,155,350 13.13% 282,997
Subtotal, Overlapping Debt 447,139,853
City of Tucson, Arizona Direct Debt 569,756,918 Total Direct and Overlapping Debt 1,016,896,771$
Source: State Report of Indebtedness and General Obligations, Series 2012-C (2015) Official Statement.
Notes: (1) Proportion applicable to the City is computed on a ratio of secondary assessed valuation of the overlapping entitywithin the City to the amount of the total secondary assessed valuation of the City.
165

CITY OF TUCSON TABLE XIIILegal Debt Margin InformationLast Ten Fiscal Years
2006 2007 2008 2009 2010 2011 2012 2013 2014 2015
Primary Tax Rate (1) $ 0.3469 0.3411 0.3296 0.3231 0.3144 0.3289 0.4297 0.4125 0.5245 0.4829 0.8895 0.8846 0.8025 0.6370 0.6200 0.6261 0.7324 0.8514 0.9059 0.9777
Total Property Tax Rate (2) $ 1.2364 1.2257 1.1321 0.9601 0.9344 0.9550 1.1621 1.2639 1.4304 1.4606
$ 2,722,915,853 3,016,230,759 3,491,926,602 3,895,581,900 3,862,655,420 3,914,105,239 3,487,959,628 3,377,401,416 3,151,042,287 3,131,952,246
163,374,951 180,973,846 209,515,596 233,734,914 231,759,325 210,076,018 209,277,578 202,644,085 189,062,537 187,420,72351,333,460 20,715,000 9,145,000 660,000
$ 112,041,491 160,258,846 200,370,596 233,074,914 231,759,325 210,076,018 209,277,578 202,644,085 189,062,537 187,420,723
68.58% 88.55% 95.64% 99.72% 100.00% 100.00% 100.00% 100.00% 100.00% 100.00%
$ 544,583,171 603,246,152 698,385,320 779,116,380 772,531,084 782,821,048 697,591,926 675,480,283 630,208,457 624,735,746230,155,609 262,585,610 259,960,610 253,415,610 238,315,610 222,360,610 209,071,010 213,450,000 214,760,000 213,495,000
$ 314,427,562 340,660,542 438,424,710 525,700,770 534,215,474 560,460,438 488,520,916 462,030,283 415,448,457 411,240,746
57.74% 56.47% 62.78% 67.47% 69.15% 71.59% 70.03% 68.40% 65.92% 65.83%
Notes: (1) Starting in FY 2011, the primary rate includes a rate for Involuntary Tort Judgements authorized under Arizona Administrative Code Regulation 15-12-202.
(2) The City's ability to issue debt is, in part, limited by the City Charter which precludes the total property tax rate to exceed 1.75 per $100 assessed value. The secondary property tax rate is levied annually to pay general obligation debt service.
(3) The Arizona Constitution and Arizona Revised Statutes limit the City's general obligation bonded debt capacity to certain percentages of the City's secondary assessed valuation and by the type of project to be constructed. For projects involving water, sewer, artificial lighting, parks, open space and recreational facility improvements, the City can issue general obligation bonds up to 20% of it's secondary assessed valuation. For any other general purpose improvements, the City may issue bonds up to 6% of it's secondary assessed valuation.
6% Limitation (3)
Fiscal Year
Secondary Tax Rate
Secondary Assessed Value
Less: Direct G.O. Bonds OutstandingLegal Debt Margin
Legal Debt MarginLegal Debt Margin as a Percentage of the Debt Limit
Legal Debt Margin as a Percentage of the Debt Limit
20% Limitation (3) Less: Direct G.O. Bonds Outstanding
166

CITY OF TUCSON TABLE XIVPledged Revenue CoverageFor the Last Ten Fiscal Years
Utility Less: Net Combined Annual Senior Lien AnnualFiscal Service Operating Available Debt Service Debt ServiceYear Charges Expenses Revenue Principal Interest Principal Interest Coverage Ratio Coverage Ratio (1)2006 128,693,649$ 71,289,091$ 57,404,558$ 11,201,882$ 18,924,918$ $ $ 1.872007 124,708,152 73,544,769 51,163,383 15,414,363 15,950,064 13,070,000 15,000,057 1.63 1.822008 129,575,735 77,116,750 52,458,985 13,589,134 18,816,787 10,515,000 17,813,015 1.61 1.852009 130,592,259 73,340,779 57,251,480 14,102,839 19,565,491 10,850,000 18,214,243 1.70 1.962010 138,999,806 71,990,433 67,009,373 17,619,889 19,207,229 14,252,045 18,018,477 1.82 2.082011 148,473,207 75,307,470 73,165,737 20,147,455 22,130,225 16,500,000 20,919,848 1.73 1.962012 156,327,453 83,267,358 73,060,095 21,198,854 22,226,365 18,330,000 20,946,272 1.68 1.862013 163,836,521 84,757,495 79,079,026 24,503,570 21,875,823 19,595,000 20,729,587 1.71 1.962014 176,411,669 91,766,938 84,644,731 22,543,481 19,291,096 19,345,000 18,170,704 2.02 2.262015 186,136,837 96,997,979 89,138,858 28,201,640 21,117,117 24,900,000 20,073,447 1.81 1.98
Special Fiscal Assessments HURFYear Collections Principal Interest Coverage Revenues Principal Interest Coverage 2006 744,351$ 441,600$ 168,055$ 1.22 50,371,196$ 9,250,000$ 7,660,318$ 2.982007 692,291 453,001 170,514 1.11 49,427,956 9,600,000 7,263,235 2.932008 1,370,171 570,887 210,457 1.75 48,918,768 10,000,000 6,831,205 2.912009 742,520 516,254 214,151 1.02 45,849,257 6,118,500 7.492010 677,504 566,635 200,664 0.88 43,475,000 6,150,817 7.072011 612,085 574,000 171,169 0.82 40,018,318 5,941,298 6.742012 536,157 583,000 142,025 0.74 37,160,062 12,255,000 6,167,389 2.022013 396,135 463,000 115,553 0.68 40,613,665 5,437,808 7.472014 371,320 429,000 92,610 0.71 41,266,976 11,660,000 5,042,561 2.472015 335,927 438,000 70,064 0.66 44,846,287 12,965,000 4,544,350 2.56
Notes: Details regarding the City's outstanding debt can be found in the notes to the financial statements. Operating expenses do not include depreciation, interest, or amortizationexpenses.
(1) The coverage ratio is based on the Annual Debt Service coverage as defined by City of Tucson Ordinance No. 6347. An amendment to Section 7.01 of Ordinance 6347 further requires that if the Net Revenue of any fiscal year does not equal or exceed 175% of the Senior Lien Annual Debt Service Requirement for that fiscal year, the City will deposit additional monies into a reserve account. Prior to Fiscal Year 2007, the coverage ratio was based on both senior and junior lien debt service requirements. Starting in Fiscal Year 2007, the coverage ratio requirement will be based on the senior lien annual debt service requirement.
Debt ServiceDebt Service
Special Assessments
Water System Revenue Bonds
Senior Lien Debt Service
Highway User Fees (HURF)
Combined Debt Service
167

City of Tucson TABLE XVDemographic and Economic Statistics (1)Last Ten Fiscal Years
PerCapita
Calendar Personal Personal UnemploymentYear (2) Population Income Income Rate
2005 986,200 28,796,630,000$ 29,200$ 4.5%2006 996,000 30,837,500,000 30,961 3.8%2007 1,013,000 33,117,770,000 32,693 4.7%2008 1,017,800 32,873,000,000 32,298 7.9%2009 1,035,700 34,958,100,000 33,753 8.6%2010 974,000 35,187,500,000 36,127 9.1%2011 991,000 36,864,000,000 37,199 7.2%2012 996,800 37,031,000,000 37,150 7.0%2013 996,046 37,587,700,000 37,737 6.6%2014 1,007,200 38,272,000,000 37,998 5.7%
(1) Population and Personal Income are for the Tucson Metropolitan Statistic Area
(2) Data is for the calendar year that ends during that fiscal year. For example, fiscal year 2015 contains data for the calendar year ending December 31, 2014.
Sources: Department of Urban Planning. Economic Outlook, University of Arizona; and the Arizona Department of Administration,Office of Employement and Population Statistics, in cooperation with the U.S. Department of Labor, Bureau of Labor Statistics.
168
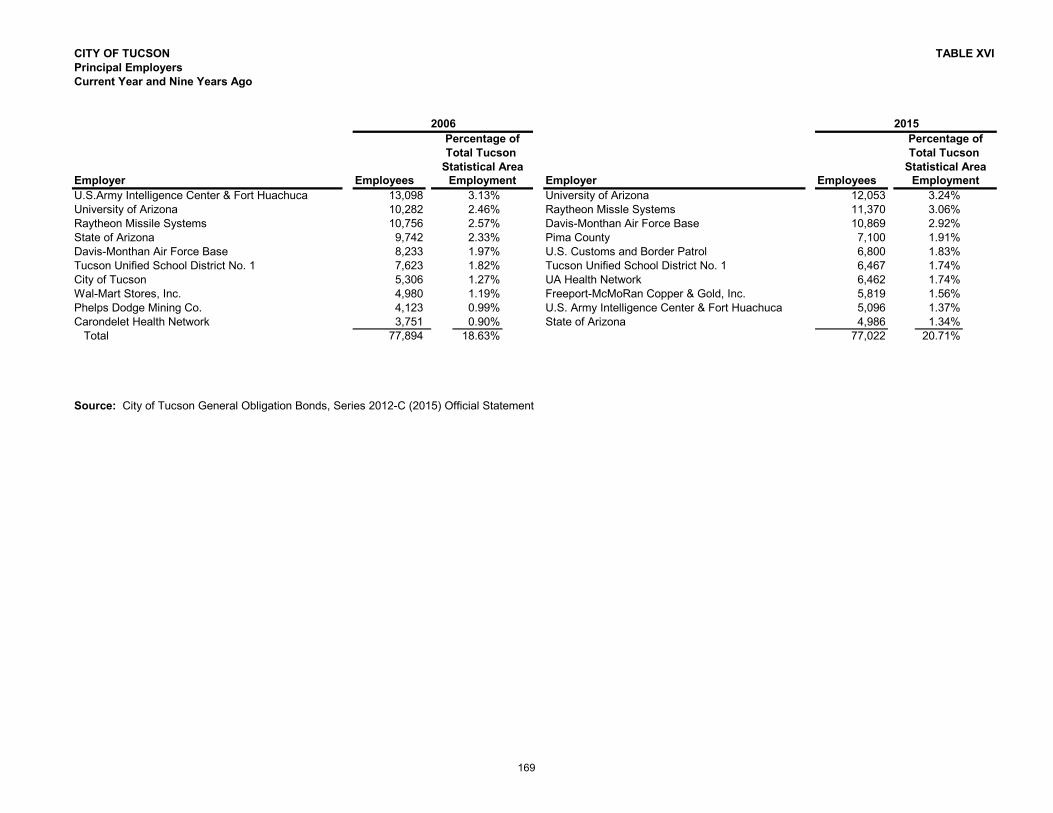
CITY OF TUCSON TABLE XVIPrincipal EmployersCurrent Year and Nine Years Ago
Employer Employees Employer EmployeesU.S.Army Intelligence Center & Fort Huachuca 13,098 3.13% University of Arizona 12,053 3.24%University of Arizona 10,282 2.46% Raytheon Missle Systems 11,370 3.06%Raytheon Missile Systems 10,756 2.57% Davis-Monthan Air Force Base 10,869 2.92%State of Arizona 9,742 2.33% Pima County 7,100 1.91%Davis-Monthan Air Force Base 8,233 1.97% U.S. Customs and Border Patrol 6,800 1.83%Tucson Unified School District No. 1 7,623 1.82% Tucson Unified School District No. 1 6,467 1.74%City of Tucson 5,306 1.27% UA Health Network 6,462 1.74%Wal-Mart Stores, Inc. 4,980 1.19% Freeport-McMoRan Copper & Gold, Inc. 5,819 1.56%Phelps Dodge Mining Co. 4,123 0.99% U.S. Army Intelligence Center & Fort Huachuca 5,096 1.37%Carondelet Health Network 3,751 0.90% State of Arizona 4,986 1.34%
Total 77,894 18.63% 77,022 20.71%
Source: City of Tucson General Obligation Bonds, Series 2012-C (2015) Official Statement
2006 2015Percentage ofTotal Tucson
Statistical AreaEmployment
Percentage ofTotal Tucson
Statistical AreaEmployment
169

City of Tucson TABLE XVIIAdopted Budget Full-time-Equivalent City Employees by FunctionLast Ten Fiscal Years
Function 2006 2007 2008 2009 2010 2011 2012 2013 (1) 2014 (2) 2015
Elected and Official 234.50 223.50 253.50 250.00 247.50 214.50 207.50 209.50 223.00 206.50Neighborhood Services 3,422.05 3,277.80 3,433.55 3,447.05 3,277.55 3,167.80 2,413.75Public Safety/Neighborhood Services 2,974.75Public Safety and Justice Services 2,239.30 2,237.80Operations and Development 578.00 564.50 577.50 563.50 456.00 450.00 1,159.25 594.00Strategic Initiatives 93.75 63.75 63.75 63.75Community Enrichment and Development 1,090.25 1,052.50Support Services 720.71 724.71 702.16 702.16 676.66 644.50 303.00 301.50 524.00 518.00Non-Departmental 4.75 14.75 4.00 4.00Pension Services 4.00 4.00 4.00Utility Services-Environmental Services 262.00 251.00 264.00 263.00 248.00 241.00 241.00 237.00 222.00 216.00Utility Services-Water 571.00 573.00 578.00 580.00 568.00 556.00 556.00 549.00 547.00 547.50Golf Courses (3) 154.75 154.75 154.75 154.75 154.75 145.25 63.75 68.00 68.00
Total 6,041.51 5,847.76 6,031.21 6,028.21 5,628.46 5,419.05 4,944.25 4,937.75 4,917.55 4,782.30
Source: Adopted Budget - Volume I
(1) Environment and Development and Neighborhood Services functions were re-organized into the Public Safety/Neighborhood Service and Operations and Development functions.
(2) Public Safety/Neighborhood Service and Operations and Development functions were re-organized into the Public Safety and Justice Services and Community Enrichment and Development.
(3) Beginning in fiscal year 2015, Tucson City Golf is managed by an independent contractor.
Fiscal Year
170

City of TucsonCapital Asset Statistics by FunctionLast Ten Fiscal Years
Function 2006 2007 2008 2009 2010 2011 2012 2013 2014 2015
Police Facilities 8 8 8 9 9 13 13 13 13 9 Fire Stations 20 20 21 21 21 21 21 21 21 22 Parks & Recreation Recreation/Regional Centers 18 18 18 18 18 18 18 18 18 20 Golf Courses 5 5 5 5 5 5 5 5 5 5
Parks 136 136 142 142 142 142 142 142 142 127 Playfields 231 231 231 231 231 231 231 231 231 225 Swimming Pools 27 27 27 27 27 27 27 27 27 45
Transportation Residential (Miles) 1,355 1,378 1,378 1,384 1,384 1,384 1,604 1,604 1,629 1,645 Collectors (Miles) 101 101 101 101 101 101 101 101 101 101
Arterials (Miles) 287 287 287 287 287 287 316 316 371 381 Interstate (Miles) 80 80 80 80 80 80 80 80 80 80 Transit Buses (Active Fleet) 189 196 203 230 241 240 237 252 240 252 Water Operable Wells 212 212 216 216 214 221 226 206 230 225 Miles of Water Mains 4,561 4617 4,437 4,683 4,454 4,620 4,687 4,793 4,606 4,623
Source: Various City Departments
Fiscal Year
TABLE XVIII
171

CITY OF TUCSON TABLE XIXOperating Indicators by FunctionLast Ten Fiscal Years
Function 2006 2007 2008 2009 2010 2011 2012 2013 2014 2015General Government Number of Construction Permits (Residential and Commerical) 6,531 5,187 3,994 2,802 2,921 2,984 2,430 2,295 1,932 2094 Permit Revenue $12,965,191 $10,728,891 $10,509,526 $7,227,251 $6,769,166 $8,278,724 $8,179,531 $8,909,982 $6,870,350 $8,644,604Police Calls for Service 337,224 346,836 345,395 327,882 296,316 299,191 305,662 328,015 346,817 326,900 Calls for Service per Capita 0.34 0.35 0.62 0.60 0.54 0.57 0.56 0.62 0.66 0.62 Part I Crimes (% Cleared) (1) 16.30% 16.97% 19.39% 18.41% 20.43% 17.04% 17.13% 11.52% 14.73% 14.80% Part II Crimes (% Cleared) (1) 89.05% 86.07% 94.14% 94.27% 97.90% 100.00% 93.02% 83.61% 79.22% 37.94%Fire Emergency Responses 71,843 76,567 79,940 79,380 77,800 79,721 80,236 81,941 79,704 85,594 Inspections 2,801 2,644 3,028 7,825 8,712 8,301 8,319 6,293 7,199 5,471Parks & Recreation KIDCO Registration 8,273 6,851 4,423 2,967 2,947 3,710 4,161 3,407 3,209 3,195 Class Enrollment-Other than KIDCO 35,703 19,681 10,531 19,865 7,412 18,304 19,418 17,607 16,949 16,724 Facility Rental 13,095 14,197 14,215 14,021 13,032 11,509 11,734 9,325 9,231 10,688 Zoo Visitors 439,380 467,108 504,528 529,010 514,269 524,701 585,583 549,929 568,028 618,357Environmental Services Landfill Tons of Waste Collected 638,550 690,215 631,465 487,144 412,950 435,864 453,400 471,400 517,564 560,938 Tons of Material Recycled 46,034 46,918 46,096 44,480 44,622 43,534 39,000 38,000 38,623 39,506Water Average Total Monthly Connections
Potable 220,571 225,048 224,129 228,157 224,562 222,736 223,139 224,284 225,791 227,052 Reclaimed 950 993 1,086 1,053 1,061 1,087 1,087 1,082 1,086 1,076
New Connections Potable 4,846 3,880 2,295 1,064 1,064 1,127 1,018 1,459 1,186 1,258 Reclaimed 48 55 15 17 17 0 0 9 0 (10)
Water Sales (1000 ccf) Potable 49,536 46,366 46,590 44,443 43,668 42,885 41,433 41,109 41,266 39,876
Reclaimed 5,998 5,848 6,617 7,151 6,913 6,872 6,285 6,483 7,154 6,188Transportation
10 10 2 to 4 weeks 4 to 6 weeks 4 to 6 weeks 4 to 6 weeks 42 16 2 to 3 weeks 1885.0% 79% 80% 81% 81% 67% 43% 46% 23% 28%$89.56 $95.00 $250.00 $486.00 $516.00 $567.00 $700.00 $746.00 $831.00 $593.00
$5.67 $5.91 $6.02 $6.44 $6.23 $5.78 $6.89 $6.20 $7.11 $7.08$0.63 $0.53 $0.68 $0.59 $0.69 $0.74 $0.70 $0.64 $0.73 $0.68
Source: Various City Departments
Note: (1) Part I crimes include Homicides, Sexual Assaults, Robberies, Burglaries, Larceny, Motor Vehicle Thefts, and TPD Arson. Part II crimes include Narcotic Violations, DUI, and Juvenile Violations. Percentage of cases cleared is computed by dividing cases cleared by cases reported.
( 2) The criteria for assessing the range of conditions have become more narrow. Other factors for the decrease include deferred maintenance from prior years.
FISCAL YEAR
Average Response Time (working days) to Complete Pothole Repairs
Sun Tran's Operating Expenses per Passenger Mile Sun Tran's Operating Expenses per Vehicle Revenue Mile Traffic Signal Expenditure per Repair The % of Lane Miles Assessed as Satisfactory or Better (2)
172

CITY OF TUCSON, ARIZONA
GLOSSARY
Glo
ssary

Glossary
Accrual basis of accounting. A method of accounting that recognizes the financial effect of transactions, events, and interfund activities when they occur, regardless of the timing of related cash flows. All proprietary and trust funds use the accrual basis of accounting.
Agent multiple-employer defined benefit pension plan. An aggregation of single-employer plans, with pooled administrative and investment functions. Separate accounts are maintained for each employer so that the employer's contributions provide benefits only for the employees of that employer. A separate actuarial valuation is performed for each individual employer's plan to determine the employer's periodic contribution rate and other information for the individual plan, based on the benefit formula selected by the employer and the individual plan's proportionate share of the pooled assets. The results of the individual valuations are aggregated at the administrative level. [SGAS 27]
Assigned fund balance. The portion of fund balance that reflects the City’s intended use of resources. This intent would have to be established by either the Mayor and Council or their designee.
Basic financial statements. The minimum combination of financial statements and note disclosures required for fair presentation in conformity with GAAP.
Basis of accounting. The timing of recognition, that is, when the effects of transactions or events should be recognized for financial reporting purposes. For example, the effects of transactions or events can be recognized on an accrual basis (that is, when the transactions or events take place), or on a cash basis (that is, when cash is received or paid). Basis of accounting is an essential part of measurement focus because a particular timing of recognition is necessary to accomplish a particular measurement focus. [SGAS 11]
Budgetary basis of accounting. The method used to determine when revenues and expenditures are recognized for budgetary purposes.
Capital and related financing activities. Term used in connection with cash flows reporting. Capital and related financing activities include (a) acquiring and disposing of capital assets used in providing services or producing goods, (b) borrowing money for acquiring, constructing, or improving capital assets and repaying the amounts borrowed, including interest, and (c) paying for capital assets obtained from vendors on credit. [SGAS 9]
Capital projects fund. Fund type used to account for financial resources to be used for the acquisition or construction of major capital facilities (other than those financed by proprietary funds and trust funds).
Capitalization threshold. The dollar value at which a government elects to capitalize tangible or intangible assets that are used in operations and that have initial useful lives extending beyond a single reporting period. For the City, the capitalization threshold is $5,000.
Cash. The term, as used in connection with cash flows reporting, includes not only currency on hand, but also demand deposits with banks or other financial institutions. Cash also includes deposits in other kinds of accounts or cash management pools that have the general characteristics of demand deposit accounts in that the governmental enterprise may deposit additional cash at any time and also effectively may withdraw cash at any time without prior notice or penalty. [SGAS 9]
Cash equivalent. Term used in connection with cash flows reporting. Short-term, highly liquid investments that are both (a) readily convertible to known amounts of cash and (b) so near their maturity that they present insignificant risk of changes in value because of changes in interest rates. Generally, only investments with original maturities of three months or less meet this definition. For this purpose "original maturity" means the original maturity to the entity holding the investment. [SGAS 9]
Collateral. Term used in connection with deposits with financial institutions. Security pledged by a financial institution to a governmental entity for its deposit.
173
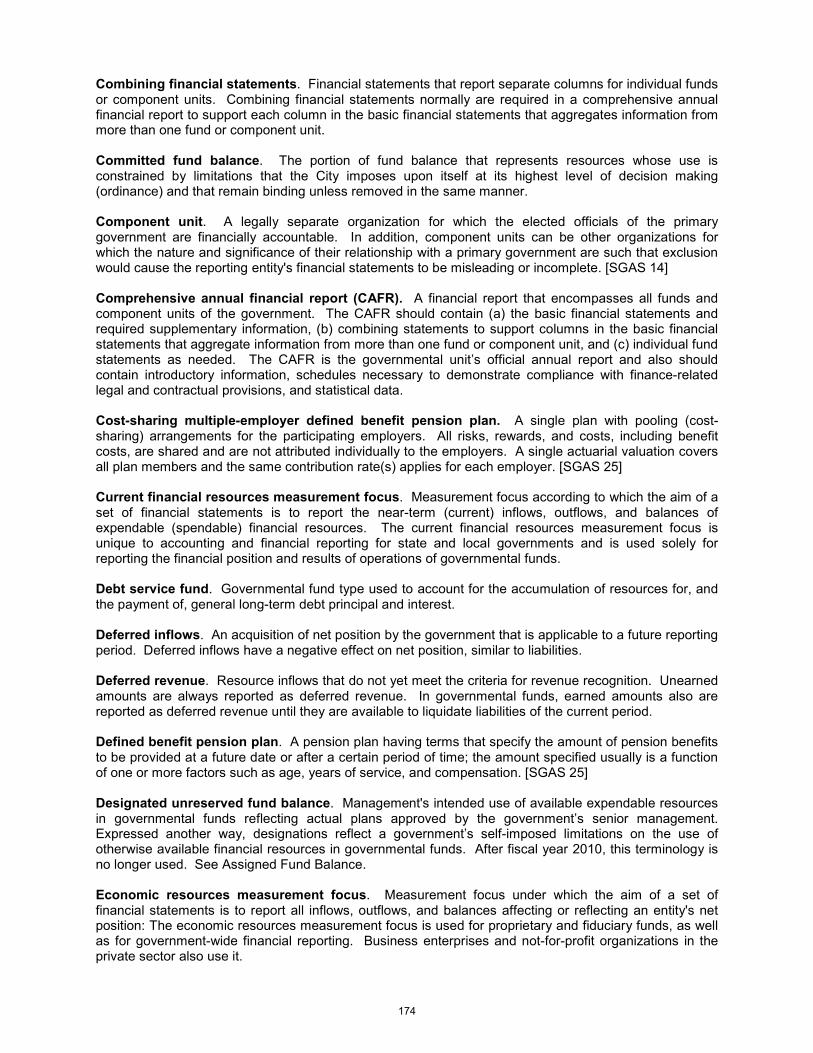
Combining financial statements. Financial statements that report separate columns for individual funds or component units. Combining financial statements normally are required in a comprehensive annual financial report to support each column in the basic financial statements that aggregates information from more than one fund or component unit.
Committed fund balance. The portion of fund balance that represents resources whose use is constrained by limitations that the City imposes upon itself at its highest level of decision making (ordinance) and that remain binding unless removed in the same manner.
Component unit. A legally separate organization for which the elected officials of the primary government are financially accountable. In addition, component units can be other organizations for which the nature and significance of their relationship with a primary government are such that exclusion would cause the reporting entity's financial statements to be misleading or incomplete. [SGAS 14]
Comprehensive annual financial report (CAFR). A financial report that encompasses all funds and component units of the government. The CAFR should contain (a) the basic financial statements and required supplementary information, (b) combining statements to support columns in the basic financial statements that aggregate information from more than one fund or component unit, and (c) individual fund statements as needed. The CAFR is the governmental unit’s official annual report and also should contain introductory information, schedules necessary to demonstrate compliance with finance-related legal and contractual provisions, and statistical data.
Cost-sharing multiple-employer defined benefit pension plan. A single plan with pooling (cost-sharing) arrangements for the participating employers. All risks, rewards, and costs, including benefit costs, are shared and are not attributed individually to the employers. A single actuarial valuation covers all plan members and the same contribution rate(s) applies for each employer. [SGAS 25]
Current financial resources measurement focus. Measurement focus according to which the aim of a set of financial statements is to report the near-term (current) inflows, outflows, and balances of expendable (spendable) financial resources. The current financial resources measurement focus is unique to accounting and financial reporting for state and local governments and is used solely for reporting the financial position and results of operations of governmental funds.
Debt service fund. Governmental fund type used to account for the accumulation of resources for, and the payment of, general long-term debt principal and interest.
Deferred inflows. An acquisition of net position by the government that is applicable to a future reporting period. Deferred inflows have a negative effect on net position, similar to liabilities.
Deferred revenue. Resource inflows that do not yet meet the criteria for revenue recognition. Unearned amounts are always reported as deferred revenue. In governmental funds, earned amounts also are reported as deferred revenue until they are available to liquidate liabilities of the current period.
Defined benefit pension plan. A pension plan having terms that specify the amount of pension benefits to be provided at a future date or after a certain period of time; the amount specified usually is a function of one or more factors such as age, years of service, and compensation. [SGAS 25]
Designated unreserved fund balance. Management's intended use of available expendable resources in governmental funds reflecting actual plans approved by the government’s senior management. Expressed another way, designations reflect a government’s self-imposed limitations on the use of otherwise available financial resources in governmental funds. After fiscal year 2010, this terminology is no longer used. See Assigned Fund Balance.
Economic resources measurement focus. Measurement focus under which the aim of a set of financial statements is to report all inflows, outflows, and balances affecting or reflecting an entity's net position: The economic resources measurement focus is used for proprietary and fiduciary funds, as well as for government-wide financial reporting. Business enterprises and not-for-profit organizations in the private sector also use it.
174

Encumbrances. Commitments related to unperformed (executory) contracts for goods or services.
Enterprise fund. Proprietary fund type used to report an activity for which a fee is charged to external users for goods or services.
Expenditure. Decreases in net financial resources under the current financial resources measurement focus not properly classified as other financing uses.
Fiduciary funds. Funds used to report assets held in a trustee or agency capacity for others and which therefore cannot be used to support the government's own programs. The fiduciary fund category includes pension (and other employee benefit) trust funds, investment trust funds, private-purpose trust funds, and agency funds.
Financial reporting entity. A primary government, organizations for which the primary government is financially accountable, and other organizations for which the nature and significance of their relationship with the primary government are such that exclusion would cause the reporting entity's financial statements to be misleading or incomplete. The nucleus of a financial reporting entity usually is a primary government. However, a governmental organization other than a primary government (such as a component unit, a joint venture, a jointly governed organization, or other stand-alone government) serves as the nucleus for its own reporting entity when it issues separate financial statements.
Financial resources. Resources that are or will become available for spending. Financial resources include cash and resources ordinarily expected to be converted to cash (e.g., receivables, investments). Financial resources also may include inventories and prepaids (because they obviate the need to expend current available financial resources).
Financial section. One of the three basic sections of a comprehensive annual financial report. The financial section is used to present the independent auditor's report on the financial statements, the basic financial statements (including the notes to the financial statements), required supplementary information, combining statements, individual fund statements and schedules, and supplementary information, as needed.
Fund. A fiscal and accounting entity with a self-balancing set of accounts recording cash and other financial resources, together with all related liabilities and residual equities or balances, and changes therein, that are segregated for the purpose of carrying on specific activities or attaining certain objectives in accordance with special regulations, restrictions, or limitations.
Fund balance. The difference between assets and liabilities reported in a governmental fund. Fund balance can be divided in to the following components: nonspendable, restricted, committed, assigned and unassigned.
Fund classifications. One of the three categories (governmental, proprietary, and fiduciary) used to classify fund types.
Fund type. One of 11 classifications into which all individual funds can be categorized. Governmental fund types include the general fund, special revenue funds, debt service funds, capital projects funds, and permanent funds. Proprietary fund types include enterprise funds and internal service funds. Fiduciary fund types include pension (and other employee benefit) trust funds, investment trust funds, private-purpose trust funds, and agency funds.
General fund. The general fund is one of five governmental fund types and typically serves as the chief operating fund of a government. The general fund is used to account for all financial resources except those required to be accounted for in another fund.
175

Generally accepted accounting principles (GAAP). The conventions, rules, and procedures that serve as the norm for the fair presentation of financial statements. The various sources of GAAP for state and local government are set forth by SAS No. 69, The Meaning of "Present Fairly in Conformity with Generally Accepted Accounting Principles" in the Independent Auditor's Report.
Government Finance Officers Association (GFOA). An association of public finance professionals founded in 1906 as the Municipal Finance Officers Association. The GFOA has played a major role in the development and promotion of GAAP for state and local government since its inception and has sponsored the Certificate of Achievement for Excellence in Financial Reporting Program since 1946.
Governmental Accounting Standards Board (GASB). The ultimate authoritative accounting and financial reporting standard-setting body for state and local governments. The GASB was established in June 1984 to replace the NCGA.
Governmental funds. Funds generally used to account for tax-supported activities. There are five different types of governmental funds: the general fund, special revenue funds, debt service funds, capital project funds, and permanent funds.
Intangible Asset. An asset with an initial useful life beyond a single reporting life and lacks physical substance and is not in a monetary form similar cash or investment securities.
Internal service funds. Proprietary fund type that may be used to report any activity that provides goods or services to other funds, departments, or agencies of the primary government and its component units, or to other governments, on a cost-reimbursement basis. The goal of an internal service fund is to measure the full cost of providing goods or services for the purpose of fully recovering that cost (including the cost of capital assets) through fees or charges.
Introductory section. The first of three essential components of any comprehensive annual financial report. The introductory section typically provides general information on a government's structure and personnel as well as information useful in assessing the government’s financial condition. The contents of the introductory section normally fall outside the scope of the independent audit of the financial statements.
Landfill closure and postclosure care costs. Costs incurred to provide for the protection of the environment that occur near or after the date that a municipal solid-waste landfill stops accepting solid waste and during the postclosure period. Closure and postclosure care costs include the cost of equipment and facilities (e.g., leachate collection systems and final cover) as well as the cost of services (e.g., postclosure maintenance and monitoring costs). [SGAS18]
Legal debt margin. The excess of the amount of debt legally authorized over the amount of debt outstanding.
Legal defeasance. A situation that occurs when debt is legally satisfied based on certain provisions in the debt instrument even though the debt is not actually paid. When debt is defeased, it is no longer reported as a liability on the face of the statement of position; only the new debt, if any, is reported as a liability. [SGAS 7]
Legal level of budgetary control. The level at which a government’s management may not reallocate resources without special approval from the legislative body.
176
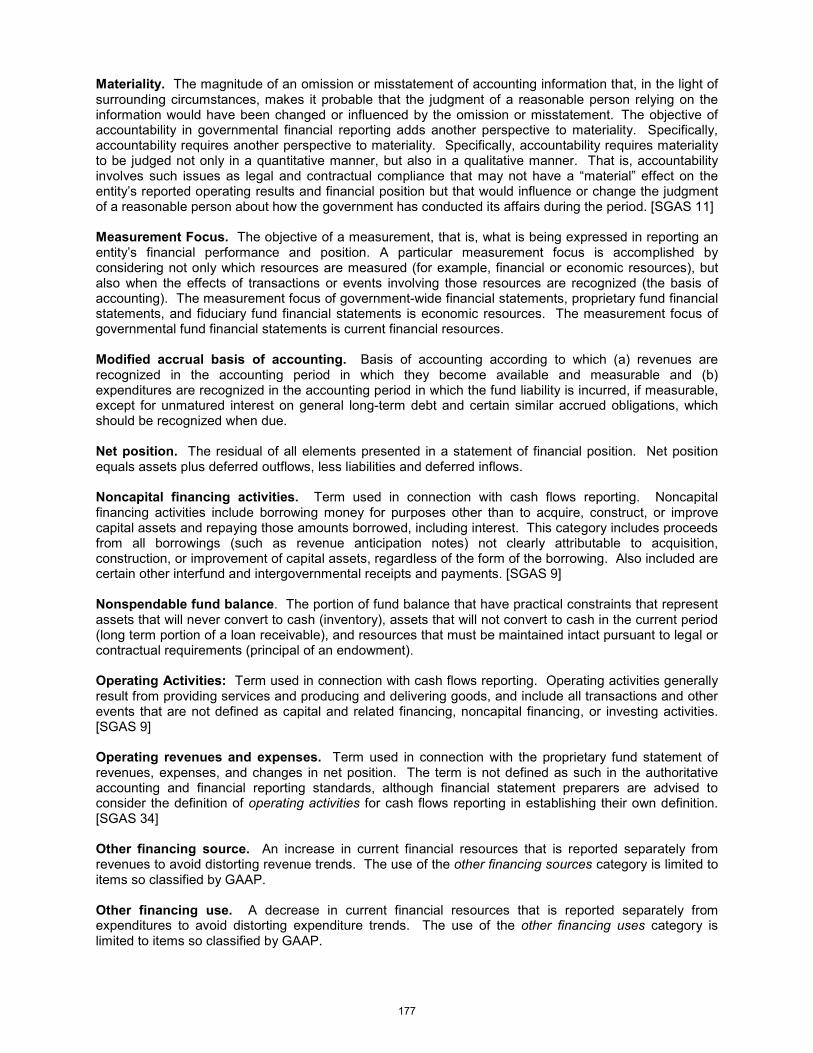
Materiality. The magnitude of an omission or misstatement of accounting information that, in the light of surrounding circumstances, makes it probable that the judgment of a reasonable person relying on the information would have been changed or influenced by the omission or misstatement. The objective of accountability in governmental financial reporting adds another perspective to materiality. Specifically, accountability requires another perspective to materiality. Specifically, accountability requires materiality to be judged not only in a quantitative manner, but also in a qualitative manner. That is, accountability involves such issues as legal and contractual compliance that may not have a “material” effect on the entity’s reported operating results and financial position but that would influence or change the judgment of a reasonable person about how the government has conducted its affairs during the period. [SGAS 11]
Measurement Focus. The objective of a measurement, that is, what is being expressed in reporting an entity’s financial performance and position. A particular measurement focus is accomplished by considering not only which resources are measured (for example, financial or economic resources), but also when the effects of transactions or events involving those resources are recognized (the basis of accounting). The measurement focus of government-wide financial statements, proprietary fund financial statements, and fiduciary fund financial statements is economic resources. The measurement focus of governmental fund financial statements is current financial resources.
Modified accrual basis of accounting. Basis of accounting according to which (a) revenues are recognized in the accounting period in which they become available and measurable and (b) expenditures are recognized in the accounting period in which the fund liability is incurred, if measurable, except for unmatured interest on general long-term debt and certain similar accrued obligations, which should be recognized when due.
Net position. The residual of all elements presented in a statement of financial position. Net position equals assets plus deferred outflows, less liabilities and deferred inflows.
Noncapital financing activities. Term used in connection with cash flows reporting. Noncapital financing activities include borrowing money for purposes other than to acquire, construct, or improve capital assets and repaying those amounts borrowed, including interest. This category includes proceeds from all borrowings (such as revenue anticipation notes) not clearly attributable to acquisition, construction, or improvement of capital assets, regardless of the form of the borrowing. Also included are certain other interfund and intergovernmental receipts and payments. [SGAS 9]
Nonspendable fund balance. The portion of fund balance that have practical constraints that represent assets that will never convert to cash (inventory), assets that will not convert to cash in the current period (long term portion of a loan receivable), and resources that must be maintained intact pursuant to legal or contractual requirements (principal of an endowment).
Operating Activities: Term used in connection with cash flows reporting. Operating activities generally result from providing services and producing and delivering goods, and include all transactions and other events that are not defined as capital and related financing, noncapital financing, or investing activities. [SGAS 9]
Operating revenues and expenses. Term used in connection with the proprietary fund statement of revenues, expenses, and changes in net position. The term is not defined as such in the authoritative accounting and financial reporting standards, although financial statement preparers are advised to consider the definition of operating activities for cash flows reporting in establishing their own definition. [SGAS 34]
Other financing source. An increase in current financial resources that is reported separately from revenues to avoid distorting revenue trends. The use of the other financing sources category is limited to items so classified by GAAP.
Other financing use. A decrease in current financial resources that is reported separately from expenditures to avoid distorting expenditure trends. The use of the other financing uses category is limited to items so classified by GAAP.
177

Other post-retirement healthcare benefits (OPEB). Medical, dental, vision, and other health-related benefits provided to retired employees, dependents, and beneficiaries. [SGAS 26]
Overlapping debt. Proportionate share that property within a government must bear the debts of other local governments located wholly or in part within the geographic boundaries of the reporting government. Except for special assessment debt, the amount of debt of each unit applicable to the reporting unit is arrived at by (1) determining what percentage of the total assessed value of the overlapping jurisdiction lies within the limits of the reporting unit, and (2) applying this percentage to the total debt of the overlapping jurisdiction. Special assessment debt is allocated on the basis of the ratio of assessments receivable in each jurisdiction, which will be used wholly or in part to pay off the debt, to total assessments receivable, which will be used wholly or in part for this purpose.
Pension (and other employee benefit) trust funds. A fiduciary fund type used to report resources that are required to be held in trust for the members and beneficiaries of defined benefit pension plans, defined contribution plans, other postemployment benefit plans, or other employee benefit plans.
Permanent Funds. A fiduciary fund type used to report resources that are legally restricted to the extent that only earnings, and not principal may be used for purposes that support the reporting government’s programs – that is, for the benefit of the government or its citizenry.
Proprietary funds. Funds that focus on the determination of operating income, changes in net position (or cost recovery), financial position, and cash flows. There are two different types of proprietary funds: enterprise funds and internal service funds.
Refunding. The issuance of new debt whose proceeds are used to repay previously issued debt. The proceeds may be used immediately for this purpose (a current refunding), or they may be placed with an escrow agent and invested until they are used to pay principal and interest on the old debt at a future time (an advance refunding).
Required supplementary information. Statements, schedules, statistical data, or other information that the GASB has determined to be necessary to supplement, although not required to be a part of, the basic statements. [SGAS 5]
Restricted assets. Assets whose use is subject to constraints that are either (a) externally imposed by creditors (such as through debt covenants), grantors, contributors, or laws or regulations of other governments or (b) imposed by law through constitutional provisions or enabling legislation.
Restricted fund balance. The portion of fund balance that reflects resources that are subject to externally enforceable legal restrictions. Such restrictions are imposed by parties altogether outside the City, such as creditors, grantors (federal/state), laws and regulations of other governments.
Special revenue fund. A governmental fund type used to account for the proceeds of specific revenue sources (other than for major capital projects) that are legally restricted to expenditure for a specified purpose.
Statistical section. The third of three essential components of any comprehensive annual financial report. The statistical section provides a broad range of trend data covering key financial indicators from the past 10 fiscal years (e.g., general government revenues and expenditures, property tax collections, debt burden). It also contains demographic and miscellaneous data useful in assessing a government’s financial condition. The contents of the statistical section normally fall outside the scope of the independent audit of the financial statements.
Unassigned fund balance. The surplus in the general fund that is left over if resources are not constrained by nonspendable, committed, restricted, and assigned. Only the general fund can have unassigned fund balance. The other governmental funds, special revenue, debt service, and capital project funds, due to the constraints on these resources can not have a positive unassigned, but can have a negative unassigned balance.
178

www.tucsonaz.gov/finance