Embed Size (px)
Citation preview

1
STUDY OF GROUTED DEEP FOUNDATIONS IN COHESIONLESS SOILS
By
SUDHEESH THIYYAKKANDI
A DISSERTATION PRESENTED TO THE GRADUATE SCHOOL OF THE UNIVERSITY OF FLORIDA IN PARTIAL FULFILLMENT
OF THE REQUIREMENTS FOR THE DEGREE OF DOCTOR OF PHILOSOPHY
UNIVERSITY OF FLORIDA
2013

2
© 2013 Sudheesh Thiyyakkandi

3
To my lovely wife, Aswathy

4
ACKNOWLEDGEMENTS
This dissertation would not have been possible without the help and
encouragements of many personalities around me.
First and foremost, I would like to express my heartfelt gratitude to my advisor,
Dr. Michael C. McVay for his excellent guidance, creative suggestions, and timely
advices for the completion of this research. I have been very fortunate to have an
advisor like him. His dedication to research and teaching has always inspired me. He
gave me the freedom to explore my own thoughts on the research, but provided the
insightful discussions and guided me in the right direction whenever I needed.
I express my sincere thanks to other members of my doctoral committee, Dr.
Dennis Hiltunen, Dr. Gary Consolazio, and Dr. Ajay Shanker for their valuable
comments and suggestions.
I also wish to convey my thanks to FDOT officials, especially Mr. Peter Lai for
providing the financial support during the period. I am deeply indebted to Coastal
Engineering staff, Mr. Ryan Mackey, Mr. Jim Joiner, Mr. Victor Adams, and Mr. Richard
Booze for the constant help and co-operation rendered during the experimental works. I
am thankful to Mr. Jose Hernando and his crew, State Materials Office, Gainesville, for
all the helps provided to perform the field testing. I articulate my sincere thanks to Mr.
Jon Sinnreich, Load Test Gainesville for providing me various monitoring instruments
for my load tests. I would like to say thanks to all the members in geotechnical group for
their help in various ways to bring out this work.
I am grateful to my parents, parents in law, and grandparents in law for their love
and encouragement. I am thankful to my brother, brothers in law, other relatives, and
friends for their support and encouragement. I deeply thank my wife for her patience,

5
support, and encouragement during this journey and my son who has given me
enormous energy and relieved stresses in my studies with his little smiles.
Last but not the least I express my heartfelt thanks to Almighty God who made
this work flawless and painless throughout the course of my doctoral research.

6
TABLE OF CONTENTS
Page
ACKNOWLEDGEMENTS ............................................................................................... 4
LIST OF TABLES ............................................................................................................ 9
LIST OF FIGURES ........................................................................................................ 11
ABSTRACT ................................................................................................................... 18
CHAPTER
1 INTRODUCTION .................................................................................................... 20
1.1 Problem Statement ........................................................................................... 20 1.2 Hypothesis ........................................................................................................ 23
1.3 Objectives ......................................................................................................... 23 1.4 Scope ................................................................................................................ 24
1.4.1 Analysis of the Previous Experimental Data on Jetted and Grouted Piles ....................................................................................................... 24
1.4.2 Numerical Modeling of Jetted and Grouted Piles ................................... 24
1.4.3 Develop a Design Methodology for Jetted and Grouted Piles ............... 25 1.4.4 Full-Scale Field Installation and Testing of Single Jetted and Grouted
Piles ....................................................................................................... 25
1.4.5 Small-Scale Testing of Jetted and Grouted Pile Groups ........................ 26 1.4.6 Small-Scale Testing of Post Grouted Drilled Shaft Groups .................... 26
1.4.7 Numerical Modeling of Post Grouted Drilled Shafts ............................... 27 1.4.8 Develop Axial Prediction Approach for Post Grouted Drilled Shafts ...... 27
1.4.9 Comparison of Side and Tip Grouted Versus Tip Only Grouted Foundations ........................................................................................... 28
1.5 Overview of Dissertation ................................................................................... 28
2 LITERATURE REVIEW .......................................................................................... 30
2.1 Pile Jetting ........................................................................................................ 30 2.2 Post Grouted Drilled Shafts .............................................................................. 31
2.3 Jetted and Grouted Precast Piles ..................................................................... 34
2.4 Cavity Expansion Theory .................................................................................. 35 2.5 Soil-Pile Interaction ........................................................................................... 37
3 INDIVIDUAL RESPONSE OF JETTED AND GROUTED PILES ............................ 47
3.1 Analysis of the Previous Experimental Data on Jetted and Grouted Piles ........ 47 3.1.1 Test Chamber and Instrumentation ....................................................... 47 3.1.2 Test Soil Properties and Test Chamber Soil Preparation ...................... 48 3.1.3 Residual Horizontal Stress Around Pile ................................................. 50

7
3.2 Numerical Modeling of Jetted and Grouted Piles .............................................. 51
3.2.1 Material Models ..................................................................................... 51 3.2.2 Simulation of Grouting and Top Down Load Test .................................. 52
3.2.3 Lateral Stress Distribution and Lateral Soil Displacement During Pile Grouting ................................................................................................. 54
3.3 Design Methodology for Jetted and Grouted Piles ............................................ 56 3.3.1 Estimation of Jetted and Grouted Pile Grouting Pressures .................... 56 3.3.2 Estimation of Unit Skin Friction .............................................................. 57
3.3.3 Load Displacement Curve for Jetted and Grouted Piles ........................ 60 3.4 Full-Scale Field Installation and Testing of Single Jetted and Grouted Piles .... 62
3.4.1 Soil Investigation at the Test Site........................................................... 62 3.4.2 Design and Construction of Precast Piles Used for Jetted and
Grouted Piles ......................................................................................... 64
3.4.2.1 Structural design ....................................................................... 64 3.4.2.2 Design and fabrication of grout delivery and jetting systems .... 64
3.4.2.3 Construction of precast piles and preparation for jetting ........... 65
3.4.2.4 Jetting of precast piles .............................................................. 67 3.4.2.5 Design and construction of concrete cap for jetted and
grouted piles ............................................................................. 68
3.4.2.6 Side and tip grouting of the piles ............................................... 70 3.4.3 Measured Noise and Vibration During Pile Jetting and Grouting ........... 72
3.4.3.1 Measured noise ........................................................................ 73 3.4.3.2 Measured ground surface vibration .......................................... 75
3.4.4 Axial Top Down Testing of the Jetted and Grouted Pile ........................ 76
3.4.5 Construction and Testing of Comparison Drilled shaft ........................... 78
3.4.5.1 Construction of test drilled shaft ................................................ 78
3.4.5.2 Axial top down testing of drilled shaft ........................................ 79 3.4.6 Comparison of the Response of Jetted and Grouted Piles with Drilled
Shaft ...................................................................................................... 79 3.4.7 Combined Torsion and Lateral Load Testing of the Jetted and
Grouted Pile ........................................................................................... 80
3.4.7.1 Design and fabrication of Mast arm assembly .......................... 80 3.4.7.2 Test setup, instrumentation, and load test procedure ............... 81
3.4.7.3 Analysis of results ..................................................................... 82
4 GROUP RESPONSE OF JETTED AND GROUTED PILES ................................. 128
4.1 Group Testing of Jetted and Grouted Piles ..................................................... 129 4.1.1 Soil Preparation in the Test Chamber .................................................. 129 4.1.2 Design and Construction of Precast Piles ............................................ 130 4.1.3 Jetting of Precast Piles for Each Group ............................................... 131 4.1.4 Side Grouting of the Piles .................................................................... 131
4.1.5 Static Top Down Test Prior to Tip Grouting ......................................... 132 4.1.6 Tip Grouting of the Piles ...................................................................... 132 4.1.7 Static Top Down Test After Tip Grouting ............................................. 133 4.1.8 Excavation of Jetted and Grouted Pile Groups .................................... 133
4.2 Analysis of Experimental Jetted and Grouted Pile Group Behavior ................ 133

8
4.3 Predicted Axial Response of Jetted and Grouted Pile Groups ........................ 137
4.3.1 Skin Resistance of the Groups ............................................................ 137 4.3.2 Load – Displacement Response of the Groups ................................... 138
5 GROUP RESPONSE OF POST GROUTED DRILLED SHAFTS ......................... 155
5.1 Group Testing of Post Grouted Drilled Shafts ................................................. 156 5.1.1 Soil Preparation for Group Tests ......................................................... 156 5.1.2 Fabrication of the Reinforcing Cage and Tip Grout System for Drilled
Shafts .................................................................................................. 156
5.1.3 Top Down Testing of Drilled Shaft Groups Prior to Tip Grouting ......... 157 5.1.4 Tip Grouting of Drilled Shafts ............................................................... 158 5.1.5 Top Down Testing on Tip Grouted Drilled Shaft Groups ...................... 159
5.1.6 Excavation of Tip-Grouted Drilled Shaft Groups .................................. 159 5.2 Analysis of Experimental Post Grouted Drilled Shaft Group Behavior ............ 160
6 INDIVIDUAL RESPONSE OF POST GROUTED DRILLED SHAFTS .................. 179
6.1 Numerical Modeling of Post Grouted Drilled Shafts ........................................ 179 6.1.1 Material Models and Parameters ......................................................... 180
6.1.2 Modeling of Construction, Tip Grouting, and Top Down Load Tests.... 181 6.1.3 Skin Resistance of Tip Grouted Shafts ................................................ 183 6.1.4 Load Transfer Mechanism at Shaft Tip ................................................ 184
6.2 Develop Axial Prediction Approach for Post Grouted Drilled Shafts ............... 186 6.2.1 Estimation of Unit Tip Resistance vs. Tip Displacement ...................... 186
6.2.2 Estimation of Tip Area Increase Due to Grouting ................................ 189 6.2.3 Comparison of Prediction Approach with Field Test Data .................... 192
7 COMPARISON OF SIDE AND TIP GROUTED VERSUS TIP ONLY GROUTED FOUNDATIONS .................................................................................................... 207
7.1 Residual Horizontal Stress Around Deep Foundations ................................... 207
7.2 Maximum Tip Grout Pressure and Grout Bulb Formation ............................... 208 7.3 Axial Resistance ............................................................................................. 210
7.4 Group Interaction ............................................................................................ 210
8 CONCLUSIONS ................................................................................................... 215
LIST OF REFERENCES ............................................................................................. 220
BIOGRAPHICAL SKETCH .......................................................................................... 228

9
LIST OF TABLES
Table Page 3-1 Measured lateral soil stress change due to jetting and grouting ......................... 85
3-2 Measured grout pressure and grout volume ....................................................... 85
3-3 Material properties used in PLAXIS .................................................................... 85
3-4 Measured and predicted grout pressures for 2.44 m long piles .......................... 86
3-5 Side resistance prediction .................................................................................. 86
3-6 Estimation of required jet pipe diameter ............................................................. 87
3-7 Comparison of measured and predicted grout pressures ................................... 87
3-8 Comparison of the measured and predicted tip grout pressures ........................ 88
3-9 Limiting velocity suggested by AASHTO Designation R8-81 .............................. 88
3-10 Side resistance prediction for field jetted and grouted pile ................................. 88
3-11 Comparison of measured and predicted side resistance .................................... 89
3-12 Comparison of unit skin frictions for jetted and grouted pile vs. drilled shaft ...... 89
3-13 Forces and moments on the foundation for the E7-T6 Mast Arm assembly (design wind speed = 130 mph) ......................................................................... 89
3-14 Dimensions of Mast arm assembly ..................................................................... 89
3-15 Forces and moments on the pile under maximum lateral load (54 kN) ............... 90
3-16 Comparison of mobilized and predicted (ultimate) torsional resistance .............. 90
4-1 Jetted and grouted piles grouting data ............................................................. 139
4-2 Highest horizontal soil stress increase near chamber boundary during grouting and group load test ............................................................................. 139
4-3 Side resistance prediction for single piles and groups ...................................... 140
4-4 Comparison of individual skin resistance prediction using the tip grout pressure and the proposed method .................................................................. 140
4-5 List of parameters used for the group load-displacement prediction ................ 141

10
5-1 Drilled shafts grouting data ............................................................................... 166
5-2 Increase of horizontal soil stress at shaft tip elevation during grouting & group test .................................................................................................................... 166
6-1 Material properties used in PLAXIS .................................................................. 195
6-2 Skin resistance of shafts before and after grouting ........................................... 195
6-3 Comparison of grouted and un-grouted skin resistance from full scale tests in United States .................................................................................................... 196
6-4 Shafts and relevant parameters used for the prediction ................................... 197
6-5 Details of full scale field tests and relevant parameters .................................... 197
6-6 Shafts and relevant parameters used for the prediction ................................... 198
7-1 Comparison between the measured tip grout pressures and spherical cavity expansion limit pressures ................................................................................. 213

11
LIST OF FIGURES
Figure Page 2-1 Three zones during pile jetting............................................................................ 40
2-2 Pressurized tip grouting of drilled shafts ............................................................. 40
2-3 Grout distribution systems: Sleeve port and Flat jack types ............................... 41
2-4 Schematic of Jetted and grouted pile with grout delivery and jetting systems .... 42
2-5 Grout delivery systems for the top and bottom zones of pile .............................. 43
2-6 Jet nozzles and side grout membranes attached to piles ................................... 44
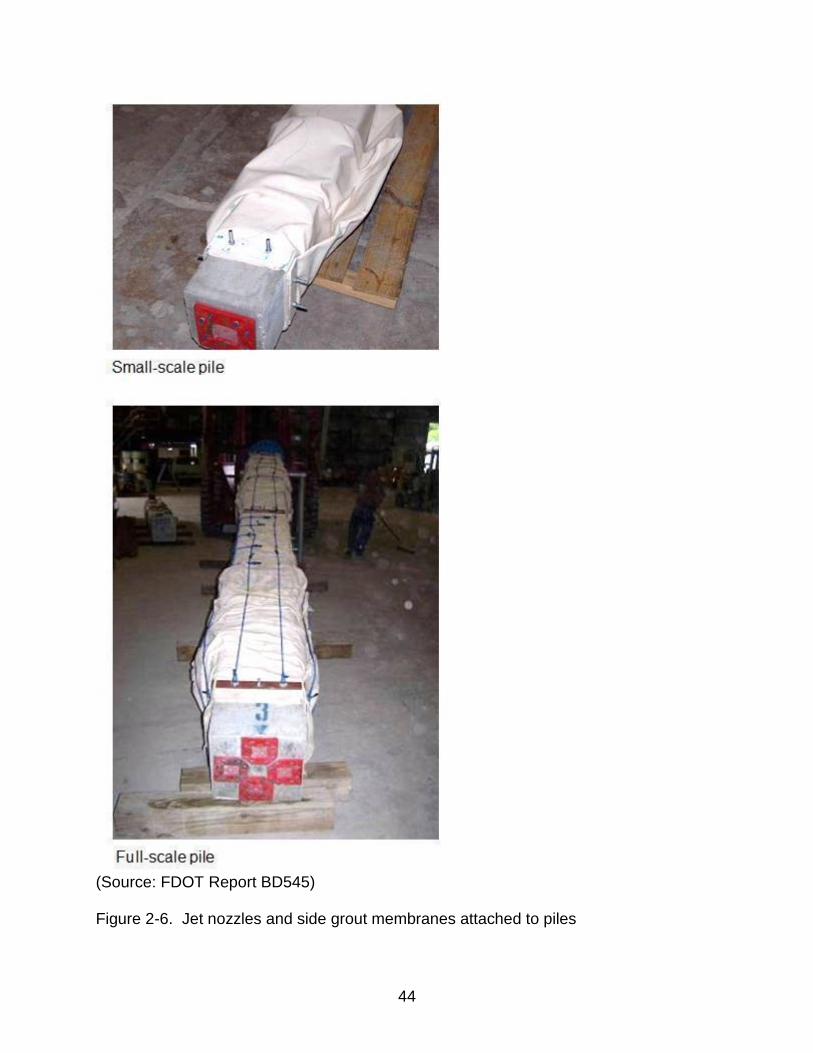
2-7 Excavated 0.406 m square x 6.1 m long jetted and grouted pile ........................ 45
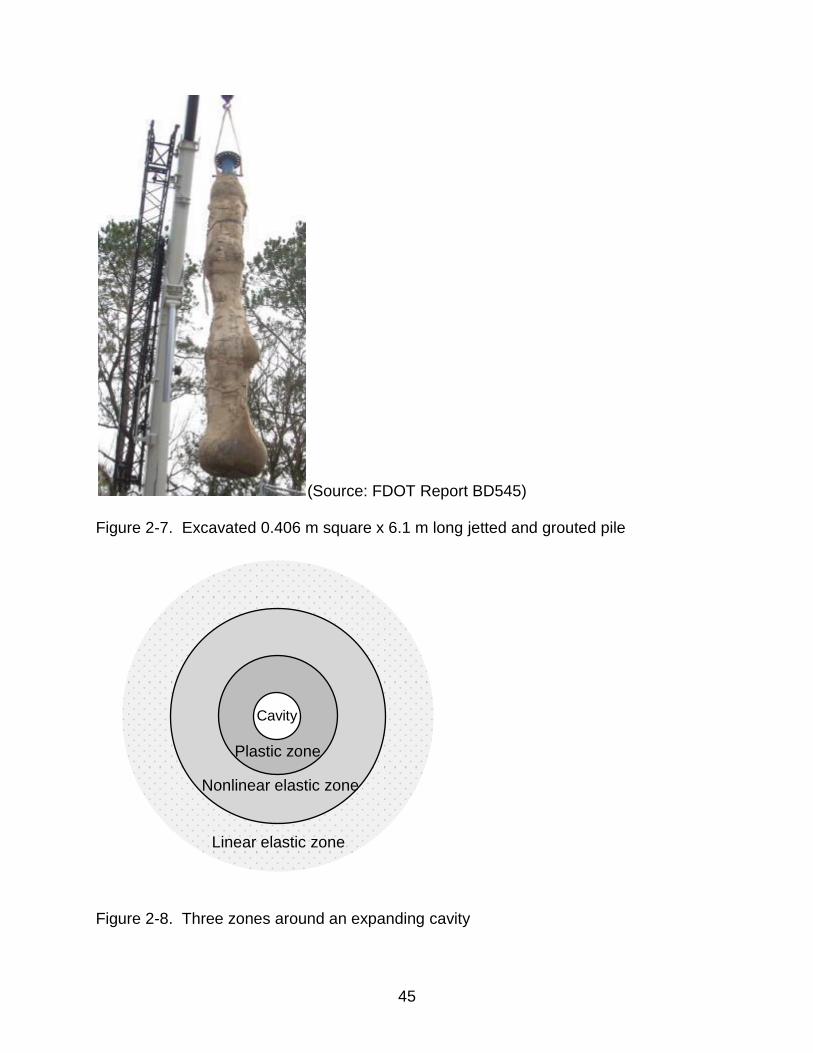
2-8 Three zones around an expanding cavity ........................................................... 45
2-9 Soil-pile interaction ............................................................................................. 46
3-1 FDOT’s test chamber and reaction shafts, Coastal Engineering lab, UF (Photo courtesy of author, Sudheesh Thiyyakkandi) .......................................... 91
3-2 Earth pressure cells in the test chamber (Photo courtesy of author, Sudheesh Thiyyakkandi) ..................................................................................................... 91
3-3 Grain size distribution of test soil ........................................................................ 92
3-4 Expansion pressure vs. volume curves from Pressuremeter tests ..................... 92
3-5 Residual horizontal stress variation with time near grouted pile ......................... 93
3-6 Finite element discretization ............................................................................... 93
3-7 FE mesh after the simulation of Jetted and grouted pile installation ................... 94
3-8 Stress distribution with radial distance during tip grouting (spherical cavity expansion) .......................................................................................................... 94
3-9 Radial displacement determined from the numerical simulation of side and tip grouting of 0.203 m square pile .......................................................................... 95
3-10 Mohr’s circle at failure during axial loading ......................................................... 96
3-11 Estimate of grout vertical stress coefficient, Kg ................................................... 97
3-12 Comparison of load-displacement curves for 0.152 m square pile ..................... 98

12
3-13 Comparison of load-displacement curves for 0.203 m square pile ..................... 98
3-14 Comparison of load-displacement curves for 0.406 m square pile ..................... 99
3-15 Layout of test piles and drilled shaft along with reaction drilled shafts ................ 99
3-16 SPT blow count (N) profiles and the Unified Soil Classification (USC) at the location of test piles and drilled shaft ................................................................ 100
3-17 Typical grain size distributions for the silty sand at the site .............................. 101
3-18 Expansion pressure-volume curves from Pressuremeter tests......................... 101
3-19 Schematic diagram of jetted and grouted pile .................................................. 102
3-20 Grout delivery and jetting systems .................................................................... 103
3-21 Reinforcing cage with grout delivery and jetting systems (Photo courtesy of author, Sudheesh Thiyyakkandi) ...................................................................... 103
3-22 Concrete placement for one of the precast piles (Photo courtesy of author, Sudheesh Thiyyakkandi) .................................................................................. 104
3-23 Preparation of pile for jetting (Photos courtesy of author, Sudheesh Thiyyakkandi) ................................................................................................... 104
3-24 Pile jetting (Photo courtesy of author, Sudheesh Thiyyakkandi) ....................... 105
3-25 Schematic of precast concrete cap – pile connection ....................................... 105
3-26 Longitudinal and cross-section view of concrete cap with reinforcement details ............................................................................................................... 106
3-27 Placement and grouting of precast cap (Photos courtesy of author, James F Stephenson III) ................................................................................................. 107
3-28 Casting of cast-in place concrete cap (Photo courtesy of author, James F Stephenson III) ................................................................................................. 107
3-29 Side grouting of piles (Photo courtesy of author, Sudheesh Thiyyakkandi) ...... 108
3-30 Grout pressure-volume response during side grouting of pile 1 ....................... 108
3-31 Grout pressure-volume response during side grouting of pile 2 ....................... 109
3-32 Grout pressure-volume response during tip grouting ........................................ 109
3-33 Grout pressure vs. pile head displacement during tip grouting ......................... 110

13
3-34 Instrumentation for noise and vibration measurement (Photos courtesy of author, Sudheesh Thiyyakkandi) ...................................................................... 110
3-35 Location of construction equipments and vibration and noise monitors ............ 111
3-36 Noise measurement during pile jetting process ................................................ 112
3-37 Noise measurement during side grouting ......................................................... 112
3-38 Noise measurement during tip grouting ............................................................ 113
3-39 Peak particle velocity measurement during pile jetting ..................................... 113
3-40 Peak particle velocity measurement during grouting ........................................ 113
3-41 Axial top down test on jetted and grouted pile (Photo courtesy of author, Sudheesh Thiyyakkandi) .................................................................................. 114
3-42 Measured strain at different depths .................................................................. 115
3-43 Load-displacement response of the jetted and grouted pile ............................. 115
3-44 Load distribution along the pile ......................................................................... 116
3-45 Lowering of reinforcing cage and concrete placement for test drilled shaft (Photos courtesy of author, Sudheesh Thiyyakkandi) ...................................... 117
3-46 Load distribution along the drilled shaft ............................................................ 117
3-47 Load-displacement response of drilled shaft .................................................... 118
3-48 Comparison of axial response of jetted and grouted pile vs. drilled shaft ......... 118
3-49 Coordinate system used for representing forces and moments........................ 119
3-50 Mast arm assembly fabricated for combined torsion and lateral load test (Photo courtesy of author, Sudheesh Thiyyakkandi) ........................................ 119
3-51 Setting and bolting Mast arm assembly (Photos courtesy of author, Sudheesh Thiyyakkandi) .................................................................................. 120
3-52 Total Station for rotation and translation measurement (Photo courtesy of author, Sudheesh Thiyyakkandi) ...................................................................... 121
3-53 String pot arrangement (Photo courtesy of author, Sudheesh Thiyyakkandi) ... 122
3-54 Digital dial gage placement (Photo courtesy of author, Sudheesh Thiyyakkandi) ................................................................................................... 123

14
3-55 Application of lateral load on the arm by pulling with a crane (Photo courtesy of author, Sudheesh Thiyyakkandi) .................................................................. 124
3-56 Tension load cell for the load measurement (Photo courtesy of author, Sudheesh Thiyyakkandi) .................................................................................. 124
3-57 Torque vs. rotation response during combined torsion and lateral load test ..... 125
3-58 Lateral displacement components during the load test ..................................... 125
3-59 Lateral load vs. resultant lateral displacement during combined torsion and lateral load test ................................................................................................. 126
3-60 Torsional cracks and gaps after loading and unloading (Photos courtesy of author, Sudheesh Thiyyakkandi) ...................................................................... 127
4-1 Soil compaction using vibratory plate compactor (Photo courtesy of author, Sudheesh Thiyyakkandi) .................................................................................. 142
4-2 Earth pressure cells placement (Photo courtesy of author, Sudheesh Thiyyakkandi) ................................................................................................... 142
4-3 Reinforcing cages with grout delivery and jetting systems for group 1 piles(Photos courtesy of author, Sudheesh Thiyyakkandi) ............................... 143
4-4 Reinforcing cages with grout delivery and jetting systems for group 2 piles(Photos courtesy of author, Sudheesh Thiyyakkandi) ............................... 144
4-5 Attachment of semi-rigid membranes and typical rubber nozzle used (Photos courtesy of author, Sudheesh Thiyyakkandi) .................................................... 145
4-6 Pile during jetting (Photo courtesy of author, Sudheesh Thiyyakkandi) ............ 146
4-7 Side grouting of pile in group 2 (Photo courtesy of author, Sudheesh Thiyyakkandi) ................................................................................................... 146
4-8 Load test setup for jetted and grouted pile group (Photo courtesy of author, Sudheesh Thiyyakkandi) .................................................................................. 147
4-9 Digital levels and invar staffs used for pile displacement monitoring (Photos courtesy of author, Sudheesh Thiyyakkandi) .................................................... 147
4-10 Jetted and grouted pile groups after excavation (Photos courtesy of author, Sudheesh Thiyyakkandi) .................................................................................. 148
4-11 Views of a tip grout bulb (group 1) (Photos courtesy of author, Sudheesh Thiyyakkandi) ................................................................................................... 148
4-12 Load-displacement response of group 1 prior to tip grouting ............................ 149

15
4-13 Load-displacement response of group 1 after tip grouting ................................ 149
4-14 Load-displacement response of group 2 after tip grouting ................................ 150
4-15 Ground surface crack around group during axial loading (Photo courtesy of author, Sudheesh Thiyyakkandi) ...................................................................... 150
4-16 Soil deformation profile (group 1 load test) ....................................................... 151
4-17 Soil deformation profile (group 2 load test) ....................................................... 151
4-18 Typical variation of horizontal stress around pile during axial load test ............ 152
4-19 Vertical stress variation below the center of the group footprint vs. beneath pile during the top down load test before tip grouting ....................................... 152
4-20 Typical vertical stress variation below the center of the group footprint vs. beneath pile during the top down load test after tip grouting ............................ 153
4-21 Comparison of group response before and after tip grouting of group 1 .......... 153
4-22 Predicted and measured load –displacement response of group 1 .................. 154
4-23 Predicted and measured load –displacement response of group 2 .................. 154
5-1 PVC casing positioned before filling the test chamber (Photo courtesy of author, Sudheesh Thiyyakkandi) ...................................................................... 167
5-2 Test chamber in fully filled state (Photo courtesy of author, Sudheesh Thiyyakkandi) ................................................................................................... 167
5-3 Reinforcing cage and grout distribution system (Photos courtesy of author, Sudheesh Thiyyakkandi) .................................................................................. 168
5-4 Pulling the casing out (Photos courtesy of author, Sudheesh Thiyyakkandi) ... 169
5-5 Group load test setup (Photo courtesy of author, Sudheesh Thiyyakkandi) ..... 169
5-6 Tip grouting (Photo courtesy of author, Sudheesh Thiyyakkandi) .................... 170
5-7 Setup for individual shaft loading (Photo courtesy of author, Sudheesh Thiyyakkandi) ................................................................................................... 170
5-8 Excavated group 1 shafts (Photos courtesy of author, Sudheesh Thiyyakkandi) ................................................................................................... 171
5-9 Excavated group 2 shafts (Photo courtesy of author, Sudheesh Thiyyakkandi) ................................................................................................... 172

16
5-10 Load-displacement response of group 1 shafts ................................................ 172
5-11 Load-displacement response of group 2 shafts ................................................ 173
5-12 Load -displacement response of group 1 shafts during the group and individual load tests. ......................................................................................... 173
5-13 Load -displacement response of group 2 shafts during the group and individual load tests .......................................................................................... 174
5-14 Displacements of all the shafts in group 1 during south shaft loading .............. 174
5-15 Displacements of all the shafts in group 2 during the individual shaft loading .. 175
5-16 Vertical stress measurement beneath group footprint during the group load tests .................................................................................................................. 176
5-17 Vertical stress measurement beneath group footprint during the individual shaft loading ..................................................................................................... 177
5-18 Variation of residual horizontal stress after different stages measured using earth pressure cells at 15 cm (0.5 ft) away from shafts .................................... 178
6-1 Typical Finite element discretization ................................................................. 199
6-2 Vertical stress at 0.305 m (1 ft) below the shaft tip versus shaft’s top displacement during axial load test (Group1 East shaft) .................................. 200
6-3 Unit tip resistance versus tip displacement for un-grouted and grouted shafts from FEM .......................................................................................................... 200
6-4 Mechanism of load transfer during axial loading of base grouted shaft ............ 201
6-5 Values of α recommended by various investigators and from load tests .......... 202
6-6 Predicted and measured response for Georgia Tech load test ........................ 202
6-7 Conceptual normalized tip resistance-displacement plot .................................. 203
6-8 Comparison of unit tip resistance-displacement response (2.44 m long shaft) . 203
6-9 Comparison of unit tip resistance-displacement response (3.96 m long shaft) . 204
6-10 Determination of mobilized tip stress, ps from log-log plot of tip stress (embedment strain gage) vs displacement (shaft: S1-FJ1) .............................. 204
6-11 Area ratio (Ar) versus NGP/√NGV .................................................................... 205
6-12 Predicted and measured tip load-displacement response (Clearwater, FL) ..... 205

17
6-13 Predicted and measured tip load-displacement response (Houston) ............... 206
6-14 Predicted and measured response (Audubon Bridge project, Louisiana) ......... 206
7-1 Group behavior of jetted and grouted piles and post grouted drilled shafts ...... 214

18
Abstract of Dissertation Presented to the Graduate School of the University of Florida in Partial Fulfillment of the Requirements for the Degree of Doctor of Philosophy
STUDY OF GROUTED DEEP FOUNDATIONS IN COHESIONLESS SOILS
By
Sudheesh Thiyyakkandi
May 2013
Chair: Michael. C. McVay Major: Civil Engineering
Grouting of deep foundation subsequent to installation has become popular due
to its effectiveness in improving axial capacity under serviceable displacement. Post tip
grouting of drilled shafts has been successfully employed worldwide to mobilize a
significant portion of tip resistance under small displacements. Recently, Florida
Department of Transportation developed a new jetted and grouted precast pile system
and the construction of the pile utilizes the advantages of several proven deep
foundation installation techniques.
This research focused on the individual and group behavior of jetted and grouted
piles and tip grouted drilled shafts in cohesionless soils. Experimental study and
numerical modeling of both types of foundations were performed to investigate the
response in individual and group scenario. Based on the study, a methodology for jetted
and grouted piles that predicts expected grout pressures during grouting, unit side and
tip resistance and the load-displacement response of the pile is proposed. In case of
post grouted drilled shafts, the study found that the increased axial capacity under
serviceable displacements depended mainly on preloading effects and the increased tip
area provided by the grouting process. A simple prediction approach for estimating the

19
tip capacity of grouted shafts utilizing cone penetration resistance was suggested based
on the results of the study. The validity of the proposed approach was verified by the
analysis of full-scale case studies of grouted shafts reported in the literature.
The experimental group study at 3 x pile/shaft diameter (D) center-to-center
spacing revealed that the jetted and grouted piles behaved as a block during axial
loading, whereas the post grouted drilled shafts acted independently of one another,
i.e., negligible group interaction. It was also identified that the side grouting of a
foundation prior to tip grouting has a substantial influence on improving the axial
capacity. The side grouting was found to significantly increase the grout pressure
developed during tip grouting and helps in the formation of tip grout bulb by spherical
cavity expansion process and thus improves the unit tip resistance of the foundation.

20
CHAPTER 1 INTRODUCTION
1.1 Problem Statement
Deep foundations are widely used to support buildings, bridges, signage and
other structures for the transfer of superstructure loads to soil under acceptable vertical
and lateral displacements. In the past, foundations of choice were driven concrete piles
due to their high mobilized skin and tip resistance (Meyerhof 1976; O’Neill 1994).
However, noise and vibration from dynamic pile driving is a critical issue in urban
environments (Selby 1991; Woods 1997; White et al. 2002; Svinkin 2006). Other
alternatives are the use of drilled shafts and continuous flight auger (CFA) piles due to
their minimally intrusive nature (Neely 1991; O’Neill and Reese 1999, Brown et al.
2007). Unfortunately, a significant portion of a drilled shaft’s tip resistance is unusable
due to the vertical displacement required for mobilization. Displacements of about 10-
15% of shaft diameter are required to fully mobilize the end bearing, whereas skin
resistance fully develops at a displacement of about 0.5 - 1% of shaft diameter (Bruce
1986; Mullins and Dapp 2006). Current service design (e.g., AASHTO 2010) limits the
vertical displacements of bridge substructure components to less than 50 mm, which
significantly limits the mobilized tip resistance.
To regain some of the unused tip capacity, post grouting the drilled shaft tip has
been successfully employed worldwide over the last five decades. The post-grouting
has been used in Asia and Europe to improve pile capacity since the early 1960s
(Bolognesi and Moretto 1973; Gouvenot and Gabix 1975; Stocker 1983). The post
grouting process consists of the following: (1) casting a drilled shaft with a grout delivery
system integrated to the rebar cage; and (2) injecting high pressure colloidal grout

21
beneath shaft base after sufficient shaft curing, which preloads the in-situ soil, and fills
in all voids and anomalies in the vicinity of the shaft tip. Additionally, tip grouting
provides a proof test for every shaft, resulting in higher LRFD (Load Resistance Factor
Design) resistance factors, ϕ (Mullins et al. 2006). Several case studies (Mullins et al.
2001, 2004 and 2006; Ruiz et al. 2005; Duan and Kulhawy 2009; Youn and Tonon
2010; Dapp and Brown 2010, Dai et al. 2010) have been performed over the last
decade to identify the effectiveness of tip grouting, the factors influencing the
improvement of axial capacity, and the fundamental mechanisms involved. A number of
design methodologies have been proposed for post grouted drilled shafts. For example,
Mullins et al. (2006) has presented a design methodology based on Federal Highway
Administration’s (FHWA) estimate of skin friction and end bearing of an un-grouted shaft
using Standard Penetration test (SPT) blow count (N) to estimate tip grout pressures
and subsequent mobilization of tip resistance. Ruiz (2005) has proposed a design
approach called Axial Capacity Multiplier (ACM) based on nine case histories, that uses
CPT tip resistance, qc. The method considers three factors: (1) soil compression under
pile tip, (2) enlarged tip area with grout tip bulb formation, and (3) side shear reversal,
as the major contributors to the improved capacity of tip grouted shafts. However,
neither approach identifies the influence of tip grouting on the ultimate end bearing of a
post grouted drilled shaft.
Although pressurized tip grouting improves the tip resistance of drilled shafts
under serviceable displacement, still remaining was the issue of construction quality
control (i.e., the structural integrity of the shaft) and the fact that they have lower skin
friction than driven piles inherent in the installation process (Jalinoos et al. 2005, Kog

22
2009, Meyerhof 1976). Recently, Florida Department of Transportation (FDOT)
developed a new jetted and grouted precast pile system (with side membranes) in
cohesionless soils and the construction of the new pile combines the advantages of
several proven deep foundation installation techniques (McVay et al. 2009: FDOT report
BD545-31): (1) use pre-cast reinforced concrete pile to eliminate the unknown quality of
the cast in-situ drilled shaft/CFA pile; (2) jetting the precast pile which is expected to
minimize the construction noise and vibration (Tsinker 1988); and (3) grouting the side
and tip to maximize skin and tip resistance. The new pile which is jetted and
subsequently grouted is referred to as “jetted and grouted precast pile” (Thiyyakkandi et
al. 2012). An appropriate design methodology to predict expected grout pressures
during grouting, unit side and tip resistance, and load-displacement response need to
be developed for the new pile. In addition, the constructability and applicability of the
pile under typical field conditions has to be validated by performing full-scale field
installation and testing. FDOT-UF research project (BD545-31) found from the full scale
torsion testing of the new pile in a larger test chamber that the pile has large torsional
capacity and suggested that the pile may be used as the foundation for Mast arm
structures (i.e., the structures supporting highway signs and traffic signals). However,
the response of the new pile needs to be verified in typical field condition by performing
the full-scale testing.
In case of the group placement of piles or shafts, the spacing of piles/shafts
within a group is generally a tradeoff; at possible minimum spacing, which reduces the
high cost of the reinforced concrete caps as well as the group interference. When the
piles or shafts are too close, the axial capacity of the group is significantly reduced, i.e.,

23
the axial group resistance may be significantly less than the sum of the individual pile
(or shaft) resistance (group efficiency factor < 1). A group efficiency factor of one (1.0)
identifies that the stresses transferred to soil from each individual pile does not overlap
with adjacent piles. Past research has shown that a center-to-center (c/c) spacing of
three times the pile or shaft diameter (3D) will result in a group efficiency factor of one
(1) for both the driven pile and drilled shaft groups. However, the behavior of post-
grouted drilled shafts and jetted and grouted precast piles in group placements are
currently unknown.
This dissertation focuses on the individual and group behavior of the
aforementioned grouted deep foundations: (1) jetted and grouted precast piles, and (2)
post grouted drilled shafts, in cohesionless soils.
1.2 Hypothesis
Individual and group response (both skin and tip) of the piles or drilled shafts
subjected to side and tip grouting will be significantly different from that of piles/shafts
undergone tip grouting only, because of the difference in the mechanism of grout bulb
formation (e.g., cavity expansion process).
1.3 Objectives
Specific objectives of this research include the following:
Develop a design methodology to predict anticipated grout pressures during grouting, unit side and tip resistance, and load-displacement response of the jetted and grouted precast piles in cohesionless soils.
Validate the constructability of the jetted and grouted precast piles in typical Florida sand.
Compare the axial, and the combined torsional and lateral response of the jetted and grouted precast piles with that of similar sized drilled shaft.

24
Investigate the group interaction of the jetted and grouted precast piles at typical 3D spacing in cohesionless soils.
Investigate the group behavior of post grouted drilled shafts at typical 3D spacing in cohesionless soils
Study the grout flow pattern and associated bulb formation during the tip grouting of drilled shafts, and the load transfer mechanism at shaft tip during the subsequent axial loading.
Develop a prediction approach for the tip resistance of base grouted drilled shafts utilizing the cone penetration resistance (CPT, qc).
Comparison of the responses of side and tip grouted foundations versus tip only grouted foundations.
1.4 Scope
1.4.1 Analysis of the Previous Experimental Data on Jetted and Grouted Piles
A detailed analysis of the previous experimental results on jetted and grouted
precast piles reported by McVay et al. (2009) was performed. Specifically the soil stress
change (both horizontal and vertical stress) in the vicinity of the piles during the
installation (i.e., jetting and grouting), and static top down test were investigated. In
addition, the variation of horizontal stress around the piles with the passage of time
subsequent to the installation was also analyzed.
1.4.2 Numerical Modeling of Jetted and Grouted Piles
Numerical modeling of the experimental jetted and grouted piles (McVay et al.
2009) were carried out to investigate the soil stresses around the piles using the two-
dimensional finite element package, PLAXIS-2D, developed by PLAXIS b. v., Delft,
Netherlands. The results obtained from the numerical analysis were compared with the
experimental results. The findings from the finite element analysis were also used for
developing a design methodology for the pile.

25
1.4.3 Develop a Design Methodology for Jetted and Grouted Piles
Based on the experimental and numerical analyses, a design methodology for
the jetted and grouted piles was proposed. Specifically, the approaches to predict the
expected grout pressures during grouting, unit skin friction and the load-displacement
response of the pile in cohesionless soil were suggested. The predicted responses of
the pile using the proposed methodology were compared with experimental and
numerical responses and were found to match quite well.
1.4.4 Full-Scale Field Installation and Testing of Single Jetted and Grouted Piles
Installation and testing of two 0.71m square x 5.5 m long (28-in square x18ft
long) jetted and grouted piles were performed at FDOT’s test site, Keystone Heights,
FL, in connection with FDOT-UF ongoing research project (BDK-75-977-41). A detailed
soil exploration was performed at the test site, which included Standard Penetration
Tests (SPT), Cone Penetration Tests (CPT), Pressuremeter Tests (PMT), and
Dilatometer Tests (DMT). The soil at the test site was predominantly silty sand (SM).
The installation of the piles validated the constructability of the Jetted and grouted pile in
typical Florida field condition. Noise and ground surface vibration monitoring was also
carried out during the jetting and grouting of the piles, and it was found that the pile is
well suited for urban areas, where the construction noise and vibration are critical
concerns. Static top down test and combined torsion and lateral load test were
performed on the piles. The axial response of the pile was compared with that of similar
sized drilled shafts installed at the same test site. The combined torsion and lateral load
test on the pile was performed by attaching a full-scale Mast arm assembly to the top of
pile and subsequently applying lateral load in increments at a standoff distance

26
(eccentricity) of 10.67 m (35 ft) from the axis of pile. Rotation and translation of the pile
were measured during the test.
1.4.5 Small-Scale Testing of Jetted and Grouted Pile Groups
Small-scale testing of two jetted and grouted pile groups was conducted to study
the soil-structure interaction between the piles within the group. These tests were
performed as a part of the experimental study involved in FDOT-UF research project:
BDK-75-977-07. The study was limited to four piles in each group with the typical 3D
center-to-center spacing (i.e., three times the precast pile width/diameter) between the
piles. The tests were performed in the FDOT’s rigid wall test chamber installed in the
Coastal Engineering Lab, University of Florida. The displacement of individual piles, the
deformation of soil, and the soil stresses within and outside the groups were monitored
during the group tests. The measured results were used to identify the behavior of
groups under top down loading. An approach to predict the axial group response of the
piles (@3D spacing) was also suggested and a reasonable agreement was found
between the measured and predicted responses.
1.4.6 Small-Scale Testing of Post Grouted Drilled Shaft Groups
Two small-scale group tests of grout-tipped drilled shafts were conducted in the
test chamber to investigate the group behavior under axial loading. The study was
limited to the groups with four shafts at 3D center-center spacing. The diameter of the
shafts in both groups was same (0.216 m), but different embedment depths; 2.44 m for
group 1 (i.e., Length/Diameter ~11) and 3.96 m for group 2 (i.e., L/D ~18). Note that the
smaller diameter shafts were selected to minimize the chamber boundary effects. The
goal of the first group test was to study the factors influencing the axial capacity of post
grouted drilled shaft, the grout flow pattern, and the group behavior at typical 3D

27
spacing. Whereas the objective of the second test was to validate the results of the first
group tests for greater embedment depths and investigate the feasibility of staged
grouting to improve the axial capacity of grout-tipped shafts. The groups testing as well
as individual shaft tests were performed to estimate group interaction. Measured axial
top down testing data included soil deformation in the vicinity of shaft, load-
displacement response of individual shafts, vertical and horizontal soil stresses
alongside and beneath individual shafts and the group. These measured data were then
used to estimate the interaction between the shafts within each group during the axial
loading.
1.4.7 Numerical Modeling of Post Grouted Drilled Shafts
To investigate the load transfer mechanism at the shaft tip, finite element
analysis of post grouted drilled shafts was conducted using PLAXIS 2D. The drilled
shaft and soil within the test chamber was simulated by an axisymmetric model. The
construction of shaft, tip grouting, and top down load test was modeled. Un-grouted
drilled shafts were also modeled for comparing the mobilized tip resistance during top
down load test. The load transfer mechanism captured from the numerical analysis was
later used for developing a prediction methodology for the tip resistance of post grouted
drilled shafts.
1.4.8 Develop Axial Prediction Approach for Post Grouted Drilled Shafts
A prediction method for the tip capacity of post grouted drilled shaft utilizing the
cone penetration resistance was developed based on the experimental and numerical
analyses. Specifically, an approach to predict the unit tip resistance-displacement
response and an equation to compute the final tip area of grouted shaft were
suggested. The expression to estimate the final tip area was obtained from the

28
regression analysis of full scale field test data with known CPT values. The suggested
prediction method was validated by applying to some of the full scale field tests
available in literature.
1.4.9 Comparison of Side and Tip Grouted Versus Tip Only Grouted Foundations
The response of side and tip grouted deep foundation was compared with tip
only grouted foundations in both individual and group placements based on the results
of experimental and numerical studies. The influence of side grouting of a pile /shaft
prior to tip grouting on the soil stress state around pile/shaft, maximum tip grout
pressures, and tip grout bulb formation was analyzed. The difference in the interaction
of piles/shafts at typical 3D spacing was also discussed.
1.5 Overview of Dissertation
An overview of the following chapters follows.
Chapter 2 is a literature review, and provides an overview of pile jetting, pile
grouting, past research into post grouted drilled shafts, jetted and grouted piles, cavity
expansion theory, and soil-pile interaction.
Chapter 3 presents the individual response of jetted and grouted piles in
cohesionless soils. An analysis of soils stress measurements near the piles from the
previous experimental study, numerical modeling of jetted and grouted piles, and a
design methodology for the piles are described in details.
Chapter 4 describes the group behavior of jetted and grouted piles at typical 3D
spacing based on the group tests. Soil preparation, construction of precast piles,
installation of the piles (i.e., jetting and grouting), group load tests, analysis of the test
results, and identified group interaction are discussed comprehensively.

29
Chapter 5 presents the group testing of post grouted drilled shafts at 3D spacing
and the axial group efficiency of the shafts based on the measured soil stress, pile and
soil deformation during the group and individual loading of the shafts. The group
response of post grouted drilled shafts was also compared with that of jetted and
grouted pile groups described in Chapter 4.
Chapter 6 demonstrates the numerical modeling of individual post grouted drilled
shafts and the axial prediction approach for the grouted shafts developed based on the
experimental and numerical study.
Chapter 7 presents a comparison of the effectiveness of side and tip grouting
versus tip only grouting on improving the capacity of deep foundations in cohesionless
soils.

30
CHAPTER 2 LITERATURE REVIEW
This Chapter reviews past studies on pile jetting, post grouted drilled shafts, and
jetted and grouted piles. It also reviews past research on cavity expansion theory and its
geotechnical applications, and soil-structure interaction of deep foundations.
2.1 Pile Jetting
Jetting of piles utilizing pressurized water has been widely used to aid pile
penetration into dense to very dense sand layers to expedite pile driving and minimize
vibration (Tsinker 1988, Gunaratne et al. 1999, Gabr et al. 2004). Jetting can assist the
pile installation in several ways: (1) the jetting pressure may loosen (erode) the soil at
the tip of the pile; (2) jetting may increase local pore water pressure and hence
decrease effective stress, which eases pile penetration; (3) the upward flow of the
jetting fluid lubricates the pile and assists its downward movement (Tsinker 1988). In
1959, Shestopal developed the following flow rate equation to estimate the water
requirements for jetting into sandy soil:
(2-1)
where,
Q = flow rate (m3/hr)
D = pile diameter or width (m)
d50 = average size of sand particles (mm)
l = desired submerged length of pile (m)
C = 0.1 for dry sand and 0.017 for saturated sand stratum
k = (Σ knln) / l = average permeability coefficient (m/ day)

31
Tsinker (1988) has identified three zones in the jet hole structure during pile
jetting in sand stratum, as shown in Figure 2-1: (1) sand-water mixture immediately
beneath the pile tip (zone 1), (2) excess water pumped into zone 1 escapes to the
surface alongside the pile (zone 2), and (3) sand-water mixture around zone 2 at high
pore pressures (zone 3). This excess pore pressure dissipates immediately after jetting
in sand. Gunaratne et al. (1999) found that the lateral load capacity of a jetted pile is
significantly less than that of driven pile due to the soil disturbance resulting from the
jetting process. Gabr et al. (2004) has identified that pile insertion rate increases with
increase in flow velocity for a given flow rate. Recently, Giken Seisakusho Ltd. has
developed pushed/jetted pile installation equipment (‘silent piler’) for steel sheet and
pipe piles (White et al. 2002). In soft soils, the pile is pushed, whereas in dense, stiff or
hard soils, a disposable jet tip is attached to assist in the pile installation by jetting.
2.2 Post Grouted Drilled Shafts
The first known published test results using shaft grouting were Gouvenot and
Gabix (1975). Their results indicated an increase in shaft friction of about 250% over un-
grouted bored piles. Bruce (1986) has presented a review of published work on pile
construction and the benefit of post grouting between 1975 and 1985. More recently, tip
and shaft grouting were used for piles and drilled shafts in sands (Plumbridge and Hill
2001). A number of different apparatus for side grouting (e.g., Joer et al. 1998, McVay
et al. 2009) and tip grouting (Mullins et al. 2001) have been developed. Typical grout
mixes used for grouting drilled shaft tips are cement, sand, and water. Micro-fine
materials (e.g., fly ash, bentonite, etc.) are also used to partially replace cement and
improve pumpability.

32
As mentioned earlier, post grouting drilled shaft tips has become popular
worldwide due to its effectiveness in mobilizing a large portion of available tip resistance
under service displacements. The grouting of a shaft base by injecting a high pressure
grout fills in any anomalies present beneath the shaft tip and pre-stresses the
underlying soil (Figure 2-2). Three types of grout distribution systems are commonly
used in practice to deliver the grout at tip: (1) stem type, (2) sleeve port type, and (3) flat
jack type (Mullins et al. 2001). The stem type is the simplest form of grout distribution
system and consists of a pipe end at the shaft tip. This is not an efficient grout
distribution system, and hence, only utilized in the remediation of substandard shafts
with inadequate capacity (Mullins et al. 2001). The sleeve port type, also known as a
tube-a-Manchette, primarily consists of a pipe network at shaft tip with pre-drilled holes
and the pipe network is connected to grout tubes at the top of the shaft (Figure 2-3).
The grout system has both grout entry and exit pipes, which allows the flushing of the
grout system and makes the re-grouting of the shaft possible if necessary. The pipe
network at the shaft tip is wrapped with a rubber membrane at the location of the holes
to prevent blockage at the hole during the casting of the shaft and allows the grout to
flow out during the grouting stage. This also prevents the return of pumped grout to the
pipe network. Flat jack type consists of stem type pipes ends at the shaft tip within a
plate and membrane system (Figure 2-3). This plate and membrane system confines
the grout mass and prevents mixing with the surrounding soil (Mullins et al. 2001). The
drawback of the flat jack type apparatus is that the grout lines cannot be flushed
properly when re-grouting is necessary, unlike the sleeve-port type grout distribution
system.

33
The effectiveness of tip grouting on improving the axial capacity of drilled shafts
was investigated by several researchers (Mullins et al. 2006; Ruiz 2005; Duan and
Kulhawy 2009; Youn and Tonon 2010; Dapp and Brown 2010; Dai et al. 2010) over the
last decade. Mullins et al. (2006) have proposed a prediction approach for the unit tip
resistance of post grouted drilled shaft based on the regression analysis of a number of
full scale field tests. Following are the steps involved in the prediction approach
suggested by Mullins et al. (2006):
Estimate the unit end bearing (qb) at a displacement of 5% of diameter of drilled shaft using Reese and O’Neill (1988) method (qb=0.057N in MPa; N=uncorrected SPT blow count).
Estimate the ultimate side resistance (Fs) of the shaft.
Determine the maximum expected grout pressure (GPmax) by dividing the ultimate side resistance (Fs) with shaft’s the cross-sectional area (A).
Convert the maximum expected grout pressure (GPmax) to a dimensionless quantity, called Grout Pressure Index (GPI) by dividing with the ultimate unit end bearing (qb).
Determine the Tip Capacity Multiplier (TCM) using Equation 2-2.
(2-2)
where,
%D = displacement expressed as the ratio of shaft diameter.
Estimate the grouted unit end bearing as the product of TCM and the ultimate un-grouted unit end bearing (qgrouted =TCM. qb).
Ruiz (2005) has developed design charts for the total capacity of post grouted
drilled shafts based on the eight reported case studies. The method, called Axial
Capacity Multiplier (ACM), uses the maximum anticipated grout pressure, and the
Davisson failure load for equivalent un-grouted shaft as the input parameters to predict

34
the axial capacity of a Post grouted drilled shaft for a given pile head displacement.
Youn and Tonon (2010) reported that the Axial Capacity Multiplier (ACM) approach
significantly over-predicted the total resistance of grouted drilled shaft in a case study at
the Brazo River Bridge, TX.
2.3 Jetted and Grouted Precast Piles
The construction of jetted and grouted precast piles is comprised of four distinct
phases: (1) construction of precast pile with jetting and grout distribution systems, (2)
pressurized water jetting of the pile into ground, (3) side grouting of the pile, and (4) tip
grouting (McVay et al. 2009; Thiyyakkandi et al. 2012). Figure 2-4 shows the schematic
of the jetted and grouted pile with grout delivery and jetting systems. The pile consists of
separate grout delivery pipes for side and tip grouting. The side grout system is
separated into a top and bottom grouting zones with their own pipe network, Figure 2-4.
Each of the side grout pipes has an entry and an exit outlet to allow staged/repeated
grouting (Figure 2-5). To allow repeated grouting, the bottom half of each grout pipe has
a series of holes drilled into them with Gum rubber covering membranes, Figure 2-5. A
center jetting pipe is used to provide pressurized water at tip for pile jetting. In the case
of large size (width) piles, the jet pipe branches off to four or five pipes at bottom for the
uniform distribution of water at tip. The nozzle at the end of the jet pipe (Figure 2-4 and
2-6) not only increases the water velocity, but also minimizes the water consumption
during jetting. The nozzle also prevents sand or fines from ingression into the jet pipe
after jetting, which can result in grout blockage as the jetting pipe and nozzle are later
used for the tip grouting.
In order to eliminate “sand locking” in the grout pipes during pumping, a grout mix
consisting of cement, micro-fine fly ash and water was used (McVay et al. 2009;

35
Thiyyakkandi et al. 2012). To prevent grout flowing along the weakest path during side
grouting, membranes were attached to the pile, (Figure 2-4 and 2-6). These membranes
confine the grout zones and improve radial expansion during grouting, resulting in major
principal stresses in the horizontal/radial direction near the pile. The membranes also
prevent the mixing of grout with the soil which improves bonding between the grout and
the pile (McVay et al. 2009; Thiyyakkandi et al. 2012). Previous study shows that the
piles possess very high axial and torsional resistances (McVay et al. 2009; Lai et al.
2010). Thiyyakkandi et al. (2012) have reported that the unit skin friction of a Jetted and
grouted pile is about 5 times that of similar sized drilled shafts. Figure 2-7 displays the
0.406 m square x 6.1 m long jetted and grouted pile after excavation (McVay et al.
2009; Lai et al. 2010). Excavation of all the test piles revealed that the side grout bulb
had surrounded the entire perimeter of the piles at each grout zone and was well
bonded to the piles (McVay et al. 2009; Thiyyakkandi et al. 2012).
2.4 Cavity Expansion Theory
Cavity expansion analysis offers useful solutions to a variety of problems in
geotechnical engineering, including in-situ testing such as pressuremeter and cone
penetration testing, pile driving, pile loading to failure, tunnel deformation, and finally,
the process of grouting a pile in-situ. Initially, cavity expansion theory focused on solving
metal indentation problems (Bishop et al. 1945; Hill 1950). The cavity expansion theory
was first applied in the geotechnical engineering field by Gibson and Anderson (1961)
for the interpretation of pressuremeter tests. The theory has been progressively refined
and applied to various geotechnical problems in the last four decades (Palmer 1972;
Vesic 1972; Hughes et al. 1977; Carter et al. 1986; Yu and Houlsby 1991; Salgado and
Randolph 2001; Salgado and Prezzi 2007). Yu (2000) has presented fundamental

36
solutions for the cavity expansion problems, major developments, and applications in
the field of geotechnical engineering.
Cavity expansion processes are of two basic types: (1) expansion from a finite
radius, and (2)expansion from zero initial radius; i.e., cavity creation problem (Salgado
et al. 1997). In the first case, an ever-increasing pressure is required for continuing the
expansion. The cavity wall pressure approaches the limit pressure (i.e., steady
expansion pressure) only when the cavity radius approaches infinity (Salgado et al.
1997). However in the second case, the cavity radius is initially zero and hence
expansion to a finite radius (i.e., cavity creation) would be sufficient to develop the limit
pressure and further expansion occurs under constant cavity pressure. This is due to
the fact that the expansion from a zero radius to a finite cavity radius is equivalent to the
expansion of an initially existing cavity to an infinite radius (Salgado et al. 1997). Based
on the strain levels, the surrounding region of an expanding cavity can be characterized
by three distinct zones: (1) Plastic zone, (2) nonlinear elastic zone, and (3) linear elastic
zone, as depicted in Figure 2-8 (Salgado et al. 1997). In the plastic zone, the material
has already failed due to the large stress state. In the nonlinear elastic zone, the
material has yielded, but not failed because the stresses are not enough to cause the
failure; and in the linear elastic zone, the stress-strain response is within the elastic limit.
In the case of jetted and grouted piles, side grouting resembles the expansion of
a cylindrical cavity from a finite radius and tip grouting resembles the expansion of a
spherical cavity. Hence, the cavity expansion solutions may be utilized in developing the
design methodology for the pile. In this research, the elastic perfectly plastic closed form
solutions of Yu and Houlsby (1991) and the limit pressure charts for cylindrical and

37
spherical cavities given by Salgado and Randolph (2001) were used. Yu and Houlsby’s
closed form solution are based on an elastic perfectly plastic soil with Mohr-Coulomb
failure criterion and a constant rate of dilatation (ψ). Yu and Houlsby (1991) have
presented a straightforward procedure for constructing the pressure expansion curves
and calculating limit pressures for expanding cylindrical and spherical cavities. Salgado
and Randolph (2001) presented a numerical method for solution of cavity expansion
problems taking into account stress-equilibrium and strength and flow assumptions,
which resulted in charts for cylindrical/spherical cavity expansion limit pressures (plim) as
a function of soil strength (c = critical state friction angle), relative density (Dr), and
depth or initial lateral/mean in-situ stress for sands.
2.5 Soil-Pile Interaction
Most deep foundations consist of a group of piles or drilled shafts. The piles or
shafts are placed at the minimum possible spacing to reduce the cost of the concrete
pile/shaft cap. Failure of the group may occur either by failure of the individual piles or
failure as an overall block. The load capacity of a group of vertically loaded piles/shafts
can, in many cases, be considerably less than the sum of the capacities of the individual
piles/drilled shafts comprising the group as there will be shear transfer occurring
through the soil from one pile/shaft to other. Generally, a group efficiency factor of one
(1) means that the shear stress transfer from one pile/shaft is not overlapped with that
of an adjacent pile/shaft. Past research has shown that a group efficiency factor of one
(1) is achieved at a minimum center-to-center spacing of three times the diameter of the
pile/shaft.

38
The pile/shaft-soil interaction may be characterized as in Figure 2-9. If one
considers the case of ultimate pile/shaft capacity, maximum side shear stress (τo) is
mobilized along the surface of the pile. For any vertical slice (Figure 2-9), the shear
stress (τ1, τ2) must always diminish with radius r, and is negligible at a radial distance rm
(radius of influence). Hence, it is evident that any pile placed within the distance rm of an
adjoining pile, undergoes shear transfer and settlement from the loaded adjoining pile,
without any load being applied to the pile.
In the case of a side grouted pile, pressure grouting increases both horizontal
stress (σh) and shear strength of the soil around the pile. Besides increasing the soil’s
shear strength, the shear modulus (G) also increases. Consequently, for any applied
load, the soil shear strain γ (∆z/∆r) must be smaller. Hence, in the case of ultimate
capacity, much larger side shear stresses are expected alongside the grouted pile/shaft
perimeter. At the radial distance rm, the shear stress is much greater for grouted piles
compared to conventional cast in-situ piles/shafts. But shearing strain γ is smaller due
to high shear modulus for any radial distance, r compared to a non-grouted cast in-situ
pile/shaft. This suggests that a group of grouted piles/shaft could have greatly reduced
efficiency factors for typical spacing, e.g., 3D. A low shear strain is expected within the
footprint of the group due to the increased confining stress and shear modulus, and
much higher shear strain is expected outside the footprint where shear modulus is
greatly diminished. Consequently, the grouted pile group may fail through block failure.
Hence group efficiencies of the jetted and grouted pile groups are expected to be less
than one at typical spacing of 3D. But for a tip grouted shaft (no side grouting) group, a

39
combined conventional single shaft summation for side shear is expected, however, the
tip resistance may exhibit a group footprint.

40
Figure 2-1. Three zones during pile jetting
Figure 2-2. Pressurized tip grouting of drilled shafts
Pumped grout
Pre-stress the soil
Negative skin friction mobilization
Zone 1
Zone 3
Zone 2

41
Figure 2-3. Grout distribution systems: Sleeve port and Flat jack types
Sleeve port type
Flat jack type (Source: FDOT Report BC165-v1)

42
Figure 2-4. Schematic of Jetted and grouted pile with grout delivery and jetting systems
Side grout system
Jet/tip grout pipe
Jet Nozzle
Membrane
Precast pile
Grout orifice (Gum rubber membrane)

43
(Source: FDOT Report BD545) Figure 2-5. Grout delivery systems for the top and bottom zones of pile
44
(Source: FDOT Report BD545) Figure 2-6. Jet nozzles and side grout membranes attached to piles
45
(Source: FDOT Report BD545) Figure 2-7. Excavated 0.406 m square x 6.1 m long jetted and grouted pile
Figure 2-8. Three zones around an expanding cavity
3.25
Linear elastic zone
Nonlinear elastic zone
Plastic zone
Cavity

46
Figure 2-9. Soil-pile interaction
Soil
Z
rm
∆z
∆r
σh
Pile/shaft
τ0
r
τ1 τ2

47
CHAPTER 3 INDIVIDUAL RESPONSE OF JETTED AND GROUTED PILES
This Chapter presents the analysis of previous experimental data on jetted and
grouted piles, numerical modeling of grouting and axial load testing of the piles, and the
proposed design methodology based on the findings of experimental and numerical
analysis. A discussion of each follows.1
3.1 Analysis of the Previous Experimental Data on Jetted and Grouted Piles
Detailed analysis of the results from the previous testing of Jetted and grouted
piles (McVay et al. 2009) was performed. The test data of the following three piles were
considered in the analysis: 1) 0.153 m (6 in) square x 2.44 m (8 ft) long, 2) 0.203 m (8
in) square x 2.44 m (8 ft) long, 3) 0.406 m (16 in) square x 6.1 m long piles. The final
diameter of the side grout bulbs was 0.38 m (15 in) for the 0.153 m pile, 0.51 m (20 in)
for the 0.203 m pile, and 0.914 m for the 0.406 m pile.
3.1.1 Test Chamber and Instrumentation
The Florida Department of Transportation’s (FDOT) rigid wall test chamber (3.66
m diameter x 10.67 m deep) located at the University of Florida’s Coastal Engineering
Lab was used for the study (Figure 3-1). The benefits of a rigid wall chamber include: 1)
control of the water table during pile/shaft construction and testing, 2) replication of soil
conditions for repetitive testing, 3) the use of instrumentation (vertical and horizontal
stress gages) in close vicinity to the piles/shafts, and 4) the opportunity for soil
excavation to expose grout zones.
1 Major contents of Section 3.1, 3.2, and 3.3 are from the article: Thiyyakkandi, S.,
McVay, M., Bloomquist, D., Lai, P. (2012). “Measured and predicted response of a new jetted and grouted precast pile with membranes in cohesionless soils,” Journal of Geotechnical and Geoenvironmental Engineering, ASCE. doi:10.1061/(ASCE)GT.1943-5606.0000860. With permission from ASCE.

48
For water level control, two 10-cm diameter slotted PVC pipes wrapped in filter
fabric were located along the chamber wall to add or remove water from the chamber.
Two 1.22-m (4 ft) diameter and 13.72-m (45 ft) long drilled shafts aligned with the
centerline of the test chamber were used to provide reactions during the axial top down
testing of the grouted piles. Lateral and vertical soil stresses near the pile was
measured during the installation, grouting and subsequent load testing using the earth
pressure cells (Figure 3-2) installed vertically and horizontally within the test chamber.
3.1.2 Test Soil Properties and Test Chamber Soil Preparation
The soil used in the test chamber was typical Florida silty sand (A-2-4), with a
grain size distribution given in Figure 3-3. The fines in the soil were classified as non-
plastic. Minimum and maximum dry densities of the silty-sand were 14.5 kN/m3 and 18.1
kN/m3 (92.2 and 115.2 lbs/ft3), respectively. Direct shear tests performed on the soil at
minimum and maximum dry densities produced peak angles of internal friction of 31o
and 36 o
, respectively. Figure 3-4 presents the shear force vs. shear displacement
curves from the direct shear tests at maximum dry density. The large strain/critical state
friction angle (ϕc) of the soil was 31o.
The soil was placed in the chamber in 0.6 m lifts. In each lift, the soil was allowed
to free-fall into the test chamber and was leveled to produce an un-compacted layer.
Each lift was then compacted with a vibratory plate compactor for 2-3 minutes, starting
from the chamber boundary towards the center in a circular motion pattern. The
moisture content of the soil was in the range of 5-7%. During soil placement, stress
gages were placed at various depths and radial distances from the expected pile
locations to measure the radial and vertical stress changes within the soil. Density

49
measurements using the core cutter method/nuclear density gage on all the lifts
revealed a mean dry density of 15.99 kN/m3, with a coefficient of variation (COV) of
2.66%. Based on the mean dry density, the relative density of compacted soil was about
47.5%. While filling the test chamber, a number of hand cone penetrometer tests were
also performed on each compacted lift. For all the lifts, cone tip resistances varied from
2450-2941 kPa (25-30 tsf) at 0.3 m (1 ft) depth to 4903-6864 kPa (50-70 tsf) at a depth
of 1.2 m (4 ft). Using the cone tip resistance values, an average relative density of 56%
was obtained using the expression (Equation 3-1) suggested by Jamiolkowski et al.
(2001).
(3-1)
where
Dr = relative density (%)
qt = cone tip resistance
σatm = atmospheric pressure (1 bar = 100 kPa)
σ’vo = effective overburden pressure
Pressuremeter testing (PMT) was conducted in the test chamber after soil
preparation to estimate the cylindrical cavity limit pressure in the soil at two different
depths, 0.91 m (3 ft) and 1.83 m (6 ft), which corresponded to the middle of the top-side
grout bag and bottom-side grout bag respectively for 2.44 m (8 ) long piles. Figure 3-4
displays the expansion pressure vs. volume curves from the pressuremeter tests in the
test chamber. The average limit pressure determined at depths of 0.91 m and 1.83 m
were 415 kPa and 520 kPa, respectively.

50
3.1.3 Residual Horizontal Stress Around Pile
As mentioned earlier, the soil stresses within the test chamber were monitored
during pile jetting, grouting and axial top down test. Soil stress measurement before and
after pile jetting revealed that considerable decrease in lateral soil stress occurred close
to pile (Table 3-1) due jetting, which is attributed to the soil disturbance around pile
caused by jetting process. At larger radial distance, lateral soil stress change was
negligible. The measured grout pressure and grout volume during side and tip grouting
of the piles are summarized in Table 3-2. The soil stress measurements during grouting
showed that the radial and vertical stress around the pile increased during grouting and
quickly diminished to a stable value after pumping ceased. The stress decrease after
pumping was attributed to elastic unloading occurring around the pile and the
incompressible nature of the grout. Evident from the measured residual lateral soil
stress as shown in Table 3-1, a significant increase in stress occurred near the pile
which decreased rapidly away from the pile. Figure 3-5 presents the measured residual
horizontal stresses around the final grouted piles over time. From the negligible
changes in stresses with time, it was expected that the axial capacity of the pile would
not change with time. However, more studies are required to quantify the possibility of
stress redistribution (e.g., one year) due to creep, aging, etc. (Bullock et al. 2005).
Numerical modeling of the experimental study was performed to obtain more
information on the soil stresses and displacements history around the piles during
grouting and top down testing. The measured grout pressures, grout volume, and
residual soil stresses after grouting were used to control the numerical modeling of the
pile, which is discussed in the Section 3.2.

51
3.2 Numerical Modeling of Jetted and Grouted Piles
A two-dimensional finite element program, PLAXIS 2D was used to model the
installation and top-down loading of the pile. The pile and soil in the test chamber were
simulated with an axisymmetric model using 15-node triangular elements, as shown in
Figure 3-6. Along the chamber wall, both the radial and vertical displacements were
restricted. The bottom boundary was placed sufficiently far away from the pile such that
its influence was negligible. The actual square pre-cast pile was modeled as an
equivalent circular pile with the same cross-sectional area.
3.2.1 Material Models
The sand was modeled with the Hardening Soil (HS) constitutive model
(described by Schanz et al. 1999, coded in PLAXIS), and the pile was modeled as a
linear elastic material. The HS model is an advanced hyperbolic model formulated in
elasto-plastic framework (Schanz et al. 1999). Schanz et al. (1999) verified the model
for large deformation cavity expansion problem by simulating pressuremeter testing in
loose sands. The model uses the Mohr-Coulomb strength in the case of shear yield
surface, which is governed by friction angle, , cohesion, c , and dilation angle, ψ, but
has an additional yield cap to model the irreversible plastic strain due to isotropic
loading. The model uses three different Moduli: E50 from primary deviatoric loading, Eur
from elastic unloading/reloading and Eoed from primary oedometer loading, to describe
soil stiffness. The model also accounts for the stress level dependency of stiffness
parameters according to a power law, which is controlled by a dependency parameter
m. The material parameters used for the sand and pile in the analysis are given in Table
3-3. E50ref was determined as secant modulus corresponds to 50% mobilization of shear
strength from the standard drained triaxial deviatoric stress - axial strain curve (Schanz

52
et al. 1999). PLAXIS default settings of Eoedref = E50
ref and Eurref = 3 E50
ref were used in
the analysis. Stress level dependency parameter, m, was taken as 0.5 based on the
recommendation of Anderson and Townsend (2005) and the PLAXIS authors. Anderson
and Townsend (2005) reported that the variation of m has little effect by investigating
the HS model parameters for Florida sand. Elastic modulus of the concrete (pile) used
in the analysis was evaluated as MPafEc
4' 1048.24730 for f’c = 27.6 MPa
(MacGregor 1992). Although the cohesion of the silty sand used in the study was zero,
a small cohesion value (0.345 kPa or 0.05 psi) was used in the analysis for the
numerical stability of the model, as suggested in the PLAXIS manual.
3.2.2 Simulation of Grouting and Top Down Load Test
The analysis began with the precast pile embedded at the installation depth (i.e.,
the jetting process was not simulated), as PLAXIS 2D currently does not allow
simulation of the jetting process. The grout zone and membranes were initially
characterized as a soft linearly elastic zone (E = 689.5 kPa or 100 psi and = 0.25), as
shown in Figure 3-6. The zones were located at the top and bottom of the pile as well as
at the pile tip; these zones represent loose soil occupying the weak zone formed around
the shaft and tip during the jetting process. The grouting process was simulated by
applying positive incremental volumetric strains to these elastic zones in steps, which is
the PLAXIS-recommended approach to the simulation of grouting [Ni and Cheng 2010].
The sequence of the simulation was the same as that of the actual grouting of the pile
(i.e., first side grouting and then tip grouting). The expansion of each elastic zone was
controlled by the measured final grout volume (Table 3-2). In the PLAXIS analysis, the
elastic unloading immediately after grouting was simulated by applying volumetric

53
contraction to the respective elastic zones after the application of the volumetric
expansion representing grouting. The amount of volumetric contraction was controlled
by the magnitude of the residual stresses around pile, (i.e., residual horizontal stresses
measured in the chamber tests near the membranes). Subsequently, each elastic zone
was replaced by the linearly elastic concrete material to represent the hardened grout.
Because the grouting process is a large strain problem, the Updated Mesh Option was
used in the analysis. The Updated Mesh analysis in PLAXIS is a calculation procedure
based on the Updated Lagrangian formulation (Bathe 1982) to account for large
deformation influences. The program updates the finite element mesh and stiffness
matrix as the calculation proceeds to reassess stresses and strains within the mesh.
Figure 3-7 shows a typical deformed mesh after the simulation of both side and
tip grouting. The maximum expansion pressures for the top zone, bottom zone and tip
of the piles from PLAXIS analysis are given in Table 3-4. The grout pressures measured
in the experimental study (Table 3-4) were slightly higher than the respective expansion
pressures determined from PLAXIS. The difference was attributed to the resistance of
the semi-rigid membrane confining the grout zones. It should be noted that no interface
elements were used at the boundary between the sand and membrane, as the semi-
rigid membrane around the grout bulb was extremely rough and the soil did not debond
or slide relative to the membrane. The direct shear testing of membrane-soil interface at
test chamber soil density (16 kN/m3) gave an interface friction angle of 29o, which is
close to the friction angle of soil (31o). Therefore, in the FEM model, the interface friction
angle was set equal to that of the sand (i.e., no soil strength reduction).

54
After simulation of the grouting process, the analysis modeled the pile load test
by activating incremental distributed loads on top of the piles. The load-displacement
response of the piles obtained from numerical analysis was quite comparable with the
measured response, as shown in Figures 3-12, 3-13 and 3-14.
3.2.3 Lateral Stress Distribution and Lateral Soil Displacement During Pile Grouting
One major concern with all grouting is the potential undesirable effects on
adjacent structures due to soil movement and increased radial stresses generated by
the grouting process. In geotechnical engineering, the process of grouting a pile in situ
falls within the study of cavity expansion theory. Research studies by Carter et al.
(1986), Yu and Houlsby (1991), Yu (2000), Salgado and Randolph (2001) and Salgado
and Prezzi (2007) have contributed significantly to the understanding of the cavity limit
pressure and principal soil stresses in the vicinity of an expanding cavity. Grouting along
the pile resembles cylindrical cavity expansion, and the tip grout bulb takes the shape of
a spherical cavity. The radial stress distribution within the plastic zone around an
expanding cavity is inversely proportional to a power (for cylindrical cavity, power = (N-
1)/N and for spherical cavity, power= 2(N-1)/N, where N is the flow number or passive
earth pressure coefficient) of the radial distance (r) from the center of the cavity (Carter
et al. 1986; Yu and Houlsby 1991; Salgado and Randolph 2001). The radial stress is
largest close to the cavity and diminishes with radial distance from the center of the
cavity. The rate of decrease of the radial stress is high near the cavity, which is even
more significant in the case of a spherical cavity (Yu and Houlsby 1991). The radial
stresses measured around the spherical grout bulb during the tip grouting of 0.203 m
square pile are presented, along with stresses determined by FEM analysis and the

55
stress distribution using the analytical solution suggested by Yu and Houlsby (1991), in
Figure 3-8. The variable along the horizontal axis is the ratio between the radial
distance (r) and the cavity radius (a = 0.254 m). It can be seen that the measured
stresses match reasonably well with the FEM and the analytical stress distribution. It
should be noted that the radial stress diminished to 20% of the cavity stress at r/a =3
and 10% of the cavity stress at r/a =5 (2.5 x bulb diameter).
Similarly, the analytical solution for the lateral displacement around an expanding
cylindrical cavity by Chai et al. (2005) reveals that the lateral displacement of soil in the
plastic zone decreases hyperbolically with the radial distance. Shown in Figure 3-9 is
the radial displacement observed during the numerical simulation of side grouting (lower
zone) and tip grouting of a 0.203-m square pile in PLAXIS. It is evident from the Figure
3-9 that the displacement diminishes at a faster rate near cavity with radial distance,
and the rate is even more striking in the case of tip grouting (spherical cavity
expansion). The displacement was reduced to a considerably small value (less than 5
mm) at a radial distance of about 1.3 m (2.5x bulb diameter).
Because the lateral stresses and displacements during grouting diminish rapidly
with radial distance within a rather narrow zone close to the pile, any underground
structures outside the zone are less likely to be affected by post grouting of the Jetted
and grouted pile. In the present case, the radius of the zone was about 2.5B (B = bulb
diameter). The chamber boundary was 3.6B (1.83 m) in the 0.203 m square pile and
4.8B in the 0.152-m square pile. Moreover, no soil displacement was observed near the
chamber wall during the top-down testing of the piles. Therefore, the results of the top-
down tests should be representative of field tests. However in the case of 0.406 m

56
square pile, the chamber boundary was 2B away only and consequently the chamber
boundary may have influenced the test results.
3.3 Design Methodology for Jetted and Grouted Piles
Based on the results of the experimental study conducted by McVay et al. (2009)
and the numerical analysis, a design methodology was proposed for the Jetted and
grouted piles. The methodology specifically includes approaches to estimate (1) the
expected grout pressures during side and tip grouting of piles, (2) the unit skin friction of
the pile, and (3) the load-displacement response under compression loading, which are
discussed below.
3.3.1 Estimation of Jetted and Grouted Pile Grouting Pressures
As mentioned earlier, side grouting resembles cylindrical cavity expansion, and
the tip grouting is analogous to spherical cavity expansion. Cavity expansion theory was
subsequently used to predict the expected grout pressure during the installation of a
jetted and grouted pile. In cavity expansion, the radial stress at the wall of the cavity
becomes the principal stress and is generally referred to as the limit pressure, as
suggested by Menard (1957), who developed the pressuremeter test. The limit pressure
may be used to predict the pump pressures required to grout a pile’s shaft and tip. In
this work, the elastic-perfectly plastic closed-form solutions of Yu and Houlsby (1991)
and limit pressure charts provided by Salgado and Randolph (2001) were used to
predict the expected grout pressure. Another alternative to predict the expected grout
pressure is to perform pressuremeter tests to obtain limit pressures at various depths at
the site prior to the design of the jetted and grouted pile. Table 3-4 shows a comparison
of the measured pump pressures during grouting, expansion pressures from the FEM
analysis and the limit pressures estimated using Yu and Houlsby’s closed-form solution

57
(for a Mohr-Coulomb material with a critical state friction angle, c = 31o, dilation angle,
ψ = 0o & Poisson’s ratio, = 0.25), Salgado and Randolph’s limit pressure chart (for c =
31o, Relative density, Dr = 50%) and pressuremeter testing. It is evident from the Table
3-4 that the measured side grout pressures are slightly larger than the limit pressures at
their respective depths. The increase may be attributed to the resistance offered by the
semi-rigid membrane and the actual shape of the grout bulb (between that of a cylinder
and a sphere). However, the difference (20%) provides a reasonable prediction for the
expected side grout pressures required for installation.
It can also be seen from Table 3-4 that the measured tip grout pressure is less
than the spherical cavity limit pressure at the specified depth. This difference may be
due to the smaller tip resistance required to mobilize the side resistance of the pile. It is
expected, for longer jetted and grouted piles, that the tip grout pressure may be equal to
the spherical cavity limit pressure, owing to the higher side resistance due to side
grouting a longer (deeper) pile.
3.3.2 Estimation of Unit Skin Friction
Besides estimating the expected grout pressures during installation, a designer
must assess the expected axial capacity of the pile. Of major interest is the expected
skin friction, which is verified during the construction process (tip grouting). However, if
the tip grout pressure does not mobilize the full skin friction of the pile, it is common to
assume that the pile capacity is at least twice the measured grout tip load (Mullins et al.
2006).
To estimate the expected side resistance, the normal stress (i.e., radial, hoop,
and vertical) adjacent to the pile must be known. Yu and Houlsby (1991) estimated the

58
changes in the normal stresses around an expanding cylindrical cavity and reported that
the normal stresses at the cavity wall increases 3 to 9 times above the in situ stress.
During steady-state cylindrical cavity expansion, radial stress (r) is the major principal
stress, and the circumferential or hoop stress () is the minor principal stress, which is
close in value to the intermediate or vertical (z) stress. Mohr’s circle of major and minor
principal stresses during steady-state cavity expansion touches the Mohr-Coulomb
strength envelope controlled by the sand’s critical state friction angle, c. However, as
mentioned earlier, the stress state around the pile changes due to elastic unloading
immediately after grouting. It was observed from the experimental study and FEM
analysis that radial and vertical stresses decrease and hoop stresses increase during
elastic unloading after grouting. As a result, the radial stress/hoop stress becomes the
major principal stress (depending on the extent of unloading), and the vertical stress
becomes the minor principal stress. Correspondingly, Mohr’s circle for this situation will
be smaller (lower) than the strength envelope. However, for axial loading, the horizontal
(radial) stress will diminish as the principal stresses rotate until the failure plane occurs
vertically and the failure stress state occurs at the pole (Figure 3-10). Due to large
stress changes, it is not possible to predict the magnitude of the horizontal normal
stress at failure. However, it was found from the FEM analysis that the magnitude of the
minor principal stress does not vary significantly with the mobilization of side resistance
during axial loading; moreover, the minor principal stress at failure was nearly
equivalent to the residual vertical stress (σ’vg) after grouting. Figure 3-10 shows Mohr’s
circle at failure, the pole under vertical loading, failure skin friction (fs), and the estimated
vertical stress, ’vg.

59
Using Mohr’s circle under failure, given in Figure 3-10, the value of the failure unit
skin friction (fs) was found in terms of the critical friction angle (c) and effective vertical
stress after grouting, σ’vg (minor principal stress),
(3-2)
From the experimental and FEM analyses, the vertical effective stress (σ’vg) at
the grout-soil interface of the pile was determined to be a function of depth (h), buoyant
weight (’) and the grout vertical effective stress coefficient, Kg:
(3-3)
The proposed grout vertical stress coefficients, Kg, for sands are shown in Figure
3-11. The solid points were obtained from experimental testing and the open values
from numerical analysis. Experimental Kg values (‘diamond’ solid points) at depths of
1.8 m and 2.36 m in Figure 3-11 were obtained from the pressure cell data for the
0.153-m square pile. The vertical stresses before and after were measured using the
earth pressure cells, which were about 0.152-m (6 in) away from the pile. The pressure
cell at a depth of 1.8 m reported an initial vertical stress of 30 kPa and a vertical stress
of 58 kPa after grouting, corresponding to a Kg value of 1.93. Similarly, the vertical
stress at 2.36 m was increased from 40 kPa to 68 kPa by grouting (i.e., Kg = 1.7). The
‘circular’ solid points (Kg values: 1.98 and 2.25) at a depth of 1.37 m in Figure 3-11 were
back-calculated from the average unit skin friction of the 0.153-m square pile (42.8 kPa)
and 0.203-m square pile (48.6 kPa) using Equations 3-2 and 3-3. Similarly, Kg (1.6) at a
depth of 3.1 m was back-calculated from the average unit skin friction (75 kPa) of the
0.406 x 0.406 x 6.1 m jetted and grouted pile (Lai et al. 2010). It was assumed that the
average unit skin friction develops at the middle of the piles; hence, the back-calculated

60
Kg values represent that depth. The Kg values obtained from numerical analysis agreed
reasonably well with the experimental Kg values (ϕc = 31o) and, consequently, for other
friction angles (ϕc =33o and 35o); the Kg curves in Figure 3-11 were obtained from the
numerical analysis results. Table 3-5 provides the prediction of the average ultimate unit
skin friction (fs) and side resistance (Qs) of the piles using Equations 3-2 and 3-3, and
Figure 3-11. Note that the Kg values in the Table 3-5 were taken from the Kg trend line
(ϕc = 31o) in Figure 3-11 (not the back-calculated values).
3.3.3 Load Displacement Curve for Jetted and Grouted Piles
The pile-soil load transfer approach proposed by McVay et al. (1989) was also
used to estimate the load-displacement relationship for the jetted and grouted precast
pile. The nonlinear side shear at any point on the pile was assessed as a function of
vertical deformation through the T-Z curve (Equation 3-4). Similarly, the mobilized tip
resistance as a function of tip displacement is given by the Q-Z curve (Equation 3-5).
The load transfer functions are given as,
T-Z curve:
(3-4)
Q-Z curve:
(3-5)
where,
r0 = radius of pile
rm = radius of influence zone = 2.5ρL(1- ) (Randolph and Wroth 1978)

61
L = length of pile
= Poisson’s ratio
ρ = ratio of G at L/2 to G at tip
τ0 = shear stress on pile-soil interface,
G = reloading shear modulus
Rf = ratio of failure shear stress to its ultimate
R0 = radius of tip bulb
Q = mobilized tip load and
Rt = ratio of failure to ultimate tip resistance
Qf = ultimate tip load
Both Equations 3-4 and 3-5 are hyperbolic load transfer functions that depend
nonlinearly on the shear modulus, G. The ultimate skin friction, τmax, used in (Eq. 5) of
the T-Z curve, is obtained from Equation 3-2. The ultimate tip load, Qf, is obtained by
multiplying the ultimate unit end bearing (qb) with the grout bulb tip area. The correlation
between the spherical cavity limit pressure (PL) and ultimate end bearing pressure
(Randolph et al. 1994) is used to estimate the unit tip resistance, qb of the pile.
(3-6)
Comparison of load-displacement curves: Figure 3-12 compares the predicted load
– displacement curve for the 0.152-m square pile using Equations 3-4 and 3-5 with the
load test results and finite-element analysis. Similarly, Figures 3-13 and 3-14 show the
0.203-m square and 0.406-m square jetted and grouted piles, respectively. It can be
seen that the predicted load – displacement response obtained using Equations 3-4 and

62
3-5 are quite comparable with both the measured response and results of the finite-
element analysis. It is also evident from the shape of the load displacement curves that
the mobilized tip resistance occurs over a larger range of vertical displacements (2 mm
to 30 mm). As identified by Lai et al. (2010), the reaction system for the 0.406-m pile
load test was capable of developing only 1400 kN of compression axial load.
3.4 Full-Scale Field Installation and Testing of Single Jetted and Grouted Piles
Full-scale field construction and testing of two 0.71m square x 5.5 m long (28-in
square x18ft long) Jetted and grouted piles were performed to validate the construction
as well as the design estimates of torsion and axial resistance of the pile in typical
Florida soils. Static top down test was performed on one of the piles and combined
torsional and lateral load test on the other one. For axial response comparison, a similar
sized drilled shaft was also constructed and tested in the same soil condition. The tests
were performed in connection with the FDOT-UF ongoing research project: BDK-75-
977-41. The details of the test site soil investigation, the construction of jetted and
grouted piles and drilled shafts, the load tests, and the test results are presented in the
following sections.
3.4.1 Soil Investigation at the Test Site
The site considered for the study was the FDOT’s test site, Keystone Heights,
FL. Figure 3-15 shows the layout of test piles and drilled shaft along with reaction drilled
shafts. A detailed subsurface exploration at the test site was performed by State
Material Office, Gainesville. Both in-situ testing (SPT, CPT, PMT, and DMT) and
laboratory soil testing (classification tests and direct shear tests) were conducted for the
site. Standard Penetration tests were performed within the footprint of the test piles and
shafts to a depth of about 3 times the width/diameter beneath the pile/shaft tips to assist

63
with the design/construction. All the SPT borings revealed very high N values (exceeds
50) at a depth of 9 m through 14 m, representing the existence of a hard stratum. The
water table at the test site was 2.9 m (9.5 ft) below the ground surface at the time of soil
exploration, which seems to be perched on the hard stratum located at 9 m depth.
Laboratory classification tests on the soil samples collected during SPT boring showed
that, in general, the upper 0.91-1.22 m (3- 4 ft) consisted of clayey sand (SC) and low
compressible clay (CL). SPT N values in this layer ranged from 3 to 8. The upper layer
is underlain by poorly graded fine sand with silt (SP-SM) up to a depth of about 9 m.
SPT blow count in this sand layer varied from 3 to 34. From depths of 9 to 15 m, very
dense sand stratum with N value ranged from 51-100 exists. The hard sand stratum
was followed by medium dense fine sand (N value: 17 to 33), which extended to the end
of boring (21 m). Figure 3-16 displays the SPT blow count (N) profiles and the Unified
Soil Classification (USC) at the foot print of the test piles and drilled shafts along with
their schematic drawings. Shown in Figure 3-17 is the typical grain size distributions for
the silty sand at the site. Moisture content of the soils above water table (2.9 m) varied
from 1.5 to 20% with depth, whereas the soils below water table had reasonably uniform
moisture content (25-30%) irrespective of the depth. Direct shear tests were conducted
on the samples collected from all the bore holes at depths of about 2.6 m and 4.6 m
(approximately corresponds to the center of grout bags of jetted and grouted piles). The
angle of internal friction varied from 27o to 29o.
Pressuremeter tests were performed in the footprints of the two jetted grouted
piles at depths of 2.6 m and 4.9 m and the pressure-volume curves are given in Figure
3-18. The pressuremeter limit pressures (maximum value) at corresponding depth will

64
be the expected side grout pressure for each bag of jetted and grouted piles as
discussed in the design methodology for the pile (Section 3.3.1).
3.4.2 Design and Construction of Precast Piles Used for Jetted and Grouted Piles
3.4.2.1 Structural design
The precast pile used for jetted and grouted pile was 0.71m square in cross-
section. Steel reinforcement for the section was determined in accordance with ACI
318-08. Concrete compressive strength of 34483 kPa (5000 psi) was used in the
design. Traverse steel reinforcement consisted of #5 bars @ 5.08 cm (2 in) spacing and
longitudinal reinforcement was comprised of 16 nos. of #9 bars. The pile section had a
torsional capacity of 1005 kN-m, flexural capacity = 1062 kN-m, shear capacity = 1294
kN, and an axial capacity of 12428 kN.
3.4.2.2 Design and fabrication of grout delivery and jetting systems
Figure 3-19 shows the schematic diagram of jetted and grouted pile with the
location of side grout bags and concrete cap. Note that the use of concrete cap was to
transfer the load during the combined torsion and lateral test of the piles. The design
and construction of the concrete cap is discussed later. There were two 2.13 m (7 ft)
long side grout bags with separate grout delivery systems. In conformity with the
previous studies (McVay et al. 2009, Thiyyakkandi et al. 2012), 2.5 cm PVC pipes were
selected for the grout delivery systems shown in Figure 3-20. Each of the grout pipes
(entry & exit) had 7 pairs of holes with 7.5 cm center to center spacing (Figure 3-20),
evenly distributed (12.5 cm intervals) along the bottom 2/3rd of each grout bag. 2.5 cm
diameter gum rubber (6 mm thick) membrane covered each pair of holes.

65
Figure 3-20 also shows the PVC piping fabricated for jetting of precast pile into
ground. The jetting pipes was also be used for tip grouting. Diameter of the central
jetting pipe was determined based on the guidelines recommended by Tsinker (1988)
with the flow rate equation (Equation 2-1) for sandy soil suggested by Shestopal (1959).
Table 3-6 presents the estimation of diameter of the central (main) jetting pipe. Using
Shestopal’s equation (Equation 2-1), required flow rate for the present case was found
to be 82.3 m3/hr. Based on the recommendations of Tsinker (1988) and Gabr et al.
(2004), a flow velocity of 5 m/s was considered in the present case and required jet pipe
diameter was estimated to be 7.5 cm (Table 3-6). The central jet pipe branched off into
five-5 cm diameter pipes at bottom of pile for uniform distribution of water at tip.
3.4.2.3 Construction of precast piles and preparation for jetting
Figure 3-21 shows the reinforcement cage along with grout delivery systems,
jetting system, and instrumentation. Also shown in the Figure 3-21 (middle) are 4 bolts/
side attached via 0.95 cm thick x 6.35 cm wide steel plates to reinforcement cage.
These threaded bolts were used for attaching the side grout membranes to the pile prior
to jetting. The piles were instrumented with 5 concrete embedment strain gages as
shown in Figures 3-19 and 3-21 for monitoring the load distribution along the piles for
the top down load test. Figure 3-22 is the photograph showing the concrete placement
of one of the piles. Average 28th day compressive strength of the poured concrete was
55634 kPa.
After sufficient curing, the formwork was detached and excess concrete at the
location of side grout exit (covered with gum rubber) was removed. Then the precast
piles were prepared for jetting, which include: (1) flushing of each grout delivery
systems to ensure proper function, (2) testing the membrane, (3) attaching top and

66
bottom side grout membranes, (4) attaching nozzles for jetting/tip grouting system, and
(5) testing of nozzles to ensure uniform water distribution at tip. Each grout delivery
systems (both top and bottom) was connected to the city water supply and flushed to
ensure that the systems were working properly (Figure 3-23). A pressure of about 48
kPa (7 psi) was needed for water to exit through the ports after expanding the gum
rubber cover.
The membrane used for the side grout bags was 45-mil thick reinforced
polypropylene geomembrane (RPP). The membrane was first tested for interface
friction angle (δ) and tensile strength. The friction angle for the membrane - soil
interface (δ) was determined by direct shear tests at a dry density of 16 kN/m3 (102 pcf)
and a moisture content of 7.5%. The soil used for the tests was typical Florida silty
sand. The interface friction angle, δ, was found to be 22.5o. Tensile strength of the
membrane was estimated by conducting tension tests on a number of 3.18 cm (1.25”)
wide strips and the average tensile strength of the membrane was 22138 kPa.
To form the grout bags, the membranes were first rolled to a cylinder of 1.22 m
diameter (design diameter of grout bulb) with an overlap of 15 cm and then the overlaps
were heat seamed. For each grout zone, the total length of the required membrane was
the sum of the length of side grout zone (2.13 m), additional length for expansion
outward during grouting, and width of steel plates for attaching the membrane to pile at
both ends (i.e., 2.13+0.508+2x0.075 =2.788 m+0.075 m extra = 2.863 m). Each
vertically seamed membrane was cut to a length of 2.863 m. A grid of small holes (1.5-2
mm Ø) at 15 cm spacing were drilled into the membrane, which is expected to allow the
grout seepage through the membrane during grouting process and thus develop

67
adequate bonding between grout bag and surrounding soil. In order to attach the
membrane to the pile, both vertical and horizontal pleats had to be placed in the
membrane. Note that the vertical pleats will reduce the circumference and one
horizontal pleat will reduce the height of the membrane. For each pile, the horizontal
pleat was first made in the middle by folding the membrane roll. Then, the membrane
was positioned at the location of grout zone. Next, the membrane was attached to the
pile in such a way that a vertical pleat of about 11 cm wide was made in the middle of
each face. The membrane was secured to the pile by means of steel plates and
threaded rods embedded in pile (Figure 3-23).
After the attachment of both top and bottom bags, the nozzles were attached at
the exit of all the 5 cm jet pipes at the tip of the piles (Figure 3-23). The nozzle pattern
for all the outer pipes was same; four – 1.25 cm diameter holes, as shown in Figure 3-
25. For the central pipe, the nozzle pattern consists of four – 1.25 cm diameter holes
and one- 1 cm diameter hole in the middle. The nozzles were tested to ensure uniform
water distribution at the bottom (Figure 3-23). Test was performed by connecting the
central jet pipe to the city water supply. The maximum water pressure recorded by
pressure gage was less than 35 kPa. As evident from the Figure 3-23, flow distribution
was virtually uniform even under small pressure.
3.4.2.4 Jetting of precast piles
After the preparation (i.e., attaching the membranes and nozzles), the piles were
jetted into the ground. Figure 3-24 shows the setup for the pile jetting. In order to reduce
water loss (e.g., percolation) and minimize water requirement during jetting, the water
used for the jetting was re-circulated. First of all, 2.1 m diameter x 1 m deep holes were
made and temporary surface casings were installed at the location of both piles to
68
collect the water coming up during the jetting process (Figure 3-24). A 50 ton crane was
used for positioning and holding the pile during the jetting process. The pressurized
water for jetting was provided to the test pile from a water tanker through a 15 cm high
pressure jet pump (max. flow rate = 6 m3/minute and max. pressure = 1269 kPa), Figure
3-24. The pump was equipped with flow meter and pressure gage to monitor the flow
rate and pressure respectively. Jetting initiated with flow of water from the water tank
through the pump to the test pile with a flow rate of 1.5 m3/minute and a pressure of
about 900-950 kPa. Subsequently the test pile was lowered with the crane as
penetration occurred. The pile was allowed to penetrate with its own self-weight by
releasing the weight steadily from the crane. A hydraulic trash pump (maximum flow
rate = 4.9 m3/minute and pressure = 450 kPa) was used to pump the water collected in
the surface casing back to the tanker (Figure 3-24) at a flow rate of nearly equal to the
jetting flow rate (1.5 m3/minute). Total water loss (percolation) during the jetting of two
piles was approximately 3.75 m3. After jetting of each pile, the casing was pulled out
and soil was backfilled around the pile.
The noise and ground surface vibrations generated during the pile jetting
operation were recorded using Vibration and Overpressure Monitors (triaxial geophones
and overpressure microphones). Analyses of noise and vibration data are presented
later.
3.4.2.5 Design and construction of concrete cap for jetted and grouted piles
A reinforced concrete cap was required for transferring the forces and moments
from the loading assembly (Mast arm structure) to the pile during the combined torsion
and lateral load testing. A precast concrete cap was chosen for one of the jetted and
grouted piles and a cast-in place cap for the other. Figure 3-25 depicts the schematic of

69
precast concrete cap – pile connection. The starting point for the design of concrete cap
was the dimension of inner square hole for accommodating the precast pile head. In
case of precast cap, a 5 cm grout space/gap between the cap hole and pile was
considered, which would provide adequate room for lowering the standard grout tube
that the industry uses. From there, other dimensions and various components of cap
(anchor bolts, flexural, torsional and shear reinforcement) were designed to meet
various standard code requirements (ACI 318-08, AASHTO LRFD, AISC 360-05, etc.).
The diameter and number of ASTM F1554 Grade 55 anchor bolts required to transfer
the loads from Mast arm pole to foundation were determined by considering steel
strength requirements of anchors in tension and shear (ACI 318 - 08, AASHTO LRFD,
AISC 360-05). It was found that 16 nos. of 3.75 cm (1.5 in) diameter bolts were
sufficient in the present study.
The optimum dimensions (outer width and depth) for the cap was selected
considering the concrete breakout strength of anchor groups in shear, side face
“blowout” failure of anchors in tension, concrete pry out strength in shear, anchor bolt
embedment, FDOT’s clear cover requirement and cost. A square cap with 1.74 m (60
in) outer width and 0.77 m (30.375 in) depth was found to be adequate for transferring
the forces and moments generated during the load tests without concrete breakout and
side face blowout failure. A minimum clear cover of 7.5 cm was provided to all the
reinforcements for all the exposed sides of cap in accordance with FDOT's "Structures
Design Guidelines for LRFD" (FDOT 2002b), considering the site condition as
“moderatively aggressive". The required anchor bolt embedment depth was determined
by considering the development length for longitudinal reinforcement and spacing

70
between anchor bolts and longitudinal reinforcement in accordance with NCHRP
(2003). The development length for # 5 rebars was determined to be 0.404 m using ACI
318-08 (2008) and the horizontal distance between anchor bolt and vertical
reinforcement was about 0.149 m (5.87 in). Therefore the required embedded depth for
anchors was estimated to be 0.628 m [0.404+0.149+ top clear cover (0.075) = 0.628 m].
Steel reinforcement for concrete cap was calculated according to ACI 318-08 (2008). A
concrete strength of 34483 kPa (5000 psi) was used in the design. Figure 3-26 displays
the longitudinal and cross-section of cap with reinforcement details. Note that the
dimensions and various reinforcements for both precast and cast-in place cap were the
same. Only difference was the grout space/gap for the precast one. Estimation of grout
tensile strength, shear strength and bond resistance at grout-concrete interface of the
precast cap-pile connection using the strength properties of cementitious non-shrink
grout approved by FDOT (Qualified Products list) indicated that the interface could
safely transfer the forces from cap to pile during the load tests. Figure 3-27 shows the
placement and grouting (gap between the pile and cap) of precast cap. The grout was
filled from bottom to top (free flow) using a funnel and a hose as shown in Figure 3-27.
Similarly, Figure 3-28 presents the casting of cast-in place concrete cap.
3.4.2.6 Side and tip grouting of the piles
The side membranes of the piles were grouted only after allowing sufficient time
for the hydration of concrete cap installed at the top of piles (Figure 3-29). Theoretical
grout volume required to fill a purely cylindrical side membrane was estimated to be
about 1.325 m3 (350 gallon). Since the membrane had vertical pleats on both ends to
attach to the pile faces (reduced perimeter at both ends), the actual volume needed to
fill the membrane will be less than the theoretical volume. A grout volume of

71
approximately 1.14 m3 (300 gallon) may be sufficient for each membrane. The grout
volume and sustained grout pressure were recorded throughout the grouting process for
each membrane. The grout pressure was recorded at the pump and the top of the pile
(both inlet and outlet pressures). Pile head and soil displacement were also monitored
throughout the grouting process (Figure 3-29). Figures 3-30 and 3-31 present the grout
pressure (inlet pressure at pile head) versus the accumulated grout volume pumped in
the top and bottom membranes of the pile 1 and 2 respectively.
Table 3-7 compares the measured grout pressures with the predicted grout
pressures from the different approaches, such as Yu and Houlsby’s (1991) closed form
solutions, Salgado and Randolph’s (2001) charts, as well as with the limit pressures
from the Pressuremeter tests. As evident from the Table 3-7, the measured side grout
pressures were in good agreement with the predicted grout pressures.
After the hydration of side grouting, tip grouting of both piles were performed.
The sustained grout pressure, volume of grout pumped, and vertical displacement of
pile and surrounding soil were recorded throughout the grouting process. The tip
grouting was controlled by the upward displacement of pile. Specifically, the grouting
stopped when the average upward pile head displacement exceeded 9.5 mm (⅜ in) in
combination with a steady or dropping tip grout pressure. Generally, 9.5 mm to 12.5 mm
(⅜ to ½ in) of displacement is considered sufficient to fully mobilize the skin resistance
on a pile in the literature.
Shown in Figure 3-32 is the measured grout pressure versus volume of grout
pumped during the tip grouting of both piles. Figure 3-33 displays the grout pressure
versus pile head displacement plots. In the case of Pile 2, as shown in Figures 3-32 and

72
3-33, there was an approximate linear increase of grout pressure with volume until pile
began to move upward (2690 kPa), and grout pressure dropped off with further vertical
movement (i.e. full mobilization of skin friction). In the case of pile 1, the grout pressure
and volume increased until 1552 kPa, upon which pressure dropped, but grout volume
below the tip still increased (Figure 3-32). At grout volume of 0.325 m3 (Figure 3-33), the
grout pressure started to increase and at grout volume of 0.53 m3, upward movement
had reached 9.5 mm (3/8-in) and grout pressure dropped suggesting that the full
mobilization of skin friction had occurred.
Table 3-8 presents a comparison of the measured maximum sustained tip grout
pressures versus the spherical cavity expansion limit pressures at pile tip predicted
using Yu and Houlsby’s (1991) closed form solutions, and Salgado and Randolph’s
(2001) charts. It is evident from the Table 3-8 that the measured grout pressures were
close to the predicted spherical cavity limit pressure at that depth, indicating that the
maximum possible grout pressure (i.e., steady state expansion) had developed during
the tip grouting of both piles. Specifically, the side grouting of the piles significantly
improved the side resistance, i.e. the lateral stresses adjacent to the piles upon which
tip grouting leads to spherical cavity expansion.
The noise and ground surface vibration were also monitored during the top
membrane and tip grouting of both piles, which is discussed below.
3.4.3 Measured Noise and Vibration During Pile Jetting and Grouting
As identified earlier, noise and ground surface vibration was measured during the
pile jetting and grouting operation. Vibration and Overpressure Monitor (Instantel®
Minimate Plus™) with triaxial geophone (velocity transducer) and overpressure

73
microphone were used for the measurement (Figure 3-34). The monitors were located
at different radial distances from the pile location.
3.4.3.1 Measured noise
Figure 3-35 shows the location of construction equipments and vibration and
noise monitors with respect to the pile location during the jetting process. Note that the
layout of noise and vibration monitors was same for both piles, but the location of the
construction equipment was different. The construction equipments used to jet the piles
were: 1) high pressure jet pump, 2) crane, and 3) water recirculation pump, as
discussed earlier. Therefore the major sources of noise in the jetting operation were the
sound/noise emitted from the motors of these equipments, and not from the jetting
process itself.
According to FHWA’s Noise Abatement Criteria (NAC), hourly equivalent steady-
state sound level (Leq) should be limited to 67dBA in residential, hospital, school, picnic,
and recreational areas and 72dBA in developed lands (commercial and industrial
areas). Noise is reported in “A-weighted” decibels (dBA), which is the sound level
measurement in decibel (dB) adjusted/weighted to match the sensitivity of human ear.
Figure 3-36 displays the noise measured at various monitor locations during the jetting
process. The noise in the vicinity of pile location was in the range of 85-92 dBA, which is
attributed to the operating noise of water recirculation pump and high pressure jet
pump. It can be seen from the Figure 3-36 that the noise levels were nearly the same
for both piles, even though the locations of equipments were different (Figure 3-35).
This is due to the fact that resultant noise level at a location due to multiple noise
sources is dominated by the highest individual noise level (as sound level, dB or dBA is
logarithmic). It is evident from the Figure 3-36 that for the distance beyond 21 m, the

74
noise level is less than 72dBA (FHWA-NAC criterion). The noise can be further reduced
by shielding the equipments (jet pump and water recirculation pump) and locating the
pumps away from any sensitive building/structure under consideration.
FHWA’s Road Construction Noise Model (FHWA 2006) database suggests an A-
weighted maximum sound level (Lmax) of 95dBA at a distance of 15.2 m (50ft) for any
impact pile driving operation. Since the noise levels decrease with the logarithm of
distance from the source, the corresponding hourly equivalent sound level (Leq) at
various distances can be obtained using Equation 3-7 (FHWA 2006). Figure 3-36 also
displays the estimated variation of noise levels with distance for an impact pile driving
operation (using Equation 3-7, Lmax = 95 dBA and U.F (%) = 100). In the case of
impact/dynamic pile driving, it can be found using Equation 3-7 and an Lmax value of 95
dBA that the noise level is less than 72 dBA (FHWA 2006) at a radial distance beyond
213 m (700 ft). Therefore it can be concluded based on limited data that the noise
generated during a pile jetting operation is much less than a dynamic pile driving as
expected.
(3-7)
Where, D- distance from source, U.F (%) - time-averaging equipment usage
factor.
During the grouting of the piles, the grout pump/diesel generator was the only
construction equipment used and hence the only source of noise. In all the cases (i.e.,
side and tip grouting), the grout pump was in the range of 8.5-15.2 m away from the pile
and in the opposite side of noise and vibration monitor’s locations. Figures 3-37and 3-
38 show the noise measured at different locations during the top membrane and tip

75
grouting respectively. It is evident from the Figures 3-37 and 3-38 that the noise
measured at all locations was less than 67dBA (FHWA’s Noise Abatement Criteria for
residential area) and hence the noise during the grouting process is not critical as long
as the source (grout pump) is at least 16 m away from the location under consideration.
3.4.3.2 Measured ground surface vibration
Also of significance is the induced ground vibration during the construction.
Ground motion may cause structural and architectural damage to nearby structures.
Triaxial geophones (velocity transducers) were used to measure the three orthogonal
components (transverse, vertical, and longitudinal) of particle motion at different radial
distance during the pile jetting and grouting operation. The resultant particle motion was
determined as the vector sum of three orthogonal components. Shown in Figure 3-39
are the peak particle velocity profiles for pile 1 and 2 during the jetting process. The
peak particle velocity was higher (0.48 mm/s) for pile 1 and it was attributed to the
proximity of jet pump to the pile as shown in Figure 3-35. However, beyond 9.1 m (30
ft), the particle velocity was negligible. For pile 2, the peak particle velocities were
similar (1.8 mm/s) at 3.66 m and 9.75 m due to the similar distance from the jet pump to
the pile (see Figure 3-35). At larger distances, peak particle velocity was higher in the
case of pile 2 than pile 1, which is attributed to the difference in location of the jet pump
as identified from Figure 3-35.
Table 3-9 presents the maximum vibration level recommended by AASHTO
Designation R8-81 (AASHTO 1982) to avoid structural damage. It is evident from Figure
3-39 that for distance greater than 6.5 m, peak particle velocities were less than the
minimum limiting velocity (2.5 mm/s or 0.1 in/s) suggested by AASHTO Designation R8-
81 for historical or critical structures.

76
Figure 3-40 presents the peak (maximum) particle velocity measured during the
side and tip grouting of the piles. It is clear from the Figure 3-40 that vibrations during
the process were negligible; much less than minimum limiting velocity suggested by
AASHTO Designation R8-81 (Table 3-9).
3.4.4 Axial Top Down Testing of the Jetted and Grouted Pile
After waiting approximately four weeks following the tip grouting of the piles,
static top down testing of jet-grouted pile 1 was performed in accordance with ASTM D
1143/D 1143M-07. Figure 3-41 shows the setup for the load test with all the
instrumentations. The reaction for the static load test was provided by two 1.22 m
diameter x 12.2 m long reaction drilled shafts installed on either side of the test pile (5.5
m away). Two 12.2 m long beam girders (Figure 3-41) were used for transferring the
load to the reaction drilled shaft during the load test. An 8896 kN (2000 kips) capacity
hydraulic jack was used for applying the load (Figure 3-41). The applied load was
measured using an 8896 kN load cell. The vertical displacement of the pile was
monitored using the digital levels, digital dial gages, and mirrored scale (Figure 3-41).
The digital dial gages were attached to a wooden reference beam as shown in Figure 3-
41. The upward displacement of the reaction drilled shafts was also monitored
throughout the test. The data from the strain gages embedded within the test pile was
acquired using the National Instruments data acquisition system. The data was later
used to identify the load distribution along the pile and used to separate the skin and tip
components.
The load was applied in 111 kN (25 kips) increments and each increment was
kept for a constant time interval of 10 minutes in conformity with ASTM D 1143. The
loading could not be continued beyond 1557 kN (350 kips) due to failure of one of the

77
reaction drilled shafts (upward movement, i.e. pullout). The maximum displacement
observed on the top of the test pile was only 4 mm (0.15 in). The applied load was then
removed in five decrements.
Shown in Figure 3-42 is the strain measured at different locations: above the top
bag, between the bags, and below the bottom bags; during the load test. The load
distribution alone the pile, and skin and tip contributions were estimated using the
measured strains and applied top load. Figure 3-43 presents the total load, mobilized tip
load, and mobilized skin resistance versus top displacements during the load test.
Shown in Figure 3-44 is the load distribution along the pile during the incremental
loading. It can be seen from the Figures 3-43 and 3-44 that that the side resistance of
the pile was not fully mobilized during the load test. The total mobilized side resistance
of the pile was 1254 kN (282 kips).
The unit skin and ultimate side resistance of jetted and grouted pile was
estimated using the proposed prediction methodology (Section 3-3) and using the tip
grout pressure data. Table 3-10 presents the prediction of the average ultimate unit skin
friction (fs) and side resistance (Qs) of jetted and grouted pile using the proposed
methodology. The average unit skin friction for each membrane was determined at the
average depth using the Kg plot (Figure 3-11) and Equation 3-2. The side resistance
was obtained by multiplying the average unit skin friction with the pile surface area.
Note that the diameter of the bulb was estimated by assuming a purely cylindrical shape
with volume equal to the volume of grout pumped.
Second approach was based on the field reported tip grout pressure (i.e.,
construction approach). The ultimate axial skin friction of a pile should be equal to the

78
maximum tip grout pressure times the effective tip area. The effective area is assumed
as the area of circle with diameter equal to the diagonal distance of precast pile [(π/4) x
(0.711√2)2 = 0.7945 m2]. The skin resistance based on the tip grout pressure is found to
be 1589 kN (2000 kPa x 0.7945 = 1589 kN; Note total capacity: skin+ tip 3178 kN),
i.e. sufficient load has not been applied to the pile to mobilize full skin friction or tip
resistance. Table 3-11 provides a comparison of the measured skin resistance with
predicted skin resistance using different approaches. It is evident from the Table 3-11
that the measured skin resistance for the top membrane was in reasonable agreement
with the predicted value based on Kg approach. However the proposed methodology
under-predicted the skin resistance of the bottom membrane. This may be attributed to
the actual shape of the bottom side bulb formed, which is currently unknown because
the pile is not excavated. It is also clear from the Table 3-11 that the measured tip grout
pressure predicted the ultimate skin resistance quite well.
3.4.5 Construction and Testing of Comparison Drilled shaft
3.4.5.1 Construction of test drilled shaft
The drilled shaft considered for the axial resistance comparison was a 1.22 m
diameter x 5.5 m long shaft. The shaft was instrumented with 8 sister-bar strain gages
(2 gages diagonally opposite in 4 different levels: 1.68 m, 3.35 m, 4.42 m, and 5.03 m)
Wet construction method was employed for the construction of the drilled shaft. Mineral
slurry (bentonite clays) was used in the excavation to provide stability. A truck mounted
drill rig was used for excavation. Figure 3-45 shows the lowering of reinforcing cage into
the shaft hole using a truck mounted hydraulic crane and the concrete placement. The
average 28th day compressive strength of the concrete determined from the testing of
the sample cylinders was 48100 kPa.
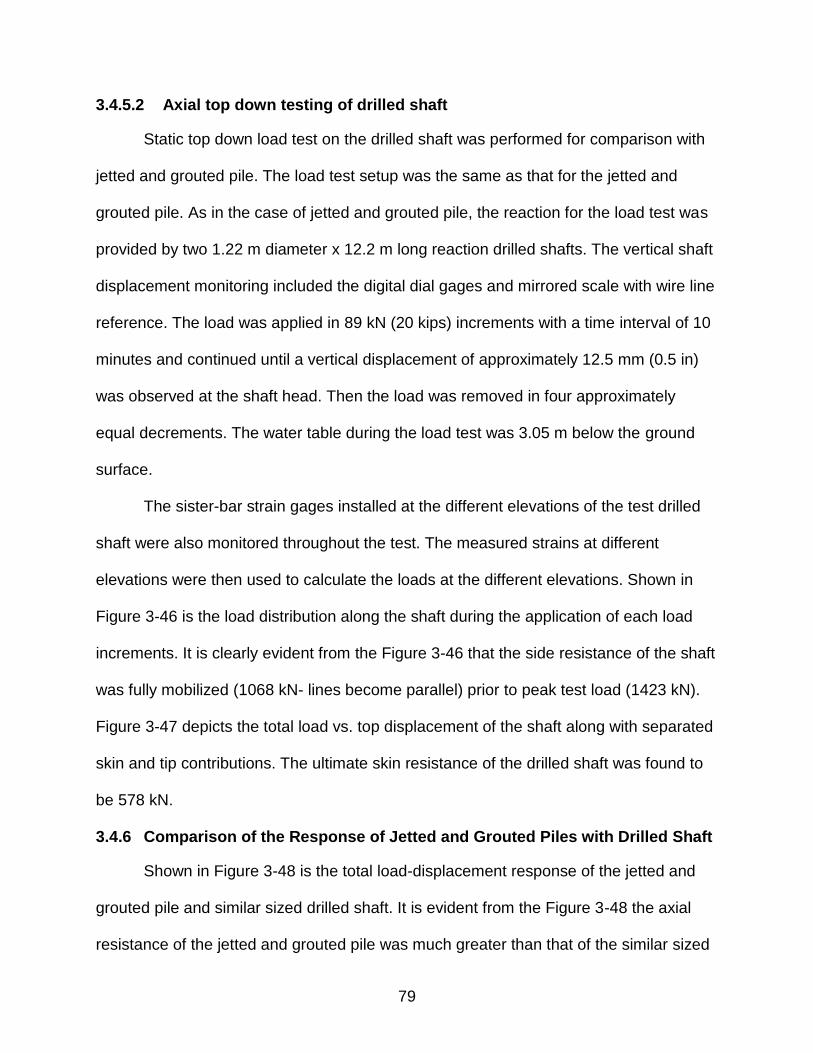
79
3.4.5.2 Axial top down testing of drilled shaft
Static top down load test on the drilled shaft was performed for comparison with
jetted and grouted pile. The load test setup was the same as that for the jetted and
grouted pile. As in the case of jetted and grouted pile, the reaction for the load test was
provided by two 1.22 m diameter x 12.2 m long reaction drilled shafts. The vertical shaft
displacement monitoring included the digital dial gages and mirrored scale with wire line
reference. The load was applied in 89 kN (20 kips) increments with a time interval of 10
minutes and continued until a vertical displacement of approximately 12.5 mm (0.5 in)
was observed at the shaft head. Then the load was removed in four approximately
equal decrements. The water table during the load test was 3.05 m below the ground
surface.
The sister-bar strain gages installed at the different elevations of the test drilled
shaft were also monitored throughout the test. The measured strains at different
elevations were then used to calculate the loads at the different elevations. Shown in
Figure 3-46 is the load distribution along the shaft during the application of each load
increments. It is clearly evident from the Figure 3-46 that the side resistance of the shaft
was fully mobilized (1068 kN- lines become parallel) prior to peak test load (1423 kN).
Figure 3-47 depicts the total load vs. top displacement of the shaft along with separated
skin and tip contributions. The ultimate skin resistance of the drilled shaft was found to
be 578 kN.
3.4.6 Comparison of the Response of Jetted and Grouted Piles with Drilled Shaft
Shown in Figure 3-48 is the total load-displacement response of the jetted and
grouted pile and similar sized drilled shaft. It is evident from the Figure 3-48 the axial
resistance of the jetted and grouted pile was much greater than that of the similar sized

80
drilled shaft. Table 3-12 presents the mobilized unit skin frictions for each zone of jetted
and grouted pile and a comparison with the maximum unit skin obtained during the
drilled shaft test. It is clear from the Table 3-12 that unit skin friction for the jetted and
grouted pile is much greater than that of drilled shaft, especially in the bottom zone (2.6
times). The superior unit skin resistance for jetted and grouted pile is attributed to the
larger horizontal stress close to the pile subsequent to side grouting (cylindrical cavity
expansion).
3.4.7 Combined Torsion and Lateral Load Testing of the Jetted and Grouted Pile
3.4.7.1 Design and fabrication of Mast arm assembly
Past torsion testing of jetted and grouted pile in a large test chamber
environment (McVay et al. 2009) showed that the pile possess very high torsional
resistance and hence could be used as the foundation for Mast arm structures
supporting highway signs and signals. Since the eccentric dead load of a standard
FDOT Mast arm assembly itself generate axial load and moment (Mx; about the axis
parallel to arm axis) on the top of foundation, a real Mast arm structure need to be used
for the testing. One of the longest (23.77 m or 78 ft long) FDOT Mast arm available is
E7 type and corresponding pole is T6 type (FDOT Design Standards Index No. 17743).
FDOT Design Standards prescribe a 1.22 m diameter x 5.5 m long drilled shaft (4 ft x 18
ft) to support an E7-T6 Mast arm assembly. Table 3-13 shows the forces and moments
generated on foundation top for the E7-T6 Mast arm assembly subjected to a design
wind speed of 130 mph (FDOT Mathcad 14 spreadsheet: MastArm v4.3). The
orientation of the coordinate system considered is shown in Figure 3-49. It was found
using the FDOT MastArm v4.3 that the standard E7-T6 assembly is not capable of
carrying torque exceeding 413 kN-m (305 kip-ft). Because the jetted and grouted pile

81
was expected to have a torque resistance more than 413 kN-m, a new Mast arm
structure had to be designed and fabricated for the testing of the pile to failure.
Accordingly a Mast arm assembly with the dimensions shown in Table 3-14 was
designed using the FDOT’s Mathcad spreadsheet: MastArm v4.3 to carry a maximum
torque of 759 kN-m (560 kip-ft). The spreadsheet had to be slightly modified to
incorporate a point lateral load on arm instead of wind load. Note that the new Mast arm
develops similar axial load and moment on the pile as an E7-T6 assembly due to its self
weight (Table 3-13). Also the forces, moments at top of pile, due to 33 kN (7.4 kips)
lateral load on the new Mast arm at an eccentricity (standoff distance) of 10.67 m (35 ft)
are comparable with the load combinations for an E7-T6 type assembly at a design
wind speed of 130 mph as a shown in Table 3-13. Figure 3-50 shows the Mast arm
assembly (i.e., arm, pole, and connection bracket) fabricated in accordance with design.
3.4.7.2 Test setup, instrumentation, and load test procedure
A crane with an axial capacity of 747 kN (75 ton) was used to lift and set the
Mast arm assembly on the pile (Figure 3-51). After setting and orienting the Mast arm
assembly properly, the bottom flange of the pole was bolted to the anchor rods
embedded in the concrete cap, while the crane supported a significant portion of the
dead weight of the assembly (Figure 3-51).
Three different types of instrumentations were used for the monitoring of rotation
and translation of pile during the load test: (1) two Total Stations, (2) two sets of string
pots (4 pots in each set), and (3) four digital dial gages. Figure 3-52 displays the
locations of Total Stations and the targets on the Pile-Mast arm assembly. As shown in
Figure 3-52, the reflective tapes were used as the targets, which were glued to eye bolts
attached to the end of 3.75 cm diameter steel pipes projecting outward from the pole.

82
The targets were at the two different elevations (4 at each elevation; Figure 3-52); the
first set was 0.15 m (0.5 ft) above the bottom flange and the second set (top) was 1.5 m
(5 ft) above the bottom set. Figure 3-53 shows the schematic arrangement and the
actual placement of the string pots at the test site. The string pots sets (4 in each set)
were also placed at the same elevation of Total Station targets. The string pots with
supporting frame were kept outside the influence zone of pile (i.e., 5 x diameters away
from pile). National Instruments data acquisition system was used to record the string
pot data. Shown in Figure 3-54 is the placement of digital dial gages at the elevation of
bottom Total Station targets and string pot set (i.e., 0.15 m above bottom flange). The
gages were supported by a wooden reference beam as shown in Figure 3-54. The
depth of water table on the day of testing was 2.62 m (8.6 ft).
The combined torsion and lateral loading of the pile was performed by applying
lateral load on the mast arm at an eccentricity of 10.67 m (35 ft) using a crane (Figure 3-
55). The location of crane was about 40 m away from the arm. A surveying level was
used to ensure that the cable was horizontal during the loading. The crane applied the
lateral load at an increment of 2.22 kN (0.5 kips) by pulling on the arm (Figure 3-55).
The applied lateral load was measured using an 89 kN (20 kips) capacity tension load
cell attached to the cable (Figure 3-56). Each increment was kept for a uniform time
interval of 5 minutes. The loading could not be continued beyond 54 kN (12.17 kips) due
to the limited pull capacity of the crane’s winch cable (tag line). Subsequently, the load
was removed in seven decrements with a time interval of 5 minutes.
3.4.7.3 Analysis of results
Table 3-15 presents the forces and moments acting on the pile when the arm
was subjected to the maximum lateral load of 54 kN. As given in Table 3-15 the

83
foundation was under a combination loads and moments (Vx, Vy, Mz, Mx, T) during the
load test. Figure 3-57 displays the torque vs. rotation response measured during the
combined torsion and lateral load testing. It can be seen from the Figure 3-57 that the
rotations measured using different instrumentations (Total Stations, string pots, and dial
gages) were the same. The maximum value of torsional resistance mobilized during the
load test was 577.6 kN-m (Table 3-15 and Figure 3-57) and corresponding measured
rotation was only 1.45o, which indicates that the torsional resistance of the pile was not
fully mobilized during the test. Shown in Figure 3-58 is the components of lateral
displacement along the direction of lateral load (X-axis) and axis of arm (Y-axis). It is
evident from the Figure 3-58 that the displacement component along the arm axis was
the larger in magnitude up to a lateral load of 36kN and afterward the displacement
along the load direction became the major component. Figure 3-59 presents the lateral
load vs. resultant lateral displacement response of the pile. The maximum lateral
displacement observed was only 15 mm. Interestingly, there was significant elastic
rotation and translation rebound during the unloading phase of the test as shown in
Figures 3-57 and 3-59. Specifically more than 50% of the rotation and translation during
the loading phase was elastic in nature. It is also evident from the Figure 3-60, which
shows the torsional cracks and gaps due to combined rotation and translation after
maximum loading and full unloading. The gaps formed during the loading phase were
almost recovered during the unloading phase.
The torsional resistance mobilized during the test was subsequently compared
with the values predicted using the different approaches (Table 3-16). The torsional
resistance was estimated by multiplying the surface area of the pile with the unit skin

84
friction values predicted using the proposed methodology (Equation 3-2) and the tip
grout pressure. The surface area of the pile was estimated by assuming that purely
cylindrical shaped bulbs with volume equal to the volume of grout were formed around
pile. Note that the torsional resistance contribution due to the pile tip is not considered in
the prediction. It can be found from the Table 3-16 that the methodology presented in
Section 3.3 under-predicted the torsional resistance. It may be attributed to the actual
shape of the side grout bulb formed and the fact that tip contribution was not considered
in the prediction. Since the torsional resistance of the pile was not fully developed
during the test (rotation = 1.45o), it is expected that the ultimate torsional resistance (i.e.,
8-100 rotation) of the pile will approach the value predicted using the tip grout pressure.
The combined torsional and lateral load testing of the jetted and grouted pile in
typical field scenario shows that the torsional resistance of the pile (577.6 kN-m) even
under very small rotation is much greater than the torque (351 kN-m) generated on an
E7-T6 Mast arm structure during a design wind speed of 130mph ( e.g., hurricane).
Noteworthy that it is even much higher than the torsional capacity of E7-T6 Mast arm
structures (413 kN-m). Thus the test suggests that the new pile is an appropriate
foundation system for Mast arm structures supporting highway signals and signs
considering both constructability and resistance in typical cohesionless soil conditions.

85
Table 3-1. Measured lateral soil stress change due to jetting and grouting
Pile
Initial stress gage location Lateral stress
Depth (m)
Radial distance from pile surface ( in terms of pile
width, B)
Before jetting (kPa)
After jetting (kPa)
% of stress
decrease
After grouting
(kPa)
0.152 m square pile
1.83 1B 13.6 7.9 41.9% 130.3
0.203 m square pile
1.22 2.25B 12.5 10.4 16.8% 48.3
1.83 6.4B 17.4 17.2 1.1% 27.6
Table 3-2. Measured grout pressure and grout volume
0.203 m x 2.44 m pile 0.152 m x 2.44 m pile
Grout pressure kPa
(psi)
Grout volume m3
(Gal)
Grout pressure kPa
(psi)
Grout volume m3
(Gal)
Top zone grouting 550 (80) 0.1893 (50) 550 (80) 0.0946 (25)
Bottom zone grouting 825 (120) 0.1893 (50) 825 (120) 0.0946 (25)
Tip grouting 1035 (150) 0.1136 (30) 1035 (150) 0.0378 (10)
Table 3-3. Material properties used in PLAXIS
Parameter Sand Pile
E (kPa) - 2.48 x 10⁷
E50ref (kPa) 3.69 x 10⁴ -
Eoedref (kPa) 3.69 x 10⁴ -
Eurref (kPa) 1.108 x 10⁵ -
Pref (kPa) 100 -
γunsat (kN/m3) 16 25
γsat (kN/m3) 19 -
Friction angle, 31 -
Dilation angle, ψ 0 -
Poisson’s ratio, 0.25 0.15
Power, m 0.5 -

86
Table 3-4. Measured and predicted grout pressures for 2.44 m long piles
Side grouting
Tip grouting top bottom
Measured Pressure(kPa) 550 825 1035
Yu and Houlsby’s solution (kPa) 385 720 1450
Salgado and Randolph’s chart (kPa) 445 760 1620
FEM (kPa) 345 620 1200
PMT (kPa) 415 520 --
Table 3-5. Side resistance prediction
Pile width (m)
Pile length H(m)
Initial vertical eff. stress at H/2
’vo (kPa)
Kg at H/2
(Fig. 3-11)
Grouted vert. eff. stress
’vg=Kg ’vo at H/2 (kPa)
c
fs (kPa) (Eq. 3-2)
Bulb Diameter,
Df (m)
Surface Area,
As (m2)
Side Resistance,
Qs (kN)
0.153 2.44 23.7 2.15 51 31o 46.4 0.38 2.9 135
0.203 2.44 23.7 2.15 51 31o 46.4 0.51 3.91 180.8
0.406 6.1 52.7 1.5 79 31o 68 0.914 17.52 1191.4

87
Table 3-6. Estimation of required jet pipe diameter
Pile width
D (cm)
Pile length l (m)
Soil Type
Grain size d50 (mm)
Permeability k (m/day)
Discharge Q (m3/hr)
Velocity V (m/s)
Jet pipe area A = Q/V (mm2)
Jet Pipe Diameter (mm)
71.1 4.57 A3 0.17 a 11.23 b 82.3 c 5
d 4572 76.2
a from grain size analysis b for A3 soil, Smith and Bloomquist (2010) c using Equation (2-1) d Tsinker (1988)
Table 3-7. Comparison of measured and predicted grout pressures
Top membrane Bottom membrane
Pile 1 Pile 2 Pile 1 Pile 2
Measured Maximum Pressures (kPa) 690-830 620-690 966-1103 1240-1380
Yu and Houlsby’s (1991) solution (kPa) a, b 497 497 960 960
Salgado and Randolph’s chart (kPa) a, b 697 697 1200 1200
PMT (kPa) 780c 560 c 1366d 1020d
a c = 29o, ψ = 0o & υ = 0.3, Dr = 40% b Corresponds to the middle of top membrane = 1.98 m and middle of bottom membrane = 4.27 m c At a depth of 2.6 m d At a depth of 4.9 m

88
Table 3-8. Comparison of the measured and predicted tip grout pressures
Pile 1 Pile 2
Measured tip grout pressure (kPa) 2000 2206
Yu and Houlsby’s (1991) solution (kPa) 2193 2193
Salgado and Randolph’s (2001) chart (kPa) 2900 2900
Table 3-9. Limiting velocity suggested by AASHTO Designation R8-81
Type of situation Limiting velocity,
mm/s (in/s)
Historical sites or other critical locations 2.54 (0.1)
Residential buildings, plastered walls 5.08 - 7.6 (0.2 - 0.3)
Residential building in good repair with gypsum board walls 10.16 – 12.7 (0.4-0.5)
Engineered structures, without plaster 25.4 – 28.1 (1.0-1.5)
Source: AASHTO Designation R8-81
Table 3-10. Side resistance prediction for field jetted and grouted pile
Grout zone
Depth to center, H (m)
’vo at H, (kPa)
Kg at H (Fig. 3-11)
’vg=Kg
’vo (kPa)
c
fs (kPa) (Eq. 3-2)
Bulb Diameter (m)
Surface Area (m2)
Side Resistance (kN)
Top 1.98 33 1.8 59.4 29o 49 1.1634 7.80 382.2
Bottom 4.27 62 1.35 83.7 29o 69 1.1683 7.83 540.3
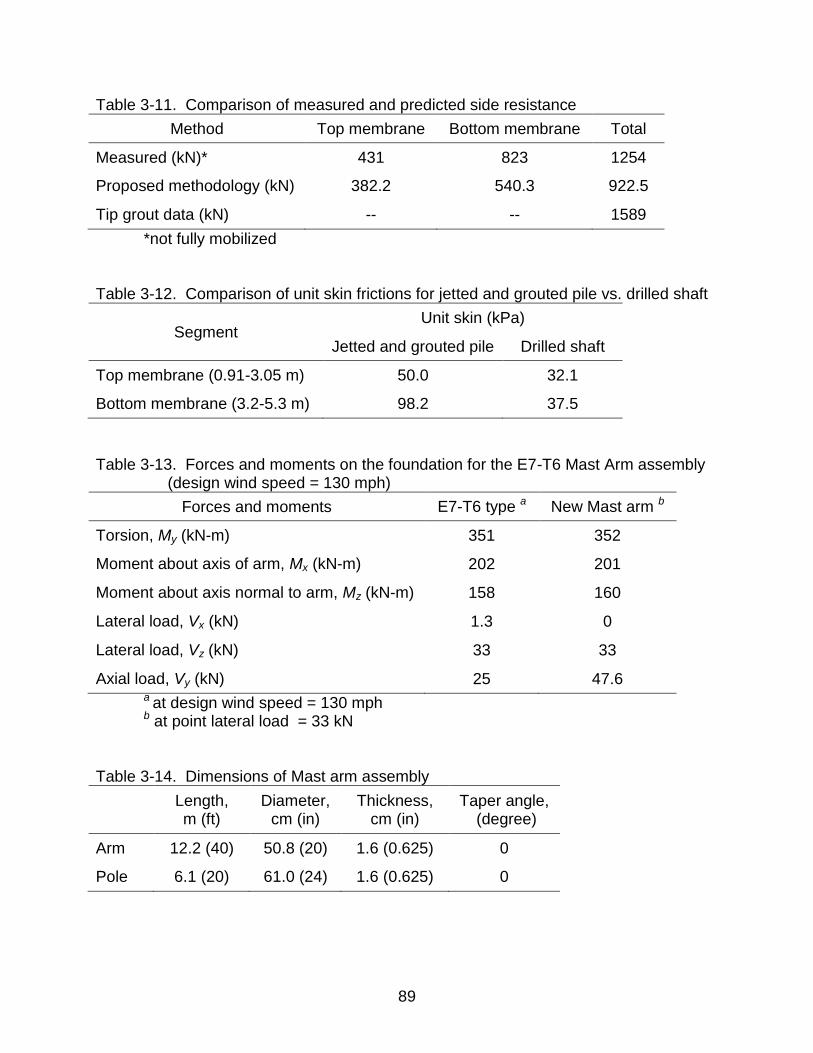
89
Table 3-11. Comparison of measured and predicted side resistance
Method Top membrane Bottom membrane Total
Measured (kN)* 431 823 1254
Proposed methodology (kN) 382.2 540.3 922.5
Tip grout data (kN) -- -- 1589
*not fully mobilized
Table 3-12. Comparison of unit skin frictions for jetted and grouted pile vs. drilled shaft
Segment Unit skin (kPa)
Jetted and grouted pile Drilled shaft
Top membrane (0.91-3.05 m) 50.0 32.1
Bottom membrane (3.2-5.3 m) 98.2 37.5
Table 3-13. Forces and moments on the foundation for the E7-T6 Mast Arm assembly (design wind speed = 130 mph)
Forces and moments E7-T6 type a New Mast arm b
Torsion, My (kN-m) 351 352
Moment about axis of arm, Mx (kN-m) 202 201
Moment about axis normal to arm, Mz (kN-m) 158 160
Lateral load, Vx (kN) 1.3 0
Lateral load, Vz (kN) 33 33
Axial load, Vy (kN) 25 47.6 a at design wind speed = 130 mph b at point lateral load = 33 kN
Table 3-14. Dimensions of Mast arm assembly
Length, m (ft)
Diameter, cm (in)
Thickness, cm (in)
Taper angle, (degree)
Arm 12.2 (40) 50.8 (20) 1.6 (0.625) 0
Pole 6.1 (20) 61.0 (24) 1.6 (0.625) 0

90
Table 3-15. Forces and moments on the pile under maximum lateral load (54 kN)
Forces and moments Magnitude
Torsion, My (kN-m) 577.6
Moment about axis of arm, Mx (kN-m) 330
Moment about axis normal to arm, Mz (kN-m) 160
Lateral load, Vx (kN) 0
Lateral load, Vz (kN) 54
Axial load, Vy (kN) 47.6
Table 3-16. Comparison of mobilized and predicted (ultimate) torsional resistance
Method Magnitude
Measured (kN-m)* 577.6
Proposed methodology (kN-m) 500
Tip grout data (kN-m) 896
*not fully mobilized

91
Figure 3-1. FDOT’s test chamber and reaction shafts, Coastal Engineering lab, UF
(Photo courtesy of author, Sudheesh Thiyyakkandi)
Figure 3-2. Earth pressure cells in the test chamber (Photo courtesy of author,
Sudheesh Thiyyakkandi)

92
Figure 3-3. Grain size distribution of test soil
Figure 3-4. Expansion pressure vs. volume curves from Pressuremeter tests
0
10
20
30
40
50
60
70
80
90
100
0.01 0.1 1 10
Pe
rce
nta
ge P
as
sin
g (
%)
Grain Size (mm)
0
100
200
300
400
500
600
0 10 20 30 40 50 60 70 80 90 100
Pre
ss
ure
(kP
a)
Volume (cm3)
Depth = 0.91 m
Depth = 1.83 m

93
Figure 3-5. Residual horizontal stress variation with time near grouted pile
Figure 3-6. Finite element discretization
0
25
50
75
100
125
150
175
200
0.01 0.1 1 10 100
resid
ual
ho
rizo
nta
l str
ess a
fter
gro
uti
ng
(kP
a)
no. of days after grouting
Depth = 1.83 m, 0.152 m away from 0.152 m pile
Depth = 2.36 m, 0.152 m away from 0.152 m pile
Depth = 1.83 m, 1.3 m away from 0.203 m pile
Pile
High resolution mesh close to pile
2.44 m (96 in)
Elastic zone (Loose grout)
Sand
Axis of symmetry
Chamber wall
1.83 m (72 in)
5.08 m (200 in)

94
Figure 3-7. FE mesh after the simulation of Jetted and grouted pile installation
Figure 3-8. Stress distribution with radial distance during tip grouting (spherical cavity
expansion)
0
200
400
600
800
1000
1200
1400
1 2 3 4 5 6 7
rad
ial s
tres
s (
kP
a)
Non-dimensional radial distance (r/a)
Analytical (Yu and Houlsby 1991)
Measured radial stress
Measured grout pressure
FEM

95
Figure 3-9. Radial displacement determined from the numerical simulation of side and
tip grouting of 0.203 m square pile
0
20
40
60
80
100
120
140
160
180
0 0.2 0.4 0.6 0.8 1 1.2 1.4 1.6 1.8 2
Rad
ial d
isp
lac
em
en
t (m
m)
Radial distance from the pile axis, m
Tip grouting
Side grouting of lower zone

96
Figure 3-10. Mohr’s circle at failure during axial loading
min
=’vg
N
Sh
ea
r S
tress,
fs
Failure shear stress
Failure Stress State, Failure Pole
Failure Plane
Failure Normal stress
max
c

97
Figure 3-11. Estimate of grout vertical stress coefficient, Kg
0
1
2
3
4
5
6
7
8
9
10
0.5 1.0 1.5 2.0 2.5 3.0 3.5
Dep
th (
m)
Kg (dimensionless)
FE analysis
FE analysis
FE analysis
From pressure cell data
Back calculated from pile's unit skin friction
ϕc= 31o 33o 35o
(ϕc= 31o)
(ϕc= 33o)
(ϕc= 35o)

98
Figure 3-12. Comparison of load-displacement curves for 0.152 m square pile
Figure 3-13. Comparison of load-displacement curves for 0.203 m square pile
0
50
100
150
200
250
300
350
0 5 10 15 20 25 30
Lo
ad
(kN
)
Displacement (mm)
Experimental
Proposed methodology
FEM
0
100
200
300
400
500
600
0 5 10 15 20 25 30 35
Lo
ad
(kN
)
Displacement (mm)
Experimental
Proposed methodology
FEM

99
Figure 3-14. Comparison of load-displacement curves for 0.406 m square pile
Figure 3-15. Layout of test piles and drilled shaft along with reaction drilled shafts
0
500
1000
1500
2000
2500
3000
3500
4000
4500
0 5 10 15 20 25 30 35
Lo
ad
(kN
)
Displacement (mm)
Experimental (Lai et al. 2010)
Proposed methodology
FEM
11 m (36 ft) 11 m (36 ft) 11 m (36 ft)
Reaction drilled shafts
Test drilled shafts
Jetted and grouted piles

100
Figure 3-16. SPT blow count (N) profiles and the Unified Soil Classification (USC) at the location of test piles and drilled
shaft

101
Figure 3-17. Typical grain size distributions for the silty sand at the site
Figure 3-18. Expansion pressure-volume curves from Pressuremeter tests
0
10
20
30
40
50
60
70
80
90
100
0.01 0.1 1 10
Pe
rce
nta
ge
pa
ss
ing
(%
)
Grain size (mm)
0
200
400
600
800
1000
1200
1400
1600
0 20 40 60 80 100
Pre
ss
ure
(kP
a)
volume (cm3)
Pile 1: 2.6 m depth
Pile 2: 2.6 m depth
Pile 1: 4.9 m depth
Pile 2: 4.9 m depth

102
Figure 3-19. Schematic diagram of jetted and grouted pile
Strain gages

103
Figure 3-20. Grout delivery and jetting systems
Figure 3-21. Reinforcing cage with grout delivery and jetting systems (Photo courtesy
of author, Sudheesh Thiyyakkandi)
Top Middle Bottom
Strain gage
Grout delivery system Jetting system

104
Figure 3-22. Concrete placement for one of the precast piles (Photo courtesy of author,
Sudheesh Thiyyakkandi)
Figure 3-23. Preparation of pile for jetting (Photos courtesy of author, Sudheesh
Thiyyakkandi)
a) Flushing each grout delivery systems
b) Attaching side grout membranes
d) Testing of nozzles c) Attaching nozzles

105
Figure 3-24. Pile jetting (Photo courtesy of author, Sudheesh Thiyyakkandi)
Figure 3-25. Schematic of precast concrete cap – pile connection
High pressure jet pump
Water tanker
Hydraulic pump for water
recirculation
Temporary casing

106
Figure 3-26. Longitudinal and cross-section view of concrete cap with reinforcement
details

107
Figure 3-27. Placement and grouting of precast cap (Photos courtesy of author, James
F Stephenson III)
Figure 3-28. Casting of cast-in place concrete cap (Photo courtesy of author, James F
Stephenson III)

108
Figure 3-29. Side grouting of piles (Photo courtesy of author, Sudheesh Thiyyakkandi)
Figure 3-30. Grout pressure-volume response during side grouting of pile 1
0
200
400
600
800
1000
1200
1400
0 0.2 0.4 0.6 0.8 1 1.2 1.4
Gro
ut
pre
ss
ure
(kP
a)
Grout volume (m3)
Pile 1 - top bag
Pile 1 - bottom bag
Grout mixing and pumping
Pile displacement and grout pressure monitoring

109
Figure 3-31. Grout pressure-volume response during side grouting of pile 2
Figure 3-32. Grout pressure-volume response during tip grouting
0
200
400
600
800
1000
1200
1400
1600
0 0.2 0.4 0.6 0.8 1 1.2 1.4
Gro
ut
pre
ss
ure
(kP
a)
Grout volume (m3)
Pile 2 - top bag
Pile 2 - bottom bag
0
500
1000
1500
2000
2500
3000
0 0.1 0.2 0.3 0.4 0.5 0.6
Gro
ut
pre
ss
ure
(kP
a)
Grout volume (m3)
Pile 1 Pile 2

110
Figure 3-33. Grout pressure vs. pile head displacement during tip grouting
Figure 3-34. Instrumentation for noise and vibration measurement (Photos courtesy of
author, Sudheesh Thiyyakkandi)
0
500
1000
1500
2000
2500
3000
0 2 4 6 8 10 12 14 16
Gro
ut
pre
ss
ure
(kP
a)
Pile top displacement (mm)
Pile 1 Pile 2
Triaxial geophone Recorder
Microphone

111
Figure 3-35. Location of construction equipments and vibration and noise monitors

112
Figure 3-36. Noise measurement during pile jetting process
Figure 3-37. Noise measurement during side grouting
40
50
60
70
80
90
100
110
120
0 2 4 6 8 10 12 14 16 18 20 22 24 26 28 30
No
ise
(d
BA
)
Distance from pile (m)
Pile1_during pile jetting
Pile2_during pile jetting
Impact pile driving (FHWA_RCNM)

113
Figure 3-38. Noise measurement during tip grouting
Figure 3-39. Peak particle velocity measurement during pile jetting
Figure 3-40. Peak particle velocity measurement during grouting
0
1
2
3
4
5
6
0 5 10 15 20 25 30
Pe
ak
part
icle
ve
loc
ity (
mm
/s)
Distance from pile (m)
Pile 1_during pile jetting
Pile 2_during pile jetting

114
Figure 3-41. Axial top down test on jetted and grouted pile (Photo courtesy of author,
Sudheesh Thiyyakkandi)
Wooden reference beam
Load cell
Dial gage
Mirrored scale
Hydraulic jack
Invar staff

115
Figure 3-42. Measured strain at different depths
Figure 3-43. Load-displacement response of the jetted and grouted pile
0
200
400
600
800
1000
1200
1400
1600
1800
0 1 2 3 4 5
Lo
ad
(kN
)
Displacement (mm)
Jet grouted pile-Top load
Jet grouted pile-Tip load
Jet grouted pile - Skin resistance

116
Figure 3-44. Load distribution along the pile

117
Figure 3-45. Lowering of reinforcing cage and concrete placement for test drilled shaft
(Photos courtesy of author, Sudheesh Thiyyakkandi)
Figure 3-46. Load distribution along the drilled shaft
Drilled shaft

118
Figure 3-47. Load-displacement response of drilled shaft
Figure 3-48. Comparison of axial response of jetted and grouted pile vs. drilled shaft
0
200
400
600
800
1000
1200
1400
1600
0 2 4 6 8 10 12 14 16
Lo
ad
(kN
)
Displacement (mm)
Top load
Tip load
Skin resistance
0
200
400
600
800
1000
1200
1400
1600
0 1 2 3 4 5
Lo
ad
(kN
)
Displacement (mm)
Jetted and grouted pile
Drilled shaft

119
Figure 3-49. Coordinate system used for representing forces and moments
Figure 3-50. Mast arm assembly fabricated for combined torsion and lateral load test
(Photo courtesy of author, Sudheesh Thiyyakkandi)
X
Z Y
Axis parallel to arm
Axis of pile
Pile
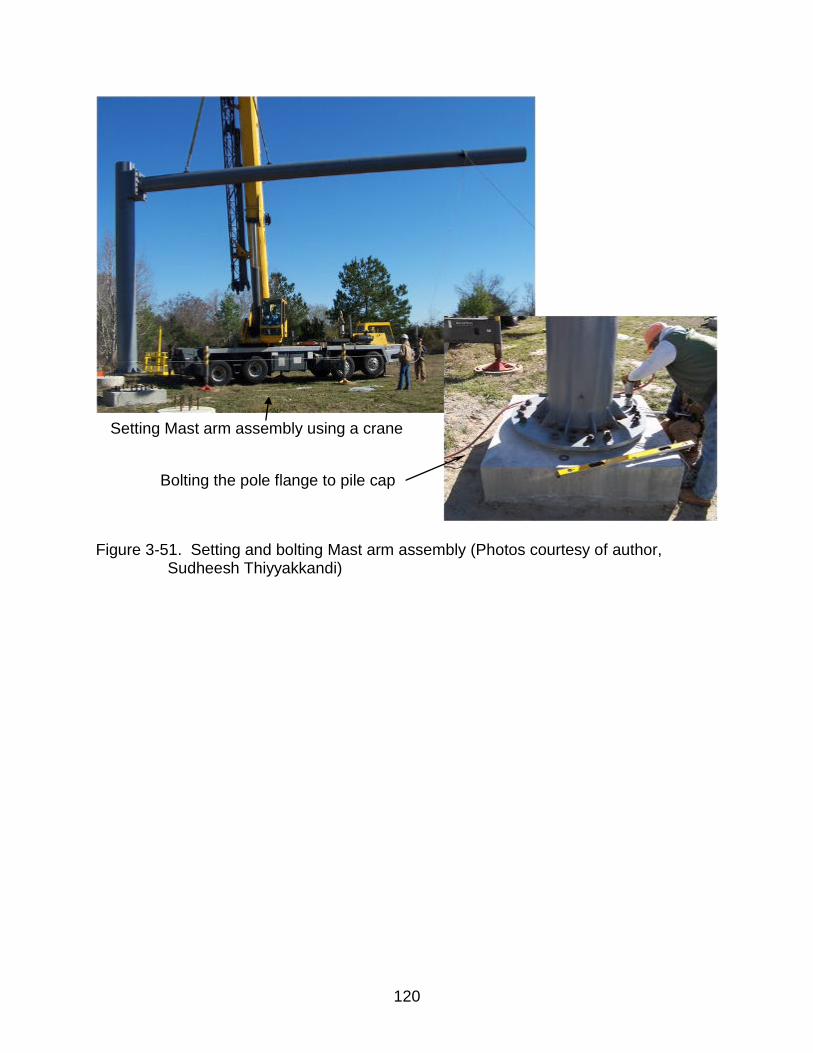
120
Figure 3-51. Setting and bolting Mast arm assembly (Photos courtesy of author,
Sudheesh Thiyyakkandi)
Bolting the pole flange to pile cap
Setting Mast arm assembly using a crane

121
Figure 3-52. Total Station for rotation and translation measurement (Photo courtesy of
author, Sudheesh Thiyyakkandi)
Total station
Pole
Top view
Axis of arm
Targets on pole

122
Figure 3-53. String pot arrangement (Photo courtesy of author, Sudheesh
Thiyyakkandi)
4 String pots in each level (total: 2 x 4 = 8)
Mast arm Side view

123
Figure 3-54. Digital dial gage placement (Photo courtesy of author, Sudheesh
Thiyyakkandi)
Dial gages
Wooden frame
Pole

124
Figure 3-55. Application of lateral load on the arm by pulling with a crane (Photo
courtesy of author, Sudheesh Thiyyakkandi)
Figure 3-56. Tension load cell for the load measurement (Photo courtesy of author,
Sudheesh Thiyyakkandi)

125
Figure 3-57. Torque vs. rotation response during combined torsion and lateral load test
Figure 3-58. Lateral displacement components during the load test
0
100
200
300
400
500
600
700
0 0.2 0.4 0.6 0.8 1 1.2 1.4 1.6 1.8 2
To
rqu
e (
kN
-m)
Rotation (degree)
Using Total station data
Using string pot data
Using Dial gage data
x
y
Mast arm

126
Figure 3-59. Lateral load vs. resultant lateral displacement during combined torsion and
lateral load test
0
10
20
30
40
50
60
0 2 4 6 8 10 12 14 16 18 20
Late
ral lo
ad
(kN
)
Resultant lateral displacement (mm)
Using Total station data
Using Dial gage data

127
Figure 3-60. Torsional cracks and gaps after loading and unloading (Photos courtesy of
author, Sudheesh Thiyyakkandi)
After loading
Torsional cracks
Gap (0.75 in)
After unloading
Gap (0.125 in)
Torsional crack

128
CHAPTER 4 GROUP RESPONSE OF JETTED AND GROUTED PILES
This Chapter presents the experimental study carried out to investigate the group
behavior of jetted and grouted piles at typical 3D center-to-center spacing. The tests
were performed in the FDOT’s rigid wall test chamber (Figure 3-1) at the Coastal
Engineering Lab, University of Florida. Past studies have shown that the boundary
conditions and size of a test chamber may influence the soil stress and displacement
field around pile, tip resistance of a penetrating object (e.g., cone penetrometer), and
limit pressure of an expanding object (Meyerhof 1959, Kishida 1963, Robinsky and
Morrison 1964; Fahey 1980; Schnaid and Houlsby 1991; Salgado et al. 1998; Kraft
1991). The zone of influence around a pile during installation or axial loading is found to
be varied from 3 to 8 pile diameters depending on the soil density and installation
method (Meyerhof 1959, Kishida 1963, Robinsky and Morrison 1964). Randolph and
Wroth (1978) stated that under axial loading, the influence zone around pile will extent
radially about 0.9 – 1.4 times the pile length, depending on Poisson’s ratio and shear
modulus distribution with depth. According to Kulhawy et al. (1979), the boundary
influence is negligible when the chamber to pile diameter ratio is greater than 14. Kraft
(1991) reported that the zone of influence reaches the wall of the chamber when pile
length-to-diameter ratio is equal to or greater than 0.45 times the chamber-to-pile
diameter ratio. For a given chamber size, the boundary effect seems to be more
significant for dense sand than loose to medium sand (Schnaid and Houlsby 1991). In
view of that, it was decided to conduct the group tests in loose to medium dense state.
The size of the piles within the group was decided by considering boundary
constraints of the testing chamber and cylindrical cavity expansion limit pressure. Based

129
on the cavity expansion formulation of Yu and Houlsby (1991), a cylindrical expansion
ratio (pile radius to grout zone radius) of 2 is at least required to develop an expansion
pressure of about 80-85% of the limit pressure in the present soil state. To maximize the
capacity of jetted and grouted pile, the pile need to be grouted to the highest possible
grout pressures, which is equal to the cavity expansion limit pressures (McVay et al.
2009, Thiyyakkandi et al. 2012). Two groups were considered in the study; the first
group consisted of four 20.3 cm square 2.44 m long (8 in square x 8 ft. long) precast
piles with 40.6 cm (16 in) diameter side grout bulbs at 61 cm (3 x pile width) center-to-
center spacing; the second group was four 11.4 cm (4.5 in) diameter 2.44 m piles with
25.4 cm (10 in) diameter side grout bulbs. For the first group, the chamber boundary
was only 3.5 x bulb diameters (or 7 x precast pile widths) away from the piles, and
hence, the group capacity might be influenced by the boundary. However, for the
second group, the chamber boundary was about 6.25 x bulb diameters (or 15 x precast
pile diameters) away from the piles and hence will have lesser boundary influence. A
description of construction and testing of both groups is presented followed by an
analysis of the results.
4.1 Group Testing of Jetted and Grouted Piles
4.1.1 Soil Preparation in the Test Chamber
Typical Florida silty sand (A-2-4) used in the previous test chamber study of
jetted and grouted piles (Section 3.1) reported by McVay et al. (2009) was used as the
test soil in the group study. For all the tests, moisture content of the soil was in the
range of 5 to 9%. The test chamber was filled in layers (lifts) and the average thickness
of each lift was 0.46 m (1.5 ft). After placing the adequate quantity of soil through free

130
fall from the top of the chamber, each lift was compacted uniformly using a vibratory
plate compactor (Figure 4-1). Soil dry density for all the lifts measured using core cutter
method/nuclear density gage were in the range of 15.56 -16.25 kN/m3 (99 -103.5 lb/ft3).
Using the dry density values, the relative density of compacted soil layers for all the
tests were estimated to be in the range of 34 -54%. While filling the test chamber, a
number of earth pressure cells were placed vertically and horizontally at various
locations to measure the vertical and radial soil stress changes during the installation
and testing of piles/shafts (Figure 4-2).
4.1.2 Design and Construction of Precast Piles
The precast piles for the first group were traditional reinforced concrete
component with square cross-section (20.3 cm x 20.3 cm). Whereas the structural
section of the second group piles was 11.4 cm (4.5 in) steel pipe (6.35 mm thick) filled
with concrete. Size of grout distribution systems and jetting systems for the piles were
selected in conformity with Thiyyakkandi et al. (2012). The jetting system for square
piles (group 1) was made using 3.8 cm (1.5 in) steel pipes and that for 11.4 cm diameter
piles (group 2) were made using 2.5 cm steel pipes. The jetting system was also used
for tip grouting during the grouting phase. Two separate grout delivery systems were
designed for the top and bottom halves of each pile. In the case of 20.3 cm square
piles, side grout delivery systems made of 2.54 cm PVC pipes were embedded within
the pile section, running along the corners of the piles. While the side grout delivery
systems for 11.4 cm diameter piles were located outside the pile (welded to the pipe)
due to the limited space available inside the piles. Each of the grout pipes (entry and
exit) has a series of holes drilled into the PVC/steel pipes in pairs at 10 cm intervals. A
2.5 cm diameter gum rubber membrane (6.4 mm thick) covered each pair of holes.

131
Figures 4-3 and 4-4 shows the placement of the grout delivery systems and jetting/tip
grouting pipes for the precast piles of first and second group respectively. After
sufficient curing following casting of piles, water under pressure was flushed through
each grout system to ensure that the grout systems (i.e., top and bottom) were working
properly. Subsequently, semi-rigid membranes were attached to the upper and lower
portions of each pile as shown in Figure 4-5. Rubber nozzles were then attached to the
bottom of each jet pipe to reduce the cross sectional area of the pipe at tip (Figure 4-5).
4.1.3 Jetting of Precast Piles for Each Group
For each group, jetting of the piles into the test chamber was done one-by-one at
a time interval of 24 hours. Figure 4-6 shows the jetting of one of the group 1 precast
piles into the test chamber. A sufficient time interval (24 hours) was used between the
jetting to allow water to percolate to a greater depth, and thus eliminate the quick
condition created in the chamber due to the previous jetting. The water for jetting was
supplied at flow rate of 0.25 m3/minute and a pressure of 415 kPa. The piles, generally
penetrated the soil under its own weight, but were guided to its final group position by
hand. Approximately 4 to 5 minutes of jetting was required to install the piles to the
required depth. Any water accumulated at the top of the chamber was pumped out and
the water level in the test chamber was continuously monitored and pumped out of the
PVC pipes located against the chamber wall to maintain a constant water table.
4.1.4 Side Grouting of the Piles
After jetting of all the piles for each group and ensuring that the water level in the
test chamber was well below the pile tip, side grouting of the piles was initiated (Figure
4-7). Top zone of all the piles in a group was grouted first. Grouting of the bottom zones
were performed after hydration of the top grout zones. Volume of grout pumped and

132
maximum sustained grout pressure observed for both top and bottom bag grouting of all
the piles are given in Table 4-1.
4.1.5 Static Top Down Test Prior to Tip Grouting
Static top down test was performed on the side grouted pile groups (prior to tip
grouting) to separate skin resistance of pile group from the total axial capacity. Figure 4-
8 displays the test setup for the group load test. As shown from the Figure 4-8, the test
setup consisted of load cells of 890 kN (200 kips) capacity on each pile to measure load
distribution, a test frame, a hydraulic jack, another load cell of 2669 kN (600 kips)
capacity to measure total load, a reaction beam with a support system, and the
displacement monitoring instrumentation. In case of group 1, the vertical displacement
of individual piles was monitored using digital levels and invar staffs, Figure 4-9. While
for group 2, pile displacement was measured using digital dial gages. Soil deformations
at the center of group and at different radial distances towards the chamber were also
monitored using digital dial gages to investigate group effect. The tests were continued
until the full mobilization of skin resistance, which was ensured from the DeBeer’s log-
log plot of load versus displacement for each of the shafts. The applied load
corresponding to the change in slope on the log-log plot was considered as the ultimate
skin resistance of each side grouted pile because the load transferred through pile tip
prior to the slope change was insignificant as identified from the earth pressure cells
installed directly below piles tips (negligible soil stress change).
4.1.6 Tip Grouting of the Piles
After the top down compression test of the groups, tip grouting of each pile in a
group was carried out individually. Grouting of each pile was stopped when the top of
each pile moved upward approximately by 6.35mm (i.e., full mobilization of side

133
resistance). Tip grouting data of piles in each group is also given in Table 4-1. Note that
the observed maximum sustained grout pressures and grout volumes were in the same
range for all the piles in each group.
4.1.7 Static Top Down Test After Tip Grouting
Following tip grouting, top down load testing was conducted on each group to
estimate the total axial capacity. The load test setup was the same as that for the group
tests prior to tip grouting. Besides the load – displacement response of piles, soil
deformations in the vicinity of group were also monitored during group loading.
4.1.8 Excavation of Jetted and Grouted Pile Groups
Shown in Figure 4-10 are the jetted and grouted pile groups after excavation.
Each pile in the group appears to possess good quality grout zones. In case of group 1,
the diameter of the upper side grout bulb varied from 27.5 to 47.5 cm along the pile, and
the diameter of the lower side grout bulb varied from 30 to 45 cm along the pile. The
diameter of all side grout bulbs for group 2 was in the range of 24-26 cm as expected.
Tip grout bulbs were nearly spherical (Figure 4-10 and 4-11) with diameter in the range
of 37- 48 cm for group 1 and 28-30 cm for group 2.
4.2 Analysis of Experimental Jetted and Grouted Pile Group Behavior
This section analyzes the results obtained from the experimental study and
discusses the group behavior of the piles. Table 4-2 presents the highest horizontal
stress change measured near chamber boundary for group 1 during grouting and group
load test. The maximum soil deformations observed near chamber boundary during
group load tests were 3.3 mm and 0.64 mm for group 1 and 2 respectively. These soil
stress and deformation measurements indicate that there was some boundary effect in
the case of Pile group 1. For group 2, the measured soil deformation near the chamber

134
wall was negligible (0.64 mm) compared to group 1, which is due to the fact that the
chamber boundary for group 2 was 6.25 x bulb diameters away from the piles
(approximately double of group1). Therefore, the boundary effect in group 2 was
assumed to be insignificant.
Figure 4-12 presents the total load versus average displacement of pile group 1
and individual response of each pile in the group during the load test performed prior to
tip grouting. Even though the distribution of applied load was non-uniform as shown in
Figure 4-12, the vertical displacements of piles were relatively uniform. Similar response
was observed for group 2 also. Moreover, for both groups, the soil deformation at the
center of group was nearly same as the average displacement at the pile heads for
each load increment. These observations suggested that the load has been transferred
through shear within the group and the group acted as a single block during. By plotting
load-displacement response of groups in log-log scale (DeBeer’s method), it was found
that skin resistance of group 1 was at least 302 kN (68 kips) and that of group 2 was
approximately 196 kN (44 kips). Vertical stress measurement beneath pile group
showed negligible stress increase prior to slope change on DeBeer’s plot, which
suggests that the entire applied load was carried as skin resistance.
Shown in Figures 4-13 and 4-14 are the loads - displacements curves from the
top down testing of group 1 and 2 respectively after tip grouting. It is evident from the
shape of the curves that significant end bearing was mobilized for the group response.
Ground surface crack observed around group during axial loading as shown in Figure 4-
15 indicates that the shearing occurred around group but not around individual piles.
For both groups, the displacements of piles and the soil deformation within the group

135
were relatively uniform during loading (Figures 4-13, 4-14, 4-16 and 4-17). These
observations suggest the block behavior of the groups during top down loading. Outside
the groups, soil deformation was found to diminish quadratically with increase in
distance from the group boundary as displayed in Figures 4-16 and 4-17.
Horizontal stress measurement around piles during the axial load test (Figure
4-18) indicated that the stress decreased with an increasing axial load until the full
mobilization of skin resistance (5 load steps), and then, increased with an increase in
applied load. During the unloading phase (Figure 4-18), the lateral stress always
decreased. It is believed that the decrease in lateral stress during skin resistance
mobilization was due to the rotation of the origin of planes or pole such that the failure
plane aligns in the vertical direction (Thiyyakkandi et al. 2012).
Shown in Figure 4-19 is the variation of vertical stress below (0.61 m) the center
of the group footprint and one of the piles during the top down load testing of group 1
before tip grouting. Similarly, Figure 4-20 shows the same during the load test after tip
grouting. Of interest is the increase in stress at the center of the pile group versus the
edge (West pile) in both cases, supporting the superposition (overlap) of stresses from
the adjacent piles. Similar stress variation was observed in group 2 load tests also.
The experimental study of jetted and grouted pile groups suggested a significant
increase in both densification of soil around the piles with an increase in the horizontal
stress (σh) and shear modulus of soil in close proximity of the piles. Consequently, the
pile has a much higher ultimate side resistance compared to traditional driven
piles/drilled shafts. In the case of a jetted and grouted piles installed in a group, the side
grouting of adjacent piles increased the confining stress and shear modulus of the soil

136
confined within the group. So the soil within the footprint of the group underwent much
smaller shear strains and the pile-soil mass behaved as a rigid body. However, outside
the footprint of the jetted and grouted pile group, the horizontal (radial) stresses
dissipated quadratically, and the soil’s shear modulus also diminished quadratically.
Therefore, the grouted pile group failed as a block (i.e., uniform movement) within the
group, but quadratically outside the group under axial loading. The vertical side capacity
of the group may be obtained by multiplying the shear stress on the surface of any
single jet-grouted pile with the surface area of the block (i.e., block perimeter of the
group the length of the pile). In the case of the group tip resistance, grouting of the
individual piles developed spherical cavity expansion stresses around each pile, as well
as densification of soil (i.e., increased shear modulus) between the bulbs (primarily
within the group foot print) through displacement of the soil in the radial direction.
Consequently, when the group was loaded, the stresses from each pile transferred to
the center of the group (i.e., superposition) resulting in higher stresses at the pile group
center (Figures 4-19 and 4-20) and block tip resistance (group foot print area unit tip
resistance) under axial top down loading developed.
Figure 4-21 depicts the comparison of group response before and after tip
grouting of group 1. A higher initial slope of curve in load test 2 (grouped pile tips)
versus test 1 (grouted pile sides only) is due to initial mobilization of the end bearing
during the mobilization of skin resistance.

137
4.3 Predicted Axial Response of Jetted and Grouted Pile Groups
4.3.1 Skin Resistance of the Groups
Since the piles act as a block during axial loading, the total side resistance of the
group can be estimated by multiplying the unit skin friction with the surface area of the
block. Unit skin resistance of a single jetted and grouted pile can be estimated using the
Equation 3-2. Table 4-3 presents the prediction of the average ultimate unit skin friction
(fs) and side resistance (Qs) of the single jetted and grouted piles and the groups using
Equations 3-2 and 3-3, and Figure 3-11. The unit skin friction at a depth equal to the
embedment depth of the piles was first determined using Kg plot (Figure 3-11) and unit
skin friction equation (Equation 3-2). Then, the average skin friction along the pile was
determined by the assuming a linear variation of skin friction with depth. Side resistance
of the individual piles and the groups were obtained by multiplying the average unit skin
friction with the pile surface area and the block surface area respectively. It can be seen
from the Table 4-3 that that the group shear resistance is less than the sum of individual
shear resistances, which is attributed to the reduced block surface area of the group
versus the sum of the individual pile surface areas.
Tip grout pressure can also be used to estimate skin resistance of individual
piles. The ultimate axial skin friction of a pile should be equal to the tip grout pressure
times an effective tip area. In case of square pile, effective area is assumed as the area
of circle with diameter equal to the diagonal distance of precast pile. Whereas for the
circular pile, the effective tip area used in the calculation was the area of the bottom
plate (Figure 4-5) used to hold bottom end of side grout membrane. Table 4-4 provides
a comparison of the skin resistance of single pile predicted using the tip grout pressure

138
with that predicted by the proposed method (Equation 3-2) and is evident that the
predictions matched reasonably well.
4.3.2 Load – Displacement Response of the Groups
The load-displacement prediction approach suggested for single jetted and
grouted piles described in Section 3.3.3 was used here to predict the load-displacement
response of the groups. Table 4-5 lists the various parameters used for the prediction.
Note that r0 and R0 values used in the prediction was the equivalent radius of the block
(i.e., equivalent radius of group footprint). Shear modulus of the soil was obtained using
the equation suggested by Randolph et al. (1994) for pile design:
(4-1)
Where, pa is atmospheric pressure (100 kPa), p’ is the mean effective stress, and
S is a constant that decreases from 400 to 75 as the silt content increases from 5 % to
15 % (Randolph et al. 1994).
The surface area of the block was used for estimating total side resistance of the
group and the effective block footprint area was used for estimating ultimate tip
resistance (Qf). Total axial load-displacement response of groups was then obtained
from the combination of the T-Z response and Q-Z response. Shown in Figures 4-22
and 4-23 are the predicted and measured load-displacement responses of the group 1
and group 2 respectively. The predicted group load-displacement curves were in good
agreement with the measured load-settlement responses.

139
Table 4-1. Jetted and grouted piles grouting data
Group Pile ID Grout pressure, kPa Grout volume m3 (gal)
Top bag a Bottom bag a Tip Top bag Bottom bag Tip
PG1
S 517 827 1517 0.090 (24) 0.094 (25) 0.079 (21)
N 483 827 1724 0.088 (23.5) 0.094 (25) 0.064 (17)
W 413 896 1655 0.086 (23) 0.094 (25) 0.079 (21)
E 448 862 1793 0.090 (24) 0.094 (25) 0.071 (19)
PG2
W 345 827 1689 0.043 (11.5) 0.043 (11.5) 0.019 (5)
E 345 759 1724 0.043 (11.5) 0.043 (11.5) 0.019 (5)
S 358 1034 1862 0.043 (11.5) 0.043 (11.5) 0.023 (6)
N 393 1034 2138 0.043 (11.5) 0.043 (11.5) 0.026 (7) a
After deducting the pressure lose in grout distribution system (138 kPa) from the measured pump pressure
Table 4-2. Highest horizontal soil stress increase near chamber boundary during grouting and group load test
Stage Stress change Measurement point elevation
Side grouting 54 kPa Middle of bottom bag
Tip grouting 58 kPa Pile tip
Group load test 24 kPa Pile tip

140
Table 4-3. Side resistance prediction for single piles and groups
Group
Initial vertical
eff. stress at embedment
depth(H),
’vo (kPa)
Kg at H
(Fig.3-11)
Grouted vert.
eff. stress at H
’vg=Kg ’vo
(kPa)
c
Unit skin at H, fsH
(kPa) (Eq. 3-2)
Ave.
skina
fs=fsH/2
(kPa)
Bulb Diameter
Df (m)
Surface Area, As (m
2)
Side Resistance,
Qs (kN)
Single Group
Single Group
Group 1 42 1.67 70.14 31o 63.85 31.925 0.406 3.11 9.06
99.3 298.2
Group 2 42 1.67 70.14 31o 63.85 31.925 0.254 1.946 5.29
62.1 168.9
a
Assuming linear variation of unit skin friction with depth
Table 4-4. Comparison of individual skin resistance prediction using the tip grout pressure and the proposed method
Group Ave. tip grout
pressure, qg (kPa) Effective tip
area, A (cm2) Individual pile skin
resistance = qg.A /104 (kN) Predicted skin resistance
using Eq. 3-2 (kN)
Group 1 1672 648.4 108.4 99.3
Group 2 1853 366.1 67.8 62.1

141
Table 4-5. List of parameters used for the group load-displacement prediction
Parameters Group 1 Group 2
r0 (cm) 57.4 33
R0 (cm) 57.4 33
L (cm) 2.44 2.44
0.25 0.25
GL/2 (kPa)a
12531 12531
G tip (kPa) a
17734 17734
τmax b 31.925 31.925
PL (kPa) c 1450 1450
Rf 0.99 0.99
Rt 0.99 0.99
Block tip area, Ablock (m2) 0.9968 0.3424
a
Using Equation 4-1 b Using Equation 3-2 c Using the solution of Yu and Houlsby (1991)
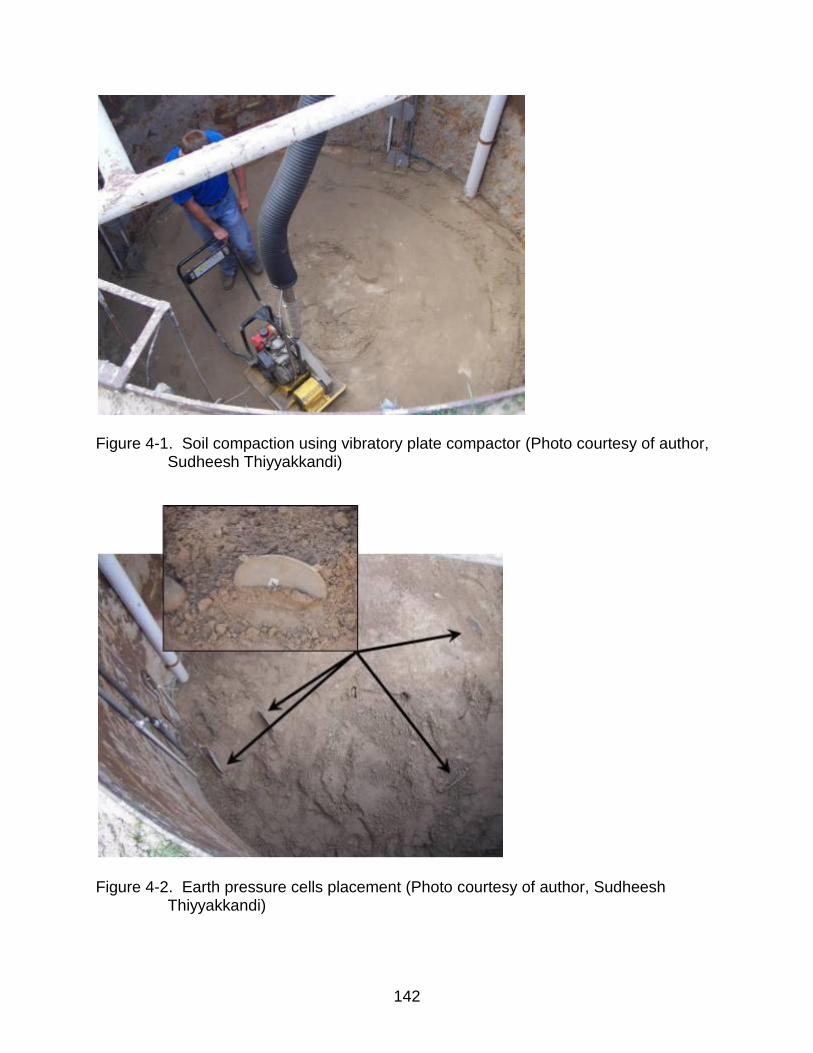
142
Figure 4-1. Soil compaction using vibratory plate compactor (Photo courtesy of author,
Sudheesh Thiyyakkandi)
Figure 4-2. Earth pressure cells placement (Photo courtesy of author, Sudheesh
Thiyyakkandi)

143
Figure 4-3. Reinforcing cages with grout delivery and jetting systems for group 1
piles(Photos courtesy of author, Sudheesh Thiyyakkandi)

144
Figure 4-4. Reinforcing cages with grout delivery and jetting systems for group 2
piles(Photos courtesy of author, Sudheesh Thiyyakkandi)

145
Figure 4-5. Attachment of semi-rigid membranes and typical rubber nozzle used
(Photos courtesy of author, Sudheesh Thiyyakkandi)

146
Figure 4-6. Pile during jetting (Photo courtesy of author, Sudheesh Thiyyakkandi)
Figure 4-7. Side grouting of pile in group 2 (Photo courtesy of author, Sudheesh
Thiyyakkandi)

147
Figure 4-8. Load test setup for jetted and grouted pile group (Photo courtesy of author,
Sudheesh Thiyyakkandi)
Figure 4-9. Digital levels and invar staffs used for pile displacement monitoring (Photos
courtesy of author, Sudheesh Thiyyakkandi)

148
Figure 4-10. Jetted and grouted pile groups after excavation (Photos courtesy of
author, Sudheesh Thiyyakkandi)
Figure 4-11. Views of a tip grout bulb (group 1) (Photos courtesy of author, Sudheesh
Thiyyakkandi)

149
Figure 4-12. Load-displacement response of group 1 prior to tip grouting
Figure 4-13. Load-displacement response of group 1 after tip grouting
0
50
100
150
200
250
300
350
0 1 2 3 4 5
Lo
ad
(kN
)
Displacement (mm)
North Pile
South Pile
West Pile
East Pile
Total load vs ave. pile displacement
Total load vs soil deformation at group center

150
Figure 4-14. Load-displacement response of group 2 after tip grouting
Figure 4-15. Ground surface crack around group during axial loading (Photo courtesy of author, Sudheesh Thiyyakkandi)

151
Figure 4-16. Soil deformation profile (group 1 load test)
Figure 4-17. Soil deformation profile (group 2 load test)
Group boundary
Group boundary

152
Figure 4-18. Typical variation of horizontal stress around pile during axial load test
Figure 4-19. Vertical stress variation below the center of the group footprint vs. beneath
pile during the top down load test before tip grouting
0
5
10
15
20
25
30
35
40
45
0 50 100 150 200
Ho
rizo
nta
l s
tres
s (
kP
a)
Time (min)
North (1.22 m depth 0.46 m away from pile)
East (1.22 m depth 0.46 m away from pile)
South (1.22 m depth 0.46 m away from pile)
West (1.22 m depth 0.46 m away from pile)
0
10
20
30
40
50
60
0 50 100 150 200 250
Ve
rtic
al s
tres
s (
kP
a)
Time (min)
Below center of group footprint
Below west pile

153
Figure 4-20. Typical vertical stress variation below the center of the group footprint vs.
beneath pile during the top down load test after tip grouting
Figure 4-21. Comparison of group response before and after tip grouting of group 1
0
100
200
300
400
500
600
700
800
0 50 100 150 200 250
Ve
rtic
al s
tres
s (
kP
a)
Time (min)
Below center of group footprint
Below west pile
0
200
400
600
800
1000
1200
0 10 20 30 40 50 60
To
tal lo
ad
(kN
)
Average pile displacement (mm)
Group test before tip grouting
Group test after tip grouting

154
Figure 4-22. Predicted and measured load –displacement response of group 1
Figure 4-23. Predicted and measured load –displacement response of group 2
0
200
400
600
800
1000
1200
1400
0 10 20 30 40 50 60
Lo
ad
(kN
)
Displacement (mm)
Predicted
Measured
0
100
200
300
400
500
600
700
800
900
0 5 10 15 20 25 30 35 40
Lo
ad
(kN
)
Displacement (mm)
Predicted
Measured

155
CHAPTER 5 GROUP RESPONSE OF POST GROUTED DRILLED SHAFTS
This Chapter focuses on the experimental investigation of group behavior of
grout-tipped drilled shaft groups. To minimize the chamber wall effects, small diameter
shafts (21.6 cm or 8.5 in) were chosen for the group study of PGDS. Two different
lengths to diameter ratio (L/D ≈ 11 and 18) were considered to compare the group
behavior at different embedment depths. The first group considered for the study was
the group of four 0.216 m diameter x 2.44 m long (8.5 in diameter 8 ft long) drilled
shaft (L/D ~11) at 3D c/c spacing. The objective of the first group test was to study the
influence of preloading, and tip bulb area on the axial capacity of grout-tipped drilled
shaft as well as study the grout flow pattern, and estimate the axial group efficiency of
tip grouted shafts at 3D spacing.
The second group chosen for the study was the four 0.216 m diameter x 3.96 m
long (8.5 in diameter 13 ft long) drilled shaft (L/D ~18) group at 3D c/c spacing. The
intent of the latter test was to validate the results obtained from the first group test at
greater embedment depths and investigate the effectiveness of staged grouting in
increasing the capacity of post grouted drilled shafts. In both group tests, the chamber
boundary was about 6.5 diameters away from the shafts, which only satisfies some of
the zone of influence criteria discussed in Chapter 4. Hence there may be small
boundary effects during the installation and axial group tests, which could be quantified
from the stress and deformation measurement near the test chamber wall. A description
of various stages of the experimental investigation, the data measured, as well as
analysis of the results, is presented.

156
5.1 Group Testing of Post Grouted Drilled Shafts
5.1.1 Soil Preparation for Group Tests
Again FDOT’s test chamber at Coastal Engineering lab, UF, was used for the
group study of post grouted drilled shafts in cohesionless soils. Soil used in the study
was the same soil (typical Florida silty sand) used in the individual and group study of
jetted and grouted piles. The moisture content of the soil was in the range of 5 to 9%.
In order to eliminate the drilling and difficulties associated with installing the shaft,
the temporary PVC casings at 3 x shaft diameter center-to-center spacing were
positioned in the test chamber before soil placement. This also ensured the verticality of
the shafts and allowed the placement of earth pressure cells in close proximity to the
shafts. Figure 5-1 presents the placement of PVC casings before filling the test
chamber. The method of soil placement was the same as that for the group testing of
jetted and grouted piles. Core cutter method and nuclear density gage were used to
determine the soil dry density for all the lifts and found to be in the range of 15.7-16
kN/m3 (99.9 -102lb/ft3). Figure 5-2 shows the test chamber in fully filled state.
5.1.2 Fabrication of the Reinforcing Cage and Tip Grout System for Drilled Shafts
Area of steel reinforcement for the drilled shafts was calculated according to
building code requirements for structural concrete (ACI 318-08). The reinforcing cage
consisted of five- #5 rebars as longitudinal reinforcement and #3 rebars at 0.3 m
spacing for shear reinforcement. Shown in Figure 5-3 is the reinforcing cage and grout
distribution system for the drilled shafts.
The grout distribution system used for the study was a sleeve port apparatus
(tube-a-Manchette) with a steel plate and a scuff ring (15 cm in diameter and 10 cm
long) welded to the bottom of a reinforcement cage (Figure 5-3), which is typical

157
practice in the Southeastern United States (Dapp et al. 2006 ). The sleeve port
apparatus consisted essentially of a pipe network at the shaft tip with pre-drilled holes
wrapped in gum rubber tubes. The principal advantages of the apparatus were to
facilitate grout distribution and the feasibility of cleaning, or removing the grout in the
pipe network for later re-grouting of the shaft, if necessary. The gum rubber tubes
allowed the grout to exit the pipe network at minimum grout pressure, 103-138 kPa (15-
20 psi), and prevented the loss of water when cleaning the pipes at smaller pressures.
The minimum grout pressure was obtained by testing the grout system with pressurized
water. The bottom of the scuff ring was covered with an ultra-soft polyurethane
membrane, which protected the sleeve port apparatus during casting of the shaft.
Construction of all the shafts in each group was performed in the same day. To cast the
shaft, the rebar cage with its grout distribution system was first lowered into the PVC
casing, and the fluid concrete was placed in the casing. Subsequently, the PVC casing
was pulled (Figure 5-4) using a forklift and the top of the shafts was leveled.
5.1.3 Top Down Testing of Drilled Shaft Groups Prior to Tip Grouting
Each group was subjected to static axial load test (ASTM 1143-07) before tip
grouting to estimate initial skin resistance. Figure 5-5 displays the test setup which
consisted of spacer disks on each shaft span grout delivery pipe, 890 kN (200 kip)
capacity load cells placed on the top of each shaft to measure load distribution, a test
frame, hydraulic jack, another 2669 kN (600 kip) capacity load cell to measure total
load, a reaction beam and support system, and displacement monitoring
instrumentation. Shaft and soil displacement were measured using digital dial gages.
The test load was applied in increments and each load increment was maintained for a
constant time interval of 5 minutes. This time interval was considered adequate to

158
assess the vertical displacement (mostly immediate settlement) under each load
increment because the soil used in the study was silty sand and the water table was
kept well below the bottom of shaft. The tests were conducted up to full mobilization of
the skin resistance, identified from the log-log plot of the shafts’ load versus
displacement and corresponding to a displacement of approximately 6.35 mm (0.25 in).
Note that the change in slope on the log load vs. log displacement plot (full mobilization
of skin friction) was visible because the tip resistance was negligible due to the unfilled
steel ring-membrane system at the base of the shaft (prior to tip grouting).
5.1.4 Tip Grouting of Drilled Shafts
After top down group test, the tip of each shaft was grouted individually (Figure 5-
6). The grout mix consisted of cement, 10% micro-fine fly ash and water at a
water/cement ratio of 0.45. For group 1 shafts (2.44 m long), grouting was performed in
single stage and continued until an upward displacement of about 6.35mm (0.25 in) at
shaft head. Tip grouting started with the south shaft (SG1- S) and the displacement of
the shaft was negligible up to a grout volume of 0.053 m3 (14 gallons). The shaft
reached an upward displacement of 6.35 mm when 0.064 m3 (17 gallon) was pumped
to the tip of the shaft. The maximum grout pressure observed during the grouting was
448 kPa. However, during the grouting of the other three shafts, upward displacement
of 6.35 mm occurred under very small volume of grout as shown in Table 5-1. Note that
the maximum pump pressure observed for all the shafts were same even though the
volume of grout pumped were different (Table 5-1).
In case of group 2 shafts (3.96 m long), grouting was performed in multiple
stages with different colored grouts in each stage to identify grout flow pattern during
different stages. In the first stage of grouting, 0.023 m3 (6 gallon) of yellow colored grout

159
was pumped into each shaft. After hydration of the first-stage grout, another 0.023 m3
(6 gallon) of red colored grout (second-stage) was pumped into each shaft. When the
third-stage grouting (black grout) was attempted in the east (SG2- E) and south (SG2-
S) shafts, grout pressures exceeding 4138 kPa (600 psi) were recorded, however, no
grout was pumped into the shafts. This was attributed to the formation of a solid grout
plug at the shaft tip due to the first and second-stage grouting. As the third-stage
grouting was controlled by upward displacement (about 6.35 mm) of shaft, grouting of
the west (SG1- W) and north (SG1- N) shafts discontinued after pumping of about 0.011
m3 (3 gallon) of grout. The grout pressures measured during the stage 2 and 3 grouting
was about 15 to 35% higher than that during the stage 1 (Table 5-1).
5.1.5 Top Down Testing on Tip Grouted Drilled Shaft Groups
After the hydration of grout, top down testing on the PGDS groups were
conducted to assess the total load capacity of the groups and the group interaction. The
test setup was exactly the same as that for the load test prior to grouting. In order to
estimate the interaction between the shafts, individual loading of a couple of shafts in
each group were also performed (Figure 5-7). Besides the load-displacement response
of test shaft, displacements of other shafts and stresses in the vicinity of the group were
also measured during the individual shaft load tests.
5.1.6 Excavation of Tip-Grouted Drilled Shaft Groups
During the excavation of the grouted shaft groups, it was observed that little, if
any, grout bulb formed beneath the shaft bases. In addition, no grout permeation or
grout-soil mixing occurred below any of the tested shafts. Figures 5-8 and 5-9 shows
the photographs of the excavated group 1 and group 2 shafts respectively and it is
evident that the grout flowed up along the shaft-soil interface during grouting every time.

160
The upward migration of the grout was attributed to the minor principal stress acting in
the horizontal direction along the shaft-soil interface, making the interface a major
conduit for grout flow. The fluid grout also relieved any side friction (viscous fluid) when
it flowed upward, as has been observed in a case study in Walton County, Florida
(Muchard 2004). However, the upward-flowing grout increased the shaft’s surface area
after hydration, which in turn would increase the skin resistance after hydration. For
instance, the bottom radius of group 1east shaft (SG1-E) increased by 33 mm (1.30 in,
15 %) due to upward-flowing grout, but no grout bulb was observed beneath any of the
2.44-m-long drilled shafts. In the case of group 2 shafts, the grout again flowed up
alongside the shaft, thus increasing the shaft diameter during the first stage of grouting.
During the second and third stage of grouting, the grout again flowed up alongside the
shaft and encircled the grout zone formed by the previous grouting. In the case of group
2 east shaft (SG2-E), the second stage of grouting formed an accumulation only on one
side above the tip of the shaft. The pressured grout always flowed along the least
resistant path and accumulated at the loosest zone. The soil preparation in the test
chamber or pulling of the casing after concrete placement may have created a relatively
loose pocket on one side at the bottom of shaft SG2-E. However, no such grout
accumulation was observed at this location during the first stage of grouting (Figure 5-
9). Moreover, the grout accumulation was not attached to the side of the shaft, and
hence its contribution to the capacity of the shaft was considered negligible.
5.2 Analysis of Experimental Post Grouted Drilled Shaft Group Behavior
This Section discusses the experimental behavior of tip-grouted drilled shafts
based on the load-deformation data and soil stress measurement during different
stages. Negligible ground surface deformation (<1mm) and soil stress change (Table 5-

161
2) was observed near the chamber wall during tip grouting and load tests, which
suggested that the chamber boundary effect was little, if any, in both group tests.
From the group load tests prior to tip grouting, the skin resistance of each shaft
was found to be in the range of 13.3-16.5 kN (3-3.7 kips) for group 1 shafts (2.44 m)
and 41-46 kN (9.2-10.4 kips) for group 2 shafts (3.96 m).
Figures 5-10 and 5-11 displays the load versus vertical displacement response of
group 1 and group 2 shafts respectively during the group load tests after tip grouting.
The maximum displacement of soil at the center of the group (group 1: 14 mm, group 2:
9.6 mm) was much less than the average displacement of shafts (group1: 46 mm,
group1: 25 mm), which suggests that the shafts behaved independently during group
loading. In group 1, the load carrying capacity of the south shaft was much higher than
the other shafts because of the larger skin resistance due to the grout zone formed
alongside the shaft (Figure 5-8). However, the load-displacement responses of the
shafts were nearly parallel at large displacements (above 25 mm), suggesting that the
rate of tip mobilization was nearly the same for all the shafts. In case of group 2, the
load carried by shafts were significantly different; the west shaft carried the most load
and the east shaft carried the least load at the same displacement, which was attributed
to the difference in tip area (as observed in Section 5.1.6) of the shaft after grouting. As
the maximum sustained grout pressure observed was more or less the same for all
shafts (Table 5-1), the effect of preloading (tip stress mobilization) should be similar.
Figure 5-12 shows the load-displacement response of south and west shafts in
group 1 during the group and individual load tests. Similarly, shown in Figure 5-13 is the
response of west and east shafts in group 2 under group and individual loading. It is
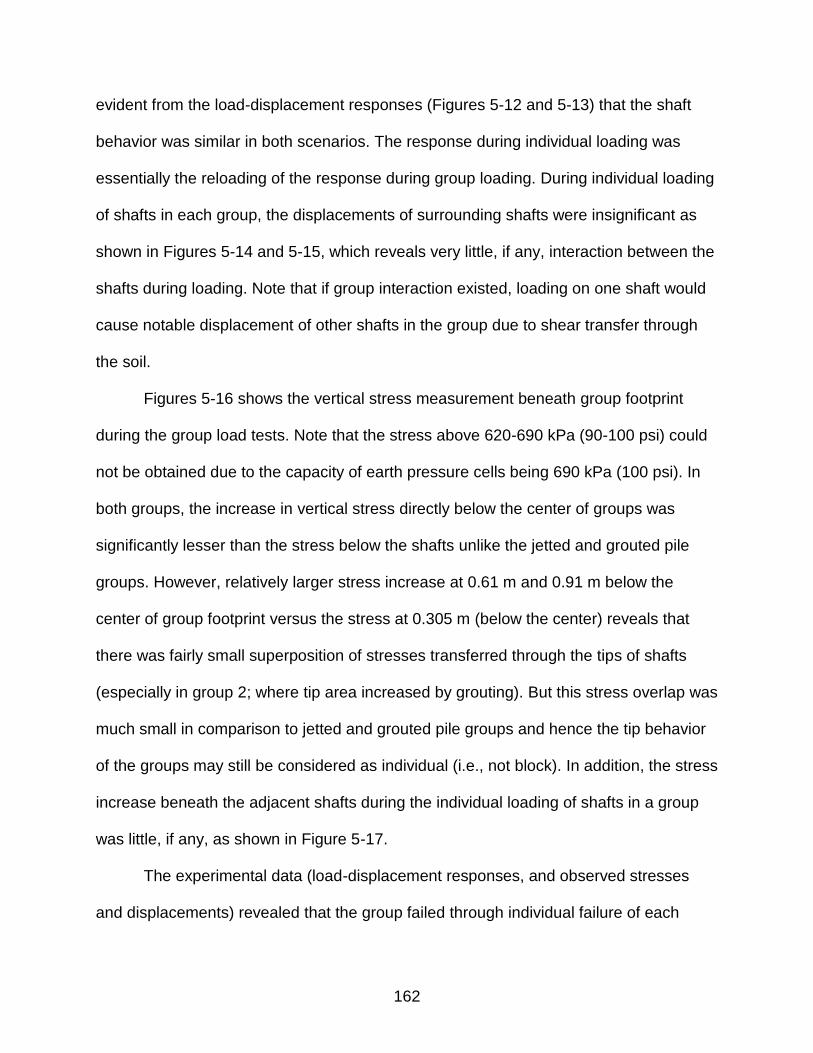
162
evident from the load-displacement responses (Figures 5-12 and 5-13) that the shaft
behavior was similar in both scenarios. The response during individual loading was
essentially the reloading of the response during group loading. During individual loading
of shafts in each group, the displacements of surrounding shafts were insignificant as
shown in Figures 5-14 and 5-15, which reveals very little, if any, interaction between the
shafts during loading. Note that if group interaction existed, loading on one shaft would
cause notable displacement of other shafts in the group due to shear transfer through
the soil.
Figures 5-16 shows the vertical stress measurement beneath group footprint
during the group load tests. Note that the stress above 620-690 kPa (90-100 psi) could
not be obtained due to the capacity of earth pressure cells being 690 kPa (100 psi). In
both groups, the increase in vertical stress directly below the center of groups was
significantly lesser than the stress below the shafts unlike the jetted and grouted pile
groups. However, relatively larger stress increase at 0.61 m and 0.91 m below the
center of group footprint versus the stress at 0.305 m (below the center) reveals that
there was fairly small superposition of stresses transferred through the tips of shafts
(especially in group 2; where tip area increased by grouting). But this stress overlap was
much small in comparison to jetted and grouted pile groups and hence the tip behavior
of the groups may still be considered as individual (i.e., not block). In addition, the stress
increase beneath the adjacent shafts during the individual loading of shafts in a group
was little, if any, as shown in Figure 5-17.
The experimental data (load-displacement responses, and observed stresses
and displacements) revealed that the group failed through individual failure of each
163
shaft within the group. There was only small stress superposition at the tip although
some of the shafts had bigger grout bulbs at their tips (group 2). The minimal group
interaction was attributed to little, if any, change in soil stresses and stiffness within the
footprint area of the group as a result of tip grouting. Hence, the resistance of the group
is suggested to be equal to the single post grouted drilled shaft resistance the number
of shafts in the group. Or, the axial group efficiency of the post grouted drilled shafts at
typical 3D spacing is equal to one (1).
Figure 5-18 presents the change in residual horizontal stress at the bottom side
of shafts caused by the construction, axial loading, and tip grouting. In the cases of
group 1 shafts, the shaft construction and axial loading (prior to grouting) caused a
small increase in horizontal stress, but the stress change due to grouting was
insignificant. On the other hand, for group 2 shafts, the shaft construction caused a
decrease in horizontal stress, which may be because the casing for the shafts (3.96 m
shafts) had to be partially pulled during the concrete pouring (after 1.2 m or 4 ft of
placement) to minimize the force required for the casing extraction, whereas for group 1
shafts (short shafts), the casing was pulled after the completion of the concrete
placement. The partial pulling of the casing could have relieved the horizontal stress
around the bottom of the shaft because the hydrostatic pressure exerted by fresh
concrete at a relatively shallow depth (1.5 m) on the shaft wall was small. This
horizontal stress reduction was regained after the first stage of grouting. The second
stage of grouting caused an additional increase in horizontal stress (Figure 5-18). The
increase in horizontal stress was also larger at 3.96 m than at 3.44 m, signifying that the
first stage of grouting may have prevented the upward flow of the grout during the

164
second stage of grouting. Although the horizontal stresses at the bottom sides of the
shafts were different after construction in group 1 and group 2 shafts, the upward grout
flow clearly occurred in both cases during the first stage of grouting. Similar upward
grout flow was reported in full-scale shafts by several investigators (Duan and Kulhawy
2009; Muchard and Farouz 2009; Mullins and Winters 2004) and attributed to the lower
horizontal stress around the shaft inherent in the installation process (drilling the shaft
hole). Therefore, the grout pattern observed in the present study was not a result of the
small-scale effect and associated lower overburden stresses. It is evident from the
Figures 5-9 and 5-18 (radial stress increase) that the grout zone also expanded laterally
(in a somewhat cylindrical manner) in addition to flowing in the upward direction.
However, it is clear that the tip grouting process was not represented by spherical cavity
expansion beneath the shaft tip and the tip area increase was due to the accumulation
of upward-flowing grout around the shaft tips. The difference in the load-displacement
responses of the shafts, as observed in Figures 5-10 and 5-11, was attributed to the
different final shaft tip areas.
The experimental study also suggested that the shearing resistance of soil
beneath the shaft tips was not necessarily improved (e.g., an increase in mean stress or
relative density) through the tip grouting process because no grout bulb developed and
no grout-soil mixture occurred beneath any of the shafts tested. Therefore the capacity
of grouted shafts under permissible service displacements depended mainly on the pre-
stressing effect (i.e., the change in soil stiffness upon reloading) and increased tip area.
The experiments revealed that the stage grouting improved shaft tip resistance by
preloading the shaft tip (i.e., the grouting process) and increasing the bottom side radius

165
of the shaft, however irregularly. The grout pressure measured during re-grouting (stage
2 or 3) could not be used to estimate skin friction because the grout may not have
covered the entire bottom area of the shaft, as observed in the experimental study.

166
Table 5-1. Drilled shafts grouting data
Group Length
m Shaft
ID
Grout pressure, kPa a Grout volume m3 (gal)
Stage 1 Stage 2 Stage 3 Stage 1 Stage 2 Stage 3
SG1 2.44
S 448 - - 0.064 (17) - -
N 448 - - 0.002 (0.5) - -
W 448 - - 0.002 (0.5) - -
E 448 - - 0.011 (3) - -
SG2 3.96
S 1241 1724 - 0.023 (6) 0.023 (6) -
N 1034 1241 1241 0.023 (6) 0.023 (6) 0.011 (3)
W 1103 1379 1241 0.023 (6) 0.023 (6) 0.011 (3)
E 1172 1517 - 0.023 (6) 0.023 (6) - a
After deducting the pressure lose in grout distribution system (138 kPa) from the measured pump pressure
Table 5-2. Increase of horizontal soil stress at shaft tip elevation during grouting & group test
Group
Tip grouting Group load test
15 cm away from shaft
15 cm away from chamber wall
15 cm away from shaft
15 cm away from chamber wall
SG1 32 kPa 2 kPa 93 kPa 10.5 kPa
SG2 668 kPa 32 kPa 106 kPa 1.5 kPa

167
Figure 5-1. PVC casing positioned before filling the test chamber (Photo courtesy of
author, Sudheesh Thiyyakkandi)
Figure 5-2. Test chamber in fully filled state (Photo courtesy of author, Sudheesh
Thiyyakkandi)
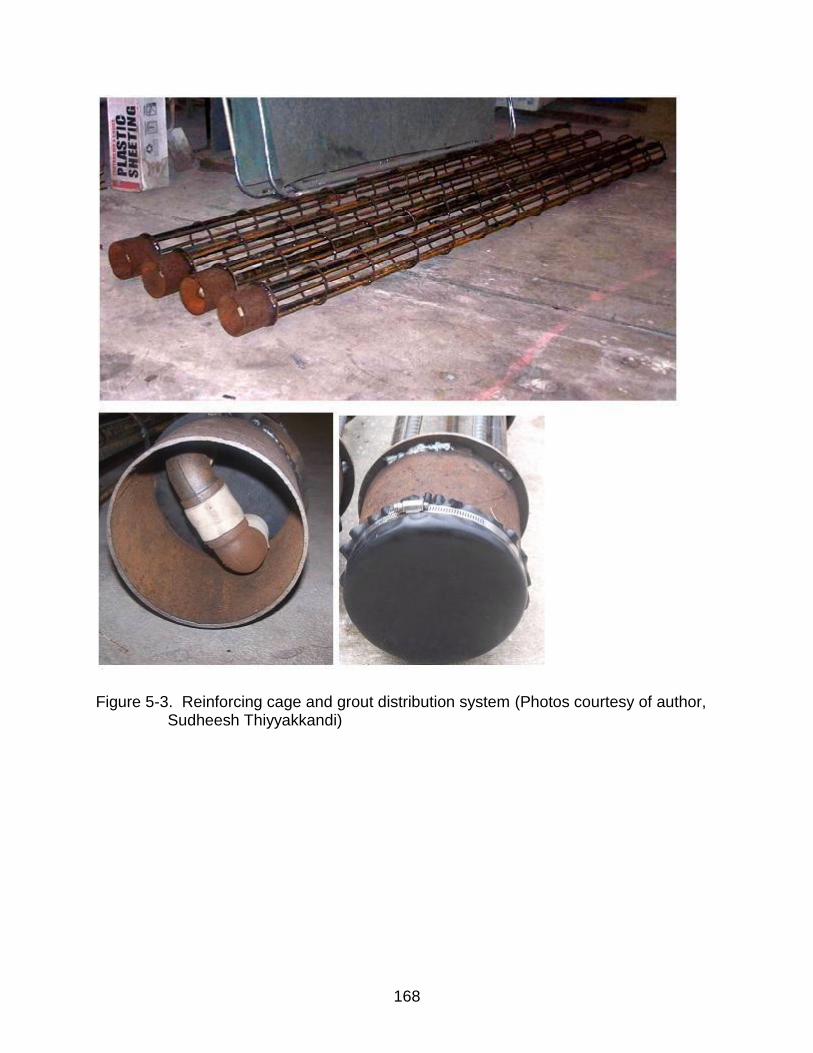
168
Figure 5-3. Reinforcing cage and grout distribution system (Photos courtesy of author,
Sudheesh Thiyyakkandi)

169
Figure 5-4. Pulling the casing out (Photos courtesy of author, Sudheesh Thiyyakkandi)
Figure 5-5. Group load test setup (Photo courtesy of author, Sudheesh Thiyyakkandi)

170
Figure 5-6. Tip grouting (Photo courtesy of author, Sudheesh Thiyyakkandi)
Figure 5-7. Setup for individual shaft loading (Photo courtesy of author, Sudheesh
Thiyyakkandi)

171
Figure 5-8. Excavated group 1 shafts (Photos courtesy of author, Sudheesh
Thiyyakkandi)

172
Figure 5-9. Excavated group 2 shafts (Photo courtesy of author, Sudheesh
Thiyyakkandi)
Figure 5-10. Load-displacement response of group 1 shafts
0
20
40
60
80
100
120
140
0 5 10 15 20 25 30 35 40 45 50 55 60
Lo
ad
(k
N)
Displacement (mm)
North
South
West
East

173
Figure 5-11. Load-displacement response of group 2 shafts
Figure 5-12. Load -displacement response of group 1 shafts during the group and
individual load tests.
0
50
100
150
200
250
300
0 5 10 15 20 25 30 35
Lo
ad
(kN
)
Displacement (mm)
North
South
West
East
0
20
40
60
80
100
120
140
160
180
200
0 10 20 30 40 50 60 70 80 90 100
Lo
ad
(k
N)
Displacement (mm)
South-during group test
South-during individual test
West-during group test
West-during individual test

174
Figure 5-13. Load -displacement response of group 2 shafts during the group and
individual load tests
Figure 5-14. Displacements of all the shafts in group 1 during south shaft loading
0
40
80
120
160
200
240
280
320
360
0 10 20 30 40 50 60
Lo
ad
(k
N)
Displacement (mm)
East-during group test
East-during individual test
West-during group test
West-during individual test
0
5
10
15
20
25
30
0 1 2 3 4 5 6 7 8 9 10
Dis
pla
ce
me
nt
(mm
)
No of load steps
S
N
E
W

175
Figure 5-15. Displacements of all the shafts in group 2 during the individual shaft
loading

176
Figure 5-16. Vertical stress measurement beneath group footprint during the group load
tests

177
Figure 5-17. Vertical stress measurement beneath group footprint during the individual
shaft loading
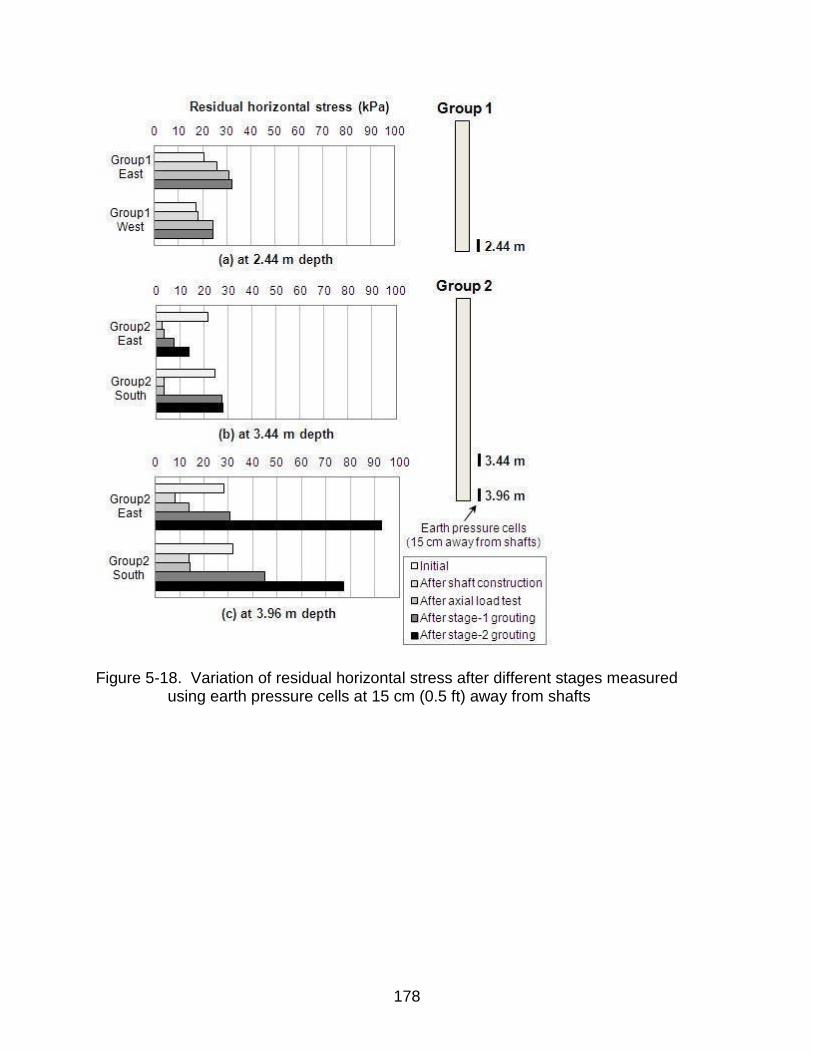
178
Figure 5-18. Variation of residual horizontal stress after different stages measured
using earth pressure cells at 15 cm (0.5 ft) away from shafts

179
CHAPTER 6 INDIVIDUAL RESPONSE OF POST GROUTED DRILLED SHAFTS
This Chapter discusses the finite element modeling and the prediction approach
developed for the axial capacity of individual post grouted drilled shafts. The objective of
the finite element analysis was to investigate the load transfer mechanism at the tip of
grouted shafts. Experimental group study of post grouted drilled shafts at typical 3D
spacing discussed in Chapter 5 revealed that the shafts behaved individually during
axial group loading (i.e., little/no group interaction). Therefore, individual experimental
shafts (both 2.44 m and 3.96 m long) were modeled in PLAXIS 2D and compared with
the experimental results. The experimental observations, the load transfer mechanisms
captured from numerical analyses, and the reported case histories were then used to
develop a tip resistance prediction approach for the grouted shafts. 2
6.1 Numerical Modeling of Post Grouted Drilled Shafts
Numerical modeling of the base grouted drilled shafts was performed using the
two-dimensional finite element software PLAXIS 2D. The construction, first stage of
grouting, and top down load testing of both the 0.216 m (8.5 in) diameter x 2.44 m (8 ft)
long and 0.216 m (8.5 in) diameter x 3.96 m (13 ft) long shafts were modeled in
PLAXIS. The second stage of grouting (group 2) was not modeled because the grouting
results (increase in tip radius and preloading effect) were irregular. Note that the tip
radius increase (Figures 5-8 and 5-9) after the first stage of grouting was nearly
axisymmetric, and hence, the problem could be simplified as a two-dimensional
2 Major portion of this Chapter is from the article: Thiyyakkandi, S., McVay, M.,
Bloomquist, D., Lai, P. (2013). “Experimental study, numerical modeling of and axial prediction approach to base grouted drilled shafts in cohesionless soils,” Acta Geotechnica, Springer. DOI: 10.1007/s11440-013-0246-3. With permission from Springer.

180
problem. An axisymmetric model using 15-node triangular elements was created to
simulate the drilled shaft and soil in the test chamber, as shown in Figure 6-1. Both the
radial and vertical displacements were restricted along the periphery of the test
chamber. The bottom mesh boundary was placed sufficiently deep under the shaft tip
such that its influence was negligible, to ensure that no stress change or displacement
occurred near the bottom boundary during the different simulation stages, such as
construction, grouting, and axial loading. Vertical movement was restricted but radial
displacement (i.e., horizontal rollers) along the bottom boundary.
6.1.1 Material Models and Parameters
The sand was modeled with the Hardening Soil (HS) constitutive model and the
drilled shaft was modeled as a linear elastic material. As mentioned earlier, the HS
model considers three different moduli, E50 from the primary deviatoric loading, Eur from
the elastic unloading/reloading and Eoed from the primary oedometer loading, to define
soil stiffness. The model incorporates the stress level dependency of the stiffness
parameters according to a power law controlled by a dependency parameter m. E50ref =
3.46 x 10⁴ kPa (secant modulus corresponds to 50% mobilization of the shear strength)
obtained from the standard drained triaxial compression test was used in the preliminary
analysis. However, to match the FEM responses with the vertical soil stress measured
by earth pressure cells at a depth of 0.305 m (1 ft) below the shaft tips during grouting
and the axial top-down load testing, E50ref had to be increased by 20%. A similar back
calculation approach has been suggested by Youn and Tonon (2010) for the FEM
modeling of post grouted drilled shafts. The materials parameters used for the sand and
drilled shaft in the analysis are given in Table 6-1. The angle of internal friction ϕ used in
the analysis was the peak friction angle obtained from direct shear tests at 50% relative

181
density and dilation angle, while ψ was estimated using the Bolton (1986) model, ψ =
(ϕ-ϕc)/0.8, where ϕc is the critical state friction angle and measures approximately 31o
for the test sand. The PLAXIS default settings of Eurref = 3 E50
ref and Eoedref = E50
ref were
used in the analysis. Although the cohesion of the silty sand used in the study was zero,
a small cohesion value (0.345 kPa or 0.05 psi) was used in the analysis for the
numerical stability of the model, as suggested in the PLAXIS manual.
6.1.2 Modeling of Construction, Tip Grouting, and Top Down Load Tests
In accordance with the experimental study, the FEM analysis began with the
simulation of the temporary casing and the shaft hole by activating the “prescribed
displacements” (i.e., zero in the radial direction) along the wall of the shaft hole and
deactivating the soil elements representing the shaft. Subsequently, the concrete
placement was modeled by activating the lateral pressure to the shaft wall, which was
equal to the hydrostatic pressure induced by fluid concrete with a unit weight of 22.5
kN/m3 (Youn and Tonon 2010), and the removal of the casing was simultaneously
modeled by deactivating the “prescribed displacements” along the wall of the shaft hole.
Deactivation of the “prescribed displacements” simulated the loading scenario after the
casing removal, and the shaft hole wall was free to deform under the lateral pressure (a
resultant of the concrete and soil pressure) and alter the stress state of the soil around
shaft, as in the actual construction process. The hydrated drilled shaft was then
simulated by activating the linearly elastic concrete material at the shaft location and
deactivating the concrete fluid pressure. Interface elements were used at the interface
between the shaft and soil to model the soil-shaft interaction. The interface strength
reduction factor R (the ratio of the shear strength of the interface element to the
surrounding sand, or 0.85) was back calculated to match the initial skin resistance of the

182
shafts measured in the experimental study. Next, the tip grouting was simulated by
applying positive incremental volumetric strains (i.e., expansion) to a linearly elastic
zone [E = 689.5 kPa (100 psi) and = 0.45] at the shaft tip, as shown in Figure 6-1. This
elastic zone simulated the cavity (voids) filled with grout during the commencement of
grouting in the experimental study. The application of positive volumetric strains to the
elastic zone, a PLAXIS-recommended approach to the simulation of grouting (Ni and
Cheng 2010; Thiyyakkandi et al. 2012), expanded the zone and exerted stress in all the
directions. This expanding zone pushed the underlying soil downward (i.e., pre-
stressing) and the shaft upward. This upward pushing of the shaft caused the
mobilization of skin resistance like that in the actual field grouting. The incremental
application of positive volumetric strain was continued until an upward shaft
displacement of approximately 6.35 mm (0.25 in) was achieved, in accordance with the
experimental study. In current industry practice, the applied grout pressure is either
maintained or released during the hydration of the grout. However, it is impractical to
maintain the full grout pressure because the stress relaxation in the soil beneath shaft
causes a partial or full release of pressure. After the grouting simulation, three different
grout pressure scenarios were considered in the analysis: 1) fully locked, 2) fully
released, and 3) partially released. In the “fully locked” case, the stress developed in the
elastic grout zone by the grouting simulation (positive volumetric strain) was maintained.
In the “fully released” case, the stress within the elastic zone was fully released, and in
case 3, the stress was partially released. For cases 2 and 3, the grout pressure release
was simulated by applying negative incremental volumetric strains (i.e., contraction) to
the elastic grout zone until the vertical stress at shaft tip became zero or negligible

183
(case 2) or 50% of the applied grout pressure (case 3). The application of negative
incremental volumetric strains contracted the elastic zone and relieved the stress
developed by the grouting process. Next, the elastic grout zone was replaced by linearly
elastic concrete material to represent the hardened grout. The “Updated Mesh Option”
was used in the analysis because the grouting process is a large strain problem. After
simulation of the grouting process, the axial load test was modeled by applying
incremental distributed loads on top of the shafts (with each increment measuring 344
kPa or 50 psi).
For comparison, un-grouted shafts, both the 2.4-m and 3.96-m drilled shafts were
also modeled in PLAXIS using the same material properties given in Table 6-1. The
casting of the shafts was first simulated, and axial loading was then modeled by the
activation of a distributed load on the shaft head, as described earlier.
Shown in Figure 6-2 are the vertical stresses at 0.305 m (1 ft) below the shaft tip
during the top-down axial load test, obtained from the stress gages and the PLAXIS
analysis of group 1 east shaft, the 2.44 m long single-stage tip grouted shaft. As
mentioned earlier, the E50ref value obtained from the standard drained triaxial
compression test had to be increased by 20% to match the numerical results with the
experimental response.
6.1.3 Skin Resistance of Tip Grouted Shafts
The vertical stresses predicted by PLAXIS at the shaft tips were used to separate
the side and tip resistance from the total applied load on the grouted shafts in the
experimental study. For instance, the experimental final skin resistance of the grouted
shaft was estimated by subtracting the tip load (the unit PLAXIS tip resistance multiplied
by the measured final tip area) from the applied experimental top load, as shown in

184
Table 6-2. The final skin resistance of all the shafts was higher than the initial skin
resistance (i.e., pre-grouting), which was attributed to the increased surface area or
radius of the shaft due to grout flowing up alongside the shaft and the increased
horizontal stress on the bottom side of group 2 shafts (Figure 5-18). Table 6-3 presents
a comparison of the grouted and un-grouted skin resistances of the drilled shafts from a
number of full-scale field tests in the United States. The skin resistance of grouted
shafts was in the range of 85 %-113 % that of the un-grouted shafts. It should be noted
that the un-grouted skin resistance for each case listed in Table 6-3 was the skin friction
of the control shafts at the same site, and different skin resistance could therefore also
be attributed to construction and spatial variability at the test sites.
6.1.4 Load Transfer Mechanism at Shaft Tip
Figure 6-3 depicts the unit tip resistance vs. tip displacement from the numerical
analysis of the un-grouted and three grouted drilled shafts: 1) full locking of tip grout
pressure, 2) full release of grout pressure, and 3) 50% release of grout pressure for the
3.96 m long (group 2) drilled shafts. During the top-down load testing, it was found that
the unit end bearing of the base grouted shaft obtained for the three cases (grout
pressure fully locked, partially released, and fully released) were nearly the same
(Figure 6-3) even though the load-transfer mechanisms captured from the FEM analysis
were different, as shown in Figure 6-4. In the case of locked-in grout pressure, the
mobilized end bearing was initially balanced by negative skin friction along the shaft
(Figure 6-4, case 1: initial). During the subsequent top-down axial loading, the negative
skin friction was first replaced by the applied load (case 1: stage 1). Further application
of the load mobilized positive skin friction (acting upwards; Figure 6-4, case 1: stage 2),
and additional end bearing was mobilized with additional loading (case 1: stage 3). In

185
the case of fully released tip resistance, no skin friction (i.e., negative skin friction)
existed initially (Figure 6-4, case 2: initial). During axial loading, positive skin resistance
was mobilized, and the tip resistance was developed along a much stiffer path up to the
initially applied grout pressure (reloading) under a small displacement (Figure 6-4, case
2: stage 2), after which further tip resistance was mobilized at a much lower stiffness
with additional loading (case 2: stage 3). The mechanism by which the load was
transferred to the soil in the partially released case was similar to that of the fully locked
case, as shown in Figure 6-4 (case 3). The load transfer mechanisms identified from the
numerical analysis, as discussed above, were the same as the conceptual mechanisms
of load transfer suggested by Mullins et al. (2006). Therefore, the present analysis
validated the conceptual load transfer mechanisms and, as evident from Figures 6-3
and 6-4, the net load capacity was essentially the same in the three scenarios.
Also shown in Figure 6-3 is the PLAXIS-predicted tip response (thin solid line) for
the un-grouted shaft subject to top-down axial load testing. Note that if the tip was
unloaded at 1200 kPa and subsequently reloaded, the resulting tip response followed a
stiffer path up to 1200 kPa followed by a softer (less stiff) path. This behavior was the
same as that of the un-grouted shaft above the preloading pressure (Figure 6-3, the
long-short dashed curve). This curve had the same stiffness response as the fully
released tip grouted shaft curve (Figure 6-3, dark solid line translated right). As
observed in the experimental study, neither grout bulb formation nor grout-soil mixture
occurred during the tip grouting process, indicating that tip grouting a shaft did not
necessarily increase the principal stresses (e.g., cavity expansion) or strength
characteristics (e.g., relative density or angle of internal friction) of the soil at the tip of

186
the shaft but only preloaded it. Consequently, the unit tip response of a base grouted
shaft can be predicted if preloading stress (i.e., grout pressure) and the unit tip
resistance vs. tip displacement curve for the un-grouted shaft are known. However, the
tip radius at the bottom of the shaft must be known to predict its resistance (or force).
6.2 Develop Axial Prediction Approach for Post Grouted Drilled Shafts
6.2.1 Estimation of Unit Tip Resistance vs. Tip Displacement
Many investigators (De Beer 1984; Franke 1993; Lee and Salgado 1999) have
suggested the use of cone penetration resistance (qc) in deep foundation design. In the
case of granular soils, the drilled shaft unit tip resistance (qb) at tip displacements of 5 to
10 % has been related to cone tip resistance qc (Lee and Salgado 1999). For instance,
Equation 6-1 expresses the unit tip resistance at displacements of 10 % diameter (qb0.1)
in terms of qc, and a coefficient, . Figure 6-5 gives the value of recommended by a
number of researchers for bored pile/drilled shafts.
(6-1)
It is well known that the tip resistance-displacement relationship is nearly
hyperbolic in nature in deep foundations (Hirayama 1990; Fleming 1992). Chin (1970)
has suggested that the asymptote of the hyperbolic tip resistance-displacement
relationship can be represented in linear form by plotting the ratio of tip displacement to
resistance against tip displacement. The inverse of the slope of the line represents the
limit base resistance of the pile (CPT resistance qc), which can be represented by:
(6-2)
In the above equation, δ represents the normalized base displacement (base
displacement/shaft diameter) at any unit tip resistance qb, and Kb is the vertical intercept

187
on the δ/qb axis. Substituting δ = 0.1 (i.e., 10 % of the diameter) and Equation 6-1, into
Equation 6-2, the intercept Kb can be calculated as:
(6-3)
By substituting Equation 6-3 into Equation 6-2, the hyperbolic function
representing the normalized unit tip resistance-displacement relationship can be written
as:
(6-4)
where the coefficient, n is given by:
(6-5)
Figure 6-6 shows a comparison of the measured and predicted unit tip resistance
vs. base displacement curves from Equation 6-4 for an un-grouted shaft test performed
at the Georgia Institute of Technology (Mayne and Harris 1993). The soil at the shaft tip
is silty silica sand with 70 % sand and a clay fraction of less than 10 %. More details
about the test site and load test can be found in the literature (Mayne and Harris 1993;
Lee and Salgado 1999). The relative density of the soil beneath the shaft tip is
approximately 25 %, and a corresponding α value is obtained as 0.21 from Figure 6-5
(Lee and Salgado 1999). Reasonable agreement is observed between the predicted
(using Equation 6-4) and measured response for the shaft.
As discussed earlier, the shear strength of the soil below a grout tipped drilled
shaft was not improved, and only the soil’s stiffness increased due to its preloading
(path AB, Figure 6-7) due to tip grouting. In other words, assuming full grout tip pressure

188
release along path BC (Figure 6-7), subsequent top-down testing will exhibit two distinct
tip stiffnesses, path CB (qb ≤ qg tip grout pressure) and path BD (qb qg) depending on
the mobilized tip stress qb. In the case of reloading, path CB may be characterized as
Timoshenko’s rigid linear elastic disk solution (Timoshenko and Goodier 1970), or unit
tip resistance qb vs. reload displacement, as:
(6-6)
where, k is stiffness, G0 is the shear modulus, and is Poisson’s ratio. The shear
modulus (G0) in Equation 6-6 can be represented by the modulus given by Randolph et
al. (1994) for pile design (Equation 4-1).
In the case of path BD in Figure 6-7, the hyperbolic relationship proposed for a
conventional drilled shaft, or Equation 6-4, can be used to assess tip stresses qb in
terms of normalized tip displacements (Figure 6-7):
(6-7)
where:
(6-8)
In Equations 6-7 and 6-8, g (Figure 6-7) is the prior permanent displacement of
the tip grouted shaft due to the tip grout pressure qg. The first term in Equation 6-8 is the
tip displacement from grouting, Equation 6-4, and the second term is the recovered
elastic rebound, Equation 6-6. Again, Equation 6-6 is valid for tip pressures qb less than
the planned tip grout pressures qg, and Equation 6-7 is valid for tip pressures qb larger
than prior tip grout pressures qg. The tip capacity (load) at a given displacement can be

189
obtained by multiplying the unit tip resistance qb with tip area of the shaft. Figure 6-8
compares the predicted unit tip resistance-displacement curve for the 2.44-m long shaft
(conventional and grouted) using Equations 6-4, 6-6 and 6-7 with the results from the
finite-element analysis. Similarly, Figure 6-9 shows a comparison for the 3.96-m long
shaft. Because the cone penetration resistance (qc) at the shaft base was not
measured, the relationship between qc and relative density (DR) suggested by
Jamiolkowski et al. (2001) was used for the estimation. Details on all the parameters
used for the prediction are listed in Table 6-4. It can be observed that the predicted unit
end bearing–displacement responses were comparable with the results from the
numerical analyses.
6.2.2 Estimation of Tip Area Increase Due to Grouting
As mentioned in Chapter 5, the experimental study showed that base grouting
increased the tip radius of the shaft (grout flowed up alongside the shaft) in addition to
preloading the soil beneath the shaft. Subsequently, an analysis of the tip area ratio Ar
(ratio of grouted to un-grouted tip area) from the full-scale case studies with measured
CPT values (qc), volume of grout pumped, and maximum applied grout pressure was
undertaken. Table 6-5 presents the details of the full-scale field tests and relevant
parameters used in the analysis.
The first four full-scale tests in Table 6-5 were from a site located in Clearwater,
Florida. The soils at the site were loose- to medium-dense shelly sands. Cone
penetration soundings were performed at the location of each shaft, and the CPT values
(qc) at the elevation of the shaft tips are given in Table 6-5. All of the test shafts were
0.61 m (2 ft) in diameter and 4.57 m (15 ft) in length. For the first two shafts (S1-FJ1
and S1-FJ2), grouting was performed using a flat jack-type grout distribution system,

190
while a sleeve port-type apparatus was used for the other two shafts (S1-SP1 and S1-
SP2). The fifth and sixth test shafts in Table 6-5 were from another site (silty silica sand)
in Clearwater, Florida. Both shafts had a diameter of 0.61 m (2 ft) and length of 4.57 m
(15 ft). A flat jack grout delivery system was used for one shaft (S2-FJ) and a Tube-a-
Manchette (sleeve port system) was utilized in the other shaft (S2-TM). The CPT qc
values at the shaft tips, measured grout pressures, and grout volumes for both shafts
are included in Table 6-5. All of the shafts in Clearwater test sites were constructed by
the wet construction method, using polymer slurry for stabilization. The last full-scale
test (S5-S2) considered in the analysis was from Houston, Texas. The shaft was 6.4 m
long with a diameter of 1.22 m and was tipped in sand. Mineral slurry was used for the
construction of shaft and grouting was carried out using a flat jack-type grout distribution
system. The Statnamic load testing method (Bermingham 2000) was utilized to estimate
the axial response in all of the case studies considered here. More information about
the site characterization and test programs for each field test can be found in the
literature (Mullins et al. 2001; Mullins and Winters 2004; Mullins et al. 2006).
For the analysis, the applied maximum sustained grout pressure (qg) was divided
by the cone penetration resistance (qc) to create a dimensionless quantity termed the
normalized grout pressure (NGP). Similarly, the volume of grout pumped (Vg) was
expressed as a non-dimensional quantity [normalized grout volume (NGV)] by dividing it
by the third power of the shaft diameter (D3). Next, the measured mobilized tip stress ps
from the load tests (Table 6-5, column 8), representing the transition from reloading to
virgin tip resistance, was obtained from the change in slope in the log-log plot of tip
stress vs. displacement (Figure 6-10). For the calculation of tip stress ps, the axial stress

191
(embedded strain gage data) at an elevation of 0.457 m-0.67 m (1.5 ft - 2.2 ft) above the
shaft tip was used instead of the shaft tip stress, which was assumed to be impacted by
changes in tip area. Because the shaft tip was pre-stressed by the applied grout
pressure (qg), the transition from reloading to virgin tip resistance will occur at the stress
of a magnitude equal to qg during subsequent axial loading. Note that if the tip area was
not increased by the grouting process, the value of ps (from the embedded strain gage)
measured during axial loading will be equal to qg (recorded grout pressure) because the
shaft tip area and cross-sectional area at the strain gage location are the same.
However, if the tip area was increased by grouting, the measured ps will be greater than
qg (final shaft tip area > shaft cross-sectional area at gage location). Accordingly, the
increase in tip area, called the area ratio Ar (i.e., the ratio of final to initial tip area) in
Table 6-5, could be determined by dividing the measured mobilized tip stress ps by the
reported tip grout pressure qg.
Based on the analysis of seven full-scale tests with known CPT values (qc)
discussed above, it was found that the area ratio Ar (Table 6-5) varied, even when the
lengths and diameters of the shafts were similar. Moreover, it was found that the area
ratio was correlated with the volume of grout pumped, maximum applied grout pressure,
shaft diameter, and properties of the soil beneath the shaft tip. Several derived
parameters in terms of normalized grout pressure (NGP) and normalized grout volume
(NGV) were considered in the study to check whether any correlation with the area ratio
existed. It was found that the area ratio (Ar) was most closely correlated to the ratio of
normalized grout pressure to square root of normalized grout volume (NGP/√NGV), as
shown in the scatter plot (Figure 6-11). In the ratio (NGP/√NGV), NGP accounts for the

192
grout pressure and soil properties (CPT, qc is used in the normalization of grout
pressure) and NGV for grout volume and shaft diameter D. However, because the tip
area increase was due to the accumulation of upward flowing grout above the shaft tip,
and not necessarily by the formation of a spherical bulb beneath the tip (discussed
earlier), taking the square root may be an adequate modification to the term NGV (grout
volume normalized by D3 or sphere volume) to account for this actual scenario.
Subsequently, the data were fitted with a hyperbolic relationship, Equation 6-9, with an
R2 of 0.85. The equation is applicable only to NGP/√NGV values less than 0.8 (based
on available data). When the NGP/√NGV value is greater than 0.8, the area ratio (Ar)
should be taken as unity (conservative, or no tip area increase), as shown in Figure 6-
11. For a specific field grout test (with a known qc, qg, and grout volume), Ar is
determined from Equation 6-9 and the estimated shaft tip resistance (stress) qb is found
from either Equation 6-6 or 6-7, depending on the tip grout pressure qg and cone tip
resistance qc, while the estimated shaft tip resistance (force) is found by multiplying qb
by the design tip area and area ratio Ar.
(6-9)
6.2.3 Comparison of Prediction Approach with Field Test Data
Of interest was to compare the proposed unit tip resistance (qb) – displacement
relationship (Equations 6-6 and 6-7) with the results of the full-scale base grouted drilled
shaft tests. High-quality full-scale field data reported by Mullins et al. (2001), Mullin and
O’Neill (2003), and Dapp and Brown (2010), along with estimated soil properties (Dr, G0,
), are given in Table 6-6.

193
The first full-scale field test data considered for the comparison was from a site
located at Clearwater (Mullins et al. 2001). The soils at the site were loose- to medium-
dense shelly sands with an average cone penetration resistance of 3200 kPa at the
shaft tip. Figure 6-12 displays the predicted and measured tip load-displacement
response for the shaft. There are two predicted curves: one using the initial tip area of
the shaft and the other an increased area (area ratio Ar = 1.81, using Equation 6-9 for
NGP/√NGV = 0.21). The predicted response considering the tip area increase matched
the actual response well.
The second test was conducted at the University of Houston in collaboration with
University of South Florida on a 1.22-m-diameter and 6.4-m-long drilled shaft tipped in
sand in the Houston region (Mullin and O’Neill 2003). The pertinent geotechnical
parameters for this case study are given in Table 6-6. The predicted tip load-
displacement curves using the initial tip area and increased tip area (area ratio Ar =
1.76, using Equation 6-9 for NGP/√NGV = 0.23) are shown along with the measured
response in Figure 6-13, which makes it clear that the predicted response with an
increased tip area was in good agreement with the measured tip load-displacement
response.
Finally, Dapp and Brown (2010) have reported a series of large-diameter (2.29 m
or 7.5 ft) base grouted drilled shaft tests for the Audubon Bridge project in Louisiana. All
the shafts were approximately 61 m (200 ft) long and tipped in an alluvial sand and
gravel formation with an average SPT blow count (N) of 64. The tip resistances of the
grouted shafts were obtained by O-cell load tests embedded near the shaft tip. Further
details on the test program can be found in Dapp and Brown (2010). Figure 6-14 shows

194
the measured tip load-displacement response for some of the shafts, and details on the
parameters used in the prediction are given in Table 6-6. Because the diameter of the
shafts was large, the possibility of enlarged shaft tip area due to grouting was negligible,
which was also evident from the estimated area ratio (Ar) value of nearly 1 (Table 6-6).
The predicted tip load-displacement response (Ar = 1) is also shown in Figure 6-14 and
is found to moderately match the measured responses.

195
Table 6-1. Material properties used in PLAXIS
Parameter Sand Pile
E (kPa) - 2.48 x 10⁷
E50ref (kPa) 4.16 x 10⁴ -
Eoedref (kPa) 4.16 x 10⁴ -
Eurref (kPa) 1.248 x 10⁵ -
Pref (kPa) 100 -
γunsat (kN/m3) 16 25
γsat (kN/m3) 19 -
Friction angle, 33 -
Dilation angle, ψ 2 -
Poisson’s ratio, ur
0.25 0.15
Power, m 0.5 -
Table 6-2. Skin resistance of shafts before and after grouting
Shaft Initial
skin, Si (kN)
Measured final tip area, Af
(m2)
Tip stress (FEM) @
25 mma,
qbg (kPa)
Tip load, Qbg = qbg Af (kN)
Top load @ 25
mma,
Qtg (kN)
Final skin, Sf = Qtg- Qbg (kN)
(Sf / Si) x 100 (%)
SG1-E 16 0.0486 1100 53.5 71 17.5 109%
SG1-W 14 0.0366 1100 40.3 55 14.7 105%
SG2-E 41 0.0534 1866 99.6 144 44.4 108%
SG2-S 43 0.0843 1866 157.3 206 48.7 113%
Note: Tip stress (column 4) from PLAXIS analysis a Top displacement

196
Table 6-3. Comparison of grouted and un-grouted skin resistance from full scale tests in United States
Site, shaft description Skin resistance (kN) (Grouted/
Un-grouted)x100% Un-groutedc Grouted
Clearwater, Florida, S1-FJ1a 863 818 95%
Clearwater, Florida, S1-FJ2 a
863 787 91%
Clearwater, Florida, S1-SP1 a 863 774 90%
Clearwater, Florida, S1-SP1 a 863 880 102%
Clearwater, Florida, S2-FJ a
827 791 96%
Clearwater, Florida, S2-TM a 827 827 100%
Palm Beach, Florida, S3-LT3 a 28023 31315 112%
West Palm Beach, Florida, S4-LT2 a 6449 6410 99%
NGES, Alabama, TS1 b 2606 2322 89%
NGES, Alabama, TS2 b 2606 2295 88%
NGES, Alabama, TS3 b 2606 2349 90%
Houston, Texas b 3051 2580 85%
Broadway Bridge Viaduct, Iowa 7860 8536 109%
a After Mullin et al. (2001)
b After Mullin et al. (2004) c Skin resistance of un-grouted shaft at the same site

197
Table 6-4. Shafts and relevant parameters used for the prediction
Test name Grout pressure,
qg (kPa) qc
a
(kPa)
DR
(%) αb G0
c (kPa) υ
FEM (2.44 m long shaft) 448 4850a 49 0.16 17646 0.3
FEM (3.96 m long shaft) 1172 6530 a 49 0.16 23934 0.3
a using the equation proposed by Jamiolkowski et al. 2001 [22] b from Fig. 8, according to Lee and Salgado 1999 [26] c using Eq. 7.
Table 6-5. Details of full scale field tests and relevant parameters
Shafta
Shaft dia.
D (m)
Grout press.
qg
(kPa)
Grout vol. Vg
(m3)
CPT qc
(kPa)
NGP =
qg/qc
NGV =
Vg/D3
ps (kPa)
Ar =
ps/qg
S1-FJ1, Clearwater, FL
0.61 586 0.05 2850 0.206 0.220 787 1.34 0.44
S1-FJ2, Clearwater, FL
0.61 462 0.107 3200 0.144 0.471 804 1.74 0.21
S1-SP1, Clearwater, FL
0.61 1138 0.165 2300 0.495 0.727 1266 1.11 0.58
S1-SP2, Clearwater, FL
0.61 1220 0.086 2400 0.508 0.379 1198 0.98 0.83
S2-FJ, Clearwater, FL
0.61 683 0.217 2100 0.325 0.956 1129 1.65 0.33
S2-TM, Clearwater, FL
0.61 862 0.18 2100 0.410 0.793 1403 1.63 0.46
S5-S2, Houston, TX
1.22 1157 0.255 13400 0.086 0.140 2134 1.84 0.23
a After Mullins et al. 2001, 2004, and 2006

198
Table 6-6. Shafts and relevant parameters used for the prediction
Test name Shaft dia.
D (m)
Grout press.
qg (kPa)
Grout vol. Vg (m3)
qc (MPa)
DR
(%) αd
G0 e
(MPa) υ Ar f
Clearwater, Florida, S1-FJ2
0.61 462 0.107 3.2 33b 0.2 29 0.3 1.81
Houston, Texas 1.22 1157 0.255 13.4 64b 0.15 49.3 0.3 1.76
Audubon Bridge site, Louisiana
2.29 5200 0.23-1 24a 50c 0.16 203 0.3 1-1.06
a using the equation proposed by Jamiolkowski et al. (2001) b using the equation and chart suggested by Jamiolkowski et al. (2001) c using the SPT- DR correlation suggested by Cubrinovski and Ishihara (1999) d from Figure 6-5, according to Lee and Salgado (1999) e using Equation 6-7. f using Equation 6-10

199
Figure 6-1. Typical Finite element discretization

200
Figure 6-2. Vertical stress at 0.305 m (1 ft) below the shaft tip versus shaft’s top
displacement during axial load test (Group1 East shaft)
Figure 6-3. Unit tip resistance versus tip displacement for un-grouted and grouted
shafts from FEM
0
100
200
300
400
500
600
700
800
900
0 5 10 15 20 25
Ve
rtic
al s
tres
s (
kP
a)
Shaft top displacement (mm)
tip gage stress (Group 1- East )
FEM
0
500
1000
1500
2000
2500
0 5 10 15 20 25 30 35 40 45 50
Un
it t
ip r
es
ista
nc
e (
kP
a)
Displacement (mm)
Ungrouted shaft (loading)
Grouted shaft (fully locked)
Grouted shaft (50% released)
Grouted shaft (fully released)
Ungrouted shaft (reloading)

201
Figure 6-4. Mechanism of load transfer during axial loading of base grouted shaft

202
Figure 6-5. Values of α recommended by various investigators and from load tests
Figure 6-6. Predicted and measured response for Georgia Tech load test
0
1000
2000
3000
4000
5000
0 50 100 150 200
Un
it t
ip r
es
ista
nce
(k
Pa
)
Base displacement(mm)
Measured
Predicted
Diameter = 0.76 m Length = 16.8 m CPT, qc = 6500 kPa Relative density = 25% α = 0.21

203
Figure 6-7. Conceptual normalized tip resistance-displacement plot
Figure 6-8. Comparison of unit tip resistance-displacement response (2.44 m long
shaft)
0
200
400
600
800
1000
1200
1400
1600
0 5 10 15 20 25 30
Un
it t
ip r
es
ista
nc
e (
kP
a)
Displacement (mm)
FEM (grouted)
FEM (ungrouted)
Predicted (grouted)
Predicted (ungrouted)

204
Figure 6-9. Comparison of unit tip resistance-displacement response (3.96 m long
shaft)
Figure 6-10. Determination of mobilized tip stress, ps from log-log plot of tip stress
(embedment strain gage) vs displacement (shaft: S1-FJ1)
0
500
1000
1500
2000
2500
3000
0 5 10 15 20 25 30
Un
it t
ip r
es
ista
nc
e (
kP
a)
Displacement (mm)
FEM (grouted)
FEM (ungrouted)
Predicted (grouted)
Predicted (ungrouted)

205
Figure 6-11. Area ratio (Ar) versus NGP/√NGV
Figure 6-12. Predicted and measured tip load-displacement response (Clearwater, FL)
0.00
0.50
1.00
1.50
2.00
2.50
3.00
0 0.2 0.4 0.6 0.8 1
Ar
NGP/√NGV
0
100
200
300
400
500
600
0 5 10 15 20 25 30 35 40 45 50
Tip
lo
ad
(kN
)
Displacement (mm)
Measured (Mullins et al. 2001)
Predicted (using initial tip area)
Predicted (using increased tip area, Ar=1.81)

206
Figure 6-13. Predicted and measured tip load-displacement response (Houston)
Figure 6-14. Predicted and measured response (Audubon Bridge project, Louisiana)
0
1000
2000
3000
4000
5000
6000
7000
0 20 40 60 80 100 120
Tip
lo
ad
(kN
)
Displacement (mm)
Measured (Mullins and Winters 2004)
Predicted (using initial tip area)
Predicted (using increased tip area, Ar=1.76)
0
5
10
15
20
25
30
0 20 40 60 80 100 120 140 160
Tip
lo
ad
(M
N)
Displacement (mm)
T2 - Measured (Dapp and Brown 2010)
T4 - Measured
1W- Measured
4W - Measured
11E- Measured
Predicted (area ratio, Ar = 1)

207
CHAPTER 7 COMPARISON OF SIDE AND TIP GROUTED VERSUS TIP ONLY GROUTED
FOUNDATIONS
This Chapter presents a comparison of the effectiveness of side and tip grouting
vs. tip only grouting on improving the axial resistance of deep foundations in individual
and group placements. The results of the experimental and numerical investigations
discussed in the Chapters 3 to 6 were used for the comparison. The difference in soil
stress state in the vicinity of pile/shaft, the maximum tip grout pressure and grout bulb
formation, the axial response, and the group interaction in both scenarios are discussed
in the following Sections.
7.1 Residual Horizontal Stress Around Deep Foundations
The experimental and numerical analysis of jetted and grouted piles (i.e., side
and tip grouted deep foundation) suggested a significant increase in residual horizontal
stress (σh) and shear modulus of soil in close proximity of the piles. This is due to the
fact that the side grouting of a pile with attached membranes resembles a cylindrical
cavity expansion problem. Note that the membranes confine the grout zone and allow
the radial expansion of the zone, which results the horizontal stress to become the
major principal stress. Without the membrane, the grout will flow along the least
resistance paths and hence the horizontal stress and shear modulus of the surrounding
soil are not necessarily improved. Consequently, the piles undergone side grouting with
membrane confinement have much higher ultimate side resistance compared to
traditional deep foundations. In the case of cast-in place foundations (e.g., drilled shafts)
without side grouting, the horizontal stress is the minor principal stress. The installation
process (drilling the shaft hole) diminishes the horizontal stress around the shaft. As a
result, such foundations mobilize the least skin resistance under axial loading.

208
7.2 Maximum Tip Grout Pressure and Grout Bulb Formation
During tip grouting of a foundation, the grout pressure pushes the foundation
upward concurrent with compressing the underneath soil. The upward grout force
mobilizes the available skin friction of the foundation. For a foundation with very high
side resistance, the grout zone initiated at tip will expands as a nearly spherical bulb
with continuation of grouting, provided that the grout does not find any weak path to
flow. In such cases the maximum grout pressure expected will be the spherical cavity
expansion limit pressure at that depth and further grout bulb expansion will occur under
the constant expansion pressure (steady state expansion). Thus, in general the
maximum expected tip grouted pressure for a foundation will be the minimum of the
pressure required to mobilize the skin resistance and the spherical cavity expansion
pressure at that depth.
Experimental study of grout-tipped drilled shafts (tip only grouted foundations)
revealed that during grouting, the grout flows up along the shaft-soil interface (weakest
path) after filling the void space beneath the shaft tip. The upward flow of the grout was
attributed to the low horizontal stresses in soil above the shaft tip (inherent in installation
process) compared to the vertical stresses at the shaft tip. Conversely, no such upward
grout flow was observed in the case of jetted and grouted piles (side grouted
foundations) during tip grouting. The increased horizontal stress (major principal stress)
subsequent to side grouting and the enlarged side grouted zones prevented the upward
flow of grout. Since the upward flowing grout may reduce (fluid grout carries no shear)
the shaft’s side friction during the grouting process, the use of grout pressure to
estimate skin resistance (grout pressure x effective tip area) may underestimate the
actual skin resistance of the shafts.

209
Table 7-1 presents a comparison between the measured tip grout pressures and
spherical cavity expansion limit pressures for jetted and grouted piles and post grouted
drilled shafts. In Table 7-1 the spherical cavity limit pressure at the tip of pile/shaft was
predicted using Yu and Houlsby (1991) closed form solutions and Salgado and
Randolph (2001) charts. It is evident from the Table 7-1 that the maximum tip grout
pressures developed for jetted and grouted piles were in the range of the predicted
spherical cavity limit pressure at corresponding depths. This indicates that the skin
resistance of the piles subsequent to side grouting was sufficient to develop high tip
grout pressure and thus cause the formation of a nearly spherical tip grout bulb by the
cavity expansion process as shown in Figures 2-7, 4-10, and 4-1. Note that the higher
grout pressures for the jetted and grouted piles were only available after the higher
horizontal stresses (i.e., major principal stress) were mobilized due to side grouting of
the piles with the membranes. Whereas, the maximum tip grout pressures measured for
the drilled shafts (not side grouted) were much less than the spherical cavity expansion
pressures (Table 7-1). For example, the tip grout pressures observed for 2.44 m long
jetted and grouted piles were in the range of 1517-1793 kPa. In contrast, the grout
pressures observed during tip grouting of 2.44 long drilled shafts were only one-third
(448 kPa or 65 psi) of that for the jetted and grout piles because of the lesser skin
resistance. This smaller grout pressures were not sufficient to cause the spherical cavity
expansion and hence no such spherical bulb was formed beneath any of the tested post
grouted drilled shafts (Figures 5-8 and 5-9).
Since the spherical grout bulb formations (by cavity expansion process) will
improve the mean stress and relative density of underlying soil, the unit tip resistance of
210
jetted and grouted piles will be significantly improved by tip grouting. But, in post
grouted drilled shafts neither grout bulb formation nor grout-soil mixing (i.e., grout
permeation) occurred below any of the test shafts. But the tip area of the shafts were
increased (especially in group 2 shafts) due to the accumulation of upward-flowing grout
above the shaft tips. In addition to increasing the tip area, the tip grouting in such
foundations (without side grouting) only compresses the soil immediately below the
shaft tip and increases its stiffness, but not necessarily the soil’s shear strength.
7.3 Axial Resistance
As discussed earlier, side grouting of a pile with membrane improves the ultimate
side resistance of the pile and assists in developing greater tip grout pressure and
spherical tip bulb formation during tip grouting. Spherical cavity expansion beneath
shafts improves the stress state of the soil and increases tip area. This results in the
mobilization very high tip resistance during the subsequent axial loading. Thus the side
and subsequent tip grouting of a foundation significantly improves its axial resistance.
On the other hand, in tip only grouted foundations (post grouted drilled shafts), no grout
bulb was formed beneath tip and soil’s strength or stress state was not necessarily
improved because of the low grout pressure. Therefore, it is postulated that grouting of
a drilled shaft tip just preloads the soil, and the grout pressure times the shaft tip area
will be mobilized under small deformations during subsequent axial loading (i.e., higher
stiffness); however, the ultimate unit tip resistance at large displacement may not be
altered.
7.4 Group Interaction
In the case of side and tip grouted piles installed in a group at typical 3D spacing,
the experimental data suggested that grouting of adjacent piles within the group

211
increased the confining stress and shear modulus of the soil mass within the group,
resulting in a very low shear strain development in the soil mass within the group
footprint area under axial loading (Figure 7-1). However, outside the footprint, the
horizontal stresses and shear modulus diminished quadratically with radial distance.
Consequently the group failed as block with uniform displacement within the group and
quadratically decreasing displacements outside the group (Figures 4-16 and 4-17). Due
to little confinement, a much higher shear strain pattern developed in the soil mass
outside the footprint where the shear modulus greatly diminished due to reduction in
horizontal stress (no longer principal stress due to rotation of pole). Since the group
behaves as a block during axial loading, the group efficiency factor for side shear will
always be less than one (1) due to the reduced surface area of the group compared to
the sum of the individual pile surface areas. In contrast, the group foot print area is
greater than the sum of individual pile tip areas, which results in group efficiency factor
of greater than one (1) for the tip resistance .Consequently the group efficiency factor
for total axial resistance (side + tip) depends on the dominancy of side or tip resistance.
However it is suggested to estimate the axial group resistance using the approach
discussed in the Section 4-3 instead of estimating the individual axial resistance and
multiplying with group efficiency factor. Specifically, use the surface area of the block for
estimating total side resistance and the effective block footprint area for estimating tip
resistance.
The experimental data on tip grouted drilled shaft groups suggested that there
was little increase in radial stress and soil displacement around shaft tips during tip
grouting, which was attributed to the low grout pressures developed due to lower skin

212
resistance of shafts. The negligible increase in confining stress and soil displacement
was not enough to improve the soil stiffness between shafts, and consequently, high
shear strain developed in soil around the shaft tip during axial group loading. Thus the
groups failed through the individual failure of each shaft within the group (Figure 7-1).
Hence, the resistance of the group is suggested to be equal to the single tip grouted
shaft resistance number of shafts in the group (i.e., group efficiency factor ≈ 1).

213
Table 7-1. Comparison between the measured tip grout pressures and spherical cavity expansion limit pressures
Foundation type
Pile/shaft ID Length
(m)
Width/ Diameter
(m)
Measured tip grout pressure
(kPa)
Spherical cavity expansion pressure (kPa)
Yu and Houlsby (1991)
Salgado and Randolph (2001)
Jetted and grouted piles
PG1 piles 2.44 0.203 1517-1793 1450 1620
PG2 piles 2.44 0.114 1689-2138 1450 1620
Field test piles 5.5 0.71 2000-2206 2190 2900
Post grouted drilled shafts
SG1 shafts 2.44 0.216 448 1450 1620
SG2 shafts 3.96 0.216 1034-1241 2068 2900

214
Figure 7-1. Group behavior of jetted and grouted piles and post grouted drilled shafts
Quadratic diminishing of horizontal stress
High confining stress and shear modulus
Low shear strain during axial loading
High shear strain during axial loading
Low shear modulus
a) Jetted and grouted pile group
Individual shaft failure
Block failure
b) Post grouted drilled shaft group

215
CHAPTER 8 CONCLUSIONS
This dissertation encompasses the behavior of grouted deep foundations in
individual and group placement. Focus has been made to characterize the axial
response of jetted and grouted piles (i.e., side and tip grouted foundations) and post
grouted drilled shafts (i.e., tip only grouted foundations) in cohesionless soils.
Experimental and numerical studies were performed on both foundations and the
following specific conclusions are dawn from the findings of the investigations.
In case of jetted and grouted piles, the cylindrical cavity expansion pressures (Yu
and Houlsby 1991, Salgado and Randolph 2001) were found to be reasonable
predictors of the expected grout pressure during side grouting. Similarly, the expected
grout pressure during tip grouting was found to be equal to the minimum of the spherical
cavity expansion pressure or the pressure required for mobilizing the full side resistance
of pile. A numerical analysis (PLAXIS 2D) of side and tip grouting as well as axial
loading of the jetted and grouted precast piles showed that grouting developed the
major principal stresses in the radial direction and minor stresses in the vertical
direction. However, under vertical top-down loading, the radial stress was found to
diminish, but the minor principal stress around pile, which is equal to the vertical stress
after grouting (σ’vg), changed only slightly. Based on the experimental/numerical results
for the vertical stresses after grouting, the ultimate unit skin friction along the pile may
be predicted by the Mohr-Coulomb strength for cohesionless soils. For the latter, the
magnitude of the unit skin friction is a function of depth, strength and relative density of
the soil. Using the estimate of the ultimate skin and tip resistance, the axial load–
displacement responses of the piles were also predicted. Because this work suggests

216
methodologies for the design of jetted and grouted precast piles, more testing is
required to verify the results before implementation is recommended. Specifically, more
studies on the stresses and mobilized resistance of the piles are warranted.
The constructability of the pile in typical Florida field conditions was verified by
performing full-scale field installation of two jetted and grouted piles. The noise and
ground surface vibration measurements during the jetting and grouting operations
suggested that the pile is well-suited for urban environment where the noise and
vibrations during the construction operations are critical concerns. Axial top down
testing a jetted and grouted pile and a similar sized drilled shaft in the same field
condition showed that the unit skin friction for the pile is much greater than (2.6 times)
that of drilled shaft. Similarly, combined torsion and lateral load testing of the pile using
a full scale Mast arm structure identified that the new pile has very high torsional
resistance and hence appropriate for Mast arm assemblies supporting highway signs
and signals. However, further studies to identify any reduction in unit skin friction
associated with long-term creep (e.g., one year), resulting in the redistribution of stress
field around pile, are needed. Nevertheless, jetted and grouted precast piles are found
to be a promising deep foundation system for the future.
The group interaction of jetted and grouted piles at typical 3x pile width spacing
was studied by performing two small-scale group tests in cohesionless soils. Measured
load-displacement response of the piles under group loading revealed that the
displacements of all piles were relatively uniform irrespective of the load carried by each
pile. Similarly, the soil deformation at the center of the group was almost identical to the
average displacement of the piles. In addition, the vertical stress beneath the center of

217
the group was higher than the vertical stress increase recorded directly beneath piles
due to overlapping stress bulbs from individual piles. All of these observations
suggested that the piles behaved as a single block during axial loading. The axial load–
displacement responses of the groups were also predicted using the same methodology
suggested for single piles. However further studies are required to investigate the group
interaction at other spacing such as 4D and 5D (D = pile width/diameter).
In the case of post grouted drilled shafts, two small-scale post-grouted drilled
shaft groups at 3D spacing were tested to study the group interaction behavior of post-
grouted drilled shafts. The displacement of soil at the center of the group measured
during group loading was much smaller than the average displacement of the top of the
shaft. Moreover, the vertical soil stresses measured beneath the shaft group during
group loading showed little, if any, stress increase at the center of group versus directly
under a shaft, unlike the jetted and grouted pile groups. The axial response of the shafts
in a group during the group and individual loading were essentially the same.
Specifically, the response during individual loading was the reloading of the response
during group loading. During individual loading of shafts in each group, the
displacements of surrounding shafts were negligible. Based on the measured
displacements and stresses during group and individual loading, it was suggested that
the grout-tipped drilled shafts behaved individually with little, if any, influence on another
(i.e., group efficiency factor is 1). Since the study was limited to small-scale group tests,
full scale group tests need to be performed in future to validate the observed behavior.
In addition, the experimental study of post-grouted drilled shaft groups revealed
that the grout flowed predominantly up along the shaft-soil interface during base
218
grouting. Grout was also shown to bond to the shaft after hydration and cause an
increase in tip radius and tip force. Although multiple-stage grouting was a viable
solution to preventing upward grout flow, the grout did not cover the entire tip area
during subsequent grouting and hence could not be used to estimate a shaft’s final skin
resistance. In addition, grout bulbs were not formed by spherical cavity expansion.
Instead, the grout flowed upward along the path of least resistance. Tip area (or radius)
increase was due to the accumulation of upward flowing grout just above the shaft tip.
No grout permeation or expansion into the soil beneath the shaft was observed in any of
the tests, suggesting no improvement to the soil’s shearing resistance. It was concluded
that the capacity of grouted shafts under permissible service displacements depended
mainly on the pre-stressing effect (i.e., the change in soil stiffness upon reloading) and
increased tip area.
Finite element modeling of the grouted and un-grouted shafts using PLAXIS 2D
showed that the unit tip resistance-displacement responses of the grouted shafts were
the same as the reloading responses of similar sized un-grouted drilled shafts initially
loaded to the anticipated grout pressure. Numerical analysis also revealed that the tip
resistance of base grouted drilled shafts with grout pressure either locked in or released
were virtually the same. A simple approach to predicting the tip resistance of base
grouted shafts in cohesionless soils was suggested based on the results of this study.
The approach utilizes cone penetration resistance (qc) and the small strain shear
modulus (G0) of soil beneath the shaft, the shaft diameter (D), anticipated grout
pressure, and anticipated grout volume to predict both the final tip area and the unit tip
resistance-displacement response of a grouted shaft. The new method was applied to a

219
number of full-scale case studies reported in the literature for comparison, yielding
reasonable agreement. However, further validation of the proposed method (e.g., on-
site load testing) is required before it can be implemented in practice.
A comparison of the behavior of jetted and grouted piles (i.e., side and tip
grouted foundations) versus post grouted drilled shafts (i.e., side only grouted
foundations) showed that side grouting of a foundation prior to tip grouting has a
significant role in improving the capacity. In addition to improving the stress state
around pile and thus increasing the skin resistance, the side grouting also assists in
developing a high grout pressure during tip grouting and preventing the grouting flow
along the pile/shaft-soil interface. This allows the grout zone to expand as a spherical
bulb (i.e., cavity expansion) during tip grouting and improves the mean stress of the
underlying soil, which consecutively improves the unit tip resistance of the pile or shaft.
In case of group placement, side and tip grouting of adjacent piles within the group
increases the confining stress and relative density of the soil mass within the group.
Therefore the soil mass within the group footprint area experiences very low shear
strain during subsequent axial loading and the group fails as a single block with uniform
group displacement. But in case of tip only grouted foundations (tip grouted drilled
shafts), negligible increase in radial stress and radial soil displacement occurs around
shaft tips during tip grouting, due to low tip grout pressures. As a result high shear strain
develops in soil around the shaft tip during axial group loading and the individual failure
of each shaft in the group occurs. Thus the study proves that the side grouting of a
foundation prior to tip grouting has a major role in improving the axial response in
individual and group placement and the proposed hypothesis is validated.

220
LIST OF REFERENCES
AASHTO (1982). Standard recommended practice for evaluation of transportation related earth-borne vibrations, AASHTO Designation: R8-81.
AASHTO (2010). LRFD bridge design specifications, 5th Edition, AASHTO. ACI Standard ACI 318-08. (2008). Building code requirements for structural concrete,
American Concrete Institute, Farmington Hills, Michigan. Anderson, B. J., and Townsend, F.C. (2005). “Calibration of constitutive models for
Florida sands by drained triaxial tests,” Calibration of Constitutive Models, GeoFrontiers 2005, GSP 139, ASCE, 1-12.
ASTM D 1143/D 1143M (2007). Standard test methods for deep foundations under
static axial compression load, ASTM. ASTM D 2937 (2010). Standard test method for density of soil in place by the drive-
cylinder method, ASTM. Bathe, K. J. (1982). “Finite element analysis in engineering analysis,” Prentice Hall, New
Jersey. Bermingham, P. D. (2000). “STATNAMIC: The first ten years.” Proceedings of the
Second International Statnamic Seminar, Tokyo, Japan, October 28-30, 1998, 457-464.
Bishop, R. F., Hill, R., and Mott, N. F. (1945). “The theory of indentation and hardness
tests,” In: Proceedings of Physics Society, 57, 147-159. Bolognesi, A. J. L., and Moretto, O. (1973). “Stage grouting preloading of large piles on
sand,” In: Proceedings of 8th ICSME, Moscow, 20. Bolton, M. D. (1986). “The strength and dilatancy of sands,” Geotechnique, 36(1), 65-
78. Brown, D. A., Dapp, S. D., Thompson, W. R., and Lazarte, C. A. (2007). “Design and
construction of continuous flight auger piles,” Geotechnical Engineering Circular No.8, FHWA.
Bruce, D.A. (1986). “Enhancing the performance of large diameter piles by grouting,”
Parts 1 and 2, Ground Engineering, 19(4), 9-15 and 19(5), 1121-1126. Bruce, D.A. (2005). “Glossary of grouting terminology,” Journal of Geotechnical and
Geoenvironmental Engineering, ASCE, 131(12), 1534-1542.

221
Bullock, P. J., Schmertmann, J. H., McVay, M. C., and Townsend, F. C. (2005). “Side shear setup. I: test piles driven in Florida,” Journal of Geotechnical and Geoenvironmental Engineering, ASCE, 131(3), 292-300.
Carter, J. P., Booker, J. R., and Yeung, S. K. (1986). “Cavity expansion in cohesive
frictional soils,” Geotechnique, 36(3), 349-358. Chai, J., Miura, N., and Koga, H. (2005). “Lateral displacement of ground caused by
soil-cement column installation,” Journal of Geotechnical and Geoenvironmental Engineering, ASCE, 131(5), 623-632.
Chin, F. K. (1970). “Estimation of the ultimate load of piles from tests not carried to
failure,” In: Proc. 2nd S.E Asian conf. soil eng., Singapore, 81-92. Cubrinovski, M., and Ishihara, K. (1999). “Empirical correlation between SPT N -value
and relative density for sandy soils,” Soils and Foundations 39(5), 61-71. Dai, G., Gong, W., Zhao, X., and Zhou, X. (2010). “Static testing of pile-base post-
grouting piles of the Suramadu bridge,” Geotechnical Testing Journal 34(1), Paper ID GTJ102926.
Dapp, S., and Brown, D. (2010). “Evaluation of base grouted drilled shafts at the
Audubon bridge,” In: Proceedings of GeoFlorida 2010: advances in analysis, modeling & design, ASCE, 1553-1562.
Dapp, S. D., Muchard, M., and Brown, D. A. (2006). “Experience with base grouted
drilled shafts in the southeastern United State,” In: Proceedings of 10th international conference on piling and deep foundations, Deep foundations institute, Amsterdam 2006, article #1385, publication #77 (IC-2006).
De Beer, E. (1984). “Different behavior of bored and driven piles,” In: Proceedings of 6th
conf. on soil mech. and found. Eng., G. Petrasovits, ed., Budapest, 307–318. De Cock, F., Legrand, C., and Huybrechts, N. (2003). “Overview of design methods of
axially loaded piles in Europe,” Report of ERTC3-Piles, ISSMGE Subcommittee. In: Proc. 13th European conf. on soil mech. and geotech. Eng., Prague, Czech Republic, 663–715.
Duan, X., and Kulhawy, F. H. (2009). “Tip post-grouting of slurry-drilled shafts in soil:
Chinese experiences,” In: Proceedings of International Foundation Congress and Equipment Expo, Contemporary Topics in Deep Foundations (GSP 185), Orlando, FL, ASCE; 47-54.
Durham, C.J. (2006). “The behavior of bored piles in Perth CBD,” Final year honors
project, School of Civil & Resource Engineering, University of Western Australia, Australia.

222
Fahey, M. (1986). “Expansion of a thick cylinder of sand: A laboratory simulation of the
Pressuremeter test,” Geotechnique, 36(3), 397-424. FDOT (2002a). Section 455- Structures Foundations, Florida Department of
Transportation Standard. FDOT (2002b). Structures design guidelines for load and resistance factor design,
Florida Department of Transportation Standard. FDOT (2011). Structures Manual, 9, Florida Department of Transportation Standard. FHWA (2006). Roadway Construction Noise Model User’s Guide, FHWA-HEP-05-054. Fleming, W. G. K. (1992). “A new method for single pile settlement prediction and
analysis,” Geotechnique, 42(3), 411-425. Franke, E. (1993). “Design of bored piles, including negative skin friction and horizontal
loading,” In: Proc., 2nd Int. Geotech. Seminar on Deep Found. on Bored and Auger Piles, Van Impe, ed., Balkema, Rotterdam, Netherlands, 43–57.
Gabr, M. A., Borden, R. H., Denton, R. L., and Smith, A. W. (2004). “Characterization of
jetting-induced disturbance zone and associated ecological impacts,” Report No. FHWA/NC/2006-09, North Carolina State University in Corporation with North Carolina Department of Transportation and Institute for Transportation Research and Education.
Ghionna, V.N., Jamiolkowsi, M., Pedroni, S., and Salgado, R. (1994). “The tip
displacement of drilled shafts in sands,” In: Proc., Settlement’94, A. Yeung and T. Felio, eds., Vol. 2, Geotech. Engrg. Div., ASCE, Reston, VA, 1039–1057.
Gibson, R. E., and Anderson, W. F. (1961). “In situ measurement of soil properties with
pressuremeter,” Civil Engineering Public Works Review, 56, 615-618. Gouvenot, D., and Gabiax, F. D. (1975). “A new foundation technique using piles sealed
by concrete under high pressure,” Proceedings, Seventh Annual Offshore Technical Conference. Houston, Texas, Vol. 2, Paper No. OTC 2310, 641-656.
Gunaratne, M., Hameed, R. A., Kuo, C., and Reddy, D. V. (1999). “Investigation of the
effect of pile jetting and performing,” Research Report No. 772, Florida Department of Transportation, in Corporation with US Department of Transportation and Federal Highway Administration.
Hill, R. (1950). The mathematical theory of plasticity, Oxford University press.
223
Hirayama, H. (1990). “Load-settlement analysis for bored piles using hyperbolic transfer functions,” Soils and Foundations, 30(1), 55-64.
Hughes, J. M. O., Wrath, C. P. and Windle, D. (1977). “Pressuremeter tests in sands,”
Geotechnique, 27(4), 455-477. Jalinoos, F., Mekic, N., and Hanna, K. (2005).“Drilled shaft foundation defects:
identification, imaging, and characterization,” FHWA, Publication No. FHWA-CFL/TD-05-007.
Jamiolkowski, M., LoPresti, D.C.F., and Manassero, M. (2001). “Evaluation of relative
density and shear strength of sands from Cone penetration test and Flat dilatometer test,” Soil Behavior and Soft Ground Construction (GSP 119), Proceedings of the Symposium, Reston, VA, ASCE, 201-238.
Joer, H. A., Randolph, M. F., and Gunasena, U. (1998). “Experimental modeling of the
shaft capacity of grouted driven piles,” Geotechnical Testing Journal, ASTM, 21(3), 159-168.
Kishida, H. (1963). “Stress distribution by model piles in sand,” Soils and Foundations,
4(1), 1-23. Kog, Y. C. (2009). “Integrity problem of large-diameter bored piles,” Journal of
Geotechnical and Geoenvironmental Engineering, ASCE, 135(2), 237-245. Kraft, L. M. (1991). “Performance of axially loaded pipe piles in sand,” Journal of
Geotechnical Engineering, ASCE, 117(2), 272-296. Kulhawy, F. H., Kozera, D. W., and Withiam, J. L. (1979). “Uplift testing of model drilled
shafts in sand,” Journal of geotechnical engineering, 105(GT1), 31-47. Lai, P., McVay, M., Bloomquist, D., Forbes, M. (2010). “An innovative prefabricated pile
installation method utilizing jetting and pressure grouting,” Proceedings of the GeoFlorida 2010: Advances in Analysis, Modeling & Design (GSP 199) © 2010, ASCE. 1592-1601.
Lee, J. H., and Salgado, R. (1999). “Determination of pile base resistance in sands,”
Journal of Geotechnical and Geoenvironmental Engineering, 125(8), 673–683. MacGregor, J. R. (1992). “Reinforced concrete,” 2nd edition. Englewood cliffs, Prentice
Hall, New Jersey. Mayne, P.W., and Harris, D. E. (1993). “Axial load-displacement behavior of drilled shaft
foundation in Piedmont residium,” Tech. Rep.No. 41-30-2175, Federal Highway Administration, Washington, D.C.

224
McVay, M., Bloomquist, D., Forbes, H., and Johnson, J. (2009). “Prestressed concrete pile installation – utilizing jetting and pressure grouting,” Final Report submitted Florida Department of Transportation, Florida.
McVay, M. C., O'Brien, M., Townsend, F. C., Bloomquist, D. G., and Caliendo, J. A.
(1989). "Numerical analysis of vertically loaded pile groups," Proceedings of Foundation Engineering Congress, ASCE, Northwestern University, Illinois, 675-690.
Menard, L. (1957). “An apparatus for measuring the strength of soils in place,” MSc
Thesis, University of Illinois, Illinois, USA. Meyerhof, G. G. (1959). “Compaction of sands and bearing capacity of cohesionless
soils,” Journal of Soil Mechanics and Foundation Division, 85(SM6), 1-29. Meyerhof, G. G. (1976). “Bearing capacity and settlement of pile foundations,” Journal
of Geotechnical Engineering Division, ASCE, 102(3), 197-228. Muchard, M. (2004). “Report of test shaft post grouting and load testing,” Walton
County, Florida. Muchard, M., and Farouz, E. (2009). “Broadway viaduct design phase load test program
for post grouted shafts,” In: 34th annual Conference on deep foundations, Deep foundations institute, Kansas city.
Mullins, G., Dapp, S., Fredreric, E., and Wagner, R. (2001). “Pressure grouting drilled
shaft tips – phase I,” Final report submitted Florida Department of Transportation, Florida.
Mullins, G., and O’Neill, M. (2003). “Pressure grouting drilled shaft tip - a full-scale load
test program,” Research Report, Univ. of South Florida, Tampa, Florida. Mullins, G., and Winters, D. (2004). “Pressure grouting drilled shaft tips – phase II,”
Final report submitted to Florida Department of Transportation, Florida. Mullins, G., and Winters, D., and Dapp, S. (2006). “Predicting end bearing capacity of
post-grouted drilled shaft in cohesionless soils,” Journal of Geotechnical and Geoenvironmental Engineering, 132(4), 478–87.
NCHRP (2003). Structural supports for Highway signs, Luminaires and Traffic signals,
NCHRP report 494, National Cooperative Highway Research Program. Neely, W. J. (1991). “Bearing capacity of auger-cast piles in sand,” Journal of
Geotechnical Engineering, ASCE, 117(2), 331-345.

225
Ni, J. C., and Cheng, W. C. (2010). “Monitoring and modeling grout efficiency of lifting structure in soft clay,” International Journal of Geomechanics, 10(6), 223-229.
O’Neill, M. W. (1994). “Review of augured pile practice outside the United States,”
Transportation Research Record No. 1447, Design and Construction of Augur Cast Piles and Other Foundation Issues, Transportation Research Board, National Research Council, Washington, D.C., 3-9.
O’Neil, M. W., and Reese, L. C. (1999). “Drilled shafts: Construction procedures and
design methods,” FHWA, Publication No. FHWA-IF-95-025. Palmer, A. C. (1972). “Undrained plane-strain expansion of a cylindrical cavity in clays,”
Geotechnique, 22(3), 451-457. Plumbridge, G. D., and Hill, S. J. (2001). “Performance of shaft grouted piles and
barrettes,” Geotechnical Engineering: Meeting Society’s needs, proceedings of 14th Southeast Asian Geotechnical Conference, Hong Kong, Vol.1, ISBN 90 5809 250 X, 407-412.
Randolph, M. F., and Wroth, C. P. (1978). “Analysis of deformation of vertically loaded
piles,” Journal of Geotechnical Engineering Division, ASCE, 104(12), 1465-1488. Randolph, M. H., Dolwin, J., and Beck, R. (1994). “Design of driven piles in sand,”
Geotechnique, 44(3), 427-448. Robinsky, E. I., and Morrison, C. F. (1964). “Sand displacement and compaction around
model friction piles,” Canadian Geotechnical Journal, 1(2), 81-93. Ruiz, M. E. (2005). “Study of axially loaded post grouted drilled shafts using CPT based
load transfer curves,” M.S. Thesis, Department of Civil Engineering, University of Puerto Rico.
Salgado, R. (1995). “Design of piles in sands based on CPT results,” In: Proc. 10th Pan-
Am. conf. of soil mech. and found. eng, Guadalajara, 3,1261–1274. Salgado, R., Mitchell, J. K., and Jamiolkowski, M. (1997). “Cavity expansion and
penetration resistance in sand.” Journal of Geotechnical and Geoenvironmental Engineering, 123(4), 344-354.
Salgado, R., Mitchell, J. K., and Jamiolkowski, M. (1998). “Calibration chamber size
effects on penetration resistance in sand,” Journal of Geotechnical and Geoenvironmental Engineering, 124(9), 878-888.
Salgado, R., and Prezzi, A.M. (2007). “Computation of cavity expansion pressure and
penetration resistance in sands,” International Journal of Geomechanics, 7(4), 251-265.

226
Salgado, R., and Randolph, M. F. (2001). “Analysis of Cavity Expansion in Sand,”
International Journal of Geomechanics, ASCE, 1(2), 175-192. Schanz, T., Vermeer, P. A., and Bonnier, P.G. (1999). “The hardening soil model:
formulation and verification,” In: R. B. J. Brinkgrove, Editor, Beyond 2000 in Computational Geotechnics, Balkema, Rotterdam, 280-290.
Schnaid, F., and Houlsby, G. T. (1991). “An assessment of chamber size effects in the
calibration of in-situ tests in sand,” Geotechnique, 41(3), 437-445. Selby, A. R. (1991). “Ground vibrations caused by pile installation,” Proceedings of the
4th International Conference on Piling and Deep Foundations, Italy, 497-502. Shestopal, A. O. (1959). “Jetting of pipes, piles, and sheet piles,” Hydro project Institute,
Moscow, USSR. Smith, C. B., and Bloomquist, D. (2010). “Horizontal Permeameter: the design,
development and testing of a horizontal permeability laboratory test,” Magna Cum Laude Honors Research Project, University of Florida.
Stocker, M. (1983). “Influence of post-grouting on the load-bearing capacity of bored
piles,” In: Proceedings of the European conference on soil mechanics and foundation engineering, A. A. Balkema, Helsinki: Rotterdam, Finland, 167–70.
Svinkin, M. R. (2006). “Mitigation of soil movements from pile driving,” Practice
Periodical on Structural Design and Construction, ASCE, 11(2), 80-85. Teixeira, C. Z., and Albiero, J. H. (1994). “A evoluc¸a˜o da reac¸a˜o de ponta de estacas
escavadas submetidas a sucessivas provas de carga, In: Proc., 10th Brazilian conf. on soil mech. and found. eng., Foz DoIguacu, 1, 3–9.
Thiyyakkandi, S., McVay, M., Bloomquist, D., Lai, P. (2012). “Measured and predicted
response of a new jetted and grouted precast pile with membranes in cohesionless soils,” Journal of Geotechnical and Geoenvironmental Engineering, doi: 10.1061/(ASCE)GT.1943-5606.0000860.
Thiyyakkandi, S., McVay, M., Bloomquist, D., Lai, P. (2013). “Experimental study,
numerical modeling of and axial prediction approach to base grouted drilled shafts in cohesionless soils,” Acta Geotechnica, Springer. DOI: 10.1007/s11440-013-0246-3.
Timoshenko, S. P., and Goodier, J. N. (1970). Theory of Elasticity, McGraw-Hill, New
York.

227
Tsinker, G. P. (1988). “Pile Jetting,” Journal of Geotechnical Engineering, ASCE, 114(3), 326-336.
Vesic, A. S. (1972). “Expansion of cavities in infinite soil mass,” Journal Soil Mechanics
and Foundations Division, 98(3), 265-290. White, D. J., Finlay, T. C. R., Bolton, M. D., and Bearss G. (2002). “Press-in piling:
ground vibration and noise during pile installation,” Proceedings of the International Deep Foundations Congress, Orlando, USA, ASCE Special Publication 116, 363-371.
White, D. J., Sidhu, H. K., Finlay, T. C. R., Bolton, M. D., and Nagayama, T. (2000).
“Press-in piling: the influence of plugging on drivability,” Proceedings of the 8th International Conference of the Deep Foundations Institute, New York, 299-310.
Woods, R. D. (1997). “Dynamic effects of pile installations on adjacent structures,”
NCHRP Synthesis 253, Transportation Research Board, National Research Council, Washington D.C.
Youn, H., and Tonon, F. (2010). “Numerical analysis on post-grouted drilled shafts: a
case study at the Brazo River Bridge, TX,” Computers and Geotechnics, 37, 456–465.
Yu, H. S. (2000). Cavity expansion methods in geomechanics, Kluwer Academic
Publishers, London. Yu, H. S., and Houlsby, G.T. (1991). “Finite cavity expansion in dilatant soils – loading
analysis,” Geotechnique, 41(2), 173-183.

228
BIOGRAPHICAL SKETCH
Sudheesh Thiyyakkandi was born in Kerala state, India and remained in Kerala
until he moved to United States to join the PhD program. He earned his Bachelor of
Technology (B. Tech) degree in Civil Engineering from University of Calicut, Kerala,
India in 2002. He received his Master of Technology (M. Tech) degree in Civil
Engineering (Geotechnical) in 2004 from the University of Kerala, India. Soon after M.
Tech, he joined Ideal Educational Society (IES) College of Engineering, Thrissur,
Kerala, as Lecturer in Civil Engineering. In August 2005 he joined National Institute of
Technology Calicut, Kerala, India as Lecturer/Assistant Professor. He was accepted by
the Department of Civil and Coastal Engineering Department at the University of Florida
for doctoral program in August 2008. He worked as graduate research assistant under
Dr. Michael C. McVay while doing PhD. He completed his Doctor of Philosophy in May
2013.