Embed Size (px)
Citation preview

1
EFFECTS OF ILLUMINANCE LEVELS ON TASK PERFORMANCE
By
S. ZACHARY TAMINOSIAN
A THESIS PRESENTED TO THE GRADUATE SCHOOL OF THE UNIVERSITY OF FLORIDA IN PARTIAL FULFILLMENT
OF THE REQUIREMENTS FOR THE DEGREE OF MASTER OF SCIENCE IN BUILDING CONSTRUCTION
UNIVERSITY OF FLORIDA
2009

2
© 2009 S. Zachary Taminosian

3
To my brothers, Samuel and Jacob

4
ACKNOWLEDGMENTS
I would like to thank my chair, Dr. Hinze, for his incredible patience and research
expertise. I also thank the members of my supervisory committee for their continuing
support and assistance in obtaining study participants. I thank Dottie Beaupied for her
excellent guidance and friendship. In addition, I would like to thank my family for giving
me all the tools needed to make this possible.
.

5
TABLE OF CONTENTS page
ACKNOWLEDGMENTS .................................................................................................. 4
LIST OF TABLES ............................................................................................................ 7
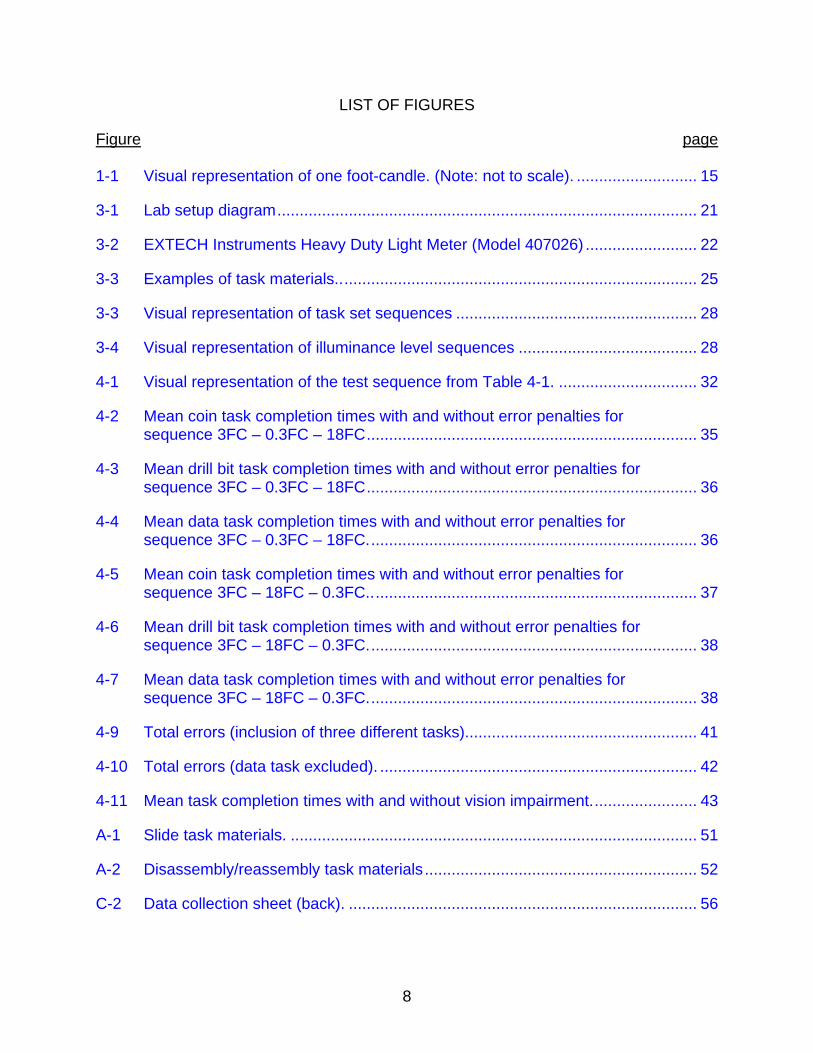
LIST OF FIGURES .......................................................................................................... 8
LIST OF ABBREVIATIONS ............................................................................................. 9
ABSTRACT ................................................................................................................... 10
CHAPTER
1 INTRODUCTION .................................................................................................... 12
Overview ................................................................................................................. 12 Statement of Problem ............................................................................................. 13
2 LITERATURE REVIEW .......................................................................................... 14
3 METHODOLOGY ................................................................................................... 19
Overview ................................................................................................................. 19 Experimental Design ............................................................................................... 19
Independent Variables: .................................................................................... 19 Dependent Variables: ....................................................................................... 19
Experimental Layout and Apparatus ....................................................................... 19 Testing Environment ........................................................................................ 19 Lab Setup ......................................................................................................... 20 Illuminance Levels ............................................................................................ 21 Task Design ..................................................................................................... 23 Tasks and Materials ......................................................................................... 23
Coin task .................................................................................................... 23 Drill bit task ................................................................................................ 24 Data task .................................................................................................... 24
Task Set Modifications ..................................................................................... 24 Procedure ............................................................................................................... 25
Overview .......................................................................................................... 25 Procedure Outline ............................................................................................ 26 Task Instructions .............................................................................................. 27 Task Set Sequencing ....................................................................................... 27 Illuminance Level Sequencing .......................................................................... 27
Data Collection Sheet ............................................................................................. 28 Testing Protocol Approval ....................................................................................... 28 Participants ............................................................................................................. 29

6
4 RESULTS ............................................................................................................... 30
Participant Characteristics ...................................................................................... 30 Quantitative Analysis .............................................................................................. 30
Analysis of Mean Completion Times with Error Penalties ................................ 35 Analysis of Mean Completion Times Where No Errors Occurred ..................... 39 Errors Analysis ................................................................................................. 40 Participant Characteristic Analysis ................................................................... 42
Vision impairment ...................................................................................... 42 Shirt/blouse hue ......................................................................................... 43
5 CONCLUSIONS ..................................................................................................... 45
Core Observations .................................................................................................. 45 Additional Observations .......................................................................................... 46
Vision Impairment ............................................................................................. 46 Shirt/Blouse Hue .............................................................................................. 46 Foot-Candle Measurements ............................................................................. 47
Summary ................................................................................................................ 47
6 RECOMMENDATIONS ........................................................................................... 49
Research Recommendations .................................................................................. 49 Practice Recommendations .................................................................................... 50
APPENDIX
A ELIMINATED TASKS: DESCRIPTIONS AND FIGURES ....................................... 51
Slide Task: .............................................................................................................. 51 Assembly/Disassembly Task: ................................................................................. 52
B TASK INSTRUCTIONS ........................................................................................... 53
Coin Task Instructions: ........................................................................................... 53 Drill Bit Task Instructions: ....................................................................................... 53 Data Task Instructions: ........................................................................................... 53
C DATA COLLECTION SHEET ................................................................................. 55
LIST OF REFERENCES ............................................................................................... 57
BIOGRAPHICAL SKETCH ............................................................................................ 58

7
LIST OF TABLES
Table page 2-1 Minimum illumination intensities in foot-candles (OSHA). .................................. 16
4-1 Task completion data with error penalties .......................................................... 32
4-2 Task completion data for cases where no errors occurred. ................................ 33
4-3 Number of task errors. ........................................................................................ 40
8
LIST OF FIGURES
Figure page 1-1 Visual representation of one foot-candle. (Note: not to scale). ........................... 15
3-1 Lab setup diagram .............................................................................................. 21
3-2 EXTECH Instruments Heavy Duty Light Meter (Model 407026) ......................... 22
3-3 Examples of task materials.. ............................................................................... 25
3-3 Visual representation of task set sequences ...................................................... 28
3-4 Visual representation of illuminance level sequences ........................................ 28
4-1 Visual representation of the test sequence from Table 4-1. ............................... 32
4-2 Mean coin task completion times with and without error penalties for sequence 3FC – 0.3FC – 18FC .......................................................................... 35
4-3 Mean drill bit task completion times with and without error penalties for sequence 3FC – 0.3FC – 18FC .......................................................................... 36
4-4 Mean data task completion times with and without error penalties for sequence 3FC – 0.3FC – 18FC. ......................................................................... 36
4-5 Mean coin task completion times with and without error penalties for sequence 3FC – 18FC – 0.3FC.. ........................................................................ 37
4-6 Mean drill bit task completion times with and without error penalties for sequence 3FC – 18FC – 0.3FC. ......................................................................... 38
4-7 Mean data task completion times with and without error penalties for sequence 3FC – 18FC – 0.3FC. ......................................................................... 38
4-9 Total errors (inclusion of three different tasks). ................................................... 41
4-10 Total errors (data task excluded). ....................................................................... 42
4-11 Mean task completion times with and without vision impairment. ....................... 43
A-1 Slide task materials. ........................................................................................... 51
A-2 Disassembly/reassembly task materials ............................................................. 52
C-2 Data collection sheet (back). .............................................................................. 56

9
LIST OF ABBREVIATIONS
CFR Code of Federal Regulations
E Illuminance
FC Foot-candles
IES Illuminating Engineering Society
IRB Institutional Review Board
OSHA Occupational Safety and Health Administration
SD Standard deviation
SPSS Statistical Package for the Social Sciences

10
Abstract of Thesis Presented to the Graduate School of the University of Florida in Partial Fulfillment of the
Requirements for the Degree of Master of Science in Building Construction
EFFECTS OF ILLUMINANCE LEVELS ON TASK PERFORMANCE
By
S. Zachary Taminosian
December 2009
Chair: Jimmie Hinze Major: Building Construction
It is generally accepted that differing illuminance levels have a direct effect on
sight-related task performance. The Occupational Safety and Health Administration
provides guidelines for minimum light levels on construction sites but little data exists on
the reduction in construction performance levels or the increase in accident occurrence
due to insufficient lighting. Some research has been conducted in the area of lighting,
but most of it focuses on highway construction projects, especially nighttime
construction. No special research work on the effects of illuminance on basic
construction task performance has been found during the preliminary literature review.
The objectives of this study were
• Explore the effects of illuminance levels on performance of simple sight-related tasks.
• Examine the findings to develop recommendations which might provide improved performance and safety on construction jobsites.
The research consisted of the physical testing of volunteers to collect data on task
performance under different lighting levels. Task completion times and errors were
recorded.

11
The data collected were analyzed to identify statistically significant relationships
related to illuminance levels and task performance. Recommendations were developed
based on the results of the data analysis.

12
CHAPTER 1 INTRODUCTION
Overview
Productivity is an important factor in the construction industry. It is evident that
productivity or performance rates can be affected by the environment in which work is
performed. One aspect of the environment that has not been examined to a great
extent in the construction industry is the level of illuminance in the work environment
and the resultant impact on performance.
Recognition by the federal government of the need for proper illuminance can be
found within the guidelines set forth by the Occupational Safety and Health
Administration (OSHA) 29 Code of Federal Regulations (CFR) 1926 Construction
Industry Regulations. One of the many requirements contained within the OSHA
regulatory subparts and paragraphs are minimum standards and practices for jobsite
lighting or illumination. While the OSHA regulations are focused on safety, it could be
inferred that lighting characteristics of a jobsite might have a direct effect on
performance.
OSHA requires that work done in general construction areas can be performed
under lighting conditions of three foot-candles while office work is to be performed with
30 foot-candles of illumination. While the concept of a foot-candle (the amount of light
from a candle emitted on a square foot of surface at a distance of one foot) is easy to
understand, it is not a measure with which most people have any familiarity. For
example, how well could the light intensity in a given room be estimated in terms of foot-
candles?

13
This lack of familiarity with foot-candle measurements was a key factor in the
genesis of this research. The research was to provide greater insights about the
meaning associated with different levels of light intensity. More importantly, this evolved
into the central theme of the study which was to investigate how performance varies
with different light levels.
Statement of Problem
A review of the literature suggests that the level, type, and distribution of lighting
on a jobsite may constitute a contributing or causal factor in the occurrence of
accidents. While light levels are often noted as possible factors in accident causation, it
is interesting to note that very little hard data exists in this area. Some specific cases
can be found where light levels were ultimately deemed responsible for accident
occurrences but these are lacking in abundance and detail. Research which examines
the correlation between sight-related task performance under varied illuminance is also
lacking.

14
CHAPTER 2 LITERATURE REVIEW
The construction industry must occasionally rely on artificial lighting to carry out
work, both indoors and during nighttime hours. While daylight is still heavily relied upon
in many work environments, it is often insufficient to provide the required levels of
illuminance for optimum productivity and safety. According to the Illuminating
Engineering Society (IES), the advantages of good lighting include greater accuracy
and better workmanship, improved quality of product, increased production, decreased
cost, and the ability of the eye to see quicker and in greater detail (Illuminating
Engineering Society 1961).
Luminous flux is the amount of luminous energy emanating from a given source
and is measured in lumens (lm). A typical candle produces a total intensity of 12.57
lumens. Illuminance (E) is defined as one lumen falling uniformly on one square foot of
surface area and is measured in foot-candles (FC) (Stein and Reynolds 2000). It
follows then, that one foot candle is equal to the amount of light emitted by one candle
on a one square foot surface area at a distance of one foot (see Figure 1-1 for a visual
representation of one foot candle).
Another important term frequently used is brightness. Brightness is the amount of
light that is generated by a source of light or reflected from a surface (Illuminating
Engineering Society 1961). Brightness is subjective and relies on perception by the
human eye. The objective form of brightness is referred to as luminance (L) whereby
levels can be measured and reproduced (Stein and Reynolds 2000). These are the
terms and units of measure that are commonly used to describe the primary aspects of
illuminance.

15
Figure 1-1. Visual representation of one foot-candle. (Note: not to scale).
The Occupational Safety and Health Administration (OSHA) requires minimum
levels of illumination in the workplace in order to provide a safe environment for
workers. What effect does safety have on performance? One study examined this
relationship and found that safety and performance appear to be dependent on each
other (Hinze 1976; Hinze and Parker 1978). The study also asserts that, for the most
part, “excellent performance cannot be achieved in the absence of good safety
performance” (Hinze 1976; Hinze and Parker 1978).
Evidence of a correlation between light levels and safety can be found in a number
of studies. One such study by Hinze and Carlisle (1990) found that reduced visibility on
nighttime projects increased the inherent hazards of construction. This study also
concluded that artificial lighting must be sufficient to permit clear visibility without
creating glare. In addition, poor visibility must be addressed to maintain an acceptable
level of work quality (Hinze and Carlisle 1990). Although three foot-candles is the
minimum lighting level required by the OSHA regulations on construction sites, the
Illuminating Engineering Society (IES) claims that less than 30 foot-candles is

16
undesirable because at lower levels of brightness the eyes do not focus sharply and
they do not accurately converge on an object (Illuminating Engineering Society 1961).
The minimum OSHA illumination intensities are shown in Table 2-1.
Table 2-1. Minimum illumination intensities in foot-candles (OSHA). Foot-candles Area of operation
5 General construction area lighting
3 General construction areas, concrete placement, excavation and waste areas, access ways, active storage areas, loading platforms, refueling, and field maintenance areas.
5 Indoors: warehouses, corridors, hallways, and exitways.
5
Tunnels, shafts, and general underground work areas: (Exception: minimum of 10 foot-candles is required at tunnel and shaft heading during drilling, mucking, and scaling. Bureau of Mines approved cap lights shall be acceptable for use in the tunnel heading)
10 General construction plant and shops (e.g., batch plants, screening plants, mechanical and electrical equipment rooms, carpenter shops, rigging lofts and active store rooms, mess halls, and indoor toilets and workrooms.)
30 First aid stations, infirmaries, and offices. (Source: U.S. Department of Labor 1970)
A review of fatality cases that were investigated by OSHA from 1990 to 2007 (data
provided directly to Dr. Hinze by OSHA) revealed that there are a number of cases in
which lighting was an apparent factor in accident causation. The following two cases
have been paraphrased and describe the circumstances in which lighting was
insufficient to ensure the safety of workers.
The first case involved a worker on a hotel/casino construction project. The
worker walked into a poorly illuminated and isolated area while on an assignment to
locate fire and smoke dampers within the building’s air conditioning ducts. The worker
subsequently stepped into an uncovered opening in the floor and fell 23 feet to his
death.
The second case concerned an employee on a nighttime clean up crew at a dry-
dock. The crew was responsible for cleaning up sandblasting materials left by a
previous crew within the cargo tanks of a ship. While looking for brushes needed for

17
cleaning, the employee descended into what was described as a totally dark fuel bunker
tank. Upon reaching a lower level within the tank, the worker began walking around in
the dark and stepped into an opening in the deck. He subsequently fell approximately
30 feet to his death.
An Internet search for incidences citing inadequate illuminance as a contributing
factor provided an additional example. The accident occurred in Washington, D.C.,
where a laborer fell through a hole in the second story of a federal building which was
under construction. The investigation which followed pointed out that the walls in the
room where the accident occurred were dark in color and only a single, dark tinted
window was installed. Furthermore, two temporary 100 watt bulbs were hanging from
the ceiling, with the closest one to the accident being non-functional. For investigative
purposes, it was assumed that the inoperative light was working at the time of the
accident. A horizontal measurement showed the light to be 10 feet from the hole. Light
meter readings taken by the investigator showed levels of between 0.2 and 0.8 foot
candles. Although OSHA requires only five foot candles in such an area, both the
District of Columbia labor laws and the IES Lighting Handbook require 10 foot candles.
Levels were significantly below either requirement (Mazer 2002).
An additional study, conducted for the Transportation Research Board by Ralph
D. Ellis, Jr., and Ashish Kumar, found that the artificial lighting required for construction
operations at night varies with the type of job and has the potential to affect the output
of the construction crew. This study also found that inadequate lighting is a factor which
affects productivity on a project-by-project basis (Ellis and Kumar 1993).

18
According to Peter Boyce, head of the Lighting Research Center’s Human
Factors Program in Troy, New York, “The purpose of lighting is to enable people to see
and do things” (Morgan 2001). Another expert, Mark S. Rea, Director of the Lighting
Research Center, stated that “A successful lighting application must deliver light where
it is needed” (Morgan 2001). For this reason it is important to consider which type of
lighting might be used to produce optimum quality and productivity.
Xenon-filled lamps are often used in the construction industry and supply bright
white light with excellent color rendering properties. Fluorescent tubes are a common
choice for ambient lighting but have poor color rendering and a weak beam (Fischer
2005). This makes them a poor choice if the tasks require seeing at a distance or
distinguishing color. In an incandescent lamp, light is produced by a wire or filament
which is heated to incandescence by its resistance to the flow of electric current.
Incandescent lamps produce a continuous spectrum of light (Illuminating Engineering
Society 1961). In addition, they are widely available and have good color rendering
properties (Security 2002).
Insufficient lighting is considered by many contractors to be the root source of
problems with nighttime construction. This can be seen in the study by Hinze and
Carlisle (1990) where a number of respondents indicated a drop in the quality of surface
finishes when road construction was carried out at night. Unevenness of the paving
surface was the main problem indicated and inspection of the work was also a problem
due to shadows. Many state highway agencies agree that the difficulty of providing
adequate lighting has an adverse impact on quality (Hinze and Carlisle 1990).

19
CHAPTER 3 METHODOLOGY
Overview
The objective of this research was to determine how differing levels of illuminance
affect performance. It was decided to examine this through exercises that evaluated
sight-related task completion times and errors. These exercises were developed to
explore the level of performance when lighting conditions were modified.
Experimental Design
This study employed a within-subjects design. Each participant completed three
different tasks at three different levels of illuminance. Each of the three tasks relied on
making visual assessments. Once the tasks were completed at one illuminance level, a
similar set of these three tasks were repeated at another illuminance level. Three
different light levels were used. The illuminance level sequences and set sequences
were systematically changed in order to control for variations in the differences between
tasks.
Independent Variables:
• Three illuminance levels: 0.3 foot-candles, 3 foot-candles, 18 foot-candles • Participant characteristics: age, eye color, shirt/blouse color, vision impairment Dependent Variables:
• Task completion times • Errors in task completion
Experimental Layout and Apparatus
Testing Environment
Testing was conducted on the University of Florida campus. During preliminary
planning, it was decided to carry out testing in a covered office cubicle. After examining
20
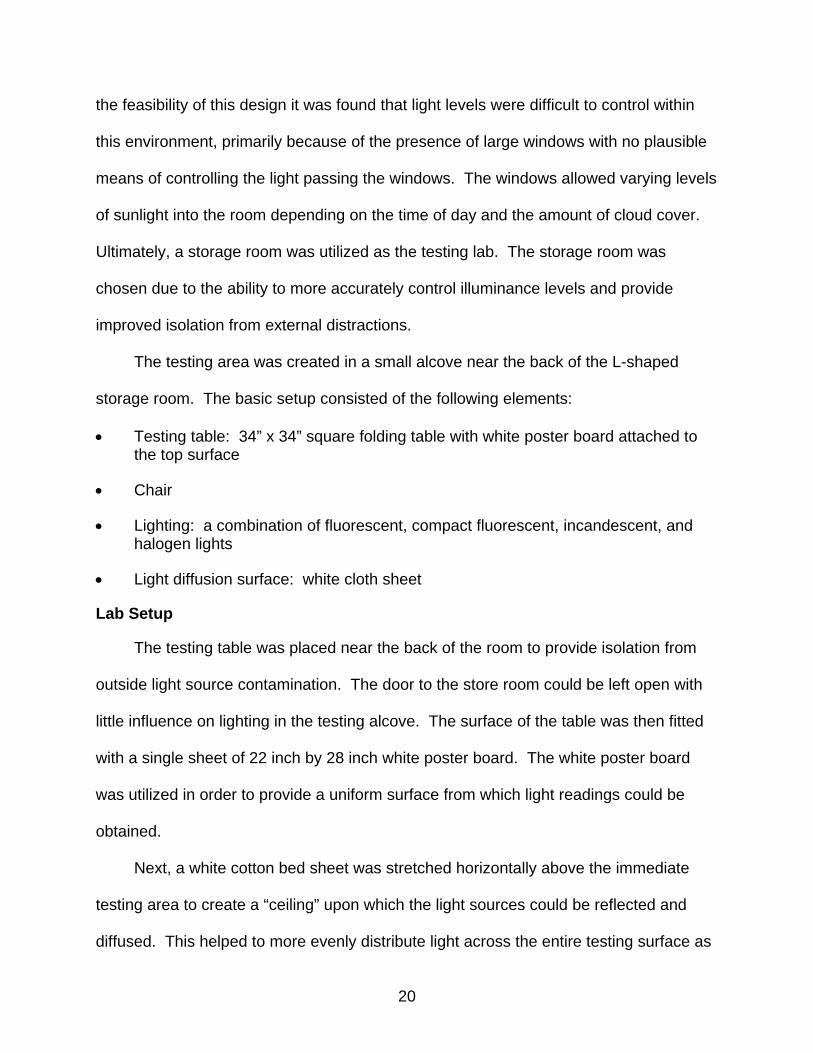
the feasibility of this design it was found that light levels were difficult to control within
this environment, primarily because of the presence of large windows with no plausible
means of controlling the light passing the windows. The windows allowed varying levels
of sunlight into the room depending on the time of day and the amount of cloud cover.
Ultimately, a storage room was utilized as the testing lab. The storage room was
chosen due to the ability to more accurately control illuminance levels and provide
improved isolation from external distractions.
The testing area was created in a small alcove near the back of the L-shaped
storage room. The basic setup consisted of the following elements:
• Testing table: 34” x 34” square folding table with white poster board attached to the top surface
• Chair
• Lighting: a combination of fluorescent, compact fluorescent, incandescent, and halogen lights
• Light diffusion surface: white cloth sheet
Lab Setup
The testing table was placed near the back of the room to provide isolation from
outside light source contamination. The door to the store room could be left open with
little influence on lighting in the testing alcove. The surface of the table was then fitted
with a single sheet of 22 inch by 28 inch white poster board. The white poster board
was utilized in order to provide a uniform surface from which light readings could be
obtained.
Next, a white cotton bed sheet was stretched horizontally above the immediate
testing area to create a “ceiling” upon which the light sources could be reflected and
diffused. This helped to more evenly distribute light across the entire testing surface as

21
well as reducing the effects of glare. A sheet of foam poster board was also placed at
an angle directly in front of the testing table in order to eliminate direct line of sight to the
light source and to help direct a majority of light towards the “diffusion ceiling”.
The compact fluorescent, incandescent, and halogen light fixtures were then
placed in elevated positions relative to the testing table surface and directed at or
through the “diffusion ceiling”. The room’s own installed fixtures provided the
fluorescent source. The incandescent source was fitted with a dimmer switch in order
to more accurately control lower lighting levels. A simple diagram of the lab setup is
shown in Figure 3-1.
Figure 3-1. Lab setup diagram
Illuminance Levels
Three different illuminance levels were examined in this study and are sometimes
referred to as “Dim”, “Moderate”, and “Bright”. The levels designated to these terms are
0.3 foot candles, 3 foot candles, and 18 foot candles respectively. Illuminance levels
were achieved by turning on specific combinations of the artificial lights. The ideal

22
lighting that was initially desired was 30 foot-candles instead of 18 foot-candles. This is
because the OSHA regulations stipulate that lighting in construction areas should be in
the range of 3 to 30 foot-candles. Since the light level with all three lights on was 18
foot candles and this was relatively consistent across the table surface, this seemed to
be an acceptable level of lighting.
Two light meters of the exact make and model shown in Figure 3-2 were used to
calibrate the three illuminance levels used in this study. The use of two meters provided
for redundancy and validity of measurements. Illuminance levels were determined by
measuring the light being reflected from the testing table’s surface. Measurements
were taken with the light sensor being held approximately 12 to 14 inches above the
testing surface. This distance was used in order to approximate participants’ head
positions observed during preliminary testing. Levels were checked each day prior to
beginning testing and at random, frequent intervals throughout the duration of the study.
Test results showed virtually no variation of lighting on the table surface for light levels
of 0.3 and 3 foot-candles. At the 18 foot-candle level, the variation was minimal but did
vary at some locations, but never more than 2 foot-candles.
Figure 3-2. EXTECH Instruments Heavy Duty Light Meter (Model 407026)

23
Task Design
Initial planning involved the conception and design of tasks to test the existence of
a relationship between illuminance levels and performance. The research team (this
researcher and the committee chair) determined that tasks should entail minimum
complexity while affording a sight-related challenge which might vary with lighting
intensity. A variety of tasks were originally considered for use in this study. After
careful consideration and discussion among fellow researchers, a total of five tasks
were finally devised.
Next, a procedural framework was developed and preliminary testing occurred.
Preliminary testing provided acceptable results in terms of data acquisition and
suitability of the tasks. Two of the five tasks were eliminated early in the study due to
difficulty (non-visual factors were very apparent and complicated the test) and time
restraints (all tests were to be completed within ten minutes). The following tasks and
materials constitute the final procedure used to test the independent variables of this
study. Examples of task materials are shown in Figure 3-3.
Tasks and Materials
Coin task
Materials:
Three sets of five pennies attached to white poster board card, white poster board cover
Description:
Pennies were oriented so all mint dates could be read horizontally from left to right.
Each set of five coins was marked uniquely with letters A, B, or C for identification
purposes. The cover was used in order to shield the mint dates from being identified
until the task was begun. The covers were also marked for ease of set identification.

24
Drill bit task
Materials:
Three sets of three drill bits of differing sizes (Set A: 9/64”, 3/16”, 7/32”; Set B: 1/8”,
13/64”, 1/4”; Set C: 5/32” 11/64”, 15/64”), small plastic tub, plastic drill bit case
Description:
Each set of three drill bits was contained within one of three plastic tubs. Each set was
marked uniquely with letters A, B, or C for identification purposes. The plastic tubs were
used to provide containment for the drill bits when presenting them to each participant.
The plastic drill bit case was green in color with respective sizes marked in raised
numbers on the inside.
Data task
Materials:
Three similar data charts (line graphs)
Description:
Data charts were printed in black ink on white paper. The charts displayed data
regarding re-incarceration rates of prisoners as disclosed in a particular study. Each of
the three charts was marked uniquely with letters A, B, or C for identification purposes.
Task Set Modifications
Two tasks were eliminated early in the testing process. Data obtained from these
tasks were not included in the data analysis and had no effect on the final results.
Examples of the two tasks that were eliminated from the study are shown in Appendix
A.
The first eliminated task required participants to extract specific information from five 35-
millimeter projection slides attached to white poster board. This task was eliminated

25
due to difficulty and frustration experienced at lower light levels, i.e., participants were
unable to see the information in the slides at the low light levels.
The second eliminated task involved an apparatus which the participant was
asked to disassemble, add parts in designated positions, and reassemble it. The
apparatus design proved cumbersome to participants and was susceptible to
malfunction.
A B
C Figure 3-3. Examples of task materials. A) coin task, B) drill bit task, C) data task.
Procedure
Overview
Prior to commencement of testing, a standardized procedure was defined. Even
after a few of the initial participants were tested, some modifications to the procedure

26
occurred. The modifications were made to increase the efficiency of the procedure and
to contribute to the validity of the data.
It should be noted that participants entered the testing lab one at a time. Those
participants waiting to take the test were asked to wait outside the “test room” where
they could not hear the tests being performed.
Procedure Outline
• Step 1: Volunteers were asked to participate in an experiment that would be completed in approximately ten minutes. Interested individuals were asked to sign up for a testing time, arranged in 15 minute blocks.
• Step 2: Willing participants entered into the “test room” and were seated at the test table which had a plain white surface.
• Step 3: Participants were presented with a consent form and an explanation of the need for such a form was given. An overall description of the procedure was given.
• Step 4: The light level was set at a predetermined foot-candle level and a number of questions were asked while the participant’s eyes were allowed to adjust to the light.
• Step 5: Questions were asked of each of the participants regarding their age, vision impairment, whether or not corrective lenses were being worn, and if any reading or learning impairments existed. The participants’ eye color and shirt/blouse color were also noted.
• Step 6: Task materials were then placed in front of the participant.
• Step 7: The researcher provided directions on how to complete the task to be performed.
• Step 8: After a task was described, the participant was told to begin the given task.
• Step 9: The researcher recorded the task completion time of the test and recorded information on any errors that were made.
• Step 10: The task materials were removed from the table.
• Step 11: A second task was described and steps six through ten were repeated.
• Step 12: A third task was described and steps six through ten were repeated.

27
• Step 13: The light levels was adjusted to the next predetermined foot-candle value and a 20 to 30 second eye-adjustment period was allowed.
• Step 14: The participant was then asked to perform the same tasks (with a different task set) at the revised illuminance level. The completion times and accuracy were noted.
• Step 15: The light level was again modified and an eye adjustment period was allowed.
• Step 16: The participant was then asked to perform the same tasks (with a different task set) at the third level of lighting.
• Step 17: The participant was informed that the testing was concluded and asked if they had any comments regarding any aspect of the testing procedure. If comments were provided, those comments were recorded on the data sheet.
• The participant was thanked for participating in the research and was excused.
Task Instructions
Instructions were given prior to the beginning of each task. Instructions explained
the materials being presented and described how the participant was to properly carry
out the task. A description of those instructions is shown in Appendix B.
Task Set Sequencing
Three task sets (e.g. Coin Set A, Coin Set B, Coin Set C) were used in an effort to
control for learning curve effects. The order in which these sets were tested was
alternated to control for variations between sets. Sequences always began with set B
for the first test. For the second and third tests either set A or C was used. This
provided for two possible set sequences. A visual representation of set sequences is
depicted in Figure 3-3.
Illuminance Level Sequencing
Illuminance level sequencing was employed in an effort to control for any
difficulties participants might experience for their eyes to adjust to the varied illuminance

28
levels. It also helped to counter the learning curve effect when a particular sequence
was used. Sequences always began with 3 foot-candles for the first test. For the
second and third tests either 0.3 foot candles or 18 foot candles were used. A visual
representation of the illuminance sequences is shown in Figure 3-4.
Test 2 (Set A) Test 3 (Set C)
Test 1 (Set B)
Test 2 (Set C) Test 3 (Set A)
Figure 3-3. Visual representation of task set sequences
Test 2 (FC = 0.3) Test 3 (FC = 18)
Test 1 (FC = 3)
Test 2 (FC = 18) Test 3 (FC = 0.3)
Figure 3-4. Visual representation of illuminance level sequences
Data Collection Sheet
A data collection sheet was utilized for each test. The collection sheet recorded
qualitative data (participant characteristics) as well as quantitative data (task completion
times and errors). An example of the data sheet is shown in Appendix C.
Testing Protocol Approval
Prior to performing any testing, a protocol and consent form were submitted to the
University of Florida Institutional Review Board (IRB). The protocol outlined the testing
procedure and any perceived risks to study participants. The consent form served to
inform participants that no perceived risks existed in conjunction with the study and that
confidentiality would be maintained. IRB approval was granted after minor revisions to
the consent form.

29
Participants
It was decided that university students would be suitable participant candidates.
Students are generally young individuals whose vision tends to be better than that of the
older population. Volunteers were obtained through two methods. Some participants
were simply approached on campus, while others were recruited through classes they
were attending.

30
CHAPTER 4 RESULTS
Participant Characteristics
A total sample size of 115 participants was tested in this study. The ages of
participants ranged from 17 years to 69 years with a median age of 22 years. Of those
115 participants, 89 (77.4%) were male and 26 (22.6%) were female. A majority of the
participants described themselves as having either blue (34.8%) or brown (45.2%) eyes.
Vision impairment was reported by 59 (51.3%) of the participants. The most common
vision problem was near-sightedness which was indicated by 48 (81.4%) of those 59
participants experiencing vision impairment. Use of glasses and contacts were closely
matched at 27 (23.5%) and 24 (20.9%) participants, respectively. While 55 (47.8%)
participants reported using corrective lenses, only 37 (67.3%) of them wore lenses
during the test.
Quantitative Analysis
The core focus of this study was to determine if and to what extent performance
was influenced at different illuminance levels. In order to examine the relationship
between performance times at different illuminance levels, the data were analyzed
using a variety of conditional criteria. All statistical analyses of data were performed
using the Statistical Package for the Social Sciences (SPSS) software.
The first approach was to examine the mean and median task completion times for
all participants. It was decided that any task times where participants made errors
should be penalized by a standard value of 20% of the task completion time for each
error. This penalty was assessed to provide a means by which completion times might
31
also reflect performance accuracy. This was deemed acceptable since accuracy of
work is implicitly linked with higher levels of performance.
Analysis of task completion times with errors assessed for penalties yielded the
data shown in Table 4-1. The information shown in the table takes into account the
illuminance sequence and provides the sample size, task completion times in terms of
mean and median values, and the standard deviation for each task. For each task, two
test sequences existed. The first test was conducted at 3 foot candles, the second test
was conducted at either 0.3 or 18 foot candles, and the third was conducted at 18 or 0.3
foot candles. A visual example of how these data might be translated for a given
illuminance sequence is shown in Figure 4-1.
The highlighted values in Figure 4-1 show that data which were obtained through
analysis of the coin task where illuminance levels started at 3 foot-candles then
decreased to 0.3 foot-candles and finally increased to 18 FC. Comparisons were made
between data in this manner.
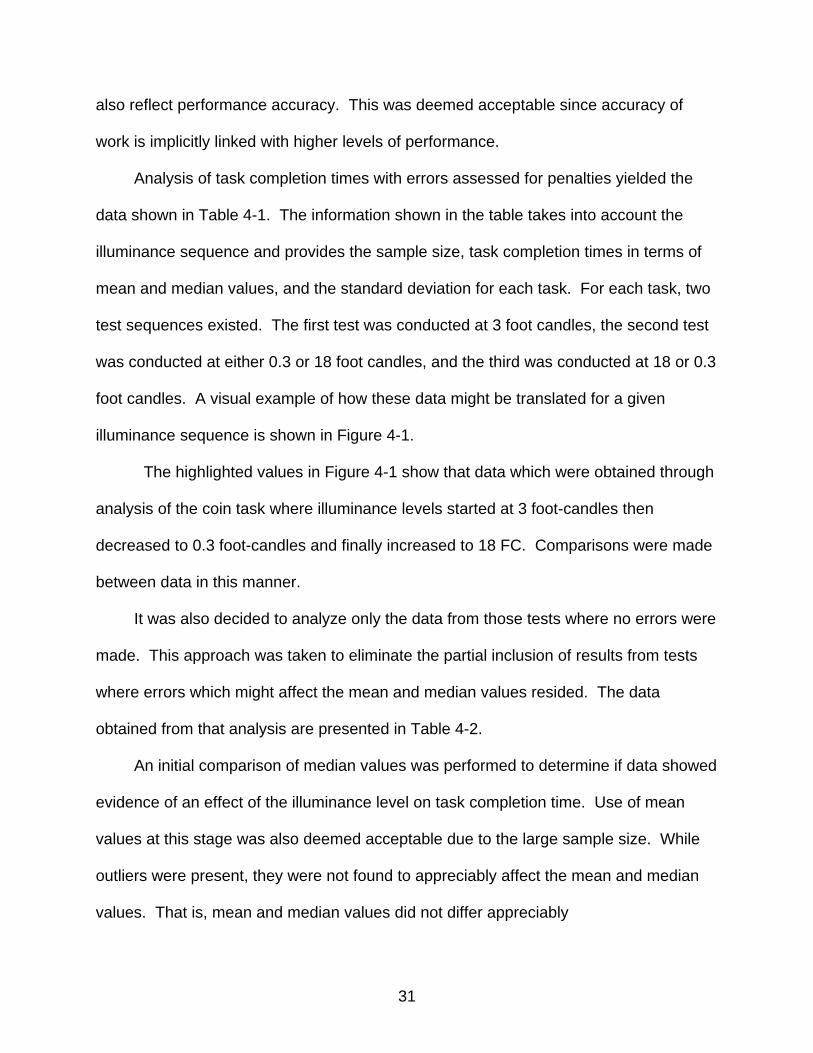
It was also decided to analyze only the data from those tests where no errors were
made. This approach was taken to eliminate the partial inclusion of results from tests
where errors which might affect the mean and median values resided. The data
obtained from that analysis are presented in Table 4-2.
An initial comparison of median values was performed to determine if data showed
evidence of an effect of the illuminance level on task completion time. Use of mean
values at this stage was also deemed acceptable due to the large sample size. While
outliers were present, they were not found to appreciably affect the mean and median
values. That is, mean and median values did not differ appreciably

32
Table 4-1. Task completion data with error penalties E1 = 3 FC
Task N Mean Median SD CoinT1 86 8.54 7.12 6.64 DrillT1 86 27.38 26.50 5.72 DataT1 86 9.68 8.63 4.44
E2 = 0.3 FC CoinT2 43 14.47 11.09 11.69 DrillT2 43 46.63 31.28 75.10 DataT2 43 5.81 4.84 3.20
E2 = 18 FC CoinT2 44 5.89 5.53 1.96 DrillT2 44 21.85 21.04 4.08 DataT2 44 3.99 3.80 1.39
E3 = 0.3 FC CoinT3 50 12.90 9.65 7.34 DrillT3 50 32.87 27.78 18.8 DataT3 50 4..81 3.97 2.96
E3 = 18 FC CoinT3 63 6.57 5.75 3.93 DrillT3 63 22.74 21.25 8.68 DataT3 64 4.16 3.68 2.06 Note: T(n) indicates Test(test sequence), E(n) indicates Illuminance(test sequence)
CoinT2 (FC=0.3,N=43, x ̄=14.47, x=11.69) CoinT3 (FC=18, N=63, x=̄6.57, x=5.75)
CoinT1 (FC=3, N=86, x=̄8.54, x=7.12)
CoinT2 (FC=18, N=44, x=̄5.89, x=5.53) CoinT3 (FC=0.3, N=50, x=̄12.90, x=7.34)
Figure 4-1. Visual representation of the test sequence from Table 4-1.
33
Table 4-2. Task completion data for cases where no errors occurred. E1 = 3 FC
Task N Mean Median SD CoinT1 32 6.88 6.48 1.80 DrillT1 68 26.63 25.36 5.12 DataT1 63 8.53 7.94 3.28
E2 = 0.3 FC CoinT2 16 10.09 8.70 6.83 DrillT2 34 29.45 29.12 5.88 DataT2 31 5.21 4.62 3.18
E2 = 18 FC CoinT2 16 5.05 5.10 0.90 DrillT2 34 21.62 20.75 4.33 DataT2 32 3.81 3.69 1.24
E3 = 0.3 FC CoinT3 16 8.85 8.36 2.21 DrillT3 34 31.18 26.98 19.72 DataT3 32 4.02 3.8 1.57
E3 = 18 FC CoinT3 16 5.35 5.32 0.99 DrillT3 34 20.13 19.69 3.93 DataT3 31 3.53 3.15 1.40 Note: T(n) indicates Test(test sequence), E(n) indicates Illuminance(test sequence)
The initial comparison showed that differences in task completion times did exist.
For the coin and drill bit tasks, median test times were higher at lower illuminance
levels. Conversely, median test times were best (lowest) when performed at the highest
illuminance level. The data task (the third task) completion times were not entirely
consistent to this effect and it was noted by many participants that learning was
influential in their ability to correctly determine answers. It was also pointed out by
some participants that the white background made answers relatively easy to find at all
three light levels. The data reflect this observation. It was determined that further
analysis was warranted.

34
To test for differences between results, a simple test of two means was performed.
The formula used to compare the two means is shown in Equation 1. This test
assumes normality of data. Mean completion times were compared between
illuminance levels for a given task and the illuminance sequence. The Z-score was then
used to determine if there was a statistically significant difference between the means.
Z-score values greater than or equal to 1.645 indicate statistical significance at less
than the 0.05 level. Any differences which showed a statistical significance at less than
the 0.05 level were deemed significant.
(Equation 4-1)
Where:
x1̄ = Mean value of sample 1 x2 = Mean value of sample 2
S1 = Standard deviation of sample 1
S2 = Standard deviation of sample 2
N1 = Number of cases in sample 1
N2 = Number of cases in sample 2
Z = Number of standard deviations that separate the means (values greater than 1.645 indicate a difference between the means that is statistically significant at less than the 0.05 level)
. The bar graphs in Figures 4-2, 4-3, and 4-4 show mean task completion times
where illuminance was set at 3 foot candles followed by 0.3 foot candles and finally 18
foot candles. Conversely, Figures 4-5, 4-6, and 4-7 show results of tests where the
illuminance level was set at 3 foot candles followed by 18 foot candles and finally 0.3
= Z

35
foot candles. Two times are represented within the figures. The first bar (non-patterned
bars) includes time penalty adjustments for errors. The second bar (patterned bars)
shows unadjusted mean completion times for those tests where no errors occurred.
Analysis of Mean Completion Times with Error Penalties
Mean task completion times with error penalties were compared between different
illuminance levels. For the sequence where illuminance levels began at 3 foot-candles
and were reduced to 0.3 foot-candles, an increase in coin task completion times from
8.54 seconds to 14.47 seconds was observed, providing for a difference between times
(ΔT) of 5.93 seconds (Figure 4-2). A Z-score of -3.087 showed this difference to be
highly significant.
8.54
14.47
6.576.88
10.09
5.35
02468
10121416
First Test 3 FC
Second Test 0.3 FC
Third Test18 FC
Illuminance Level of Test
Aver
age
Task
Com
plet
ion
Tim
e (s
econ
ds)
Figure 4-2. Mean coin task completion times with and without error penalties for
sequence 3FC – 0.3FC – 18FC. (Note: Solid areas denote times with penalty assessments for errors and textured areas denote only test results with no errors).
For the same sequence, the drill bit task (Figure 4-3) showed an increase in time
from 27.38 seconds to 46.63 seconds (ΔT = 19.25 sec.), with a significant Z-score of -
With error penalties
Without error penalties

36
1.678. The data task for this sequence (Figure 4-4) resulted in a decrease from 9.68
seconds to 5.81 seconds (ΔT = -3.87 sec.), a decrease that is highly statistically
significant at a Z-score of 5.661.
27.38
46.63
22.7426.63
29.45
20.13
05
101520253035404550
First Test 3 FC
Second Test 0.3 FC
Third Test18 FC
Illuminance Level of Test
Aver
age
Task
Com
plet
ion
Tim
e (s
econ
ds)
Figure 4-3. Mean drill bit task completion times with and without error penalties for
sequence 3FC – 0.3FC – 18FC. (Note: Solid areas denote times with penalty assessments for errors and textured areas denote only test results with no errors).
9.68
5.81
4.16
8.53
5.21
3.53
0
2
4
6
8
10
12
First Test 3 FC
Second Test 0.3 FC
Third Test18 FC
Illuminance Level of Test
Aver
age
Task
Com
plet
ion
Tim
e (s
econ
ds)
Figure 4-4. Mean data task completion times with and without error penalties for
sequence 3FC – 0.3FC – 18FC. (Note: Solid areas denote times with penalty assessments for errors and textured areas denote only test results with no errors).

37
When the illuminance levels increased from 0.3 foot-candles to 18 foot-candles,
coin task completion times decreased from 14.47 seconds to 6.57 seconds (ΔT = -7.90
sec.) with a highly statistically significant Z-score of 4.270. In addition, drill bit
completion times decreased from 46.63 seconds to 22.47 seconds (ΔT = - 23.89 sec.)
with a statistically significant Z-score of 2.077. Data completion times decreased from
5.81 seconds to 4.16 seconds (ΔT = - 1.65) with a Z-score of 2.990.
Where illuminance levels changed from 3 foot-candles to 18 foot-candles task
completion times with penalties assessed were evaluated. The coin task completion
times (Figure 4-5) exhibited a decrease from 8.54 seconds to 5.89 seconds
(ΔT = -2.65 sec.) and a statistically significant Z-score of 3.421. Drill bit task times
(Figure 4-6) decreased from 27.38 to 21.85 (ΔT = -5.53 sec.) with a statistically
significant Z-score of 6.348. Data times (Figure 4-7) also decreased from 9.68 seconds
to 3.99 seconds (ΔT = -5.69 sec.) with a highly statistically significant Z-score of
10.887.
8.54
5.89
12.9
6.88
5.05
8.85
0
2
4
6
8
10
12
14
First Test 3 FC
Second Test 18 FC
Third Test0.3 FC
Illuminance Level of Test
Aver
age
Task
Com
plet
ion
Tim
e (s
econ
ds)
Figure 4-5. Mean coin task completion times with and without error penalties for
sequence 3FC – 18FC – 0.3FC. (Solid areas denote times with error penalty assessments and textured areas denote only test results with no errors).

38
27.38
21.85
32.87
26.63
21.62
31.18
0
5
10
15
20
25
30
35
First Test 3 FC
Second Test 18 FC
Third Test0.3 FC
Illuminance Level of Test
Aver
age
Task
Com
plet
ion
Tim
e (s
econ
ds)
Figure 4-6. Mean drill bit task completion times with and without error penalties for
sequence 3FC – 18FC – 0.3FC. (Solid areas denote times with error penalty assessments and textured areas denote only test results with no errors).
9.68
3.994.81
8.53
3.81 4.02
0
2
4
6
8
10
12
First Test 3 FC
Second Test 18 FC
Third Test0.3 FC
Illuminance Level of Test
Aver
age
Task
Com
plet
ion
Tim
e (s
econ
ds)
Figure 4-7. Mean data task completion times with and without error penalties for
sequence 3FC – 18FC – 0.3FC. (Solid areas denote times with error penalty assessments and textured areas denote only test results with no errors).
Finally, a comparison was made where the illuminance level was decreased from
18 foot-candles to 0.3 foot-candles. Coin task completion times increased from 5.89
seconds to 12.90 seconds (ΔT = 7.01 sec.) with a highly statistically significant Z-score
of -6.495. Drill times were found to increase from 21.85 seconds to 32.87 seconds
39
(ΔT = 11.02 sec.). Data task times also increased slightly from 3.99 seconds to 4.81
seconds (ΔT = 0.82 sec.) with a statistically significant Z-score of -1.752.
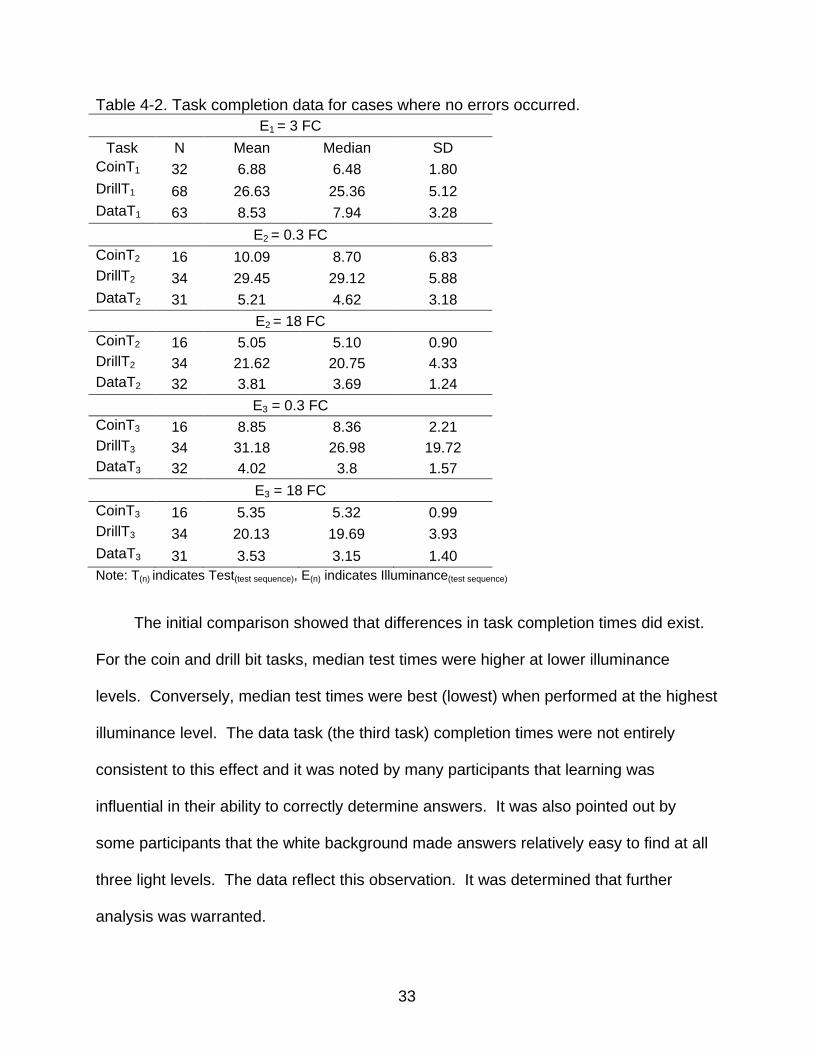
Analysis of Mean Completion Times Where No Errors Occurred
Analysis of mean coin task completion times restricted to tests in which no errors
occurred yielded similar results. When illuminance levels decreased from 3 foot-
candles to 0.3 foot-candles, mean coin task completion times increased from 6.88
seconds to 10.09 seconds (ΔT = 3.21 sec.) with a statistically significant Z-score of -
1.848. Drill times increased from 26.63 seconds to 29.45 seconds (ΔT = 2.82 sec.) with
a statistically significant Z-score of -2.381. Conversely, data task completion times
decreased from 8.53 seconds to 5.21 seconds (ΔT = -3.32 sec.) with a highly statistically
significant Z-score of 4.709.
When the level was increased from 0.3 foot-candles to 18 foot-candles, the mean
coin task completion times decreased from 10.09 seconds to 5.35 seconds (ΔT = -4.74
sec) with a statistically significant Z-score of 2.747. Drill task times decreased from
29.45 seconds to 20.13 seconds (ΔT = -9.32 sec.) with a highly statistically significant Z-
score of 7.684. Data task times for this sequence also decreased from 5.21 seconds to
3.53 seconds (ΔT = -1.68 sec.) with a statistically significant Z-score of 2.692.
The increase from 3 foot-candles to 18 foot-candles resulted in a 1.83 second
decrease in mean coin task completion times from 6.88 seconds to 5.05 seconds (ΔT = -
1.83 sec.) and yielded a highly statistically significant Z-score of 4.696. Drill task
completion times decreased from 26.63 seconds to 21.62 seconds (ΔT = -5.01 sec.)
with a highly statistically significant Z-score of 5.176. Additionally, data task completion
times decreased from 8.53 seconds to 3.81 seconds (ΔT = -4.72 sec.).

40
Finally, decreasing the illuminance from 18 foot candles to 0.3 foot candles
increased coin task completion times from 5.05 seconds to 8.85 seconds (ΔT = 3.80
sec.) with a highly statistically significant Z-score of -6.370. Drill task times showed an
increase from 21.62 seconds to 31.18 seconds (ΔT = 9.56 sec.) with a statistically
significant Z-score of -2.761 and data task times increased from 3.81 seconds to 4.02
seconds (ΔT = 0.21 sec.) with a non-significant Z-score of -0.594.
Errors Analysis
Task completion errors are shown in Table 4-3. Errors were totaled per individual
task and illuminance sequence. For example, when the first illuminance level was set at
3 foot candles, 21 participants made errors in the coin task and seven made errors in
the drill bit task. In addition, when the first illuminance level was set at 3 foot-candles,
49 errors were made in the three tasks.
Table 4-3. Number of task errors. Test Coin Drill Data Total
Test 1 3 FC 21 7* 21 49**
Test 2 0.3 FC 24 4 3 31
Test 2 18 FC 5 1 2 8
Test 3 0.3 FC 27 7 3 37
Test 3 18 FC 3 1 4 8
Note: Data interpretation example * When the first illuminance level was set at 3 foot candles, seven participants made errors in the drill bit task. ** When the first illuminance level was 3 foot candles, 49 errors were made in the three tasks.
To simplify the data analysis for comparative purposes, all errors per individual
illuminance level were combined. The total number of errors for each light level are
summarized in Figure 4-5. The data show that the highest number of errors (68)
occurred at the lowest illuminance level of 0.3 foot-candles. Conversely, the fewest

41
number of errors (16) occurred at the highest level of illuminance of 18 foot candles,
while the number of errors (49) which occurred at the moderate level of 3 foot-candles
fell between the two extremes.
Since the mean time task completion analysis showed some anomaly (larger
number of errors in the data task at 3 foot-candles than at 0.3 foot-candles) in regards
to the data task, a second error analysis was conducted. To control for this data task
anomaly, all errors which occurred in the data task were excluded from the total number
of errors for each illuminance level. Error occurrence trends remained consistent with
prior analysis as can be seen in Figure 4-10. The most errors (62) occurred at the
lowest illuminance level while the fewest errors (10) occurred at the highest illuminance
level. Error occurrence at the moderate illuminance level (28) fell between the two
extremes.
Total Errors
68
48
16
01020304050607080
0.3 FC 3 FC 18 FC
Illuminance Level
To
tal
Nu
mb
er o
f E
rro
rs
Figure 4-9. Total errors (inclusion of three different tasks).

42
Total Errors
62
28
10
0
10
20
30
40
50
60
70
0.3 FC 3 FC 18 FC
Illuminance Level
Tota
l Num
ber o
f Err
ors
Figure 4-10. Total errors (data task excluded).
Participant Characteristic Analysis
Two additional variables were briefly examined in relation to the illuminance levels
and performance. Those variables pertained to the vision impairment of participants
and the color of the shirt/blouse of the participants. For these abbreviated analyses,
data task completion times were not examined (coin task and drill bit task only) due to
the evidence of the influence of the learning curve observed in the prior analyses.
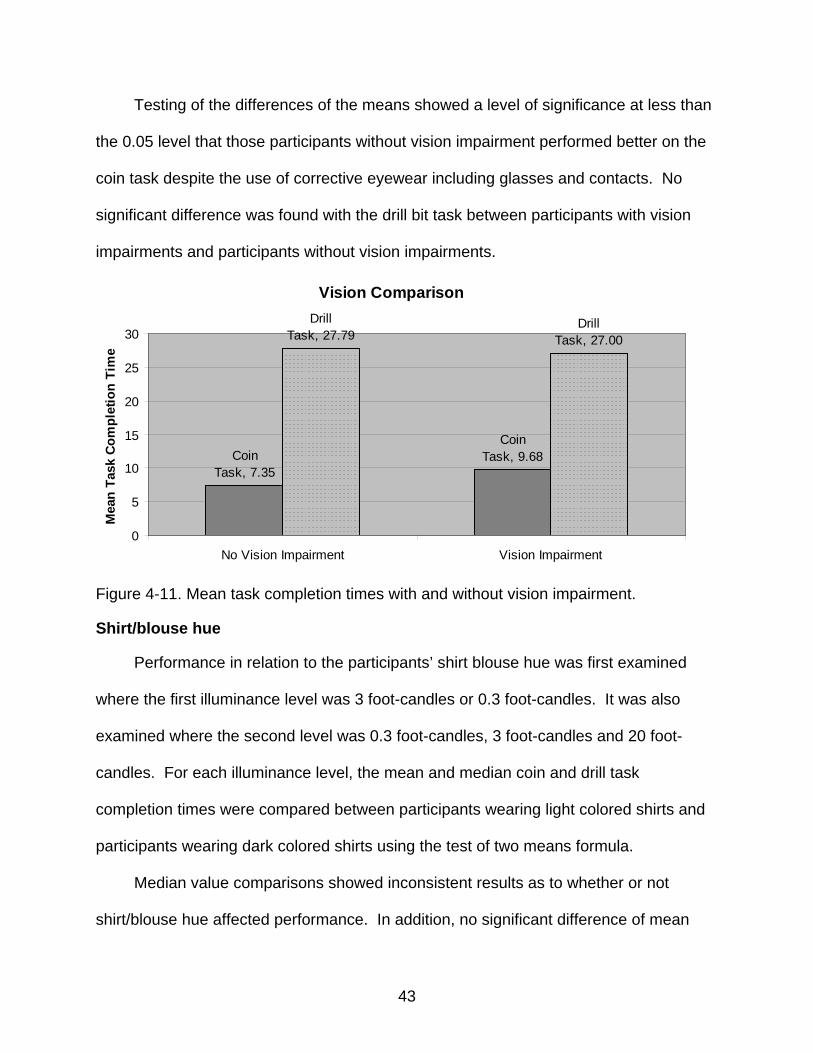
Vision impairment
In order to examine the relationship between vision impairment and performance
at different illuminance levels, the mean task completion times were compared. In this
case, mean completion times at the 3 foot-candle level were compared between
participants who reported having vision impairment and participants with no vision
impairment. Analysis was conducted at the 3-foot candle level because it yielded the
largest sample size. The data from this analysis are summarized in Figure 4-11.
43
Testing of the differences of the means showed a level of significance at less than
the 0.05 level that those participants without vision impairment performed better on the
coin task despite the use of corrective eyewear including glasses and contacts. No
significant difference was found with the drill bit task between participants with vision
impairments and participants without vision impairments.
Vision Comparison
Coin Task, 7.35
Coin Task, 9.68
Drill Task, 27.79
Drill Task, 27.00
0
5
10
15
20
25
30
No Vision Impairment Vision Impairment
Mea
n Ta
sk C
ompl
etio
n Ti
me
Figure 4-11. Mean task completion times with and without vision impairment.
Shirt/blouse hue
Performance in relation to the participants’ shirt blouse hue was first examined
where the first illuminance level was 3 foot-candles or 0.3 foot-candles. It was also
examined where the second level was 0.3 foot-candles, 3 foot-candles and 20 foot-
candles. For each illuminance level, the mean and median coin and drill task
completion times were compared between participants wearing light colored shirts and
participants wearing dark colored shirts using the test of two means formula.
Median value comparisons showed inconsistent results as to whether or not
shirt/blouse hue affected performance. In addition, no significant difference of mean

44
completion times was found between participants wearing either light or dark shirts at
any light level. The only circumstance where a near significance could be found was for
the drill bit task where the first illuminance level was 3 foot-candles. In this instance,
participants were found to perform slightly better when wearing a darker colored shirt
with a significance level slightly greater than 0.05, indicating a tendency toward
significance. Findings are inconclusive.

45
CHAPTER 5 CONCLUSIONS
The focus of this research was to explore how illuminance levels might affect
performance. The expectation was that task completion times would increase as
illuminance levels decreased and that task completion accuracy would decline with a
decrease in illuminance values. Conversely, task completion speed was expected to
increase and accuracy would improve with elevated lighting levels.
Core Observations
This study found that significant differences in performance did occur at different
illuminance levels. Task completion times were much higher at the 0.3 foot-candle level
when compared to the 3 and 18 foot-candle levels. On the other hand, fastest
completion times consistently occurred at the 18 foot-candle level. The only exception
to this was the data task where studying the graph in the test consumed considerable
time.
In the case of the data task, where illuminance changed from 3 foot-candles to 0.3
foot-candles to 18 foot-candles, task completion times decreased at each level. When
the sequence was 3 to 18 to 0.3 foot-candles, the completion times decreased
significantly at the 18 foot-candle level then increased slightly at 0.3 foot-candles. It
was assumed that inconsistency in the data test results was due mainly to a learning
curve effect. This was supported by many participants who actually observed this after
testing was completed. It appears in both instances however, that the learning curve
effect was countered by a decrease in illuminance when the task was performed at the
lowest light intensity. Since differences were significant in all other cases, it appears
that the sequence of illuminance was not important.

46
Examination of task error occurrence also indicates that better performance occurs
at higher illuminance levels. The number of errors was decidedly higher at lower
illuminance levels while higher illuminance levels resulted in the fewest errors. This is
an important factor to consider in terms of job site illuminance since performance is
often measured in terms of accuracy. It should be noted that the trend in error
occurrence was consistent, regardless of illuminance sequence, providing further
evidence that the eye adjustment period between different illuminance tests did not
influence results.
Additional Observations
Vision Impairment
It was decided to briefly examine how vision impairment might affect performance
when correlated with different illuminance levels. This analysis found that vision
impairment made a significant difference in coin task completion times at the 3 foot-
candle level. Participants who reported vision impairment showed higher completion
times than participants with no vision impairment, even though corrective lenses in the
form of contacts or glasses were worn. The lack of a significant difference for the drill
bit task might be partly attributed to the fact that participants were allowed to pick up the
task materials, whereas in the coin task they were not. Further research might indicate
that minimum illuminance requirements should take vision impairment into account.
Shirt/Blouse Hue
Another variable which was examined was the shirt/blouse hue of the participants.
The question was postulated as to whether or not the hue of clothing might significantly
affect some aspect of the illuminance level and therefore consequently affect
performance. This analysis examined the coin and drill task completion times between
47
participants wearing either light or dark colored shirts. While a near statistically
significant difference was found between light and dark shirts in one particular instance,
it is interesting to note that the outcome in that case was somewhat counterintuitive to
the researcher. Those results showed that participants wearing dark shirts performed
better than participants wearing light shirts. As a whole, data indicate that the hue of
workers’ clothing should not be considered to be influential upon performance.
Foot-Candle Measurements
While theoretically the determination of actual illuminance levels in a given setting
might seem like an easy task, in reality it is not. During the developmental stage of this
research, many practice measurements were taken with the light meter in order to
familiarize the researcher with the equipment and to determine an optimum method for
measuring lab illuminance levels. During this initial process, a high amount of variability
in light meter readings was observed. The readings could be affected by any number of
variables such as location, distance from the surface being measured, distance from
light sources, etc. A wide variety of readings could be obtained by simply turning the
sensor from side to side. This might present a problem for jobsite safety personnel as
well as accident investigators.
Summary
Participants performed better in terms of faster completion times and fewer errors
at higher illuminance levels. While OSHA stipulates that 3 foot-candles is sufficient for
general construction areas, this research suggests that performance suffers at this level
as compared to 18 foot-candles.
If light levels influence safety, and performance is dependent upon safety, then it
can be concluded that higher illuminance levels positively affect safety and provide for a
48
higher level of performance. Conversely, lower illuminance levels negatively affect
safety and result in lower performance. In short, when performing detailed work on a
jobsite, proper lighting is important to ensure fast and accurate performance.
.

49
CHAPTER 6 RECOMMENDATIONS
Research Recommendations
This research utilized a fairly large sample size (115 participants) which yielded
acceptable subset sample sizes when filtering for specific variables such as illuminance
level and vision impairment. Future research in this area might strive for a larger overall
sample size so that additional variables might be investigated with higher levels of
confidence. Furthermore, additional illuminance levels should be tested and compared.
Specifically, the various levels required by OSHA should be studied.
Further analysis of vision impairment at different illuminance levels should be
carried out to determine if special lighting considerations should be made when
impairment is present. The research could also be expanded to include an analysis of
performance in relation to specific types of corrective lenses used, eye color, and color
blindness.
This study originally sought to compare findings of illuminance in actual jobsite
conditions. This approach was eliminated from the research design due to the
extensive variability in light meter readings that were noted. Future studies might
address gaining more consistency with these readings. At the very least, future
research should recognize and make provision for the lack of consistency when taking
measurements with these devices.
For any future analysis of data recorded in this study, data task results should be
excluded due to the suspected influence of the learning curve effect. If this study is to
be replicated, it is recommended that participants be presented with sample versions of

50
task materials and instructions prior to actual testing. This would serve to further
eliminate learning curve effects for all tasks.
Practice Recommendations
Construction industry professionals should become more familiarized with
minimum illuminance level requirements. Programs should be implemented where
frequent measurements of actual jobsite levels are required. Workers should also be
notified of the importance of illuminance levels and asked to report any areas where
substandard lighting exists.
Maintaining jobsite illuminance levels above the OSHA minimum of 3 foot-candles
is highly recommended. The findings in this study even suggest that the OSHA
minimum requirement should be raised in order to provide for better safety and
performance. Additionally, improvements in the reporting and investigation of accidents
where improper illuminance was a contributing factor would help to provide more data in
this area.

51
APPENDIX A ELIMINATED TASKS: DESCRIPTIONS AND FIGURES
The following tasks were eliminated from the procedure due to time constraints
and/or difficulty.
Slide Task:
Materials:
Three sets of three 35-millimeter projection slides, white poster board cards
Description:
Each set of three slides was attached to a white poster board card. Each set was
marked uniquely with letters A, B, or C for identification purposes (Figure A-1.).
Procedure:
Participants were presented with a slide card and read a question pertaining to each
slide. The slides were uncovered one at a time and the participant was to find the
answer and call it out.
Figure A-1. Slide task materials.

52
Assembly/Disassembly Task:
Materials:
Small apparatus constructed of three wooden slats and three bolts, six washers
Description:
The apparatus was constructed so that three wooden slats could be stacked using the
three bolts (Figure A-2). Placement within the apparatus for additional parts was
marked individually with letters A through F. The washers to be added were also
individually marked with corresponding letters A through F.
Procedure:
The participant was presented with the apparatus and a diagram showing how the
apparatus should be assembled. The participant then disassembled the apparatus,
added the washers and reassembled it. The task was graded for accuracy upon
completion.
A B
C Figure A-2. Disassembly/reassembly task materials. A) disassembled, B) assembled, C)
assembly diagram.
53
APPENDIX B TASK INSTRUCTIONS
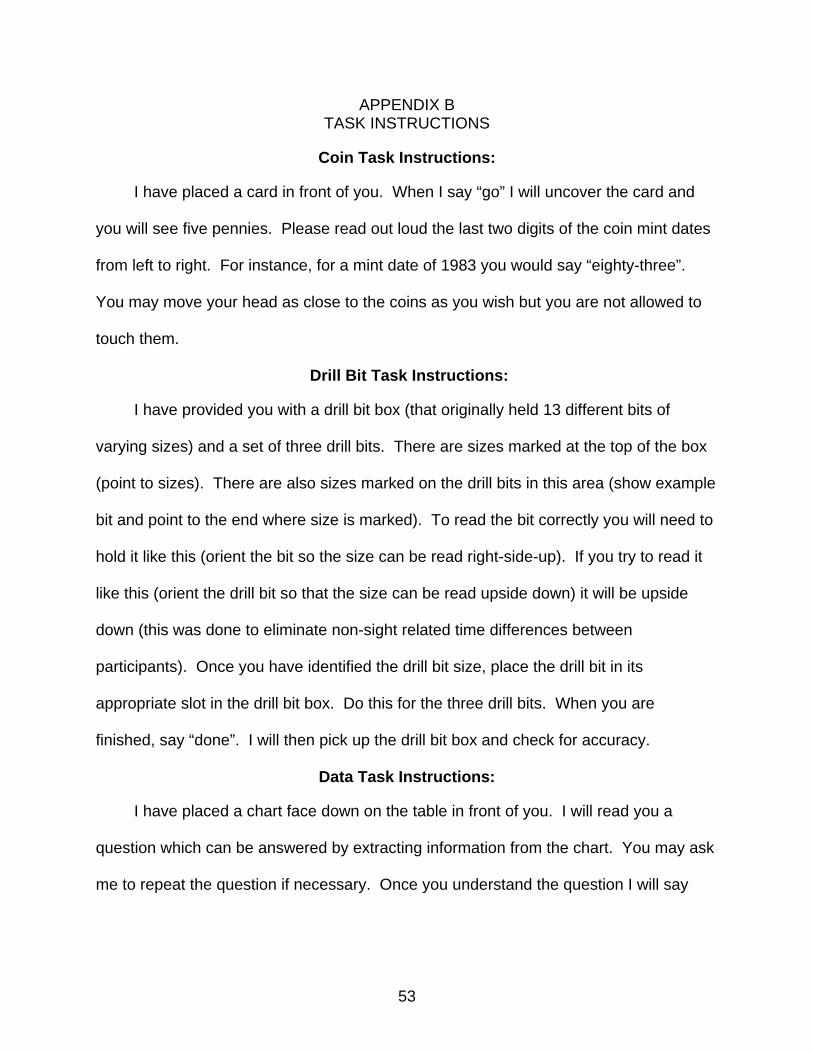
Coin Task Instructions:
I have placed a card in front of you. When I say “go” I will uncover the card and
you will see five pennies. Please read out loud the last two digits of the coin mint dates
from left to right. For instance, for a mint date of 1983 you would say “eighty-three”.
You may move your head as close to the coins as you wish but you are not allowed to
touch them.
Drill Bit Task Instructions:
I have provided you with a drill bit box (that originally held 13 different bits of
varying sizes) and a set of three drill bits. There are sizes marked at the top of the box
(point to sizes). There are also sizes marked on the drill bits in this area (show example
bit and point to the end where size is marked). To read the bit correctly you will need to
hold it like this (orient the bit so the size can be read right-side-up). If you try to read it
like this (orient the drill bit so that the size can be read upside down) it will be upside
down (this was done to eliminate non-sight related time differences between
participants). Once you have identified the drill bit size, place the drill bit in its
appropriate slot in the drill bit box. Do this for the three drill bits. When you are
finished, say “done”. I will then pick up the drill bit box and check for accuracy.
Data Task Instructions:
I have placed a chart face down on the table in front of you. I will read you a
question which can be answered by extracting information from the chart. You may ask
me to repeat the question if necessary. Once you understand the question I will say

54
“go”. You may then flip the chart over, place it back on the table, and call out the
answer once you find it.

55
APPENDIX C DATA COLLECTION SHEET
Effects of Illuminance Levels on Performance DATA COLLECTION SHEET
Date:_________ Time:__________ Participant Age:_________ Gender: M F Eye Color:_________ Shirt/Blouse Hue: LIGHT MEDIUM DARK Vision Impairment: YES NO Impairment Type: Near-sighted Far-sighted Astigmatism Injury Other:________ Corrective Lenses: YES NO
If answered yes to previous question:
Corrective Lens Type: Glasses Contacts Bifocals Other:____________ Corrective lenses worn during testing: YES NO
Color Blindness: YES NO Reading or Learning Impairment: YES NO If answered yes to previous question please describe (optional):
Figure C-1. Data collection sheet (front).

56
Task 1: Coin Mint Date Identification Illumination Level: __3__ ft. candles Set: A B C Coin 1 2 3 4 5 Time Date Illumination Level: _____ ft. candles Set: A B C Coin 1 2 3 4 5 Time Date Illumination Level: ______ ft. candles Set: A B C Coin 1 2 3 4 5 Time Date Task 2: Drill Bit Size Identification Illumination Level: ___3_ ft. candles Set: A B C Time: ________
Illumination Level: _____ ft. candles Set: A B C Time: ________
Illumination Level: _____ ft. candles Set: A B C Time: ________
Task 3: Technical Data Chart Level: __3__ ft. cdl Set: A B C Ans: ______ Time: __________
Level: _____ ft. cdl Set: A B C Ans: ______ Time: __________
Level: _____ ft. cdl Set: A B C Ans: ______ Time: __________
Figure C-2. Data collection sheet (back).

57
LIST OF REFERENCES
Ellis, Ralph D., Jr., and Kumar, Ashish. (1993). Influence of Nighttime Operations on Construction Cost and Productivity, Transportation Research Record 1389, 31-37.
Fischer, F. (2005). Casting Light on a Critical Tool. Occupational Health & Safety, 74(2), 30-36.
Hinze, Jimmie. (1976). The Effect of Middle Management on Safety in Construction. Technical Report no. 209 (June), Construction Institute. Stanford, Calif.: Stanford University.
Hinze, Jimmie, and Carlisle, Dana. (1990). Variables Affected by Nighttime Construction Projects. Transportation Research Record 1282, 95-103.
Hinze, Jimmie, and Parker, Henry W. (1978). Safety: Productivity and Job Pressures. Journal of the Construction Division, ASCE, Vol. 104, No. CO1, Proc. Paper 13593 (March), pp. 27-34.
Illuminating Engineering Society Committee on Lighting Education. (1961). Lighting fundamentals course. New: York.
Mazer, William M. (2002, June). Poor Illumination Results in Major Injuries. Electrical Contractor: Power and Integrated Building Systems. Retrieved March, 2008 from http://www.ecmag.com/?fa=article&articleID=4946
Morgan, Marilyn R.P. (2001). Putting More Light on the Subject: How we use light affects how much energy we use. Energy User News, February, 14-16.
Stein, B., & Reynolds, J. (2000). Mechanical and electrical equipment for buildings. New York: Wiley.
U.S. Department of Labor. Occupational Safety and Health Administration (OSHA). 1970. Safety and Health Regulations for Construction. Code of Federal Regulations, Part 1926. Washington, D.C.

58
BIOGRAPHICAL SKETCH
Stephen Zachary Taminosian was born in Fort Myers, Florida. The oldest of three
children, he grew up in Fort Myers, Florida, graduating from Fort Myers High School in
2001. He earned his Bachelor of Arts in criminology from the University of Florida in
2005 and began work on his Master of Science in Building Construction in 2006, also at
the University of Florida.