Embed Size (px)
Citation preview
THE EFFECT OF INTEREST RATES ON LENDING IN MORTGAGE
FINANCIAL INSTITUTIONS IN KENYA
BY
NJUGUNA KEZIAH WACHERA
A RESEARCH PROJECT SUBMITTED IN PARTIAL FULFILMENT OF THE
REQUIREMENTS FOR THE AWARD OF MASTERS IN BUSINESS
ADMINISTRATION, UNIVERSITY OF NAIROBI
OCTOBER 2013

ii
DECLARATION
I declare that this research project proposal is my original work and has not been
submitted for a degree in any other university.
Signed: ……………………………… Date: …………………………..
Njuguna Keziah Wachera
D61/68502/2011
This research project has been submitted for examination with the approval of my
University Supervisor.
Signed: ……………………………. Date: ……………………………
Supervisor: Mr. Mirie Mwangi

iii
ACKNOWLEDGEMENT
First and foremost, I would like to thank the Almighty God for giving me the strength,
and sufficient grace that enabled me to finish this course. I would also like to thank my
supervisor Mr. Mirie Mwangi, for his immeasurable support and professional guidance
throughout the course of this study despite his busy schedule.
I thank my family husband Maurice & daughter Lisette for their love, encouragement and
understanding despite being too busy for them in pursuit of this course. I also appreciate
my parents Mr & Mrs Njuguna for their encouragement, advice and installing in me a
sense of discipline and love for education.
I am grateful to the University Of Nairobi, my fellow classmates and lecturers whose
valuable input and positive constructive criticism was instrumental in shaping this
research project.

iv
DEDICATION I dedicate this research project to my lovely daughter, Lisette, and my husband, Maurice,
for their love, support and encouragement. I owe my success to their support.
v
ABSTRACT There is a need for financial stability. Housing finance necessarily involves long term loans, and making long term loans in a sound way for both lending institution and borrower is far from easy when interest rates and inflation are high and volatile. Mortgage is a long-term commitment that ties a prospective homeowner down to mortgage repayment for at least 20 years or transfer of a legal or equitable interest in a specific immovable property for the payment of debt. Mortgage loans are secured by the real property and provide a schedule of payment of interest and repayment of the principal to a bank. The objective of the study was to determine the effect of interest rates on lending by mortgage financial institutions in Kenya. The study was driven by the need to understand how changes in interest rates are likely to affect the amount of mortgage lending advanced by mortgage financial institutions to their customers. The study adopted a time series secondary data and according to CBK, there are there are 43 licensed commercial banks and 1 mortgage finance company in Kenya as at 31st December 2012 the study used a sample population of 30 financial institutions comprising of 29 commercial banks and one housing finance. The study used secondary data sources to collect data from CBK, World Bank, Hass Consult and The Mortgage Company website. The data collected was analyzed using excel linear regression analysis conducted at 95% confidence level. Regression analysis results indicate an inverse relationship between the level of interest rates and the mortgage granted by mortgage financial institutions. This relationship is weak as exemplified by the low levels of coefficient of determination and correlation coefficients. Therefore this means that there are other factors that affect lending by mortgage financial institutions in Kenya other than mortgage interest rates. The study recommends that the government should focus its attention on the other most important variables which determine lending by mortgage financial institutions and influence these variables. Thus the government should leave the determination of interest rates to the market forces of supply and demand but strengthen the monetary policies to ensure that the rate of inflation which is a major component of interest rate is controlled and managed below the two digit figure to avoid inflationary pressure pushing interest rates upwards.
vi
TABLE OF CONTENTS
DECLARATION ................................................................................................................ ii
ACKNOWLEDGEMENT ................................................................................................. iii
DEDICATION ................................................................................................................... iv
ABSTRACT ..................................................................................................................... v
LIST OF TABLES ............................................................................................................. ix
LIST OF FIGURE............................................................................................................... x
ABBREVIATIONS ........................................................................................................... xi
CHAPTER ONE: INTRODUCTION ............................................................................. 1
1.1 Background of Study ................................................................................................ 1
1.1.1 Interest Rates ...................................................................................................... 3
1.1.2 Lending .............................................................................................................. 6
1.1.3 Relationship Between Interest Rates and Lending ............................................ 8
1.1.4 Mortgage Market in Kenya ................................................................................ 9
1.2 Research Problem ................................................................................................... 12
1.3 Objective of Study .................................................................................................. 13
1.4 Value of Study ........................................................................................................ 14
CHAPTER TWO: LITERATURE REVIEW .............................................................. 15
2.1 Introduction ............................................................................................................. 15
2.2 Theoretical Framework ........................................................................................... 15
2.2.1 Traditional Theory ........................................................................................... 15
2.2.2 Classical Theory............................................................................................... 16
2.2.3 Neo-Classical or Loanable Funds Theory ........................................................ 17
vii
2.2.4 Keynesian Liquidity Preference Theory .......................................................... 18
2.2.5 Title Theory and Lien Theory .......................................................................... 19
2.3 Concepts of the Study ............................................................................................. 20
2.4 Empirical Evidence ................................................................................................. 21
2.5 Summary of Literature Review ............................................................................... 25
CHAPTER THREE: RESEARCH METHODOLOGY ............................................. 26
3.1 Introduction ............................................................................................................. 26
3.2 Research Design...................................................................................................... 26
3.3 Population ............................................................................................................... 26
3.4 Sample..................................................................................................................... 27
3.5 Data Collection ....................................................................................................... 27
3.6 Data Analysis .......................................................................................................... 27
CHAPTER FOUR: DATA ANALYSIS, RESULTS AND DISCUSSIONS .............. 29
4.1 Introduction ............................................................................................................. 29
4.2 Descriptive Statistics ............................................................................................... 29
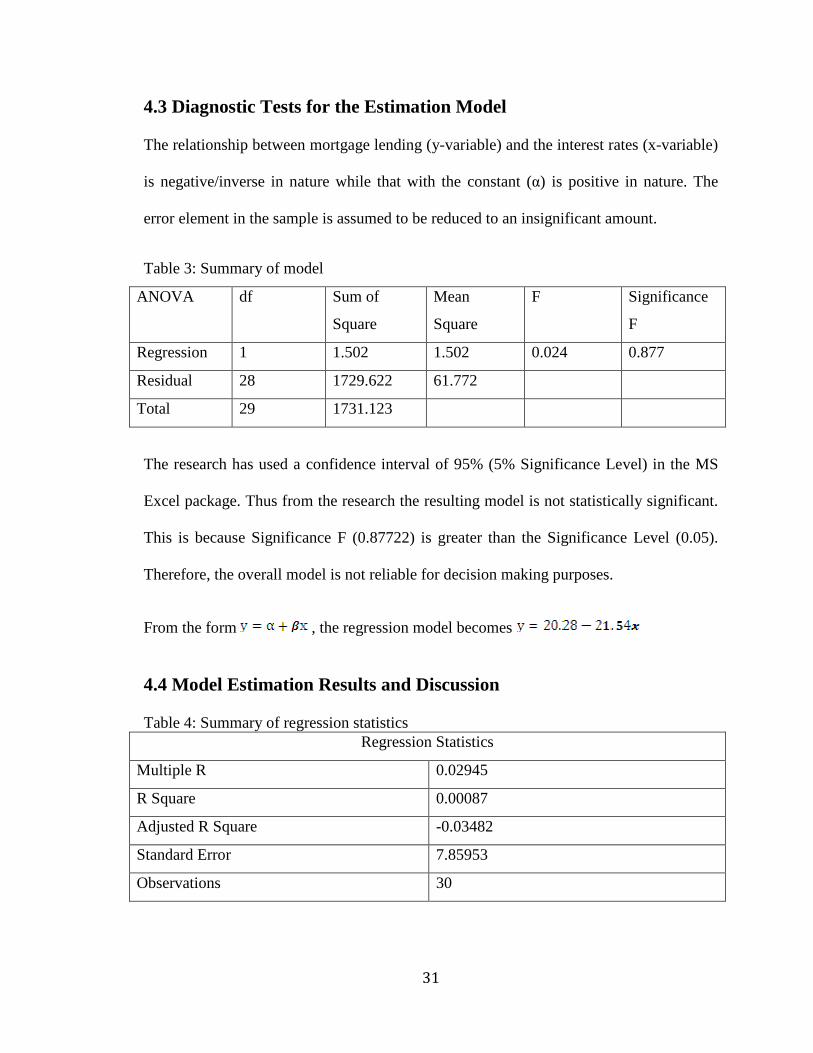
4.3 Diagnostic Tests for the Estimation Model ............................................................ 31
4.4 Model Estimation Results and Discussion .............................................................. 31
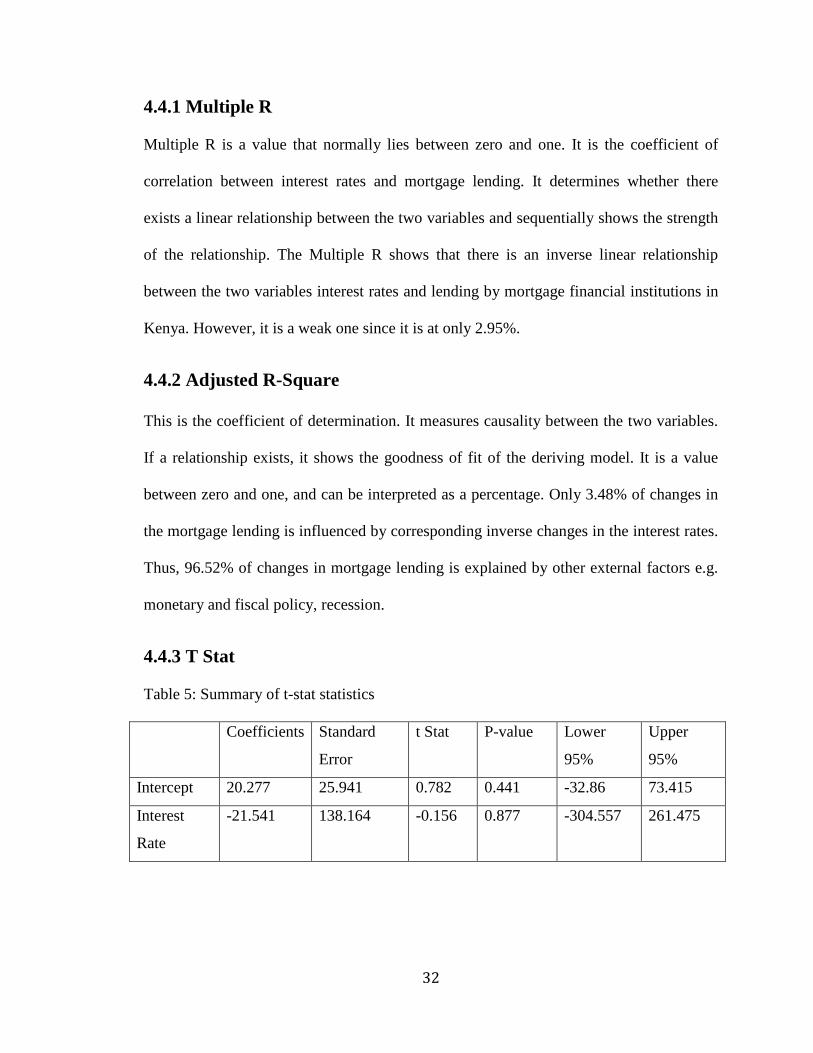
4.4.1 Multiple R ........................................................................................................ 32
4.4.2 Adjusted R-Square ........................................................................................... 32
4.4.3 T Stat ................................................................................................................ 32
4.5 Summary of Findings and Interpretations............................................................... 34
viii
CHAPTER FIVE: SUMMARY, CONCLUSION AND RECOMMENDATIONS .. 36
5.1 Summary ................................................................................................................. 36
5.2 Conclusion .............................................................................................................. 36
5.3 Study Recommendation .......................................................................................... 37
5.4 Limitations of the Study.......................................................................................... 38
5.5 Suggestions for Further Research ........................................................................... 39
REFERENCES ................................................................................................................. 40
Appendix I: Financial Institutions in Kenya based on Bank Segment ............................. 45
Appendix II: Sample of Mortgage Financial Institutions in Kenya .................................. 46
Appendix III: Summary of mortgage rates and amounts lent out by Mortgage Financial
Institutions in Kenya. ................................................................................ 48
Appendix IV: Regression analysis summary output ......................................................... 50
ix
LIST OF TABLES
Table 1: Variable definitions and measurements .............................................................. 29
Table 2: Summary of statistics of the study variables ...................................................... 30
Table 3: Summary of model ............................................................................................. 31
Table 4: Summary of regression statistics ........................................................................ 31
Table 5: Summary of t-stat statistics ................................................................................. 32

x
LIST OF FIGURE Graph 1: Line of best fit .................................................................................................... 33

xi
ABBREVIATIONS ARM – Adjustable Rate Mortgage CBK – Central Bank of Kenya CBR – Central Bank Rate CDC – Commonwealth Development Corporation DL – Demand of Loanable Funds EBIT – Earnings Before Interest and Tax FRM – Fixed Rate Mortgage GDP – Gross Domestic Product GOK – Government of Kenya MCMC – Markov Chain Monte Carlo NSE – Nairobi Securities Exchange SL – Supply of Loanable Funds USA – United States of America VRM – Variable Rate Mortgage

CHAPTER ONE: INTRODUCTION
1.1 Background of Study
Financial institutions play the important role in the economy of offering credit, which
include mortgages. A mortgage is a loan secured by real estate property. Mortgages
enable households and firms to acquire real property without paying the entire value of
purchase upfront. Mortgage loans are characterized by size of loans, period of maturity,
interest rates charged as well as the method of paying (Milani, 2010). Interest charged on
mortgage loans can either be floating/ variable/ adjustable or fixed. Interest rates are
basically determined by the money supply, the rate of inflation, the time period of credit,
and the central bank’s monetary policy (International Monetary Fund, 2012). These
factors influence the variability of interest rates. Generally, interest rates can be
discounted for inflation or given as they are observed. They can either be seen as either
short or long term.
Mortgages represent long term loans and are thus more affected by factors such as prices
in the bond market, the costs of longer-term deposits, and generally the competition for
funds in the financial markets (International Monetary Fund, 2012). The mortgage
market is a phrase that describes a vast array of institutions and individuals who are
involved with mortgage finance in one way or another. This market is broken down into
two separate yet connected entities: the primary mortgage market and the secondary
mortgage market. The primary mortgage market is a market where new mortgages are
originated. The secondary mortgage market is a market where existing mortgages are
bought and sold (McDonald and Thornton, 2008).
2
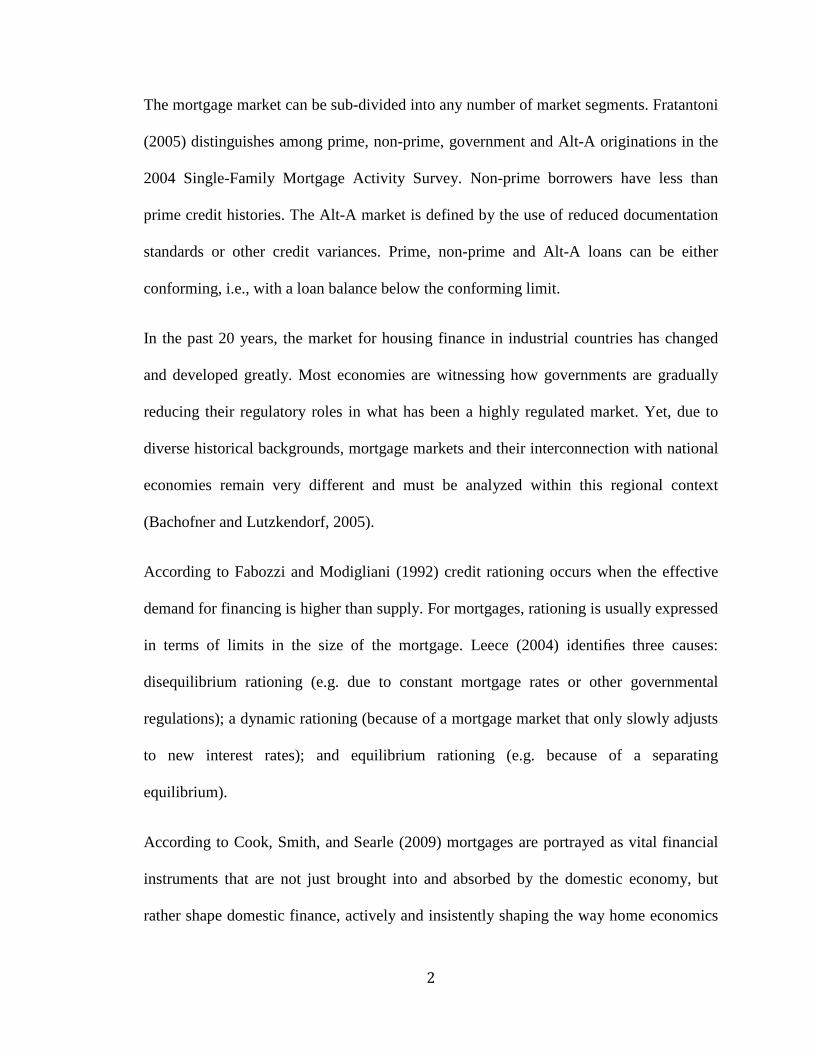
The mortgage market can be sub-divided into any number of market segments. Fratantoni
(2005) distinguishes among prime, non-prime, government and Alt-A originations in the
2004 Single-Family Mortgage Activity Survey. Non-prime borrowers have less than
prime credit histories. The Alt-A market is defined by the use of reduced documentation
standards or other credit variances. Prime, non-prime and Alt-A loans can be either
conforming, i.e., with a loan balance below the conforming limit.
In the past 20 years, the market for housing finance in industrial countries has changed
and developed greatly. Most economies are witnessing how governments are gradually
reducing their regulatory roles in what has been a highly regulated market. Yet, due to
diverse historical backgrounds, mortgage markets and their interconnection with national
economies remain very different and must be analyzed within this regional context
(Bachofner and Lutzkendorf, 2005).
According to Fabozzi and Modigliani (1992) credit rationing occurs when the effective
demand for financing is higher than supply. For mortgages, rationing is usually expressed
in terms of limits in the size of the mortgage. Leece (2004) identifies three causes:
disequilibrium rationing (e.g. due to constant mortgage rates or other governmental
regulations); a dynamic rationing (because of a mortgage market that only slowly adjusts
to new interest rates); and equilibrium rationing (e.g. because of a separating
equilibrium).
According to Cook, Smith, and Searle (2009) mortgages are portrayed as vital financial
instruments that are not just brought into and absorbed by the domestic economy, but
rather shape domestic finance, actively and insistently shaping the way home economics
3
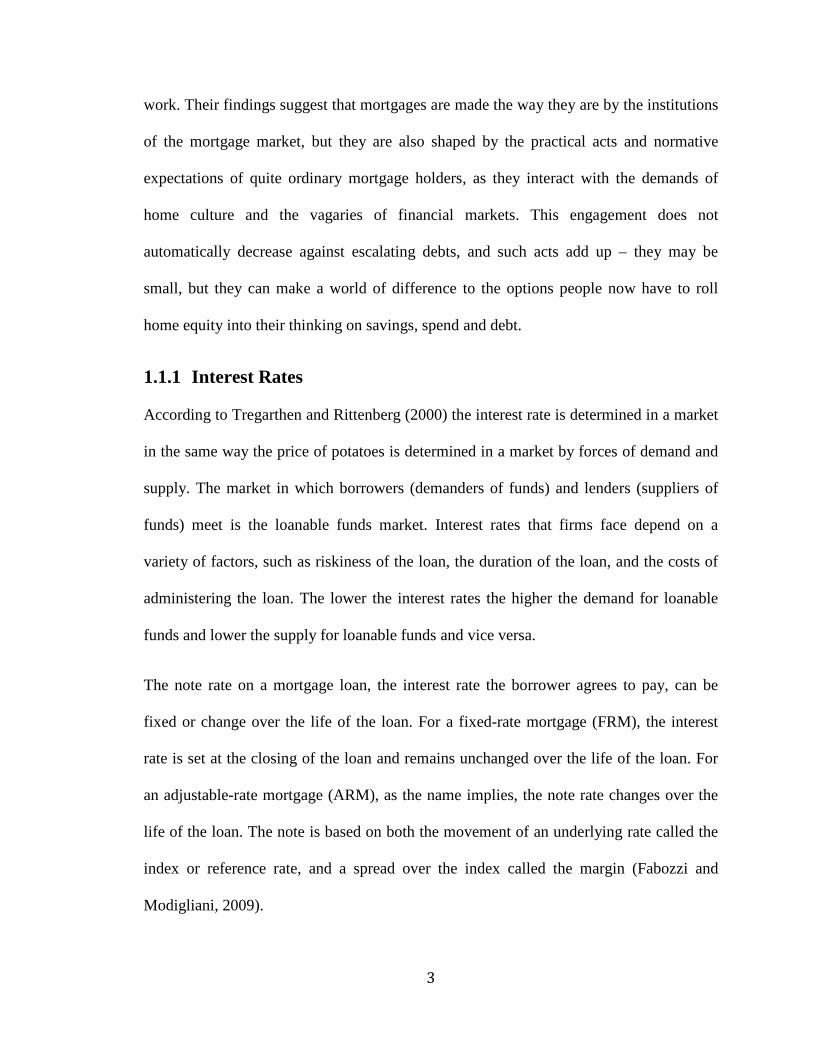
work. Their findings suggest that mortgages are made the way they are by the institutions
of the mortgage market, but they are also shaped by the practical acts and normative
expectations of quite ordinary mortgage holders, as they interact with the demands of
home culture and the vagaries of financial markets. This engagement does not
automatically decrease against escalating debts, and such acts add up – they may be
small, but they can make a world of difference to the options people now have to roll
home equity into their thinking on savings, spend and debt.
1.1.1 Interest Rates According to Tregarthen and Rittenberg (2000) the interest rate is determined in a market
in the same way the price of potatoes is determined in a market by forces of demand and
supply. The market in which borrowers (demanders of funds) and lenders (suppliers of
funds) meet is the loanable funds market. Interest rates that firms face depend on a
variety of factors, such as riskiness of the loan, the duration of the loan, and the costs of
administering the loan. The lower the interest rates the higher the demand for loanable
funds and lower the supply for loanable funds and vice versa.
The note rate on a mortgage loan, the interest rate the borrower agrees to pay, can be
fixed or change over the life of the loan. For a fixed-rate mortgage (FRM), the interest
rate is set at the closing of the loan and remains unchanged over the life of the loan. For
an adjustable-rate mortgage (ARM), as the name implies, the note rate changes over the
life of the loan. The note is based on both the movement of an underlying rate called the
index or reference rate, and a spread over the index called the margin (Fabozzi and
Modigliani, 2009).
4
Rates on ARMs are lower than on otherwise equivalent FRMs. The reason is that the
borrower is bearing some of the market risk. Market risk arises because of the inverse (or
negative) relationship between interest rates and bond prices. Specifically, if the market
interest rate rises, the value of the bond (mortgage) falls and vice versa. The problem is
that interest rates are extremely difficult to predict. If the markets were populated by
investors who are indifferent to whether they sustain a capital loss or a capital gain (i.e.,
indifferent to risk), the fact that bond prices and interest rates are inversely related would
not be an issue. Interest rates would be in variant to the maturity of the asset (McDonald
and Thornton, 2008). Because the term structure of interest rates is normally upward
sloping, both the initial payments and the expected stream of future payments are
normally lower for an ARM than for a FRM (Campbell, 2012).
However, financial markets are populated by risk-adverse lenders (i.e., those more
concerned with suffering a capital loss than getting a capital gain). Consequently, there is
a risk premium on bonds (including mortgages) that increases as the term of the loan
increases. The risk premium is tiny essentially zero—for loans of only a few months. The
risk premium for30-year loans can be fairly large, depending on market circumstances
because the interest rates on ARMs adjust over the term of the loan, ARMs have less
market risk than the corresponding FRMs with the same maturity. Consequently, with an
ARM, some of the market risk associated with mortgage lending is assumed by the
borrower. As noted earlier, like anything else, risk is priced. Hence, ARMs have an initial
rate that is lower than the rate on another wise equivalent-maturity fixed rate loan
(McDonald and Thornton, 2008). Stiglitz (2010) found that there's a matched percentage
changes in the long term interest rates and mortgage financing. McDonald and Thornton
5
(2009) additionally found that, consistent with this study finding that interest rates
fluctuations showed significant fluctuations in the subprime mortgage market in the
European Union Countries.
According to Semmelrock (2009) the recent popularity of no-interest and below-market
ARM’s with low initial rates has allowed many first time and other marginally qualified
purchasers to get mortgages where they would not have qualified under historically more
stringent underwriting standards. These below-market rates that are hyped up to be
attractive allow a borrower to pay a set low interest payment for the first couple of years,
then the rate rises after that to whatever the going rate is. So when interest goes up in the
economy, suddenly individuals paying a 3% interest payment on their mortgage are
suddenly stuck paying a 6%-8% payment and they find themselves unable to make the
new increased payment, resulting in defaults, and ultimately, foreclosures and
bankruptcies. The question here is who would let themselves enter into these kinds of
agreements? The answer is the lending institutions are in large part responsible this sub-
prime crisis by relaxing their underwriting standards.
According to Muth (1962) differences in the net yield of mortgages of different
maturities arise from the fact that in the real world there is not a single pure rate of
interest but rather a structure of pure rates for loans of different length. As several writers
have argued, differences between "short" and "long" pure rates of interest result from the
expectation that future short rates will differ from current short rates. On a straight
mortgage loan payable in ten years the net yield sacrificed by the lender is the yield on
government bonds with ten years to maturity. When ten-year bond yields are low relative
6
to those on twenty-year bonds, the net yield and contract rate on ten-year mortgages
would be low relative to those on twenty-year mortgages, and vice versa.
1.1.2 Lending According to Pandey (2010) mortgage is the transfer of a legal or equitable interest in a
specific immovable property for the payment of a debt. The possession of the property
may remain with the borrower, with the lender getting the full legal title. The transferor
of interest (borrower) is called the mortgagor, the transferee (bank) is called the
mortgagee, and the instrument of transfer is called the mortgage deed.
The banking system and the financial system more generally, is a key pillar in any
economy, bearing in mind its basic function, which is to reallocate funds from agents
with a surplus to those with a deficit. By solving the problem of asymmetric information
among agents and by diversifying risks, banks manage to decrease the costs of the
exchange of financial funds and enable their efficient allocation within the economy.
Therefore, the financial system is one of the most important sources of financing
economic decisions related to consumption and investment, and hence of the financing
capital accumulation and technological innovations, aimed at medium-term productivity
growth and more dynamic and sustainable rates of economic growth. Consequently, the
price of financing through bank loans (i.e. lending rates) and the efficiency of the banking
system (as measured by interest rate spreads) are essential for the possibility of allocation
additional financial potential in the economy, and thus for the acceleration or
sustainability of economic growth (Georgievska,2011).
7
According to Semmelrock (2009) when it is harder to get a mortgage, it is mainly
because of adverse selection. Not knowing enough about the other party in the financial
markets today leads to asymmetric information and is a major cause for concern. But how
is it possible to avoid adverse selection and at the same time avoid individuals who are
likely to default? Lending institutions protect their investment when they lend money, in
order to preserve their assets and make money for their owners. One of the most
important ways for lenders to protect their investment is by requiring collateral. Usually
in real estate, the property being financed is designated as security for the loan. The
collateral usually takes place in the form of a lien against the property being purchased,
which is in effect until the loan is fully paid. A lien basically attaches the property to the
loan, so that if a default occurs, the lender has the full right to obtain and/or sell the
property to satisfy the note. Another popular way for lenders to protect their investment is
through requiring down payments. A portion of the purchase price is immediately put
down so that the risk of default is much lower. Down payments also reduce moral hazard
on top of reducing the total amount of interest that will amortize over time.
There are two risks associated with lending. The first, called default risk is the possibility
that the borrower fails to repay the loan. The second, called market risk, arises when
interest rates change overtime. If market interest rates rise after the lender has offered a
mortgage contract, not only will the lender earn less interest than he would have had he
waited and lent at the higher interest rate, but the market value of the Investment will
decline. Of course, the reverse is also true: If market interest rates fall, the lender will
earn more interest than if he waited and the Market value of his investment will increase.
The risk is due to the fact that it is very difficult to predict whether interest rates will rise
8
or fall. The lender also risks losing the higher interest He would earn if the individual
decides to refinance the loan at a lower rate (McDonald and Thornton, 2008).
1.1.3 Relationship Between Interest Rates and Lending In microeconomics, according to Kidwell, Blackwell, Whidbee and Peterson, (2008) in
equilibrium, the supply of loanable funds equals the demand for loanable funds (SL =
DL). The equilibrium interest rate is only a temporary equilibrium point. Any force that
provides a shift in positions of the supply of or demand for loanable funds produces a
change in the equilibrium rate of interest. Specifically, an increase in the level of interest
rates may be accompanied by either an increase in the demand for or a decrease in the
supply of loanable funds. Similarly, a decline in the level of interest rates can be caused
by either an increase in the supply of or a reduction in the demand for loanable funds.
When either the demand for loans falls or supply increases, lenders may reduce rates
charged but also allow borrowers more generous terms in the form of lower down-
payments or longer maturities. Likewise, according to this argument, the demand
function for mortgage loans depends on the minimum down-payments and maximum
maturities permitted by lenders, in addition to the contract rate of interest (Muth, 1962).
There has been a steady increase in the supply of and demand for home mortgage finance
as well as a number of new, often large suppliers. The changes in the mortgage market
resulted in lower interest rates, higher possible loan to value ratios, higher possible loan
to income ratio, and longer repayment periods. In particular the higher loan to value
rations are important as it means that the level of down payments required to buy a house
is lower and that has a potentially strong effect on the young who are the most likely to
9
need a mortgage when buying a home, but it has also shifted the burden of home
ownership from large down payment to greater mortgage repayments (Del Boca and
Lusardi, 2003).
According to Muth (1962) since the mortgage market is but a part of the market for all
borrowed funds, the supply of mortgage loans depends on both the total supply of
loanable funds and the demand for other classes of funds. The really interesting questions
about the supply of mortgage loans relate to their relative supply in the aggregate and the
relative supply of different classes of mortgage loans. By the "relative supply of
mortgage loans" means the ratio of the quantity of mortgage lending to the quantity of all
other lending as a function of the returns on mortgage loans relative to the returns on
other loans. What matters to the lender, of course, in choosing among alternative kinds of
loans is not the gross, but the net, yield he expects to receive. The latter is simply the
gross yield less the administrative costs of making and servicing the loan and of a risk
premium to cover expected losses. The purchase of government bonds involves little or
no administrative cost and risk, so their yield provides a close approximation to the pure,
or costless, default-free rate of interest and is a convenient standard with which to
compare the yields on mortgage loans.
1.1.4 Mortgage Market in Kenya The development of mortgage insult ray in Kenya dates back to 1965 when the premier
HFCK was incorporated. Their main objective was carrying out the Government policy
of promoting thrift and home ownership. This was to be achieved by providing savings
and mortgage facilities to the Kenyan public. Initially the Commonwealth Development
Corporation (CDC) held 60% of equity while the Kenyan government controlled 40%. In
10
1992 Housing Finance offered its shares to the public and became a quoted company at
the NSE with CDC and GOK retaining a shareholding of 30.4% each and Kenyan
investors taking up the balance of 39.2% (www.housing.co.ke)
Later, the Company issued a prospectus dated 26th February 1999 in which 30million
government shares were offered to the public. After the sale, the general public and
institutional investors increased their shareholding to 62.3%, CDC remained at a steady
30.4% of equity, while the Kenyan government reduced its shareholding to 7.3% of
equity. The CDC Group has gradually been reducing its shareholding with the eventual
sale of all its shares to Equity Bank Ltd and British American Investments Company
Limited (BAICL) on the 11th July 2007. The shareholding stood at 7.32% Government,
20.0% Equity Bank Ltd, 4.9% BAICL, 7.87% NSSF and 59.91% to the public.
(www.housing.co.ke)
Currently Housing Finance controls 29% of the total mortgages in the Kenyan mortgage
market. The change in legislation of the Banking Act in 2002 removed the 5 year term
loan restriction, implied that banks could now venture in mortgage loans that have longer
repayment terms. In addition the drastic drop in returns offered by Treasury bills resulted
in commercial banks seeking alternative lending avenues. This saw the entry of other
players in the market such as Standard Chartered Bank, Barclays Bank of Kenya,
Cooperative Bank, Commercial Bank of Africa. (Banking Supervision Annual Report
2011).
In Kenya interest rates are mainly driven by inflation which affects the value of money;
demand and supply of money through sale and purchase of government security in the

11
one market; monetary policy and intervention by the government through setting the
Central Bank lending rate; general economic conditions such as economic booms and
slumps (Ngugi, 2004). Interest rates in the country have also been sensitive to the existing
political atmosphere. For instance the 2007/2008 post-election crisis caused a hike in the
weighted average bank lending rates by 1.6% (Ng'etich and Wanjau, 2011).
When the CBR rose in the second half of 2011, the mortgage lending rate increased on
average from 14.7 to 25% (Central Bank of Kenya, 2012). However, despite the CBR
rate coming down mortgage rates have remained high.
According to CBK Report (2012) Kenya had a total of 19,177 mortgage accounts by
December 2012, up from 16,029 in December 2011. The value of outstanding mortgage
loans increased from Sh90.4 billion in December 2011 to Sh122.2 billion in December
2012, representing a growth of Sh31.8 billion or 32.5 percent. The same report points out
that 85.6 percent of the mortgage loans were on variable interest rates basis, down from
90 percent in 2011 and in 2010, 73 percent of mortgage loans were on variable interest
rates. “The tendency for financial institutions to grant mortgage loans on variable interest
rate basis may be contributing to slow growth in residential mortgage market”, the survey
said.
On the other hand, the average mortgage loan size increased from Sh5.6 million in
December 2011 to Sh6.4 million in December 2012. The increase, says the CBK Report
(2012), may be partly attributed to increase in property prices. Although the report does
not say exactly how many borrowers defaulted on their monthly repayments, a simple
calculation (dividing the value of non-performing mortgage loans, which is Sh6.9 billion
12
in this case, by average mortgage loan size, which is Sh6.4 million) gives the number of
defaulters as approximately 1,078 compared to 764 in December 2011.
1.2 Research Problem
In microeconomic terms, the housing finance market is considered as the interaction
between a supply matrix of housing finance quantity classified by characteristics such as
pricing / volume and a demand matrix of households classified by their characteristics,
preferences and constraints (Follain et al 1980). The market allocates housing finance on
the basis of the price (interest rate) and the number of households that are willing to pay
the bid prices in consideration that they have their preferences and constraints. It is
argued that there is disequilibrium in the housing finance market when the price does not
adjust fast enough to clear the market. While theory is based towards the postulation that
interest rates are inversely related to the amount of credit available in an economy,
studies have shown situations when the levels of credit is independent of the official
interest rates, especially characteristic of credit squeeze.
A study by Martinez and Maza (2003) found out that housing prices and real income
were positively related to mortgage credit while interest rates have a negative impact on
the variation in short term mortgage credit. However, Gerlach and Penguin (2005),
examined the long and short term relationship between interest rates and mortgage credit
with application to the Hong Kong housing market and noted that house prices are found
to be more sensitive to short-term rates where floating rate mortgages are more widely
used and more aggressive lending practices are associated with stronger feedback from
prices to bank credit. Based on their findings considering mortgage markets are long term
in nature what is the effect of interest rates on lending by mortgage financial institutions?
13
Given the role of interest rates in the economy, several studies have been conducted.
Interest rates affect the core operation of an economy in terms of production and
consumption through transmission mechanism of inflation, exchange rates amongst other
monetary variables. Accordingly, studies are legion explaining the effects interest rates
have on various variables in the economy. In Kenya, these studies include Ngugi (2004),
Oduor, Karingi and Mwaura (2011) have tried to illuminate the point that interest rates
effect on the amount of credit to the economy is largely minimal. Instead the overall net
credit in Kenya’s financial industry is influenced more by other factors such as
information asymmetry between the borrowers and the lenders, value of the collateral
used by the banks to secure the loans, central bank reserve requirements, direct credit
controls on the banking system and perception of risk regarding the solvency of other
banks within the banking system. Other studies include Muguchia (2012) who shows the
effect of flexible interest rates on the growth of mortgage financing in Kenya. Kilonzo
(2003) shows the effect of changes in interest rates on credit granted by commercial
banks in Kenya.
Given that mortgages are long term in nature and interest rates determine the quantity of
mortgage funds supplied and demanded in the market; this study seeks to find out the
effect of interest rates on lending by mortgage financial institutions in Kenya?
1.3 Objective of Study
To establish the effect of interest rates on lending by mortgage financial institutions in
Kenya.

14
1.4 Value of Study
Interest rates are used to influence the monetary policy and other aspects to achieve the
desired macroeconomic framework. Therefore this study will provide important insights
to relevant government departments towards achieving the country's macroeconomic
target of Kenya Vision 2030. To mortgage financial institutions, this study will be useful
in that it will help them to have an indication of the relationship between mortgage
lending and rates of interest.
Also the Constitution of Kenya 2010 explicitly accords every Kenyan a human right to
adequate and decent housing. The policy makers and market players would benefit from
this study in order to consider expanding the mortgage market to as many Kenyans as
possible. Will also help them understand how monetary policies on interest rates affect
the mortgage market and by extension, economic growth. The study will also give a good
insight to academicians who want to pursue further research in this area.
15
CHAPTER TWO: LITERATURE REVIEW
2.1 Introduction
This section focuses on both theoretical and empirical literature on the effect of interest
rates on lending by mortgage financial institutions. The empirical evidence is drawn from
Kenya and the rest of the world.
2.2 Theoretical Framework
Various theories of interest rates put together explain or provide variables which
determine their level. These theories differ because of differences of opinion as to
whether interest rates are monetary or real phenomena.
2.2.1 Traditional Theory Traditional theory defines interest rate as the price of savings determined by the demand
and supply of loanable funds. With the assumption of the existence of a capital market, it
is the rate at which savings are equal to investment. According to the loanable fund
theory, no role is assigned to the quantity of money, the level of income on savings, or
institutional factors like government and commercial banks (Gardner, Mills, and
Cooperman, 2000).
According to the traditional theory, nominal interest rate adjusts fully to the expected rate
of inflation leaving the real interest rate unaffected. According to the works of Irving
Fisher (1901), there is a positive relationship between expected future price increases and
nominal interest. To him, an increase in price increases the nominal value of trade
resulting to an increase in demand for money leading to an increase in nominal interest
16
rate. Studies estimated the magnitude of the fisher effect and found that it was less than
one suggesting that nominal interest rate are extremely slow to adjust to inflation such
that there is a tendency for inflationary rate to expand the gap between nominal and real
interest rates. Tobin (1965) modified Fisher's conclusion arguing that inflation reduces
the demand for money balances, lowering the real rates of return such that the real rates
rise by less than the inflation. However, this theory has been subjected to a lot of
criticism by the Keynesian on the ground that it is indeterminate since no solution is
possible as the position of the saving schedule will vary with level of income. As income
increases, the saving schedule in turn shifts to the right hence one cannot know what the
rate of interest will be unless we already know the income level (Hardwick, 1986).
2.2.2 Classical Theory According to the classical theory, rate of interest is determined by the supply and demand
of capital. The supply of capital is governed by the time preference and the demand for
capital by the expected productivity of capital. Both time preference and productivity of
capital depend upon waiting or saving. The theory is therefore also known as the supply
and demand theory waiting or saving. Whilst the demand for capital is inversely related
to the rate of interest, the supply of capital depends upon savings rather than upon the
will to save and the power to save of the community. The rate of interest is thus
determined by the intersection of the demand curve and the supply curve of capital
(Shapiro, 1992).
The classical theory neglects monetary factors in the determination of interest rate. It is a
pure or real theory of interest which takes into consideration the real factors like the time
preference and the marginal productivity of capital. This theory is also indeterminate.
17
Since savings depend upon the level of income, it is not possible to know the rate of
interest unless the income level is known beforehand. And the income level itself cannot
be known without already knowing the rate of interest. This theory also neglects the
effects of investment on the level of income. A rise in the rate of interest, for instance,
will bring a decline in investment by making it less profitable and decrease in credit
granted by commercial banks (Shapiro, 1992; Sodersten, 1980). The implication of the
above analysis is that an increase in money supply results in a fall in the interest rate.
Given a non-zero elasticity of real rate of net rest to money, changes in nominal rate of
interest are translated to changes in real rate of interest.
2.2.3 Neo-Classical or Loanable Funds Theory According to the neo-classical or loanable funds theory was formulated by the Swedish
economist Knut Wicksell in the 1900s (Haugen, 2005). According to him, the level of
interest rates is determined by the supply and demand of loanable funds available in an
economy's credit market (i.e., the sector of the capital markets for long-term debt
instruments). This theory suggests that investment and savings in the economy determine
the level of long-term interest rates. Short-term interest rates, however, are determined by
an economy's financial and monetary conditions.
Demand for loanable funnels has three sources: government, businesses, and consumers
who need them for purposes of investment, hoarding, and consumption. More funds are
borrowed at a lower rate of interest than at a higher rate. Supply of loanable funds on the
other hand comes from savings, dishoardings, and bank credit. In this theory savings are
seen as providing the supply of loanable funds and releasing resources from the
production of current consumer goods into the production of capital goods. Investment on
18
the other hand is seen as providing the demand for loanable funds. The higher the rate of
interest, the more willing households and individuals will be able to save and so sacrifice
some present consumption for (uncertain) future consumption (Shapiro, 1992; Situma,
1997; Hardwick, 1986).
The neo-classical theory ignores the possibility that savers may have a given purpose for
which they are saving to buy a house for example. In such a case, a higher interest rate
may actually reduce savers willingness to save because rising interest rates raise real
incomes and so reduce the amount of saving necessary for a given purpose. This theory
has also been criticized for combining monetary factors (e.g. bank credit, hoarding) with
real factors (e.g. savings, investment) without bringing in changes in the level of income.
This makes the theory unrealistic. A basic conclusion of the neo-classicists is that falling
interest rate will induce greater investment to take place.
2.2.4 Keynesian Liquidity Preference Theory The Keynesian liquidity preference theory of interest rate by John Maynard Keynes
postulates that the rate of interest is determined by the intersection of the supply-schedule
of money and demand-schedule for money (liquidity presence schedule). Thus the theory
explains that the rate of interest is determined at a point where the liquidity preference
curve equals the supply of money curve. If money supply is increased by the monetary
authorities but the liquidity presence curve remains the same, the rate of interest will fall.
However, if the demand for money increases and the liquidity preference curve shifts
upwards given the supply of money, the rate of net rest rises. The Keynesian theory has
been criticized on the grounds that it is indeterminate. Keynes asserts that liquidity
preference and the quantity of money determine the rate of interest. But this is not correct

19
since liquidity presence schedule will shift as income level changes. Therefore unless the
income level is already known, the demand and supply curves of money cannot tell us
what the rate of interest will be. Besides, the theory treats the interest rate as a purely
monetary phenomenon and by neglecting the real factors, makes the theory narrow and
unrealistic (Shapiro, 1992; Harwick, 1986).
2.2.5 Title Theory and Lien Theory According to Title Theory and Lien Theory of Mortgages, some banks retain and treat
mortgage as a title theory. Since the mortgage is said to hold a title interest, the
mortgagee has the right to possession under this theory. In a title theory bank, the
mortgage is treated as having transferred title to the mortgagee, subject to the mortgagee's
duty to re convey if payment is made. The title is said to remain in the mortgagee until
the mortgage has been satisfied and foreclosed. Although the mortgagee has the right of
possession to the property, there is generally an express agreement giving the right of
possession to the mortgagor. The mortgagee is said to hold the title for security purposes
only. The mortgagor is given the right of possession (Buckley and Kalarickal, 2004).
In lien theory, the mortgagor retains legal and equitable title to the property, but conveys
an interest that the mortgage can only foreclose upon to satisfy the obligation of the
mortgagor. This is equivalent to a future interest in the property which allows the
mortgagee to use the process of foreclosure. The interest is a security interest or
mortgage, which forms a lien on the property. In this theory the right to possession arises
upon a default. The mortgagor has a right to sue the mortgagee for any interference with
his right to possession (Buckley and Kalarickal, 2004).
20
For practical applications there is usually by little difference between a lien theory and
title theory. The principle difference arising in the title theory bank is that the mortgagee
is given the right to possession before the foreclosure is complete.
2.3 Concepts of the Study
According to Castro and Santos (2010) a factor of relevance in the setting of bank interest
rates is therefore credit risk, particularly aggregate credit risk, which is associated with
the state of the economy. Another important factor is associated with the exposure of
banks to interest rate risk. Since financial institutions have to cope with unsynchronized
demand for loans and supply of deposits, they often turn to the money market to manage
their liquidity position. Volatility of interest rates in the money market is sometimes
considered in determining interest rate margins. Another important factor lies not only in
increased competition within the banking and financial system as a whole, which made it
possible to widen the range of funding opportunities and investment, but also in the
increase in financial innovation, that have supported changes in risk management and
brought down the costs of doing business. Increased competition and financial innovation
are closely linked to the liberalization of financial markets and, more recently.
The evolution of bank lending theoretically results from the interaction between demand
and supply factors. However, the variables that help to explain the dynamics of the loans
sometimes affect both demand for and supply of credit, and it is not always, accordingly,
possible to empirically identify the two channels. There are usually variables of scale,
variables related to financing conditions, variables related to the position of households
and corporations and factors related to structural changes in the banking sector and other
variables. Another set of factors that play a predominant role, especially in the supply of
21
loans, is related to factors, mainly structural in nature, that affect the banking sector.
Increased competition in the banking sector, led to a wave of innovation and a significant
increase in the supply of new products in the financial sector (by increasing loan
maturities, lower down payments, securitization, inter alia), which has had serious
consequences not only in terms of amounts and conditions of credit supply but also in
terms of raising funds and risk management by financial institutions (Castro and Santos
2010).
2.4 Empirical Evidence
The theory of credit demand, credit supply and economic activity in USA as postulated
by Balke and Zeng (2011) for the period January 1985 to December 2009. They
estimated the model using Bayesian Markov Chain Monte Carlo (MCMC) methods
which provides the determining factors of the credit output. The principal determinant of
credit demand and supply is interest rates. There are also other factors that shift the
demand for loans such as inflation rate, money supply in the economy, the GDP, non-
performing loans, liquidity ratio, customer deposit and bank capitalization. This
theoretical basis is supported by empirical works by Essene and Apgar (2007) who argue
that mortgage finances as a result of the existing macroeconomic environment in the
country which determine the operations of financial institutions. Leech (2008) theorized
the significance of mortgage demand, mortgage choices and the nature of the economic
environment in which macroeconomic factors such as inflation rates, GDP as well as
bank operating factors such as customer deposits and liquidity ratios were found to be
inter-related to mortgage financing.
22
According to Case and Shiller (2008), the meltdown in mortgage markets has
substantially raised mortgage rates relative to their historical relationship to interest rates.
They conducted a study analyzing the role of credit markets in mortgage prices and thus
in house prices in USA housing market. The study showed that the spread between the
interest rate on the average 30-year conforming mortgage and the 10-year Treasury bond
had widened enormously in the last few years. In fact, while the yield on the 10-year
Treasury bond had fallen by nearly 1.5 percent in the past 2years, the average rate on a
conforming mortgage had fallen by about 0.5 percent. Problems in the entire economy
combined with the broader credit crunch were responsible for the increase in the spread
between mortgage rates and treasury securities.
McShane and Sharpe (1984) postulates a theoretical model of determining bank interest
margins based on hedging behavior of interest margin determination – the dealer model
of bank interest margin determination – and applies this model to Australian banks. Their
model assumes the following about banks in undertaking intermediation between
depositors (suppliers of funds) and borrowers (demanders of funds): (i) maximization of
expected utility (ii) risk aversion in loan and deposit markets. Loan/deposit interest
margins are defined in the study as fees for financial intermediation given the randomness
of loan requests and receipt of deposits, and the uncertainty in short term interest rates.
However, the study notes the narrowness of this definition of interest rate margin and
embeds their model in a more general model of profit maximization.
Empirically, not much has been done on interest rates in Kenya. According to Muguchia
(2012) in her study of the effect of flexible interest rates on the growth of mortgage
finance in Kenya during the financial period 2007 to 2011. Through the regression
23
analysis conducted the study found out that the flexible interest rates have a strong
negative and significant effect on mortgage financing among the financial institutions in
Kenya. Specifically, a percentage change in the weighted average lending rates among
Kenya's financial institutions reduces the annual mortgage output by1.3 percent. The
study revealed the other independent variables had mixed effects on mortgage financing.
Inflation, non-performing loans, liquidity ratio had negative effects on mortgage
financing while money supply, gross domestic product, customer deposits, bank
capitalization and bank size had positive effect on mortgage financing.
Ngumo (2012) studied the effect of interest rates on the financial performance of firms
offering mortgages in Kenya for the period 2007 to 2011. Linear regression analysis was
used to analyze the data at 95% confidence level. The study established positive
relationships in the five regression analysis between financial performance and the
amount of mortgage loans advanced; three positive results were established between
interest rates and the former. The study concludes that the amount of mortgage advanced
by mortgage firms would lead to a high financial performance (EBIT) as it raises the
revenue thereof. On the other hand, interest rate would positively relate with financial
performance till is starts discouraging borrowings owing to increase in the cost of
mortgage. The study recommends that mortgage firms in Kenya charge interest rates on
the mortgage appropriately as ineffective interest rate policy raises the cost of mortgage
borrowing, negate its demand thus lowers financial performance.
Wahome (2010) in her study of factors influencing mortgage financing in Kenya in 2010
through regression found out that mortgage firms in Kenya are emphasizing on mortgage
financing to improve firm performance. The study concludes that mortgage financing is
24
influenced by market and financial factors which includes increase investment and
improve profitability of the bank, improvement of risk management, attraction of more
customers, promotion of innovations, market penetration, diversification of investment
and encountering competitions in the market lowering of interest rates on treasury bond.
The study therefore established that there is positive relationship between mortgage firms
performance with factors influencing mortgage financing which are encountering
competitions in the marketing, creating of wealth, improving saving, high interest rates
from mortgage, diversification of investment, increase investment.
Kilonzo (2003) in his study of the effect of changes in interest rates on credit granted by
commercial banks in Kenya from 1992 to 2002 used regression analysis to indicate an
inverse relationship between the level of interest rates and the amount of credit granted
by commercial banks. He observed that when interest rates increase, the amount of credit
granted by commercial banks to their customers decreases while the interest rates decline,
the amount of credit granted by commercial banks increases. He used a t-test of the
regression parameters y = a + b(x) particularly (b) at 5% level of significance revealed
that interest rates have o effect on the amount of credit granted by commercial banks in
Kenya. This further confirmed his research findings of low correlation coefficients for all
commercial banks implying the existence of a weak relationship between credit granted
and interest rates. His research findings led to the conclusion that interest rates are not the
most important determinant of the amount of credit granted by commercial banks in
Kenya.
25
2.5 Summary of Literature Review
The objective of the study was to determine the effect of interest rates on lending by
mortgage financial institutions in Kenya. The study was driven by the need to understand
how changes in interest rates are likely to affect the amount of mortgage lending
advanced by mortgage financial institutions to their customers. Based on the theories the
level of interest rates is determined by the supply and demand of loanable funds available
in an economy's credit market. From the empirical review it provides evidence that
interest rates have an inverse relationship with other variables. The identified knowledge
gap from the theories and empirical review is that they don’t postulate the effect of
interest rates on the long term nature of mortgage lending. Therefore this research goes a
long way to investigate the effect of interest rates on lending by mortgage financial
institutions.
26
CHAPTER THREE: RESEARCH METHODOLOGY
3.1 Introduction
This chapter introduces the design of the research, the population of the units to be
studied, the sampling framework of the population, the data collection techniques and the
type of the data, the analysis of the data as well as the data validity and data reliability.
3.2 Research Design
The research design used was a descriptive survey research. Mugenda and Mugenda
(2003) describe research as a process of collecting data in order to answer questions
regarding the current status of the subjects in the study. Mugenda (2003) defines a survey
as an attempt to collect data from members of the population with respect to one or more
variables. It is appropriate to use descriptive survey as it allows ascertaining of the effect
of interest rates on lending by mortgage financing institutions. The study focuses on
financial institutions offering mortgage facilities in Kenya.
3.3 Population
A population is a well-defined or set of people, services, elements, events, group of
things or households that are being investigated (Ngechu, 2004). The target population
for this study is financial institutions in the country offering mortgage credit services.
According to CBK, there are there are 43 licensed commercial banks and 1 mortgage
finance company in Kenya as at 31st December 2012.
27
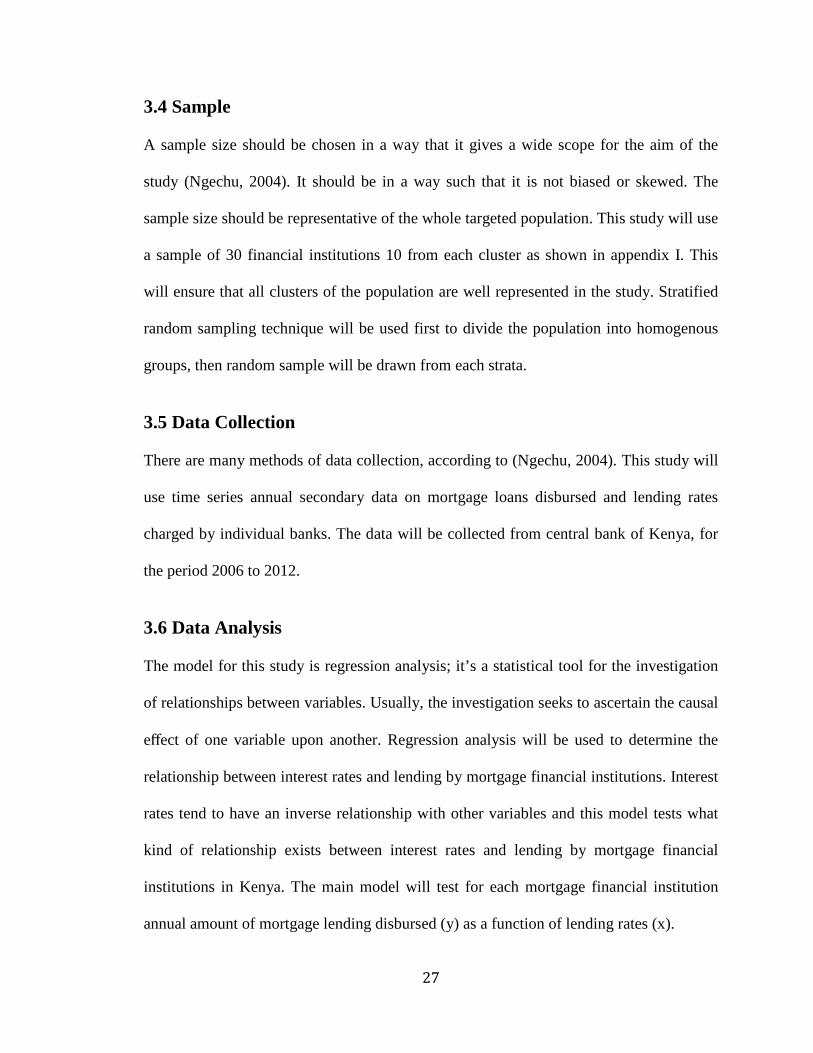
3.4 Sample
A sample size should be chosen in a way that it gives a wide scope for the aim of the
study (Ngechu, 2004). It should be in a way such that it is not biased or skewed. The
sample size should be representative of the whole targeted population. This study will use
a sample of 30 financial institutions 10 from each cluster as shown in appendix I. This
will ensure that all clusters of the population are well represented in the study. Stratified
random sampling technique will be used first to divide the population into homogenous
groups, then random sample will be drawn from each strata.
3.5 Data Collection
There are many methods of data collection, according to (Ngechu, 2004). This study will
use time series annual secondary data on mortgage loans disbursed and lending rates
charged by individual banks. The data will be collected from central bank of Kenya, for
the period 2006 to 2012.
3.6 Data Analysis
The model for this study is regression analysis; it’s a statistical tool for the investigation
of relationships between variables. Usually, the investigation seeks to ascertain the causal
effect of one variable upon another. Regression analysis will be used to determine the
relationship between interest rates and lending by mortgage financial institutions. Interest
rates tend to have an inverse relationship with other variables and this model tests what
kind of relationship exists between interest rates and lending by mortgage financial
institutions in Kenya. The main model will test for each mortgage financial institution
annual amount of mortgage lending disbursed (y) as a function of lending rates (x).
28
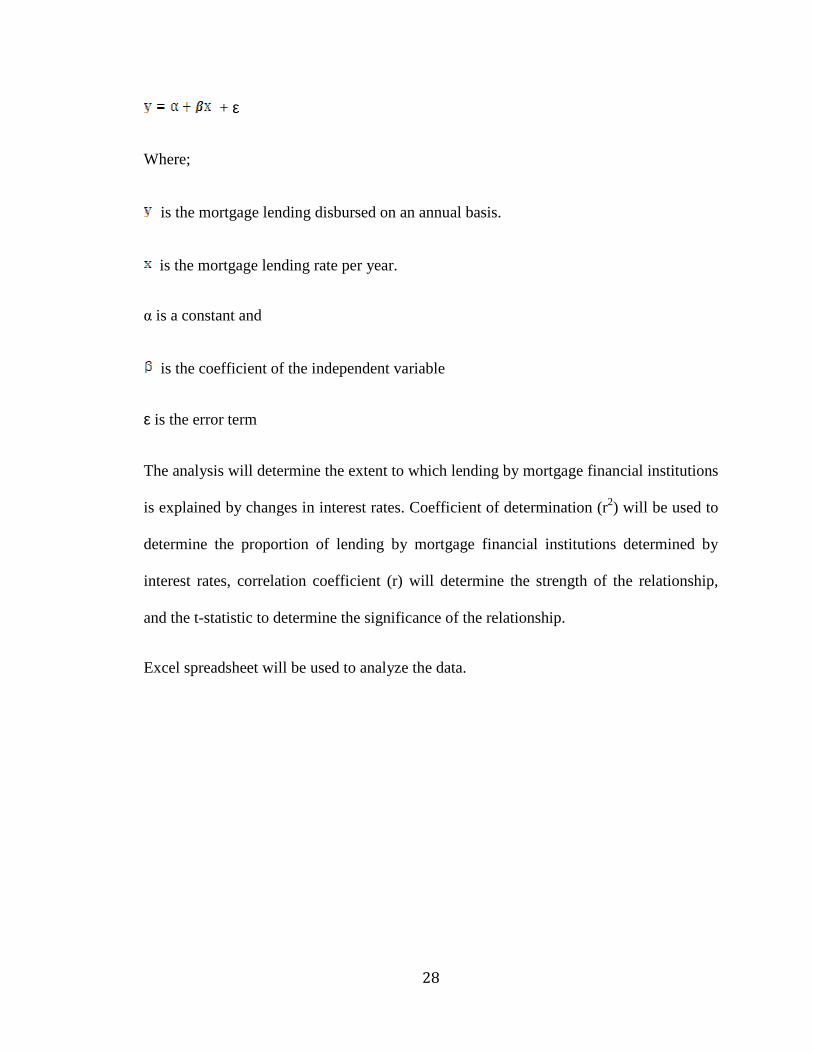
+ ε
Where;
is the mortgage lending disbursed on an annual basis.
is the mortgage lending rate per year.
α is a constant and
is the coefficient of the independent variable
ε is the error term
The analysis will determine the extent to which lending by mortgage financial institutions
is explained by changes in interest rates. Coefficient of determination (r2) will be used to
determine the proportion of lending by mortgage financial institutions determined by
interest rates, correlation coefficient (r) will determine the strength of the relationship,
and the t-statistic to determine the significance of the relationship.
Excel spreadsheet will be used to analyze the data.
29
CHAPTER FOUR: DATA ANALYSIS, RESULTS AND DISCUSSION
4.1 Introduction
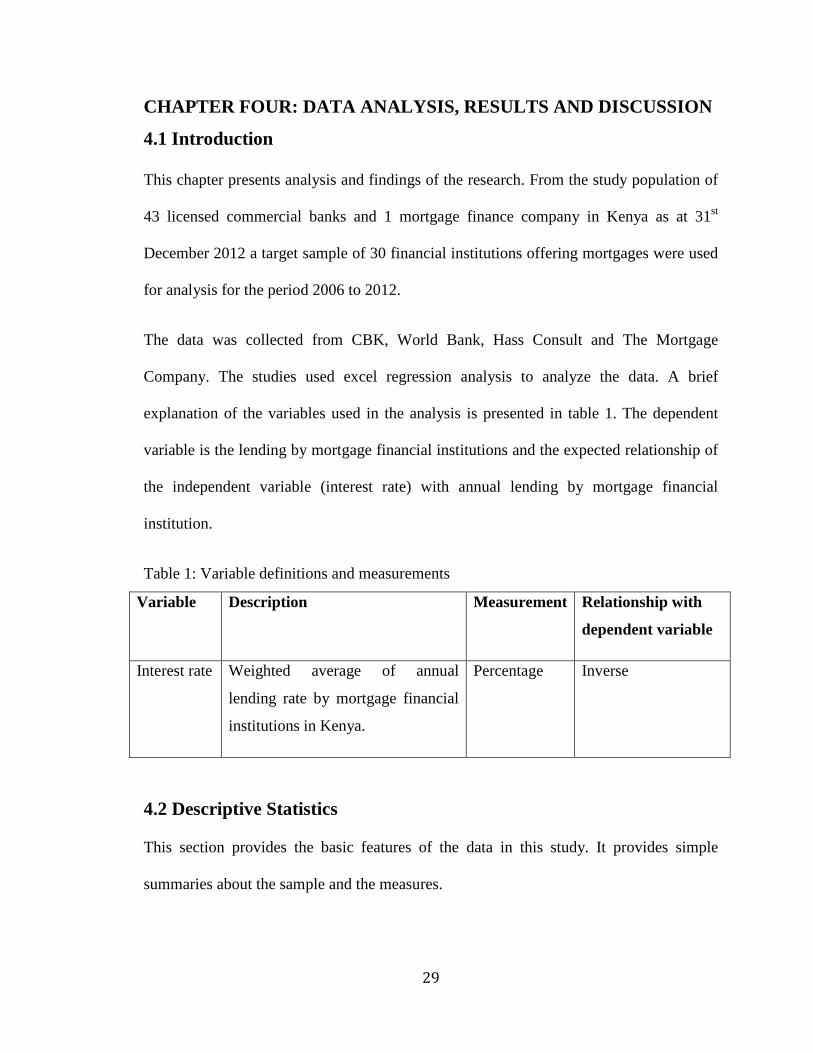
This chapter presents analysis and findings of the research. From the study population of
43 licensed commercial banks and 1 mortgage finance company in Kenya as at 31st
December 2012 a target sample of 30 financial institutions offering mortgages were used
for analysis for the period 2006 to 2012.
The data was collected from CBK, World Bank, Hass Consult and The Mortgage
Company. The studies used excel regression analysis to analyze the data. A brief
explanation of the variables used in the analysis is presented in table 1. The dependent
variable is the lending by mortgage financial institutions and the expected relationship of
the independent variable (interest rate) with annual lending by mortgage financial
institution.
Table 1: Variable definitions and measurements
Variable Description Measurement Relationship with
dependent variable
Interest rate Weighted average of annual
lending rate by mortgage financial
institutions in Kenya.
Percentage Inverse
4.2 Descriptive Statistics
This section provides the basic features of the data in this study. It provides simple
summaries about the sample and the measures.
30
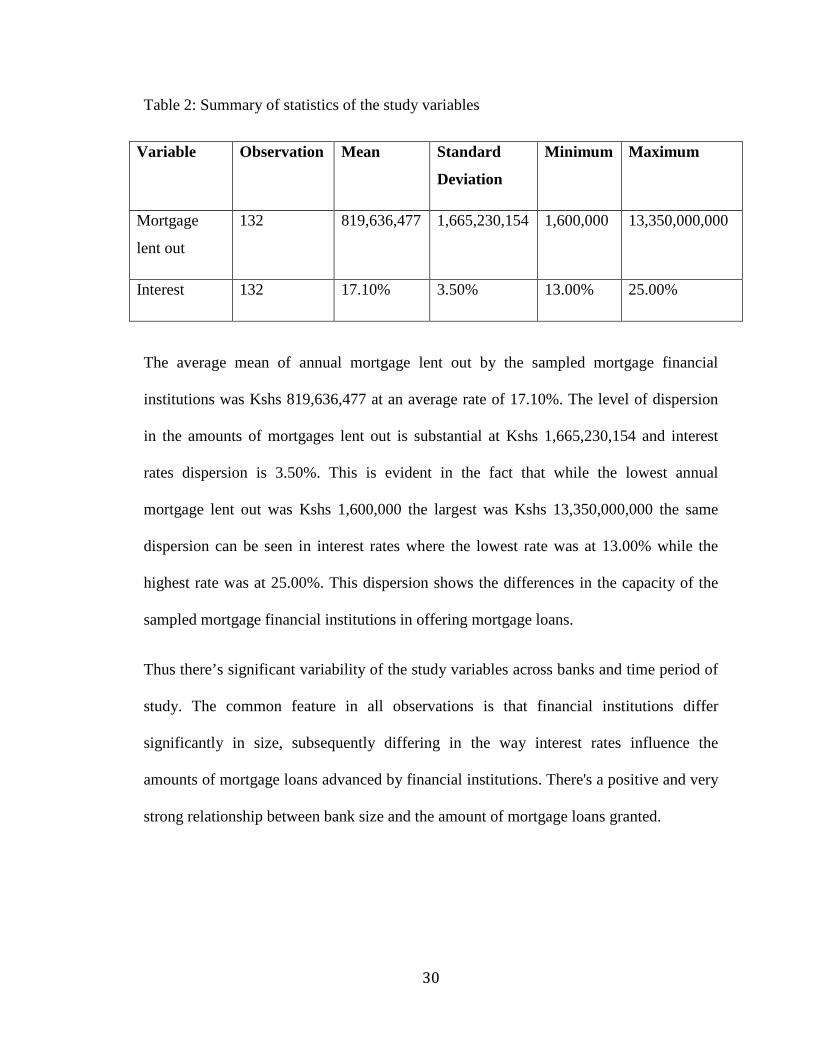
Table 2: Summary of statistics of the study variables
Variable Observation Mean Standard
Deviation
Minimum Maximum
Mortgage
lent out
132 819,636,477 1,665,230,154 1,600,000 13,350,000,000
Interest 132 17.10% 3.50% 13.00% 25.00%
The average mean of annual mortgage lent out by the sampled mortgage financial
institutions was Kshs 819,636,477 at an average rate of 17.10%. The level of dispersion
in the amounts of mortgages lent out is substantial at Kshs 1,665,230,154 and interest
rates dispersion is 3.50%. This is evident in the fact that while the lowest annual
mortgage lent out was Kshs 1,600,000 the largest was Kshs 13,350,000,000 the same
dispersion can be seen in interest rates where the lowest rate was at 13.00% while the
highest rate was at 25.00%. This dispersion shows the differences in the capacity of the
sampled mortgage financial institutions in offering mortgage loans.
Thus there’s significant variability of the study variables across banks and time period of
study. The common feature in all observations is that financial institutions differ
significantly in size, subsequently differing in the way interest rates influence the
amounts of mortgage loans advanced by financial institutions. There's a positive and very
strong relationship between bank size and the amount of mortgage loans granted.
31
4.3 Diagnostic Tests for the Estimation Model
The relationship between mortgage lending (y-variable) and the interest rates (x-variable)
is negative/inverse in nature while that with the constant (α) is positive in nature. The
error element in the sample is assumed to be reduced to an insignificant amount.
Table 3: Summary of model
ANOVA df Sum of
Square
Mean
Square
F Significance
F
Regression 1 1.502 1.502 0.024 0.877
Residual 28 1729.622 61.772
Total 29 1731.123
The research has used a confidence interval of 95% (5% Significance Level) in the MS
Excel package. Thus from the research the resulting model is not statistically significant.
This is because Significance F (0.87722) is greater than the Significance Level (0.05).
Therefore, the overall model is not reliable for decision making purposes.
From the form , the regression model becomes
4.4 Model Estimation Results and Discussion
Table 4: Summary of regression statistics Regression Statistics
Multiple R 0.02945
R Square 0.00087
Adjusted R Square -0.03482
Standard Error 7.85953
Observations 30
32
4.4.1 Multiple R Multiple R is a value that normally lies between zero and one. It is the coefficient of
correlation between interest rates and mortgage lending. It determines whether there
exists a linear relationship between the two variables and sequentially shows the strength
of the relationship. The Multiple R shows that there is an inverse linear relationship
between the two variables interest rates and lending by mortgage financial institutions in
Kenya. However, it is a weak one since it is at only 2.95%.
4.4.2 Adjusted R-Square
This is the coefficient of determination. It measures causality between the two variables.
If a relationship exists, it shows the goodness of fit of the deriving model. It is a value
between zero and one, and can be interpreted as a percentage. Only 3.48% of changes in
the mortgage lending is influenced by corresponding inverse changes in the interest rates.
Thus, 96.52% of changes in mortgage lending is explained by other external factors e.g.
monetary and fiscal policy, recession.
4.4.3 T Stat Table 5: Summary of t-stat statistics
Coefficients Standard
Error
t Stat P-value Lower
95%
Upper
95%
Intercept 20.277 25.941 0.782 0.441 -32.86 73.415
Interest
Rate
-21.541 138.164 -0.156 0.877 -304.557 261.475

33
T-stat is used to measure the significance of individual parameters in the overall model.
The higher the t-stat the more statistically significant the individual parameter is. There is
a positive relationship between the dependent variable and intercept (constant) 20.277.
The constant (intercept), α have a higher t Stat value and thus have a higher statistical
significance than the interest rates. Therefore other unexplained variables that have not
been included in this study have more statistical significance than the interest rates.
At 95% confidence interval when the t-stat is greater than 1.96 then the parameters are
statistically significant, in reference to the study both the constant and interest rate
variables are not statistically significant because they are less than 1.96. There’s an
inverse relationship between the t-stat and p-value, the higher the t-stat the lower the p-
value and this is confirmed from the table above. The range of coefficients is shown by
lower and upper 95%. The Beta coefficient of interest rates can go as low as -305 and as
high as 261 thus not so reliable because they are dispersed from the mean.
Graph 1: Line of best fit
The line of best fit usually portrays the distinction between the unexplained variables and
explained variables on a scatter plot graph. Below the line of best fit we find the
34
explained variables and in our case that’s the interest rate while above the line of best fir
we have unexplained variables that is the constant and error term.
4.5 Summary of Findings and Interpretations
Role of financial institutions in the economy is offering credit, which include mortgages.
On the other hand interest rates define the cost of credit in an economy. The objective of
the study was to determine the effect of interest rates on lending by mortgage financial
institutions in Kenya. The study was driven by the need to understand how changes in
interest rates are likely to affect the amount of mortgage lending advanced by mortgage
financial institutions to their customers. Based on the theories the level of interest rates is
determined by the supply and demand of loanable funds available in an economy's credit
market. From the empirical review it provides evidence that interest rates have an inverse
relationship with other variables.
Using a sample of 30 mortgages financial institutions comprising of 29 commercial banks
and one housing finance, regression results reveal that there is an inverse relationship
between the amount of mortgage lending granted by mortgage financial institutions and
the level of interest rates. Specifically, a percentage change in the weighted average
lending rates among Kenya's mortgage financial institutions reduces the annual mortgage
lending by 21.54 percent. This relationship is weak as exemplified by the low levels of
coefficient of determination and correlation coefficients. Therefore this means that there
are other factors that affect lending by mortgage financial institutions in Kenya other than
mortgage interest rates e.g. monetary and fiscal policy, recession etc.
35
There is a positive relationship between the dependent variable and intercept (constant)
20.277. The constant (intercept), α have a higher t Stat value and thus have a higher
statistical significance than the interest rates. Therefore other unexplained variables that
have not been included in this study have more statistical significance than the interest
rates in the effect of lending by mortgage financial institutions in Kenya.
36
CHAPTER FIVE: SUMMARY, CONCLUSION AND
RECOMMENDATIONS
5.1 Summary
This chapter presents discussions of the key findings presented in chapter four,
conclusions drawn based on such findings and recommendations there-to. This chapter is
thus structured into conclusions, recommendations, limitations of the study and areas for
further research.
5.2 Conclusion
When interest rates increase, the amount of mortgage granted by financial institutions to
their customers decreases while when the interest rates decline, the amount of mortgage
granted by financial institutions increases. The conclusion of this study is that there’s a
weak relationship between effect of interest rates and lending by mortgage financial
institutions therefore there are other external factors or determinants of lending by
mortgage financial institutions other than mortgage interest rates for instance like
monetary and fiscal policy, recession.
Regression results reveal that there is an inverse relationship between the amount of
mortgage lending granted by mortgage financial institutions and the level of interest
rates. This relationship is weak as exemplified by the low levels of coefficient of
determination and correlation coefficients. Therefore this means that there are other
factors that affect lending by mortgage financial institutions in Kenya other than
mortgage interest rates. Specifically, a percentage change in the weighted average
37
lending rates among Kenya's mortgage financial institutions reduces the annual mortgage
lending by 21.54 percent.
5.3 Study Recommendation
While the focus and scope of this study was to establish the effect of interest rates on
lending by mortgage financial institutions in Kenya, it is imperative to note that the
macroeconomic environment in which interest rates operate in the country is closely
interlinked with other variables not captured in this study. Thus in order to achieve the
Kenya vision 2030, the right macroeconomic environment needs to be favorable targeting
other factors such as inflation, reducing non-performing loans.
Government intervention on interest rates in terms of controls is not likely to lead to a
significant growth in the amount of lending granted by mortgage financial institutions.
Reason being according to this study interest rates are weakly related and not the most
important determinant to lending by mortgage financial institutions in Kenya. Thus the
government should focus its attention on the other most important variables which
determine lending by mortgage financial institutions and influence these variables.
Thus the government should leave the determination of interest rates to the market forces
of supply and demand but strengthen the monetary policies to ensure that the rate of
inflation which is a major component of interest rate is controlled and managed below the
two digit figure to avoid inflationary pressure pushing interest rates upwards.
According to CBK Report (2012) Kenya had a total of 19,177 mortgage accounts by
December 2012 up from 16,029 in December 2011, and this is a reflection of low
mortgage intake and this study therefore recommends the mortgage financial institutions
38
to promote policies that ensure higher uptake of mortgages especially by lowering the
mortgage rates to be in tandem with the central bank rate. The central bank should apply
stringent regulations on mortgage rates charged by mortgage financial institutions so as to
promote more mortgage intake.
5.4 Limitations of the Study
The key limitation to this study was unavailability of data. Due to the sensitivity of data
pertaining to interest rates and mortgages issued out, majority if not all mortgage
financial institutions were reluctant to divulge this information. The resolution was to
make do with the readily available annual data from CBK, Hass Consult and The
Mortgage Company websites. For this reason the study is limited in so far as it fails to
take into account a longer duration of period. Also due to confidentiality reasons and the
tedious work involved in getting data for the 6 year period covered by the study, the
study was conducted for 30 mortgage financial institutions representing only
approximately 68% of the population. Analysis of the whole population would have
shown a closer representation of the population.
The study did not benefit from the relevant literature from the local content on the subject
matter as this area of study seems to be less traversed. The study used time series data for
the period 2003 to 2012. This means that only 10 observations were included in the
analysis for the 30 mortgage financial institutions in Kenya. A long period with 50 or
more observations is more appropriate when working with macroeconomic data however
collection of such data was not possible.
39
5.5 Suggestions for Further Research
The study concentrated on effect of interest rates on lending by mortgage financial
institutions in Kenya. A further study to incorporate the other macro-economic
determinants that affect lending by mortgage financial institutions in Kenya other than
interest rates could be beneficial. Like influence of capital flow and foreign exchange
rates on lending by mortgage financial institutions in Kenya.
A study could be conducted on the effect of inflation on lending by mortgage financial
institutions because according to the World Bank (2011), the choice of whether to levy
fixed rate or variable rate interest in a given market largely depends on the inflationary
environment. Also a similar research study that incorporates many data points would add
value as it would increase the degrees of freedom in the analysis to determine the various
factors that affect lending by mortgage financial institutions in Kenya over time.
40
REFERENCES Bachofner, M. & Lützkendorf, T. (2005). Research Trends in the Mortgage Market,
Building Research & Information, 33(4), 376-381
Balke, S. B. & Zeng, Z. (2011), Credit Demand, Credit Supply, and Economic activity,
Retrieved from faculty.smu.edu/nbalke/workingpapers/credit_balke_zeng.pdf
on 26th May 2013
Banking Act - Cap 488
Buckley, R. & Kalarickal, J. (2004). Shelter strategies for the urban poor. Idiosyncratic
and successful but hardly mysterious World Bank Policy Research Working
Paper. 3427, Washington D.C.
Campbell, J. Y. (2012). Mortgage Market Design, Department of Economics, Littauer
Center, Harvard University,
Castro, G., & Santos, C. (2010). Bank Interest rates and Loan Determinants, Banco de
Portugal Economic Bulletin, 65-86
CBK’s (2011) Residential Mortgages Market Survey as at December 2011
Central Bank of Kenya (2012) Bank Supervision Annual Report.
Central Bank of Kenya, (2012). Various monthly economic reviews, 2012.
Cook, N., Smith, S. J. & Searle, B. A. (2009). Mortgage markets and cultures of
consumption, Consumption Markets & Culture, 12(2), 133-15
Del Boca, D. & Lusaidi, A. M. (2003). Credit Market Constraints and Labour market
decisions. Labour economics, Elsevier, 10(6), 681-703
41
Essene, R. S. & Apgar, W. (2007). Understanding Mortgage Market Behavior: Creating
Good Mortgage Options for all Americans, Joint Center for Housing Studies of
Harvard University.
Fabozzi F. J. & Modigliani F. (2009). Capital Markets Institutions and Instruments (4th
Ed). USA: Pearson Prentice Hall.
Fabozzi, J. & Modigliani, F. (1992). Mortgage and Mortgage Backed Securities
Market. Boston, Harvard Business School Press.
Fratantoni, M. (2005). Housing and Mortgage Markets An Analysis, Mortgage Bankers
Association
Follain, J.R., Lim, G.C. & Renaud B. (1980). The Demand for Housing in developing
Countries: the case of Korea, Journal of Urban Economics, 7, 315-336.
Georgievska, L., Kabashi, R., Trajkovska, N. M., Mitreska, A., & Vaskov, M. (2011).
Determinants of lending interest rates and interest rate spreads, Special
Conference Paper Special, Bank of Greece.
Gerlach, S. & Peng, W. (2005). Bank lending and property prices in Hong Kong,
Journal of Banking and Finance, 290, 461-81.
Hardwick, P., Khan, B., Langmead, J. (1986). An Introduction to Modern Economics.
Longman Group, Burnt Mill, Harlow, England.
Haugen, A. (2005). Modern Investments (5th Edition). New Delhi.
International Monetary Fund (2012). Financial Intermediation Costs in Low-income
Countries: The Role of Regulatory, Institutional, and Macroeconomic Factors,
IMF working paper.
42
Kidwell, D. S., Blackwell D. W., Whidbee D. A & Peterson R. L. (2008). Financial
Institutions, Markets, And Money 10th Edition. USA, John Wiley & Sons, Inc.
Kilonzo, B. M. (2003). The effects of changes in interest rates on credit granted by
commercial banks in Kenya. Unpublished MBA Research Project.
Leece, D. (2004). Economics of the Mortgage Market - Perspectives on Household
Decision Making. Blackwell Publishing Ltd, Oxford, UK
Martinez, P. J & Maza L. A. (2003). Analysis of housing prices in Spain, working paper
0307, Bank of Spain.
McDonald, D. J. and Thornton, D. L. (2008). A Primer on the Mortgage Market and
Mortgage Finance. Federal Reserve Bank of St. Louis, 90(1), 31-45.
McShane, R. W. & Sharpe, I. G. (1984). A Time Series/Cross Section Analysis of the
Determinants of Australian Trading Bank Loan/Deposit Interest Margins, Journal
of Banking and Finance, 9, 115-136.
Milani, C. (2010), The Determinants of Mortgage Rates: An Empirical Analysis of the
Euro Area Countries, AbiServizi, Economic Research Department
Mugenda, O. M. & Mugenda A. G. (2003). Research Methods: Quantitative and
Qualitative Approaches. Nairobi: acts press.
Muguchia L. (2012). Effect of Flexible Interest Rates on the Growth of Mortgage
Financing in Kenya. Unpublished MBA Research Project.
Muth, R. F. (1962). Interest Rates, Contract Terms, and the Allocation of Mortgage
Funds. The Journal of Finance, 17(1), 63-80.
43
Ngechu, M. (2004). Understanding the Research Prcess and Methods. An introduction to
research methods. Acts press, nairobi.
Ng'etich, J. C. & Wanjau, K. (2011). The Effects of Interest Rate Spread on the level of
Non-Performing Assets: A case of Commercial Banks in Kenya, International
Journal of Public Management ( ISSN: 2223-6244) 1(1), 58-65.
Ngugi, R. W. (2004). Understanding Interest Rates Structure in Kenya, Kenya Institute
for Public Policy Research and Analysis Discussion Paper.
Ngumo, L. W. (2012). The Effect of Interest rates on the Financial Performance of Firms
Offering Mortgages in Kenya. Unpublished MBA Research Project.
Oduor, J., Karingi, S & Mwaura, S. (2011). Efficiency of Financial Market
Intmediation in Kenya: A Comparative Analysis, Journal of Policy Modeling,
33(2), 226-240.
Pandey, I. M. (2010). Financial Management, 10th Edition, New Delhi, Vikas Publishing
House Pvt Ltd.
Parliament Budget Office, (2012). High Interest Rates and the Risks to Economic
Growth, Parliament Budget Office Nairobi, Kenya Discussion Paper.
Shapiro, E. (1992), Macroeconomic Analysis. Galgotia Publications Pvt. Ltd. New Delhi
Situma, E. N. (1997). Financial Liberalization and Private Investment in Africa, Fiscal
Policy and Private Investment in Developing Countries Seminar, July.
Stiglitz, J. E. (2010). The Stiglitz Report: Reforming the International Monetary and
Financial Systems in the Wake of the Global Crisis, The New Press, ISBN
1595585206
44
Sodersten, Bo (1980). International Economics. Macmillan Press Ltd., London.
Tobin, J. (1965). Money and Economic Growth, Econometrica, 33 (4), 671-684.
Tregarthen T. & Rittenberg L. (2000). Economics, 2nd Edition. USA, Worth
Publishers.
Wahome, M. W. (2010). A Survey of Factors Influencing Mortage Financing In Kenya.
Unpublished MBA Research Project.
World Bank, The (2011). Developing Kenya's Mortgage Market, accessed from
www.siteresources.worldbank.org on 20th September 2012.

45
APPENDIX I: Financial Institutions in Kenya based on Bank Segment 1. Kenya Commercial Bank Large 2. Housing Finance Large 3. CFC Stanbic Large 4. Standard Chartered Large 5. Barclays Bank Large 6. Commercial Bank of Africa Large 7. I&M Bank Large 8. Equity Bank Large 9. National Bank of Kenya Large 10. Diamond Trust Bank Large 11. NIC Bank Large 12. Bank of India Large 13. Cooperative Bank of Kenya Large 14. Prime Bank Large 15. Imperial Bank Large 16. Bank of Africa Large 17. Bank of Baroda Large 18. Citibank N.A. Large 19. Development Bank Medium 20. Consolidated Bank of Kenya Medium 21. Family Bank Medium 22. Victoria Commercial Bank Medium 23. Chase Bank Medium 24. Fidelity Commercial Bank Medium 25. African Banking Corp Medium 26. Giro Bank Medium 27. EcoBank Medium 28. Guardian Bank Medium 29. Fina Bank Medium 30. Gulf African Bank Medium 31. Habib AG Zurich Medium 32. K-Rep Bank Medium 33. First Community Bank Small 34. Paramount Bank Small 35. Trans-National Bank Small 36. Credit Bank Small 37. Middle East Bank Small 38. Habib Bank Small 39. Oriental Commercial Bank Small 40. Equatorial Bank Small 41. UBA Kenya Small 42. Dubai Bank Small 43. City Finance Bank Small 44. Southern Credit Banking Corp Small
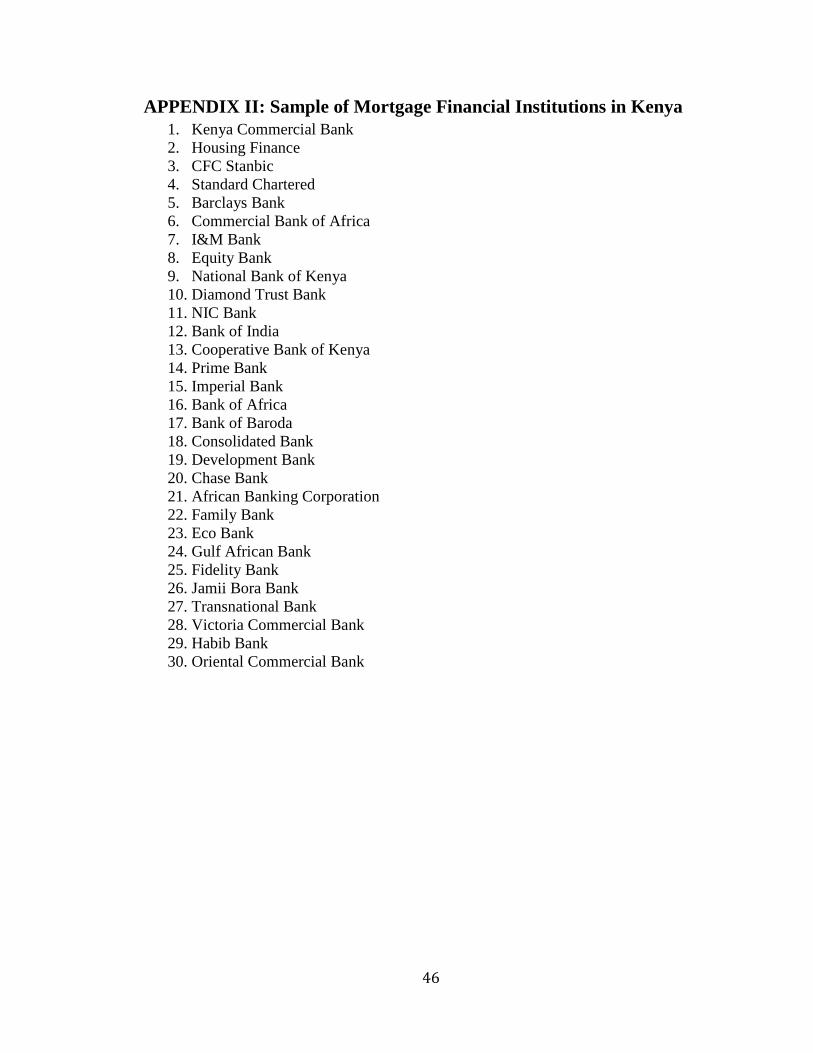
46
APPENDIX II: Sample of Mortgage Financial Institutions in Kenya 1. Kenya Commercial Bank 2. Housing Finance 3. CFC Stanbic 4. Standard Chartered 5. Barclays Bank 6. Commercial Bank of Africa 7. I&M Bank 8. Equity Bank 9. National Bank of Kenya 10. Diamond Trust Bank 11. NIC Bank 12. Bank of India 13. Cooperative Bank of Kenya 14. Prime Bank 15. Imperial Bank 16. Bank of Africa 17. Bank of Baroda 18. Consolidated Bank 19. Development Bank 20. Chase Bank 21. African Banking Corporation 22. Family Bank 23. Eco Bank 24. Gulf African Bank 25. Fidelity Bank 26. Jamii Bora Bank 27. Transnational Bank 28. Victoria Commercial Bank 29. Habib Bank 30. Oriental Commercial Bank
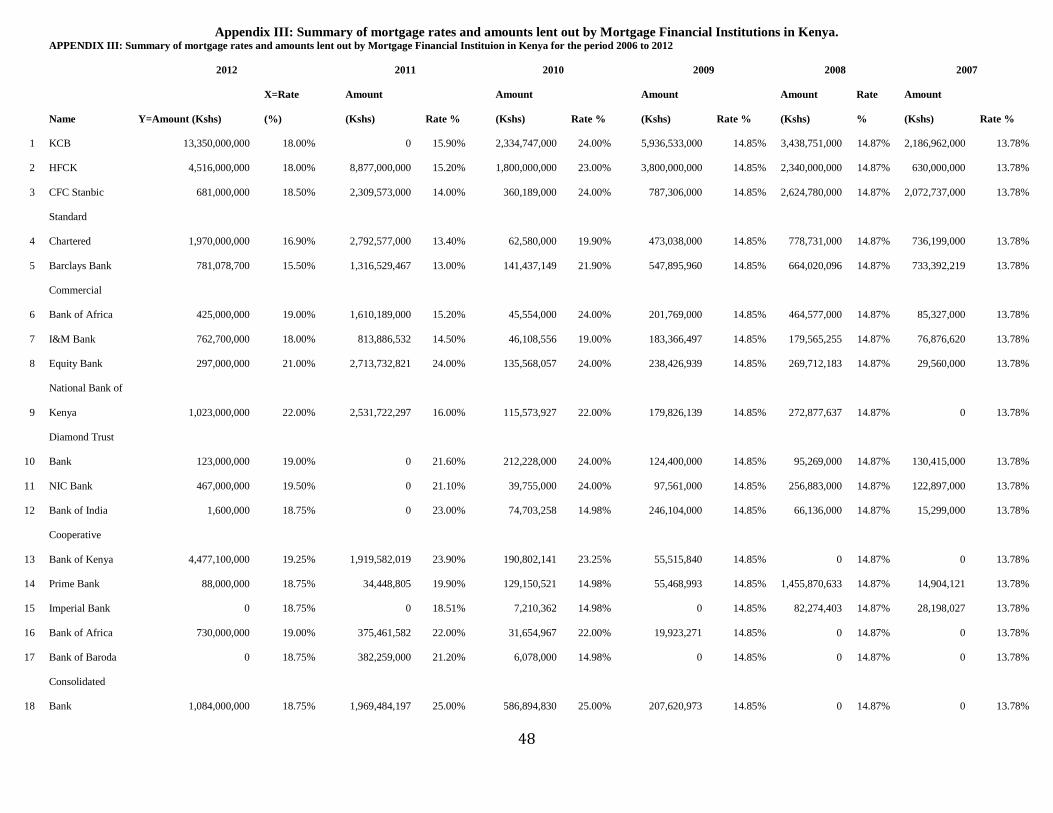
48
Appendix III: Summary of mortgage rates and amounts lent out by Mortgage Financial Institutions in Kenya. APPENDIX III: Summary of mortgage rates and amounts lent out by Mortgage Financial Instituion in Kenya for the period 2006 to 2012
2012 2011 2010 2009 2008 2007
Name Y=Amount (Kshs)
X=Rate
(%)
Amount
(Kshs) Rate %
Amount
(Kshs) Rate %
Amount
(Kshs) Rate %
Amount
(Kshs)
Rate
%
Amount
(Kshs) Rate %
1 KCB 13,350,000,000 18.00% 0 15.90% 2,334,747,000 24.00% 5,936,533,000 14.85% 3,438,751,000 14.87% 2,186,962,000 13.78%
2 HFCK 4,516,000,000 18.00% 8,877,000,000 15.20% 1,800,000,000 23.00% 3,800,000,000 14.85% 2,340,000,000 14.87% 630,000,000 13.78%
3 CFC Stanbic 681,000,000 18.50% 2,309,573,000 14.00% 360,189,000 24.00% 787,306,000 14.85% 2,624,780,000 14.87% 2,072,737,000 13.78%
4
Standard
Chartered 1,970,000,000 16.90% 2,792,577,000 13.40% 62,580,000 19.90% 473,038,000 14.85% 778,731,000 14.87% 736,199,000 13.78%
5 Barclays Bank 781,078,700 15.50% 1,316,529,467 13.00% 141,437,149 21.90% 547,895,960 14.85% 664,020,096 14.87% 733,392,219 13.78%
6
Commercial
Bank of Africa 425,000,000 19.00% 1,610,189,000 15.20% 45,554,000 24.00% 201,769,000 14.85% 464,577,000 14.87% 85,327,000 13.78%
7 I&M Bank 762,700,000 18.00% 813,886,532 14.50% 46,108,556 19.00% 183,366,497 14.85% 179,565,255 14.87% 76,876,620 13.78%
8 Equity Bank 297,000,000 21.00% 2,713,732,821 24.00% 135,568,057 24.00% 238,426,939 14.85% 269,712,183 14.87% 29,560,000 13.78%
9
National Bank of
Kenya 1,023,000,000 22.00% 2,531,722,297 16.00% 115,573,927 22.00% 179,826,139 14.85% 272,877,637 14.87% 0 13.78%
10
Diamond Trust
Bank 123,000,000 19.00% 0 21.60% 212,228,000 24.00% 124,400,000 14.85% 95,269,000 14.87% 130,415,000 13.78%
11 NIC Bank 467,000,000 19.50% 0 21.10% 39,755,000 24.00% 97,561,000 14.85% 256,883,000 14.87% 122,897,000 13.78%
12 Bank of India 1,600,000 18.75% 0 23.00% 74,703,258 14.98% 246,104,000 14.85% 66,136,000 14.87% 15,299,000 13.78%
13
Cooperative
Bank of Kenya 4,477,100,000 19.25% 1,919,582,019 23.90% 190,802,141 23.25% 55,515,840 14.85% 0 14.87% 0 13.78%
14 Prime Bank 88,000,000 18.75% 34,448,805 19.90% 129,150,521 14.98% 55,468,993 14.85% 1,455,870,633 14.87% 14,904,121 13.78%
15 Imperial Bank 0 18.75% 0 18.51% 7,210,362 14.98% 0 14.85% 82,274,403 14.87% 28,198,027 13.78%
16 Bank of Africa 730,000,000 19.00% 375,461,582 22.00% 31,654,967 22.00% 19,923,271 14.85% 0 14.87% 0 13.78%
17 Bank of Baroda 0 18.75% 382,259,000 21.20% 6,078,000 14.98% 0 14.85% 0 14.87% 0 13.78%
18
Consolidated
Bank 1,084,000,000 18.75% 1,969,484,197 25.00% 586,894,830 25.00% 207,620,973 14.85% 0 14.87% 0 13.78%
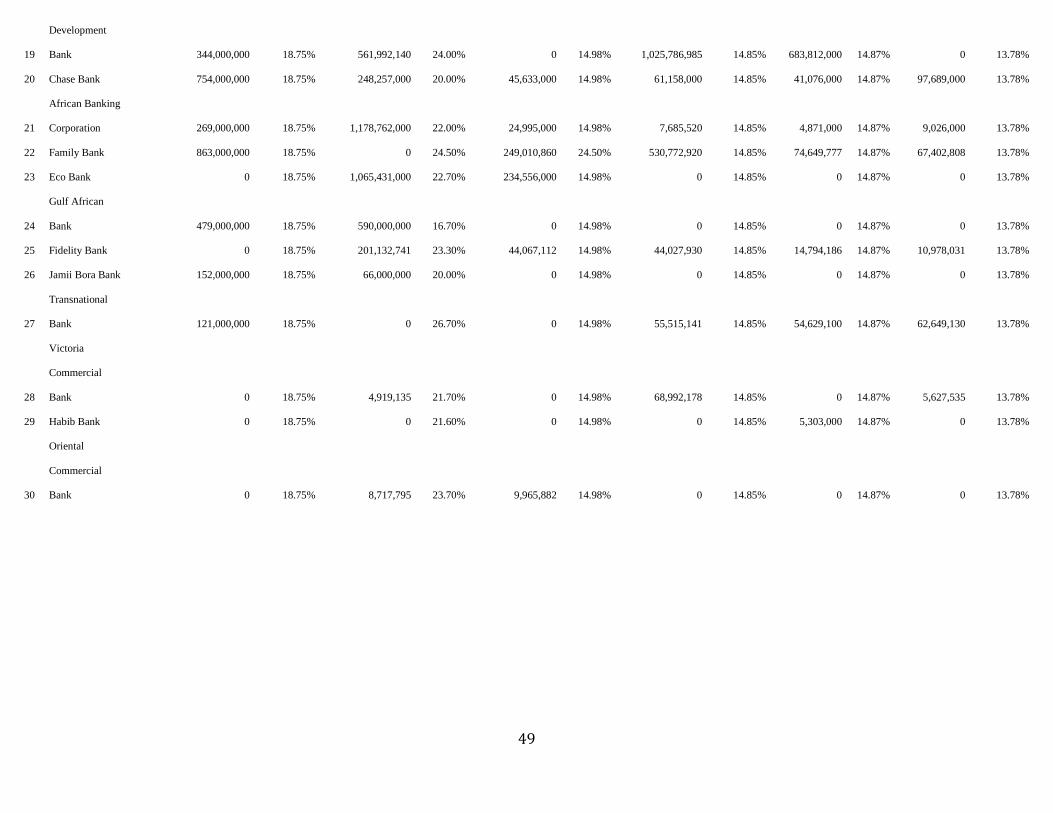
49
19
Development
Bank 344,000,000 18.75% 561,992,140 24.00% 0 14.98% 1,025,786,985 14.85% 683,812,000 14.87% 0 13.78%
20 Chase Bank 754,000,000 18.75% 248,257,000 20.00% 45,633,000 14.98% 61,158,000 14.85% 41,076,000 14.87% 97,689,000 13.78%
21
African Banking
Corporation 269,000,000 18.75% 1,178,762,000 22.00% 24,995,000 14.98% 7,685,520 14.85% 4,871,000 14.87% 9,026,000 13.78%
22 Family Bank 863,000,000 18.75% 0 24.50% 249,010,860 24.50% 530,772,920 14.85% 74,649,777 14.87% 67,402,808 13.78%
23 Eco Bank 0 18.75% 1,065,431,000 22.70% 234,556,000 14.98% 0 14.85% 0 14.87% 0 13.78%
24
Gulf African
Bank 479,000,000 18.75% 590,000,000 16.70% 0 14.98% 0 14.85% 0 14.87% 0 13.78%
25 Fidelity Bank 0 18.75% 201,132,741 23.30% 44,067,112 14.98% 44,027,930 14.85% 14,794,186 14.87% 10,978,031 13.78%
26 Jamii Bora Bank 152,000,000 18.75% 66,000,000 20.00% 0 14.98% 0 14.85% 0 14.87% 0 13.78%
27
Transnational
Bank 121,000,000 18.75% 0 26.70% 0 14.98% 55,515,141 14.85% 54,629,100 14.87% 62,649,130 13.78%
28
Victoria
Commercial
Bank 0 18.75% 4,919,135 21.70% 0 14.98% 68,992,178 14.85% 0 14.87% 5,627,535 13.78%
29 Habib Bank 0 18.75% 0 21.60% 0 14.98% 0 14.85% 5,303,000 14.87% 0 13.78%
30
Oriental
Commercial
Bank 0 18.75% 8,717,795 23.70% 9,965,882 14.98% 0 14.85% 0 14.87% 0 13.78%
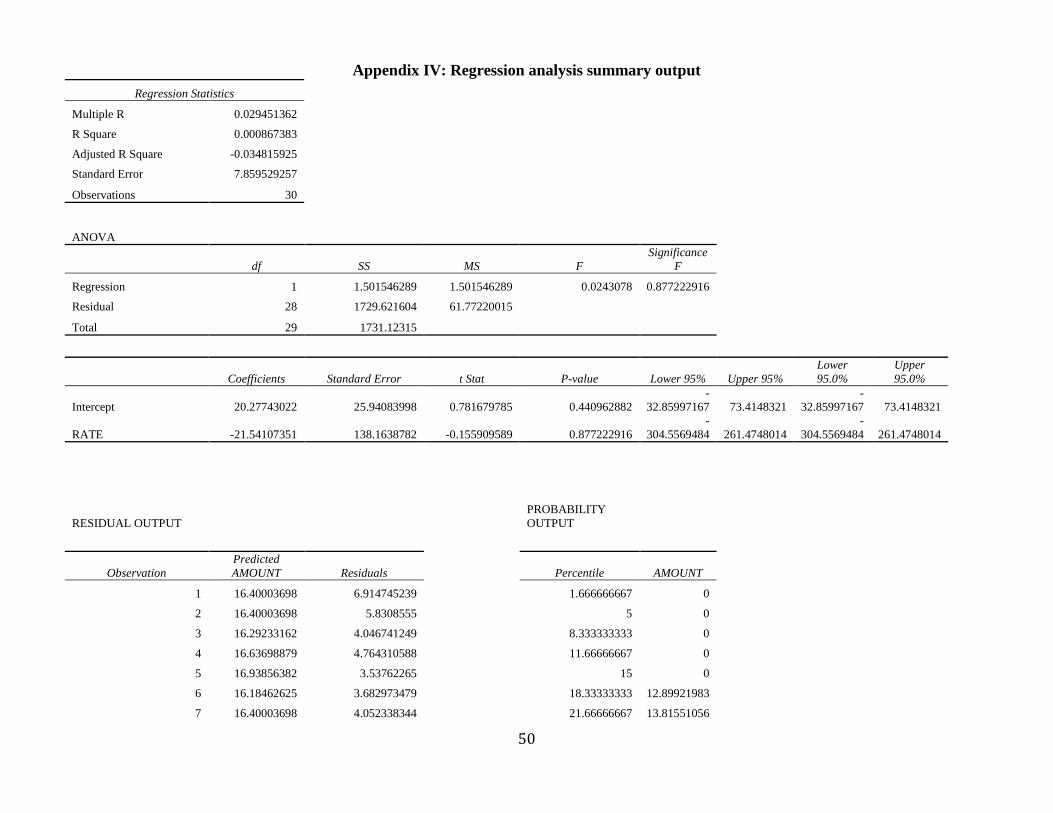
50
Appendix IV: Regression analysis summary output Regression Statistics
Multiple R 0.029451362
R Square 0.000867383
Adjusted R Square -0.034815925
Standard Error 7.859529257
Observations 30
ANOVA
df SS MS F Significance
F
Regression 1 1.501546289 1.501546289 0.0243078 0.877222916
Residual 28 1729.621604 61.77220015
Total 29 1731.12315
Coefficients Standard Error t Stat P-value Lower 95% Upper 95% Lower 95.0%
Upper 95.0%
Intercept 20.27743022 25.94083998 0.781679785 0.440962882 -
32.85997167 73.4148321 -
32.85997167 73.4148321
RATE -21.54107351 138.1638782 -0.155909589 0.877222916 -
304.5569484 261.4748014 -
304.5569484 261.4748014
RESIDUAL OUTPUT PROBABILITY OUTPUT
Observation Predicted AMOUNT Residuals Percentile AMOUNT
1 16.40003698 6.914745239 1.666666667 0
2 16.40003698 5.8308555 5 0
3 16.29233162 4.046741249 8.333333333 0
4 16.63698879 4.764310588 11.66666667 0
5 16.93856382 3.53762265 15 0
6 16.18462625 3.682973479 18.33333333 12.89921983
7 16.40003698 4.052338344 21.66666667 13.81551056
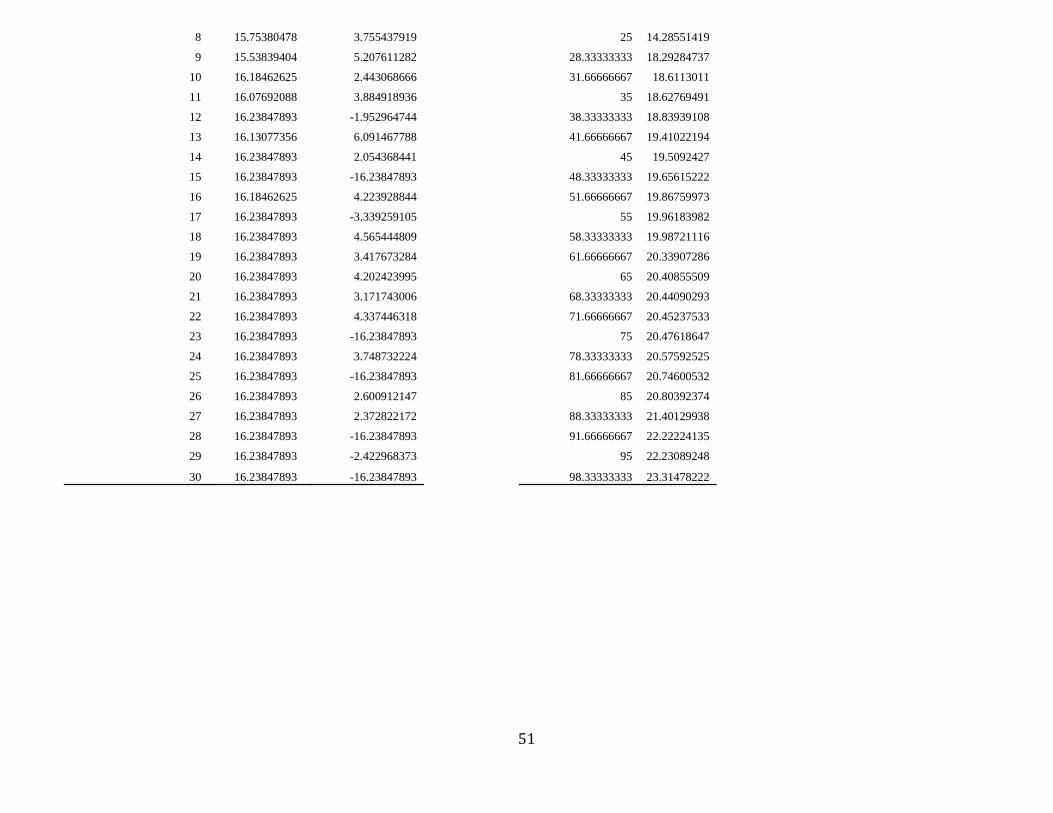
51
8 15.75380478 3.755437919 25 14.28551419
9 15.53839404 5.207611282 28.33333333 18.29284737
10 16.18462625 2.443068666 31.66666667 18.6113011
11 16.07692088 3.884918936 35 18.62769491
12 16.23847893 -1.952964744 38.33333333 18.83939108
13 16.13077356 6.091467788 41.66666667 19.41022194
14 16.23847893 2.054368441 45 19.5092427
15 16.23847893 -16.23847893 48.33333333 19.65615222
16 16.18462625 4.223928844 51.66666667 19.86759973
17 16.23847893 -3.339259105 55 19.96183982
18 16.23847893 4.565444809 58.33333333 19.98721116
19 16.23847893 3.417673284 61.66666667 20.33907286
20 16.23847893 4.202423995 65 20.40855509
21 16.23847893 3.171743006 68.33333333 20.44090293
22 16.23847893 4.337446318 71.66666667 20.45237533
23 16.23847893 -16.23847893 75 20.47618647
24 16.23847893 3.748732224 78.33333333 20.57592525
25 16.23847893 -16.23847893 81.66666667 20.74600532
26 16.23847893 2.600912147 85 20.80392374
27 16.23847893 2.372822172 88.33333333 21.40129938
28 16.23847893 -16.23847893 91.66666667 22.22224135
29 16.23847893 -2.422968373 95 22.23089248
30 16.23847893 -16.23847893 98.33333333 23.31478222