Embed Size (px)
Citation preview

SUMMARY OF DATA FROM ONSITE AND LABORATORY ANALYSES OF PRECIPITATION
RUNOFF FROM CARBONATE-STONE SURFACES, NATIONAL ACID PRECIPITATION
ASSESSMENT PROGRAM, JUNE 1984 TO NOVEMBER 1987
By Michael M. Reddy, Paul F. Schuster, and James J. Harte
U.S. GEOLOGICAL SURVEY
Open-File Report 89-246
Prepared in cooperation with the
NATIONAL PARK SERVICE
Denver, Colorado 1989

DEPARTMENT OF THE INTERIOR
MANUEL LUJAN, JR., Secretary
U.S. GEOLOGICAL SURVEY
Dallas L. Peck, Director
For additional information Copies of this report canwrite to: be purchased from:
Chief, Branch of Regional Research U.S. Geological SurveyU.S. Geological Survey Books and Open-File Reports SectionRoom H-2822, Bldg. 53 Federal CenterBox 25046, Mail Stop 418 Box 25425Federal Center Denver, CO 80225-0425Denver, CO 80225-0046 [Telephone: (303) 236-7476]

CONTENTS
Page Abstract------------------------------------------- -------------------- iIntroduction------------------------------------------------------------- 1Data file 2 Summary------------------------------------------------------------------ 3References cited--------------------------------------------------------- 3
TABLES
Page Table 1. Variable names and codes for source of samples
and sample types------------------------------------------- 42. Variable names and codes for sample collection
and precipitation type------------------------------------- 53. Variable names for onsite- and laboratory-measured
parameters------------------------------------------------- 64-9. Summary statistics for:
4. Blank samples---------------------------------------------- 75. Glass samples---------------------------------------------- 86. Limestone samples------------------------------------------ 97. Marble samples--------------------------------------------- 108. Distilled-water reference samples-------------------------- 119. M-82 standard reference water samples---------------------- 12
10. Analytical results for standard reference watersample M-82- -- -- ---- ---- 13
11. Summary statistics for M-4 standard referencewater samples---------------------------------------------- 14
12. Analytical results for standard reference watersample M-4------------------------------------------------- 15
13. Summary statistics for samples collected using therecording precipitation monitor---------------------------- 16
14. Detection limits for laboratory analyses (1984-86)----------- 1715. Detection limits for laboratory analyses (1987)-------------- 1716-18. Sample data set of:
16. DATAT.A 1817. DATAT.B 1918. DATAT.C 19
111
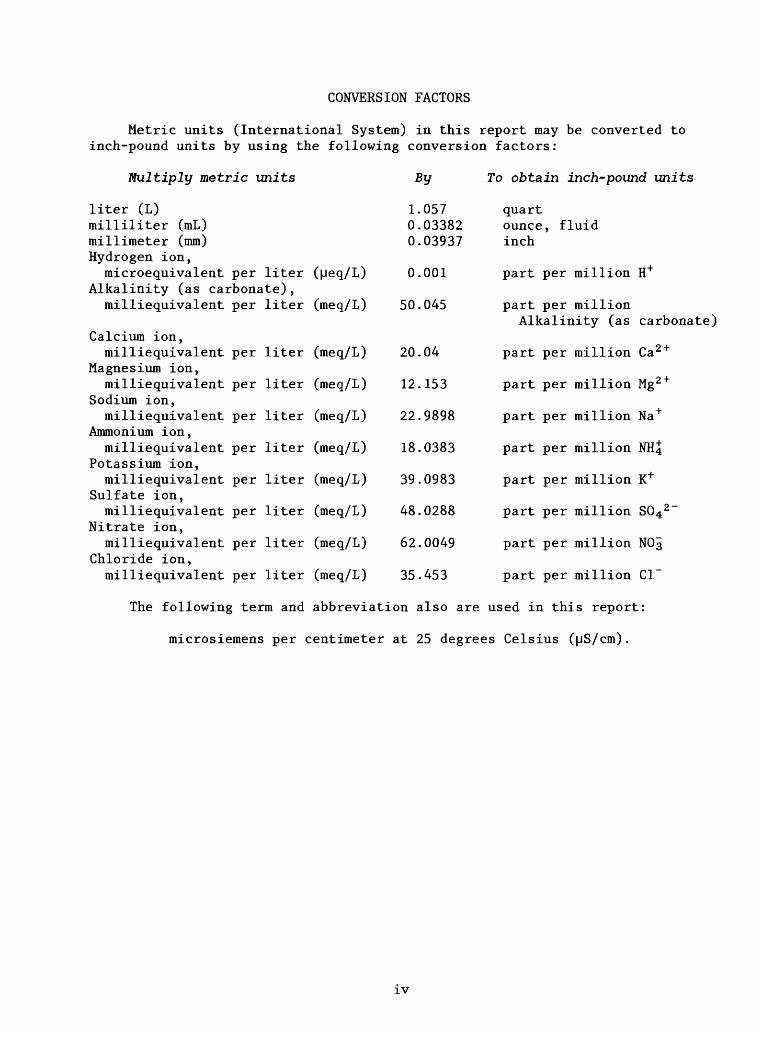
CONVERSION FACTORS
Metric units (International System) in this report may be converted to inch-pound units by using the following conversion factors:
Multiply metric units By
liter (L) 1.057 milliliter (mL) 0.03382 millimeter (mm) 0.03937 Hydrogen ion,microequivalent per liter (peq/L) 0.001
Alkalinity (as carbonate),milliequivalent per liter (meq/L) 50.045
Calcium ion,milliequivalent per liter (meq/L) 20.04
Magnesium ion,milliequivalent per liter (meq/L) 12.153
Sodium ion,milliequivalent per liter (meq/L) 22.9898
Ammonium ion,milliequivalent per liter (meq/L) 18.0383
Potassium ion,milliequivalent per liter (meq/L) 39.0983
Sulfate ion,milliequivalent per liter (meq/L) 48.0288
Nitrate ion,milliequivalent per liter (meq/L) 62.0049
Chloride ion,milliequivalent per liter (meq/L)
To obtain inch-pound units
quartounce, fluid inch
part per million H+
part per millionAlkalinity (as carbonate)
part per million Ca2+
part per million Mg2 +
part per million Na+
part per million NH4
part per million K+
part per million S04 2 ~
part per million NOs
part per million Cl~35.453
The following term and abbreviation also are used in this report:
microsiemens per centimeter at 25 degrees Celsius (pS/cm).
IV

SUMMARY OF DATA FROM ONSITE AND LABORATORY ANALYSES OF
PRECIPITATION RUNOFF FROM CARBONATE-STONE SURFACES,
NATIONAL ACID PRECIPITATION ASSESSMENT PROGRAM,
JUNE 1984 TO NOVEMBER 1987
By Michael M. Reddy, Paul F. Schuster, and James J. Harte
ABSTRACT
This report presents a summary of data collected from June 1984 to November 1987 as part of an experimental research program to quantify the interaction of acid precipitation with a carbonate-stone surface. The work was done in conjunction with the National Acid Precipitation Assessment Program. Precipitation-runoff samples were collected from polypropylene receptacles (blank samples), glass plates, and flat surfaces of two types of carbonate stone: Salem Limestone (from Indiana) and Shelburne Marble (from Vermont). The summary is based on onsite and laboratory measurements for 1,973 samples that are available in a computer-data file. The data file contains sample description and analytical data for precipitation and runoff samples collected at five sites, which are representative of 318 rain events, distilled-water reference samples, and standard reference water samples.
INTRODUCTION
The National Acid Precipitation Assessment Program, Task Group VII Materials and Cultural Resources Effects--was organized, in part, as a 10-year program to measure, document, and quantify acid-precipitation effects on two types of carbonate stone: Salem Limestone (from Indiana) and Shelburne Marble (from Vermont). In 1984, four onsite-research locations were established in the eastern United States at Newcomb, N.Y.; Chester, N.J.; Washington, D.C.; and Research Triangle Park, N.C. In 1986, Steubenville, Ohio replaced Chester, N.J. as an operational site. Precipitation-runoff samples from polypropylene receptacles (blank samples), glass plates, and stone surfaces were analyzed. Details of the onsite and laboratory procedures are described in other reports (Sherwood, 1984; Reddy and others, 1985; Reddy and Werner, 1985). Sample preparation, analytical procedures, and laboratory quality-control protocols used by the U.S. Geological Survey laboratory are described by Fishman and Friedman (1985).

This work has been done as part of the National Acid Precipitation Assessment Program and was funded in part by the National Park Service. The purpose of this report is to update a report authored by See and Reddy (1987); the update includes data collected in 1987. Data and statistics presented in this report do not necessarily indicate the views of the National Acid Precipitation Assessment Program or the National Park Service.
DATA FILE
Precipitation-runoff analysis data are available for samples collected and analyzed from June 1984 to November 1987. Five types of samples were collected from 318 rain events during this period. To evaluate onsite- sampling variability, replicate samples were collected from adjacent stones of the same type. The duplicate samples were submitted to the laboratory to identify variability caused by sample processing and handling. Additional distilled-water reference samples and standard reference water samples (SRWS) 1 were submitted to the laboratory with the onsite samples. Both types of reference samples were processed using the same procedures as the onsite samples. During the indicated period, 1,973 samples were processed; ana lytical results are available in the data file which is summarized in tables 1 through 18.
The data file is available in ASCII format on a 3% inch diskette. It has been divided into three subfiles. The first subfile (DATAT.A) contains descriptive information and onsite measurements of pH and specific conduct ance. The second subfile (DATAT.B) repeats some descriptive information and contains laboratory measurements of pH, specific conductance, alkalinity, and major anions. The third subfile (DATAT.C) also repeats some descriptive information and contains laboratory measurements of major cations. For further information about the availability or use of the diskette, call Michael M. Reddy, Paul F. Schuster, or James J. Harte at (303) 236-3617 or FTS 776-3617 or contact the Chief, Branch of Regional Research, Water Resources Division, Room H-2822, Bldg. 53 (mailing address: Box 25046, mail stop 418, Denver Federal Center, Denver, Co. 80225-0046).
The data file consists of 29 variables. Variable names and codes established for source of samples and sample types are listed in table 1. Variable names and codes established for sample collection and precipitation type are listed in table 2. Variable names for parameters measured onsite and in the laboratory are listed in table 3.
All data has been proofed to eliminate keypunching errors. An additional check on the quality of the data was provided by a verification of summary statistics for the data, sorted by sample type. Samples that have exceptionally large or small values were examined and reanalyzed to determine if the values were accurate or erroneous. The summary statistics for each
1 SRWS - Standard reference water samples are prepared and used by the U.S. Geological Survey's quality assurance program to ensure that the laboratory is producing analytical data for inorganic constituents that are of acceptable reliability (Schroder and others, 1980).
sample type are listed in tables 4 through 9, 11, and 13. Analytical results, obtained from the U.S. Geological Survey, Quality Assurance Laboratory, for standard reference water samples M-82 and M-4 are given in tables 10 and 12.
The summary statistics are not intended for use in evaluating the effect of acid precipitation on stone samples. The statistical calculations include all entries in the data file including overflow, duplicate, and replicate samples from all of the sites. Tables 4 through 9, 11, and 13 are strictly statistical descriptions of the data file.
Samples that had analytical results less than the detection limits of the selected methods are indicated in the data set by double dashes (--). The detection limits of quantification are listed in tables 14 and 15. Sample parts of the data file are included in tables 16 through 18.
SUMMARY
A total of 1,973 samples from 318 rain events have been analyzed using a protocol designed to minimize errors from handling procedures, laboratory analyses, and data-entry operations. Duplicate samples and standard reference water samples are included in this sample set. Further additions will be made to the data file as sample collection continues, and as laboratory analyses are completed.
REFERENCES CITED
Fishman, M.J., and Friedman, L.C., eds., 1985, Methods for determination of inorganic substances in water and fluvial sediments: U.S. Geological Survey Open-File Report 85-495, 709 p.
Reddy, M.M., Sherwood, S.I., and Doe, B.R., 1985, Modeling limestone dis solution by acid rain, in General Proceedings of Research and Design, 85, Los Angeles, 1985: Washington, D.C. The American Institute of Architects Foundation, p. 383-388.
Reddy, M.M. and Werner, M.G., 1985, Composition of rainfall runoff fromlimestone and marble at Research Triangle Park, North Carolina: U.S. Geological Survey Open-File Report 85-630, 6 p.
Schroder, L.J., Fishman, M.J., Friedman, L.C., and Darlington, G.W., 1980, The use of standard reference water samples by the U.S. Geological Survey: U.S. Geological Survey Open-File Report 80-738, 11 p.
See, R.B. and Reddy, M.M., 1987, Summary of data for onsite and laboratoryanalyses of precipitation runoff from carbonate-rock surfaces, National Acid Precipitation Assessment Program, June 1984 to September, 1986: U.S. Geological Survey Open-File Report 87-461, 14 p.
Sherwood, S.I., 1984, The National Park Service program on the effects of air pollution on cultural properties: Annual Air Pollution Control Association Meeting, 77th, San Francisco, 1984, Preprint, p. 1-16.

Table 1. Variable names and codes for source of samples and sample types
Variable nameAbbreviated variable name in data file
Code Definition
Source of samples SITE
Sample type TYPE
DC Washington, D.C. LB Standard reference water samples
from U.S. Geological Survey laboratory, Denver, Colo.
NJ Chester, N.J. NC Research Triangle Park, N.C. NY Newcomb, N.Y. OH Steubenville, Ohio B Blank (empty receptacle) rack G Glass L Limestone M MarbleD Distilled-water reference sampleM-82 M-82 standard reference water sampleM-4 M-4 standard reference water sampleSR-74 SR-74 standard reference water sampleSR-70 SR-70 standard reference water sampleSR-74D SR-74D standard reference water sampleP-5 P-5 standard reference water sampleP Recording precipitation monitor

Table 2. Variable names and codes for sample collection andprecipitation type
Variable nameAbbreviated variable name in data file
Code Definition
YearEventSide
Duplicate
Julian day on Julian day off Overflow
YEAREVENTSIDE
DUP
JD ON JD OFF OVERFLOW
Precipitation type
Filtered volume
Unfiltered volume
Degree
PRECIP TYPE
FILT VOL
UNFILT VOL
DEGREE
Two-digit code Two-digit code Two-digit code
12
1-365 1-365YN
RN SN SL SR
Integer
Integer
0-90°
Year of collection Sample-collection sequence Position of blanks, glass, and
stones in racks Original sample Split of original sample Date sample collector was installed Date sample collector was removed Collector bottle overflowed Collector bottle didnot overflow
Known problems withsample collection
Rain Snow SleetSnow and rain mixed Volume of filtered sample sent
to laboratory for analysis Volume of unfiltered sample
sent to laboratory Degree at which blank, glass,
or stone is set with respectto horizontal

Table 3. --Variable names for onsite- and laboratory-measured parameters
Variable nameAbbreviated
variable name in data file
Units
Volume
Precipitation
VOLUME RAIN IN RAIN MM
Sample volume (milliliters) Depth (inches) Depth (millimeters)
Specific conductance(onsite)
Specific conductance(laboratory)
pH (onsite) pH (laboratory) Alkalinity (laboratory) Calcium ion (laboratory) Magnesium ion (laboratory) Sodium ion (laboratory) Ammonium ion (laboratory) Potassium ion (laboratory) Sulfate ion (laboratory) Nitrate ion (laboratory) Chloride ion (laboratory)
CON FLD Microsiemens per centimeter
CON LAB
PH FLD PH LAB ALK MEQ CA MEQ MG MEQ NA MEQ NH4 MEQ K MEQ S04 MEQ N03 MEQ CL MEQ
Microsiemens per centimeter
Standard unitsStandard unitsMilliequivalentsMilliequivalentsMilliequivalentsMilliequivalentsMilliequivalentsMilliequivalentsMilliequivalentsMilliequivalentsMilliequivalents
per liter per liter per liter per liter per liter per liter per liter per liter per liter

Table 4.--Summary statistics for blank samples
[mL, milliliters; mm, millimeters; |jS/cm, microsiemens per centimeter at 25 degrees Celsius; |Jeq/L, microequivalents per liter; meq/L, milliequivalents per liter; --, indicates that results were less than detection limits for the selected analytical procedures; missing, data unavailable; less than detection, number of samples having results that were less than detection limits for the selected analytical procedures; measured, number of samples having results that were greater than detection limits]
Number of samples
Parameter
Volume (mL)Precipitation (mm)Specific
conductance(onsite, |jS/cm)
Specificconductance (laboratory,MS/cm)
pH (onsite, standard units)
Hydrogen ion (onsite, |Jeq/L)
pH (laboratory, standard units)
Hydrogen ion(laboratory,Meq/L)
Alkalinity(meq/L, ascarbonate)
Calcium ion (meq/L)
Magnesium ion (meq/L)
Sodium ion (meq/L)
Ammonium ion(meq/L, asnitrogen)
Potassium ion (meq/L)
Sulfate ion(meq/L, assulfate)
Nitrate ion(meq/L, asnitrate)
Chloride ion (meq/L)
Mean
1,34215.7
39.5
35.5
4.61
60.1
4.90
44.94
0.028
0.079
0.013
0.028
0.018
0.004
0.098
0.050
0.022
Standard deviation
1,26016.8
36.7
29.7
0.79
73.4
0.98
69.37
0.063
0.177
0.024
0.049
0.014
0.004
0.105
0.061
0.046
RangeMini- Maxi mum mum
11 4,2400.25 127
3.0 244.1
3.3 270.0
3.39 7.14
0.072 407
3.13 7.70
0.020 741.3
0 0.520
0.002 1.951
0.001 0.253
0.327
0.001 0.044
0.026
0.005 1.155
0.004 0.656
0.352
Missing
542
81
39
81
81
40
40
22
34
36
36
197
113
40
38
103
Less than detec
tion
00
0
0
0
0
0
0
0
1
4
17
0
1
0
1
4
Measured
204167
128
170
128
128
169
169
187
174
169
156
12
95
169
170
102
Table 5. Summary statistics for glass samples
[mL, milliliters; mm, millimeters; pS/cm, microsiemens per centimeter at 25 degrees Celsius; jJeq/L, microequivalents per liter; meq/L, milliequivalents per liter; --, indicates that results were less than detection limits for the selected analytical procedures; missing, data unavailable; less than detection, number of samples having results that were less than detection limits for the selected analytical procedures; measured, number of samples having results that were greater than detection limits]
Number of samplesRange
Parameter
Volume (mL)Precipitation (mm)Specific
conductance(onsite, pS/cm)
Specificconductance (laboratory,MS/cm)
pH (onsite, standard units)
Hydrogen ion (onsite, peq/L)
pH (laboratory, standard units)
Hydrogen ion(laboratory,Meq/L)
Alkalinity(meq/L,as carbonate)
Calcium ion (meq/L)
Magnesium ion (meq/L)
Sodium ion (meq/L)
Ammonium ion(meq/L, asnitrogen)
Potassium ion (meq/L)
Sulfate ion(meq/L, assulfate)
Nitrate ion(meq/L, asnitrate)
Chloride ion (meq/L)
Mean
3,11120.0
36.6
35.8
4.44
61.7
4.54
53.92
-0.001
0.048
0.010
0.015
0.023
0.007
0.100
0.046
0.013
Standard deviation
2,62617.7
27.5
22.8
0.62
50.0
0.64
69.50
0.029
0.075
0.021
0.023
0.016
0.008
0.082
0.037
0.026
Mini mum
340.5
3.5
3.2
3.46
0.047
2.97
0.066
-0.160
0.002
0.0002
0.006
0.001
0.008
0.001
0.001
Maxi mum
13,253108
240.0
149.8
7.33
347
7.18
1,072
0.110
0.590
0.280
0.240
0.040
0.030
0.460
0.250
0.290
Missing
1473
36
13
40
40
15
15
17
18
18
18
340
337
10
10
10
Less than detec tion
00
0
0
0
0
0
0
0
0
0
3
0
0
6
11
31
Measured
337278
315
338
311
311
336
336
334
333
333
330
11
14
335
330
310

Table 6. --Summary statistics for limestone samples
[mL, milliliters; mm, millimeters; |jS/cm, microsiemens per centimeter at 25 degrees Celsius; |Jeq/L, microequivalents per liter; meq/L, milliequivalents per liter; --, indicates that results were less than detection limits for the selected analytical procedures; missing, data unavailable; less than detection, number of samples having results that were less than detection limits for the selected analytical procedures; measured, number of samples having results that were greater than detection limits]
Number of samplesRange
Parameter
Volume (mL)Precipitation (mm)Specific
conductance(onsite, |jS/cm)
Specificconductance (laboratory,pS/cm)
pH (onsite, standard units)
Hydrogen ion (onsite, peq/L)
pH (laboratory, standard units)
Hydrogen ion(laboratory,
I 1 £ltf"l / T 1LI d_| / J-J J
Alkalinity(meq/L,as carbonate)
Calcium ion (meq/L)
Magnesium ion (meq/L)
Sodium ion (meq/L)
Ammonium ion(meq/L, asnitrogen)
Potassium ion (meq/L)
Sulfate ion(meq/L, assulfate)
Nitrate ion(meq/L, asnitrate)
Chloride ion (meq/L)
Mean
1,99019.5
72.6
80.9
7.45
0.094
7.06
0.140
0.520
0.713
0.035
0.029
0.005
0.010
0.201
0.065
0.025
Standard deviation
2,22618.5
36.3
48.9
0.51
0.318
0.42
0.190
0.256
0.407
0.050
0.045
0.004
0.021
0.214
0.073
0.047
Mini mum
00.3
10.0
12.5
5.37
0.001
5.61
0.008
0.096
--
0.001
--
0.001
0.001
0.006
0.005
0.002
Maxi mum
12,745127
243.0
506.0
9.15
4.27
8.12
2.450
2.600
4.170
0.420
0.510
0.010
0.190
3.060
0.630
0.560
Missing
21111
124
75
128
128
76
76
90
85
88
88
530
458
92
92
148
Less than detec tion
00
0
0
0
0
0
0
0
1
0
4
0
0
4
42
14
Measured
520430
417
466
413
413
465
465
451
455
453
449
11
83
445
407
379

Table 7.--Summary statistics for marble samples
[mL, milliliters; mm, millimeters; |jS/cm, microsieraens per centimeter at 25 degrees Celsius; |Jeq/L, microequivalents per liter; meq/L, milliequivalents per liter; --, indicates that results were less than detection limits for the selected analytical procedures; missing, data unavailable; less than detection, number of samples having results that were less than detection limits for the selected analytical procedures; measured, number of samples having results that were greater than detection limits]
Number of samplesRange
Parameter
Volume (mL)Precipitation (mm)Specific
conductance(onsite, pS/cm)
Specificconductance (laboratory,pS/cm)
pH (onsite, standard units)
Hydrogen ion (onsite, peq/L)
pH (laboratory, standard units)
Hydrogen ion(laboratory,Meq/L)
Alkalinity(meq/L,as carbonate)
Calcium ion (meq/L)
Magnesium ion (meq/L)
Sodium ion (meq/L)
Ammonium ion(meq/L, asnitrogen)
Potassium ion (meq/L)
Sulfate ion(meq/L, assulfate)
Nitrate ion(meq/L, asnitrate)
Chloride ion (meq/L)
Mean
2,54118.8
62.3
65.0
7.31
0.098
7.02
0.151
0.412
0.574
0.023
0.016
0.007
0.016
0.163
0.055
0.016
Standard deviation
2,30518.3
38.2
35.4
0.42
0.250
0.37
0.307
0.174
0.304
0.023
0.031
0.005
0.095
0.158
0.046
0.022
Mini mum
00.25
14.0
17.2
5.49
0.001
5.32
0.010
0.012
0.154
0.002
0.0004
0.001
0.014
0.002
Maxi mum
12,756127
425.0
341.0
8.97
3.24
8.00
4.820
1.480
3.150
0.310
0.440
0.020
0.920
1.710
0.560
0.220
Missing
19112
104
45
106
106
47
47
61
52
54
58
565
480
50
50
126
Less than detec tion
00
0
0
0
0
0
0
0
1
0
16
0
2
1
12
21
Measured
558465
473
532
471
471
530
530
516
524
523
503
12
95
526
515
430
10

Table 8.--Summary statistics for distilled-water reference samples
[pS/cm, microsiemens per centimeter at 25 degrees Celsius; peq/L, microequivalents per liter; meq/L, milliequivalents per liter; --, indicates that results were less than detection limits for the selected analytical procedure; -, indicates that analytical results are not available; missing, data unavailable; less than detection, number of samples having results that were less than detection limits for the selected analytical procedures; measured, number of samples having results that were greater than detection limits]
Number of samplesRange
Parameter
Specificconductance(onsite, pS/cm)
Specificconductance (laboratory,pS/cm)
pH (onsite, standard units)
Hydrogen ion (onsite, peq/L)
pH (laboratory, standard units)
Hydrogen ion(laboratory,peq/L)
Alkalinity(meq/L,as carbonate)
Calcium ion (meq/L)
Magnesium ion (meq/L)
Sodium ion (meq/L)
Ammonium ion(meq/L, asnitrogen)
Potassium ion (meq/L)
Sulfate ion(meq/L, assulfate)
Nitrate ion(meq/L, asnitrate)
Chloride ion (meq/L)
Mean Standard Mini- deviation mum
2.8
2.3
6.10
1.58
6.71
2.144
0.042
0.005
0.001
0.011
-
0.003
0.007
0.005
0.005
4.3 0.9
1.3 0.9
0.70 5.50
1.17 0.028
1.41 4.55
5.622 0.004
0.033 -0.003
0.006
0.002
0.010 0.002
-
0.005
0.004 0.001
0.004 0.002
0.002 0.003
Maxi mum
17.0
5.0
7.56
3.16
8.40
28.25
0.110
0.020
0.005
0.034
-
0.010
0.011
0.008
0.010
Missing
22
8
21
21
10
10
12
12
9
9
35
25
6
6
15
Less than detec tion
0
0
0
0
0
0
0
10
15
13
0
3
23
27
11
Measured
13
27
14
14
25
25
23
13
11
13
0
7
6
2
9
11

Table 9. Summary statistics for M-82 standard reference water samples
[|jS/cm, microsiemens per centimeter at 25 degrees Celsius; |Jeq/L, microequivalents per liter; meq/L, milliequivalents per liter; --, indicates that results were less than detection limits for the selected analytical procedure; -, indicates that analytical results are not available; missing, data unavailable; less than detection, number of samples having results that were less than detection limits for the selected analytical procedures; measured, number of samples having results that were greater than detection limits]
Number of samplesRange
Parameter
Specificconductance(onsite, jjS/cm)
Specificconductance (laboratory,pS/cm)
pH (onsite, standard units)
Hydrogen ion (onsite, |Jeq/L)
pH (laboratory, standard units)
Hydrogen ion(laboratory,Meq/L)
Alkalinity(meq/L,as carbonate)
Calcium ion (meq/L)
Magnesium ion (meq/L)
Sodium ion (meq/L)
Ammonium ion(meq/L, asnitrogen)
Potassium ion (meq/L)
Sulfate ion(meq/L, assulfate)
Nitrate ion(meq/L, asnitrate)
Chloride ion (meq/L)
Mean Standard deviation
130.7
139.6
7.54
0.031
7.34
0.090
0.615
0.725
0.287
0.276
-
0.052
0.582
0.016
0.071
5.3
4.9
0.16
0.013
0.50
0.136
0.171
0.020
0.010
0.017
-
0.003
0.027
0.033
0.014
Mini mum
122.1
133.5
7.21
0.019
6.28
0.010
0.596
0.698
0.270
0.230
-
0.049
0.549
--
0.025
Maxi- Missing mum
140.0
148.0
7.72
0.062
8.00
0.525
0.740
0.764
0.313
0.301
-
0.056
0.668
0.075
0.084
16
8
15
15
11
11
9
9
6
6
25
19
6
7
11
Less than detec tion
0
0
0
0
0
0
0
0
0
0
0
0
0
11
0
Measured
9
17
10
10
14
14
16
16
19
19
0
6
19
18
14
12

Table 10. --Analytical results for standard reference watersample M-82 (obtained from the U.S. Geological
Survey, Quality Assurance Laboratory,Denver, Colorado)
[pS/cm, microsiemens per centimeter at 25 degrees Celsius; meq/L, milliequivalents per liter]
Parameter MeanStandard Total number deviation of analyses
Specific conductance (pS/cm) 138.3 8.6 43pH (standard units) 6.9 0.39 42Alkalinity (meq/L as carbonate) 0.6614 0.0420 37Calcium ion (meq/L) 0.6891 0.0349 43
Magnesium ion (meq/L) 0.2954 0.0189 44Sodium ion (meq/L) 0.2749 0.0135 41Sulfate ion (meq/L) 0.5836 0.0373 39Chloride ion (meq/L) 0.0739 0.0133 42
13

Table 11. Summary statistics for M-4 standard reference water samples
[pS/cm, microsiemens per centimeter at 25 degrees Celsius; peq/L, microequivalents per liter; meq/L, milliequivalents per liter; missing, data unavailable; less than detection, number of samples having results that were less than detection limits for the selected analytical procedures; measured, number of samples having results that were greater than detection limits]
Number of samplesRange
Parameter
Specificconductance(onsite, (JS/cm)
Specificconductance (laboratory,pS/cm)
pH (onsite, standard units)
Hydrogen ion (onsite, |Jeq/L)
pH (laboratory, standard units)
Hydrogen ion(laboratory,peq/L)
Alkalinity(meq/L,as carbonate)
Calcium ion (meq/L)
Magnesium ion (meq/L)
Sodium ion (meq/L)
Sulfate ion(meq/L, assulfate)
Nitrate ion(meq/L, asnitrate)
Chloride ion (meq/L)
Mean Standard deviation
101.9
109.6
7.64
0.023
7.32
0.055
0.535
0.513
0.222
0.186
0.423
0.012
0.082
6.8
9.8
0.05
0.002
0.23
0.040
0.014
0.060
0.019
0.032
0.037
0.001
0.009
Mini mum
97.6
42.7
7.60
0.020
6.54
0.012
0.501
0.322
0.162
0.102
0.366
0.010
0.073
Maxi mum
112.0
115.5
7.70
0.025
7.91
0.288
0.566
0.624
0.261
0.221
0.475
0.015
0.113
Missing
70
23
70
70
26
26
11
9
9
9
10
10
10
Less than detec tion
0
0
0
0
0
0
0
0
0
0
0
3
2
Measured
4
51
4
4
48
48
63
65
65
65
64
61
62
14

Table 12. Analytical results for standard reference watersample M-4 (obtained from the U.S. Geological Survey,
Quality Assurance Laboratory, Denver, Colorado)
[pS/cm, microsiemens per centimeter at 25 degrees Celsius; meq/L, milliequivalents per liter]
Standard Total number Parameter Mean deviation of analyses
Specific conductance (pS/cm)pH (standard units)Alkalinity (meq/L as carbonate)Calcium ion (meq/L)Magnesium ion (meq/L)Sodium ion (meq/L)Sulfate ion (meq/L)Nitrate ion (meq/L)Chloride ion (meq/L)
111.07.580.5400.5690.2470.2000.4120.0140.079
5.00.220.0220.0400.0210.0130.0520.0030.014
555648575654535051
15

Table 13. Summary statistics for samples collected using the recording precipitation monitor
[mL, milliliters; mm, millimeters; pS/cm, microsiemens per centimeter at 25 degrees Celcius; |Jeq/L, microequivalents per liter; milliequivalents per liter; --, indicates that results were less than detection limits for the selected analytical procedure; -, indicates that analytical results are not available; missing, data unavailable; less than detection, results that were less than detection limits for the selected analytical procedures; measured, number of samples having results that were greater than detection limits]
Number of samplesRange
Parameter
Volume (mL)Precipitation (mm)Specific
conductance(onsite, jjS/cm)
Specificconductance (laboratory,|jS/cm)
pH (onsite, standard units)
Hydrogen ion onsite, |jeq/L)
pH (laboratory, standard units)
Hydrogen ion(laboratorypeq/L)
Alkalinity(meq/L,as carbonate)
Calcium ion (meq/L)
Magnesium ion (meq/L)
Sodium ion (meq/L)
Ammonium ion(meq/L, asnitrogen)
Potassium ion (meq/L)
Sulfate ion(meq/L, assulfate)
Nitrate ion(meq/L, asnitrate)
Chloride ion (meq/L)
Mean
98219.9
530.8
385.6
4.54
57.0
5.07
33.35
0.024
0.041
0.005
0.047
-
1.578
0.051
0.064
0.241
Standard deviation
91318.6
888.5
805.4
0.73
59.0
0.96
45.48
0.075
0.169
0.009
0.110
-
3.410
0.034
0.129
0.098
Mini mum
00.5
10.7
1.7
3.31
0.135
3.47
0.063
-0.157
0.001
0.001
-
0.010
0.004
0.001
0.025
Maxi mum
4,000127
6,000
6,960
6.87
490
7.20
340.4
0.454
1.497
0.074
0.795
-
18.42
0.173
0.657
0.480
Missing
222
40
40
41
41
41
41
42
47
47
47
153
117
80
81
120
Less than detec tion
00
0
0
0
0
0
0
0
0
3
11
0
0
2
6
2
Measured
151131
113
113
112
112
112
112
111
106
103
95
0
36
71
66
31
16
Table 14.--Detection limits for laboratory analyses (1984-86)
[meq/L, milliequivalents per liter]
Parameter
Calcium ionMagnesium ionSodium ionAmmonium ionPotassium ionSulfate ionNitrate ionChloride ion
Units
(meq/L as Calcium)(meq/L as Magnesium)(meq/L as Sodium)(meq/L as Nitrogen)(meq/L as Potassium)(meq/L as Sulfate)(meq/L as Nitrate)(meq/L as Chloride)
Detection limit
0.00040.00020.00340.000030.00010.0020.00260.0007
Method of analysis
Inductively coupled plasmaInductively coupled plasmaInductively coupled plasmaAutomated colorimetric analysisAtomic absorptionIon chromatographyIon chromatographyIon chromatography
Table 15.--Detection limits for laboratory analyses (1987)
[meq/L, milliequivalents per liter]
Parameter
Calcium ion Magnesium ion Sodium ion Sulfate ion Nitrate ion Chloride ion
Units
(meq/L as Calcium) (meq/L as Magnesium) (meq/L as Sodium) (meq/L as Sulfate) (meq/L as Nitrate) (meq/L as Chloride)
Detection limit
0.0001 0.00004 0.00023 0.020 0.010 0.002
Method of analysis
Inductively coupled plasma Inductively coupled plasma Inductively coupled plasma Ion chromatography Ion chromatography Ion chromatography
17
Table 16.--Sample
data set
of DATAT.A
[See tables
1 through
3 for
definition of
abbreviations; -,
indicates results
not available]
SITE
DCDCLBNC
NCNC
NJNJOHOH
OHLB
NY
NYNY
NY
TYPE
LMDBLLGMMLMM-4LGPM
YEAR
84878584858586858687878786858587
EVENT
41101621217622311091232
SIDE
47013367610703608
DUP1111121111111111
JD ON
290239-20820720719191288235242-171280295279
JD OFF
299240-212210210196102301242256-174284301282
VOLUME
8302,035
-3,943
575-
3,700290
2,4901,9404,620
-862650440720
OVER FLOW
NN-NNNNNNNN-NNNN
RAIN IN
---2.1500.400
-0.700
-0.6401.1601.290
-0.3600.0700.3500.420
RAIN MM
---54.61010.160
-17.780
-16.25629.46432.766
-9.1441.7788.89010.668
PRECIP TYPE
_RN----RN-RNRNRN-RN--SR
PH FLD
7.5206.640-
4.4906.230---7.200
8.6407.500-7.840
3.6504.5707.640
CON FLD
88.0047.90-18.50
71.00---
136.5050.20104.70
-40.0066.0075.0036.70
FILT VOL-250------250250250-250--250
UNFILT VOL_250----999-250250250-250--250
DEG REE3030-3030303030303030-30303030

Table 17. Sample data set of DATAT.B
[See tables 1 through 3 for definition of abbreviations; -, indicates results not available; --, indicates results were less than detection limits for selected analytical procedures]
SITE
DCDCLBNCNCNCNJNJOHOHOHLBNYNYNYNY
TYPE
LMDBLLGMMLM
M-4LGPM
YEAR
84878584858586858687878786858587
EVENT
4110
162121762231
109
1232
SIDE
470133676
10703608
DUP
1111121111111111
PH LAB
7.4226.9008.0004.5836.829
-3.7306.7306.8207.0606.980
-6.930
-5.9006.800
CON LAB
92.5050.904.0015.7576.50
-88.50
217.00140.0042.1076.60
-42.5059.60
-44.60
ALK MEQ
0.720000.152100.0.0.59200
-0.1.180000.386000.221600.297100.555000.338000.0.0.37240
CL MEQ
.0.016080.00400
-0.02652
-0.016330.065020.029300.002840.011090.08487
0.01117-
0.00472
N03 MEQ
0.0440000.069010
--0.0471000.057440
-0.1003800.1740900.093700
--0.0527200.0151700.0119200.0811100.0400000.017740
S04 MEQ
0.2290000.2379900.0010000.0478900.173890
-0.1898900.7333800.7212000.1949000.3780700.4298000.0463900.1240300.0160000.044120
Table 18.--Sample data set of DATAT.C
[See tables 1 through 3 for definition of abbreviations; -, indicates results not available; --, indicates results were less than detection limits for selected analytical procedures]
SITE
DCDCLBNCNCNCNJNJOHOHOHLBNYNYNYNY
TYPE
LMDBLLGMMLMM-4LGPM
YEAR
84878584858586858687878786858587
EVENT
4110
162121762231
109
1232
SIDE
470133676
10703608
DUP
1111121111111111
00
0000210000000
CA MEQ
.89800000
.72854000-
.00416000
.69610000
.69960000
.02552000
.06885000
.20658200
.37862000
.66170000
.55788000
.37290000
.02197000
.01185000
.44225000
0.0.0.0.0.0.0.0.0.0.0.0.0.0.0.0.
MG MEQ
0280000020510000200000006000036140003622000058800049510006538800059100036220023683000055400004880000296000146200
NA MEQ
0.019000000.00818000
-
0.041470000.027340000.026240000.039770000.010018050.015960000.021310000.203410000.002710000.016790000.049890000.00314000
NH4 MEQ K MEQ
0.0060000-
0.00100000.0033300
---------
0.04100 0.0054230--
19*U.S. GOVERNMENT PRINTING OFFICE: 1989-0-673-196/00030