Embed Size (px)
Citation preview

EVALUATION OF ISOLATION DETAILS TO ENABLE ROCKING IN
A MASONRY VENEER PANEL
By
LOUIS MARIE GOUHIER DE FONTENAY
A thesis submitted in partial fulfillment of
the requirements for the degree of
MASTER OF SCIENCE IN CIVIL ENGINEERING
WASHINGTON STATE UNIVERSITY
Department of Civil and Environmental Engineering
DECEMBER 2012

ii
To the Faculty of Washington State University:
The members of the Committee appointed to examine the thesis of LOUIS MARIE
GOUHIER DE FONTENAY find it satisfactory and recommend that it be accepted.
__________________________________
David I. McLean, Ph.D. P.E., Chair
__________________________________
James D. Dolan, Ph.D., P.E.
__________________________________
William F. Cofer, Ph.D., P.E.

iii
ACKNOWLEDGEMENTS
I would like to acknowledge the National Institute of Science and Technology for their
financial support of this project. I also would like to recognize KPFF Consulting Engineers, and
particularly Steve Dill of KPFF, for providing the impetus and structural details for the rocking
panel.
I would like to express my deepest gratitude to Dr. David McLean for serving as my
committee chair and for giving me the chance to work on this project. His patience, guidance,
support and knowledge greatly helped me get through my master’s program. I would also like to
thank Dr. Dan Dolan and Dr. Bill Cofer for serving as members of my graduate committee. Their
availability, kindness and advice are really appreciated.
I sincerely thank the people at the Composite Materials and Engineering Center, especially
Bob Duncan, Scott Lewis, Kyle Spangenberg, Danny Mjelde and Tim Spry for their assistance in
constructing and testing my specimens. In addition, I want to acknowledge Vicki Ruddick for her
help with the administrative details associated with my graduate program. I also extend my
thanks to Derek Ohlgren and Carl Harris for their help.
Finally, I would like to thank my family and friends for their support and love during this
18 month program, so far away from home.

iv
EVALUATION OF SPECIAL DETAILS TO ENABLE ROCHING IN
A MASONRY VENEER PANEL
ABSTRACT
By Louis Marie Gouhier de Fontenay, M.S.
Washington State University
December 2012
Committee Chair: David I. McLean
The objective of this project was to evaluate the effectiveness of special isolation details
designed to enable rocking response in masonry veneer panels subjected to lateral displacements.
Rocking is expected to reduce or eliminate damage to the masonry panel in a seismic event.
Criteria considered in evaluating the performance of the panels and isolation details included
strength, energy dissipation, residual displacement, extent of damage and rocking behavior.
Two panel specimens were constructed and tested under quasi-static cyclic lateral loading
and constant axial (vertical) loading. One panel had 20 kips of axial load, and the other had 50
kips, which was later reduced to 40 kips due to testing capacities. Special details were
incorporated at the base of the panels to enable rocking. Two steel dowels were placed across the
interface between the panel and footing. The dowels included a bond breaker such that only shear
could be resisted by the dowels. In addition, the interface included a neoprene pad in the center
region of the panel and two strips of compressible foam at the ends. The neoprene pad served to
transmit axial loads and shear between the panel and the footing, and the foam strips protected
the ends of the panels once rocking occurred.
Both panels exhibited rocking behavior. Very little damage occurred to the first panel with
the lower axial loading. The second panel with the higher axial loading underwent a more

v
complex response mechanism and experienced substantial damage. The larger axial loads for
Panel 2 also resulted in increased lateral capacity and stiffness. Yielding of the dowels
contributed significantly to energy dissipation in the specimens. Friction and sliding of the panel
on the neoprene pad was also a major contributor to energy dissipation.
For the panel with lower axial loading, only minor damage developed in the panel even
when loaded to 3 in. of lateral displacement, corresponding to a lateral drift of more than 5%.
Even in the panel with higher axial loading, significant damage did not develop until the lateral
displacements exceeded 1.0 in of lateral displacement, corresponding to a lateral drift of nearly
2%. The special isolation details proposed for the veneer panels were successful in developing
the intended rocking response.

vi
TABLE OF CONTENT
Page
ACKNOWLEDGEMENTS ........................................................................................................... iii
ABSTRACT .................................................................................................................................... iv
LIST OF TABLES ........................................................................................................................... x
LIST OF FIGURES ......................................................................................................................... xi
CHAPTER 1: INTRODUCTION .................................................................................................... 1
1.1 Background ............................................................................................................................ 1
1.2 Scope and Objectives ............................................................................................................. 3
CHAPTER 2: LITERATURE REVIEW ......................................................................................... 5
2.1 Introduction ........................................................................................................................... 5
2.2 Rocking Mechanism .............................................................................................................. 5
2.3 Self-centering Issue ............................................................................................................... 6
2.4 Code Provisions ................................................................................................................... 10
2.4.1 US Codes................................................................................................................... 10
2.4.2 European Code .......................................................................................................... 11
2.4.3 New Zealand Code .................................................................................................... 11
2.5 Historical Review of the Interest in Rocking Systems ........................................................ 12
2.6 Previous Research................................................................................................................ 14
2.6.1 Rocking Behavior of Rigid Objects (Prieto and Lourenço, 2005) ............................ 14

vii
2.6.2 Seismic Performance of Precast Reinforced and Prestressed Concrete Walls
(Holden, Restrepo and Mander, 2002) .................................................................................. 14
2.6.3 Shake-Table Tests of Confined-Masonry Rocking Walls with Supplementary
Hysteretic Damping (Toranzo, et al., 2009) ......................................................................... 18
2.6.4 In-plane Experimental Behavior of Stone Masonry Walls under Cyclic Loading
(Vasconcelos and Lourenço, 2009) ...................................................................................... 20
2.6.5 Effects of Interface Material on the Performance of Free Rocking Blocks
(ElGawady et al., 2011) ........................................................................................................ 22
CHAPTER 3: EXPERIMENTAL PROGRAM ............................................................................. 25
3.1 Introduction ......................................................................................................................... 25
3.2 Footing description .............................................................................................................. 25
3.3 Panel specimen Description................................................................................................. 25
3.4 Load Beam Description ....................................................................................................... 30
3.5 Material Properties .............................................................................................................. 31
3.6 Test Setup ............................................................................................................................ 35
3.7 Instrumentation .................................................................................................................... 37
3.8 System Control and Data Acquisition ................................................................................. 38
3.9 Test Procedures.................................................................................................................... 39
CHAPTER 4: RESULTS OF PANEL TESTS .............................................................................. 41
4.1 Introduction ......................................................................................................................... 41
4.2 Panel 1 ................................................................................................................................. 41

viii
4.2.1 Test Observations ...................................................................................................... 41
4.2.2 Damage ..................................................................................................................... 44
4.2.3 Vertical Displacements Along the Length of the Panel ............................................ 45
4.2.4 Load-Displacement Curves ....................................................................................... 47
4.3 Panel 2 ................................................................................................................................. 53
4.3.1 Test Observations ...................................................................................................... 53
4.3.2 Damage ..................................................................................................................... 54
4.3.3 Vertical Displacements Along the Length of the Panel ............................................ 57
4.3.4 Load-Displacement Curves ....................................................................................... 59
4.4 Influence of the Axial Reduction from 50 kips to 40 kips for Panel 2 ................................ 66
4.5 Influence of the Axial Load Change from 20 kips to 50/40 kips ........................................ 67
4.6 Summary and Conclusions from the Panel Tests ................................................................ 69
CHAPTER 5: ANALYSES, DISCUSSION AND COMPARISONS OF PANEL
PERFORMANCE .......................................................................................................................... 71
5.1 Introduction ......................................................................................................................... 71
5.2 Rocking Load ...................................................................................................................... 71
5.3 Dowel Yielding.................................................................................................................... 76
5.4 Behavior of the Neoprene Pad and Foam Strips.................................................................. 77
5.5 Energy Dissipation .............................................................................................................. 79
5.6 Summary of Panel Behavior ................................................................................................ 84
5.7 Summary and Conclusions .................................................................................................. 86

ix
CHAPTER 6: SUMMARY, CONCLUSIONS AND RECOMMENDATIONS ........................... 88
6.1 Summary and Conclusions .................................................................................................. 88
6.2 Recommendations and Future Research.............................................................................. 90
BIBLIOGRAPHY .......................................................................................................................... 92

x
LIST OF TABLES
Page
Table 2.1: Comparison between Ductile and Hybrid Walls (adapted from Holden et al., 2002) .. 16
Table 3.1: Material Properties ........................................................................................................ 30
Table 3.2: Average Compressive Strength of Masonry Materials ................................................. 33
Table 4.1: Visual Observations for Panel 1 .................................................................................... 43
Table 4.2: Visual Observations for Panel 2 .................................................................................... 55
Table 5.1: Required Lateral Load for used Axial Loads ................................................................ 73

xi
LIST OF FIGURES
Page
Figure 1.1: Failure Modes (from Lee, Li, Oh, Yang and Yi, 2008) ................................................. 2
Figure 2.1: Lateral Static Loading of a Rocking Wall (from Toranzo, 2002) ................................. 6
Figure 2.2: Idealized Seismic Response of Yielding Structure (from Christopoulos et al. 2002) ... 8
Figure 2.3: Idealized Seismic Response of Rocking Structure (from Christopoulos et al. 2002).... 9
Figure 2.4: Load-Displacement Curves of Ductile and Hybrid Walls (from Holden et al., 2002) 17
Figure 2.5: Geometry of the Wall (from Toranzo et al., 2009) ...................................................... 19
Figure 2.6: General Dimensions of the Test Structure (from Toranzo et al., 2009) ...................... 20
Figure 2.7: Rocking Hysteresis Curves for 2 Different Arrangements (from Vasconcelos and
Lourenço, 2009) ............................................................................................................................. 21
Figure 2.8: Plane View of the Specimen and Schematic of Rocking Mechanism (from ElGawady
et al, 2011) ...................................................................................................................................... 23
Figure 3.1: Building Drawing with Rocking Panel between Floors (from KPFF- Consulting
Engineers) ....................................................................................................................................... 26
Figure 3.2: Panel Rocking Details (from KPFF- Consulting Engineers) ....................................... 27
Figure 3.3: Panel Details ................................................................................................................ 29
Figure 3.4: Loading Beam Details ................................................................................................. 31
Figure 3.5: Clay Brick Dimensions (from Mutual Materials Catalog) .......................................... 32
Figure 3.6: Construction Phase 2: Panel Construction ................................................................... 34
Figure 3.7: Construction Phase 2: Grouting ................................................................................... 34
Figure 3.8: 3D View of Test Setup ................................................................................................ 36
Figure 3.9: Test Setup .................................................................................................................... 37

xii
Figure 3.10: String Potentiometer and Gauge Locations ............................................................... 38
Figure 3.11: System Control Flow Chart (adapted from Sherman, 2011) ..................................... 39
Figure 3.12: Loading Cycles .......................................................................................................... 40
Figure 4.1: Side View of Panel During Testing Showing Rocking Behavior ................................ 42
Figure 4.2: Rocking Behavior and Uplift of One End ................................................................... 42
Figure 4.3: Uplift of the North and South Ends of the Panel ......................................................... 43
Figure 4.4: Damage to Panel 1 ....................................................................................................... 44
Figure 4.5: Photos showing Panel and Dowels at the End of the Test ........................................... 45
Figure 4.6: Measured Vertical Displacements for Pushing ............................................................ 46
Figure 4.7: Measured Vertical Displacements for Pulling ............................................................. 46
Figure 4.8: Hysteresis Curve for Panel 1 ....................................................................................... 47
Figure 4.9: Uplifting and Crushing of P2 (top) and P3 (bottom) ................................................... 49
Figure 4.10: Sliding of Panel 1 ....................................................................................................... 51
Figure 4.11: Load-Displacement Curve without Sliding ............................................................... 52
Figure 4.12: Rocking of Panel 2 ..................................................................................................... 53
Figure 4.13: Uplift at North Toe .................................................................................................... 54
Figure 4.14: Spalling on East (left) and West (right) ..................................................................... 55
Figure 4.15: Toe Crushing at South Toe ........................................................................................ 56
Figure 4.16: End-of-Test Photos .................................................................................................... 57
Figure 4.17: Measured Vertical Displacements for Pushing .......................................................... 58
Figure 4.18: Measured Vertical Displacements for Pulling ........................................................... 58
Figure 4.19: Load-Displacement Curve for Panel 2 ...................................................................... 60
Figure 4.20: Load-Vertical Displacement Curves for P2 and P3 ................................................... 62

xiii
Figure 4.21: Sliding of Panel 2 ....................................................................................................... 63
Figure 4.22: Comparison between the Load-Displacement Curves ............................................... 65
Figure 4.23: Influence of Axial Load Reduction ........................................................................... 67
Figure 4.24: Load-Displacement Curves for Both Panels Depicting the Change of Stiffness ...... 68
Figure 5.1: Static Calculation (dimensions in inches) .................................................................... 72
Figure 5.2: P2 and P3 Records for Panel 2. ................................................................................... 74
Figure 5.3: Load-Displacement Curves with 50 kip Axial (top) and 40 kips (bottom) ................. 75
Figure 5.4: Lateral Expansion of Neoprene ................................................................................... 78
Figure 5.5: Neoprene Deformation in Panel 1 ............................................................................... 78
Figure 5.6: Neoprene Friction Reaction in Panel 2 ........................................................................ 79
Figure 5.7: Illustration of Total Energy Equation (adapted from Snook, 2005) ............................ 80
Figure 5.8: Cumulative Energy Dissipation for both Panels .......................................................... 82
Figure 5.9: Normalized Cumulative Energy Dissipation for both Panels ...................................... 83
Figure 5.10: Idealized Friction Hysteresis for One Cycle .............................................................. 84

1
CHAPTER 1: INTRODUCTION
1.1 Background
In many countries, a significant portion of residential and commercial buildings are
constructed with masonry, including both structural masonry and masonry veneers. The use of
masonry often reduces costs and construction time. Unreinforced masonry structures have
traditionally performed poorly in seismic events due to limited ductility once their strengths are
exceeded. In addition, unreinforced masonry may experience brittle shear failures. Because of
this limited ductility, unreinforced masonry is no longer used in areas with significant seismic
activity. Typical failure modes of masonry shear walls are depicted in Figure 1.1. It was with
these modes in mind that researchers and engineers developed steel reinforced shear walls to
make them capable of satisfactorily resisting an earthquake.
All modern structures, whether constructed of masonry, timber or reinforced concrete, are
typically designed to behave in a ductile manner in order to dissipate energy and provide advance
notice of distress. Designing to produce ductile response is the widely accepted philosophy for
modern seismic design. Structures in seismic zones must incorporate special detailing to achieve
the required ductility and thereby prevent collapse during an event and ensure the safety of its
occupants. Ductility is achieved and energy is dissipated through inelastic deformations of the
reinforcement in critical regions of the structures, referred to as plastic hinge zones. These
inelastic deformations lead to permanent damage which will typically require repair after a large
seismic event. However, such damage is acceptable in a major event, even if it means that the
structure will need to be partially or even entirely rebuilt, but it must not collapse.

2
Figure 1.1: Failure Modes (from Lee, Li, Oh, Yang and Yi, 2008)
Performance-based design is a new design philosophy that is increasingly being used by
structural engineers that seek to limit the extent of damage under one or more loading scenarios.
Elastic design can be used so that structures always stay in the elastic range. However, elastic
design is an uneconomical as well as an unnecessary design approach except for highly critical
buildings such as nuclear power plants where damage may result in a significant hazard. The
effects of the March 2011 magnitude 9.0 earthquake and subsequent tsunami on the Fukushima
nuclear power plant represent an example of this hazard. To be economical, most buildings are
designed for seismic loads using a Response Modification Factor, referred to as the R-factor,
3
which allows for a reduction in the elastic capacity by accounting for energy dissipation through
plastic deformations.
An alternative solution to produce seismically resistant structures is seismic isolation. With
this design approach, the energy of an event is dissipated through mechanical devices. Base
isolation is one of the more common ways of protecting structures. By decoupling the building
from the ground, base isolation can be utilized to protect it from the horizontal movements
caused by an earthquake. For example, by mounting rubber bearings between the building and its
foundation, little or no ground movements are transmitted into the structure itself. The system not
only provides protection to the building but also to its contents and occupants. Nevertheless, it
does not make the building seismic-proof as often times the building will still be damaged during
critical events. This type of isolation system also typically adds to the cost of a building.
Another structural isolation method utilizes a rocking response of the building. Rocking
systems were among the first isolation systems and allow for a building to rock on its base to
enable the building to survive major earthquakes with little or no damage, provided that the
building does not lose its stability and overturn during the shaking. Surprisingly, with such
promising potential, these systems have not been widely utilized in practice. With increasing
demand for improved seismic performance, the interest in rocking systems has increased in the
last two decades. However, research in and applications of rocking systems still lag behind other
alternatives for isolation systems.
1.2 Scope and Objectives
This project was initiated through discussions with KPFF Consulting Engineers based on
isolation details designed to enable rocking in masonry veneer panels in high-rise structures.
4
Steve Dill of KPFF served as the primary contact for information on the proposed system. The
research was conducted at Washington State University. The objective of the project is to
investigate the effectiveness of the isolation details to enable rocking response in a masonry
veneer panel subjected to lateral displacements. Rocking is expected to reduce or eliminate
damage to the masonry panel in a seismic event. Two panel specimens with the same rocking
details and geometry were subjected to cyclic, quasi-static lateral loading under different axial
loadings. Criteria considered in evaluating the performance of the panels and isolation details
included strength, energy dissipation, residual displacement, extent of damage and rocking
behavior.

5
CHAPTER 2: LITERATURE REVIEW
2.1 Introduction
There are a limited number of modern structures that have been designed to enable rocking
on their foundations. Provisions addressing rocking mechanisms as a seismic isolation system are
not yet included in current US building codes. Nevertheless, interest in rocking systems has risen
recently as another option for seismic isolation of structures.
This chapter includes a general discussion of the rocking mechanism, summaries of several
experimental and analytical studies that have contributed to a better understanding of rocking in
structures, and a review of rocking provisions in building codes from around the world.
2.2 Rocking Mechanism
A rocking wall is a non-linear elastic system that exhibits a response that can generally be
classified as bilinear. The wall first behaves as a fixed-base wall before the rocking mechanism
starts. The rocking mechanism stops when the neutral axis migrates close to the wall edges,
triggering overturning of the wall. Assurance has to be made in the design that the wall does not
overturn.
One of the biggest issues that must be addressed with rocking systems is that the dissipation
of energy is negligible compared to systems designed to behave ductily (Holden, Restrepo and
Mander, 2002). Rocking of the structure also leads to significantly higher lateral displacements
with little increase in lateral loads (due to rigid body behavior), whereas ductile design is the
opposite (high lateral forces and small displacements). In general, standard masonry buildings are
typically too stiff to activate a rocking mechanism. If rocking does happen, it is considered as a

6
failure mode. Figure 2.1 displays the expected load-displacement curve of a laterally-loaded
rocking wall under a unidirectional push. This figure does not account for a damping system, a
self-centering system, or damage to the edges (toes) of the wall.
Figure 2.1: Lateral Static Loading of a Rocking Wall (from Toranzo, 2002)
2.3 Self-centering Issue
Self-centering is the ability of a structure to come back to its initial position by itself. In the
case of a wall, this would mean that the wall comes back to vertical and that no residual sliding is
present at the base.

7
The self-centering of a wall after the rocking event is an important issue (Christopoulos,
Filiatrault and Folz, 2002). Excessive residual deformations can lead to the destruction of the
structure, even days after a seismic event.
Figure 2.2 shows an idealized force-displacement response of a linear elastic system and
the response of a yielding structure (i.e., using ductile design). As a large fraction of the energy is
dissipated through hysteretic response, significant residual displacements may be present. The
system can dissipate significant energy (area enclosed by the curves), but no self-centering can be
expected because of plastic deformations.
In contrast, self-centering system shows a characteristic flag-shaped hysteresis curve (see
Figure 2.3). The amount of dissipated energy may be significantly reduced, but the system returns
to its original position (no residual drift).

8
Figure 2.2: Idealized Seismic Response of Yielding Structure (from Christopoulos et al. 2002)

9
Figure 2.3: Idealized Seismic Response of Rocking Structure (from Christopoulos et al. 2002)
The concept of self-centering systems was proposed by Stanton et al. (1997) and was
extended by Restrepo (2002) to reinforced concrete cantilever walls by using a hybrid jointed
wall, by Shen (2000) to concrete coupled walls, and by Kuruma (2004) to cantilever walls with
vertical joints. The proposed systems all incorporated post-tensioned axial tendons within the
structures. The results were promising with no residual displacements observed.
Prestressed tendons provide axial load (depending on the prestressing force) and self-
centering properties. The tendons were used in recent research (Filiatrault, Restrepo and
Christopoulos, 2004) as part of a larger study investigating precast concrete moment-resisting
frames and interconnected shear walls under the US PRESSS program (PREcast Seismic

10
Structural System) directed by Priestley until 1999. Results from the PRESSS program proved to
be effective and are now incorporated in a number of building codes for specific types of
structures.
2.4 Code Provisions
Neither the US building codes nor the European building codes include any provisions
accounting for rocking mechanism as the basis of the design. Only the New Zealand building
code specifies some details accounting for rocking in design. Brief discussion is given for each of
these codes in the following sections.
2.4.1 US Codes
As noted earlier, the US building codes do not provide any guidelines to base the design of
structures on a rocking mechanism. FEMA 306 (1998) does provide an equation (Equation 1-4)
for evaluating the amount of strength for sliding or rocking in the design, but it does not
recommend rocking as a desired system. In addition, FEMA 356 (2000) provides a procedure to
account for rocking behavior by calculation of the amplitude of rocking. The procedure involves
the following steps:
- Calculation of the mass, weight, and center of gravity for the rocking system (or
subsystem);
- Calculation of the soil contact area, center of contact, and rocking system dimension, R;
- Determination of whether rocking will initiate;
- Calculation of the effective viscous damping of the rocking system (and the
corresponding design displacement spectrum); and

11
- Calculation (graphically or iteratively) of the period and amplitude of rocking (the
solution will not converge if overturning will occur).
Although rocking provisions have not yet been implemented in US building codes, some
particular innovative types of ductile connections like the jointed ductile connections or hybrid
systems have been tested and are currently being approved by US committees. Guidelines for the
design of such structures should be available for design soon. See ACI T1.2-0.3 (2003) for more
information about such systems. However, according to the US building codes, new design
methods can be used if a special study is performed. See for example the Building Code
Requirements and Specification for Masonry Structures (MSJC, 2011), article 1.3.
2.4.2 European Code
In Europe, Eurocode 8 - Design of Structures for Earthquake Resistance (EN 8, 2008)
accounts for rocking or sliding in certain structural components such as large, lightly-reinforced
walls (Section 1.4). These options are taken into account with the use of a q-factor, referred to as
the behavior factor. The code recognizes the stable nonlinear-elastic behavior that can result from
rocking, but it judges that it is difficult to address this type of behavior in design (Section 5.1.2).
Consequently, no procedures are given except for, like the US code, some specific, deeply
studied solutions such as for jointed ductile connections.
2.4.3 New Zealand Code
In contrast to US and European codes, the New Zealand building code (NZS 4203: 1976)
has incorporated rocking mechanisms in its design provisions for quite a long time.

12
In 1981, New Zealand constructed a state-of-the-practice bridge incorporating rocking: the
South Rangitikei Railway Bridge. Each column footing of this 315-m (1033-ft) long bridge was
equipped with torsional beam mechanical energy dissipating devices. These devices were
designed to allow slight rocking on the foundations.
Where dissipation of energy is through rocking of the foundations, the New Zealand code
requires that the structure shall be subjected to a special study, except that this need not apply if
the structural ductility factor is equal to or less than 2.0. These restrictions led designers to design
many low-rise shear wall buildings governed by rocking mechanisms (Priestley, Evison and Carr
1978).
Subsequently, NZS 1170.5:2004 replaced NZS 4203 and required that a special study be
performed when rocking is implemented as a method of seismic isolation with energy dissipation
during seismic excitation. This special study should entail the development of a computer model
and a time history analysis of the structure. However, most design offices cannot provide this
type of advanced analysis and, consequently, the cost of this analysis is only justified for the
large structures. Following these new requirements, researchers are currently developing
guidelines for designers wishing to use rocking elements (Kelly, 2009).
2.5 Historical Review of the Interest in Rocking Systems
Housner (1963) was the first to find that the rocking mechanism could be a seismic
solution. He observed that, despite some apparent instability, several golf-ball-on-a-tee types of
elevated water tanks survived the ground shaking motion of the 1960 Chilean earthquake. In
contrast, some significantly stiffer structures were completely destroyed. Following this
observation, Housner analyzed the free oscillations of a rocking block (rocking period, energy

13
loss, overturning acceleration, etc.) and showed that the stability of a tall slender block subjected
to earthquake motion is much greater than its stability with constant horizontal force.
Additionally, the rocking behavior mode makes the wall act as a rigid body (Aslam et al, 1980).
It was not until 1978 when Meek (1978) introduced aspects of structural flexibility coupled
with rocking structures that the interest in the rocking mechanism was subjected to more
research. Aslam et al. (1980) analyzed the rocking and overturning response of massive concrete
blocks with a high aspect ratio. They considered, among other things, the influence of
prestressing. Prestressing provided additional lateral resistance, anchored the structure to the
footing and gave an improved rocking resistance. In particular, it prevented excessive rocking.
Priestley and Tao (1993) proposed a new beam-to-column connection. The beams were
designed and constructed so that they could rock at the column interface. They used partially
unbound tendons (following Aslam’s results) and used special spiral confinement in the beam
plastic hinge regions. The idea was to prevent damage in the connections by limiting the energy
absorbed during large lateral displacements. They observed that damage still occurred in high-
force regions such as the rocking toe. The use of tendons was also investigated for beam-column
connections (Garcia-Pujador, 1998), (Cheng, 2008), (Roh and Reinhorn, 2010), walls: (Pennucci
et al., 2009), (Kuruma, et al., 1999) (Hitaka and Sakino, 2008) (L. Toranzo, 2002) (Restrepo and
Rahman, 2007) and frames (Stanton et al., 1997) (Christopoulos et al., 2002).
A new philosophy for rocking was developed by Mander and Cheng (1997) and was
referred to as Damage Avoidance Design (DAD). As the name implies, DAD attempts to prevent
significant structural damage during an event, enabling the continued use and operation of the
building following the event. While some damage might be unavoidable, this philosophy would
attempt to limit both the time and monetary costs of any necessary repairs.

14
2.6 Previous Research
2.6.1 Rocking Behavior of Rigid Objects (Prieto and Lourenço, 2005)
Equations developed by Housner to describe rocking response (Housner, 1963) have been
periodically improved, adjusted and corrected. Lipscombe (1990) proved experimentally that
Housner’s equations were not accurate for blocks with an aspect ratio smaller than 4. An
optimized formulation was proposed by Prieto and Lourenço (2005) to solve two important
drawbacks: the complexity and the intractability for a generalization with a high number of
blocks. Equations are provided in this reference for defining the rocking mechanism of rigid
blocks.
2.6.2 Seismic Performance of Precast Reinforced and Prestressed Concrete Walls
(Holden, Restrepo and Mander, 2002)
Following their previous project, Holden et al. (2002) investigated the performance of two
precast concrete cantilever wall units. Precast walls are becoming more common for their cost
efficiency, and they also allow quicker installation and high quality control. The main
disadvantages of precast walls are that regions resisting lateral forces are likely to undergo heavy
damage in moderate seismic events. Precast panels require special detailing such as the continuity
of vertical reinforcement passing through areas where plastic deformations are expected.
The first specimen was designed according to the New Zealand code (SNZ 1995) as a
reinforced specimen reacting in a ductile manner, whereas the second incorporated a partially
prestressed system and was able to rock on its foundations. Table 2.1 summarizes the differences.

15
Note that the two walls were built with the same geometry and the same concrete material. Figure
2.4 shows the lateral force-displacement response obtained from testing of the two specimens.
The code-compliant specimen was heavily damaged, whereas the second specimen had no
visible damage. Even for a small drift (lateral displacement/height), the damage for the first
specimen was extensive. The first system dissipated more energy but showed significant residual
deformation, whereas the rocking specimen maintained self-centering characteristics. They
concluded that the hybrid specimen had significant positive qualities and required deeper
investigation.
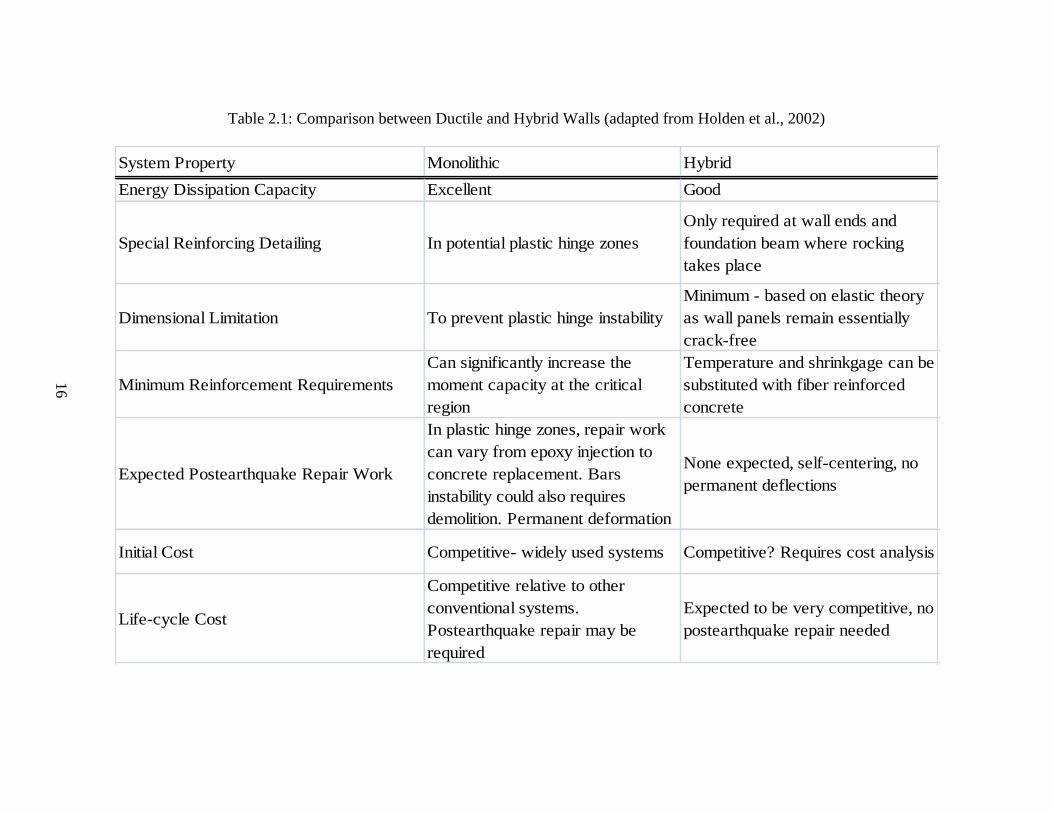
Table 2.1: Comparison between Ductile and Hybrid Walls (adapted from Holden et al., 2002)
System Property Monolithic Hybrid
Energy Dissipation Capacity Excellent Good
Special Reinforcing Detailing In potential plastic hinge zones
Only required at wall ends and
foundation beam where rocking
takes place
Dimensional Limitation To prevent plastic hinge instability
Minimum - based on elastic theory
as wall panels remain essentially
crack-free
Minimum Reinforcement Requirements
Can significantly increase the
moment capacity at the critical
region
Temperature and shrinkgage can be
substituted with fiber reinforced
concrete
Expected Postearthquake Repair Work
In plastic hinge zones, repair work
can vary from epoxy injection to
concrete replacement. Bars
instability could also requires
demolition. Permanent deformation
None expected, self-centering, no
permanent deflections
Initial Cost Competitive- widely used systems Competitive? Requires cost analysis
Life-cycle Cost
Competitive relative to other
conventional systems.
Postearthquake repair may be
required
Expected to be very competitive, no
postearthquake repair needed
16

17
Figure 2.4: Load-Displacement Curves of Ductile and Hybrid Walls (from Holden et al., 2002)

18
2.6.3 Shake-Table Tests of Confined-Masonry Rocking Walls with Supplementary
Hysteretic Damping (Toranzo, et al., 2009)
Toranzo et al. (2009) conducted tests to validate the concept of rocking walls as a major
seismic system. They specifically tested confined masonry walls, but their findings can also be
used with other kinds of rocking wall systems.
Confined masonry is a widely used method that consists of unreinforced brick panels
surrounded by reinforced concrete elements (beams and columns). A typical confined-masonry
specimen is shown in Figure 2.5. The concept of controlled rocking is an economic option for
common low-rise buildings built with confined masonry.
Toranzo et al. used a 0.4-scale model frame wall incorporating steel hysteretic energy
dissipating dampers referred to as EDDs. These devices were designed to meet the energy
dissipation requirements while being easy to replace or fix. They recommended that the EDDs be
placed at the toes of the rocking walls in order to dissipate energy through flexure. In addition,
the EDDs need to be designed to transfer shear loads into the foundation. While these devices
were deemed effective, Toranzo et al. recommended that supplemental damping be introduced to
increase the damping.

19
Figure 2.5: Geometry of the Wall (from Toranzo et al., 2009)
The setup of the test conducted by Toranzo et al. is shown in Figure 2.6. It was built to
represent a typical three-story building commonly found in South America. It can be related to
the research reported in this paper because the frame provides lateral bracing and the masonry is
not fixed to the footing. They measured their displacement with an adaptation of the design
methodology of Priestley (2000). Given the expected large stresses at the toes of the walls, they
provide a 10-mm (3/8-in.) thick steel plate to avoid damage to the foundation as well a steel case
to protect the corners of the wall from crushing. They concluded that, with careful and logical

20
detailing, damage can be eliminated and the wall returns to its original position providing no
residual displacement.
Figure 2.6: General Dimensions of the Test Structure (from Toranzo et al., 2009)
2.6.4 In-plane Experimental Behavior of Stone Masonry Walls under Cyclic
Loading (Vasconcelos and Lourenço, 2009)
Vasconcelos and Lourenço (2009) studied the behavior of stone masonry walls, a
traditional building material throughout history. As few experimental investigations of stone
masonry are available in the literature (most are for concrete, steel or masonry building
materials), they tested 23 walls in quasi-static loading. They simulated distinct types of walls

21
existing in ancient buildings of Europe under different loading modes. They tested different bond
arrangements and many of these walls failed due to the rocking mechanism as can be seen in
Figure 2.7. They stressed that, when only rocking of the wall occurs, global collapse does not
occur. However, residual inelastic horizontal displacements were observed due to sliding along
the bed joints of the units.
Figure 2.7: Rocking Hysteresis Curves for 2 Different Arrangements (from Vasconcelos
and Lourenço, 2009)

22
In addition they noted that, in a real earthquake event, different effects can be amplified due
to in-plane and out-of plane forces acting together. They concluded that, like masonry structures,
the failure mode clearly depends on the level of axial load as well as the height-to-length ratio.
They also found that the prediction of the lateral resistance through simplified methods agreed
reasonably with the results from the experiments. A final conclusion from their study is that very
little energy was dissipated unless some damage was done to the specimens. With the exception
of the material used and the isolation details, these tests were very similar to those investigated in
the masonry panels of this project.
2.6.5 Effects of Interface Material on the Performance of Free Rocking Blocks
(ElGawady et al., 2011)
This research was conducted on the interface of free rocking blocks. Two types of test
specimens were tested utilizing different properties such as the aspect ratio and the material at the
interface. By doing this, the effects of the varying properties on the behavior of the blocks could
be examined. The basic setup of these experiments is presented in Figure 2.8.

23
Figure 2.8: Plane View of the Specimen and Schematic of Rocking Mechanism (from ElGawady
et al, 2011)
The paramaters investigated by ElGawady et al. included rocking period, rocking
amplitude, and energy dissipation. They also attempted to compare the experimental results to the
returns of existing rocking models. They reached the following conclusions:
- “Rocking response is very sensitive to any source of friction within or associated with the
rocking system, either on or in the test specimen or its interface, as well as any small
imperfections existing either in the specimens or the surface where the experiments were
performed i.e. either the laboratory strong floor or the shaking table platform.
- The results of free rocking tests were repeatable. The test became more uniform with
higher amplitudes and for tests on rigid foundations. For small amplitudes and for tests
on rubber bases, the tests were still repeatable but with higher scatter.”

24
Finally, they were able to predict the free rocking amplitude quite accurately when a
coefficient of restitution was used.

25
CHAPTER 3: EXPERIMENTAL PROGRAM
3.1 Introduction
Two masonry veneer panel specimens were constructed to evaluate the performance of
isolation details designed to enable rocking of the panels in a seismic event. The veneer panels
are part of the building envelope and are not intended to resist lateral forces.
This chapter provides details of the two panel specimens, how they were constructed, and
the procedures used to test the panels.
3.2 Footing description
The veneer panels were built on heavily-reinforced concrete footings. These footings
already existed (from Sherman, 2011) and were reused in this project for the purpose of saving
time as well as money. Some modifications were made to accommodate the details of the panel
specimens. The footings were 24 in. wide, 18 in. deep and had a length of 86 in. Exact
reinforcement in the footings is unknown, but these footings were designed for a much higher
load resistance than that expected for this study (at least 10 times). The footings were then
anchored in the laboratory floor with threaded rods to ensure the immobility of the footings
during testing.
3.3 Panel specimen Description
The test specimen was designed and constructed to replicate the dimensions, details and
support conditions of a rocking masonry panel developed by KPFF Consulting Engineers in
Seattle. Drawings of the rocking masonry panel were provided by Steve Dill of KPFF. Details of

26
the rocking panel are presented in Figures 3.1 and 3.2. The masonry panel incorporates details at
the top and bottom of the panel intended to enable rocking behavior and thereby reduce the
damage that might occur from lateral displacements of the building system.
Figure 3.1: Building Drawing with Rocking Panel between Floors (from KPFF- Consulting
Engineers)

27
Figure 3.2: Panel Rocking Details (from KPFF- Consulting Engineers)

28
The test specimens were designed to represent half of the actual height of the masonry
panel and incorporated the rocking detail only at the base. The specimens were free at the top,
thereby effectively creating a cantilever condition for the panels. Nominal vertical and horizontal
reinforcement was provided in the panels. The panels were first constructed on top of the heavily-
reinforced footings, and reinforced loading beams were then constructed at the top of the panels.
In accordance with the details provided by KPFF, the panel-footing interface incorporated a
neoprene pad and foam strips as well as two steel dowels. Details of the test specimens are given
in Figure 3.3.
The two panels were identical except for the material used in the foam strips. The two foam
materials have similar compression resistance but different textures and internal structures. The
neoprene pad is intended to provide transfer of axial loading and to resist shear sliding. It also
acts to smooth out the interface, preventing any concentration of stress due to unevenness
inherent in construction. The foam strips create a void at the bottom edges of the panel and are
intended to reduce toe crushing. The bond breaker around the dowels, consisting of 4-in. long
foam pipe insulation, provides a 0.25-in. void between the grout and the dowels. The neoprene
pad and foam strips were purchased from Gardico Incorporated. Properties of the neoprene pad
and foam strips are shown in Table 3.1. Note that CCNS stands for Closed Cell Neoprene Sponge.

29
Figure 3.3: Panel Details

30
Table 3.1: Material Properties
Neoprene Foam
Panel 1
0.5 in. 60A Neo
60 Durometer
0.5 in. Styrofoam
Expanded polystyrene
Panel 2
0.5 in. 60A Neo
60 Durometer
0.5 in. CCNS med density
A bond breaker was incorporated over the top half of the dowels to allow vertical slip
between the dowels and the panel to enable rocking. The dowels also help to re-center the panel
after rocking and, at large lateral displacements, resist shear and provide an energy dissipating
mechanism once dowel yielding occurs.
3.4 Load Beam Description
Reinforced concrete beams were built on top of the two panels for use in applying the
lateral load to the specimens. Each beam was 9.5-in. wide, 7-in. high and 60-in. long. Details are
provided in Figure 3.4. Stirrups made from 0.25-in. diameter steel wire were used and spaced
evenly at 6 in. throughout the length of the beam. The connection of the beam to the panel
consisted of two different types of reinforcement. First, on the outer edges of the panel, vertical
reinforcement extended from the bottom of the panel into the loading beam. Additionally, two
hooks were grouted 5 in. into the top row of bricks cells and then extended 5 in. into the load
beam.

31
Figure 3.4: Loading Beam Details
3.5 Material Properties
The panel specimens were constructed using structural clay bricks provided by Mutual
Materials in Seattle. The bricks used were 6 in. stretcher structural bricks. Bond beam bricks with

32
same dimensions were used to at locations with longitudinal reinforcement. The nominal
dimensions of the masonry blocks were 6x4x12 in. See Figure 3.5 for details.
Figure 3.5: Clay Brick Dimensions (from Mutual Materials Catalog)
During construction, specimens were prepared to determine material properties. Three
standard blocks were tested according to ASTM C140-11. Three mortar test cylinders with a 2-in.
diameter and 4-in height were made with Type S mortar and were tested according to ASTM
C780-11. Three grout prisms were constructed and tested according to ASTM C1019-11.The
grout prisms were nominally 3.5-in. square by 7-in. high. Finally, three two-block prisms
conforming to ASTM C1314-11 were constructed and tested. All material specimens were tested
for compressive strength after completion of the panel tests at approximately 3 months after
construction. The average compressive strength for each material is given in Table 3.2. Note that
the compressive strength listed for the brick masonry units is based on an assumed net area of
50% of the gross area.

33
Table 3.2: Average Compressive Strength of Masonry Materials
Masonry Units Mortar Grout Masonry Prisms
Average Compressive Strength
(psi) 11,530 3,270 6,940 4,920
Steel reinforcing bars used in the panels were standard Grade 60 with a measured yield
strength of 64 ksi.
The two panels were constructed at the Composite Materials and Engineering Center at
Washington State University. The construction took place in three phases. The first phase was to
prepare the existing footing. It consisted of grinding the surface of the footing; drilling holes for
the dowels, anchoring the dowels in the footing with epoxy, and spreading a thin layer of gypsum
cement to smooth the surface of the footing in preparation for placing the neoprene pad and foam
strips.
For the second phase, professional masons were hired to build and grout the test panels.
The clay bricks were placed in running bond with face shell mortar bedding (3/8 in. mortar
thickness). During this second phase, grouting of the panels took place as well as construction of
the masonry and grout prisms.
The second phase is illustrated in Figures 3.6 and 3.7.

34
Figure 3.6: Construction Phase 2: Panel Construction
Figure 3.7: Construction Phase 2: Grouting

35
For the final construction phase, the loading beams were formed and poured. The forms
were removed two days after grouting.
3.6 Test Setup
The footing of the specimen was anchored to a reaction floor with 1.25-in. diameter steel
rods. Steel bracing was placed at each end of the footing to prevent sliding of the footing on the
reaction floor during the test. Three identical hydraulic jacks with a 5-in. stroke and operated
under a constant pressure applied axial (vertical) load onto the panel. The jacks had an individual
rated capacity of 10,000 psi corresponding to maximum capacity of 120 kips of applied force per
jack. The first panel was tested with a 20-kip axial load and the second with an initial axial load
of 50 kips, which was later changed to 40 kips. The pressure to be applied was determined from
Equation 3.1.
Equation 3.1
These jacks were connected in parallel thus maintaining equal pressure to each jack. The
upward forces from the jacks were resisted by a box beam attached to a sliding trolley system.
This arrangement enabled the jacks to move with the panel while maintaining a constant pressure
and creating a “free” boundary condition at the top of the panel. Horizontal loads were applied to
the panel by a 22-kip hydraulic actuator through the top loading beam. This actuator was
controlled by a computer.
The panel was restrained from out-of-plane movement by a lateral bracing system.

36
The 22-kip capacity hydraulic actuator was attached to a steel frame on one side and to the
loading beam on the other side. Drilled steel plates were placed on the ends of the concrete
loading beam and were then tightened with four 1-in. diameter rods. The test setup is shown in
Figure 3.8 and Figure 3.9 (North direction on the left).
Figure 3.8: 3D View of Test Setup

37
Figure 3.9: Test Setup
3.7 Instrumentation
Four string potentiometers, one mechanical displacement gauge and a load cell attached to
the horizontal actuator were used to monitor the response of the panels during testing.
One potentiometer (pot) (labeled as P4) with a 20-in. stroke was connected to the loading
beam at the height of the load application and served to monitor the global lateral displacement of
the panel during testing. The other end of this pot was connected to a rigid frame that was
isolated from the main test frame. Two other pots (labeled as P2 and P3) with 10-in. strokes were
placed at the North and South toes of the panel to measure the vertical displacements of the toes
of the panels during testing. Finally, a fourth pot (labeled as P1) with a 2-in. stroke was placed at

38
the base of the panels to measure horizontal sliding of the panels. The mechanical displacement
gauge was positioned against the footings to measure any movement of the footings on the
laboratory floor. During testing, no significant sliding of the footings was observed (measured
displacements were less than 0.001 in.). The positions of the potentiometers and the mechanical
gauge are shown in Figure 3.10.
Figure 3.10: String Potentiometer and Gauge Locations
3.8 System Control and Data Acquisition
Two separate computer system were used for these tests. One computer controlled the 22-
kip hydraulic actuator by sending information on the load, loading rate, and loading direction.
North South

39
The second computer was used to collect and record data from the string potentiometers. A flow
chart for the signals from the different computers and actuators is shown in Figure 3.11.
Figure 3.11: System Control Flow Chart (adapted from Sherman, 2011)
3.9 Test Procedures
The panels were subjected to slowly-applied, cyclic lateral loading using a prescribed
pattern of input displacements. Axial load was maintained at a constant 20 kips during testing for
Panel 1. For Panel 2, axial load was applied at a constant 50 kips for the first 3 cycles. Then, as
the maximum capacity of the horizontal jack was reached during the third displacement cycle, the
axial load was reduced to 40 kips for the remaining cycles.
The sequence of twelve horizontal displacement cycles is presented in Figure 3.12. Testing
was stopped after completion of these twelve cycles. The global displacement in the figure
corresponds to displacements of the top of the panel (measured by pot P4). The circle in the

40
figure represents an error in the intended loading pattern whereby Panel 1 was pushed to 2 in.
instead of 1.5 in. As will be evident in the later discussion of results, this error did not
significantly impact the behavior of the specimen.
Figure 3.12: Loading Cycles
Testing of Panel 1 took place at the WSU Composite Material and Engineering Center on
September 17, 2012. Panel 2 was tested on September 19. Both tests were completed in about 3.5
hours. Horizontal loads were applied at a rate of 0.5 in. /min. The tests commenced with pushing
the panel to the South. Recording of the potentiometers data was started before the axial load
application and stopped after the release of the same loads. This sequence allows for analysis of
the influence of the axial load application and release on the panels.

41
CHAPTER 4: RESULTS OF PANEL TESTS
4.1 Introduction
Results for the two masonry panel specimens tested in this study are presented in this
chapter. Results presented include test observations, load-displacement hysteresis curves, vertical
displacements at the ends of the panel, and sliding displacements. Photos are presented that
illustrate the observed behavior and damage to the panels during testing.
4.2 Panel 1
4.2.1 Test Observations
During testing, Panel 1 exhibited rocking behavior with little damage (see Figure 4.1 and
Figure 4.2). At the end of testing, some cracks developed in the end of the panel and spalling of
the faces of several bricks occurred on the West side as well as at the toes of the panel. Visual
observations made during testing are listed in Table 4.1
.

42
Figure 4.1: Side View of Panel During Testing Showing Rocking Behavior
Figure 4.2: Rocking Behavior and Uplift of One End

43
Table 4.1: Visual Observations for Panel 1
Load
(kips)
Disp.
(in.) Cycle Test observation
1.49 0.38 1.5 in. Onset of Crushing in North toe
1.06 0.5 2 in. Onset of Crushing in South toe
4.85 0.305 2.5 in. Sudden Spalling of a brick at base
-6.47 -2.68 3 in. Minor Crushing South toe
10 2.4 3 in. Spalling continues at base
5.4 2.8 3 in. Minor Crushing North toe
-5.4 -0.1 3 in. Splitting of brick in North toe - narrow face
0.5 0.687 3 in. Splitting of brick in North toe – side
The uplift of the panel characterizing the rocking behavior is shown in Figure 4.3.
Complete crushing of the foam is also shown in the figure; however, it can be seen that the foam
remained intact.
Figure 4.3: Uplift of the North and South Ends of the Panel

44
4.2.2 Damage
Only minor damage occurred to the panel as a result of inputting the lateral displacements.
Photos showing the observed damage are presented in Figure 4.4.
Figure 4.4: Damage to Panel 1
Photos of Panel 1 after completion of the test and removal of the panel from the footing are
shown in Figure 4.5. No permanent damage was observed in the neoprene pad, but the steel
dowels were bent at their base in a manner indicating shear yielding. The foam strips were
compressed to a very thin sheet.

45
Figure 4.5: Photos showing Panel and Dowels at the End of the Test
4.2.3 Vertical Displacements Along the Length of the Panel
The vertical displacements measured by potentiometers P2 and P3 at the same time for
peak displacements of pushing and pulling loading are provided in Figures 4.6 and 4.7. It can be
seen in the figures that the center of rotation of the panel is located around 12 in. from the center
of the panel (corresponding to 3/4 of the panel length). This location is approximately at the
interface of the neoprene pad and foam strip. It is evident that, when the panel rocks, the
compression force on the neoprene is concentrated near the end of the neoprene pad.

46
Figure 4.6: Measured Vertical Displacements for Pushing
Figure 4.7: Measured Vertical Displacements for Pulling
-76.2 -50.8 -25.4 0 25.4 50.8 76.2
-2.54
-1.27
0
1.27
2.54
3.81
5.08
-1
-0.5
0
0.5
1
1.5
2
-30 -20 -10 0 10 20 30
Distance from the center of the panel (cm)
Ver
tica
l Dis
pla
cem
ent
(cm
)
Ver
tica
l Dis
pla
cem
ent
(in
.)
Distance from the center of the panel (in.)
0.5"
1"
1.5"
2"
2.5"
3"
North side
South side
-76.2 -50.8 -25.4 0 25.4 50.8 76.2
-2.54
-1.27
0
1.27
2.54
3.81
5.08
-1
-0.5
0
0.5
1
1.5
2
-30 -20 -10 0 10 20 30
Distance from the center of the panel (cm)
Ver
tica
l Dis
pla
cem
ent
(cm
)
Ver
tica
l Dis
pla
cem
ent
(in
.)
Distance form the center of the panel (in.)
0.5"
1"
1.5"
2"
2.5"
3"
North side
South side
47
4.2.4 Load-Displacement Curves
Hysteresis Curves
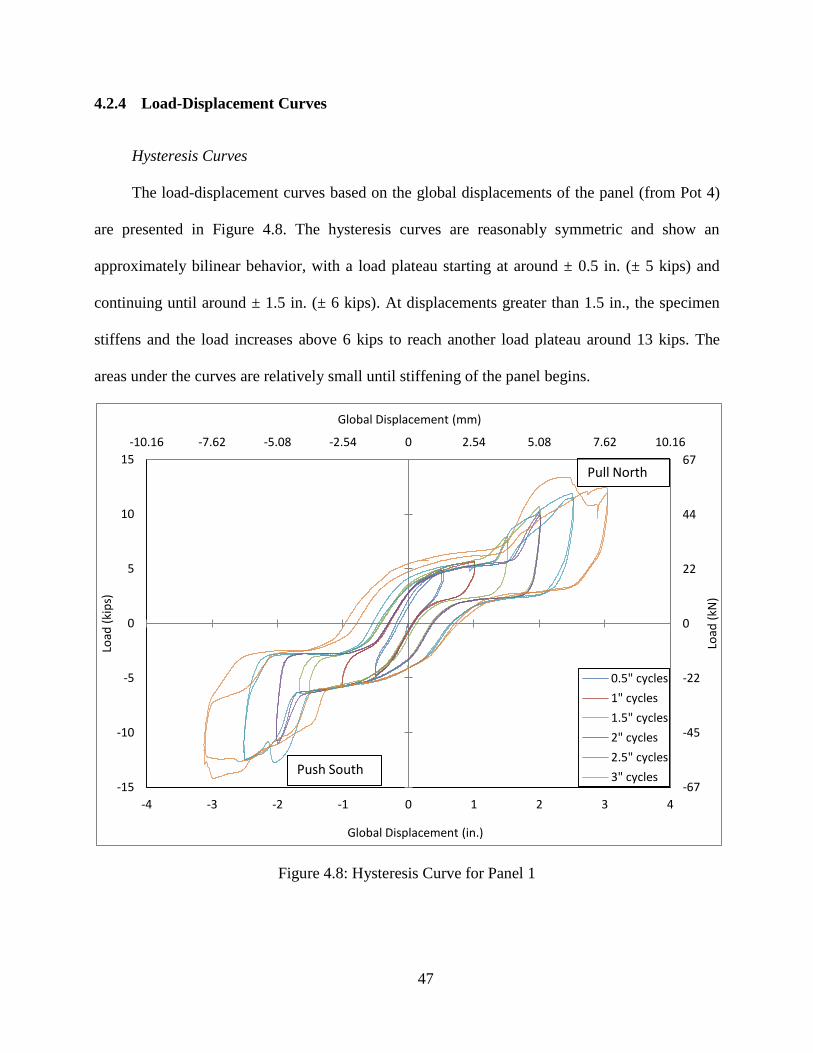
The load-displacement curves based on the global displacements of the panel (from Pot 4)
are presented in Figure 4.8. The hysteresis curves are reasonably symmetric and show an
approximately bilinear behavior, with a load plateau starting at around ± 0.5 in. (± 5 kips) and
continuing until around ± 1.5 in. (± 6 kips). At displacements greater than 1.5 in., the specimen
stiffens and the load increases above 6 kips to reach another load plateau around 13 kips. The
areas under the curves are relatively small until stiffening of the panel begins.
Figure 4.8: Hysteresis Curve for Panel 1
-10.16 -7.62 -5.08 -2.54 0 2.54 5.08 7.62 10.16
-67
-45
-22
0
22
44
67
-15
-10
-5
0
5
10
15
-4 -3 -2 -1 0 1 2 3 4
Global Displacement (mm)
Load
(kN
)
Load
(ki
ps)
Global Displacement (in.)
0.5" cycles
1" cycles
1.5" cycles
2" cycles
2.5" cycles
3" cycles Push South
Pull North

48
Panel Uplift
Plots of the vertical displacements at both ends of the panel are presented in Figure 4.9. The
first plot is of the North Pot (P2), and the second plot is of the South Pot (P3). The two sets of
curves are reasonably symmetric and reach a maximum negative displacement of around -0.5 in.,
corresponding to the crushing of the foam (which was originally 0.5-in. thick), and a maximum
uplift of around 1.5 in. A plateau starts at around 0.2 in. uplift and a load of around 5 kips. These
values correspond to the onset of visual rocking of the panel.
The initial compression displacement due to the engagement of the axial force (20 kips)
was small with a value of 0.014 in.

49
Figure 4.9: Uplifting and Crushing of P2 (top) and P3 (bottom)
-50.8 -38.1 -25.4 -12.7 0 12.7 25.4 38.1 50.8
-67
-45
-22
0
22
44
67
-15
-10
-5
0
5
10
15
-2 -1.5 -1 -0.5 0 0.5 1 1.5 2
Vertical Displacement (mm)
Load
(kN
)
Load
(ki
ps)
Vertical Displacement (in.)
0.5" cycles
1" cycles
1.5" cycles
2" cycles
2.5" cycles
3" cycles Push South
Pull North
-50.8 -38.1 -25.4 -12.7 0 12.7 25.4 38.1 50.8
-67
-45
-22
0
22
44
67
-15
-10
-5
0
5
10
15
-2 -1.5 -1 -0.5 0 0.5 1 1.5 2
Vertical Displacement (mm)
Load
(kN
)
Load
(ki
ps)
Vertical Displacement (in.)
Push South
Pull North

50
Panel Sliding vs. Load
A plot of the measured horizontal displacements (sliding) of the panel vs. the applied
horizontal loads is presented in Figure 4.10. The amount of sliding is small for low levels of
applied lateral forces, but it becomes more significant as the applied load increases above 5 kips.
The curves shown in Figure 4.10 are symmetric in both directions with a significant drop in
applied load at the point of reversing the direction of loading. This drop in load is associated with
friction between the neoprene pad and the panel as the load is reversed. A residual sliding
displacement of about 0.5 in. was present at the end of testing. Note that, as mentioned before,
the dowels were encircled with 0.25-in. thick insulation pipe foam, providing a gap between the
grout and dowels. This gap needs to be compressed before engaging the dowels, which occurred
during the 2.5 in. and 3 in. cycles. Also, when cycling to displacement levels of 2.5 in. and 3 in.,
an increase in load occurred just prior to 0.25 in. of displacement, followed by a load reduction.
A possible explanation for this behavior is that, at larger displacements, the dowels had
experienced plastic deformations introducing kinking and momentary locking of the dowels. The
subsequent drop in load seen the curves occurs once the dowels begin to again slip vertically.

51
Figure 4.10: Sliding of Panel 1
Net Panel Displacement vs. Horizontal Load
A plot of the rocking load vs. net panel displacements defined as the global displacement
minus the sliding displacement (P4-P1) is shown in Figure 4.11. The curves indicate a reasonably
uniform rocking plateau of approximately 5 kips occurring between 0.25 in. and 1.25 in. of net
displacements. Beyond 1.25 in. net displacement, the specimen stiffens and a second plateau is
eventually reached at approximately 13 kips. Additionally, no perfect self-centering is observed.
However, displacements at zero load are quite small (less than 0.25 in.).
-25 -20 -15 -10 -5 0 5 10 15 20 25
-66
-44
-22
0
22
44
66
-15
-10
-5
0
5
10
15
-1.00 -0.75 -0.50 -0.25 0.00 0.25 0.50 0.75 1.00
Horizontal Displacement at base (mm)
Load
(kN
)
Load
(ki
ps)
Horizontal Displacement at base (in.)
0.5" cycles
1" cycles
1.5" cycles
2" cycles
2.5" cycles
3" cycles

Figure 4.11: Load-Displacement Curve without Sliding
-7.62 -6.35 -5.08 -3.81 -2.54 -1.27 0 1.27 2.54 3.81 5.08 6.35 7.62
-67
-45
-22
0
22
44
67
-15
-10
-5
0
5
10
15
-3 -2.5 -2 -1.5 -1 -0.5 0 0.5 1 1.5 2 2.5 3
Global Displacement (mm)
Load
(kN
)
Load
(ki
ps)
Global Displacement (in.)
0.5" cycles
1" cycles
1.5" cycles
2" cycles
2.5" cycles
3" cycles Push South
Pull North
52
53
4.3 Panel 2
4.3.1 Test Observations
During testing, Panel 2 exhibited the expected rocking behavior for both the 40 and 50 kips
axial loading. However, it experienced more substantial damage and a more complex response
than was observed in Panel 1.
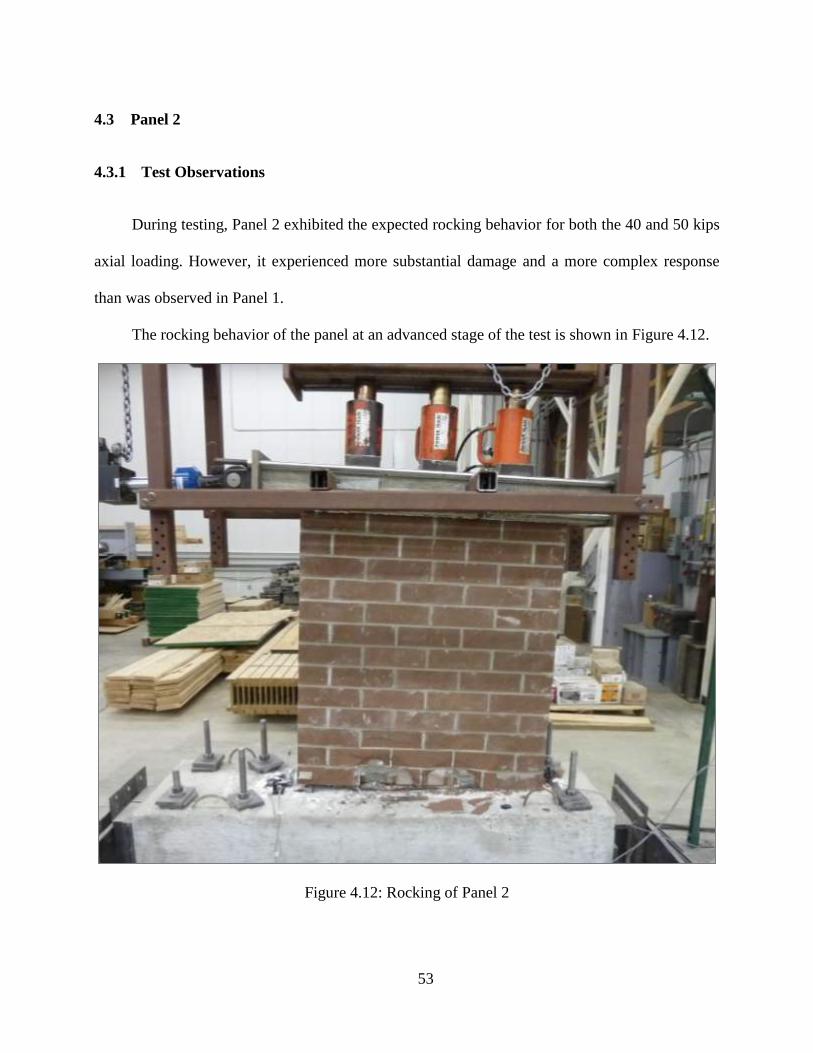
The rocking behavior of the panel at an advanced stage of the test is shown in Figure 4.12.
Figure 4.12: Rocking of Panel 2

54
The uplift and damage at the North toe is shown in Figure 4.13. It is clear that the toe is
significantly uplifting. In addition, the behavior of the foam strips was different than for the first
specimen. While both types of foam were fully compressed, the CCNS broke into pieces.
Figure 4.13: Uplift at North Toe
4.3.2 Damage
Observed damage includes spalling of the faces of bricks on both sides (East and West) of
the panel at the base, numerous substantial cracks in the panel, and extensive toe crushing.
Damage began early during the test. Visual observations made during testing are noted in Table
4.2. The damage was so extensive that the functionality of two potentiometers (P1 and P3) was
lost during the test.

55
Table 4.2: Visual Observations for Panel 2
Load (kips) Disp. (in.) Cycle Test observation
-10.5 -0.7 1 in. Spalling East South brick
6.6 0.509 1 in. Spalling West South brick
-9.7 -0.68 1 in. Onset Spalling West Center brick
-1.3 0.21 1 in. Spalling West Center brick + loss of P2
-3.3 -1.1 1.5 in. Spalling East Center
0.2 -0.3 1.5 in. Spalling West North : visible rebar
12.3 1.02 1.5 in. Lateral Cracking East North
-12.5 -0.88 1.5 in. Crack South Toe (8in. long vertically)
9.1 0.84 1.5 in. Crack North Toe (3in. long vertically)
3.7 -0.1 1.5 in. Onset of Toe Crushing at South
-4.4 0.14 1.5in. – 2in. Change of Axial Load (50 kips 40 kips)
-10.1 -2.1 2 in. Lateral Cracking East South
-15.3 -2.5 2.5 in. Minor Toe Crushing at South
-10.9 -2.35 2.5 in. Toe Crushing at South
18.1 2.4 3 in. Advanced Toe Crushing at South + loss of P3
The spalling of the panel at both the East and West sides is shown in Figure 4.14.
Figure 4.14: Spalling on East (left) and West (right)

56
The crushing of the South toe is shown in Figure 4.15. Cracking first occurred in the
brick units, followed by spalling of the bricks, and then crushing and spalling of the grout. Large
residual vertical and sliding displacements were present in Panel 2 at the end of testing.
Figure 4.15: Toe Crushing at South Toe
The neoprene pad did not exhibit any damage at the end of testing. However, the foam
strips were completely compressed. Additionally, the first two rows of bricks on both sides
experienced widespread splitting and spalling, and extensive toe crushing occurred at both ends
of the panel. Both dowels were severely bent. Photos after removing the panel from the footing
showing the bottom view of the panel and the dowel bending are presented in Figure 4.16.

57
Figure 4.16: End-of-Test Photos
4.3.3 Vertical Displacements Along the Length of the Panel
The panel vertical displacements obtained from P2 and P3 at the maximum lateral
displacements for each loading cycle are displayed in Figures 4.17 and 4.18. As was seen for
Panel 1, the center of rotation occurred at the neoprene-foam interface or at around 12 in. from
the geometric center of the panel. An exception to this was the first 2 cycles at small
displacements where visual rocking had not started and the point of rotation was closer to the
center of the panel (around 2 in. from the center). For the 3 in. cycles, the damage at the south toe
caused the panel to rock on the toe, instead of on the neoprene pad. This shifted the center of
rotation to around 16 in. from the center of the panel.
Results for the 3 in. curve are not displayed in Figure 4.18 because of the loss of P3 due to
toe crushing. However, it seems that the center of rotation did not move during pulling. It stayed
at around 12 in. from the center (3/4 of the wall length) because minimal damage was
experienced at the North toe.

58
Figure 4.17: Measured Vertical Displacements for Pushing
Figure 4.18: Measured Vertical Displacements for Pulling
-76.2 -50.8 -25.4 0 25.4 50.8 76.2
-25.4
-12.7
0
12.7
25.4
38.1
50.8
-1
-0.5
0
0.5
1
1.5
2
2.5
-30 -20 -10 0 10 20 30
Distance from the center of the panel (cm)
Ver
tica
l Dis
pla
cem
ent
(cm
)
Ver
tica
l Dis
pla
cem
ent
(in
.)
Distance from the center of the panel (in.)
0.5" 1" 1.5" 2" 2.5" 3"
North side
South side
-76.2 -50.8 -25.4 0 25.4 50.8 76.2
-2.54
-1.27
0
1.27
2.54
3.81
5.08
-1
-0.5
0
0.5
1
1.5
2
-30 -20 -10 0 10 20 30
Distance form the center of the panel (cm)
Ver
tica
l Dis
pla
cem
ent
(cm
)
Ver
tica
l Dis
pla
cem
ent
(in
.)
Distance from the center of the panel (in.)
0.5"
1"
1.5"
2"
2.5"
North side
South side

59
4.3.4 Load-Displacement Curves
Hysteresis Curves
The load-displacement curves based on the panel global displacements (P4 potentiometer)
are presented in Figure 4.19. The hysteresis curves are symmetric for the 0.5 in. and 1 in. cycles.
Rocking seemed to begin during the 1 in. cycles. For the cycles beyond 1 in., the required load to
push the specimen was somewhat higher than the load required to pull the specimen.
The effects of damage to the South toe are evident at two locations in the figure: on the left
end of the curve with a decrease in stiffness, and at the abscissa intersection where the curve
progressively shifts away from the origin.
When pulling (positive loads), a repeating curve can be seen with a plateau at a load of
approximately 18 kips occurring between global displacements of 1.5 in. and 3 in.
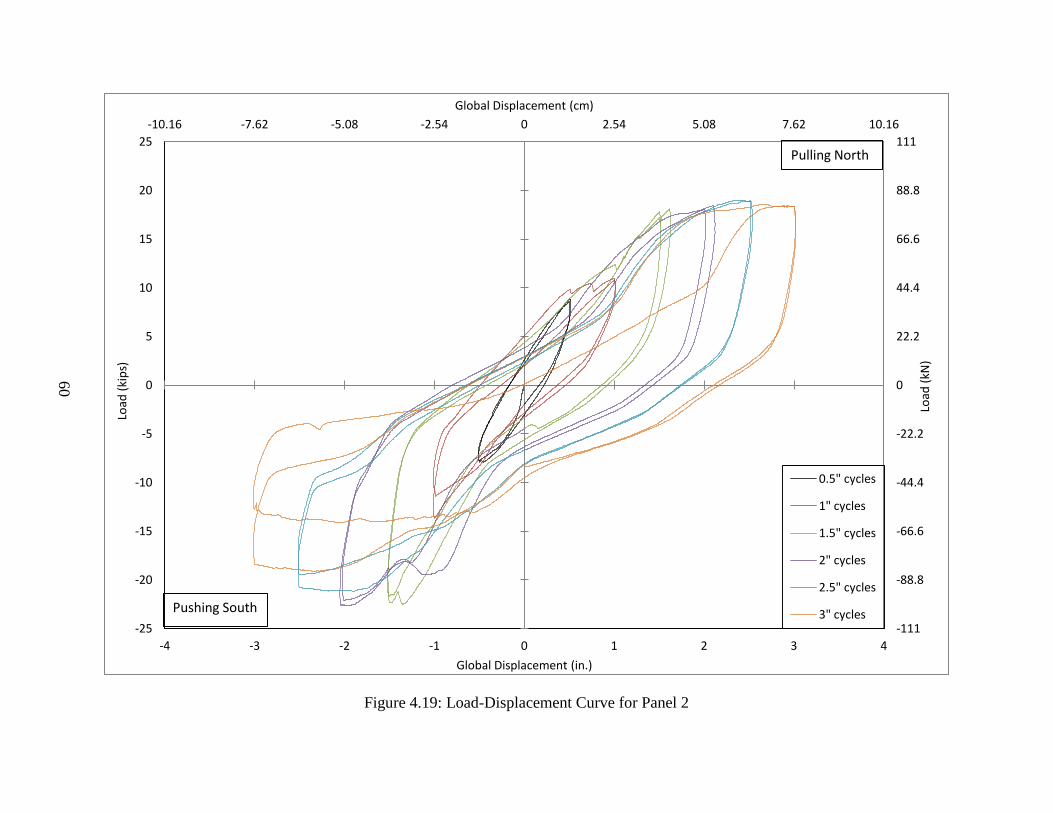
Figure 4.19: Load-Displacement Curve for Panel 2
-10.16 -7.62 -5.08 -2.54 0 2.54 5.08 7.62 10.16
-111
-88.8
-66.6
-44.4
-22.2
0
22.2
44.4
66.6
88.8
111
-25
-20
-15
-10
-5
0
5
10
15
20
25
-4 -3 -2 -1 0 1 2 3 4
Global Displacement (cm)
Load
(kN
)
Load
(ki
ps)
Global Displacement (in.)
0.5" cycles
1" cycles
1.5" cycles
2" cycles
2.5" cycles
3" cycles Pushing South
Pulling North
60

61
Panel Uplift
The recorded vertical displacements at both toes are presented in Figure 4.20. The curves
are symmetric until significant damage began during the 1.5 in. cycles.
The first curve represents displacements of the barely damaged North toe obtained from P2.
The effects of a decrease in stiffness and the damage to the other toe are evident in the right side
of the graph. A consistent compression of -0.5 in. at the North toe can be seen for most cycles
except for the last 3 in. cycle. It is likely that this exception is due to the consequences of the toe
crushing at the opposing toe. With this crushing, the entire structure begins to lean thus causing
the displacement of -0.4 in. in compression. The maximum vertical uplift of 2.25 in. is associated
with the crushing of the South toe. The initial displacement due to the application of the 50-kip
axial load caused a 0.065 in. compression in the panel.
The second curve represents the South toe vertical displacements (P3). The initial
compression due to 40-kip axial load is 0.07 in. Toe crushing can be seen when the maximum
compression reaches -0.78 in. due to the crushing of the toe (the foam was nominally 0.5-in.
thick). This created a shift in the rotation. The vertical uplift is then reduced to 0.85 in.
maximum. Once again, a plateau at around 18 kips can be observed.

62
Figure 4.20: Load-Vertical Displacement Curves for P2 and P3
-25.4 -12.7 0 12.7 25.4 38.1 50.8 63.5
-111.2
-88.96
-66.72
-44.48
-22.24
0
22.24
44.48
66.72
88.96
111.2
-25
-20
-15
-10
-5
0
5
10
15
20
25
-1 -0.5 0 0.5 1 1.5 2 2.5
Vertical Displacement (mm)
Load
(kN
)
Load
(ki
ps)
Vertical Displacement (in.)
0.5" cycles
1" cycles
1.5" cycles
2" cycles
2.5" cycles
3" cycles
Pull North
Push South
-25.4 -12.7 0 12.7 25.4 38.1 50.8 63.5
-111.2
-89.0
-66.7
-44.5
-22.2
0.0
22.2
44.5
66.7
89.0
111.2
-25
-20
-15
-10
-5
0
5
10
15
20
25
-1 -0.5 0 0.5 1 1.5 2 2.5
Vertical Displacement (mm)
Load
(kN
)
Load
(ki
ps)
Vertical Displacement (in.)
0.5" cycles
1" cycles
1.5" cycles
2" cycles
2.5" cycles
3" cycles
Pull North
Push South

63
Panel Sliding vs. Load
The specimen experienced significant sliding displacements. However, the potentiometer
P2 was lost during the 1 in. cycles due to spalling of the bricks. Consequently, no sliding
measurements were obtained after the loss of the potentiometer.
The sliding displacements until the loss of the potentiometer are shown in Figure 4.21.
Symmetrical curves are shown for the 0.5 in. displacement cycles. At the half cycle of 1 in.
symmetry is lost. This can be seen with the 0.6 in. offset as opposed to the 0.4 in. symmetric
offset. Due to damage and sliding, no self-centering is observed after this point.
Figure 4.21: Sliding of Panel 2
Net Panel Displacement vs. Horizontal Load
As already mentioned, it was not possible to measure sliding displacements during the full
duration of the test. Nevertheless, a comparison can be done before the loss of the potentiometer.
-20.32 -15.24 -10.16 -5.08 0 5.08 10.16 15.24 20.32
-67
-44
-22
0
22
44
67
-15
-10
-5
0
5
10
15
-0.8 -0.6 -0.4 -0.2 0 0.2 0.4 0.6 0.8
Horizontal Displacement at base (mm)
Load
(kN
)
Load
(ki
ps)
Horizontal Displacement at base (in.)
0.5" cycles
1" cycles

64
Both load-displacement curves based on the net panel displacement are presented in Figure 4.22.
Similar to the results for Panel 1, a narrower curve is seen after removing the sliding
displacement.
The net panel displacement (defined previously) corresponds to approximately half of the
global displacement (recorded directly by P4):
- For the 0.5 in. cycles, peaks are at ± 0.26 in. when sliding is removed
- For the first 1 in. cycle, the extreme values are ±1 in. with sliding and ± 0.5 in. without
sliding corresponding to the compression of the foam around the dowels.

65
Figure 4.22: Comparison between the Load-Displacement Curves
-38.1 -25.4 -12.7 0 12.7 25.4 38.1
-67
-44
-22
0
22
44
67
-15
-10
-5
0
5
10
15
-1.5 -1 -0.5 0 0.5 1 1.5
Global Displacement (mm)
Load
(kN
)
Load
(ki
ps)
Global Displacement (in.)
Load-displacement curve w/ sliding
0.5" cycles
1" cycles
-38.1 -25.4 -12.7 0 12.7 25.4 38.1
-67
-44
-22
0
22
44
67
-15
-10
-5
0
5
10
15
-1.5 -1 -0.5 0 0.5 1 1.5
Global Displacement (mm)
Load
(kN
)
Load
(ki
ps)
Global Displacement (in.)
Load-displacement curve w/o sliding
0.5" cycles
1" cycles

66
4.4 Influence of the Axial Reduction from 50 kips to 40 kips for Panel 2
Due to reaching the maximum capacity of the 22-kip actuator during the 1.5 in. cycles for
Panel 2, the applied axial load was reduced from 50 kips to 40 kips for the subsequent cycles.
The influence of this change on the overall behavior and the damage is difficult to quantify.
However, at the change, it resulted in a 400 lbs drop in lateral load as well as 0.035 in. movement
upward in the panel. The uplift records for the 1.5 in. and 2 in. displacement cycles are shown in
Figure 4.23. The circle in the figure shows where the change was recorded. It is evident that there
was a change of stiffness between the two cycles, but this may also be due to the damage (see
Table 4.2; the onset of a number of damage events happened during these cycles).

67
Figure 4.23: Influence of Axial Load Reduction
4.5 Influence of the Axial Load Change from 20 kips to 50/40 kips
Panel 1 was tested under 20 kips of axial load, while Panel 2 was tested with 50 kips (later
reduced to 40 kips) axial load. Two major differences were observed from the tests of 2 panels.
-25
-20
-15
-10
-5
0
5
10
15
20
25
-0.6 -0.4 -0.2 0 0.2 0.4 0.6 0.8 1 1.2
Late
ral L
oad
(ki
ps)
Vertical displacement at P2 (in.)
1.5" cycles
2" cycles
-25
-20
-15
-10
-5
0
5
10
15
20
25
-0.6 -0.4 -0.2 0 0.2 0.4 0.6 0.8
Load
(ki
ps)
Vertical Displacement at P3 (in.)

68
This first difference is that Panel 2 experienced much more damage. The second difference is the
amount of force that was necessary to cause rocking in the panel. Indeed, this is the reason for the
change of axial load during the test of Panel 2. Consequently, Panel 2 had a higher stiffness than
Panel 1 as shown on Figure 4.24.
Figure 4.24: Load-Displacement Curves for Both Panels Depicting the Change of Stiffness
-25
-20
-15
-10
-5
0
5
10
15
20
25
-4 -3 -2 -1 0 1 2 3 4
Load
(ki
ps)
Global Displacement (in.)
0.5" cycles 1" cycles 1.5" cycles 2" cycles 2.5" cycles 3" cycles
Pushing South
Pulling North
-25
-20
-15
-10
-5
0
5
10
15
20
25
-4 -3 -2 -1 0 1 2 3 4
Load
(ki
ps)
Global Displacement (in.)
0.5" cycles 1" cycles 1.5" cycles 2" cycles 2.5" cycles 3" cycles
Pushing South
Pulling North

69
4.6 Summary and Conclusions from the Panel Tests
This chapter presented results from quasi-static cyclic tests performed on two rocking
masonry veneer panels. Results presented include visual observations, load-displacement
hysteresis curves and an analysis of the rotation observed in both panels. The effects of the higher
axial loads used for testing Panel 2 are also discussed. Photos of each specimen during and at the
end of testing were provided.
Panel 1 exhibited clear rocking behavior during testing. Very little damage, consisting of
several spalled bricks and minor cracking in the panel, was observed in this specimen. After
removal of the panel from the footing, bending of the dowels was evident as well as the complete
compression of the foam strips. The neoprene pad exhibited no damage. At small lateral
displacements, the center of rotation of the panel during testing was located close to the center of
the panel. At this time, the panel had not started rocking and was oscillating on the neoprene pad.
Rocking initiated at 0.5 in. of lateral displacement and the center of rotation shifted to the
interface of the neoprene pad and foam strip, approximately 12 in. from the center of the panel.
Two load plateaus were evident in the load-displacement hysteresis curves: the first plateau was
at around 5 kips of in-plane load covering 0.5 in. to 1.5 in. of lateral displacements and was
associated with rocking, and the second plateau was at around 13 kips and occurred towards the
end of testing. Panel 1 experienced significant sliding on the footing, with nearly 1 in. of
permanent displacement at the end of testing.
Panel 2 also exhibited rocking behavior during testing, but substantial damage occurred to
the panel due to the larger axial loads. Splitting and spalling of the bricks above the neoprene pad
on both sides of the panel and significant toe crushing at the South occurred during testing. After
removal of the panel from the footing, complete compression of the foam strips was observed

70
similar to that for Panel 1, but the bending of the dowels was more significant. The centers of
rotation for Panel 2 were located at the same places as Panel 1: close to the center of the panel for
small displacements, and at 12 in. from the center once rocking initiated. The hysteresis curves
were substantially different than those for Panel 1. They were not symmetrical, no clear plateau
can be determined for rocking, and there was a plateau for positive load at around 18 kips near
the end of testing. Significant sliding representing half of the input global displacements were
recorded before the loss of the instrument measuring sliding. The larger axial loads for Panel 2
also resulted in increased lateral capacity and stiffness.
The special isolation details generally performed as intended in both panels. The detail
enabled stable rocking in Panel 1 to drifts of around 2%, and no significant damage occurred
even when displaced to drift exceeding 5%. The foam strips were completely compressed
effectively creating voids at both ends of the panels. Sliding of the panels on the neoprene pads
and shear yielding of the dowels dissipated energy during testing.

71
CHAPTER 5: ANALYSES, DISCUSSION AND COMPARISONS OF
PANEL PERFORMANCE
5.1 Introduction
This chapter provides discussion of analyses performed to understand the behavior
observed in the testing of the two panel specimens. Comparisons are made of the calculated loads
to rock the panel with test results. The performance and effectiveness of the isolation details to
produce rocking response and dissipate energy are evaluated. Differences and similarities of the
two specimens are also discussed.
5.2 Rocking Load
Based on equilibrium principles and Figure 5.1, the load required to cause a unit value (1
in.) of uplift of the panel can be calculated as follows:
The assumptions are:
- Rotation on the interface of the neoprene-foam at 12 in. from the center of the panel
based on the discussion in Sections 4.2.3 and 4.3.3;
- A weight (W) of 1450 lbs for the panel and loading beam, based on a assumed density of
approximately 145 lbs/cubic foot for both components;
- The influence of the foam is neglected (treated as a void);
- The system is in static equilibrium and the sum of moments at the point of rotation is 0;
and

72
- Second-order effects due to changes in geometry are not considered. It is recognized that
these second-order effect would slightly increase the predicted rocking loads, particularly
for larger lateral displacements.
Figure 5.1: Static Calculation (dimensions in inches)
Equation 5.1
The rocking loads determined from Equation 5.1 for the three values of axial load used in
the tests for the panel specimens are listed in Table 5.1. The rocking load listed in the table for

73
Panel 1 compares well with the observed plateau at about 5 kips of lateral load corresponding to
the onset rocking in this panel (see Figure 4.8 and 4.9).
Table 5.1: Required Lateral Load for used Axial Loads
For Panel 2, two axial loads were used:
- For A = 50 kips, the first two cycles do not reach the 11.43 kip lateral load required to
activate the rocking mechanism. However, after exceeding this load on the third cycle
(1.5in), the panel starts to rock as can be seen in Figure 5.2. The dowels get engaged as
soon as the rocking mechanism is activated. This causes a greater stiffness which can be
seen in Figure 5.3.
- For A = 40 kips, the dowels also get engaged as soon as the rotation starts, at a lateral
load of around ± 9.2 kips. This behavior is evident in Figure 5.3.
A (kips) L Required
(kips)
20 4.77
40 9.21
50 11.43

Figure 5.2: P2 and P3 Records for Panel 2.
-22.84
-11.42
0
11.42
22.84
-0.6 -0.4 -0.2 0 0.2 0.4 0.6 0.8
North
-22.84
-11.42
0
11.42
22.84
-0.6 -0.4 -0.2 0 0.2 0.4 0.6
South
0.5" cycles
1" cycles
1.5" cycles
-27.6
-18.4
-9.2
0
9.2
18.4
27.6
-1 -0.5 0 0.5 1 1.5 2 2.5
North
-27.6
-18.4
-9.2
0
9.2
18.4
27.6
-1 -0.5 0 0.5 1
South
2" cycles
2.5" cycles
3" cycles
74

75
Figure 5.3: Load-Displacement Curves with 50 kip Axial (top) and 40 kips (bottom)
-25
-20
-15
-10
-5
0
5
10
15
20
25
-2 -1.5 -1 -0.5 0 0.5 1 1.5 2
Load
(ki
ps)
Global Displacement (in.)
0.5" cycles
1" cycles
1.5" cycles
-25
-20
-15
-10
-5
0
5
10
15
20
25
-4 -3 -2 -1 0 1 2 3 4
Load
(ki
ps)
Global Displacement (in.)
2" cycles
2.5" cycles
3" cycles

76
5.3 Dowel Yielding
Along with friction on the neoprene pad, the two steel dowels contributed to restraining the
panel from sliding. At small displacements, the foam sleeve around the base of the dowels results
in no loading of the dowels. As displacements increase, the sleeve compresses and the dowels are
loaded in single shear. Eventually at large displacements, the dowels yield in shear and are
severely deformed resulting in second-order effects. This mechanism is less predictable since the
dowels are kinking and momentarily locking against vertical slip.
For Panel 1, a gain in load capacity at around 1.25 in. of lateral displacement is shown in
Figure 4.11 and is likely associated with the dowels being engaged in shear. The dowels are
encircled by 0.25 in. of foam. At panel sliding displacements greater than 0.25 in., the foam is
compressed and the dowels engage and resist sliding, thereby increasing the lateral load capacity
of the panel. A second plateau was reached during testing at a load of around 13 kips. The second
plateau corresponds to the yielding of the dowels. The Masonry Design Standard provides
Equation 3.9 (MSJC, 2011) which gives the shear strength of headed and bent-bar anchors as
follows:
Equation 5.2
Bvns is the nominal shear strength of an anchor when governed by steel yielding (lb) and Ab the
cross-sectional area of the anchor (in2). Based on a yielding strength of 36 ksi for the A36 steel
dowels, this gives a load of 13.3 kips to cause yielding of the two 5/8-in. diameter dowels. This
level of shear load corresponds very closely to the plateau recorded in the test of Panel 1.
For Panel 2, the dowels seem to engage as soon as the rotation starts, at around 1 in. of
global displacement (corresponding to 0.25 in. of uplift).
77
5.4 Behavior of the Neoprene Pad and Foam Strips
The compressive strengths of both types of foam strips are insignificant. However, the
polystyrene foam strips remained intact after compression while the CCNS foam strips lost their
integrity during testing, which makes the polystyrene foam the recommended material for this
application.
As a result of the weak resistance in compression, the foam strips were completely
compressed at the end of the test. Consequently, the neoprene pad is the only point of transfer of
axial load to the footing. It also determines the center of rotation for rocking of the panels. With
the panel resting on the neoprene, it changes the expected location of the center of rotation of a
rigid block (at the toes) to an inner location (at the neoprene-foam interface). The presence of the
foam strips has the effect of protecting the toes for small rocking displacements (less than
approximately 0.5 in. in uplift that results in compressing the 0.5 in. thick foam).
Based on a Poisson’s ratio of 0.5 for the neoprene, substantial lateral expansion would be
expected from the axial loading, particularly once rocking starts and area of neoprene carrying
axial loading is reduced. Such expansion was observed during testing, as can be seen in Figure
5.4, at the free edges of the panels. This lateral expansion of the neoprene is restrained by friction
between the neoprene and the overlaying bricks and footing. Eventually, the outward friction
force on the brick results in a brittle tension failure and spalling of the brick face due to tension
forces. This spalling occurred in Panel 1 during the 2.5 in. cycles and in Panel 2 during the 1 in.
cycles.
The boundary conditions on the neoprene are provided by only the panel and the footing.
Therefore, the pad is free to move laterally and side-ways with only friction to impede it. With an

78
increase in lateral load, friction caused some large deformations in the neoprene, as shown on
Figures 5.5 and 5.6.
Figure 5.4: Lateral Expansion of Neoprene
Figure 5.5: Neoprene Deformation in Panel 1

79
Figure 5.6: Neoprene Friction Reaction in Panel 2
5.5 Energy Dissipation
The total energy dissipated by the two panel specimens was determined based on the area
inside the loop of the load-displacement hysteresis curves using the Trapezoidal Rule shown in
Equation 5.3. The basis of this calculation is illustrated in Figure 5.7. It assumes a straight line
between two consecutive points and calculates the area enclosed by the hysteresis loops.
Equation 5.3
E refers to the energy between data points (kip-in.), ∆1 and ∆2 are the displacements (in.) and L1
& L2 are the load at the data points (kips).

80
Figure 5.7: Illustration of Total Energy Equation (adapted from Snook, 2005)
Energy dissipation in the panels may be caused by the following five different potential
mechanisms:
- Compression the foam, but it is clear that not much energy is required to achieve this
process;
- Inelastic deformations in the panel, but the panel acted for the most part as a rigid body;
- Friction and sliding of the panels on the neoprene and deformation of this material
(elastic and/or plastic);

81
- Bending and shear deformation of the dowels; and
- Damage to the masonry panel.
The relative contributions to energy dissipation are not the same for two specimens as they
did not undergo the same amount of axial loading.
- Specimen 1 dissipated 214 kips-in., mostly through sliding of panel on the neoprene and
plastic deformation of the dowels.
- Specimen 2 dissipated 467 kips-in. Since the axial and lateral loads were larger in this
panel, it would be expected that more energy would be dissipated. Nevertheless, the
energy dissipated before the onset of damage was is 97 kips-in. With the amount of
damage experienced by this panel, it is hard to quantify the amount of energy dissipated
by each mechanism. However, it is clear that more energy is dissipated through damage
in Panel 2.
Cumulative energy dissipation is given in Figure 5.8 for both panels. The vertical colored
lines represent the global lateral displacement at the engagement of the dowels (around 1 in. for
Panel 2 and 1.25 in. for Panel 1). It can be seen that the energy dissipation increases significantly
once the dowels get engaged.

82
Figure 5.8: Cumulative Energy Dissipation for both Panels
In order to be able to compare the dissipation of energy between both panels, the calculated
energy was divided by the axial load used for testing each panel and is presented in Figure 5.9. It
can be seen the axial load is a main parameter in the energy dissipation capacity. For small
displacements (less than 1.5 in.), both panels dissipated the same amount of energy per axial load.
At larger displacements, the energy dissipation is greater in Panel 2, most likely as a result of the
greater damage in this specimen.
0
100
200
300
400
500
0 0.5 1 1.5 2 2.5 3 Ener
gy D
issi
pat
ed in
th
e h
yste
resi
s cu
rve
s (K
ip-i
n.)
Global Displacement (in.)
Panel 1
Panel 2

83
Figure 5.9: Normalized Cumulative Energy Dissipation for both Panels
Plastic deformation of the dowels resulted in significant energy dissipation. This is
particularly obvious in Figure 4.11 which depicts the energy from only rocking. Once the dowels
get engaged, creating a stiffer curve, the area under the curves is greater than the area before
engagement. The neoprene behaved elastically, and the energy dissipated by the neoprene itself is
small. However, the energy dissipated by friction and sliding at the neoprene interfaces is clearly
significant. Figure 5.10 shows an idealized representation of load-displacement cycle for a body
restrained by friction. By comparing this figure with Figure 4.10, a similar behavior can be
observed. It can be concluded that the energy dissipated from friction and sliding at the interface
is significant, particularly at larger lateral displacements.
0
2
4
6
8
10
12
14
0 0.5 1 1.5 2 2.5 3
Cu
mu
lati
ve e
ner
gy d
issi
pat
ed /
Axi
al lo
ad (
kip
-in
/kip
)
Cycles
Panel 1
Panel 2

84
Figure 5.10: Idealized Friction Hysteresis for One Cycle
Toe crushing and splitting of the bricks towards the end of testing also contributed energy
dissipation, but the amount is likely much less than the contributions from yielding of the dowels
and sliding of the panels on the neoprene pads.
5.6 Summary of Panel Behavior
The two panel specimens both exhibited a rocking response when subjected to lateral
loading. By comparing the hysteresis curves obtained during testing (shown in Figures 4.8 and
4.11) with the theoretical bilinear curve depicting rocking behavior (shown in Figure 2.1) it can
be seen that the test results largely align with the theoretical response. The differences are due to
the energy dissipation resulting in greater area being contained in the hysteresis curves. The
energy dissipation is a result of sliding and friction at the neoprene-panel interface and yielding
L
- L
-D D
85
of the steel dowels. With the engagement of the dowels, a distinct increase in stiffness was seen
on the curves.
The following discussion provides a summary of the observed behavior of the panels,
particularly with reference to Panel 1 as its response was easier to analyze and understand.
At the beginning of the test, the panel behaved almost elastically, as can be seen during the
early cycles in Figures 4.8 and 4.19. Only the friction at the neoprene interface is preventing
sliding. At this time, the panel had not started rocking and was oscillating on the neoprene pad.
The location of the center of rotation of the panel during testing was located close to the center of
the panel for small displacements.
When the lateral displacement exceeds 0.25 in., the foam around the dowels becomes
compressed and the dowels are loaded in single shear and act to resist sliding of the panel. This is
demonstrated by the sudden increase in load seen in Figure 4.10 indicating a stiffer response.
With the sleeve around the top of the dowel allowing vertical motion, the panel starts rocking. It
however needs a specific and calculable lateral force to override the amount of axial load. The
center of rotation is now located at the interface of the neoprene pad and foam strip. A horizontal
plateau characterizing the rocking behavior can be observed in Figures 4.8 and 4.9. The curves
are largely bilinear, similar to the theoretical response of a rigid body shown in Figure 2.1. As the
rocking increases, a smaller area of neoprene has to carry the axial load. It creates high lateral
expansion due to a high Poisson ratio (0.5) and eventually triggers the spalling of the contact
bricks due to tension forces.
At a lateral displacement of about 1 in. for Panel 2 and 1.25 in. for Panel 1, the dowels get
engaged and stiffen the response of the panel. At the lateral load gets higher, the dowels start
yielding in shear, dissipating significant energy. Friction and sliding of the panel at the neoprene

86
interface is also dissipating energy. This can be seen with the amount of sliding on Figures 4.10
and 4.21. At the same time, uplift results in compression of the foam strips at the toes. As the
uplift gets larger, the foam is completely compressed and results in loading at the toes which
creates cracks (Panel1) and toe crushing (Panel 2) depending on the amount of axial load.
5.7 Summary and Conclusions
This chapter compared calculated loads to rock the panels and to cause dowel yielding with
results obtained from the two panel tests. The performance and effectiveness of the isolation
details to produce rocking response and dissipate energy were evaluated. A summary was
provided of the observed panel behavior.
Based on equilibrium, the calculated loads to engage rocking of the panels were found to
compare well with the rocking loads obtained during testing, especially for Panel 1. Because of
the higher axial loads used in Panel 2, rocking behavior began and was quickly followed by the
engagement of dowels making comparisons with the calculated rocking loads more difficult.
The shear capacity of the dowels was calculated using the provision given in the MSJC
(2011). The resulting shear capacity aligned closely with the second plateau obtained during
testing of Panel 1. For Panel 2, the higher axial load resulted in the dowels engaging quickly,
complicating evaluation of the behavior for this panel.
The effects of a higher axial load (from 20 kips for Panel 1 to 50 and 40 kips for Panel 2)
increases the load at which the rocking plateau occurs and resulted in greater damage to the
panel.
Energy dissipation in both specimens was determined using Trapezoidal Rule. Yielding of
the dowels contributed significantly to energy dissipation. Friction and sliding of the panel on the

87
neoprene pad was also a major contributor to energy dissipation. By normalizing the energy
dissipation to the axial load, it was seen that axial load strongly influences the amount of energy
dissipation. However, lateral expansion of the neoprene created tension forces on the bricks
above, resulting in eventual spalling of the bricks. This was particularly evident in Panel 2 with
the higher axial loads where spalling occurred on both sides of the wall along the full length of
neoprene pad. Other contributions to energy dissipation from cracking and toe crushing were
likely modest.
For the panel with lower axial loading, only minor damage developed in the panel even
when loaded to 3 in. of lateral displacement, corresponding to a lateral drift of more than 5%.
Even in the panel with higher axial loading, significant damage did not develop until the lateral
displacements exceeded 1.0 in of lateral displacement, corresponding to a lateral drift of nearly
2%. The special isolation details proposed for the veneer panels were successful in developing
the intended rocking response.

88
CHAPTER 6: SUMMARY, CONCLUSIONS AND
RECOMMENDATIONS
6.1 Summary and Conclusions
The objective of this project was to evaluate the effectiveness of special isolation details
designed to enable rocking response in masonry veneer panels subjected to lateral displacements.
Rocking is expected to reduce or eliminate damage to the masonry panel in a seismic event.
Criteria considered in evaluating panel performance the effectiveness of the isolation details
included strength, energy dissipation, residual displacement, extent of damage and rocking
behavior.
Two masonry veneer panels incorporating the special details were constructed and tested at
the Composite Materials and Engineering Center at Washington State University using different
axial loads. The panels were nominally 4.5 feet in height and 4 feet in width. The special details
incorporated in the panels consist of three elements. First, foam strips were placed at the outer
ends of the panels. These strips effectively create a void and are intended to protect the toes of the
panel. Second, a neoprene pad was placed at the interface of the panel and the footing covering
around 50% of the contact area. The neoprene pad serves to transfer axial loading and to resist
shear through friction. Finally, two steel dowels were embedded into the footing and incorporated
a bond breaker over the top half of the dowels to allow vertical slip between the dowels and the
panel to enable rocking. The dowels also help to re-center the panel after rocking and, at large
lateral displacements, resist shear and provide an energy dissipating mechanism once dowel
yielding occurs. The dowels were surrounded by foam wrapping at their base to allow
approximately 0.25-in. of sliding before the dowels were engaged.

89
Panel 1 exhibited stable rocking behavior during testing. Very little damage was observed
in this specimen. After removal of the panel, bending of the dowels was evident as well as the
complete compression of the foam strips. The neoprene pad exhibited no damage. Rocking
initiated at 0.5 in. of lateral displacement with the center of rotation located at the interface of the
neoprene pad and foam strip, approximately 12 in. from the center of the panel. Two load
plateaus were evident in the load-displacement hysteresis curves. The first plateau was at around
5 kips of in-plane load and was a result of rocking of the panel. The second plateau was at around
13 kips and was associated with yielding of the dowels. Panel 1 experienced significant sliding
on the footing, with nearly 1 in. of permanent displacement at the end of testing.
Panel 2 also exhibited rocking behavior during testing, but substantial damage occurred to
the panel because due to the larger axial loads resulting in a more complex response. Splitting
and spalling of the bricks above the neoprene pad on both sides of the panel and significant toe
crushing at the South occurred during testing. After removal of the panel from the footing,
complete compression of the foam strips was observed similar to that for Panel 1, but the bending
of the dowels was more significant. The hysteresis curves were substantially different from those
for Panel 1. They were not symmetrical, no clear load plateau could be determined for rocking,
and there was a plateau for positive load at around 18 kips near the end of testing. Significant
sliding representing half of the input lateral displacements were recorded before the loss of the
instrument measuring sliding. The larger axial loads for Panel 2 resulted in increased lateral
capacity and stiffness.
Yielding of the dowels contributed significantly to energy dissipation. Friction and sliding
of the panel on the neoprene pad was also a major contributor to energy dissipation. By
normalizing the energy dissipation to the axial load, it was seen that axial load strongly

90
influences the amount of energy dissipation. However, lateral expansion of the neoprene created
tension forces on the bricks above, resulting in eventual spalling of the bricks. This was
particularly evident in Panel 2 with the higher axial loads where spalling occurred on both sides
of the panel along the full length of neoprene pad. Other contributions to energy dissipation from
cracking and toe crushing were likely modest.
For the panel with lower axial loading, only minor damage developed in the panel even
when loaded to 3 in. of lateral displacement, corresponding to a lateral drift of more than 5%.
Even in the panel with higher axial loading, significant damage did not develop until the lateral
displacements exceeded 1.0 in of lateral displacement, corresponding to a lateral drift of nearly
2%. The special isolation details proposed for the veneer panels were successful in developing
the intended rocking response.
6.2 Recommendations and Future Research
The following recommendations are made for possible future research to better understand
and potentially improve the rocking response in masonry veneer panels.
It was seen in this study that the center of rotation once rocking initiated was at the
neoprene-foam interface. The length of the neoprene pad actually sets the location of the center
of rotation and consequently controls the lateral load required to cause rocking. Changing this
length would affect the global behavior of the panel. However, sufficient area of neoprene pad to
carry the axial load is also a consideration.
The conclusions made in this thesis are limited to the two specimens that were tested.
Additional research is recommended to provide additional information on rocking behavior with

91
these isolation details. Numerical modeling of the panels should also be explored as a way to
obtain greater understanding of panel behavior, particularly for larger axial loads.

92
BIBLIOGRAPHY
Aslam, M., G. Godden, and T. Scalise. "Earthquake rocking response of rigid bodies." Journal of
Structural Engineering (ASCE), 1980: 377-392.
Cheng, Chin Tung. "Shaking table tests of a self-centering designed bridge substructure."
Engineering Structures, 2008: 3426-3433.
Christopoulos, C., A. Filiatrault, and B. Folz. "Seismic Response of Self-Centering Hysteretic
SDOF Systems." Earthquake Engineering and Structural Dynamics, 2002: 1131-1150.
ElGawady, M. A., Quincy Ma, John Butterworth, and Jason Ingham. "Effects of interface
material on the performance of free rocking blocks." Earthquake Engineering and Structural
Dynamics, 2011: 375-392.
Eurocode, EN8. Design of Structures for Earthquake Resistance- Part 1: General rules seismic,
actions and rules for buildings. 2009.
"FEMA 306. Evaluation of Eathquake Damaged Concrete and Masonry Wall Buildings." ATC-43
Project for the Partnership for Response and Recovery, 1999.
Filiatrault, Andre, Jose Restrepo, and Constantin Christopoulos. "Development of Self-Centering
Earthquake Resisting Systems." 13th World Conference on Earthquake Engineering.
Vancouver, B.C. Canada, 2004.
Garcia-Pujador, Rodolfo. Shaking table study of rocking column bridge based on damage
avoidance design. State University of New York at Buffalo, 1998.
Hitaka, Toko, and Kenji Sakino. "Cyclic tests on a hybrid coupled wall utilizing a rocking
mechanism." Earthquake Engineering and Structural Dynamics, 2008: 1657-1676.
Holden, T., J. I. Restrepo, and J. B. Mander. "Seismic performance of precast reinforced and
prestressed concrete walls." Journal of Structural Engineering, 2002: 286-296.

93
Housner, G. W. "The behavior of inverted pendulum structures during earthquakes." Bulletin of
the Seismological Society of America, 1963: 403-417.
Kelly, Trevor E. "Tentative Seismic Design Guidelines for Rocking Structures." Bulletin of New
Zealand Society for Earthquake Engineering, 2009: 239-274.
Kuruma, Y., R. Sause, S. Pessiki, and W. Lu. "Lateral load behavior ans seismic design of
unbonded post-tensioned precast concrete walls." ACI Structural Journal, 1999: 622-632.
Lipscombe, P. R. Dynamics of rigid block structures. Dissertation submitted to the University of
Cambridge for the Doctor of Philosophy, 1990.
Mander, J. B., and C. T. Cheng. Seismic resistance of bridge piers based on damage avoidance
design. State University of New York, Buffalo: Technical Report NCEER-97-0014 (National
Center for Earthquake Engineering Research), 1997.
Masonry, Standards Joint Committee(MSJC). Building Code Requirements for Masonry
Structures, 2011. American Concrete Institute, Farmington Hills, MI., American Sociery of
Civil Engineers, Reston, VA., and the Masonry Society, CO.
Meek, J. W. "Effects of Foundation Tipping on Dynamic Response." Journal Struct. Div. ASCE
Vol. 101 No. ST7, 1978: 1297-1311.
New Zealand Standards. Code of Practive for General Structural Design and Design Loadings
for Buildings, NZS 4203:1992. 1992.
New Zealand Standards. Structural Design Actions, Part 5: Earthquake Actions NZS 1170:2004.
2002.
Pennucci, D., G. M. Calvi, and T. J. Sullivan. "Displacement-based design of precast walls with
additional dampers." Journal of Earthquake Engineering, 2009: 40-65.

94
Priestley, M. J. N., R. J. Evison, and A. J. Carr. "Seismic response of sructures free to rock on
their foundations." Bulletin of the New Zealand National Society for Earthquae Engineering,
1978: 141-150.
Priestley, M. J., and J. R. Tao. "Seismic Response of Prescast Prestressed Concrete frames with
Partially Debonded Tendons." PCI Journal, January-February 1993: 58-69.
Prieto, Francisco, and Paulo B. Lourenço. "On the rocking behavior of rigid objects." Meccanica,
2005: 121-133.
Restrepo, José I., and Amar Rahman. "Seismic Performance of Self-Centering Structural Walls
Incorporating Energy Dissipators." Journal of Structural Engineering, November 2007:
1560-1570.
Roh, Hwasung, and Andrei Reinhorn. "Nonlinear static analysis of structures with rocking
columns." Journal of Structural Engineering, 2010: 532-542.
Stanton, J., W. Stone, and G. S. Cheok. "A hybrid reinforced precast frame for seismic regions."
PCI, 1997: 20-32.
Toranzo, L. A., J. I. Restrepo, J. B. Mander, and A. J. Carr. "Shake-Table Tests of Confined-
Masonry Rocking Walls with Supplementary Hysteretic Damping." Journal of Earthquake
Engineering, 2009.
Toranzo, L. The use of rocking walls in confined masonry structures: a performance-based
approach. University of Canterbury, New Zealand: PhD Thesis, Department of Civil
Engineering, 2002.
Vasconcelos, G., and P. B. Lourenço. "In-plane experimental behavior of stone masonry walls
under cyclic loading." Journal of strutural engineering, 2009: 1269-1277.