Embed Size (px)
Citation preview

Analysis of the pathogen mobility from wastewater to suspended duckweed
By: Kevin Clack
International Research Experience for Students (IRES) 2017
In collaboration with Zoluntu Ngwane, Natalie Mladenov, Monica Palomo, Thor Axel
Stenstrom, Dennis Amoah, Bjoern Pietruschka, Chris Buckley, Pardon Muchaonyerwa, Alfred
Odindo

2
Table of Contents
Abstract ................................................................................................................................. 3
1. Introduction .................................................................................................................... 3
2. Methods and Materials .................................................................................................... 4 Preparation of Duckweed .......................................................................................................................... 4 Growth Rate Kinetics ................................................................................................................................. 4
2.1 Experimental Setups ......................................................................................................................... 5 Batch experimental setup .......................................................................................................................... 5 Continuous-flow experimental setup ........................................................................................................ 6
2.2 Microbial study of duckweed biomass ............................................................................................. 8 2.3 Microbial study of duckweed biomass dried at ambient temperatures .......................................... 8
3. Results ............................................................................................................................ 9 3.1 Microbial analysis of duckweed biomass ......................................................................................... 9
Batch setup ................................................................................................................................................ 9 Continuous-flow setup and subsequent drying at ambient temperatures ............................................. 10
3.2 Water quality and microbial analysis of treated effluent .............................................................. 11 Batch setup .............................................................................................................................................. 11 Continuous-flow setup ............................................................................................................................. 14
3.3 Duckweed growth ........................................................................................................................... 16 Growth rate kinetics – Batch setup ......................................................................................................... 16 Growth rate kinetics – Continuous-flow setup ........................................................................................ 16
4. Discussion ..................................................................................................................... 16 4.1 Microbial analysis of duckweed biomass ....................................................................................... 16
Microbial analysis of duckweed dried at ambient temperatures............................................................ 17 4.2 Water quality analysis .................................................................................................................... 18
5. Conclusion .................................................................................................................... 19
6. recommendations ......................................................................................................... 19
Acknowledgements ............................................................................................................... 20
References ........................................................................................................................... 20
Appendix .............................................................................................................................. 21 6.1.1 Spread plate method with 3M Petrifilms ................................................................................... 21 6.1.2 Spread plate method with Brilliance E. coli/Coliform selective agar ......................................... 21 6.1.3 IDEXX Colilert-18 ......................................................................................................................... 21
6.3 Microbial analysis ........................................................................................................................... 27 6.4 Duckweed drying microbial analysis .............................................................................................. 37

3
Abstract
Global efforts are being made to ensure safe water sources, sanitation, food security, and
sustainable agriculture through the United Nations Sustainable Development Goals. These
efforts have attracted interest in the use of duckweed, a small angiosperm that thrives in nutrient
rich waters across the globe, for polishing treatment of effluent from anaerobic baffled reactor
(ABR) systems, and as a green-fertilizer or soil amendment. However, it is hypothesized that
elevated concentrations of pathogenic bacteria may be present in the biomass of duckweed
grown in ABR effluent. In order to address this, lab-scale batch and continuous-flow duckweed
ponds were constructed with a 3 and 2-day hydraulic residence time (HRT), respectively to
determine pathogen concentrations in Lemna minor and a mixed duckweed with both L. minor
and Wolffia arrhiza. Analysis for Total Coliforms (TC) and E. coli indicator bacteria in ABR
effluent and duckweed biomass was conducted using a spread plate method with 3M Petrifilms
and Brilliance E. coli/coliform selective agar. Counts of E. coli and TC were lower in the
effluent of ponds with duckweed than in controls without. After growth in ABR effluent, L.
minor and mixed biomass contained E. coli and TC at concentrations of 10 and 8 log CFU/g,
respectively. When L. minor and mixed duckweed was dried at 32C, E. coli and TC present in
duckweed biomass were reduced to a magnitude of 3 log CFU/g within the first 24 hours.
During the next 48 hours E. coli and TC increased to 4.19(±0.07) and 4.78(±0.06) log CFU/g,
respectively in L. minor biomass. In mixed biomass E. coli and TC increased to 4.04(±0.18) and
4.80(±0.11) log CFU/g respectively. These results indicate that pathogen counts in the ABR
effluent are reduced and taken up by duckweed biomass, posing a potential health risk when used
as a green-fertilizer or soil amendment.
1. Introduction
While anaerobic digestion is an efficient means of the removal of organic material and
suspended solids, it has little effect on the nutrient concentrations and only partially removes
pathogenic organisms (Collivignarelli et al., 1990). An ABR is an example of a low-
maintenance anaerobic treatment system, efficient in the removal of organic material and
suspended solids, but with little bacterial removal. This system is usually followed by one or
more anaerobic filters (AF), creating the appropriate term, ABR-AF system. As a polishing
treatment step, this system is usually followed by a constructed wetland, membrane filtration, or
another natural system such as ponds or lagoons as a final treatment step to remove pathogenic
bacteria. Natural systems have notably low cost and maintenance, rendering them suitable for
developing countries where money and skilled workers are scarce (Conely et al., 1991). An
example of a natural treatment system is described in a study done by Nasr et al. (2008), where
duckweed was used in a pond as a polishing treatment for wastewater. Duckweed is a small,
non-N-fixing, angiosperm with high reproduction rates that is naturally present in nutrient rich
and brackish bodies of water. While duckweed has been the focus of many wastewater treatment
studies due to its known ability to take up nutrients and contaminants, little information has been
presented about its tendency to take up pathogenic bacteria into its cell tissue and on its surface
(Goopy et al., 2003).
In ABR-AF systems, helminth eggs are effectively removed from through sedimentation. In
addition, bacteria and viruses are inactivated to a great extent, although they still exist in

4
infectious concentrations in treated effluent. High inactivation rates of pathogenic bacteria have
been reported in natural treatment processes such as constructed wetlands, shallow aerobic
stabilizations ponds, algal ponds, or duckweed ponds. This is attributed to effects of starvation,
exposure to UV rays, sedimentation, and various biochemical interactions.
In duckweed ponds, UV radiation is expected to have less effect in pathogen inactivation due to
decreased sunlight penetration past matts of floating biomass. Additionally, duckweed biomass
may serve as a surface for pathogen attachment. In effect, pathogens adsorbed to duckweed
biomass may be shielded from UV light (MacIntyre et al., 2006). Additionally, pathogens may
remain on the surface of duckweed biomass when removed during harvesting, or after
sedimentation due to plant decay (El-Shafai et al. 2007). In addition to adsorption to the surface
of duckweed biomass, it is also possible that pathogens may be internalized into the biomass.
Pathogen internalization has not been studied in duckweed specifically, but a study by Hirneisen
et al. (2012) discusses pathogen internalization of various root-based crops. Hirneisen reports
that there is controversy whether internalization of pathogens is an active or passive process.
However, authors suggest that motile bacteria position themselves close to the root-systems,
increasing the potential for internalization into the plant biomass.
The goal of this study was to test the hypothesis that pathogenic bacteria may be present in
duckweed biomass when grown in ABR-AF effluent. In order to address this hypothesis, this
study attempted determine concentrations of TC and E. coli indicator bacteria in harvested
duckweed biomass after several days of growth in ABR-AF system effluent. Additionally, in
order to address the potential use of duckweed as a green-fertilizer or stock feed, inactivation of
TC and E. coli were also determined in harvested duckweed biomass due to drying at ambient
temperatures. Lastly, using batch and continuous flow bench-scale ponds containing duckweed
and ABR-AF effluent, this study also attempted to determine the removal of TC and E. coli
indicator bacteria present in ABR-AF system effluent treated with duckweed and compared with
controls.
2. Methods and Materials
Preparation of Duckweed
Duckweed consisting of a mixture of L. minor and W. arrhiza was retrieved from a swine lagoon
located at an estate 20 km outside of Pietermaritzburg, South Africa for use in this study. L.
minor duckweed was retrieved from the mixture using a sieve to prepare containers with only L.
minor without fronds of W. arrhiza. Clean tap water was poured over the sieve to separate any
remaining W. arrhiza fronds from the L. minor. Both the L. minor and mixed duckweed were
grown in effluent from the second anaerobic filter (AF2) in the ABR-AF system for three days
prior to the start of the experiments to allow time to adjust to new growing conditions.
Growth Rate Kinetics
On the first day of each trial duckweed was dewatered using a manual centrifuge. An initial
damp weight was recorded before the duckweed was added into its respective container. On the
final day of each trial, pre-cut mousseline cloth was wetted with water and then dewatered using
a manual centrifuge. The damp weight of each mousseline cloth was recorded. Duckweed was
sieved out of each container using a hand sieve and mousseline cloth. The Duckweed was

5
contained in the mousseline cloth and weighed using a gravimetric scale. The damp weight of
the mousseline cloth was subtracted from the total weight and recorded
𝑌 = (𝐷𝑊𝐶𝑓 − 𝐶) − 𝐷𝑊𝑖 Eqn. 2.1
𝑌 = growth rate of duckweed (g
d⁄ )
DWCf = combined mass of dewatered mousseline cloth and final duckweed biomass C = mass of dewatered mousseline cloth
DWi = initial mass of dewatered duckweed biomass
2.1 Experimental Setups
Batch experimental setup
This study built upon the results of a report by Scolavino (2016) on nutrient removal by
duckweed grown in diluted effluent sampled from different stages of an ABR-constructed
wetland system. The first part of this study utilized a batch setup to analyze changes in water
quality and indicator bacteria concentrations due to the presence of duckweed. Duckweed was
grown in the growing tunnel at Newlands-Mashu DEWATS site for three days in three triplicate
sets of 0.06 m2 containers filled with 3 L of AF2 effluent. One set contained L minor, another
contained a mixture of L. minor and W. arrhiza, and finally a control was established consisting
of ABR-AF effluent from AF2 without the presence of duckweed. An aerial load of 500 g/m2 of
duckweed was added to each container to achieve ideal growing conditions.
Figure 1: Control (C), L. minor (L), and Mixed (M)
duckweed batch containers
Sampling and analytical methods – Batch setup
Each morning at 11:00 AM, 25 mL samples were retrieved after each container was stirred
thoroughly. The water level of each container was recorded after sampling and replenished the
next day with DI water before conducting water quality analysis and sampling to account for
evapotranspiration. pH, dissolved oxygen (DO), electrical conductivity (EC), temperature, and
turbidity were measured daily after sampling to assess the water quality in each container. A
Fisher pH meter was used to measure pH, a WTW Oxi 3401 DO meter to analyze dissolved
oxygen, a YSI EC meter used to test electro-conductivity and temperature, and a Hach DR900
spectrophotometer was used to test for turbidity.
C3
C2
C1 L1
L2
L3 M3
M2
M1

6
Microbial analysis was conducted at the Durban University of Technology (DUT) Water and
Wastewater Technology (WWT) laboratory using spread plate method with 3M petrifilms to
determine changes in TC and E. coli concentrations over the 3-day HRT (Figure 2).
Figure 2: Spread plate method with 3M Petrifilms
IDEXX Colilert method was used to determine initial and final TC and E. coli concentrations in
units of MPN/100 mL over the course of a 3-day HRT. A 10-5 serial dilution was prepared from
a thoroughly vortexed 25 mL of sample. Microbial analysis was conducted using IDEXX
Colilert-18 method (Figure 3).
Figure 3: IDEXX Colilert-18 method. Fluoresced
cells signifying the presence of E. coli.
Continuous-flow experimental setup
In addition to the batch setup, a continuous flow system was constructed to analyze changes in
water quality and concentrations of indicator bacteria by duckweed in bench-scale duckweed
ponds. Three 12 L, 7 cm deep, duckweed ponds were assembled to resemble full-scale ponds,
and lab-scale ponds assembled in a previous experiment conducted by Nasr et al. 2008 (Figure
3.2); one with L. minor, another with a mixture of L. minor and W. arrhiza, and a control pond
without the presence of duckweed. An aerial load of 600 g/m2 of duckweed was added to the L.
minor and Mixed ponds to achieve ideal growing conditions according to Nasr et al. 2008. This
surface density provided a loose coverage that prevented algae growth while providing enough
space for growth. Each pond was fed by an influent reservoir filled with effluent from the
Newlands Mashu ABR-AF system at a flow rate of 0.25 Lhr-1 to achieve a 2-day HRT. The

7
influent reservoir was filled with AF2 effluent twice daily at 10:00 AM and 1:00 PM to provide
two reference points for initial pathogen concentrations.
Figure 4: Continuous flow setup with Mixed, L.
minor, and Control ponds fed by influent reservoir.
Sampling and analytical methods – Continuous-flow setup
The influent reservoir was re-filled with AF2 effluent at 10:00 AM and 1:00 PM on days 1 and 2.
After each re-fill, 25 mL samples were collected in triplicate from the influent reservoir for
initial water quality and microbial. At the end of each 2-day HRT, 25 mL samples were
retrieved from the effluent of each pond 30 minutes before the 2-day HRT had been reached, at
the HRT completion, and 30 minutes after the HRT had been reached to account for variance of
effluent water quality (Figure 6).
Figure 5: Sampling from continuous-flow effluent
weir of control pond.
Influent
reservoir
Mixed
pond
L. minor
pond Control
pond
Mixed pond
Effluent
2 Channel
Pump 1 Channel
Pump
Control
Effluent
L. pond
Effluent

8
The pH, dissolved oxygen (DO), electrical conductivity (EC), temperature, and turbidity were
measured in the influent reservoir at the time of each re-fill and at each sampling time from the
pond effluent to assess the changes in water quality before and after treatment with a pond. A
Fisher pH meter was used to measure pH, a WTW Oxi 3401 DO meter to analyze dissolved
oxygen, a YSI Conductivity meter used to measure electro-conductivity and temperature, and a
Hach DR900 spectrophotometer was used to determine turbidity.
Microbial analysis was conducted on influent samples, and on effluent samples after the HRT
was reached using a spread plate method with E. coli/coliform selective agar. Triplicate samples
were retrieved from the influent reservoir after being filled with AF2 effluent at 10:00 AM and
1:00 PM to determine influent TC and E. coli influent concentrations. Microbial analysis was
conducted on samples retrieved from the pond effluent 30 minutes before the 2-day HRT, at the
2-day HRT, and 30 minutes after the 2-day HRT to account for the variance of effluent TC and
E. coli concentrations.
2.2 Microbial study of duckweed biomass
L. minor and W. arrhiza were grown in AF2 effluent for 3 days prior to experimentation to allow
the duckweed to acclimate to its new conditions. De-watered duckweed samples were retrieved
from batch setups on the initial day of each trial and analyzed for TC and E. coli indicator
bacteria present in the initial biomass. De-watered duckweed samples were also taken on the
final day of each experiment to determine final TC and E. coli concentrations. Duckweed was
dewatered using a manual centrifuge and a sieve. 5g of dewatered duckweed was weighed out
and macerated in a blender for 3 minutes with 500 mL of DI water to obtain a 1:100 dilution
(Figure 6). This liquid was further diluted to 10-5 in a 100-mL graduated cylinder. Each dilution
was poured into a clean Nalgene bottle and analyzed for pathogens using IDEXX method
(Appendix section 6.1.3).
(A)
(B)
(C)
(D)
Figure 6 Dewatering (A), weighing (B), and maceration (C) & (D) of duckweed biomass for microbial
analysis.
2.3 Microbial study of duckweed biomass dried at ambient temperatures
Changes in E. coli and TC concentrations were determined in L. minor and mixed duckweed
biomass harvested from continuous-flow experimental setups over the course of a three-day
drying period at ambient temperatures. Dewatered duckweed was pre-weighed into 5 g samples,
spread evenly onto metal weighing trays, and placed into an incubator at approximately 32°C to
resemble drying conditions in direct sunlight in northern Africa, where average temperatures can
reach up to 36°C in summer months. Each day, one of each duckweed sample was macerated,

9
prepared into 10-2 dilutions with DI water, and analyzed for pathogen concentration using a
spread plate method with brilliance E. coli/coliform agar (Figure7) (Appendix Section 6.1.2).
(A)
(B)
Figure 7: 5 g dewatered duckweed in metal weighing trays before drying (A) and after one day
of drying (B).
3. Results
In this study, changes in duckweed biomass in the batch and continuous-flow experiments are
reported. In addition, bacterial enumeration was performed on treated effluent sampled from all
ponds, harvested biomass, and biomass after drying at 32C. Lastly, water quality analysis was
conducted to assess the effects of the presence of duckweed in batch and continuous-flow ponds.
3.1 Microbial analysis of duckweed biomass
Microbial analysis with IDEXX Colilert method was conducted on initial duckweed biomass in
batch containers without replication. Final microbial analysis of duckweed from batch
containers was conducted in triplicate.
Batch setup
The results from the IDEXX Colilert method indicate that the initial TC concentrations in L.
minor and mixed duckweed were 6.70x10⁶ and 9.80x10⁷ MPN/g, respectively. After growth in
ABR-AF system effluent for 3 days, TC concentrations in L. minor remained unchanged at
6.15x10⁶(±2.71x10⁶) MPN/g, and decreased in the mixed biomass to 4.42x10⁶(±5.30x10⁵)
MPN/g (Figure 11). Results indicate that initial E. coli counts in L. minor and mixed duckweed
biomass were 1.55x10⁶ and 5.73x10⁷ MPN/g, respectively. After growth in ABR-AF system
effluent for 3 days, E. coli counts in L. minor and mixed duckweed decreased to
9.43x10⁵(±3.62x10⁵) and 9.07x10⁵(±4.68x10⁵) MPN/g, respectively (Figure 8).

10
Figure 8: Initial and final IDEXX MPN of indicator
bacteria in biomass of L. minor and mixed
duckweed after growing in DEWATS effluent for
four days.
Continuous-flow setup and subsequent drying at ambient temperatures
After growth in continuous-flow ponds, duckweed biomass was harvested and analyzed for final
pathogenic bacteria concentrations and inactivation rates due to drying at ambient temperatures.
Trends in E. coli and TC concentrations were similar in both harvested L. minor and mixed
duckweed over a three-day drying time at 32C. At the beginning of day-1, E. coli and TC
concentrations were too numerous to count (TNTC) although estimated to be 108 and 1010
CFU/g, respectively. It is important to note the large inactivation observed within the first 24
hours, followed by an exponential regrowth in the following 48 hours. After the first 24-hour
drying period a 5-log E. coli inactivation and a 6.5-log TC inactivation was observed followed
by a 1-log E. coli regrowth and a 1.5-log TC regrowth over the next two days (Figure 9 and
Table 1).
Figure 9: log inactivation and re-growth of E. coli and TC
in duckweed biomass when dried at 32C.
5.005.506.006.507.007.508.00
Lo
g(M
PN
/g)
TC E. coli
2
4
6
8
10
1 2 3 4
log(E
. co
li)
(CF
U/g
)
Day
2
4
6
8
10
1 2 3 4
log(TC)(CFU
/g)
Day

11
Table 1: Daily E. coli and TC concentrations in harvested L. minor and mixed duckweed after
drying at 32C
Day 1 Day 2 Day 3 Day 4
L. minor
(CFU/g) E. coli 1.00E+08 1.30E+03 2.53E+03 1.55E+04
TC 1.00E+10 2.23E+03 5.00E+03 6.07E+04
Mixed
(CFU/g) E. coli 1.00E+08 1.83E+03 3.87E+03 1.16E+04
TC 1.00E+10 3.20E+03 7.80E+03 6.48E+04
3.2 Water quality and microbial analysis of treated effluent
Batch setup
A batch setup was used as shown in figure 1 to determine the changes in TC and E. coli
pathogenic indicator bacteria in treated water, and any changes in water quality due to the
presence of duckweed. Water added daily to each container to counter evapotranspiration did
maintain steady water levels throughout the experiment. On the coolest day with a temperature
of 12.7C, 64(±12) mL, 87(±23) mL, and 44(±6) mL was lost due to evapotranspiration in L.
minor, mixed, and control ponds, respectively. The largest losses due to evapotranspiration
occurred between day 2 and 3 with a temperature of 14.2C; 110(±17) mL, 110(±17) mL, and
107(±21) mL were lost in L. minor, mixed, and control ponds respectively.
Physical and chemical constituents of treated effluent in batch ponds (Figure 8)
The pH of each duckweed container increased from 7.18(±0.02) on day 1 to a maximum between
day 3 and 4 of 7.88(±0.01), 7.85(±0.02), and 8.21(±0.01) for L. minor, mixed, and control ponds
respectively. It is important to note that after day 1, pH readings of the control were consistently
higher than both L. minor and mixed containers. Measurements of water temperature mirrored
the trends of daily ambient temperatures. Ambient temperatures as well as temperatures of bins
ranged from 12.6(±0.2) to 21.8(±0.1)C with standard deviations of ±0.1, 0.2, 0.2, and 0.4 for
days 1-4, respectively.
Turbidity rose in the first 24 hours of the experiment, but fell drastically in the following days. It
is important to note that day 2 readings were higher in both duckweed ponds than in the control.
Readings dropped from 215(±13) to 38(±2) NTU in L. minor containers, 228(±14) to 107(±11)
NTU in mixed containers, and 211(±14) to 125(±4) NTU in control ponds.
Dissolved oxygen concentrations were high due to improper calibration of the DO meter.
However, for comparison only within this study, we report the changes in DO for the different
experiments. We observed sporadic DO concentrations throughout the experiment, ranging
between 17.9(±0.2) – 23.2(±0.3) mg/L for L. minor containers, 18.2(±0.1) – 23.4(±0.2) mg/L for
mixed containers, and 17.2(±0.3) – 22.5(±0.1) mg/L. Although they varied throughout the
experiment, readings were higher at the end of the experiment than at the beginning. DO
concentrations were consistently higher in L. minor ponds after the second day of the
experiment.

12
Electrical conductivity readings were also sporadic, but followed the same trend for each
container, throughout the experiment, ranging between 845 and 1143 S with standard
deviations of ±16.9, 8.3, 26.9, and 13.6 S for days 1-4 respectively. Conductivity appears to be
negatively correlated to DO concentrations. There was no significant difference in EC among
the different L. minor, mixed, and control containers. Although trends varied throughout the
week, readings were lower at the end of the experiment than at the beginning.
Figure 10: Daily pH, DO, EC, Temperature, Turbidity, and Evapotranspiration
measurements of batch experiment.
Microbial analysis of treated effluent in batch ponds (Figure 9)
Results of replicate experiments show that TC and E. coli were reduced in all duckweed ponds as
well as in the control. The log reduction allows us to clearly see the consistent drop in E. coli
concentrations over the course of the first two days followed by a large reduction in the final 24
hours of the experiment. E. coli concentrations were reduced from 6.8x10⁵(±1.01x10⁵) to
1.61x10⁴(±1.85x10⁴) CFU/100 mL in L. minor containers, 3.63x10⁴(±2.42x10⁴) CFU/100mL in
the mixed containers, and 1.57x10⁵(±6.40x10⁴) CFU/100 mL in control containers. TC
concentrations were reduced from 1.80x10⁶(±1.82x10⁵) CFU/100 mL to 5.24x10⁴(1.84x10⁴)
CFU/100 mL in L. minor containers, 1.01x10⁵(±3.49x10⁴) CFU/100 mL in mixed containers,
and 2.78x10⁵(±8.47x10⁴) CFU/100 mL in control containers. It is important to note that the final
reduction in TC and E. coli was lower in control containers than in containers with duckweed.
6.9
7.2
7.5
7.8
8.1
8.4
1 2 3 4
pH
16
18
20
22
24
26
1 2 3 4
DO
(m
g/L
)
800
900
1000
1100
1200
1 2 3 4
EC
(µ
S)
12
17
22
27
1 2 3 4Te
mp
era
ture
(°C
)
Day
Lemna
Mix
Control
0
50
100
150
200
250
1 2 3 4Tu
rbid
ity (
FA
U)
Day
0
50
100
150
200
1 2 3 4V
ol (m
L)
Day
LemnaMixControl

13
Figure 11: Inactivation of E. coli and TC over a four-day batch experiment
determined with spread plate method
For the same experiments described above, results for initial and final IDEXX Colilert
enumeration technique were compared with those of the spread plate method. Colilert results
had an order of magnitude higher for both initial TC and E. coli (Figure 10) than the spread plate
method (Figure 9). Results indicated higher initial pathogen counts, suggesting that initial TC
and E. coli counts were 1.38x10⁷(±1.17x10⁷) and 3.16x10⁶(±4.63x10⁵), respectively in AF2
effluent. The Colilert method also suggested that TC and E. coli counts increased in the L. minor
containers over the 3-day residence time to 1.31x10⁸(±3.62x10⁷) and 5.86x10⁷(±4.69x10⁶)
MPN/100 mL, respectively. Meanwhile, TC and E. coli counts decreased in mixed and control
containers. TC and E. coli counts decreased to 6.06x10⁵(±4.91x10⁵) and 2.42x10⁵(±2.16x10⁵)
MPN/100 mL, respectively in mixed containers, and 1.92x10⁶(±1.35x10⁶) and
4.28x10⁵(±3.88x10⁵) MPN/100mL in controls. It is important to note the high standard
deviations in the results of this method (Figure 10).
1.00E+04
2.60E+05
5.10E+05
7.60E+05
1 2 3 4
E.
co
li(C
FU
/10
0m
L)
1.00E+04
5.10E+05
1.01E+06
1.51E+06
1 2 3 4
TC
(C
FU
/100
mL
)
Day
4.00
4.50
5.00
5.50
6.00
6.50
1 2 3 4
log
(E.
co
li)
4.00
4.50
5.00
5.50
6.00
6.50
1 2 3 4
log
(TC
)
Day
Lemna
Mix
Control

14
Figure 12: E. coli and TC concentrations in DEWATS
effluent determined at the beginning and end of the four-
day batch experiment determined with IDEXX Colilert
method for comparison with spread plate method
Continuous-flow setup
A continuous-flow setup was used as shown in figure 5 to determine the changes in TC and E.
coli pathogenic indicator bacteria in ABR-AF system effluent, and any changes in water quality
due to the presence of duckweed. Each trial is indicated by influent reservoir (IR) 1-4, signifying
that the influent reservoir was refilled to attain benchmark for initial water quality and microbial
analyses.
Physical and chemical constituents
The initial pH of the influent reservoir in each trial was 7.07(±0.02). In each trial pH increased
more in the control than did in duckweed ponds. pH rose to 7.78(±0.06), 7.77(±0.05), and
7.94(±0.08) in L. minor, Mixed, and Control duckweed ponds (Figure 12). There was no
significant difference in temperature between duckweed ponds at each sampling time (Figure
12).
In each trial, DO rose after treatment in each pond and the control. In trial 1 DO rose from
27.2(±0.1) mg/L in the influent reservoir to 31.0(±2.6), 31.0(±3.0), and 30.2(±0.9) mg/L in L.
minor, mixed, and control duckweed ponds respectively. In trial 2, DO rose from 26.7(±0.3)
mg/L in the influent reservoir to 29.6(±0.3), 29.5(±0.3), and 30.2(±0.5) mg/L in L. minor, mixed,
and control duckweed ponds respectively. In trial 3 DO rose from 27.8(±0.2) mg/L in the
influent reservoir to 32.8(±0.6), 31.5(±0.1), and 34.0(±0.6) mg/L in L. minor, mixed, and control
duckweed ponds respectively. Lastly, in trial 4 Do rose from 27.9(±0.1) mg/L in the influent
reservoir to 31.5(±0.5), 31.0(±0.6), and 31.6(±0.8) mg/L in L. minor, mixed, and control
duckweed ponds respectively (Figure 12).
In trial 1, EC dropped from 1143(±2) S/cm in the influent reservoir to 1062(±25), 1043(±68),
and 1025(±19) S in L. minor, mixed, and control duckweed ponds respectively. In trial 2, EC
rose from 1142(±1) S in the influent reservoir to 1151(±7), 1184(±10), and 1115(±49) S in L.
minor, mixed, and control duckweed ponds respectively. In trial 3, EC dropped from 1047(±1)
S in the influent reservoir to 981(±22), 994(±30), and 971(±23) S in L. minor, mixed, and
control duckweed ponds respectively. Finally, in trial 4, EC rose from 1058(±1) S in the
0
2
4
6
8
10
Lo
g(M
PN
/10
0m
L)
TC E. coli

15
influent reservoir to 1086(±14), 1083(±4), and 1084(±1) S in L. minor, mixed, and control
duckweed ponds respectively (Figure 3.3).
Turbidity results suggest that there was an increase in treatment efficiency throughout this
experiment. In all four trials, ponds containing duckweed showed a decrease in turbidity over
time compared to the controls. The first two trials resulted in an effluent turbidity of 76(±4) and
73(±4) NTU for L. minor duckweed ponds, 88(±3) and 82(±3) NTU for mixed duckweed ponds,
and 144(±3) and 145(±3) NTU for control ponds respectively. The second two trials resulted in
an even lower effluent turbidity of 54(±5) and 54(±4) NTU for L. minor duckweed ponds, 57(±2)
and 59(±1) NTU for mixed ponds, compared to 120(±3) and 125(±4) NTU for control ponds,
respectively (Figure 3.3).
Figure 13: Water quality parameters taken from each influent reservoir, and from each effluent
reservoir after the 2-day HRT was reached under continuous flow conditions.
Microbial analysis of treated effluent
An increase in pond treatment efficiency was observed over the course of three trials conducted
over two days. Reductions of pathogenic bacteria ranged from 45-62 E. coli reduction and 24-
66% TC reduction in L. minor ponds, 0-47% E. coli reduction and -71-52% TC reduction in
mixed ponds, and -22-38% E. coli reduction and -61-51% TC reduction in control ponds (Figure
13).
7.007.207.407.607.808.008.20
pH
25
27
29
31
33
35D
O (
mg
/L)
500600700800900
100011001200
IR1
IR2
IR3
IR4
EC
(µ
S/c
m)
Influent
MixEffluent
LemnaEffluent
20
23
25
28
30
IR1
IR2
IR3
IR4
Te
mp
(°C
)
40
90
140
190
240
IR1
IR2
IR3
IR4Tu
rbid
ity (
FA
U)

16
Figure 14: Changes in concentrations of indicator bacteria, E. coli, and TC in influent and in
effluent after 2-day residence time in a continuous flow-setup.
3.3 Duckweed growth
In both batch and continuous-flow setups, a negative growth rate was recorded.
Growth rate kinetics – Batch setup
In batch experiments, 30.028(±0.007) g L. minor and 30.032(±0.023) g mixed duckweed were
added into each container to achieve a 500 g/m2 surface area density. The final biomass was
recorded to be 29.817(±1.949) g for L. minor and 29.396(±3.614) g for mixed duckweed. This
resulted in a -0.211(±1.942) g decrease in L. minor biomass, and a -0.636(±3.592) g decrease in
mixed duckweed.
Growth rate kinetics – Continuous-flow setup
In continuous-flow experiments, 111 g L. minor and mixed duckweed was added to each pond to
achieve a 600 g/m2 surface area density. The final biomass was recorded to be 81.326 g L. minor
and 94.583 g mixed duckweed. This resulted in a -29.674 g decrease in L. minor biomass, and a
-16.417 g decrease in mixed duckweed biomass.
4. Discussion
4.1 Microbial analysis of duckweed biomass
Results from initial L. minor and mixed duckweed should be interpreted with caution because
bacterial enumeration requires destructive sampling of the biomass. Additionally, there was not
enough biomass to conduct replicate analyses of initial samples, although final biomass was
destructively sampled and analyzed in triplicate.
0.00E+00
2.00E+06
4.00E+06
6.00E+06
E.
co
li C
FU
/10
0m
L
-25-10
520355065
% R
ed
uctio
n
of
E.
co
li
1.00E+06
4.00E+06
7.00E+06
1.00E+07
1.30E+07
1.60E+07
Trial 1 Trial 2 Trial 3
TC
(CF
U/1
00
mL
Influent Mix Effluent
Lemna Effluent Control Effluent
-75-55-35-15
5254565
Trial 1 Trial 2 Trial 3% R
ed
uctio
n o
f T
C
Mix Lemna Control

17
Microbial analysis of duckweed biomass grown in
After treatment of ABR-AF system effluent in both batch containers and continuous-flow ponds,
duckweed contained high concentrations of E. coli and TC fecal indicator bacteria adsorbed to
the biomass surface and within the cell tissue. It was expected that the concentration of fecal
indicator bacteria would reach a consistent concentration in the duckweed biomass when grown
in treated wastewater. This was observed by the similar initial and final E. coli and TC
concentrations in the L. minor biomass (Figure 8) after treatment in batch containers filled with
ABR-AF system effluent. However, a decrease in E. coli and TC fecal indicator bacteria in
mixed duckweed biomass was observed in batch containers. Because the mixed duckweed was
not as thoroughly rinsed in the sieving process as L. minor, it is expected that excess fecal
indicator bacteria located on the damp mixed biomass may have washed off when added into the
ABR-AF system effluent, resulting in lower E. coli and TC counts in the final mixed biomass.
Microbial analysis of duckweed dried at ambient temperatures
Reductions of E. coli and TC fecal indicator bacteria were similar both in harvested L. minor and
mixed duckweed when dried at 32C for a four-day period. The initial decrease in E. coli and
TC in both L. minor and mixed duckweed biomass is consistent with the results of Mondini et al.
(2002), who found a similar response of microbial biomass to air-drying. In this study, Mondini
et al. explained that after an initial period of microbial die-off, regrowth of both E. coli and TC
would occur, suggesting that surviving pathogenic bacteria were re-growing. This phenomenon
was also described in other studies (Bottner, 1985; Shen et al., 1987) and attributed to the
phenomenon that after initial die-off nutrients and organic matter become more readily available
to surviving microorganisms.
Microbial analysis of wastewater in batch and continuous flow experimental setups
Results reported in Figures 9 and 13 suggest greater inactivation of TC and E. coli fecal indicator
bacteria occurred within L. minor and mixed duckweed ponds than in the control containers in
both batch and continuous flow setups. The mechanisms by which these fecal indicator bacteria
are removed in both batch containers and continuous-flow ponds are explained in reviews by
Maynard et al., 1999 and Davies-Colley et al., 2000. These reviews suggest that temperature,
starvation, and interactions of sunlight with pH and oxygen radicals, predation, and
sedimentation have a significant role in the removal of fecal coliforms. The oxygen around the
root zone of the duckweed may react with UV-light, producing oxygen radicals (Maynard et al.,
1999), thereby inactivating pathogens nearby. This indicates that adsorption and oxidation due to
the presence of duckweed may have a greater effect on the removal of pathogens present in
ABR-AF system effluent. Additionally, studies by Reed and Crites (1984) and Reed et al.
(1988) suggest that pathogenic organisms and viruses retained in root zone beds through sorption
and filtration mechanisms may be destroyed by die-off and predation.
An initial increase in TC and E. coli was observed in the first trial of the continuous flow
experimental setup (Figure 13). This may be a result of the initial transfer of pathogens that had
already been adsorbed to the surface of the Leman minor and mixed duckweed.
These lab-scale experimental setups were only operable for three days. Although the duckweed
species were each grown in ABR-AF system effluent for a three-day period prior to

18
experimentation to allow the duckweed to acclimate to new growing conditions, variance in
water quality between the acclimation pond and batch and continuous-flow setups likely affected
the growth rate of duckweed present in each pond. Different results would likely be observed in
a system in which the duckweed is already acclimated to its growing conditions when the
experiment begins. A high growth rate would signify that the duckweed has acclimated to its
growing conditions.
4.2 Water quality analysis
No identifiable trends in water quality parameters measured were influenced by volumes lost due
to evapotranspiration. It was expected that evapotranspiration rates would be up to four times
higher in containers with duckweed as reported by Sasse (1998).
The changes in water quality of this study were consistent with previous studies that found an
increase in pH in duckweed ponds. Nasr et al. (2008) reported a pH rise from 7.2 in the ABR to
8.5 in the pond effluent due to photosynthetic activity. Similarly, the pH in our study rose from
7.18(±0.02) to 7.88(±0.01). However, the pH in control ponds (without photosynthetic activity),
experienced a higher increase in our study, 8.21(±0.01), which indicates the increase may be due
to other factors.
Although DO measurements were high due to calibration errors, the trend in DO showed that DO
rose in all experimental setups. A potential explanation is given in a study done by Korner et al.
(2003), that duckweed may provide additional surface are for microbial growth, oxygenating the
water.
EC readings depended largely on the ambient temperature in both batch and continuous-flow
experiments. A large decrease in EC was observed on the second day of the batch experiment,
which can be attributed to the lower ambient temperature that day.
It is not expected that duckweed ponds with duckweed present on them had any effect on the
overall temperature of the pond. The temperature of each pond was greatly affected by changing
ambient temperatures.
Turbidity decreased in all duckweed ponds in both the batch and continuous flow setups.
Because the batch setup was thoroughly mixed each time before samples were taken
sedimentation is not expected to have any effect on turbidity reduction in the batch setup.
However, in the continuous flow setup the reduction in turbidity is expected to be due partially to
sedimentation because mixing was not considered to be a significant factor. In the continuous
flow setup, the greater reduction in L. minor and mixed duckweed ponds is due to the adsorption
of pathogenic bacteria to the fronds and root structures of suspended. In a study by Scolavino et
al. (2016) turbidity reductions were reported as high as 96% when duckweed flourished in
Scolavino’s experiment. Although, duckweed may have an important influence on turbidity
reductions, that role may have been less apparent in this experiment due to the lower growth of
duckweed.
Indeed, in both continuous flow and batch experimental setups, negative biomass growth was
observed. This may be due to the lack of ideal growing conditions. Although the duckweed

19
acclimated to AF2 effluent for at least three days prior to experimentation, little growth was
observed. The negative biomass accumulation may be due to the decay of dead fronds into the
wastewater or the lack of time necessary to establish growth.
5. Conclusion
Duckweed was found to produce greater log reductions of pathogenic bacteria from ABR-AF
system effluent wastewater in both batch and continuous-flow systems. After treatment in ABR-
AF system effluent, duckweed biomass contained pathogenic bacteria in significant quantities.
After duckweed was harvested from a pond and laid out to dry in ambient temperatures,
pathogenic bacteria that may have been internalized on the biomass or adsorbed to the plant
surface itself, experienced an initial die-off as low as 2.23x10³ CFU/g, but regrew to
concentrations as high as 6.48x10⁴ CFU/g 48 hours later.
With this knowledge, duckweed may be used in the future as a polishing treatment for ABR-AF
system effluent to reduce pathogenic bacteria concentrations. Additionally, it is now known that
there is a health risk associated with the reuse of duckweed that is grown in ABR-AF system
effluent as a green fertilizer or feed stock. Using duckweed grown in ABR-AF system effluent
as a green fertilizer presents a health risk to the consumer if there is any possibility that
pathogens may be transmitted into the crop. Duckweed grown in DEWATS effluent may also
present a risk to animals when used as a stock feed. With drying times of only 4 days, non-
treated duckweed grown in ABR-AF system effluent should only be used as a green fertilizer for
crops not intended for human consumption. Finally, it has been shown that pathogen
concentrations are significantly reduced after 24 hours of drying at ambient temperatures.
However, surviving bacteria grow back with widely available substrate. Further studies must be
conducted to assess the reduction of fecal indicator bacteria due to extended drying times at
ambient temperatures and the potential of transmission of pathogens from duckweed into crops
for human consumption.to infect agricultural animals.
6. Recommendations
It would be beneficial to conduct this experiment with a system that has allowed proper time for
the duckweed to acclimate to its growing conditions. With ideal growth rates, the effects that
duckweed has on ABR-AF system effluent will be clearly. Additionally, conducting
experiments on larger systems will mitigate the error that comes with minor biomass losses, and
prevent large daily temperature fluctuations. Lastly, it is recommended that thorough rinsing of
both mixed and L. minor duckweed be conducted before experimentation to prevent the
transmission of excess fecal indicator bacteria into the system.
Future studies will be necessary to assess the reduction of fecal indicator bacteria due to the
drying of duckweed over a longer span of time at ambient temperatures. The duckweed-drying
experiment in this study took place over a four-day period. It will be beneficial to observe the
trends that occur after two weeks to a month of drying time. Perhaps fecal indicator bacteria will
die off as the moisture content of the biomass continues to deplete.

20
References
Ansa, E.D.O. & Awuah, Esi & Andoh, Anthonia & Banu, Regina & H.K. Dorgbetor, W & J.
Lubberding, H & Gijzen, Huub. (2015). A Review of the Mechanisms of Faecal Coliform
Removal from Algal and Duckweed Waste Stabilization Pond Systems. American
Journal of Environmental Sciences. 11. 28-34. 10.3844/ajessp.2015.28.34.
Bottner, P. Response of microbial biomass to alternate moist and dry conditions in a soil
incubated with C- and N-labelled plant material, Soil Biology and Biochemistry, 17(3),
329 - 337, 1985.
Collivignarelli, G., Farneti, A., Bassetti, A., Barbaresi, U. Anaerobic–aerobic treatment of
municipal wastewaters with full-scale UASB and attaches biofilm reactors Water
SciTechnol, 22(1/2), 475 – 482, 1990.
Conley, L. M., Dick, R. I., Lion, L.W. An assessment of the root zone method of wastewater
treatment, J Water Pollt Con Fed, 63, 239 – 247, 1991.
Davies-Colley, R. J., Donnison, A. M., and Speed, D. J., Towards a mechanistic understanding
of pond disinfection, Water Sci. Technol, 42, 149 – 158, 2000.
El-Shafai SA, El-Gohary FA, Nasr FA, Van der steem P, Gijzen H (2007) Nutrient recovery
from domestic wastewater using a UASB-duckweed ponds system. Bioresour Technol
98:798–807. doi:10.1016/j.biortech.2006.03.011
Goopy, J. P., Murray, P. J. A Review on the Role of Duckweed in Nutrient Reclamation and as
Source of Animal Feed, Asian-Australasian Journal of Animal Science, 16, 297 – 305,
2003.
Hirneisen, K., Sharma, M., & Kniel, K. (2012). Human enteric pathogen internalization by root
uptake into food crops. Foodborne Pathogens and Disease, 9(5), 396-405.
Korner, S., Vermaat, J. E., Veenstra, S. The capacity of duckweed to treat waste- Water:
ecological considerations for a sound design, J. Environ. Qual, 32(5), 1583 – 1590, 2003.
MacIntyre, M.E., B.G. Warner and R.M. Slawson, 2006. Escherichia coli control in a surface
flow treatment wetland. J. Water Health, 4: 211-214. PMID: 16813013
Maynard, H. E., Ouki, S.K., Williams, S.C. Tertiary lagoons: A review of removal mechanisms
and performance, Water Res., 33, 1 – 13, 1999.
Mondini, C., Contin, M., Leita, L., De Nobili, M. Response of microbial biomass to air-drying
and rewetting in soils and compost, Geoderma, 105(1), 111 – 124, 2002.
Nasr, F., Doma, H., Nassar, H. Treatment of Domestic Wastewater using an Anaerobic Baffled
Reactor Followed by a Duckweed Pond for Agricultural Purposes, Environmentalist,
29(3), 270 - 279, 2008
Reed, S. C., Crites, R. W. Handbook of Land Treatment Systems for Industrial and Municipal
Wastes, Noyes Pub., Park Ridge, N. J., 1984.
Reed, S. C, et al., Natural Systems for Waste Management and Treatment, McGraw-Hill, New
York, N. Y., 1998.
Scolavino, J., Duckweed and Wastewater Analysis, 2017.
Shen, S.M., Brookes, P.C., Jenkinson, D. S. Soil respiration and the measurement of microbial
biomass C by the fumigation technique in fresh and in air dried soil, Soil Biol. Biochem,
19, 153 - 158, 1987.

21
Appendix
6.1 Methods
6.1.1 Spread plate method with 3M Petrifilms
• 25 mL of sample was vortexed until thoroughly mixed.
• A 10-2 dilution was prepared by serial 1:10 dilutions in sterile falcon tubes.
• 1mL of each 10-2 dilution was pipetted onto labeled 3M petrifilms
• Petrifilms were incubated at 35°C for 24 hours.
• Colonies were counted and recorded in units of CFU/100mL
6.1.2 Spread plate method with Brilliance E. coli/Coliform selective agar
• 25mL of sample was vortexed until thoroughly mixed
• A 10-2 dilution was achieved by serial dilution
• 100µL was pipetted onto each petri dish and spread plate method was conducted
• Incubate at 35°C for 24 hours
• Colonies counted and recorded in units of CFU/100mL
6.1.3 IDEXX Colilert-18
• Add IDEXX Colilert-18 pillow packet to 100mL sample in sterile container
• Cap and stir thoroughly until dissolved
• Pour sample/reagent mixture into a Quanti-Tray* or Quanti-Tray*/2000 and seal in an
IDEXX Quanti-Tray* Sealer.
• Incubate sealed tray at 35°C for 18 hours.
• Read results according to IDEXX interpretation table:
Table 2: IDEXX Colilert-18 Interpretation Guide
6.2 Water Quality Analysis
Table 7.2.1: Daily water quality parameters – Batch Setup
Parameters: 7/17/17 11:00 AM
L. pH DO (mg/L) EC(uS) Temp (°C) Evap. Vol. (mL) Turbidity (FAU)
1 7.17 17.7 1105 21.7 0 201
2 7.18 17.8 1145 22.1 0 224
3 7.18 18.1 1140 21.8 0 221

22
Avg 7.18 17.9 1130 21.9 0 215
Std Dev. 0.01 0.2 22 0.2 0 13
Mix pH DO (mg/L) EC(uS) Temp (°C) Evap. Vol. (mL) Turbidity (FAU)
1 7.20 18.1 1146 21.8 0 243
2 7.20 18.2 1142 21.7 0 224
3 7.19 18.3 1116 21.4 0 216
Avg 7.20 18.2 1135 21.6 0 228
Std Dev. 0.01 0.1 16 0.2 0 14
Control pH DO (mg/L) EC(uS) Temp (°C) Evap. Vol. (mL) Turbidity (FAU)
1 7.17 17.5 1135 21.8 0 199
2 7.16 17.2 1119 21.8 0 208
3 7.14 16.9 1105 21.7 0 226
Avg 7.16 17.2 1120 21.8 0 211
Std Dev. 0.02 0.3 15 0.1 0 14
Parameters: 7/18/17 10:00 AM
L. pH DO (mg/L) EC(uS) Temp (°C) Evap. Vol. (mL) Turbidity (FAU)
1 7.68 22.9 848 12.5 50 233
2 7.67 23.4 846 12.6 70 234
3 7.65 23.4 848 12.6 70 244
Avg 7.67 23.2 847 12.6 63 237
Std Dev. 0.02 0.3 1 0.1 12 6
Mix pH DO (mg/L) EC(uS) Temp (°C) Evap. Vol. (mL) Turbidity (FAU)
1 7.61 23.5 847 12.6 60 246
2 7.64 23.4 844 12.4 100 237
3 7.65 23.2 844 12.5 100 232
Avg 7.63 23.4 845 12.5 87 238
Std Dev. 0.02 0.2 2 0.1 23 7
Control pH DO (mg/L) EC(uS) Temp (°C) Evap. Vol. (mL) Turbidity (FAU)
1 7.89 22.5 856 12.9 41 205
2 7.91 22.5 858 12.8 50 186
3 7.96 22.6 869 12.7 40 181
Avg 7.92 22.5 861 12.8 44 191
Std Dev. 0.04 0.1 7 0.1 6 13
Parameters: 7/19/17 11:00 AM
L. pH DO (mg/L) EC(uS) Temp (°C) Evap. Vol. (mL) Turbidity (FAU)
1 7.89 19.3 1109 14.2 130 111
2 7.90 19.9 1105 14.1 100 128
3 7.86 20.1 1102 14.1 100 93
Avg 7.88 19.8 1105 14.1 110 111
Std Dev. 0.02 0.4 4 0.1 17 18
Mix pH DO (mg/L) EC(uS) Temp (°C) Evap. Vol. (mL) Turbidity (FAU)

23
1 7.81 21.7 1109 14.0 100 133
2 7.83 22.1 1080 14.0 130 136
3 7.85 22.1 1089 14.2 100 179
Avg 7.83 22.0 1093 14.1 110 149
Std Dev. 0.02 0.2 15 0.1 17 26
Control pH DO (mg/L) EC(uS) Temp (°C) Evap. Vol. (mL) Turbidity (FAU)
1 8.18 19.2 1132 14.8 100 182
2 8.20 19.4 1127 14.5 130 156
3 8.18 19.5 1171 14.2 90 160
Avg 8.19 19.4 1143 14.5 107 166
Std Dev. 0.01 0.2 24 0.3 21 14
Parameters: 7/20/17 10:00 AM
L. pH DO (mg/L) EC(uS) Temp (°C) Evap. Vol. (mL) Turbidity (FAU)
1 7.87 20.7 1057 15.8 60 38
2 7.89 21.0 1048 16.0 100 37
3 7.87 21.4 1056 15.9 60 41
Avg 7.88 21.0 1054 15.9 73 39
Std Dev. 0.01 0.4 5 0.1 23 2
Mix pH DO (mg/L) EC(uS) Temp (°C) Evap. Vol. (mL) Turbidity (FAU)
1 7.83 22.5 1050 15.8 60 107
2 7.85 23.5 1044 15.6 60 97
3 7.86 23.9 1031 15.9 80 118
Avg 7.85 23.3 1042 15.8 67 107
Std Dev. 0.02 0.7 10 0.2 12 11
Control pH DO (mg/L) EC(uS) Temp (°C) Evap. Vol. (mL) Turbidity (FAU)
1 8.22 20.8 1030 16.7 120 128
2 8.22 21.3 1016 16.5 170 121
3 8.20 21.2 1037 16.4 180 126
Avg 8.21 21.1 1028 16.5 157 125
Std Dev. 0.01 0.3 11 0.2 32 4
Table 7.2.2: Water quality analysis from Influent reservoir (influent reservoir) – continuous flow
setup
IR1_7.31.17
10:45 AM
Sample pH DO (mg/L)
EC
(µS) Temp (°C) Turbidity (FAU)
A 7.08 27.3 1141 22.8 254
B 7.09 27.1 1144 22.8 254
C 7.09 27.1 1145 22.8 260
Avg 7.09 27.2 1143 22.8 256

24
Std Dev. 0.01 0.12 2 0.0 3
IR2_7.31.17
13:00:00 PM
Sample pH DO (mg/L)
EC
(µS) Temp (°C) Turbidity (FAU)
A 7.07 27.0 1142 23.0 179
B 7.07 26.4 1142 23.0 176
C 7.07 26.7 1143 23.0 182
Avg 7.07 26.7 1142 23.0 179
Std Dev. 0.00 0.3 1 0.0 3
IR3_8.01.17
10:00 AM
Sample pH DO (mg/L)
EC
(µS) Temp (°C) Turbidity (FAU)
A 7.08 27.6 1046 22.8 176
B 7.06 27.9 1047 22.8 181
C 7.07 27.9 1047 22.8 177
Avg 7.07 27.8 1047 22.8 178
Std Dev. 0.01 0.2 1 0.0 3
IR4_8.01.17
13:00:00 PM
Sample pH DO (mg/L)
EC
(µS) Temp (°C) Turbidity (FAU)
A 7.04 28.0 1057 23.5 232
B 7.05 27.9 1059 23.5 228
C 7.05 27.9 1059 23.5 234
Avg 7.05 27.9 1058 23.5 231
Std Dev. 0.01 0.1 1 0.0 3
Table 7.2.3: Trial 1&2 water quality analysis – continuous flow setup
pond_Eff_IR1_8.02.17
10:30 AM
pH
DO
(mg/L)
EC
(µS)
Temp
(°C)
Turbidity
(FAU)
Mix 7.81 28.3 971 22.7 85
L. 7.77 28.8 1034 22.8 75
Control 8.04 29.2 1005 23.0 145
11:00 AM
pH
DO
(mg/L)
EC
(µS)
Temp
(°C)
Turbidity
(FAU)
Mix 7.70 34.2 1051 23.9 88

25
L. 7.74 33.9 1082 24.6 73
Control 7.93 30.9 1027 24.8 141
11:30 AM
pH
DO
(mg/L)
EC
(µS)
Temp
(°C)
Turbidity
(FAU)
Mix 7.74 30.4 1107 26.3 90
L. 7.75 30.4 1070 25.0 80
Control 7.96 30.5 1043 25.6 146
Mix
avg 7.75 31.0 1043 24.3 88
std dev 0.06 3.0 68 1.8 3
L.
avg 7.75 31.0 1062 24.1 76
std dev 0.02 2.6 25 1.2 4
Control
avg 7.98 30.2 1025 24.5 144
std dev 0.06 0.9 19 1.3 3
pond_Eff_IR2_8.02.17
12:40
PM pH
DO
(mg/L)
EC
(µS)
Temp
(°C)
Turbidity
(FAU)
Mix 7.67 29.2 1195 30.0 80
L. 7.72 29.3 1154 28.5 73
Control 7.94 29.7 1063 28.8 143
1:10 PM
Mix 7.74 29.7 1175 29.4 85
L. 7.68 29.8 1155 28.0 76
Control 7.93 30.6 1160 29.2 145
1:40 PM
Mix 7.79 29.7 1182 29.3 80
L. 7.84 29.8 1143 27.5 69
Control 8.01 30.3 1121 29.0 148
Mix
avg 7.73 29.5 1184 29.6 82
std dev 0.06 0.3 10 0.4 3
L.
avg 7.75 29.6 1151 28.0 73
std dev 0.08 0.3 7 0.5 4
Control
avg 7.96 30.2 1115 29.0 145
std dev 0.04 0.5 49 0.2 3
26
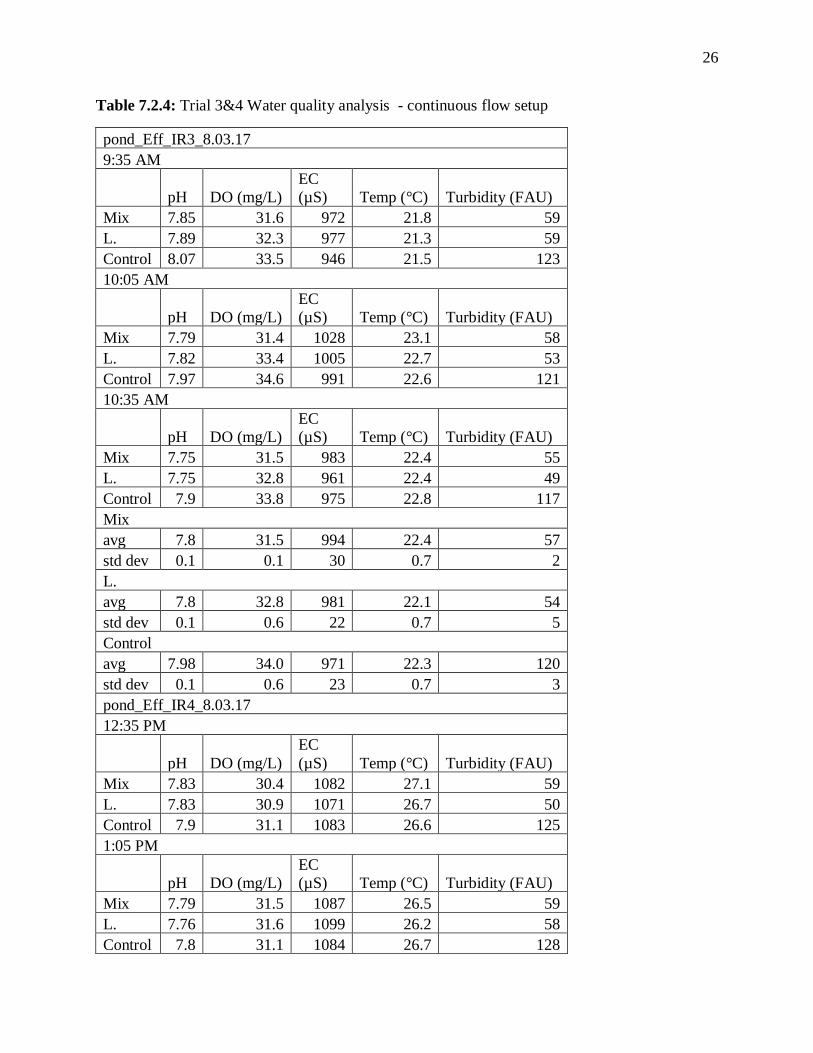
Table 7.2.4: Trial 3&4 Water quality analysis - continuous flow setup
pond_Eff_IR3_8.03.17
9:35 AM
pH DO (mg/L)
EC
(µS) Temp (°C) Turbidity (FAU)
Mix 7.85 31.6 972 21.8 59
L. 7.89 32.3 977 21.3 59
Control 8.07 33.5 946 21.5 123
10:05 AM
pH DO (mg/L)
EC
(µS) Temp (°C) Turbidity (FAU)
Mix 7.79 31.4 1028 23.1 58
L. 7.82 33.4 1005 22.7 53
Control 7.97 34.6 991 22.6 121
10:35 AM
pH DO (mg/L)
EC
(µS) Temp (°C) Turbidity (FAU)
Mix 7.75 31.5 983 22.4 55
L. 7.75 32.8 961 22.4 49
Control 7.9 33.8 975 22.8 117
Mix
avg 7.8 31.5 994 22.4 57
std dev 0.1 0.1 30 0.7 2
L.
avg 7.8 32.8 981 22.1 54
std dev 0.1 0.6 22 0.7 5
Control
avg 7.98 34.0 971 22.3 120
std dev 0.1 0.6 23 0.7 3
pond_Eff_IR4_8.03.17
12:35 PM
pH DO (mg/L)
EC
(µS) Temp (°C) Turbidity (FAU)
Mix 7.83 30.4 1082 27.1 59
L. 7.83 30.9 1071 26.7 50
Control 7.9 31.1 1083 26.6 125
1:05 PM
pH DO (mg/L)
EC
(µS) Temp (°C) Turbidity (FAU)
Mix 7.79 31.5 1087 26.5 59
L. 7.76 31.6 1099 26.2 58
Control 7.8 31.1 1084 26.7 128

27
1:35 PM
pH DO (mg/L)
EC
(µS) Temp (°C) Turbidity (FAU)
Mix 7.81 31.1 1079 26.6 60
L. 7.78 31.9 1088 26.4 53
Control 7.82 32.5 1085 26.8 121
Mix
avg 7.81 31.0 1083 26.7 59
std dev 0.02 0.6 4 0.3 1
L.
avg 7.79 31.5 1086 26.4 54
std dev 0.0 0.5 14 0.3 4
Control
avg 7.84 31.6 1084 26.7 125
std dev 0.1 0.8 1 0.1 4
6.3 Microbial analysis
Table 7.3.1: Spread plate counts of WW with 3M petrifilms – Batch setup
3M Counts: 7/17/17 11:00 AM (10^-2)
AF2 Red
E.
coli TC
E. coli*P
(CFU/100mL)
TC*P
(CFU/100mL)
log (E.
coli*P)
log
(TC*P)
A 121 70 191 7.00E+05 1.91E+06 5.85 6.28
B 102 57 159 5.70E+05 1.59E+06 5.76 6.20
C 113 77 190 7.70E+05 1.90E+06 5.89 6.28
Avg 112 68 180 6.80E+05 1.80E+06 5.83 6.25
Std
Dev. 10 10 18 1.01E+05 1.82E+05 0.07 0.05
3M Counts: 7/18/17 10:00 AM (10^-2)
L. Red
E.
coli TC
E. coli*P
(CFU/100mL)
TC*P
(CFU/100mL)
log (E.
coli*P)
log
(TC*P)
1 102 57 159 5.70E+05 1.59E+06 5.76 6.20
2 109 66 175 6.60E+05 1.75E+06 5.82 6.24
3 117 59 176 5.90E+05 1.76E+06 5.77 6.25
Avg 109 61 170 6.07E+05 1.70E+06 5.78 6.23
Std
Dev. 8 5 10 4.73E+04 9.54E+04 0.03 0.02
Mix Red
E.
coli TC
E. coli*P
(CFU/100mL)
TC*P
(CFU/100mL)
log (E.
coli*P)
log
(TC*P)
1 120 63 183 6.30E+05 1.83E+06 5.80 6.26
2 91 76 167 7.60E+05 1.67E+06 5.88 6.22
3 82 80 162 8.00E+05 1.62E+06 5.90 6.21

28
Avg 98 73 171 7.30E+05 1.71E+06 5.86 6.23
Std
Dev. 20 9 11 8.89E+04 1.10E+05 0.05 0.03
Control Red
E.
coli TC
E. coli*P
(CFU/100mL)
TC*P
(CFU/100mL)
log (E.
coli*P)
log
(TC*P)
1 58 40 98 4.00E+05 9.80E+05 5.60 5.99
2 68 68 136 6.80E+05 1.36E+06 5.83 6.13
3 56 63 119 6.30E+05 1.19E+06 5.80 6.08
Avg 61 57 118 5.70E+05 1.18E+06 5.74 6.07
Std
Dev. 6 15 19 1.49E+05 1.90E+05 0.12 0.07
3M Counts: 7/19/17 11:00 AM (1:121)
L. Red
E.
coli TC
E. coli*P
(CFU/100mL)
TC*P
(CFU/100mL)
log (E.
coli*P)
log
(TC*P)
1 27 23 50 2.78E+05 6.05E+05 5.44 5.78
2 22 30 52 3.63E+05 6.29E+05 5.56 5.80
3 45 31 76 3.75E+05 9.20E+05 5.57 5.96
Avg 31 28 59 3.39E+05 7.18E+05 5.53 5.85
Std
Dev. 12 4 14 5.27E+04 1.75E+05 0.07 0.10
Mix Red
E.
coli TC
E. coli*P
(CFU/100mL)
TC*P
(CFU/100mL)
log (E.
coli*P)
log
(TC*P)
1 46 43 89 5.20E+05 1.08E+06 5.72 6.03
2 32 35 67 4.24E+05 8.11E+05 5.63 5.91
3 36 43 79 5.20E+05 9.56E+05 5.72 5.98
Avg 38 40 78 4.88E+05 9.48E+05 5.69 5.97
Std
Dev. 7 5 11 5.59E+04 1.33E+05 0.05 0.06
Control Red
E.
coli TC
E. coli*P
(CFU/100mL)
TC*P
(CFU/100mL)
log (E.
coli*P)
log
(TC*P)
1 33 33 66 3.99E+05 7.99E+05 5.60 5.90
2 32 29 61 3.51E+05 7.38E+05 5.55 5.87
3 26 36 62 4.36E+05 7.50E+05 5.64 5.88
Avg 30 33 63 3.95E+05 7.62E+05 5.60 5.88
Std
Dev. 4 4 3 4.25E+04 3.20E+04 0.05 0.02
3M Counts: 7/20/17 10:00 AM (1:121)
L. Red
E.
coli TC
E. coli*P
(CFU/100mL)
TC*P
(CFU/100mL)
log (E.
coli*P)
log
(TC*P)
1 3 3 6 3.63E+04 7.26E+04 4.56 4.86
2 2 1 3 1.21E+04 3.63E+04 4.08 4.56
3 4 0 4 0.00E+00 4.84E+04 0.00 4.68
Avg 3 1 4 1.61E+04 5.24E+04 4.32 4.70

29
Std
Dev. 1 2 2 1.85E+04 1.85E+04 0.34 0.15
Mix Red
E.
coli TC
E. coli*P
(CFU/100mL)
TC*P
(CFU/100mL)
log (E.
coli*P)
log
(TC*P)
1 7 3 10 3.63E+04 1.21E+05 4.56 5.08
2 4 1 5 1.21E+04 6.05E+04 4.08 4.78
3 5 5 10 6.05E+04 1.21E+05 4.78 5.08
Avg 5 3 8 3.63E+04 1.01E+05 4.47 4.98
Std
Dev. 2 2 3 2.42E+04 3.49E+04 0.36 0.17
Control Red
E.
coli TC
E. coli*P
(CFU/100mL)
TC*P
(CFU/100mL)
log (E.
coli*P)
log
(TC*P)
1 11 15 26 1.82E+05 3.15E+05 5.26 5.50
2 11 17 28 2.06E+05 3.39E+05 5.31 5.53
3 8 7 15 8.47E+04 1.82E+05 4.93 5.26
Avg 10 13 23 1.57E+05 2.78E+05 5.17 5.43
Std
Dev. 2 5 7 6.40E+04 8.47E+04 0.21 0.15
Table 7.3.2: IDEXX Colilert MPN of WW – Batch setup
Intial WW IDEXX counts: 7/17/17 11:00 AM
AF2
Lg
Wells
Sm
Wells
Lg Wells
(F)
Sm Wells
(F)
MPN
(TC)
MPN (E.
coli)
Log(MPN
TC)
Log(MPN E.
coli)
A 49 16 25 2 2.73E+07 3.64E+06 7.44 6.56
B 39 2 21 1 7.44E+06 2.79E+06 6.87 6.45
C 34 7 21 3 6.70E+06 3.05E+06 6.83 6.48
Avg 41 8 22 2 1.38E+07 3.16E+06 7.14 6.50
Std
Dev. 8 7 2 1 1.17E+07 4.36E+05 0.34 0.06
Final WW IDEXX counts: 7/20/17 11:00 AM
L.
Lg
Wells
Sm
Wells
Lg Wells
(F)
Sm Wells
(F)
MPN
(TC)
MPN (E.
coli)
Log(MPN
TC)
Log(MPN E.
coli)
A 49 44 49 30 1.57E+08 6.19E+07 8.20 7.79
B 49 39 49 28 1.06E+08 5.53E+07 8.02 7.74
C 0 0 0 0 0.00E+00 0.00E+00 0.00 0.00
Avg 49 42 49 29 1.31E+08 5.86E+07 8.11 7.77
Std
Dev. 0 4 0 1 3.62E+07 4.69E+06 0.12 0.03
Mix
Lg
Wells
Sm
Wells
Lg Wells
(F)
Sm Wells
(F)
MPN
(TC)
MPN (E.
coli)
Log(MPN
TC)
Log(MPN E.
coli)
A 4 1 3 0 6.36E+05 3.13E+05 5.80 5.50
B 1 0 0 0 1.01E+05 0.00E+00 5.00 0.00

30
C 7 3 3 1 1.08E+06 4.14E+05 6.03 5.62
Avg 4 1 2 0 6.06E+05 2.42E+05 5.61 3.70
Std
Dev. 3 2 2 1 4.91E+05 2.16E+05 0.54 3.21
Control
Lg
Wells
Sm
Wells
Lg Wells
(F)
Sm Wells
(F)
MPN
(TC)
MPN (E.
coli)
Log(MPN
TC)
Log(MPN E.
coli)
A 6 1 0 0 7.47E+05 0.00E+00 5.87 0.00
B 22 4 7 0 3.39E+06 7.58E+05 6.53 5.88
C 14 0 5 0 1.63E+06 5.25E+05 6.21 5.72
Avg 14 2 4 0 1.92E+06 4.28E+05 6.21 3.87
Std
Dev. 8 2 4 0 1.35E+06 3.88E+05 0.33 3.35
Table 7.3.3: Initial and final biomass microbial analysis with IDEXX Colilert method – Batch
setup
Initial Biomass IDEXX counts: 7/17/17 11:00 AM
AF2
Lg
Wells
Sm
Wells
Lg Wells
(F)
Sm Wells
(F)
MPN
(TC)
MPN (E.
coli)
Log(MPN
TC)
Log(MPN E.
coli)
L. 34 7 10 4 6.70E+06 1.55E+06 6.83 6.19
Mix 49 38 32 5 9.80E+07 5.73E+06 7.99 6.76
Final Biomass IDEXX counts: 7/20/17 11:00 AM
L.
Lg
Wells
Sm
Wells
Lg Wells
(F)
Sm Wells
(F)
MPN
(TC)
MPN (E.
coli)
Log(MPN
TC)
Log(MPN E.
coli)
A 39 6 8 0 8.36E+06 8.60E+05 6.92 5.93
B 36 5 11 1 6.97E+06 1.34E+06 6.84 6.13
C 23 1 6 0 3.13E+06 6.30E+05 6.50 5.80
Avg 33 4 8 0 6.15E+06 9.43E+05 6.75 5.95
Std Dev. 9 3 3 1 2.71E+06 3.62E+05 0.23 0.16
Mix
Lg
Wells
Sm
Wells
Lg Wells
(F)
Sm Wells
(F)
MPN
(TC)
MPN (E.
coli)
Log(MPN
TC)
Log(MPN E.
coli)
A 31 1 11 1 4.79E+06 1.34E+06 6.68 6.13
B 49 48 3 1 TNTC 4.10E+05 TNTC 5.61
C 27 2 8 1 4.04E+06 9.70E+05 6.61 5.99
Avg 36 17 7 1 4.42E+06 9.07E+05 6.64 5.91
Std Dev. 12 27 4 0 5.30E+05 4.68E+05 0.05 0.27
Table 7.3.4: Spread plate counts of influent reservoir – Continuous flow setup
IR1_7.31.17
10:45 AM
Sample Red E. coli TC
E. coli*P
(CFU/100mL)
TC*P
(CFU/100mL)
log (E.
coli*P)
log
(TC*P)

31
A 10 19 29 1.90E+06 2.90E+06 6.28 6.46
B 8 15 23 1.50E+06 2.30E+06 6.18 6.36
C 9 10 19 1.00E+06 1.90E+06 6.00 6.28
Avg 9 15 24 1.47E+06 2.37E+06 6.15 6.37
Std Dev. 1 5 5 4.51E+05 5.03E+05 0.14 0.09
IR2_7.31.17
13:00:00 PM
Sample Red E. coli TC
E. coli*P
(CFU/100mL)
TC*P
(CFU/100mL)
log (E.
coli*P)
log
(TC*P)
A TNTC TNTC TNTC N/A N/A N/A N/A
B TNTC TNTC TNTC N/A N/A N/A N/A
C TNTC TNTC TNTC N/A N/A N/A N/A
Avg N/A N/A N/A N/A N/A N/A N/A
Std Dev. N/A N/A N/A N/A N/A N/A N/A
IR3_8.01.17
10:00 AM
Sample Red E. coli TC
E. coli*P
(CFU/100mL)
TC*P
(CFU/100mL)
log (E.
coli*P)
log
(TC*P)
A 61 30 91 3.00E+06 9.10E+06 6.48 6.96
B 44 25 69 2.50E+06 6.90E+06 6.40 6.84
C 55 31 86 3.10E+06 8.60E+06 6.49 6.93
Avg 53 29 82 2.87E+06 8.20E+06 6.46 6.91
Std Dev. 9 3 12 3.21E+05 1.15E+06 0.05 0.06
IR4_8.01.17
13:00:00 PM
Sample Red E. coli TC
E. coli*P
(CFU/100mL)
TC*P
(CFU/100mL)
log (E.
coli*P)
log
(TC*P)
A 79 37 116 3.70E+06 1.16E+07 6.57 7.06
B 106 34 140 3.40E+06 1.40E+07 6.53 7.15
C 92 50 142 5.00E+06 1.42E+07 6.70 7.15
Avg 92 40 133 4.03E+06 1.33E+07 6.60 7.12
Std Dev. 14 9 14 8.50E+05 1.45E+06 0.09 0.05
Table 7.3.5: Spread plate counts of pond effluent Trail 1&2 – continuous flow
pond_Eff_IR1_8.02.17
10:30 AM
Mix Red E. coli TC
E. coli*P
(CFU/100mL)
TC*P
(CFU/100mL)
log (E.
coli*P)
log
(TC*P)
A 24 16 40 1.60E+06 4.00E+06 6.20 6.60
B 26 16 42 1.60E+06 4.20E+06 6.20 6.62
C 22 13 35 1.30E+06 3.50E+06 6.11 6.54

32
11:00 AM
Mix Red E. coli TC
E. coli*P
(CFU/100mL)
TC*P
(CFU/100mL)
log (E.
coli*P)
log
(TC*P)
A 21 7 28 7.00E+05 2.80E+06 5.85 6.45
B 14 12 26 1.20E+06 2.60E+06 6.08 6.41
C 30 11 41 1.10E+06 4.10E+06 6.04 6.61
11:30 AM
Mix Red E. coli TC
E. coli*P
(CFU/100mL)
TC*P
(CFU/100mL)
log (E.
coli*P)
log
(TC*P)
A 40 19 59 1.90E+06 5.90E+06 6.28 6.77
B TNTC TNTC TNTC TNTC TNTC TNTC TNTC
C 29 23 52 2.30E+06 5.20E+06 6.36 6.72
Average 26 15 40 1.46E+06 4.04E+06 6.14 6.59
Std. Dev. 8 5 11 4.98E+05 1.12E+06 0.16 0.12
L. Red E. coli TC
E. coli*P
(CFU/100mL)
TC*P
(CFU/100mL)
log (E.
coli*P)
log
(TC*P)
A 7 5 12 5.00E+05 1.20E+06 5.70 6.08
B 7 8 15 8.00E+05 1.50E+06 5.90 6.18
C 8 9 17 9.00E+05 1.70E+06 5.95 6.23
L. Red E. coli TC
E. coli*P
(CFU/100mL)
TC*P
(CFU/100mL)
log (E.
coli*P)
log
(TC*P)
A 7 6 13 6.00E+05 1.30E+06 5.78 6.11
B 12 10 22 1.00E+06 2.20E+06 6.00 6.34
C 11 9 20 9.00E+05 2.00E+06 5.95 6.30
L. Red E. coli TC
E. coli*P
(CFU/100mL)
TC*P
(CFU/100mL)
log (E.
coli*P)
log
(TC*P)
A 9 9 18 9.00E+05 1.80E+06 5.95 6.26
B 17 9 26 9.00E+05 2.60E+06 5.95 6.41
C 11 7 18 7.00E+05 1.80E+06 5.85 6.26
Average 10 8 18 8.00E+05 1.79E+06 5.89 6.24
Std. Dev. 3 2 4 1.66E+05 4.40E+05 0.10 0.11
Control Red E. coli TC
E. coli*P
(CFU/100mL)
TC*P
(CFU/100mL)
log (E.
coli*P)
log
(TC*P)
A 21 12 33 1.20E+06 3.30E+06 6.08 6.52
B 20 17 37 1.70E+06 3.70E+06 6.23 6.57
C 13 9 22 9.00E+05 2.20E+06 5.95 6.34
Control Red E. coli TC
E. coli*P
(CFU/100mL)
TC*P
(CFU/100mL)
log (E.
coli*P)
log
(TC*P)
A 35 27 62 2.70E+06 6.20E+06 6.43 6.79
B 17 22 39 2.20E+06 3.90E+06 6.34 6.59

33
C 28 35 63 3.50E+06 6.30E+06 6.54 6.80
Control Red E. coli TC
E. coli*P
(CFU/100mL)
TC*P
(CFU/100mL)
log (E.
coli*P)
log
(TC*P)
A 17 12 29 1.20E+06 2.90E+06 6.08 6.46
B 15 15 30 1.50E+06 3.00E+06 6.18 6.48
C 15 12 27 1.20E+06 2.70E+06 6.08 6.43
Average 20 18 38 1.79E+06 3.80E+06 6.21 6.55
Std. Dev. 7 9 15 8.55E+05 1.48E+06 0.19 0.16
pond_Eff_IR2_8.02.17
12:40 PM
Mix Red E. coli TC
E. coli*P
(CFU/100mL)
TC*P
(CFU/100mL)
log (E.
coli*P)
log
(TC*P)
A 14 7 21 7.00E+05 2.10E+06 5.85 6.32
B 16 11 27 1.10E+06 2.70E+06 6.04 6.43
C 11 13 24 1.30E+06 2.40E+06 6.11 6.38
1:10 PM
Mix Red E. coli TC
E. coli*P
(CFU/100mL)
TC*P
(CFU/100mL)
log (E.
coli*P)
log
(TC*P)
A 10 12 22 1.20E+06 2.20E+06 6.08 6.34
B 20 11 31 1.10E+06 3.10E+06 6.04 6.49
C 25 13 38 1.30E+06 3.80E+06 6.11 6.58
1:40 PM
Mix Red E. coli TC
E. coli*P
(CFU/100mL)
TC*P
(CFU/100mL)
log (E.
coli*P)
log
(TC*P)
A 9 11 20 1.10E+06 2.00E+06 6.04 6.30
B 16 9 25 9.00E+05 2.50E+06 5.95 6.40
C 10 16 26 1.60E+06 2.60E+06 6.20 6.41
Avg 15 11 26 1.14E+06 2.60E+06 6.05 6.41
Std Dev. 5 3 6 2.55E+05 5.61E+05 0.10 0.09
L. Red E. coli TC
E. coli*P
(CFU/100mL)
TC*P
(CFU/100mL)
log (E.
coli*P)
log
(TC*P)
A 13 6 19 6.00E+05 1.90E+06 5.78 6.28
B 13 7 20 7.00E+05 2.00E+06 5.85 6.30
C 11 15 26 1.50E+06 2.60E+06 6.18 6.41
L. Red E. coli TC
E. coli*P
(CFU/100mL)
TC*P
(CFU/100mL)
log (E.
coli*P)
log
(TC*P)
A 10 4 14 4.00E+05 1.40E+06 5.60 6.15
B 4 5 9 5.00E+05 9.00E+05 5.70 5.95
C 7 16 23 1.60E+06 2.30E+06 6.20 6.36

34
L. Red E. coli TC
E. coli*P
(CFU/100mL)
TC*P
(CFU/100mL)
log (E.
coli*P)
log
(TC*P)
A 11 5 16 5.00E+05 1.60E+06 5.70 6.20
B 6 10 16 1.00E+06 1.60E+06 6.00 6.20
C 9 15 24 1.50E+06 2.40E+06 6.18 6.38
Average 9 9 19 9.22E+05 1.86E+06 5.91 6.25
Std. Dev. 3 5 5 4.89E+05 5.39E+05 0.23 0.14
Control Red E. coli TC
E. coli*P
(CFU/100mL)
TC*P
(CFU/100mL)
log (E.
coli*P)
log
(TC*P)
A 9 7 16 7.00E+05 1.60E+06 5.85 6.20
B 11 15 26 1.50E+06 2.60E+06 6.18 6.41
C 11 16 27 1.60E+06 2.70E+06 6.20 6.43
Control Red E. coli TC
E. coli*P
(CFU/100mL)
TC*P
(CFU/100mL)
log (E.
coli*P)
log
(TC*P)
A 9 22 31 2.20E+06 3.10E+06 6.34 6.49
B 18 16 34 1.60E+06 3.40E+06 6.20 6.53
C 17 17 34 1.70E+06 3.40E+06 6.23 6.53
Control Red E. coli TC
E. coli*P
(CFU/100mL)
TC*P
(CFU/100mL)
log (E.
coli*P)
log
(TC*P)
A 20 14 34 1.40E+06 3.40E+06 6.15 6.53
B 22 13 35 1.30E+06 3.50E+06 6.11 6.54
C 15 15 30 1.50E+06 3.00E+06 6.18 6.48
Average 15 15 30 1.50E+06 2.97E+06 6.16 6.46
Std. Dev. 5 4 6 3.94E+05 6.06E+05 0.13 0.11
Table 7.3.6: Spread plate counts of pond effluent Trail 3&4 – continuous flow setup
pond_Eff_IR3_8.03.17
9:35 AM
Mix Red
E.
coli TC
E. coli*P
(CFU/100mL)
TC*P
(CFU/100mL)
log (E.
coli*P)
log
(TC*P)
A 23 19 42 1.90E+06 4.20E+06 6.28 6.62
B 38 10 48 1.00E+06 4.80E+06 6.00 6.68
C 35 13 48 1.30E+06 4.80E+06 6.11 6.68
10:05 AM
Mix Red
E.
coli TC
E. coli*P
(CFU/100mL)
TC*P
(CFU/100mL)
log (E.
coli*P)
log
(TC*P)
A 32 10 42 1.00E+06 4.20E+06 6.00 6.62
B 39 13 52 1.30E+06 5.20E+06 6.11 6.72
C 36 20 56 2.00E+06 5.60E+06 6.30 6.75

35
10:35 AM
Mix Red
E.
coli TC
E. coli*P
(CFU/100mL)
TC*P
(CFU/100mL)
log (E.
coli*P)
log
(TC*P)
A 29 19 48 1.90E+06 4.80E+06 6.28 6.68
B 25 18 43 1.80E+06 4.30E+06 6.26 6.63
C 34 14 48 1.40E+06 4.80E+06 6.15 6.68
Average 32 15 47 1.51E+06 4.74E+06 6.17 6.67
Std. Dev. 6 4 5 3.95E+05 4.67E+05 0.12 0.04
L. Red
E.
coli TC
E. coli*P
(CFU/100mL)
TC*P
(CFU/100mL)
log (E.
coli*P)
log
(TC*P)
45 10 55 1.00E+06 5.50E+06 6.00 6.74
10 24 34 2.40E+06 3.40E+06 6.38 6.53
28 8 36 8.00E+05 3.60E+06 5.90 6.56
L. Red
E.
coli TC
E. coli*P
(CFU/100mL)
TC*P
(CFU/100mL)
log (E.
coli*P)
log
(TC*P)
31 12 43 1.20E+06 4.30E+06 6.08 6.63
41 8 49 8.00E+05 4.90E+06 5.90 6.69
16 47 63 4.70E+06 6.30E+06 6.67 6.80
L. Red
E.
coli TC
E. coli*P
(CFU/100mL)
TC*P
(CFU/100mL)
log (E.
coli*P)
log
(TC*P)
21 15 36 1.50E+06 3.60E+06 6.18 6.56
23 15 38 1.50E+06 3.80E+06 6.18 6.58
19 7 26 7.00E+05 2.60E+06 5.85 6.41
26 16 42 1.62E+06 4.22E+06 6.13 6.61
11 13 12 1.27E+06 1.16E+06 0.27 0.12
Control Red
E.
coli TC
E. coli*P
(CFU/100mL)
TC*P
(CFU/100mL)
log (E.
coli*P)
log
(TC*P)
37 13 50 1.30E+06 5.00E+06 6.11 6.70
34 19 53 1.90E+06 5.30E+06 6.28 6.72
36 15 51 1.50E+06 5.10E+06 6.18 6.71
Control Red
E.
coli TC
E. coli*P
(CFU/100mL)
TC*P
(CFU/100mL)
log (E.
coli*P)
log
(TC*P)
62 18 80 1.80E+06 8.00E+06 6.26 6.90
47 26 73 2.60E+06 7.30E+06 6.41 6.86
29 28 57 2.80E+06 5.70E+06 6.45 6.76
Control Red
E.
coli TC
E. coli*P
(CFU/100mL)
TC*P
(CFU/100mL)
log (E.
coli*P)
log
(TC*P)
44 20 64 2.00E+06 6.40E+06 6.30 6.81
33 33 66 3.30E+06 6.60E+06 6.52 6.82

36
43 22 65 2.20E+06 6.50E+06 6.34 6.81
41 22 62 2.16E+06 6.21E+06 6.32 6.79
10 6 10 6.42E+05 1.03E+06 0.13 0.07
pond_Eff_IR4_8.03.17
12:35 PM
Mix Red
E.
coli TC
E. coli*P
(CFU/100mL)
TC*P
(CFU/100mL)
log (E.
coli*P)
log
(TC*P)
A 42 27 69 2.70E+06 6.90E+06 6.43 6.84
B 38 18 56 1.80E+06 5.60E+06 6.26 6.75
C 44 21 65 2.10E+06 6.50E+06 6.32 6.81
1:05 PM
Mix Red
E.
coli TC
E. coli*P
(CFU/100mL)
TC*P
(CFU/100mL)
log (E.
coli*P)
log
(TC*P)
A 44 22 66 2.20E+06 6.60E+06 6.34 6.82
B 38 25 63 2.50E+06 6.30E+06 6.40 6.80
C 41 14 55 1.40E+06 5.50E+06 6.15 6.74
1:35 PM
Mix Red
E.
coli TC
E. coli*P
(CFU/100mL)
TC*P
(CFU/100mL)
log (E.
coli*P)
log
(TC*P)
A 39 21 60 2.10E+06 6.00E+06 6.32 6.78
B 36 25 61 2.50E+06 6.10E+06 6.40 6.79
C 48 23 71 2.30E+06 7.10E+06 6.36 6.85
Avg 41 22 63 2.18E+06 6.29E+06 6.33 6.80
Std Dev. 4 4 5 3.96E+05 5.46E+05 0.09 0.04
L. Red
E.
coli TC
E. coli*P
(CFU/100mL)
TC*P
(CFU/100mL)
log (E.
coli*P)
log
(TC*P)
9 7 16 7.00E+05 1.60E+06 5.85 6.20
18 12 30 1.20E+06 3.00E+06 6.08 6.48
16 10 26 1.00E+06 2.60E+06 6.00 6.41
L. Red
E.
coli TC
E. coli*P
(CFU/100mL)
TC*P
(CFU/100mL)
log (E.
coli*P)
log
(TC*P)
37 14 51 1.40E+06 5.10E+06 6.15 6.71
30 18 48 1.80E+06 4.80E+06 6.26 6.68
43 24 67 2.40E+06 6.70E+06 6.38 6.83
L. Red
E.
coli TC
E. coli*P
(CFU/100mL)
TC*P
(CFU/100mL)
log (E.
coli*P)
log
(TC*P)
45 14 59 1.40E+06 5.90E+06 6.15 6.77
32 18 50 1.80E+06 5.00E+06 6.26 6.70
37 19 56 1.90E+06 5.60E+06 6.28 6.75
30 15 45 1.51E+06 4.48E+06 6.15 6.61

37
13 5 17 5.18E+05 1.69E+06 0.16 0.20
Control Red
E.
coli TC
E. coli*P
(CFU/100mL)
TC*P
(CFU/100mL)
log (E.
coli*P)
log
(TC*P)
50 23 73 2.30E+06 7.30E+06 6.36 6.86
28 31 59 3.10E+06 5.90E+06 6.49 6.77
36 31 67 3.10E+06 6.70E+06 6.49 6.83
Control Red
E.
coli TC
E. coli*P
(CFU/100mL)
TC*P
(CFU/100mL)
log (E.
coli*P)
log
(TC*P)
45 22 67 2.20E+06 6.70E+06 6.34 6.83
56 25 81 2.50E+06 8.10E+06 6.40 6.91
46 33 79 3.30E+06 7.90E+06 6.52 6.90
Control Red
E.
coli TC
E. coli*P
(CFU/100mL)
TC*P
(CFU/100mL)
log (E.
coli*P)
log
(TC*P)
41 34 75 3.40E+06 7.50E+06 6.53 6.88
33 9 42 9.00E+05 4.20E+06 5.95 6.62
23 16 39 1.60E+06 3.90E+06 6.20 6.59
40 25 65 2.49E+06 6.47E+06 6.37 6.80
11 8 15 8.42E+05 1.53E+06 0.19 0.12
6.4 Duckweed drying microbial analysis
Table 7.4.1: Spread plate counts of DW biomass after drying at ambient temperatures
L. biomass analysis
Day 1 Red E. coli TC
E. coli*P
(CFU/g)
TC*P
(CFU/g)
log (E.
coli*P)
log
(TC*P)
A
1.00E+0
8
1.00E+0
6
1.00E+0
8 1.00E+08 1.00E+10 8.00 10.00
B
1.00E+0
8
1.00E+0
6
1.00E+0
8 1.00E+08 1.00E+10 8.00 10.00
C
1.00E+0
8
1.00E+0
6
1.00E+0
8 1.00E+08 1.00E+10 8.00 10.00
Avg
1.00E+0
8
1.00E+0
6
1.00E+0
8 1.00E+08 1.00E+10 8.00 10.00
Std Dev.
0.00E+0
0
0.00E+0
0
0.00E+0
0 0.00E+00 0.00E+00 0.00 0.00
Day 2 Red E. coli TC
E. coli*P
(CFU/g)
TC*P
(CFU/g)
log (E.
coli*P)
log
(TC*P)
A 7 10 17 1.00E+03 1.70E+03 3.00 3.23
B 11 14 25 1.40E+03 2.50E+03 3.15 3.40
C 10 15 25 1.50E+03 2.50E+03 3.18 3.40
Avg 9 13 22 1.30E+03 2.23E+03 3.11 3.34

38
Std Dev. 2 3 5 2.65E+02 4.62E+02 0.09 0.10
Day 3 Red E. coli TC
E. coli*P
(CFU/g)
TC*P
(CFU/g)
log (E.
coli*P)
log
(TC*P)
A 26 27 53 2.70E+03 5.30E+03 3.43 3.72
B 34 25 59 2.50E+03 5.90E+03 3.40 3.77
C 14 24 38 2.40E+03 3.80E+03 3.38 3.58
Avg 25 25 50 2.53E+03 5.00E+03 3.40 3.69
Std Dev. 10 2 11 1.53E+02 1.08E+03 0.03 0.10
Day 4 Red E. coli TC
E. coli*P
(CFU/g)
TC*P
(CFU/g)
log (E.
coli*P)
log
(TC*P)
A 432 144 576 1.44E+04 5.76E+04 4.16 4.76
B 520 184 704 1.84E+04 7.04E+04 4.26 4.85
C 404 136 540 1.36E+04 5.40E+04 4.13 4.73
Avg 452 155 607 1.55E+04 6.07E+04 4.19 4.78
Std Dev. 61 26 86 2.57E+03 8.62E+03 0.07 0.06
Mix biomass analysis
Day 1 Red E. coli TC
E. coli*P
(CFU/g)
TC*P
(CFU/g)
log (E.
coli*P)
log
(TC*P)
A
1.00E+0
8
1.00E+0
6
1.00E+0
8 1.00E+08 1.00E+10 8.00 10.00
B
1.00E+0
8
1.00E+0
6
1.00E+0
8 1.00E+08 1.00E+10 8.00 10.00
C
1.00E+0
8
1.00E+0
6
1.00E+0
8 1.00E+08 1.00E+10 8.00 10.00
Avg
1.00E+0
8
1.00E+0
6
1.00E+0
8 1.00E+08 1.00E+10 8.00 10.00
Std Dev.
0.00E+0
0
0.00E+0
0
0.00E+0
0 0.00E+00 0.00E+00 0.00 0.00
Day 2 Red E. coli TC
E. coli*P
(CFU/g)
TC*P
(CFU/g)
log (E.
coli*P)
log
(TC*P)
A 20 24 44 2.40E+03 4.40E+03 3.38 3.64
B 11 16 27 1.60E+03 2.70E+03 3.20 3.43
C 10 15 25 1.50E+03 2.50E+03 3.18 3.40
Avg 14 18 32 1.83E+03 3.20E+03 3.25 3.49
Std Dev. 6 5 10 4.93E+02 1.04E+03 0.11 0.13
Day 3 Red E. coli TC
E. coli*P
(CFU/g)
TC*P
(CFU/g)
log (E.
coli*P)
log
(TC*P)
A 34 35 69 3.50E+03 6.90E+03 3.54 3.84
B 45 40 85 4.00E+03 8.50E+03 3.60 3.93
C 39 41 80 4.10E+03 8.00E+03 3.61 3.90
Avg 39 39 78 3.87E+03 7.80E+03 3.59 3.89
Std Dev. 6 3 8 3.21E+02 8.19E+02 0.04 0.05

39
Day 4 Red E. coli TC
E. coli*P
(CFU/g)
TC*P
(CFU/g)
log (E.
coli*P)
log
(TC*P)
A 450 77 527 7.70E+03 5.27E+04 3.89 4.72
B 476 100 576 1.00E+04 5.76E+04 4.00 4.76
C 668 172 840 1.72E+04 8.40E+04 4.24 4.92
Avg 531 116 648 1.16E+04 6.48E+04 4.04 4.80
Std Dev. 119 50 168 4.96E+03 1.68E+04 0.18 0.11