Embed Size (px)
Citation preview

INFRARED PHOTODISSOCIATION SPECTROSCOPY OF SMALL ORGANIC CATIONS
By
JONATHAN DAVID MOSLEY
(Under the Direction of Michael A. Duncan)
ABSTRACT
Small organic cations of the form [Cn,Hm]+ (carbocations) and [Cx,Hy,O]
+ (carboxonium
ions) are produced in a molecular beam via electrical discharge in a pulsed nozzle source. Size-
selected ions are investigated using infrared laser photodissociation spectroscopy in the
fingerprint region (600-2150 cm-1) and the C−H and O−H stretching region (2400-3800 cm
-1).
Quantum chemistry is used to predict structures and frequencies to aid assignment of the infrared
spectra. We attempted to produce and characterize the infamous 2-norbornyl carbocation
[C7,H11] +
in the gas phase. Spectral analysis reveals that a previously unanticipated
rearrangement occurs. [C7,H9]+ is produced from norbornene, and an unusual structural isomer
of the well-known protonated toluene is found. The mass 31 cation [C,H3,O]+ exists in two
structural configurations, protonated formaldehyde and the triplet methoxy cation. Cation
analogs to formaldehyde [C,H2,O]+ and methanol [C,H4,O]
+ both have radically different
structural isomers. [C2,H3,O]+ can exist as the remarkably stable acetyl cation, or as its more
energetic protonated ketene isomer, depending on the complex reaction pathways involved in the
ion source.
INDEX WORDS: Ion Infrared Spectroscopy, Carbocations, Carboxonium Ions
INFRARED PHOTODISSOCIATION SPECTROSCOPY OF SMALL ORGANIC CATIONS
By
JONATHAN DAVID MOSLEY
B.S., University of Florida, 2007
A Dissertation Submitted to the Graduate Faculty of the University of Georgia
in Partial Fulfillment of the Requirements for the Degree
DOCTOR OF PHILOSOPHY
ATHENS, GEORGIA
2014

©2014
Jonathan David Mosley
All Rights Reserved

INFRARED PHOTODISSOCIATION SPECTROSCOPY OF SMALL ORGANIC CATIONS
By
JONATHAN DAVID MOSLEY
Major Professor: Michael A. Duncan
Committee: Gary E. Douberly
Paul v. R. Schleyer
Electronic Version Approved:
Julie Coffield
Dean of the Graduate School
The University of Georgia
August 2014

iv
DEDICATION
I dedicate this dissertation to my wife Nicole Pacheco. Thank you for your loving acceptance of
me and for the giving of everything you have for the greater good.
“Sometimes you've got to think about more than your own safety. Sometimes you've got to think
about the greater good.” – J. K. Rowling

v
ACKNOWLEDGEMENTS
Firstly, I would like to thank my Higher Power, whom I choose to call God, for reaching
me through all the wonderful people who have supported me on my journey down the Road of
Happy Destiny.
I would like to thank my parents Michael and Juliana Mosley for instilling in me a strong
work ethic and a desire to be of service to others. Without these fundamental principles, I would
be helpless in discovering my true potential as a human being. I would also like to thank my
wife Nicole Pacheco, without whom the completion of graduate school while raising four
children would have just been a nightmare. To my loving children (if you ever actually read
this), I thank you for showing me the meaning of unconditional love.
Lastly, I would like to thank Professor Michael Duncan for the opportunity to work in his
laboratory. Neither one of us knew what we were getting ourselves into when I joined up five
years ago. I am indebted to him for allowing me the space to twist, turn, and finally spring forth
into the light of spectroscopy. I will never forget the lessons that I learned while under his
tutelage. Above all, he has taught me the importance of being able to simply relate to others the
fundamental principles of science that so completely captivate our minds.
“If you do what you’ve always done, you’ll get what you've always gotten.” – Anthony Robbins

vi
TABLE OF CONTENTS
Page
ACKNOWLEDGMENTS……………………………………………………...…………………v
CHAPTER
1 INTRODUCTION……………………………………………………………….. 1
2 EXPERIMENTAL SETUP…………………………….………………………...15
3 STRUCTURAL ISOMERIZATION OF 2-NORBORNYL CATION IN THE
GAS-PHASE REVEALED BY INFRARED SPECTROSCOPY AND
COMPUTATIONAL CHEMISTRY…………………………………………….28
4 INFRARED SPECTROSCOPY AND COMPUTATIONAL CHEMISTRY
REVEAL ANOTHER STRUCTURAL ISOMER OF PROTONATED
TOLUENE……………………………………………………………………… 43
5 INFRARED SPECTROSCOPY OF THE MASS 31 CATION: PROTONATED
FORMALDEHYDE VS METHOXY…………………………………………...62
6 UBIQUITOUS INTERSTELLAR MOLECULES WITH RADICALLY
DIFFERENT CATION STRUCTURES: INFRARED SPECTROSCOPY OF
FORMALDEHYDE AND METHANOL CATIONS…………………………...93
7 INFRARED SPECTROSCOPY OF THE ACETYL CATION AND ITS
PROTONATED KETENE ISOMER…………………………………………..135
8 CONCLUSION…………………………………………………………………168

1
CHAPTER 1
INTRODUCTION
The structures of ions have been of particular interest in mass spectrometry1-4
and
astrochemistry.5-9
Ion reactivity studies and collisional dissociation dynamics can indicate the
presence of more than one isomer, though spectroscopy can give more direct structural
information.1-4
Additionally, the observation of ions in space requires spectroscopy in the
laboratory to confirm their presence and abundance in interstellar environments. However, ion
spectroscopy is difficult due to the high internal temperatures and low densities per quantum
state resulting from standard ion production methods.4 On the other hand, quantum chemistry
can provide structural information of ions as well as the relative energies of isomers. Indeed,
theory and spectroscopy are both needed to corroborate which isomers exist.1, 3, 4
Recent
developments in ion production methods and infrared laser technology make it possible to obtain
the spectra of mass-selected ions via laser photodissociation.10-15
This work utilizes infrared
photodissociation spectroscopy and mass spectrometry to investigate the structure and bonding
of small organic cations of the form [Cm,Hn]+ and [Cx,Hy,O]
+.
Ions of the form [Cm,Hn]+, known as carbocations, are well known in mass
spectrometry.1-3
Carbocations are known in organic chemistry as reaction intermediates, such as
in electrophilic aromatic substitutions.16-18
They also exist in interstellar clouds and planetary
atmospheres, and are key elements in reactions producing complex organic molecules in space.4-9
Carbocations are interesting in their own right in terms of their structure and bonding. Their
"nonclassical" configurations contain bridging hydrogen and methyl moieties, which participate
2
in three-center two-electron (3c-2e) bonding. Carbocations can also have carbon atoms which
connect to more than four other atoms, giving rise to the term "hypervalent". "Classical"
structures consist of carbon atoms engaging in single, double, and triple bonds with ordinary
binding configurations, but neighboring orbitals can interact in these structures to introduce
subtle effects, such as hyperconjugation. Carbocations often pose problems within quantum
chemistry because of these structural issues. Carbocations of a particular mass to charge ratio
can have more than one structural isomer, often with competing "classical" and "nonclassical"
forms.1, 3
The actual structures that form depend on the ion production methods, what precursor
is used to produce the ion, the inherent stability of the binding configurations and the local
environment. Carbocations are thus compelling targets for infrared spectroscopy.
Extending beyond pure carbocations, [Cx,Hy,O]+, known as carboxonium ions, are
prevalent among mass spectra of oxygen-containing organic molecules.1-4
The name itself
reflects their hybrid nature, possessing characteristics of carbocations and oxonium ions (those
containing positively charged trivalent oxygen atoms). Indeed, multiple isomers are expected for
a wide variety of carboxonium ions that differ in the location of the positive charge on
neighboring C and O atoms.1, 3, 4, 19
These ions have been implicated as reaction intermediates in
organic chemistry, such as in Friedel-Crafts acylation reactions.19, 20
Like carbocations, they are
present in the interstellar medium, and are critical intermediates in reactions producing complex
polyatomic molecules in space.4-9
Therefore, carboxonium ions are also fascinating subjects for
studies utilizing modern spectroscopy techniques.
The observation of carbocations and carboxonium ions in space requires known spectral
signatures to confirm their presence and abundance in interstellar environments. Indeed, CH+,
one of first known diatomic molecules in space, was detected by its well-known electronic

3
spectrum.21
While only a handful of these organic cations have been detected in space, many
more are believed to be present.7-9
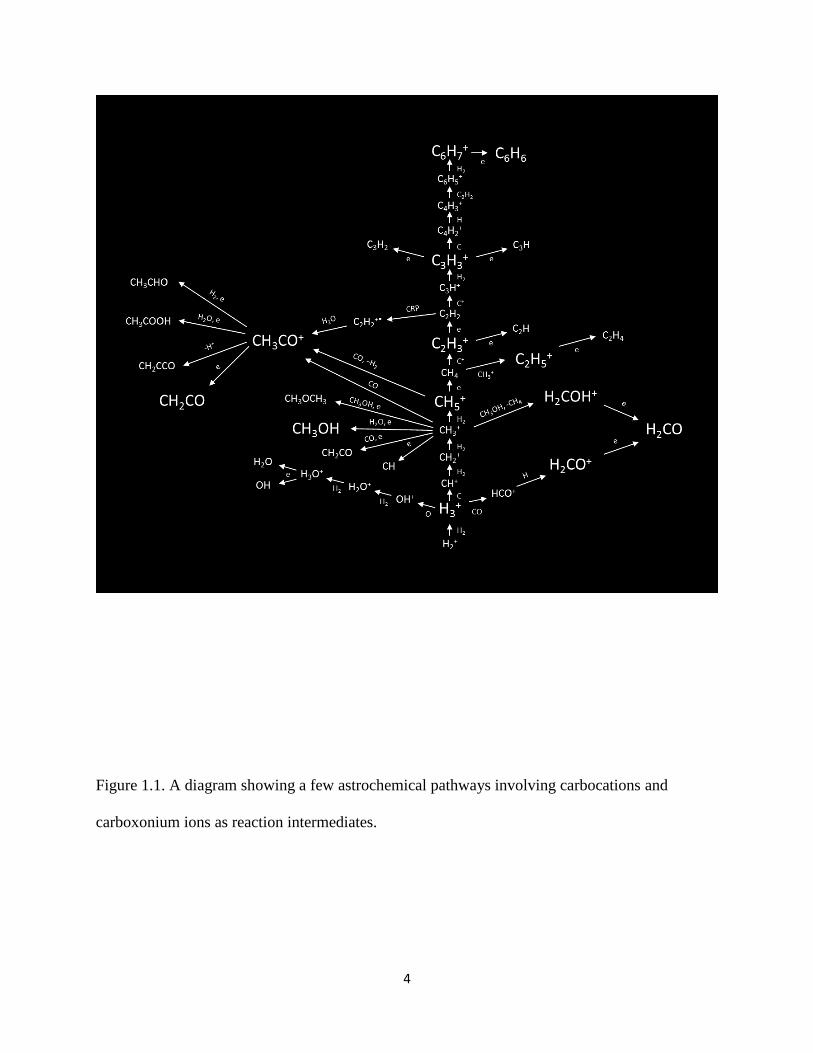
A diagram of astrochemical pathways for several
carbocations and carboxonium ions (see Figure 1.1) reveals just a small portion of the richly
complex astrochemical pathways that involve these fascinating species. The detection of new
species requires spectroscopy in the laboratory. Generally, to perform electronic spectroscopy,
an ion must contain low lying electronic states which give rise to transitions that are accessible
by modern lasers. Laser light up to the vacuum-UV region is available, but adds substantial
experimental difficulty due to atmospheric absorptions. To date, a limited number of organic
ions have been studied with electronic spectroscopy.21-23
Rotational spectra have been measured
for some of these ions.24-26
However, rotational spectroscopy of ions is difficult due to inherently
low signal levels, and thus has only been successful for a few cases. A very recent development
allows for mass-selected rotational spectra to be obtained.26
Still, the application is limited only
to ions with a permanent dipole moment. On the other hand, vibrational spectroscopy is
generally applicable to carbocations and carboxonium ions, regardless of the presence of low
lying electronic states or permanent dipole moments.
Because of the extreme difficulties in performing ion spectroscopy, there have been very
few previous investigations into the exact structures of carbocations and carboxonium ions.
Infrared and NMR spectroscopy have been performed for several ions in so-called "superacid"
matrices, which stabilize the ions with counteranions in a solvation environment.17-19
X-ray
crystallography measurements have also been reported for some of these systems, but
determining the effects of solvent and counterions is difficult.27, 28
Thus, gas-phase experiments
are ideal for ion characterization, because they remove these undesirable complications.
4
Figure 1.1. A diagram showing a few astrochemical pathways involving carbocations and
carboxonium ions as reaction intermediates.

5
Unfortunately, standard gas-phase ion production methods, such as plasmas and electron impact
ionization, are highly energetic processes, and result in complex mixtures of ions and neutral
molecules. Spectral detection of any particular ionic species is therefore complicated by
overlapping signals from neutral molecules which absorb in the same wavelength regions and are
present in much higher concentrations. Additionally, hot ions have complex spectra due to the
large amounts of excess energy spread over the molecular ion's internal degrees of freedom. The
present work addresses these issues with improvements in ion production and detection methods.
A pulsed discharge in a supersonic expansion produces abundant cold ions which are isolated
and studied with mass-selected infrared laser photodissociation spectroscopy. These methods
provide new spectral signatures for pure carbocations and carboxonium ions and elucidate the
role of structural isomers.
Previous vibrational spectroscopic studies have employed a wide variety of techniques,
including measurements in superacid matrices,17-19
photoelectron spectroscopy of radicals,29-38
infrared laser absorption in plasmas,39-41
infrared laser absorption in molecular beams with
pulsed discharges,42
infrared absorption in rare gas matrices,43, 44
and discharges or electron
impact ionization followed by mass-selected infrared laser photodissociation.12, 13
Each
technique suffers from disadvantages, including solvent and counterion effects, inefficient ion
cooling, low densities of ions, and limited laser tuning ranges. Nevertheless, significant insights
into the structural configurations of carbocations and carboxonium ions have been made using
these techniques. Some early developments in ion spectroscopy made by T. Oka utilized
discharges or plasmas to measure high resolution absorption spectra for ions such as CH5+ and
C2H3+.40, 41
These studies suffer from overlapping signal of the more abundant neutral CH4 and
C2H2. Interestingly, the CH5+ spectrum has yet to be assigned. The Nesbitt group measured this

6
ion at higher resolution more recently, prompting several theoretical studies of the highly
complex vibrational dynamics of this hypervalent carbocation.42, 45-50
The advent of velocity
modulation enabled the selective detection of ions within discharge tubes, and these methods
have been applied to a limited number of ions, including the rotationally resolved spectrum of
HCO+ in the C−H stretching region measured by Saykally.
51-53 Sears et al measured the ν3
fundamental band of HCO+ in the 2200 cm
-1 region using similar methods.
54 T. Amano
measured the high resolution spectrum of the O−H stretch of H2COH+.55
Maier and coworkers
have developed a method for studying electronic spectra of carbocations using discharges in
molecular beams, mass selection, and deposition in rare gas matrices.22
The same authors have
reported the infrared spectrum of C3H3+ in a similar matrix isolation study.
43 Newer matrix
isolation studies have also been performed for ions such as C6H7+ using solid para-hydrogen
matrices.44
Perhaps the most definitive measurements have been performed using infrared laser
photodissociation with mass-selected ions. The first such measurements were performed by Y.
T. Lee on ions such as CH5+ and C2H7
+.12, 13
The same group first discussed the method of
spectator atom "tagging" to enhance infrared dissociation yield, where photon energies are much
lower than covalent bond energies.10, 11, 13
Using this technique, Dopfer and Maier measured the
infrared spectra of several carbocations, including CH3+, C3H3
+ and C6H7
+, and the carboxonium
ions HCO+ and HOCO
+.56-60
However, these studies were limited to the higher frequency C−H
and O−H stretching regions by the available infrared lasers. The use of free electron lasers by
these and other authors enabled the measurement of spectra in the fingerprint region, but the
spectra were broad and shifted unpredictably due to multiphoton dissociation effects.61-64
The
experiments described here utilize the gas-phase ion production methods and mass-selected
7
photodissociation measurements similar to those described previously by Y. T. Lee10, 11, 13
and
those of Dopfer and Maier,56-60
but use improved ion cooling in supersonic expansions. Recent
developments in infrared optical parametric oscillators (OPO) have significantly improved the
spectral analysis of organic cations throughout the infrared region. The Duncan group has
recently used these methods to measure the extended infrared spectra of several carbocations,
including C2H3+, C3H3
+, C3H5
+, C4H9
+, C6H7
+ and C10H9
+.65
The same group has also measured
the spectra of HOCO+ and C3H7O
+.66, 67
Johnson and coworkers have recently reported spectra
for CH3OH2+ and CH3CH2OH2
+ recorded using similar OPO's.
68
This present work applies infrared photodissociation spectroscopy, mass spectrometry
and computational chemistry to the investigation of a structural isomer of the infamous 2-
norbornyl cation, C7H11+. Additionally, the spectrum of C7H9
+ is obtained and analyzed to reveal
another isomer of protonated toluene. This method is also used to probe the structure and
bonding of the mass 31 cation, [C,H3,O]+, which is ubiquitous among mass spectra of oxygen-
containing molecules. The cation analogs of the well-known organic molecules formaldehyde
and methanol are studied as well. Finally, the acetyl cation, CH3O+, and its higher energy
isomers are investigated. This ion is an important reaction intermediate and is believed to be
present in space, but has yet to be discovered there, due to a lack of known gas-phase
spectroscopic data.

8
References
(1) Baer, T.; Ng, C.; Powis, I., The Structure, Energetics, and Dynamics of Organic Ions.
Wiley: New York, 1996.
(2) Beynon, J. H., Mass Spectrometry. Elsevier: Amsterdam, 1960.
(3) Holmes, J. L.; Aubrey, C.; Mayer, P. M., Assigning Structures to Ions in Mass
Spectrometry. CRC Press: Boca Raton, FL, 2007.
(4) Bowers, M. T., Gas Phase Ion Chemistry. Academic Press: New York, 1984; Vol. I-III.
(5) Hartquist, T. W.; Williams, D. A., eds., The Molecular Astrophysics of Stars and
Galaxies. Clarendon Press: Oxford, 1998.
(6) Tielens, A. G. G. M., The Physics and Chemistry of the Interstellar Medium. Cambridge
University Press: Cambridge, U.K., 2005.
(7) Petrie, S.; Bohme, D. K., Ions in space. Mass Spectrom. Rev. 2007, 26 (2), 258-280.
(8) Snow, T. P.; Bierbaum, V. M., Ion chemistry in the interstellar medium. Annu. Rev. Anal.
Chem. 2008, 1 (1), 229-259.
(9) Klemperer, W., Astronomical chemistry. Annu. Rev. Phys. Chem. 2011, 62, 173-184.
(10) Okumura, M.; Yeh, L. I.; Lee, Y. T., The vibrational predissociation spectroscopy of
hydrogen cluster ions. J. Chem. Phys. 1985, 83 (7), 3705-3706.
(11) Okumura, M.; Yeh, L. I.; Myers, J. D.; Lee, Y. T., Infrared spectra of the cluster ions
H7O3+·H2 and H9O4
+·H2. J. Chem. Phys. 1986, 85 (4), 2328-2329.
(12) Yeh, L. I.; Price, J. M.; Lee, Y. T., Infrared-spectroscopy of the penta-coordinated
carbonium-ion C2H7+. J. Am. Chem. Soc. 1989, 111 (15), 5597-5604.
(13) Boo, D. W.; Lee, Y. T., Infrared-spectra of CH5+ core in CH5
+ (H2). Chem. Phys. Lett.
1993, 211 (4-5), 358-363.
9
(14) Bieske, E. J.; Dopfer, O., High-resolution spectroscopy of cluster ions. Chem. Rev. 2000,
100, 3963-3998.
(15) Duncan, M. A., Frontiers in the spectroscopy of mass-selected molecular ions. Int. J.
Mass Spectrom. 2000, 200, 545-569.
(16) Aue, D. H., Carbocations. Wiley Int. Rev.: Comp. Mol. Sci. 2011, 1 (4), 487-508.
(17) Olah, G. A.; Prakash, G. K., Carbocation Chemistry. John Wiley and Sons: New York,
2004.
(18) Schleyer, P. V. R.; Prakash, G. K., Stable Carbocation Chemistry. John Wiley and Sons:
New York, 1997.
(19) Olah, G. A.; Laali, K. K.; Wang, Q.; Prakash, G. K. S., Onium Ions. John Wiley & Sons:
New York, 1998.
(20) Olah, G. A., Friedel-Crafts Chemistry. Wiley: New York, 1973.
(21) Douglas, A. E.; Herzberg, G., Band spectrum and structure of the CH+ molecule;
identification of three interstellar lines. Can. J. Res. 1942, 20a (6), 71-82.
(22) Jochnowitz, E. B.; Maier, J. P., Electronic spectroscopy of carbon chains. Annu. Rev.
Phys. Chem. 2008, 59, 519-544.
(23) Bieske, E. J.; Maier, J. P., Spectroscopic studies of ionic complexes and clusters. Chem.
Rev. 1993, 93 (8), 2603-2621.
(24) Dixon, T. A.; Woods, R. C., Microwave absorption spectrum of the CO+ ion. Phys. Rev.
Lett. 1975, 34 (2), 61-63.
(25) Woods, R. C.; Dixon, T. A.; Saykally, R. J.; Szanto, P. G., Laboratory microwave
spectrum of HCO+. Phys. Rev. Lett. 1975, 35 (19), 1269-1272.
10
(26) Sandra, B.; Lars, K.; Alexander, S.; Oskar, A.; Stephan, S., Laboratory rotational
spectrum of l-C3H+ and confirmation of its astronomical detection. Astrophys. J. Lett.
2014, 783 (1), L4/1-4.
(27) Laube, T., X-ray crystal structures of carbocations stabilized by bridging or
hyperconjugation. Acc. Chem. Res. 1995, 28 (10), 399-405.
(28) Davlieva, M. G.; Lindeman, S. V.; Neretin, I. S.; Kochi, J. K., Isolation, x-ray structures,
and electronic spectra of reactive intermediates in friedel−crafts acylations. J. Org. Chem.
2005, 70 (10), 4013-4021.
(29) Houle, F. A.; Beauchamp, J. L., Detection and investigation of allyl and benzyl radicals
by photoelectron-spectroscopy. J. Am. Chem. Soc. 1978, 100 (11), 3290-3294.
(30) Houle, F. A.; Beauchamp, J. L., Photoelectron-spectroscopy of methyl, ethyl, isopropyl,
and tert-butyl radicals - implications for the thermochemistry and structures of the
radicals and their corresponding carbonium-ions. J. Am. Chem. Soc. 1979, 101 (15),
4067-4074.
(31) Schultz, J. C.; Houle, F. A.; Beauchamp, J. L., Photoelectron-spectroscopy of 1-propyl,
1-butyl, isobutyl, neopentyl, and 2-butyl radicals - free-radical precursors to high-energy
carbonium-ion isomers. J. Am. Chem. Soc. 1984, 106 (14), 3917-3927.
(32) Jarvis, G. K.; Weitzel, K. M.; Malow, M.; Baer, T.; Song, Y.; Ng, C. Y., High-resolution
pulsed field ionization photoelectron-photoion coincidence study of C2H2: Accurate 0 K
dissociation threshold for C2H+. Phys. Chem. Chem. Phys. 1999, 1 (22), 5259-5262.
(33) Weitzel, K. M.; Malow, M.; Jarvis, G. K.; Baer, T.; Song, Y.; Ng, C. Y., High-resolution
pulsed field ionization photoelectron-photoion coincidence study of CH4: Accurate 0 K
dissociation threshold for CH3+. J. Chem. Phys. 1999, 111 (18), 8267-8270.

11
(34) Xing, X.; Wang, P.; Woo, H. K.; Bahng, M. K.; Baek, S. J.; Ng, C. Y., Rotationally
resolved infrared-vacuum ultraviolet-pulsed field ionization-photoelectron depletion
method for infrared spectroscopic studies of neutral molecules. Chem. Phys. Lett. 2008,
455 (4-6), 321-324.
(35) Willitsch, S.; Wuest, A.; Merkt, F., High-resolution photoelectron spectroscopy and ab
initio quantum chemistry. Chimia 2004, 58 (5), 281-286.
(36) Willitsch, S.; Merkt, F., Rovibronic photoionization dynamics of asymmetric-top
molecules. Int. J. Mass Spectrom. 2005, 245 (1-3), 14-25.
(37) Worner, H. J.; Merkt, F., Diradicals, antiaromaticity, and the pseudo-Jahn-Teller effect:
Electronic and rovibronic structures of the cyclopentadienyl cation. J. Chem. Phys. 2007,
127 (3), 034303/1-16.
(38) Schulenburg, A. M.; Meisinger, M.; Radi, P. P.; Merkt, F., The formaldehyde cation:
Rovibrational energy level structure and coriolis interaction near the adiabatic ionization
threshold. J. Mol. Spectrosc. 2008, 250 (1), 44-50.
(39) Oka, T., Observation of the infrared spectrum of H3+. Phys. Rev. Lett. 1980, 45 (7), 531-
534.
(40) Crofton, M. W.; Jagod, M. F.; Rehfuss, B. D.; Oka, T., Infrared spectroscopy of carbo‐
ions. V. Classical vs nonclassical structure of protonated acetylene C2H3+. J. Chem. Phys.
1989, 91 (9), 5139-5153.
(41) White, E. T.; Tang, J.; Oka, T., CH5+: The infrared spectrum observed. Science 1999, 284
(5411), 135-137.

12
(42) Huang, X.; McCoy, A. B.; Bowman, J. M.; Johnson, L. M.; Savage, C.; Dong, F.;
Nesbitt, D. J., Quantum deconstruction of the infrared spectrum of CH5+. Science 2006,
311 (5757), 60-63.
(43) Wyss, M.; Riaplov, E.; Maier, J. P., Electronic and infrared spectra of H2C3H+ and cyclic
C3H3+ in neon matrices. J. Chem. Phys. 2001, 114 (23), 10355-10361.
(44) Bahou, M.; Wu, Y.-J.; Lee, Y.-P., A new method for investigating infrared spectra of
protonated benzene (C6H7+) and cyclohexadienyl radical (c-C6H7) using para-hydrogen.
J. Chem. Phys. 2012, 136 (15), 154304/1-8.
(45) Schreiner, P. R.; Kim, S. J.; Schaefer, H. F.; Schleyer, P. V., CH5+ - the never-ending
story or the final word. J. Chem. Phys. 1993, 99 (5), 3716-3720.
(46) Marx, D.; Parrinello, M., Molecular spectroscopy - CH5+: The cheshire cat smiles.
Science 1999, 284 (5411), 59-61.
(47) Bunker, P. R.; Ostojic, B.; Yurchenko, S., A theoretical study of the millimeterwave
spectrum of CH5+. J. Mol. Struct. 2004, 695, 253-261.
(48) Fleming, F. P.; Barbosa, A. G. H.; Esteves, P. M., Nature of the chemical bond in
protonated methane. J. Phys. Chem. A 2006, 110 (43), 11903-11905.
(49) Kumar, P.; Marx, D., Understanding hydrogen scrambling and infrared spectrum of bare
CH5+ based on ab initio simulations. Phys. Chem. Chem. Phys. 2006, 8 (5), 573-586.
(50) Lin, Z.; McCoy, A. B., Signatures of large-amplitude vibrations in the spectra of H5+ and
D5+. J. Phys. Chem. Lett. 2012, 3 (24), 3690-3696.
(51) Gudeman, C. S.; Saykally, R. J., Velocity modulation infrared-laser spectroscopy of
molecular-ions. Annu. Rev. Phys. Chem. 1984, 35, 387-418.
13
(52) Gudeman, C. S.; Begemann, M. H.; Pfaff, J.; Saykally, R. J., Velocity-modulated infrared
laser spectroscopy of molecular ions: The ν1 band of HCO+. Phys. Rev. Lett. 1983, 50
(10), 727-731.
(53) Stephenson, S. K.; Saykally, R. J., Velocity modulation spectroscopy of ions. Chem. Rev.
2005, 105 (9), 3220-3234.
(54) Foster, S. C.; McKellar, A. R. W.; Sears, T. J., Observation of the ν3 fundamental band of
HCO+. J. Chem. Phys. 1984, 81 (1), 578-579.
(55) Amano, T.; Warner, H. E., Laboratory detection of protonated formaldehyde (H2COH+).
Astrophys. J. 1989, 342 (2), L99-L101.
(56) Olkhov, R. V.; Nizkorodov, S. A.; Dopfer, O., Infrared photodissociation spectra of
CH3+–Arn complexes (n=1–8). J. Chem. Phys. 1998, 108 (24), 10046-10060.
(57) Dopfer, O.; Roth, D.; Maier, J. P., Infrared spectra of C3H3+-N2 dimers: Identification of
proton-bound c-C3H3+-N2 and H2CCCH
+-N2 isomers. J. Am. Chem. Soc. 2002, 124 (3),
494-502.
(58) Solcà, N.; Dopfer, O., Protonated benzene: IR spectrum and structure of C6H7+ Angew.
Chem. Int. Ed. 2002, 41 (19), 3628-3631.
(59) Nizkorodov, S. A.; Dopfer, O.; Ruchti, T.; Meuwly, M.; Maier, J. P.; Bieske, E. J., Size
effects in cluster infrared spectra: The ν1 band of Arn-HCO+ (n = 1-13). J. Phys. Chem.
1995, 99 (47), 17118-17129.
(60) Dopfer, O.; Olkhov, R. V.; Roth, D.; Maier, J. P., Intermolecular interaction in proton-
bound dimers.: Infrared photodissociation spectra of RG–HOCO+ (RG=He, Ne, Ar)
complexes. Chem. Phys. Lett. 1998, 296 (5–6), 585-591.
14
(61) Jones, W.; Boissel, P.; Chiavarino, B.; Crestoni, M. E.; Fornarini, S.; Lemaire, J.; Maitre,
P., Infrared fingerprint of protonated benzene in the gas phase. Angew. Chem. Int. Ed.
2003, 42 (18), 2057-2059.
(62) Polfer, N.; Sartakov, B. G.; Oomens, J., The infrared spectrum of the adamantyl cation.
Chem. Phys. Lett. 2004, 400 (1–3), 201-205.
(63) Lorenz, U. J.; Solcà, N.; Lemaire, J.; Maître, P.; Dopfer, O., Infrared spectra of isolated
protonated polycyclic aromatic hydrocarbons: Protonated naphthalene. Angew. Chem. Int.
Ed. 2007, 46 (35), 6714-6716.
(64) Chiavarino, B.; Crestoni, M. E.; Fornarini, S.; Lemaire, J.; Mac Aleese, L.; Maître, P.,
Infrared absorption features of gaseous isopropyl carbocations. ChemPhysChem 2004, 5
(11), 1679-1685.
(65) Duncan, M. A., Infrared laser spectroscopy of mass-selected carbocations. J. Phys. Chem.
A 2012, 116 (47), 11477-11491.
(66) Douberly, G. E.; Ricks, A. M.; Ticknor, B. W.; Duncan, M. A., Structure of protonated
carbon dioxide clusters: Infrared photodissociation spectroscopy and ab initio
calculations. J. Phys. Chem. A 2008, 112 (5), 950-959.
(67) Douberly, G. E.; Ricks, A. M.; Ticknor, B. W.; Duncan, M. A., The structure of
protonated acetone and its dimer: Infrared photodissociation spectroscopy from 800 to
4000 cm-1
. Phys. Chem. Chem. Phys. 2008, 10 (1), 77-79.
(68) Roscioli, J. R.; McCunn, L. R.; Johnson, M. A., Quantum structure of the intermolecular
proton bond. Science 2007, 316 (5822), 249-254.
15
CHAPTER 2
EXPERIMENTAL SETUP
Organic cations are produced in a supersonic expansion via pulsed electrical discharge
using needle or ring electrodes. Ions are produced using expansion gas(es) consisting of He, H2,
Ne, and/or Ar seeded with the vapor pressure of a solid or liquid organic precursor molecule. A
General Valve Series 9 nozzle, operated at a frequency of 10 Hz and pulse duration ranging from
200-400 microseconds, is employed in these experiments. The backing pressure used varies with
the gas mixture, diameter of the expansion hole, nozzle pulse duration, and electrical discharge
setup and conditions. Typical backing pressures range from 50-200 psig. The original design of
the molecular beam machine used to conduct these experiments can be traced to the Smalley
group.1, 2
The reflectron time-of-flight (TOF) apparatus is original to the Duncan group and has
been described previously for the photodissociation of mass-selected ions.3-5
This work utilizes
TOF mass spectrometry with powerful infrared lasers to obtain the infrared photodissociation
spectra of organic cations.
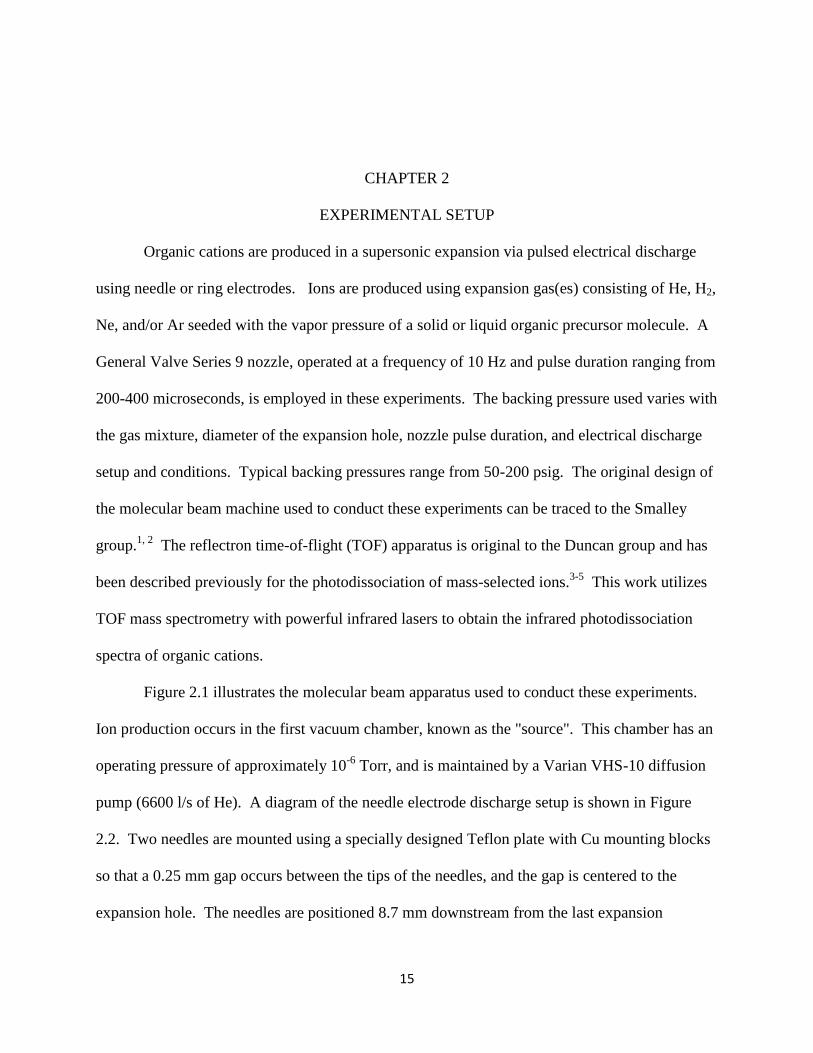
Figure 2.1 illustrates the molecular beam apparatus used to conduct these experiments.
Ion production occurs in the first vacuum chamber, known as the "source". This chamber has an
operating pressure of approximately 10-6
Torr, and is maintained by a Varian VHS-10 diffusion
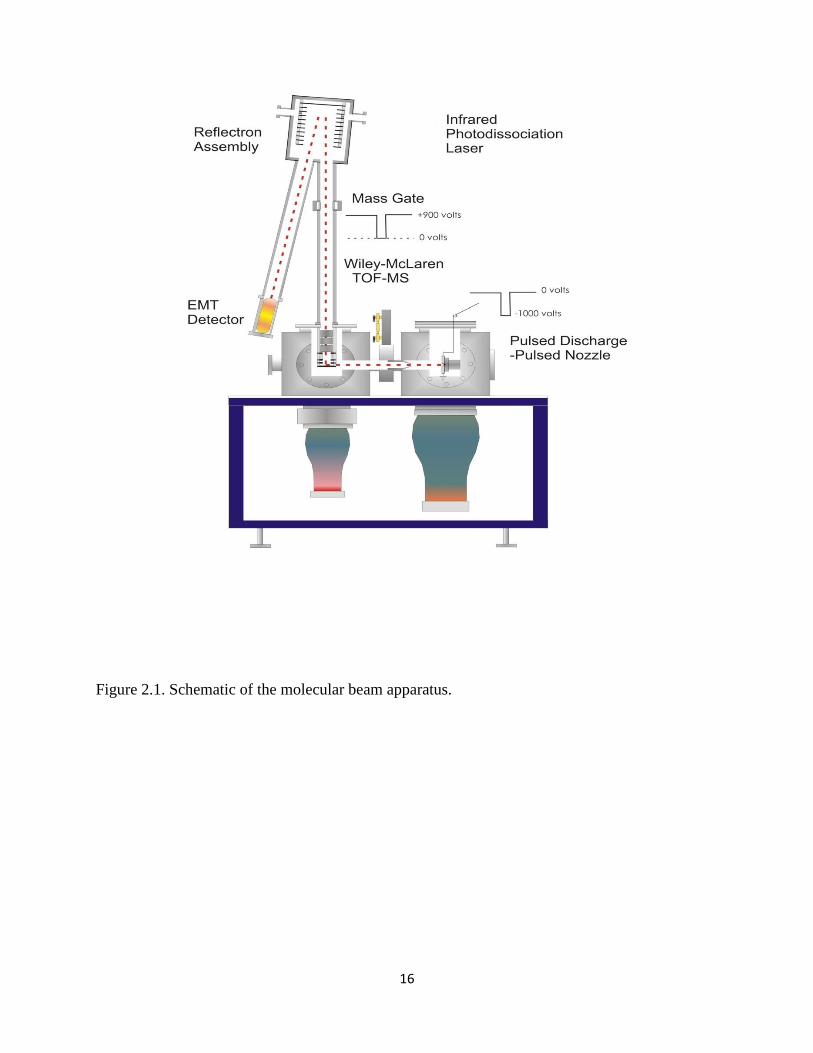
pump (6600 l/s of He). A diagram of the needle electrode discharge setup is shown in Figure
2.2. Two needles are mounted using a specially designed Teflon plate with Cu mounting blocks
so that a 0.25 mm gap occurs between the tips of the needles, and the gap is centered to the
expansion hole. The needles are positioned 8.7 mm downstream from the last expansion
16
Figure 2.1. Schematic of the molecular beam apparatus.
17
Figure 2.2. A diagram of the needle electrode discharge source.
18
aperture. One needle is maintained at a ground potential, while the other is connected to the
output of a Directed Energies (DEI) PVX-4140 high voltage pulsing circuit. The voltage is
controlled by an external power supply (Bertan) that operates from 0-3000 V. The pulse width is
controlled by an externally generated 5V pulse (Stanford Research Systems) and is variable over
the nanosecond to millisecond range. Typical pulse widths for optimal ion production are from
4-15 microseconds. Highly efficient cooling in the supersonic expansion is achieved by pulsing
the discharge in the middle of the nozzle gas pulse. The resulting plasma contains a variety of
neutrals, cations and anions.
Ions are entrained in the molecular beam and skimmed (Beam Dynamics 3mm nozzle)
into a second, differentially pumped, mass spectrometer chamber. Cations are pulse extracted
into the first flight tube of a homemade Wiley-McClaren TOF mass spectrometer in the
reflectron configuration.3, 4, 6
The mass spectrometer chamber is maintained at an operating
pressure of approximately 10-6
– 10-7
Torr using a Varian VHS-6 diffusion pump (3000 l/s of He)
to reduce collisions of the ion beam with background gases. Because pulse extraction occurs
perpendicularly to the molecular beam axis, a pair of deflection plates (~40V) is used to correct
for lateral motion of the ion beam. The ions are extracted in between the "draw-out grid" and
repeller plate of the Wiley-McClaren stack which, combined with a third ground plate
downstream, creates a two-field acceleration region. This setup minimizes the energy spread due
to the finite width of the molecular beam along the electric field lines and greatly improves the
resolution of the TOF mass spectrometer. Voltages are supplied to the acceleration plates by fast
high voltage switches (Behlke HTS-50) and the timings are controlled by digital delay generators
(Stanford Research Systems). After extraction, the ion beam passes through an einzel lens
(~400V) which counteracts space-charge effects and creates a tightly focused ion packet. The

19
ions then enter a field free region, an ion mirror, and another field free region and ultimately
terminate their flight at an ion detector (EMT Hamamatsu R-590). The output of the detector is
pre-amplified and sent to a digital oscilloscope, which measures the time taken for the ions to
traverse the mass spectrometer.
Ions accelerated in a TOF instrument have essentially the same kinetic energy. Their
flight time is determined by both their kinetic energy and their mass, as shown by equation (1):
⁄ (1)
Where m is the mass of the ion and v is its velocity, which is equal to distance, d over time, t.
Time zero is defined here to coincide with the pulsing of the acceleration plates. Thus, by
substitution and rearrangement, mass is shown to be proportional to the square of the flight time:
( ⁄ ) ⁄ (2)
So, ions with lighter mass will travel more quickly than heavier ions, and if the kinetic energy
and distance traveled is precisely known, the mass of the ion can be obtained by measuring the
flight time with an oscilloscope. However, exactly measuring these parameters is difficult in
practice, so a reference mass is used to calibrate the mass spectrum. Since all ions have the same
kinetic energy, equation (1) can be expressed as:
(3)

20
Which when rearranged, can give a simple way in which to express the mass of an unknown ion
in terms of its flight time and that of an ion with known mass:
( ⁄ )
(4)
The reference ion usually varies with the precursor used. Initial calibration is often done using
the known flight time of the hydronium ion in our mass spectrometer (m/z = 19, 33.4
microseconds). Homemade software utilizes a two-point calibration system to allow for
calibration over a large range of masses:
(
) ( )
(5)
Which corrects for the error introduced by the difference in time zero between very small and
very large masses.
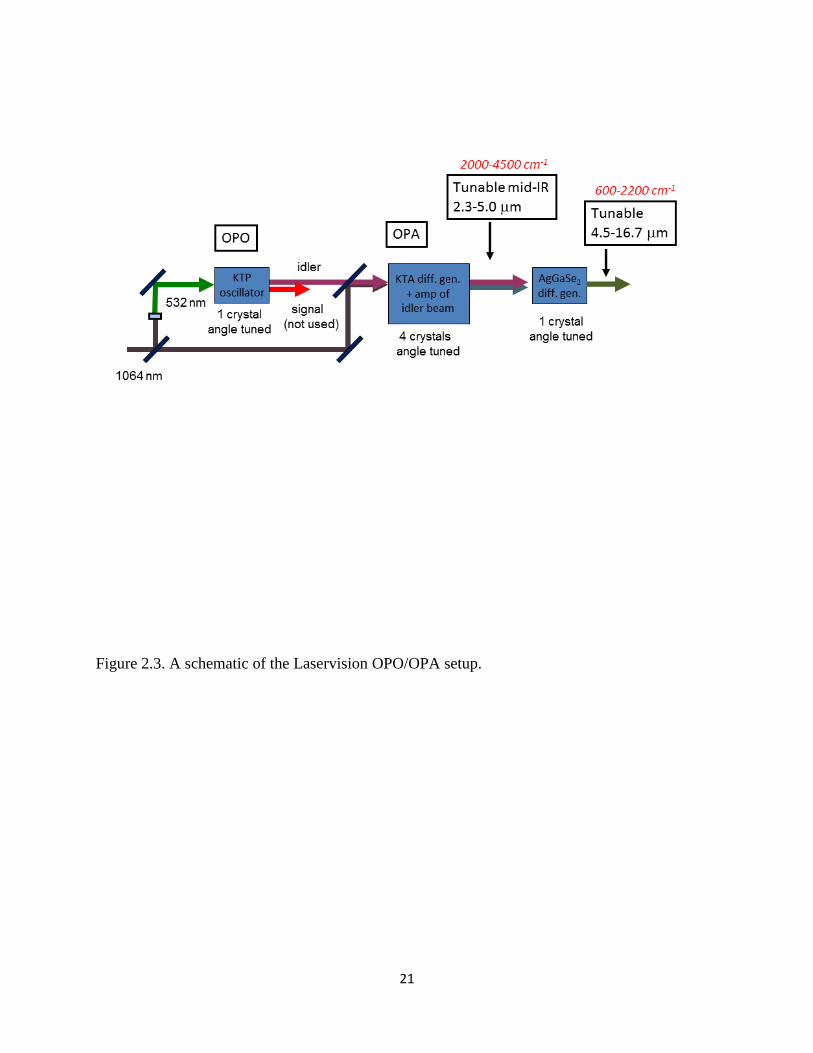
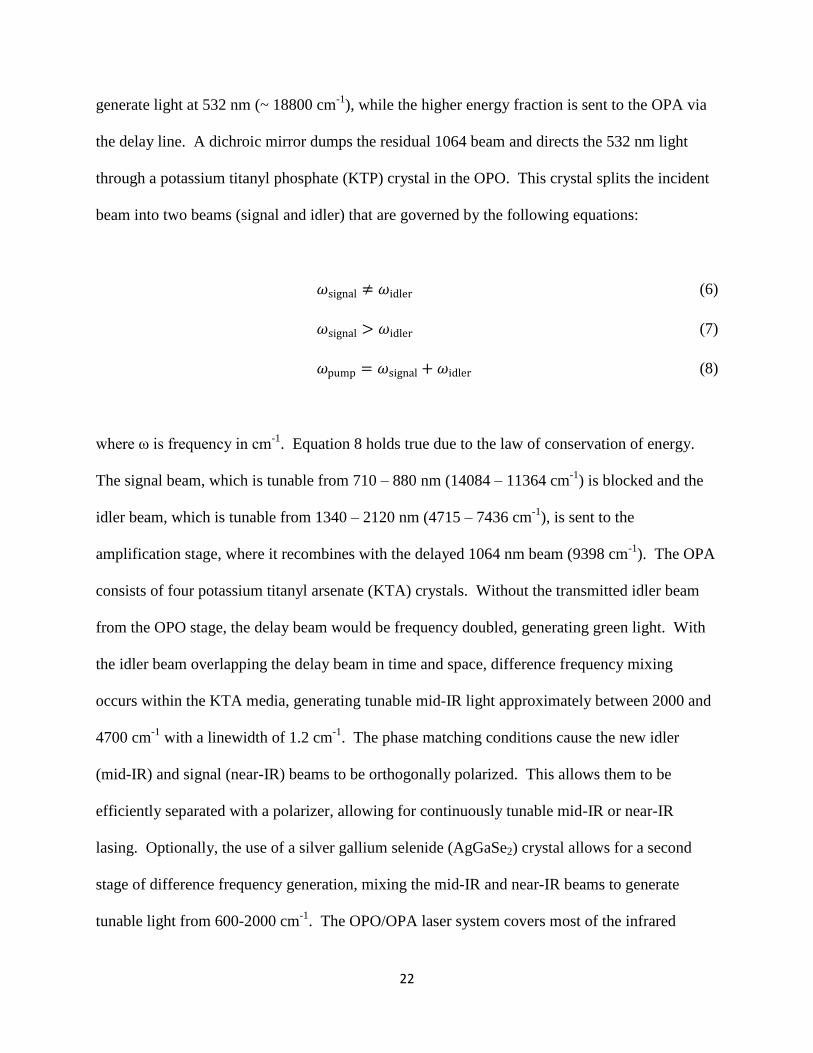
The tunable infrared light used in these experiments is generated by a LaserVision
infrared optical parametric oscillator (OPO)/ optical parametric amplifier (OPA) laser system.
An illustration of this system is shown in Figure 2.3. The OPO is pumped by the fundamental
(1064 nm) of a Spectra Physics Pro 230 Nd:YAG laser operated at 10 Hz and approximately 430
mJ/pulse. The pump beam enters the OPO/OPA box and is first split by a 30/70 beam splitter.
The 30% beam is frequency doubled in a potassium dihydrogen phosphate (KDP) crystal to
21
Figure 2.3. A schematic of the Laservision OPO/OPA setup.
22
generate light at 532 nm (~ 18800 cm-1
), while the higher energy fraction is sent to the OPA via
the delay line. A dichroic mirror dumps the residual 1064 beam and directs the 532 nm light
through a potassium titanyl phosphate (KTP) crystal in the OPO. This crystal splits the incident
beam into two beams (signal and idler) that are governed by the following equations:
(6)
(7)
(8)
where ω is frequency in cm-1
. Equation 8 holds true due to the law of conservation of energy.
The signal beam, which is tunable from 710 – 880 nm (14084 – 11364 cm-1
) is blocked and the
idler beam, which is tunable from 1340 – 2120 nm (4715 – 7436 cm-1
), is sent to the
amplification stage, where it recombines with the delayed 1064 nm beam (9398 cm-1
). The OPA
consists of four potassium titanyl arsenate (KTA) crystals. Without the transmitted idler beam
from the OPO stage, the delay beam would be frequency doubled, generating green light. With
the idler beam overlapping the delay beam in time and space, difference frequency mixing
occurs within the KTA media, generating tunable mid-IR light approximately between 2000 and
4700 cm-1
with a linewidth of 1.2 cm-1
. The phase matching conditions cause the new idler
(mid-IR) and signal (near-IR) beams to be orthogonally polarized. This allows them to be
efficiently separated with a polarizer, allowing for continuously tunable mid-IR or near-IR
lasing. Optionally, the use of a silver gallium selenide (AgGaSe2) crystal allows for a second
stage of difference frequency generation, mixing the mid-IR and near-IR beams to generate
tunable light from 600-2000 cm-1
. The OPO/OPA laser system covers most of the infrared
23
region from 600-7400 cm-1
, with only a small gap from 4700 – 4715 cm-1
. Most fundamental
vibrations occur in the fingerprint region (300-2000 cm-1
) and the higher frequency stretching
region (2500-4500 cm-1
). Thus, this system is widely applicable for vibrational spectroscopy of
carbocations and carboxonium ions.
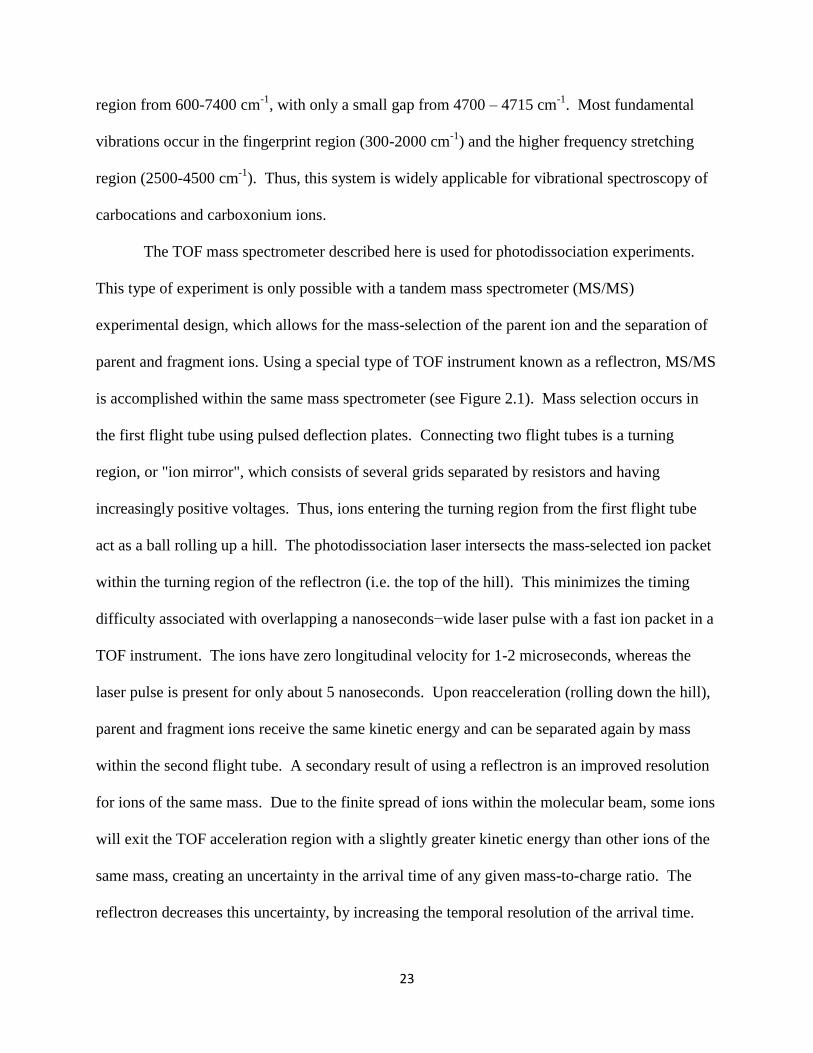
The TOF mass spectrometer described here is used for photodissociation experiments.
This type of experiment is only possible with a tandem mass spectrometer (MS/MS)
experimental design, which allows for the mass-selection of the parent ion and the separation of
parent and fragment ions. Using a special type of TOF instrument known as a reflectron, MS/MS
is accomplished within the same mass spectrometer (see Figure 2.1). Mass selection occurs in
the first flight tube using pulsed deflection plates. Connecting two flight tubes is a turning
region, or "ion mirror", which consists of several grids separated by resistors and having
increasingly positive voltages. Thus, ions entering the turning region from the first flight tube
act as a ball rolling up a hill. The photodissociation laser intersects the mass-selected ion packet
within the turning region of the reflectron (i.e. the top of the hill). This minimizes the timing
difficulty associated with overlapping a nanoseconds−wide laser pulse with a fast ion packet in a
TOF instrument. The ions have zero longitudinal velocity for 1-2 microseconds, whereas the
laser pulse is present for only about 5 nanoseconds. Upon reacceleration (rolling down the hill),
parent and fragment ions receive the same kinetic energy and can be separated again by mass
within the second flight tube. A secondary result of using a reflectron is an improved resolution
for ions of the same mass. Due to the finite spread of ions within the molecular beam, some ions
will exit the TOF acceleration region with a slightly greater kinetic energy than other ions of the
same mass, creating an uncertainty in the arrival time of any given mass-to-charge ratio. The
reflectron decreases this uncertainty, by increasing the temporal resolution of the arrival time.

24
Basically, ions with greater energy penetrate farther into the reflectron electric field, and thus
have a greater transit time through the reflectron. This allows the slower ions to "catch up" with
the faster same-mass ions, and all ions of the same mass-to-charge ratio reach the detector within
a narrower time interval.
A typical mass spectrum using the TOF mass spectrometer described here is presented in
Figure 2.4 (top trace, black). This spectrum was recorded using the vapor pressure of ethanol at
room temperature seeded in an expansion of pure Ar. Several peaks are seen with unit resolution
(using the full-width half-maximum definition). As shown in Figure 2.4, the full spectrum can
be recorded, or a single peak can be detected with mass selection (middle trace, navy). This
allows for an increase in ion signal by increasing the (negative) voltage applied to the detector.
Additional ion intensity can be obtained by applying a large positive voltage (~2500 V) to a
post-accelerator tube positioned within the second flight tube. Because the ion density produced
in the TOF mass spectrometer is too low for direct absorption measurements (106−10
7
molecules/cm3), absorption must be detected by its effect on the ion. This action spectroscopy is
accomplished with photodissociation in the TOF mass spectrometer. However, the energy of an
infrared photon (~ 0.5 eV) is much less than the energy required to break a covalent bond (4-5
eV), thus the method of rare gas tagging is used to greatly enhance the photodissociation yield.
Using a rare gas atom, such as Ar, a weak (~0.1 eV) intermolecular bond is formed in the Ar-
tagged complex. Ar is highly polarizable, and charge-induced dipole interactions stabilize the
weakly bound complex in the absence of external stimuli. Infrared absorption by the molecular
ion induces fast intramolecular vibrational relaxation (IVR) processes on the order of
picoseconds, and enough energy transfers into the normal mode corresponding to the Ar
stretching motion to break the intermolecular bond. This process is highly efficient, with nearly

25
Figure 2.4. A breakdown mass spectrum of [C,H3,O]+−Ar produced using ethanol vapor seeded
in an expansion of Ar.
26
100% photodissociation yield upon absorption. Due to the high ionization potential (IP) of Ar
(15.8 eV), the charge remains on the organic cation (9-10 eV typical IP for neutral organic
molecules) and a loss of neutral Ar is observed, as shown in Figure 2.4 (bottom trace, wine).
Thus, by integrating the fragment ion intensity while tuning the infrared laser, an infrared
photodissociation spectrum analogous to the molecular ion's absorption spectrum can be
obtained. This is accomplished by recording a photodissociation mass spectrum averaged over a
pre-defined number of laser shots per wavelength and transferring at high speeds to a PC which
contains homemade integration software. The same software controls the laser scanning
parameters to ensure precise wavelength correlation. A typical infrared photodissociation
spectrum is obtained over 300-1000 laser shots.
27
References
(1) Powers, D. E.; Hansen, S. G.; Geusic, M. E.; Puiu, A. C.; Hopkins, J. B.; Dietz, T. G.;
Duncan, M. A.; Langridge-Smith, P. R. R.; Smalley, R. E., Supersonic metal cluster
beams: Laser photoionization studies of copper cluster (Cu2). J. Phys. Chem. 1982, 86
(14), 2556-2560.
(2) Dietz, T. G.; Duncan, M. A.; Powers, D. E.; Smalley, R. E., Laser production of
supersonic metal cluster beams. J. Chem. Phys. 1981, 74 (11), 6511-6512.
(3) Cornett, D. S.; Peschke, M.; LaiHing, K.; Cheng, P. Y.; Willey, K. F.; Duncan, M. A.,
Reflectron time-of-flight mass spectrometer for laser photodissociation. Rev. Sci.
Instrum. 1992, 63 (4), 2177-2186.
(4) LaiHing, K.; Cheng, P. Y.; Taylor, T. G.; Willey, K. F.; Peschke, M.; Duncan, M. A.,
Photodissociation in a reflectron time-of-flight mass spectrometer: A novel mass
spectrometry/mass spectrometry configuration for high-mass systems. Anal. Chem. 1989,
61 (13), 1458-1460.
(5) Duncan, M. A., Invited review article: Laser vaporization cluster sources. Rev. Sci.
Instrum. 2012, 83 (4), 041101/1-19.
(6) Wiley, W. C.; McLaren, I. H., Time‐of‐flight mass spectrometer with improved
resolution. Rev. Sci. Instrum. 1955, 26 (12), 1150-1157.

28
CHAPTER 3
STRUCTURAL ISOMERIZATION OF 2-NORBORNYL CATION IN THE GAS PHASE
REVEALED BY INFRARED SPECTROSCOPY AND COMPUTATIONAL CHEMISTRY
The 2-norbornyl cation (C7H11+; 2NB
+) is the most famous and controversial nonclassical
carbocation.1, 2
On the basis of unusual solvolysis reaction rates and products of 2-exo- and 2-
endo-norbornyl derivatives,3-8
Winstein proposed a symmetrically bridged nonclassical structure
for the ionic intermediate.5 In sharp disagreement, H. C. Brown favored rapidly equilibrating
classical structures and advocated steric hindrance to account for the difference in solvolysis
rates.9 This dispute continued vehemently for three decades. Experimental investigations of the
nature of 2NB+, e.g., under "stable ion" conditions in "superacid" media supported the non-
classical structure (as did theoretical computations at ever-more sophisticated levels).10-22
Notably, Saunders demonstrated that the deuterium isotope effects on the 13
C-NMR spectra
showed no rapidly equilibrating carbon signatures14
and Yannoni, et al.’s cryogenic (5K) 13
C-
NMR spectra showed a static symmetrically bridged structure.15
However, proponents of the
classical structure argued that these results were not definitive because of the relatively long
NMR time scale. Recently, the long-sought X-ray crystal structure of the 2-norbornyl cation
finally was obtained (by overcoming double-disorder problems), confirming the nonclassical
structure of 2NB+ in the condensed phase.
23 Nevertheless, questions remain about the nature of
this ion in the gas phase. Although aspects of its chemistry have been studied by mass
spectrometry,24-28
no gas-phase vibrational spectroscopy of 2NB+
has been recorded. Hence, our
initial objective was to explore the structure of the mass-selected C7H11+ ion with infrared laser

29
spectroscopy. Much to our surprise, the structure of C7H11+ obtained by protonating norbornene
under our conditions, was not that of 2NB+, but instead corresponded to a much more stable
rearranged ion. The identification of the structure of this unexpected C7H11+ isomer is the
subject of the present paper.
Previous gas phase mass spectrometry investigations of 2NB+ explored its ion-molecule
reactions and collision induced dissociation behavior.24-28
Fragmentation patterns of C7H11+
produced by different methods are similar, and energetic thresholds were consistent with the
expected thermochemistry for 2NB+.28
However, rearrangements are common in ion
fragmentation and these experiments did not establish the actual ion structures. Since 2NB+ is so
well-known as an ion pair in the condensed phase, it is not generally appreciated that this ion is
far from being the C7H11+ global energy minimum. Limited computational studies have explored
some other C7H11+ isomers, but there has been no comprehensive study of the potential energy
surface.20, 29, 30
Our investigation of the C7H11+ isomer produced by highly energetic norbornene
protonation was based on comparison of its experimental infrared spectrum with those predicted
computationally for various C7H11+ isomers. Theory finds that several of these are more stable
than 2NB+, but that only the C7H11
+ global energy minimum gives a good match with the IR
experiment.
C7H11+ ions are produced using a previously-described pulsed electrical discharge
source.31
The expansion gas composed of 5% H2/95% argon (total pressure ~20 atm) is seeded
with norbornene vapor (Sigma-Aldrich, 99%) heated to ~40 °C. Ions are formed and cooled
collisionally in the supersonic expansion. The molecular beam is skimmed into a second
differentially-pumped vacuum chamber, where the ions are pulse-extracted by a reflectron time-
of-flight (TOF) mass spectrometer. C7H11+ tagged with argon (m/z 135) is mass-selected in the

30
first section of the TOF, and the selected ion packet is irradiated in the turning region of the
reflectron by the beam from a tunable infrared photodissociation laser (LaserVision
OPO/OPA).31
Parent and fragment ions are reaccelerated into a second flight tube and detected
at different times with an ion detector. IR spectra are recorded by integrating the C7H11+ ion
signal resulting from argon elimination while tuning the infrared laser. MP2 computations were
carried out with the GAMESS-US package (version 1 May 2012 (R1)).32
CCSD(T)
computations employed the CFOUR program (Version 1.0).33
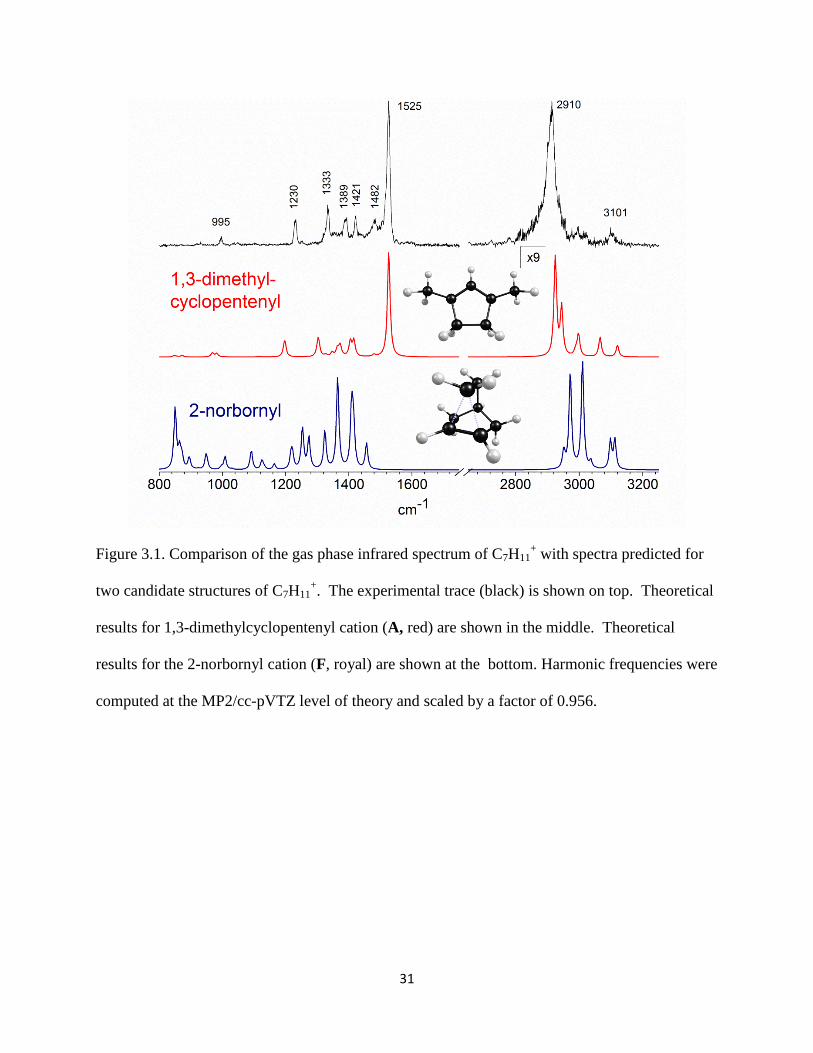
The infrared spectrum of our C7H11+ isomer, obtained by photodissociation of argon
tagged species31
is shown in Figure 3.1 (top). The C7H11+Ar ion was produced in a mixture of
norbornene and H2 in argon; H3+ forms abundantly and serves as the protonating agent. After
mass selection, the spectrum was recorded as the wavelength dependent yield of the C7H11+
photofragment. The spectrum consists of a strong broad band at 2910 cm-1
in the C−H stretching
region, whose appearance is insensitive to laser power or to the tagging employed (one or two 2
Ar’s or N2). Much weaker absorptions appear at higher frequencies, but sharper structures
characterize the fingerprint region, with bands at 995, 1230, 1333, 1389, 1421, 1482, and the
most prominent peak at 1525 cm-1
. Notably, this spectrum DOES NOT correspond to that
predicted for the 2-norbornyl cation (Figure 3.1, blue trace, bottom) by the MP2/cc-pVTZ level
of theory. Likewise, our band patterns DO NOT match those measured for 2NB+ in superacid
films.13, 23
In particular, 2NB+ has no 1525 cm
-1 feature nor are its stronger bands in the 1300–
1400 cm-1
region and the strong feature near 850 cm-1
detected. We confirmed the surprising
conclusion that our spectrum is not that of the 2NB+ cation by showing that its vibrational
spectrum computed at DFT/B3LYP and CCSD(T) levels of theory was in essential agreement
with that shown in Figure 3.1.
31
Figure 3.1. Comparison of the gas phase infrared spectrum of C7H11+ with spectra predicted for
two candidate structures of C7H11+. The experimental trace (black) is shown on top. Theoretical
results for 1,3-dimethylcyclopentenyl cation (A, red) are shown in the middle. Theoretical
results for the 2-norbornyl cation (F, royal) are shown at the bottom. Harmonic frequencies were
computed at the MP2/cc-pVTZ level of theory and scaled by a factor of 0.956.

32
The ion we produced was identified by a more extensive computational investigation into
possible C7H11+ isomers than performed previously.
20, 29, 30 The six lowest energy isomers of the
13 C7H11+ structures examined are shown in Figure 3.2. The energies of isomers A, B and D
were computed further at the CCSD(T)/ANO0 level, but their relative energies (Table 3.1) agree.
As is apparent in Figure 3.2 and Table 3.1, 2NB+ is far from being the most stable C7H11
+
isomer. In line with post facto chemical intuition, the 1,3-dimethylcyclopentenyl cation
(DMCP+) is the C7H11
+ global energy minimum, being 23.4 and 16.9 kcal/mol more stable than
2NB+ at the CCSD(T) and the MP2 levels, respectively. Computed vibrational spectra for each
of the 13 C7H11+ isomers were compared with the measured spectrum. Only the DMCP
+ isomer
has a computed spectrum (Figure 3.1, middle trace) matching experiment remarkably well. All
of the main experimental features are accounted for, and there are no obvious bands predicted
that are not observed. Evidently, our experiment produced the DMCP+ global minimum C7H11
+
isomer exclusively.
Previous gas phase studies employed gentler norbornene protonation conditions to give
the 2NB+ ion.
24-28 In contrast, the protonation method employed here was highly exothermic (by
nearly 100 kcal/mol) and the ion produced in our experiment had ample excess energy to
isomerize into the monocyclic DMCP structure. The rearrangement observed is quite
understandable when the experimental energetics are considered: the protonating agent H3+ has a
much lower proton affinity (PA=100.9 kcal/mol)34
than that of norbornene (198.8 kcal/mol).27
Hence, the exothermic protonation step results in rearrangement since the energy suffices to
dissociate the 2NB+ framework. Merino and coworkers have carried out a complimentary
molecular dynamics investigation of the global 2NB+ potential energy surface in a study of its
rearrangement pathways.35
According to their findings, ring-opening steps for 2NB+ require

33
Figure 3.2. Six low energy C7H11+ isomers. F is believed to be a stable minimum in the gas
phase. Our computations show A to be the most stable isomer in the gas phase.

34
Table 3.1. Structural isomers of the C7H11+ cation predicted on the 0 K potential energy surface
(PES). All structures were fully optimized at the MP2/cc-pVTZ level of theory and confirmed to
be minima by harmonic vibrational frequency analysis. Selected low energy isomers were
evaluated further at the CCSD(T)/ANO0 level of theory. Theoretical results confirm that isomer
A is the global minimum.
Isomer MP2/cc-pVTZ
[hartree]
∆E [kcal
mol-1
]
CCSD(T)/ANO0
[hartree]
∆E [kcal
mol-1
]
1,3-dimethylcyclopentenyl (A) -272.469199 0.0 -272.401776 0.0
1,2-dimethylcyclopentenyl (B) -272.460872 +5.2 −−− −−−
1,4-dimethylcyclopentenyl (C) -272.453815 +10.1 −−− −−−
1-ethylcyclopentenyl (D) -272.452139 +11.8 −−− −−−
1-methylcyclohexenyl (E) -272. 452273 +12.0 -272.386235 +11.0
2-norbornyl (F) -272.446965 +16.9 -272.368925 +23.4

35
activation energies well below the exoergicity of norbornene protonation by H3+. Previous gas
phase studies of 2NB+ employed much less exothermic norbornene protonation reactions, or
generated ions from norbornyl halide precursors.24-28
Unfortunately, our initial attempts to
observe authentic gas phase 2NB+ spectra were unsuccessful due, e.g., to limitations of our
present apparatus. But we plan to persevere and report our results subsequently.
The DMCP+ cation we observed (evidently for the first time in the gas phase) is a
fascinating species in its own right. It has been characterized before in the condensed phase in
zeolite matrices.36-38
Methanol-to-gasoline conversion studies showed that small hydrocarbon
precursors such as ethylene can lead to this ion, whose presence was confirmed by 13
C-NMR
studies as an ion pair component in the acid catalyst.36, 37
Haw, et al. obtained a low resolution
condensed phase Raman spectrum of DMCP+.38
Its structure combines carbocation-stabilizing
features: five-membered ring allyl resonance and optimally-placed methyl substituents. The C-C-
C asymmetric allyl stretch corresponds to the strong 1525 cm-1
vibration. This frequency is
lower than the corresponding vibrations of the allyl cation (1581 cm-1
)39
or of protonated
benzene (1607 cm-1
).40
The prominent 2910 cm-1
absorption corresponds to the overlapping C–
H stretches of the CH3 and CH2 groups. Lower frequency bands arise from C–H bending and
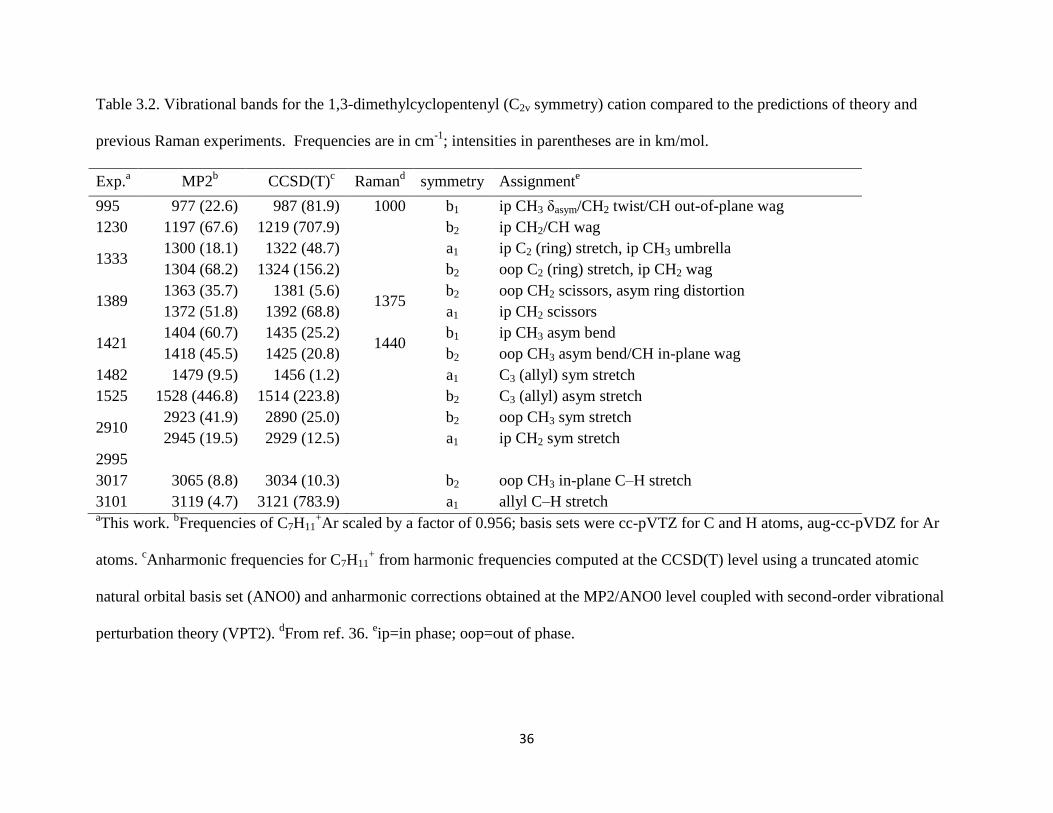
carbon stretching modes. (See the vibrational assignments in Table 3.2; also as shown, three
bands observed in the condensed-phase Raman experiment are shifted only slightly from our gas
phase values.) Therefore, the assignment of the C7H11+ ion in our experiment to DMCP
+, the
C7H11+
global minimum, is unambiguous.
Merino’s related study35
reveals an even richer variety of structures on the C7H11+ cation
potential surface connecting to the 2NB+ cation. Besides DMCP
+, other cations lower in energy
than 2NB+ are highly relevant in the mechanistic dynamics of this PES. Thus far, we only have
36
Table 3.2. Vibrational bands for the 1,3-dimethylcyclopentenyl (C2v symmetry) cation compared to the predictions of theory and
previous Raman experiments. Frequencies are in cm-1
; intensities in parentheses are in km/mol.
Exp.a MP2
b CCSD(T)
c Raman
d symmetry Assignment
e
995 977 (22.6) 987 (81.9) 1000 b1 ip CH3 δasym/CH2 twist/CH out-of-plane wag
1230 1197 (67.6) 1219 (707.9) b2 ip CH2/CH wag
1333 1300 (18.1) 1322 (48.7)
a1 ip C2 (ring) stretch, ip CH3 umbrella
1304 (68.2) 1324 (156.2) b2 oop C2 (ring) stretch, ip CH2 wag
1389 1363 (35.7) 1381 (5.6)
1375 b2 oop CH2 scissors, asym ring distortion
1372 (51.8) 1392 (68.8) a1 ip CH2 scissors
1421 1404 (60.7) 1435 (25.2)
1440 b1 ip CH3 asym bend
1418 (45.5) 1425 (20.8) b2 oop CH3 asym bend/CH in-plane wag
1482 1479 (9.5) 1456 (1.2) a1 C3 (allyl) sym stretch
1525 1528 (446.8) 1514 (223.8) b2 C3 (allyl) asym stretch
2910 2923 (41.9) 2890 (25.0)
b2 oop CH3 sym stretch
2945 (19.5) 2929 (12.5) a1 ip CH2 sym stretch
2995
3017 3065 (8.8) 3034 (10.3) b2 oop CH3 in-plane C–H stretch
3101 3119 (4.7) 3121 (783.9) a1 allyl C–H stretch aThis work.
bFrequencies of C7H11
+Ar scaled by a factor of 0.956; basis sets were cc-pVTZ for C and H atoms, aug-cc-pVDZ for Ar
atoms. cAnharmonic frequencies for C7H11
+ from harmonic frequencies computed at the CCSD(T) level using a truncated atomic
natural orbital basis set (ANO0) and anharmonic corrections obtained at the MP2/ANO0 level coupled with second-order vibrational
perturbation theory (VPT2). dFrom ref. 36.
eip=in phase; oop=out of phase.
37
detected DMCP+ spectroscopically. Future studies with carefully chosen reactants and conditions
may allow other C7H11+ isomers to be characterized, hopefully including the authentic 2NB
+
cation.

38
References
(1) Aue, D. H., Carbocations. Wiley Int. Rev.: Comp. Mol. Sci. 2011, 1 (4), 487-508.
(2) Olah, G. A.; Prakash, G. K., Carbocation Chemistry. John Wiley and Sons: New York,
2004.
(3) Schmerling, L., The exchange of hydrogen and chlorine between bicyclo (2,2,1) heptane
and t-butyl chloride. J. Am. Chem. Soc. 1946, 68 (2), 195-196.
(4) Roberts, J. D.; Urbanek, L.; Armstrong, R., The chlorination of bicyclo [2,2,1] heptane
(norbornylane). J. Am. Chem. Soc. 1949, 71 (9), 3049-3051.
(5) Winstein, S.; Trifan, D. S., The structure of the bicyclo[2,2,1]2-heptyl (norbornyl)
carbonium ion. J. Am. Chem. Soc. 1949, 71 (8), 2953-2953.
(6) Winstein, S.; Morse, B. K.; Grunwald, E.; Jones, H. W.; Corse, J.; Trifan, D.; Marshall,
H., Neighboring carbon and hydrogen. VII. Reactivity of some alicyclic and bicyclic
derivatives1,2,3. J. Am. Chem. Soc. 1952, 74 (5), 1127-1132.
(7) Winstein, S.; Trifan, D., Neighboring carbon and hydrogen. XI. Solvolysis of exo-
norbornyl p-bromobenzenesulfonate1,2,3. J. Am. Chem. Soc. 1952, 74 (5), 1154-1160.
(8) Winstein, S.; Trifan, D., Neighboring carbon and hydrogen. X. Solvolysis of endo-
norbornyl arylsulfonates1,2,3. J. Am. Chem. Soc. 1952, 74 (5), 1147-1154.
(9) Brown, H. C.; Schleyer), w. c. b. P. v. R., The Nonclassical Ion Problem. Plenum Press:
New York, 1977.
(10) Schleyer, P. V.; Comisaro.Mb; Olah, G. A.; Fort, R. C.; Watts, W. E., Stable carbonium
ions .10. Direct nuclear magnetic resonance observation of 2-norbornyl cation. J. Am.
Chem. Soc. 1964, 86 (24), 5679-5680.
39
(11) Saunders, M.; Schleyer, P. V.; Olah, G. A., Stable carbonium ions .11. Rate of hydride
shifts in 2-norbornyl cation. J. Am. Chem. Soc. 1964, 86 (24), 5680-5681.
(12) Olah, G. A.; Commeyras, A.; Lui, C. Y., Stable carbonium ions. LXXII. Raman and
N.M.R. spectroscopic study of the nortricyclonium ion [protonated
tricyclo[2.2.1.02,6]heptane] and its relation to the 2-norbornyl
[bicyclo[2.2.1]heptyl]cation. The nature of the stable long-lived norbornyl cation in
strong acid solutions. J. Am. Chem. Soc. 1968, 90 (14), 3882-3884.
(13) Olah, G. A.; White, A. M.; Demember, J. R.; Commeyra.A; Lui, C. Y., Stable carbonium
ions .100. Structure of norbornyl cation. J. Am. Chem. Soc. 1970, 92 (15), 4627-4640.
(14) Saunders, M.; Kates, M. R., Deuterium isotope effect on the carbon-13 NMR spectrum of
the bicyclo[2.2.1]heptyl cation. Nonclassical norbornyl cation. J. Am. Chem. Soc. 1980,
102 (22), 6867-6868.
(15) Yannoni, C. S.; Macho, V.; Myhre, P. C., Resolved 13
C NMR spectra of carbonium ions
at cryogenic temperatures. The norbornyl cation at 5 K. J. Am. Chem. Soc. 1982, 104
(25), 7380-7381.
(16) Raghavachari, K.; Haddon, R. C.; Schleyer, P. V.; Schaefer, H. F., Effects of electron
correlation on the energies of 2-norbornyl cation structures - evaluation of the non-
classical stabilization energy. J. Am. Chem. Soc. 1983, 105 (18), 5915-5917.
(17) Brown, H. C., The energy of the transition states and the intermediate cation in the
ionization of 2-norbornyl derivatives. Where is the nonclassical stabilization energy? Acc.
Chem. Res. 1983, 16 (12), 432-440.

40
(18) Olah, G. A.; Prakash, G. K. S.; Saunders, M., Stable carbocation .249. Conclusion of the
classical non-classical ion controversy based on the structural study of the 2-norbornyl
cation. Acc. Chem. Res. 1983, 16 (12), 440-448.
(19) Olah, G. A.; Prakash, G. K. S.; Saunders, M., Structure of the 2-norbornyl cation - reply.
Acc. Chem. Res. 1985, 18 (10), 292-293.
(20) Schleyer, P. v. R.; Sieber, S., The classical 2-norbornyl cation rigorously defined ab
initio. Angew. Chem. Int. Ed. 1993, 32 (11), 1606-1608.
(21) Schreiner, P. R.; Schleyer, P. V.; Schaefer, H. F., Why the classical and nonclassical
norbornyl cations do not resemble the 2-endo- and 2-exo-norbornyl solvolysis transition
states. J. Org. Chem. 1997, 62 (13), 4216-4228.
(22) Kong, J.; Roy, D.; Lenoir, D.; Zhang, X. W.; Zou, J. J.; Schleyer, P. V., 2-norbornyl ion-
pair leakage in electrophilic addition of HCl to nortricyclene and norbornene. Org. Lett.
2009, 11 (20), 4684-4687.
(23) Scholz, F.; Himmel, D.; Heinemann, F. W.; Schleyer, P. v. R.; Meyer, K.; Krossing, I.,
At last, the crystal structure determination of the non-classical 2-norbornyl cation.
Science 2013, 341 (6141), 62-64.
(24) Kaplan, F.; Cross, P.; Prinstein, R., Gas-phase stabilities of bicyclic cations. J. Am. Chem.
Soc. 1970, 92 (5), 1445-1446.
(25) Saluja, P. P. S.; Kebarle, P., Heat of formation of the 2-norbornyl cation in the gas phase.
J. Am. Chem. Soc. 1979, 101 (5), 1084-1087.
(26) Solomon, J. J.; Field, F. H., Reversible reactions of gaseous ions. X. The intrinsic
stability of the norbornyl cation. J. Am. Chem. Soc. 1976, 98 (6), 1567-1569.

41
(27) Staley, R. H.; Wieting, R. D.; Beauchamp, J. L., Carbenium ion stabilities in the gas
phase and solution. An ion cyclotron resonance study of bromide transfer reactions
involving alkali ions, alkyl carbenium ions, acyl cations, and cyclic halonium ions. J. Am.
Chem. Soc. 1977, 99 (18), 5964-5972.
(28) Blanchette, M. C.; Holmes, J. L.; Lossing, F. P., Characterizing the 2-norbornyl cation in
the gas phase. J. Am. Chem. Soc. 1987, 109 (5), 1392-1395.
(29) Kirmse, W., Metastable norbornyl cations. Acc. Chem. Res. 1986, 19 (2), 36-41.
(30) Fuchs, J.-F.; Mareda, J., Ab initio and DFT gas phase investigations of the C7H11+
potential energy surfaces of bicyclobutonium species and related carbocations. J. Mol.
Struct.: THEOCHEM 2005, 718 (1–3), 93-104.
(31) Duncan, M. A., Infrared laser spectroscopy of mass-selected carbocations. J. Phys. Chem.
A 2012, 116 (47), 11477-11491.
(32) Schmidt, M. W.; Baldridge, K. K.; Boatz, J. A.; Elbert, S. T.; Gordon, M. S.; Jensen, J.
H.; Koseki, S.; Matsunaga, N.; Nguyen, K. A.; Su, S.; Windus, T. L.; Dupuis, M.;
Montgomery, J. A., General atomic and molecular electronic structure system. J. Comput.
Chem. 1993, 14 (11), 1347-1363.
(33) CFOUR, a quantum chemical program package written by J. F. Stanton, J. Gauss, M. E.
Harding, P. G. Szalay with contributions from A. A. Auer, R. J. Bartlett, U. Benedikt, C.
Berger, D.E. Bernholdt, Y.J. Bomble, L. Cheng, O. Christiansen, M. Heckert, O. Heun,
C. Huber, T.-C. Jagau, D. Jonsson, J. Jusélius, K. Klein, W.J. Lauderdale, D.A.
Matthews, T. Metzroth, L.A. Mück, D.P. O'Neill, D.R. Price, E. Prochnow, C. Puzzarini,
K. Ruud, F. Schiffmann, W. Schwalbach, C. Simmons, S. Stopkowicz, A. Tajti, J.
Vázquez, F. Wang, J.D. Watts and the integral packages MOLECULE (J. Almlöf and
42
P.R. Taylor), PROPS (P.R. Taylor), ABACUS (T. Helgaker, H.J. Aa. Jensen, P.
Jørgensen, and J. Olsen), and ECP routines by A. V. Mitin and C. van Wüllen. For the
current version, see http://www.cfour.de.
(34) Hunter, E. P.; Lias, S. G., Proton Affinity Evaluation. In NIST Chemistry Webbook, NIST
Standard Reference Database Number 69, Linstrom, P. J.; Mallard, W. G., Eds. National
Institute of Standards and Technology: Gaithersburg, MD, 20899,
http://webbook.nist.gov.
(35) Merino, G., private communication.
(36) Xu, T.; Haw, J. F., Cyclopentenyl carbenium ion formation in acidic zeolites: An in situ
NMR study of cyclic precursors. J. Am. Chem. Soc. 1994, 116 (17), 7753-7759.
(37) Haw, J. F.; Nicholas, J. B.; Song, W. G.; Deng, F.; Wang, Z. K.; Xu, T.; Heneghan, C. S.,
Roles for cyclopentenyl cations in the synthesis of hydrocarbons from methanol on
zeolite catalyst HZSM-5. J. Am. Chem. Soc. 2000, 122 (19), 4763-4775.
(38) Chua, Y. T.; Stair, P. C.; Nicholas, J. B.; Song, W. G.; Haw, J. F., UV raman spectrum of
1,3-dimethylcyclopentenyl cation adsorbed in zeolite H-MFI. J. Am. Chem. Soc. 2003,
125 (4), 866-867.
(39) Douberly, G. E.; Ricks, A. M.; Schleyer, P. v. R.; Duncan, M. A., Infrared spectroscopy
of gas phase C3H5+: The allyl and 2-propenyl cations. J. Chem. Phys. 2008, 128, 021102.
(40) Douberly, G. E.; Ricks, A. M.; Schleyer, P. v. R.; Duncan, M. A., Infrared spectroscopy
of gas phase benzenium ions: Protonated benzene and protonated toluene, from 750 to
3400 cm–1
. J. Phys. Chem. A 2008, 112 (22), 4869-4874.
43
CHAPTER 4
INFRARED SPECTROSCOPY AND COMPUTATIONAL CHEMISTRY REVEAL
ANOTHER STRUCTURAL ISOMER OF PROTONATED TOLUENE
Introduction
The structures of ions have been of particular interest in mass spectrometry.1-3
Ion
reactivity studies and collisional dissociation dynamics can indicate the presence of more than
one isomer, though spectroscopy can give more direct structural information.1-3
However, ion
spectroscopy is difficult due to the high internal temperatures and low densities per quantum
state resulting from standard ion production methods.1 On the other hand, computational
chemistry can provide structural information of ions as well as the relative energies of isomers.
Indeed, theory and spectroscopy are both needed to corroborate which isomers exist. Recent
developments in ion production methods and infrared laser technology make it possible to obtain
the spectra of mass-selected ions via laser photodissociation.4-7
This work investigates the C7H9+
carbocation with infrared photodissociation spectroscopy.
Carbocations have attracted much attention in organic chemistry.8-10
For example, σ-
complexes, also known as arenium ions, are reaction intermediates in aromatic electrophilic
substitutions.8, 9
The structure of protonated benzene (C6H7+) was confirmed to be the C2v global
minimum structure via NMR and IR spectroscopy.11-14
However, the protonation of toluene, one
of the simplest derivatives of benzene, may be associated with rearrangements to isomeric
structures.15
Recently, the C3H3+ and C3H5
+ carbocations were shown via infrared spectroscopy
to exist in two forms, cyclopropenyl vs propargyl (C3H3+),
16, 17 and allyl vs 2-propenyl (C3H5
+).
18

44
The C7H7+ system consists of two isomers, as evidenced by different reactivity for different
structural forms.19-21
These structures are believed to be those of the benzylium and tropylium
ions, though limited spectroscopic studies have been performed for this system.22, 23
Here, we
investigate the infrared spectrum of a previously unanticipated isomer of the C7H9+ system.
Several studies have been performed previously on C7H9+ ions, using mass spectrometric
studies,14, 15, 24-30
NMR spectroscopy,31-34
infrared spectroscopy,35-37
and computational
chemistry.14, 36, 38-41
Much of the early interest in this ion was due to its being an alkyl-
substituted form of protonated benzene (C6H7+).
14, 15, 24-26, 31 In fact, four structural isomers of
C7H9+ correspond to methyl substitution at different ring positions around the benzenium ring
(i.e. CH3-C6H7+, protonated toluene). It is widely recognized that the structure corresponding to
para-protonated toluene is the global minimum structure.14, 24, 26, 31, 35-37, 39
Higher energy isomers
with very interesting structures have been studied with experimental27, 28, 32-34
and theoretical36, 38,
40, 41 methods. Recently, we attempted to measure the infrared spectra of norbornyl cations in the
gas phase made from norbornene protonation.42
Fortuitously, our attempts led to the discovery
of a C7H9+ carbocation with a previously unobserved structure. The present work reports the
infrared spectrum of a different isomer than those reported previously.
Experimental Methods
C7H9+ ions are produced using a previously-described pulsed electrical discharge
source.43
The expansion gas composed of 5% H2/95% argon (total pressure ~20 atm) is seeded
with norbornene vapor (Sigma-Aldrich, 99%) heated to ~40 °C. Ions are formed and cooled
collisionally in the supersonic expansion. The molecular beam is skimmed into a second
differentially-pumped vacuum chamber, where the ions are pulse-extracted by a reflectron time-
of-flight (RTOF) mass spectrometer. C7H9+ tagged with argon (m/z 133) is mass-selected in the
45
first section of the RTOF, and the selected ion packet is irradiated in the turning region of the
reflectron by the beam from a tunable infrared photodissociation laser (LaserVision
OPO/OPA).43
Parent and fragment ions are reaccelerated into a second flight tube and detected
at different times with an ion detector. IR spectra are recorded by integrating the C7H9+ ion
signal resulting from argon elimination while tuning the infrared laser. MP2 and B3LYP
computations were carried out with the GAMESS-US package (version 1 May 2012 (R1)).44
Results and Discussion
The full mass spectrum produced from a mixture of norbornene and H2 in argon is
presented in Figure 4.1. The most abundant ion signal is detected for C5H7+, C7H9
+, and C7H11
+.
Several smaller peaks are observed, including those corresponding to C2H5+, C3H7
+, C4H9
+,
C5H6+, C6H3
+, C6H7
+, C6H9
+, C6H11
+, and C7H7
+. A few of the less abundant carbocations have
been observed before with infrared spectroscopy (C2H5+, C4H9
+, C6H7
+), while others, such as
C5H6+ (cyclopentadiene cation) and C7H7
+ (benzylium vs tropylium) are intriguing targets for
such studies. Reaction products occur at higher mass to charge ratios, along with the Ar-tagged
complexes of the more abundant carbocations.
The infrared spectrum of C7H9+Ar, obtained by photodissociation of the argon tagged
species43
is shown in Figure 4.2 (black trace, third from top). It contains two prominent features
in the fingerprint region at 1475 and 1512 cm-1
. An intense higher frequency band is seen at
1616 cm-1
. At lower frequency, a partially resolved doublet is observed with at 1263 cm-1
(HWHM). Other bands appear at 1100, 1195, 1309, and 1392 cm-1. The C−H stretching region
consists of two strong peaks at 2836 and 2908 cm-1
, as well as two weaker bands at 3085 and
3124 cm-1
(partially resolved doublet). The previously reported spectrum of para-protonated

46
Figure 4.1. The mass spectrum produced from norbornene vapor in an expansion of H2 and Ar.

47
Figure 4.2. Comparison of two gas phase infrared spectra of C7H9+ with spectra predicted for two
structures of C7H9+. Harmonic frequencies were computed at the B3LYP/6-311+G** level of
theory and scaled by a factor of 0.969 in the C−H stretching region only.

48
toluene (C7H9+), obtained in this laboratory from toluene protonation, is reproduced for
comparison in Figure 4.2 (black trace, top).37
The common features of the two spectra are
highlighted using dashed green lines. The 1195, 1263, and 1309 cm-1
bands correspond to peaks
reported previously at 1204, 1264/1277, and 1323 cm-1
. The band at 1475 cm-1
corresponds to
overlapping bands at 1473 and 1487 cm-1
, but differs in appearance with respect to peak shape.
Additionally, the 1263 cm-1
band is approximately half as intense as the 1475 cm-1
band, whereas
the 1277 and 1473 cm-1
bands have roughly the same intensities in the previous spectrum.
Though we do not normalize to laser power, it is approximately equal at these two frequencies.
The 1616 cm-1
band corresponds to the most prominent band in the spectrum of para-protonated
toluene at 1623 cm-1
. Notably, there is a systematic redshift in the values reported here, relative
to the previous spectrum in the fingerprint region. This can be attributed to different calibration
values between the two experiments. In both cases, calibration is achieved with photoacoustic
spectroscopy. Previously, calibration of the higher frequency mid-IR beam of the OPO was used
to derive the calibration value in the lower frequency far-IR beam. The current calibration was
achieved in the fingerprint region with photoacoustic spectroscopy of ammonia and methane. In
the C−H stretching region, two prominent bands exist at 2836 and 2908 cm-1
. The 2836 cm-1
band matches protonated toluene's most intense C−H stretch, reported previously at 2835 cm-1
.
In the present spectrum, the band at 2908 cm-1
has comparable intensity to that of the 2836 cm-1
peak, whereas the previous spectrum contains a peak at 2914 cm-1
with less than half the
intensity of the 2835 cm-1
band. Because seven bands coincide with para-protonated toluene's
spectral signature, we conclude that this structure is present in the current experiment. The
bands observed previously below 1000 cm-1
do not appear in the spectrum from norbornene
protonation, presumably due to lower signal levels in the current experiment.

49
New features are apparent in the fingerprint region at 1100, 1392, and 1512 cm-1
, and at
3085 and 3124 cm-1
in the C−H stretching region, as shown in Figure 4.2. Additionally, the band
at 1473 cm-1
is twice as intense as the 1263 cm-1
band in the present spectrum, whereas the
analogous bands in para-protonated toluene's spectrum have approximately equal intensities.
Likewise, the strongest C−H stretching bands observed at 2836 cm-1
and 2908 cm-1
in the current
spectrum are roughly similar in intensity. Previously, the 2835 cm-1
band was by far the most
intense peak in this region. These observations suggest that an additional structural isomer is
present alongside para-protonated toluene when C7H9+ is produced using norbornene as a
precursor. Norbornene protonation has recently been shown to produce an unexpected structural
isomer of the 2-norbornyl cation (C7H11+) in the gas phase, that of the 1,3-dimethylcyclopentenyl
cation (DMCP).42
This unexpected rearrangement is the result of complex reaction pathways
which are present in our ion source. Similarly complex chemistry is expected to occur for the
C7H9+ ion using identical source conditions. Indeed, the C7H11
+ and C7H9
+ ions were generated
in the same plasma (Figure 4.1) and their spectra were recorded on the apparatus simultaneously.
To investigate other possible isomers, we performed an extensive investigation of the
C7H9+ potential energy surface (PES). Nine structures were found in addition to the global
minimum structure, para-protonated toluene (1). Their relative energies computed at the
MP2/aug-cc-pVDZ level of theory are presented in Table 4.1, and their structures are shown in
Figure 4.3. These values are corrected for zero point vibrational energy effects. The well-known
ortho- (2), meta- (3) and ipso- (4) isomers of protonated toluene are +1.2, +4.1 and +8.5 kcal/mol
higher in energy than 1. The 1,3- (5), 1,2- (6) and 1,4- (8) isomers of protonated cycloheptatriene
lie higher in energy on the PES at +19.2, +22.2, and +27.6 kcal/mol, respectively. 1, 2, and 6
have been investigated with infrared spectroscopy before.35-37
We find the bicyclic 3-notricyclyl
ion (7) to be 24.7 kcal/mol above the global minimum structure. Olah measured the NMR
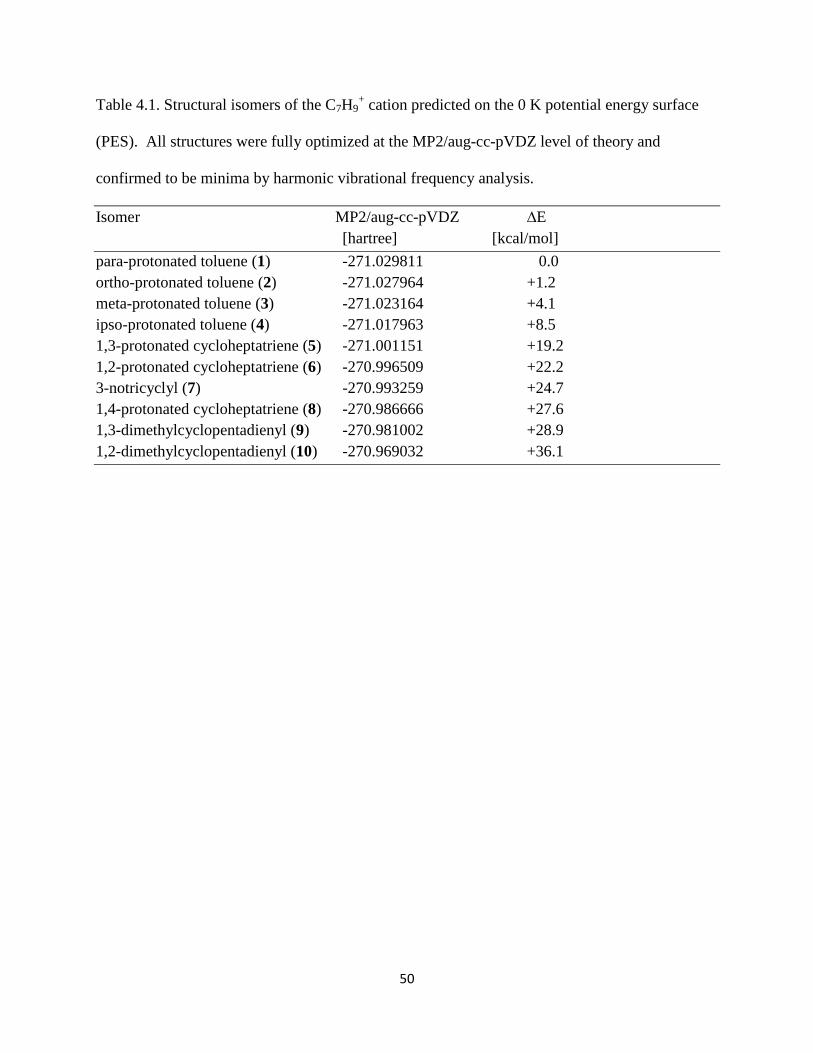
50
Table 4.1. Structural isomers of the C7H9+ cation predicted on the 0 K potential energy surface
(PES). All structures were fully optimized at the MP2/aug-cc-pVDZ level of theory and
confirmed to be minima by harmonic vibrational frequency analysis.
Isomer MP2/aug-cc-pVDZ ∆E
[hartree] [kcal/mol]
para-protonated toluene (1) -271.029811 0.0
ortho-protonated toluene (2) -271.027964 +1.2
meta-protonated toluene (3) -271.023164 +4.1
ipso-protonated toluene (4) -271.017963 +8.5
1,3-protonated cycloheptatriene (5) -271.001151 +19.2
1,2-protonated cycloheptatriene (6) -270.996509 +22.2
3-notricyclyl (7) -270.993259 +24.7
1,4-protonated cycloheptatriene (8) -270.986666 +27.6
1,3-dimethylcyclopentadienyl (9) -270.981002 +28.9
1,2-dimethylcyclopentadienyl (10) -270.969032 +36.1

51
Figure 4.3. Ten C7H9+ structures optimized at the MP2/aug-cc-pVDZ level of theory. Relative
energies are corrected for zero-point energy effects.
52
spectrum for 7 in a superacid matrix.32
This structural isomer is analogous to the infamous 2-
norbornyl cation. The remaining two structures are the 1,3- (9) and 1,2- (10) isomers of
dimethylcyclopentadienyl cation. These structures are much more energetic than para-protonated
toluene, lying +28.9 and +36.1 kcal/mol higher in energy. Of particular interest is 9, which is
analogous to the C7H11+ global minimum structure, DMCP. Previous results show that DMCP is
present in our ion source under the conditions used here. 42
When we compare the predicted
spectra for the nine higher energy isomers computed at the B3LYP/6-311+G** level of theory to
our spectrum, only those peaks predicted for 9 satisfactorily match any of the new bands.
The predicted spectrum for 9−Ar, obtained at the B3LYP/6-311+G** level of theory, is
presented in Figure 4.2 (blue trace, bottom). The higher frequency vibrations corresponding to
C−H stretching modes are scaled by a factor of 0.969 to correct for vibrational anharmonicity,45
whereas the lower frequency vibrations are presented unscaled. The predicted frequencies and
their infrared intensities are given in Table 4.2 in comparison to the observed infrared bands.
Several bands are predicted in the fingerprint region at 1097, 1186, 1343, 1421, 1431 and 1519
cm-1. These bands arise from C−H bending and carbon stretching modes (see vibrational
assignments in Table 4.2). In the C−H stretching region, a single strong band is predicted for 9-
Ar, corresponding to overlapping methyl stretches. Two bands with moderate intensity are
predicted at 3051 cm-1
and 3137 cm-1, corresponding to the methyl and allyl C−H stretches. All
of the new experimental features are accounted for, and there are no obvious bands predicted for
9−Ar above 1000 cm-1
that are not observed. Evidently, our experiment produces 9 in addition
to 1.
Figure 4.2 shows the predicted spectrum of 1−Ar (red trace, second from top) in
comparison to the experimental spectra. The fingerprint region of the predicted spectrum is
presented unscaled. All of the predicted bands appear to the blue of the experimental bands for

53
Table 4.2. Vibrational bands for 1 and 9 compared to the predictions of theory. Frequencies are
in cm-1
; intensities in parentheses are in km/mol.
Exp.a DFT [1]
b Toluene−H
+c DFT[9]
b Assignment
d
1100 1097 (70.8) iph methyl ip CH wag/allyl CH wag
1195 1207 (47.2) 1204 1186 (154.3) allyl ip CH wag
1263 1264/1277
1309 1339 (43.0) 1323
1392 1343 (177.6) ooph methyl CH2 scissors
1475 1473/1487 1421 (86.0) iph δ-methyl deform
1431.7 (325.4) ooph δ-methyl deform/allyl CH wag
1512 1519 (368.5) asym allyl CCC str
1616 1649 (185.6) 1623
2836 2862 (32.9) 2835
2870 (38.7)
2908 2903 (35.6) 2914 2880 (175.5) ooph sym methyl str
2903 (35.6) 2907 (12.7) iph asym methyl str
3085 3051 (14.4) ooph methyl ip CH str
3051 (14.3) iph methyl ip CH str
3124 3094 (16.0) 3137 (13.2) allyl CH str aThis work.
bC−H stretching frequencies scaled by 0.969; low frequencies are left unscaled; basis
sets were 6-311+G** for all atoms. cFrom ref. 3.
dNotation: in phase (iph), out of phase (ooph),
in plane (ip), out of plane (oop).
54
1−Ar. However, when standard scaling is applied, the agreement between experiment and
theory is not as good. Hence, we choose to report the values in this region as unscaled harmonic
vibrations. In contrast, the predicted bands for 9−Ar appear very close to, or at slightly lower
frequencies than the experimental bands. The C−H stretching region is scaled by a factor of
0.969.45
Again, predictions for 1−Ar are not a perfect match, but the agreement is reasonable.
Any differences between theory and experiment in this region can be attributed to imperfect
scaling, both for the predicted spectrum of 1 and that of 9.
The cation we observed (apparently for the first time) is fascinating in its own right.
Although this structure has been investigated via X-ray crystallography as a ligand in neutral π-
hydrocarbon complexes,46, 47
it has never been characterized in its cationic state to our
knowledge. The strong 1512 cm-1
band corresponds to the C−C−C asymmetric allyl stretch.
This frequency is very close to the corresponding vibration of DMCP at 1525 cm-1
.
Additionally, the corresponding vibrations of the allyl cation (1581 cm-1
),18
protonated benzene
(1607 cm-1
),37
protonated toluene (1623 cm-1
),37
and protonated naphthalene (1620 cm-1
),48
are
all higher in frequency. Apparently, this is the lowest frequency measured yet for this type of
vibration. The prominent 2908 cm-1
absorption corresponds to overlapping methyl C−H
stretches, which are observed at 2910 cm-1
for DMCP. 9's allyl C−H stretch occurs at 3124 cm-1
.
The corresponding vibration of DMCP occurs at 3101 cm-1
. The spectral similarities between 9
and DMCP are due do the very similar structural motifs. Thus, the assignment of the new bands
to 9 is unambiguous.
Like the analogous DMCP cation, 9's structure contains carbocation-stabilizing features:
a five-membered ring allyl resonance and optimally-placed methyl substituents. Unlike DMCP,
however, 9 is much higher in energy than the corresponding global minimum structure. This can
be explained in part due to a special carbocation problem: with 4 π electrons, 9 is anti-aromatic.
55
Despite its apparent instability, we observe this structure, and not any of the other higher energy
isomers observed previously (see Figure 4.3).27, 28, 32
The complex plasma reaction pathways
form this ion in our source, possibly via H2 loss from DMCP, in addition to the global minimum
structure. That the higher energy isomer survives long enough for spectral analysis (on the order
of milliseconds) means there must be a significant local well on the potential energy surface, and
rapid collisional cooling traps the metastable ion behind a barrier. Thus, infrared spectroscopy in
a supersonic expansion allows for the capture and study of transient species.
Conclusion
The C7H9+ carbocation is produced from norbornene and characterized with infrared
spectroscopy. The global minimum structure is observed, as well as another higher energy
isomer. An extensive investigation of the potential surface reveals multiple C7H9+ isomers.
Comparison between theory and experiment confirms that the structure of the dimethyl-
cyclopentadienyl cation is produced along with para-protonated toluene. This metastable species
is formed via an unknown mechanism in our source and kinetically trapped, allowing to measure
its infrared spectrum for the first time.

56
References
(1) Bowers, M. T., Gas Phase Ion Chemistry, Vol 3: Ions and Light. Academic Press: New
York, 1984.
(2) Baer, T.; Ng, C.; Powis, I., The Structure, Energetics, and Dynamics of Organic Ions.
Wiley: New York, 1996.
(3) Holmes, J. L.; Aubrey, C.; Mayer, P. M., Assigning Structures to Ions in Mass
Spectrometry. CRC Press: Boca Raton, FL, 2007.
(4) Yeh, L. I.; Lee, Y. T., Infrared-spectroscopy of the penta-coordinated carbonium-ion
C2H7+. J. Am. Chem. Soc. 1989, 111 (15), 5597-5604.
(5) Boo, D. W.; Lee, Y. T., Infrared-spectra of CH5+ core in CH5
+ (H2). Chem. Phys. Lett.
1993, 211 (4-5), 358-363.
(6) Bieske, E. J.; Dopfer, O., High-resolution spectroscopy of cluster ions. Chem. Rev. 2000,
100, 3963-3998.
(7) Duncan, M. A., Frontiers in the spectroscopy of mass-selected molecular ions. Int. J.
Mass Spectrom. 2000, 200, 545-569.
(8) Olah, G. A.; Prakash, G. K., Carbocation Chemistry. John Wiley and Sons: New York,
2004.
(9) Schleyer, P. V. R.; Prakash, G. K., Stable Carbocation Chemistry. John Wiley and Sons:
New York, 1997.
(10) Aue, D. H., Carbocations. Wiley Int. Rev.: Comp. Mol. Sci. 2011, 1 (4), 487-508.
(11) Olah, G. A.; Schlosberg, R. H.; Kelly, D. P.; Mateescu, G. D., Stable carbonium ions. IC.
Benzenonium ion (C6H7+) and its degenerate rearrangement. J. Am. Chem. Soc. 1970, 92
(8), 2546-2548.
57
(12) Olah, G. A.; Staral, J. S.; Asencio, G.; Liang, G.; Forsyth, D. A.; Mateescu, G. D., Stable
carbocations. 215. Carbon-13 nuclear magnetic resonance spectroscopic study of the
benzenium, naphthalenium, and anthracenium ions. J. Am. Chem. Soc. 1978, 100, 6299.
(13) Perkampus, H. H.; Baumgarten, E., Proton-Addition Complexes of Aromatic
Hydrocarbons. Angewandte Chemie International Edition in English 1964, 3 (12), 776-
783.
(14) Hehre, W. J.; McIver, R. T.; Pople, J. A.; Schleyer, P. V., Alkyl substituent effects on
stability of protonated benzene. J. Am. Chem. Soc. 1974, 96 (22), 7162-7163.
(15) Kuck, D.; Schneider, J.; Grutzmacher, H. F., A Study of Gaseous Benzenium and
Toluenium Ions Generated from 1,4-Dihydro-Benzoic and 1-Methyl-1,4-Dihydro-
Benzoic Acids. J. Chem. Soc. Perk. T. 2 1985, (5), 689-696.
(16) Dopfer, O.; Roth, D.; Maier, J. P., Interaction of C3H3+ isomers with molecular nitrogen:
IR spectra of C3H3+-(N-2)(n) clusters (n=1-6). Int. J. Mass Spectrom. 2002, 218 (3),
281-297.
(17) Ricks, A. M.; Douberly, G. E.; Schleyer, P. v. R.; Duncan, M. A., Communications:
Infrared spectroscopy of gas phase C3H3+ ions: The cyclopropenyl and propargyl cations.
J. Chem. Phys. 2010, 132 (5), 051101.
(18) Douberly, G. E.; Ricks, A. M.; Schleyer, P. v. R.; Duncan, M. A., Infrared spectroscopy
of gas phase C3H5+: The allyl and 2-propenyl cations. J. Chem. Phys. 2008, 128, 021102.
(19) Dunbar, R. C., Nature of the C7H7+ ions from toluene parent ion photodissociation. J. Am.
Chem. Soc. 1975, 97 (6), 1382-1384.
(20) Lifshitz, C.; Gotkis, Y.; Ioffe, A.; Laskin, J.; Shaik, S., Is the tropylium ion (Tr+) formed
from toluene at its thermochemical threshold? Intl. J. Mass Spectrom. Ion Proc. 1993,
125 (1), R7-R11.

58
(21) Lifshitz, C., Tropylium ion formation from toluene: Solution of an old problem in organic
mass spectrometry. Acc. Chem. Res. 1994, 27 (5), 138-144.
(22) Nagy, A.; Fulara, J.; Garkusha, I.; Maier, J. P., On the benzylium/tropylium ion
dichotomy: Electronic absorption spectra in neon matrices. Angew. Chem. 2011, 123
(13), 3078-3081.
(23) Dryza, V.; Chalyavi, N.; Sanelli, J. A.; Bieske, E. J., Electronic absorptions of the
benzylium cation. J. Chem. Phys. 2012, 137 (20), 204304.
(24) Devlin, J. L.; Wolf, J. F.; Taft, R. W.; Hehre, W. J., The proton affinities of toluene. J.
Am. Chem. Soc. 1976, 98 (7), 1990-1992.
(25) Arnett, E. M.; Abboud, J. L. M., Baker-nathan effect on solvation energies of
benzenonium and other organic ions. J. Am. Chem. Soc. 1975, 97 (13), 3865-3867.
(26) Lau, Y. K.; Kebarle, P., Substituent effects on the intrinsic basicity of benzene: proton
affinities of substituted benzenes. J. Am. Chem. Soc. 1976, 98 (23), 7452-7453.
(27) Salpin, J. Y.; Mormann, M.; Tortajada, J.; Nguyen, M. T.; Kuck, D., The gas-phase
basicity and proton affinity of 1,3,5-cycloheptatriene - energetics, structure and
interconversion of dihydrotropylium ions. Eur. J. Mass Spectrom. 2003, 9 (4), 361-376.
(28) Mormann, M.; Kuck, D., Hydride abstraction from 1,3,5-cycloheptatriene by gaseous
carbenium ions, as studied by Fourier transform ion cyclotron resonance kinetics and
deuterium labeling. J. Phys. Org. Chem. 2003, 16 (10), 746-752.
(29) Mormann, M.; Salpin, J.-Y.; Kuck, D., Gas-phase titration of C7H9+ ion mixtures by FT-
ICR mass spectrometry: Semiquantitative determination of ion populations generated by
CI-induced protonation of C7H8 isomers and by EI-induced fragmentation of some
monoterpenes. Int. J. Mass Spectrom. 2006, 249–250 (0), 340-352.
59
(30) Kuck, D., Half a century of scrambling in organic ions: complete, incomplete,
progressive and composite atom interchange. Int. J. Mass Spectrom. 2002, 213 (2–3),
101-144.
(31) Olah, G. A.; Schlosberg, R. H.; Porter, R. D.; Mo, Y. K.; Kelly, D. P.; Mateescu, G. D.,
Stable carbocations .124. Benzenium ion and monoalkylbenzenium ions. J. Am. Chem.
Soc. 1972, 94 (6), 2034.
(32) Olah, G. A.; Liang, G., Stable carbocations. CLXXVI. 3-Nortricyclyl cations. Question
of charge delocalization in rigid cyclopropylcarbinyl systems. J. Am. Chem. Soc. 1975,
97 (7), 1920-1927.
(33) Masamune, S.; Sakai, M.; Ona, H.; Jones, A. J., Nature of the (CH)5+ species. II. Direct
observation of the carbonium ion of 3-hydroxyhomotetrahedrane derivatives. J. Am.
Chem. Soc. 1972, 94 (25), 8956-8958.
(34) Kemp-Jones, A. V.; Nakamura, N.; Masamune, S., A bishomo square-pyramidal
carbonium ion. J. Chem. Soc. Chem. Commun. 1974, (3), 109-110.
(35) Dopfer, O.; Lemaire, J.; Maître, P.; Chiavarino, B.; Crestoni, M. E.; Fornarini, S., IR
spectroscopy of protonated toluene: Probing ring hydrogen shifts in gaseous arenium
ions. Int. J. Mass Spectrom. 2006, 249–250 (0), 149-154.
(36) Schroder, D.; Schwarz, H.; Milko, P.; Roithova, J., Dissociation routes of protonated
toluene probed by infrared spectroscopy in the gas phase. J. Phys. Chem. A 2006, 110
(27), 8346-8353.
(37) Douberly, G. E.; Ricks, A. M.; Schleyer, P. V. R.; Duncan, M. A., Infrared spectroscopy
of gas phase benzenium ions: Protonated benzene and protonated toluene, from 750 to
3400 cm-1
. J. Phys. Chem. A 2008, 112 (22), 4869-4874.
60
(38) Gassman, P. G.; Creary, X., C7H9 cation manifold. Interconversion of a series of
potentially bishomoantiaromatic ions. J. Am. Chem. Soc. 1973, 95 (20), 6852-6853.
(39) Dewar, M. J. S.; Dieter, K. M., Evaluation of AM1 calculated proton affinities and
deprotonation enthalpies. J. Am. Chem. Soc. 1986, 108 (25), 8075-8086.
(40) Rasul, G.; Prakash, G. K. S.; Olah, G. A., Comparative study of the hypercoordinate ions
C7H9+ and C8H9
+ by the ab initio/GIAO-CCSD(T) method. J. Phys. Chem. A 2006, 110
(39), 11320-11323.
(41) Siehl, H.-U., The interplay between experiment and theory: computational NMR
spectroscopy of carbocations. In Advances in Physical Organic Chemistry, Richard, J. P.,
Ed. Academic Press: 2007; Vol. 42, pp 125-165.
(42) Mosley, J. D.; Young, J. W.; Agarwal, J.; Schaefer, H. F.; Schleyer, P. v. R.; Duncan, M.
A., Structural isomerization of the gas phase 2-norbornyl cation revealed with infrared
spectroscopy and computational chemistry. Angew. Chem. Int. Ed. 2014, in press.
(43) Duncan, M. A., Infrared laser spectroscopy of mass-selected carbocations. J. Phys. Chem.
A 2012, 116 (47), 11477-11491.
(44) Schmidt, M. W.; Baldridge, K. K.; Boatz, J. A.; Elbert, S. T.; Gordon, M. S.; Jensen, J.
H.; Koseki, S.; Matsunaga, N.; Nguyen, K. A.; Su, S.; Windus, T. L.; Dupuis, M.;
Montgomery, J. A., General atomic and molecular electronic structure system. J. Comput.
Chem. 1993, 14 (11), 1347-1363.
(45) Merrick, J. P.; Moran, D.; Radom, L., An evaluation of harmonic vibrational frequency
scale factors. J. Phys. Chem. A 2007, 111 (45), 11683-11700.
(46) Kirss, R. U., Electrocyclic reactions of open metallocenes: Carbon-carbon bond
formation during thermolysis of bis(2,4-dimethyl-1,3-pentadienyl)ruthenium and -
osmium. Organometallics 1992, 11 (2), 497-499.
61
(47) Kirss, R. U.; Quazi, A.; Lake, C. H.; Churchill, M. R., Synthesis of unsymmetrical
ruthenocenes by gas phase electrocyclic reactions of pentadienylruthenium complexes.
Organometallics 1993, 12 (10), 4145-4150.
(48) Ricks, A. M.; Douberly, G. E.; Duncan, M. A., The infrared spectrum of protonated
naphthalene and its relevance for the unidentified infrared bands. Astrophys. J. 2009, 702
(1), 301-306.
62
CHAPTER 5
INFRARED SPECTROSCOPY OF THE MASS 31 CATION:
PROTONATED FORMALDEHYDE VS METHOXY
Introduction
The ion at m/z = 31 is produced as an abundant fragment in the ionization of methanol, ethanol,
dimethyl ether, and other small oxygen-containing molecules.1 This ion has been the subject of much
study and discussion in the mass spectrometry community for many years.2-22
Two important structures
are recognized, the CH2OH+ protonated formaldehyde ion and the CH3O
+ methoxy cation. The HCOH2
+
oxonio-methylene ion was also proposed on the basis of computational studies,8 but there is apparently no
experimental evidence for this species. In early studies on low temperature ions, evidence was found for
a weakly bound HCO+−H2 complex.
4-6 As shown in Figure 5.1, protonated formaldehyde has a singlet
ground state and is by far the most stable structure. Methoxy cation lies +96.0 kcal/mol above this, with a
triplet ground state. Therefore, interconversion of these two ions requires a curve crossing, which has
been estimated to lie +14.3 kcal/mol above the methoxy ground state.20
Oxonio-methylene is also a
singlet, lying +82.9 kcal/mol above protonated formaldehyde.8 The collisional dissociation of a variety of
ions having m/z=31 produces fragmentation with an m/z = 15:14 peak ratio of about 0.03, suggesting that
the most common structure produced is protonated formaldehyde. Different fragmentation (an intense
m/z=15 peak) attributed to methoxy cation can be produced by charge reversal of the corresponding
anions.7, 12
Attempts to detect methoxy by ionization of neutral CH3O radicals from various sources were
unsuccessful.17
Instead, HCO+ ions were detected at a higher photoionization threshold, presumably by
prompt fragmentation of the nascent CH3O+. Collisional dissociation of [C,H3,O]
+ proceeds by
elimination of H2 with significant translational energy release.15, 19-21
However, the energy release is the

63
Figure 5.1. Schematic energy level diagram showing the relative energies of methoxy, protonated
formaldehyde and oxonio-methylene as well as the energies of the curve crossings connecting these
species.
64
same for ions believed to have either the CH3O+ or CH2OH
+ structures. This has been interpreted to
indicate that methoxy crosses over into the protonated formaldehyde structure before dissociating,
although it has also been proposed that methoxy dissociates directly to HCO+ + H2.
20 The protonated
formaldehyde ion has been characterized with gas phase infrared spectroscopy via an O–H stretching
vibration23
and with millimeter wave measurements;24
it has also been detected in interstellar space.25
The vibrational spectrum of protonated formaldehyde has also been investigated computationally,26-29
but
there is no spectroscopy of the methoxy cation to our knowledge. Here we describe the infrared
spectroscopy of the mass-selected m/z=31 ion, produced via discharge in a supersonic expansion, which
shows that both protonated formaldehyde and the methoxy cation structures are present.
Experimental details
Ions for these experiments are produced in a pulsed discharge/supersonic expansion source using
needle electrodes, as described previously.30
The expansion gas is argon seeded with the ambient vapor
pressure of methanol or ethanol at room temperature. The discharge is activated for a 5–10 microsecond
duration in the center of a 250–300 microsecond gas pulse. After this, ions expand supersonically to form
a dense, cold plasma. This beam is collimated by a skimmer before sampling by a reflectron time-of-
flight mass spectrometer (RTOF) in a differentially pumped chamber.31
Ions are extracted perpendicular
to their flight direction from the molecular beam into the RTOF. To select specific ions for
photodissociation, pulsed deflection plates are employed at the end of the first flight tube section. Ions
are excited with the tunable infrared laser in the turning region of the reflectron, and mass analysis of any
fragmentation peaks occurs in a second flight tube section.31
The IR laser is a Nd:YAG-pumped optical
parametric oscillator/amplifier (OPO/OPA; LaserVision). In its normal operating configuration,32
a KTP
oscillator pumped at 532 nm and a KTA difference frequency generation (idler + 1064 nm) amplifier
provides tunable output in the 2000-4500 cm-1
region with a line width of about 1 cm-1
. In a second
configuration, another stage of difference frequency generation in AgGaSe2 provides output in the 800-
2200 cm-1
range.33
65
Computational studies are carried out at the MP2/cc-pVTZ and DFT/B3LYP levels of theory
using the Gaussian03 program package.34
Energetics are reported from the MP2 calculations, while
vibrational spectra are those from DFT/B3LYP, taking advantages of the best performance of each
method as noted in previous work from our lab.30
A vibrational scaling factor of 0.9682 was employed
for the DFT/B3LYP spectra, as recommended by Radom and coworkers for this level of theory.35
Results and discussion
Electrical discharges in methanol or ethanol produce a complex mass spectrum containing many
fragment ions and their clusters with precursor molecules and with argon. A representative mass
spectrum is shown in Figure 5.2. The m/z 31 ion is seen in high abundance when ethanol is used as the
precursor. Several other fragment ions are observed with varying intensities in our source. Notably, the
cluster of argon with the m/z 31 ion, observed at m/z 71, is only a few percent as intense as the untagged
species. Employing mass selection (Figure 5.2, navy trace, middle) allows for signal amplification of the
ion of interest, and efficient photodissociation is observed upon resonant absorption by the m/z 31 ion.
The infrared photodissociation spectrum measured for [C,H3,O]+Ar produced in a discharge of
ethanol, obtained by loss of Ar is presented in Figure 5.3. An intense resonance near 3182 cm-1
dominates the spectrum, but there are vibrational bands throughout the 1000 to 3500 cm-1
region. The
3182 cm-1
band is in the region where an O–H stretch is expected for protonated formaldehyde, although
this band is shifted significantly to lower energy compared to the O–H stretch seen by Amano and
coworkers at 3422.8 cm-1
.23
Bands near 2700 cm-1
can be associated with C–H stretches, while those in
the 1000-1600 cm-1
region should be C−H bending and carbonyl stretching vibrations. We use
computational chemistry of the three isomer possibilities for these ions to investigate detailed assignments
for these bands. Table 5.1 shows the relative energies for the three isomers at both the MP2 and
DFT/B3LYP levels of theory. As expected from previous work, protonated formaldehyde is far more
stable than either the methoxy or oxonio-methylene ions, and their relative energies are completely
consistent with previous results.2-5, 8, 10, 13, 16, 20
We have not investigated the energies of the singlet/triplet
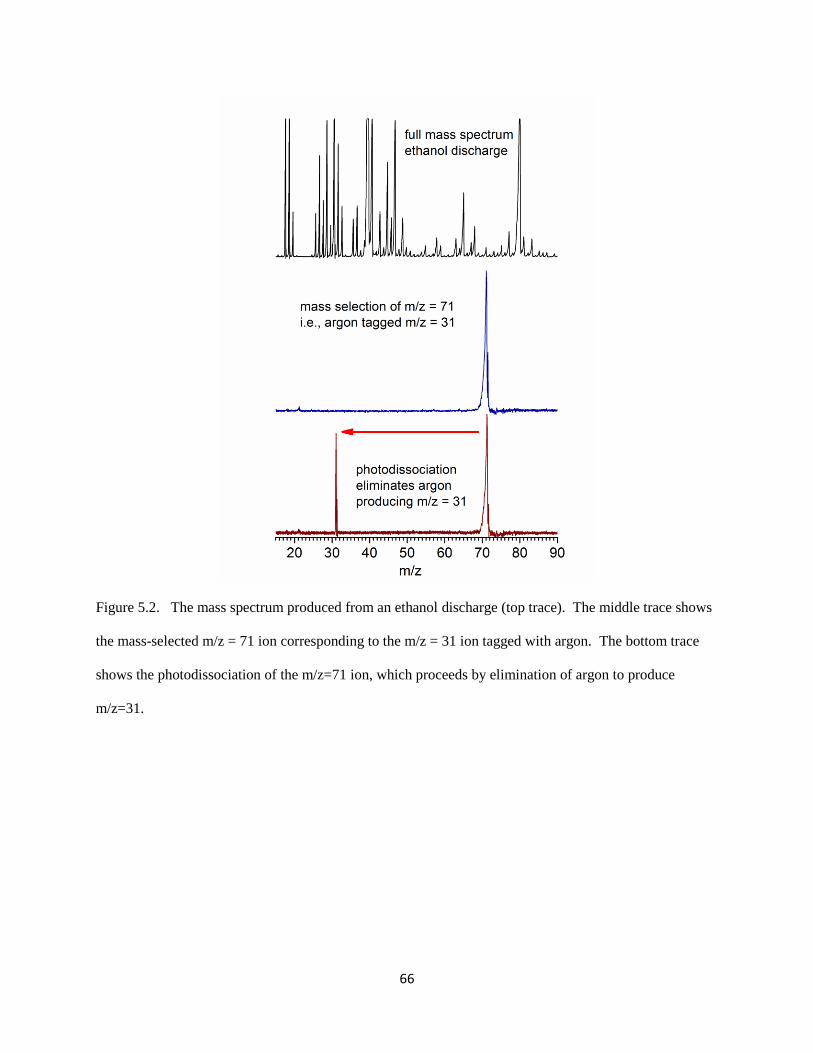
66
Figure 5.2. The mass spectrum produced from an ethanol discharge (top trace). The middle trace shows
the mass-selected m/z = 71 ion corresponding to the m/z = 31 ion tagged with argon. The bottom trace
shows the photodissociation of the m/z=71 ion, which proceeds by elimination of argon to produce
m/z=31.

67
Figure 5.3. The infrared photodissociation spectrum of the mass 31 cation obtained by tagging it with
argon and measuring the argon elimination mass channel.

68
Table 5.1. Relative energies of [C,H3,O]+ isomers with and without argon at the DFT/B3LYP and MP2
levels of theory with the correlation consistent Dunning triple ζ basis set. All energetics are corrected for
zero point energy.
Isomer ∆E (MP2) ∆E (B3LYP)
CH2OH+
0.0 0.0
CHOH2+
+81.1 +78.3
CH3O+
+91.3 +72.8
CH2OH+-Ar 0.0 0.0
CHOH2+-Ar +79.8 +76.9
CH3O+-Ar (1) +93.3 +73.8
CH3O+-Ar (2) +93.7 +75.5
CH3O+-Ar (3) +93.9 +75.1
69
curve crossing for methoxy/protonated formaldehyde; instead, we use here the previous results of
Schwarz and coworkers.20
The oxonio-methylene energetics shown are those from Radom and
coworkers.8
Figure 5.4 shows an expanded view of the mass 31 ion spectrum compared to the predictions of
theory for the protonated formaldehyde, methoxy and oxonio-methylene cations, each with attached
argon. The computed band intensities are those for linear absorption, while those in the experiment are
determined by the absorption strength, the photodissociation yield and the IR laser power, which falls
gradually toward lower energy. We normalize the data to parent ion intensity variations, but not to the
laser power because the beam shape and hence the overlap with the ion beam changes across the
spectrum. Therefore, band positions are more significant than intensities, especially when comparing
different ends of the spectrum.
It is immediately apparent that many of the bands here can be assigned to the protonated
formaldehyde cation. The strong 3182 cm-1
feature is reproduced reasonably well in position and
intensity for the O–H stretch vibration. The different position of this band compared to the vibration in
the isolated ion23
results from the argon atom attaching to the proton, which induces a strong red shift.
This can be seen via calculations with and without argon (see Figure 5.5), and large red shifts have been
seen for other ions with argon attached at a proton site.30
Additionally, changing the tag atom to neon
largely eliminates the red shift, as shown in Figure 5.6. Just below the 3182 cm-1
feature, we see weak
bands assigned to the symmetric (2967 cm-1
) and asymmetric (3124 cm-1
) CH2 stretches that were not
reported previously, but agree well with the predictions of theory. The bands at lower frequency for
protonated formaldehyde have also not been reported previously, but all have been predicted before with
computational chemistry.26-29
These include the carbonyl stretch (1628 cm-1
), the CH2 scissors vibration
(1449 cm-1
) and the COH+ in-plane hydrogen bend (1351 cm
-1). These vibrations are all reproduced well
by our theory, including the argon, and are in good agreement with previous theory without argon,26-29
because the shift from the argon is small. The photodissociation signal drops off below the 1351 cm-1
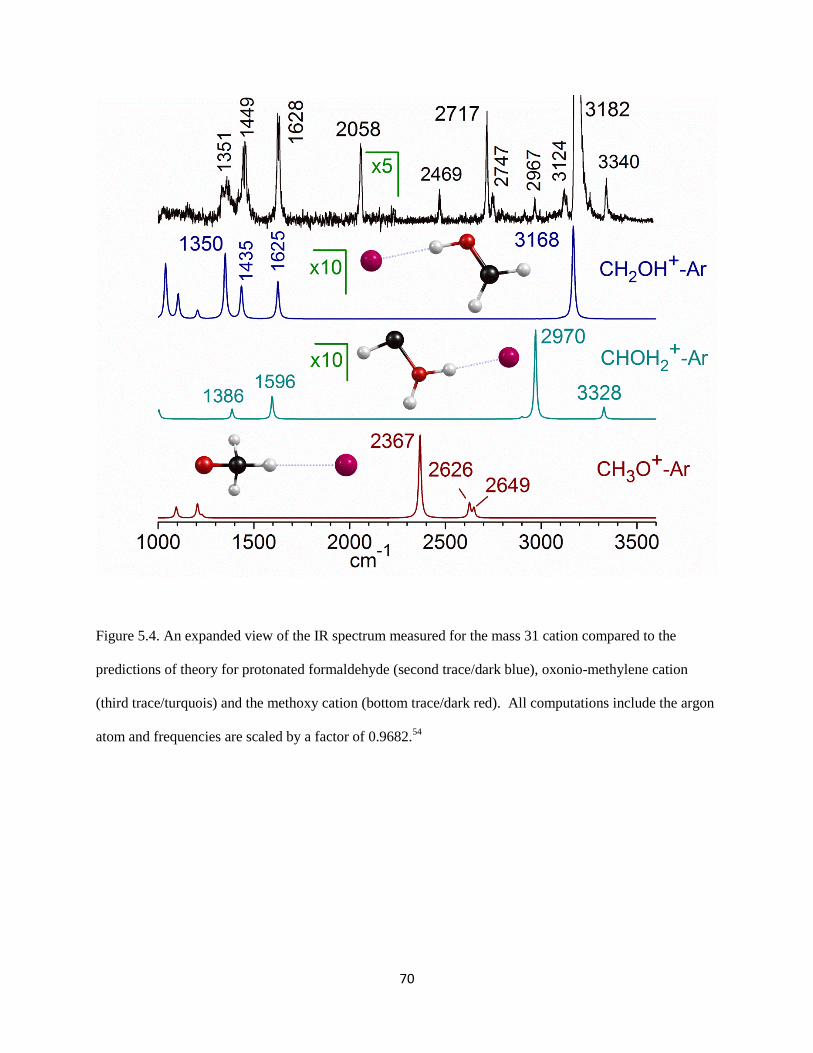
70
Figure 5.4. An expanded view of the IR spectrum measured for the mass 31 cation compared to the
predictions of theory for protonated formaldehyde (second trace/dark blue), oxonio-methylene cation
(third trace/turquois) and the methoxy cation (bottom trace/dark red). All computations include the argon
atom and frequencies are scaled by a factor of 0.9682.54

71
Figure 5.5. The optimized geometries of protonated formaldehyde (CH2OH+) with and without argon
calculated at the MP2/cc-pVTZ level of theory using Gaussian03. Bond lengths are in Ångstroms. Bond
angles are in degrees.

72
Figure 5.6. The O−H stretching band of [C,H3,O]+Ne obtained by loss of neon.
73
band, most likely due to the bond energy of the argon tag. This is computed to be 4.4 kcal/mol (1540
cm-1
) for protonated formaldehyde at the MP2 level and 1.7–2.1 kcal/mol for the different argon isomers
of methoxy (see discussion below).
The vibrational frequencies for protonated formaldehyde can be compared to those of
formaldehyde itself.36
The carbonyl stretch of protonated formaldehyde (1628 cm-1
) is shifted to much
lower frequency than that in formaldehyde (1746.1 cm-1
), suggesting that protonation weakens the C=O
bond. This presumably is due to the proton's withdrawing electron density from the bond. This is
consistent with the computed C=O bond distance in protonated formaldehyde (1.248 Å at the MP2 level;
see Figure 5.5) being longer than that in formaldehyde (1.205 Å). Likewise, the CH2 scissors frequency
here (1449 cm-1
) is lower than in formaldehyde (1500.1 cm-1
), again consistent with a less rigid system.
A similar trend is found for the formaldehyde cation,36
which also has lower C=O (1675 cm-1
) and CH2
scissors (1210 cm-1
) vibrations than neutral formaldehyde. The lower frequency bands at 1351, 1449 and
1628 cm-1
can also be compared to the vibrations in high Rydberg states of the CH2OH hydroxymethyl
radical that converge to the protonated formaldehyde ground state.37-39
As shown in Table 5.2, each of
these vibrations occurs within a few cm-1
of the frequencies seen here.
Bands in the middle of the spectrum are not readily assigned to fundamentals of protonated
formaldehyde. These include the feature at 2058 cm-1
and the group of bands at 2469, 2717 and 2747 cm-
1. Additionally, a less intense but noticeable band at 3340 cm
-1 cannot be immediately identified. We
consider the 2469, 2717 and 2747 cm-1
group of bands first. Protonated formaldehyde has no vibrations
in this region, but the triplet methoxy cation does have bands predicted here, as shown in the lower trace
of Figure 5.4. Although three bands are predicted for CH3O+Ar, the pattern of peak positions and
intensities from theory does not match the experiment. Because we use the method of argon tagging, and
because argon often binds in more than one position on other ions,40
we conducted a careful study of its
binding sites on methoxy and their influence on the vibrational patterns (a similar study on protonated
formaldehyde found only the Ar-on-H+ isomer). Three binding sites for argon attached to methoxy
correspond to stable minima. Table 5.1 presents the energies for these complexes, and Figure 5.7 shows
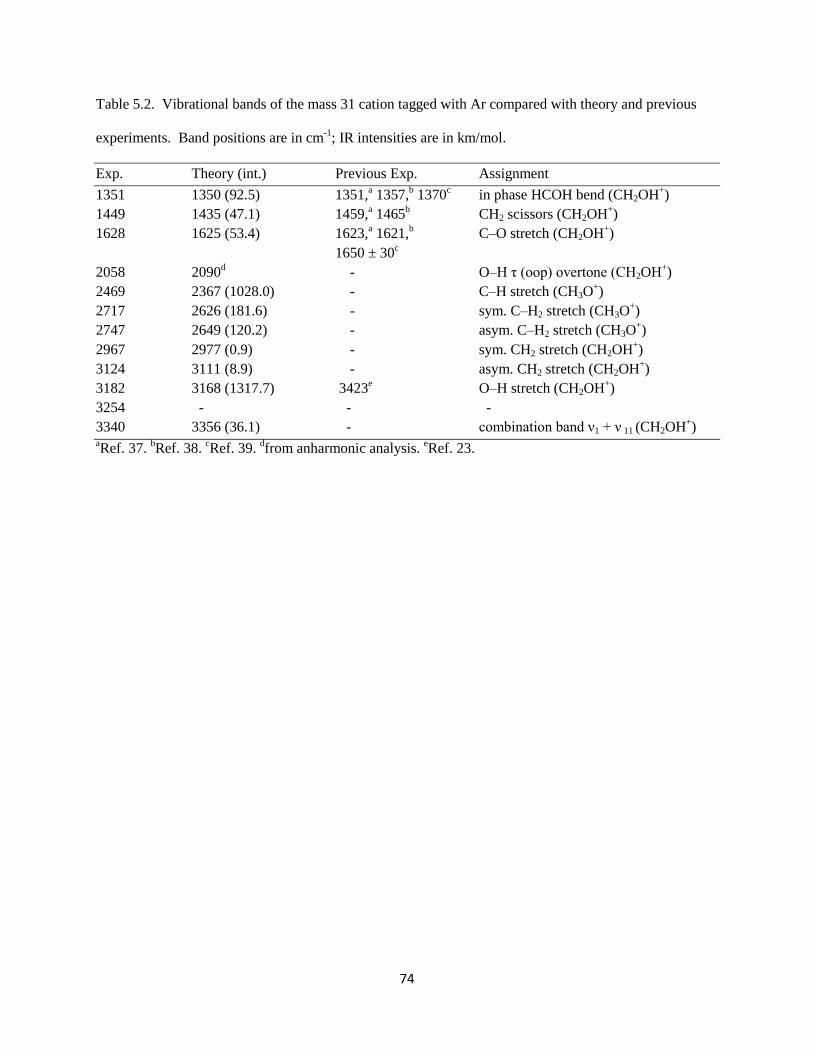
74
Table 5.2. Vibrational bands of the mass 31 cation tagged with Ar compared with theory and previous
experiments. Band positions are in cm-1
; IR intensities are in km/mol.
Exp. Theory (int.) Previous Exp. Assignment
1351 1350 (92.5) 1351,a 1357,
b 1370
c in phase HCOH bend (CH2OH
+)
1449 1435 (47.1) 1459,a 1465
b CH2 scissors (CH2OH
+)
1628 1625 (53.4) 1623,a 1621,
b C–O stretch (CH2OH
+)
1650 ± 30c
2058 2090d - O–H τ (oop) overtone (CH2OH
+)
2469 2367 (1028.0) - C–H stretch (CH3O+)
2717 2626 (181.6) - sym. C–H2 stretch (CH3O+)
2747 2649 (120.2) - asym. C–H2 stretch (CH3O+)
2967 2977 (0.9) - sym. CH2 stretch (CH2OH+)
3124 3111 (8.9) - asym. CH2 stretch (CH2OH+)
3182 3168 (1317.7) 3423e O–H stretch (CH2OH
+)
3254 - - -
3340 3356 (36.1) - combination band ν1 + ν 11 (CH2OH+)
aRef. 37.
bRef. 38.
cRef. 39.
dfrom anharmonic analysis.
eRef. 23.
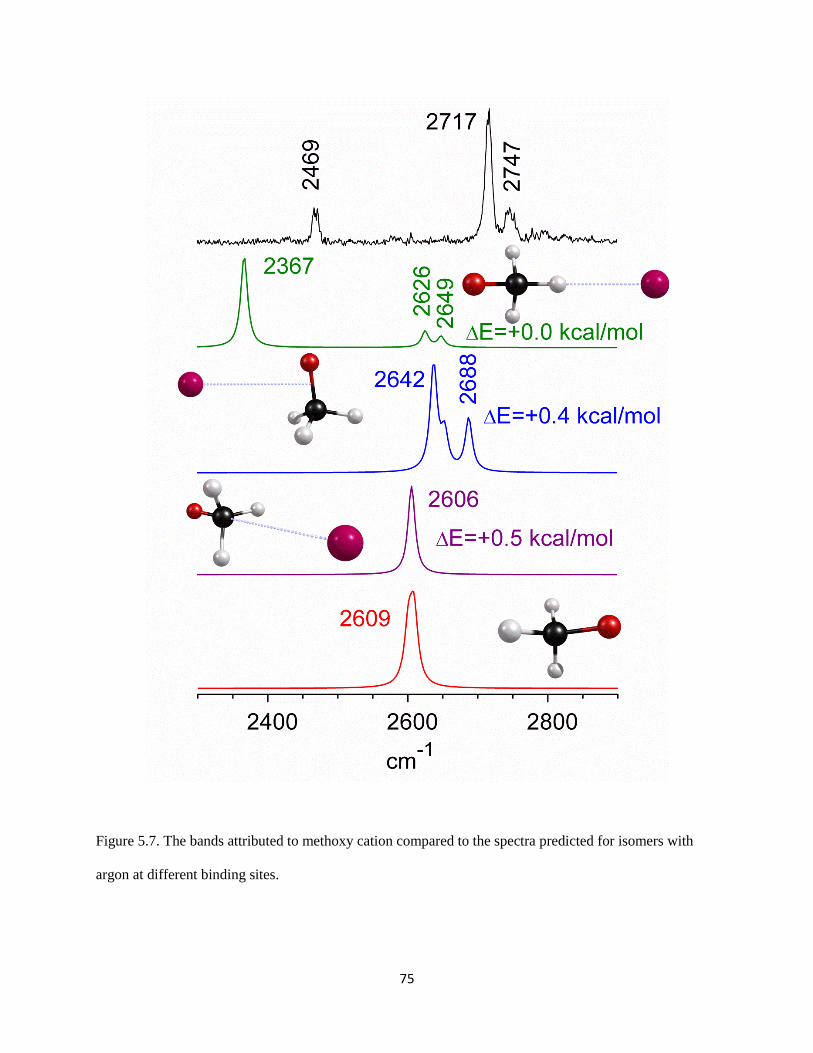
75
Figure 5.7. The bands attributed to methoxy cation compared to the spectra predicted for isomers with
argon at different binding sites.

76
their spectra compared to the experiment. These include the three-fold pocket between the CH groups
(Figure 5.7, purple trace, fourth from top), along the side of the CO bond (blue trace, third from top), and
a single CH site (green trace, second from top); the energies of these sites are extremely close. If argon
binds in the three-fold pocket on the C3 axis, the symmetry of the argon-free system is preserved, and two
overlapping C–H stretches are predicted (symmetric and degenerate asymmetric stretch) just as seen for
the isolated methoxy cation (red trace, bottom). If argon binds alongside the CO bond, the symmetry is
broken, and a symmetric/asymmetric pair is split from the remaining . If argon binds on a single CH
position, it interacts more strongly with one CH than the others, and this C–H stretch is strongly red
shifted with respect to the symmetric/asymmetric CH2 pair. Unfortunately, none of the vibrational
patterns computed for these limiting structures exactly matches the spectrum. The best match is for the
Ar-on-CH structure, which is computed to be most stable. It has three bands with about the right spacing,
with one more red-shifted than the other two, but the position and relative intensities don't match the
spectrum exactly. However, since the energy differences between these sites are so small, it is likely that
the potential for argon motion is quite flat and that the argon samples more than one of these
configurations. If we acknowledge that the level of theory employed (and perhaps the scaling factors) is
not ideal for such weak interactions, and that the zero point motion may exceed the barriers between
argon configurations, it is not too surprising that we do not have an exact match to the experimental
spectrum. The Ar-on-CH configuration produces a shifted band and a doublet, which is what we see in
the experiment, although the exact spacings and relative intensities are not perfect. It is likely that this
main configuration, and perhaps some dynamical averaging over nearby configurations, can explain the
spectrum. We therefore assign the 2469, 2717 and 2747 cm-1
bands to the C–H stretches of the methoxy
cation.
Detection of a stable methoxy cation living many hundreds of microseconds is surprising in light
of the difficulties in producing this species in the past and its high instability relative to protonated
formaldehyde. In additional tests to confirm this assignment, we first varied the precursor used to
produce the mass 31 cation. Experiments comparing methanol and ethanol produce the spectra shown in
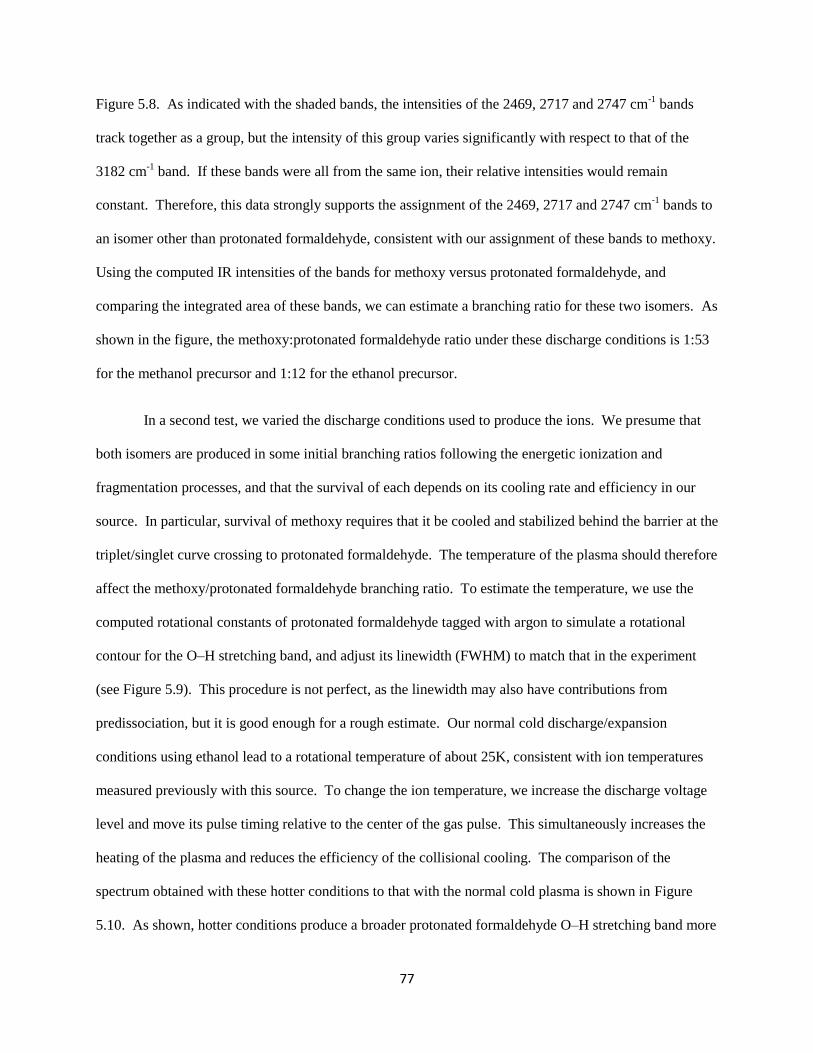
77
Figure 5.8. As indicated with the shaded bands, the intensities of the 2469, 2717 and 2747 cm-1
bands
track together as a group, but the intensity of this group varies significantly with respect to that of the
3182 cm-1
band. If these bands were all from the same ion, their relative intensities would remain
constant. Therefore, this data strongly supports the assignment of the 2469, 2717 and 2747 cm-1
bands to
an isomer other than protonated formaldehyde, consistent with our assignment of these bands to methoxy.
Using the computed IR intensities of the bands for methoxy versus protonated formaldehyde, and
comparing the integrated area of these bands, we can estimate a branching ratio for these two isomers. As
shown in the figure, the methoxy:protonated formaldehyde ratio under these discharge conditions is 1:53
for the methanol precursor and 1:12 for the ethanol precursor.
In a second test, we varied the discharge conditions used to produce the ions. We presume that
both isomers are produced in some initial branching ratios following the energetic ionization and
fragmentation processes, and that the survival of each depends on its cooling rate and efficiency in our
source. In particular, survival of methoxy requires that it be cooled and stabilized behind the barrier at the
triplet/singlet curve crossing to protonated formaldehyde. The temperature of the plasma should therefore
affect the methoxy/protonated formaldehyde branching ratio. To estimate the temperature, we use the
computed rotational constants of protonated formaldehyde tagged with argon to simulate a rotational
contour for the O–H stretching band, and adjust its linewidth (FWHM) to match that in the experiment
(see Figure 5.9). This procedure is not perfect, as the linewidth may also have contributions from
predissociation, but it is good enough for a rough estimate. Our normal cold discharge/expansion
conditions using ethanol lead to a rotational temperature of about 25K, consistent with ion temperatures
measured previously with this source. To change the ion temperature, we increase the discharge voltage
level and move its pulse timing relative to the center of the gas pulse. This simultaneously increases the
heating of the plasma and reduces the efficiency of the collisional cooling. The comparison of the
spectrum obtained with these hotter conditions to that with the normal cold plasma is shown in Figure
5.10. As shown, hotter conditions produce a broader protonated formaldehyde O–H stretching band more
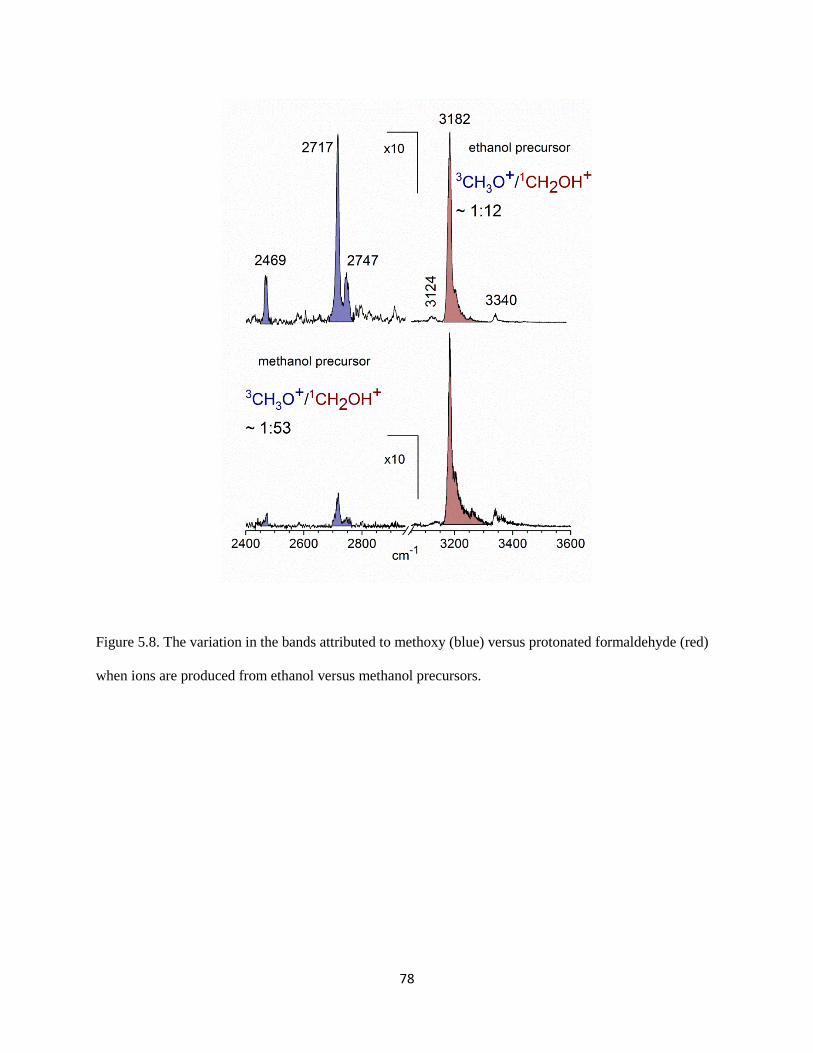
78
Figure 5.8. The variation in the bands attributed to methoxy (blue) versus protonated formaldehyde (red)
when ions are produced from ethanol versus methanol precursors.

79
Figure 5.9. Comparison of the observed O–H stretch of CH2OH
+-Ar (black) at two different source
conditions with simulated ro-vibrational spectra for an asymmetric top using the PGOPHER program.
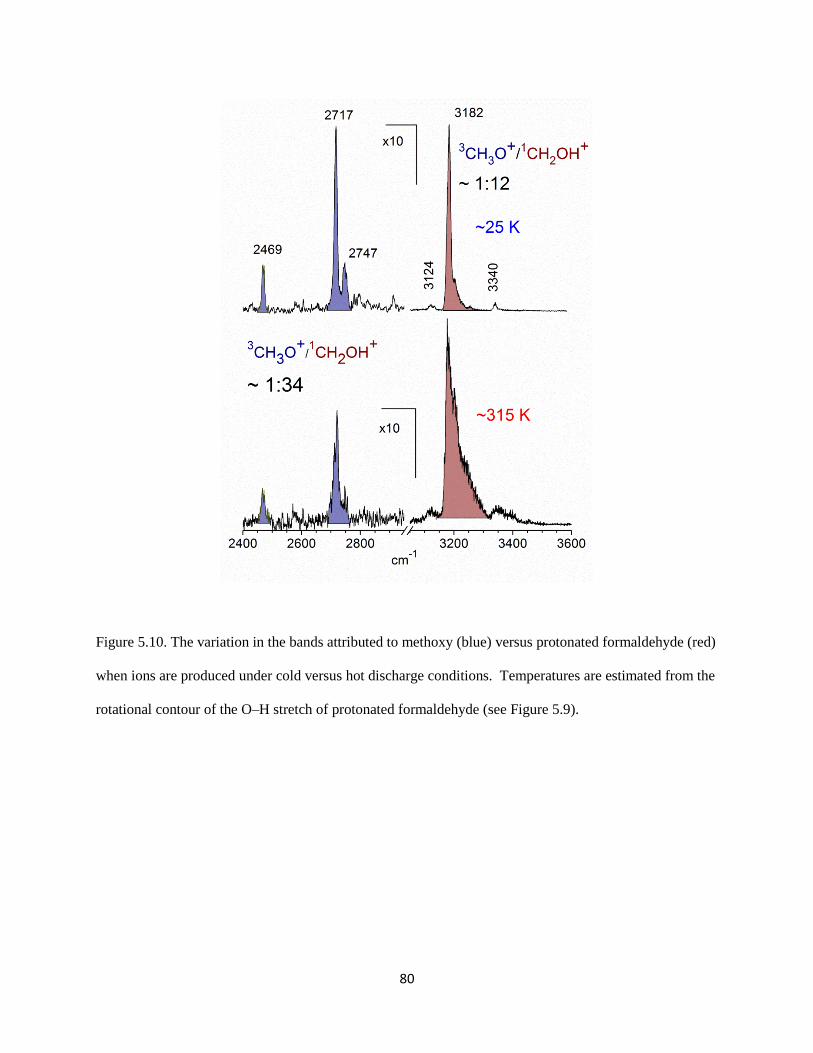
80
Figure 5.10. The variation in the bands attributed to methoxy (blue) versus protonated formaldehyde (red)
when ions are produced under cold versus hot discharge conditions. Temperatures are estimated from the
rotational contour of the O–H stretch of protonated formaldehyde (see Figure 5.9).

81
shaded to the blue, with a temperature of roughly 315K. Vibrations are not likely to be equilibrated to
this same temperature, but this confirms that the plasma is heated to a significant degree. Furthermore,
the bands attributed to methoxy decrease in intensity, corresponding to these hotter conditions. Again,
comparing the integrated areas and computed IR intensities, we arrive at a CH3O+:CH2OH
+ ratio of 1:34.
Less methoxy survives at higher temperature, consistent with inefficient trapping behind the singlet/triplet
curve crossing barrier. Overall, the dependence on precursor and discharge conditions are consistent with
the assignment of the 2469, 2717 and 2747 cm-1
bands to an isomer other than protonated formaldehyde.
The vibrational analysis indicates that this isomer is methoxy. Its production efficiency changes with
different precursors and conditions, consistent with expectations for a metastable species. Because we
have been able to capture this ion, the qualitative aspects of the potential energy surface and singlet/triplet
curve crossings proposed previously20
must be valid, i.e., there must be a significant local well on the
methoxy surface.
The oxonio-methylene cation has been suggested as a possible structural isomer by theory,8 but
there is no experimental evidence for this ion to our knowledge. We find a stable minimum for this
structure, whose predicted spectrum is shown in the third trace from the top in Figure 5.4. Vibrations are
predicted at 2970 cm-1
and 3328 cm-1
, near experimental bands, but the relative intensities do not match
the experiment. Because the IR laser power is steady in this region, measured intensities should resemble
those computed. As noted above, the 2967 cm-1
band can also be assigned to the weak symmetric CH2
stretch of protonated formaldehyde. This band is not evident in the theory trace for this ion because it is
so much weaker than the O–H stretch. As discussed below, the 3340 cm-1
can be assigned to a
combination band. Considering all this, it is not possible to completely exclude the presence of a small
amount of oxonio-methylene cation, but we conclude that there is no compelling evidence for it.
Unassigned vibrational bands remain at 2058 and 3340 cm-1
that are not close to predicted
fundamentals of protonated formaldehyde or methoxy cation. Therefore, we investigate assignments for
these features involving overtones or combination bands, guided by past experience with similar systems
(the following results were obtained by our collaborator Anne McCoy at the Ohio State University). Such
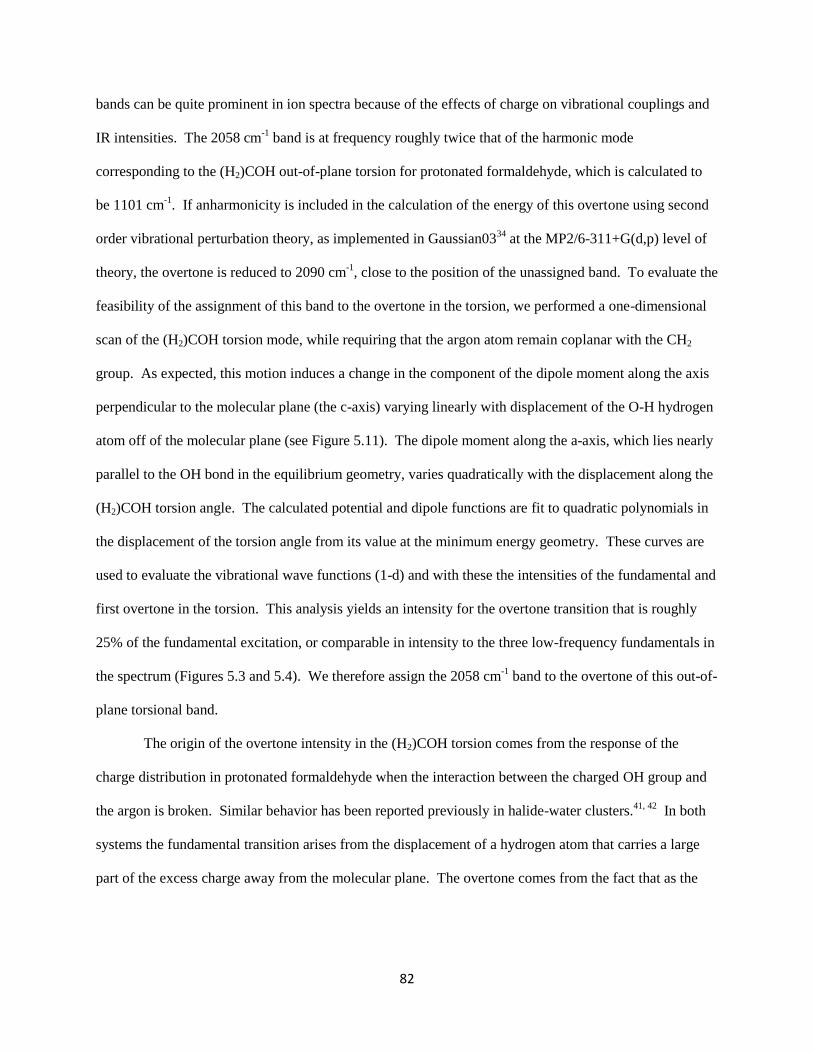
82
bands can be quite prominent in ion spectra because of the effects of charge on vibrational couplings and
IR intensities. The 2058 cm-1
band is at frequency roughly twice that of the harmonic mode
corresponding to the (H2)COH out-of-plane torsion for protonated formaldehyde, which is calculated to
be 1101 cm-1
. If anharmonicity is included in the calculation of the energy of this overtone using second
order vibrational perturbation theory, as implemented in Gaussian0334
at the MP2/6-311+G(d,p) level of
theory, the overtone is reduced to 2090 cm-1
, close to the position of the unassigned band. To evaluate the
feasibility of the assignment of this band to the overtone in the torsion, we performed a one-dimensional
scan of the (H2)COH torsion mode, while requiring that the argon atom remain coplanar with the CH2
group. As expected, this motion induces a change in the component of the dipole moment along the axis
perpendicular to the molecular plane (the c-axis) varying linearly with displacement of the O-H hydrogen
atom off of the molecular plane (see Figure 5.11). The dipole moment along the a-axis, which lies nearly
parallel to the OH bond in the equilibrium geometry, varies quadratically with the displacement along the
(H2)COH torsion angle. The calculated potential and dipole functions are fit to quadratic polynomials in
the displacement of the torsion angle from its value at the minimum energy geometry. These curves are
used to evaluate the vibrational wave functions (1-d) and with these the intensities of the fundamental and
first overtone in the torsion. This analysis yields an intensity for the overtone transition that is roughly
25% of the fundamental excitation, or comparable in intensity to the three low-frequency fundamentals in
the spectrum (Figures 5.3 and 5.4). We therefore assign the 2058 cm-1
band to the overtone of this out-of-
plane torsional band.
The origin of the overtone intensity in the (H2)COH torsion comes from the response of the
charge distribution in protonated formaldehyde when the interaction between the charged OH group and
the argon is broken. Similar behavior has been reported previously in halide-water clusters.41, 42
In both
systems the fundamental transition arises from the displacement of a hydrogen atom that carries a large
part of the excess charge away from the molecular plane. The overtone comes from the fact that as the

83
Figure 5.11. The variation in the component of the dipole moment along the c-axis, plotted as a function
of the HOC(H2) torsion angle (τ). The blue open circles are for the complex with argon present, while the
red solid ones are for the complex without argon.

84
interaction between the argon atom and protonated formaldehyde is weakened by displacement of the
hydrogen atom off of the molecular plane, the partial charge on argon becomes closer to zero, and the
excess charge becomes localized on protonated formaldehyde. The charge redistribution is primarily in
the molecular plane and these changes will be the same if the hydrogen is displaced above or below this
plane. The angular dependence of the a-component of the dipole moment for bare protonated
formaldehyde (red circles) and the complex of protonated formaldehyde with an argon atom (blue circles)
are plotted in Figure 5.12. The intensities of the overtone transitions in these systems are proportional to
the squares of the second derivatives of these curves. Because the bend dependence of the a-component
of the dipole moment is only seen when the argon atom is present, this overtone is not likely to have
strong IR intensity in the bare protonated formaldehyde. Thus, the occurrence of this overtone is a result
of vibrational dynamics induced by argon.
The second unexpected feature in our spectrum at 3340 cm-1
lies 158 cm-1
to the blue of the
shared proton O–H stretch. This interval is comparable to the harmonic frequency of the Ar–H stretch.
Analogous bands have been seen in the spectra of halide-water systems42
and protonated CO2.43
Again,
we present here the results obtained by Anne McCoy at the Ohio State University. To analyze the origins
of this band, particularly with respect to the source of its intensity, we develop an adiabatic model similar
to one developed by Myshakin et al.44
(see Appendix). Using the harmonic frequencies of the O–H and
Ar–H stretches along with the cubic force constant that is quadratic in the O–H stretch displacement and
linear in the Ar–H stretch displacement, we predict an intensity of the combination band that is roughly
4% that of the O−H stretching mode. The physical origins of the intensity comes from the fact that when
the vibrational Hamiltonian is averaged over the probability amplitude for the ground and first excited
states in the O–H stretch, the minimum in the resulting effective potential shifts to slightly larger values
of the Ar–H distance.
Therefore, we have assigned all the bands measured in the photodissociation spectrum of the
mass 31 cation. The most prominent features are the fundamentals of protonated formaldehyde;
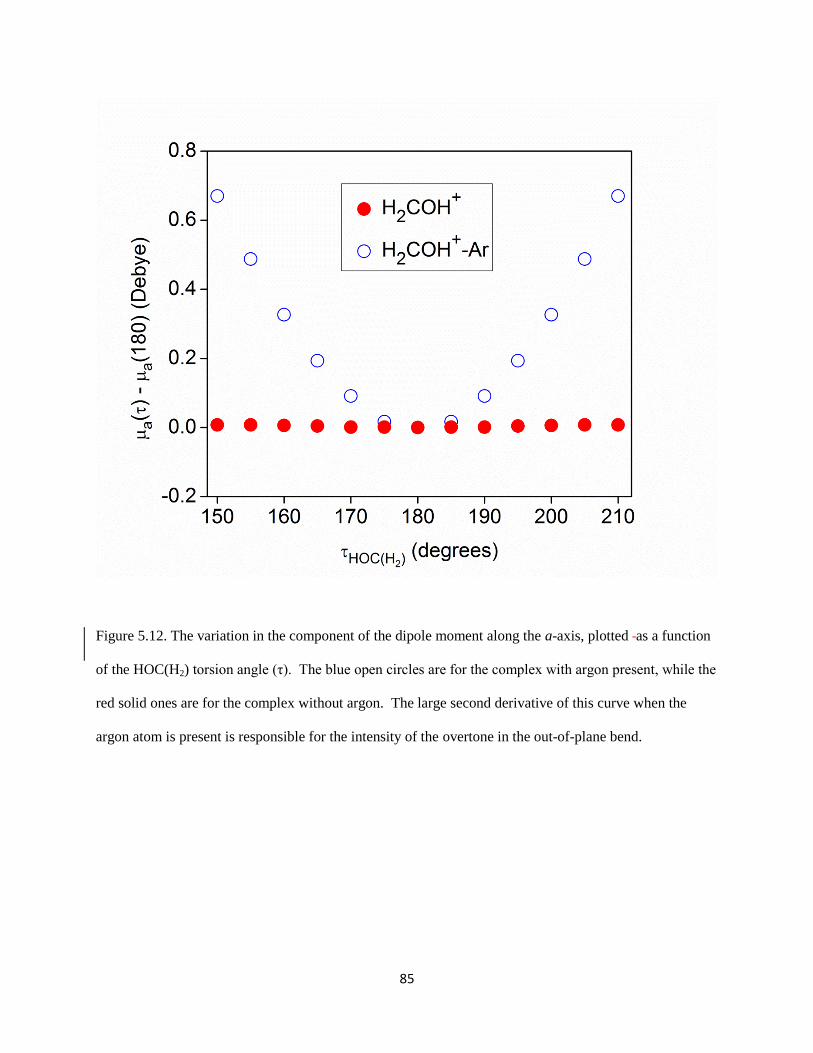
85
Figure 5.12. The variation in the component of the dipole moment along the a-axis, plotted as a function
of the HOC(H2) torsion angle (τ). The blue open circles are for the complex with argon present, while the
red solid ones are for the complex without argon. The large second derivative of this curve when the
argon atom is present is responsible for the intensity of the overtone in the out-of-plane bend.

86
additional bands are assigned to an overtone of its out-of-plane torsional mode and a combination of its
O–H stretch with an argon stretch. Protonated formaldehyde has long been recognized as the most stable
form of this ion, and it is therefore no surprise that it would be present. Except for the strong O–H
stretch, however, none of its vibrations have been reported previously. The O–H stretch here is strongly
shifted because argon attaches on the proton, but the other five fundamentals are expected to have
frequencies quite close (within 5-10 cm-1
) to their free-ion values. The torsional overtone (2058 cm-1
) and
O–H/H–Ar combination (3340 cm-1
) band arise from the unusual vibrational dynamics resulting from
attachment of argon to a cation. Our data here are also provide the first spectroscopic evidence for the
metastable (triplet) methoxy cation. Methoxy is present at 2-10% of the amount of protonated
formaldehyde, depending on the conditions. Its survival is heavily dependent on the efficient collisional
cooling in our discharge/supersonic expansion source that makes it possible to stabilize this ion behind
the barriers for curve crossing to protonated formaldehyde or dissociation to HCO+ + H2. It is therefore
understandable that it has been difficult to isolate this isomer in the past. Like the O–H stretch of
protonated formaldehyde, the C–H stretches of methoxy are perturbed significantly by the attachment of
argon.
These data show that IR spectroscopy with a supersonic expansion source is useful to capture
metastable ion structures resulting from complex reaction pathways and to reveal their spectral signatures.
The rapid excitation followed by highly efficient collisional cooling provides a unique opportunity to
sample structural configurations that are otherwise inaccessible. We have reported this behavior
previously for C7H9+ cations, which had co-existing isomeric structures (protonated toluene vs 1,3-
dimethylcyclopentadienyl). Previous results from this laboratory also show similar behavior for C3H3+
and C3H5+ cations (cyclopropenyl vs propargyl; allyl vs 2-propenyl).
30 However, the present case is the
most extreme example of this behavior yet, with triplet methoxy lying 96 kcal/mol higher in energy than
protonated formaldehyde.

87
Conclusions
The m/z=31 cation, i.e., [C,H3,O]+, has been investigated with mass-selected ion infrared
photodissociation spectroscopy using the method of argon tagging. The infrared spectrum contains sharp
resonances from 1300 to 3500 cm-1
. Spectral analysis confirms the presence of both the protonated
formaldehyde and methoxy structures; there is no clear evidence for the oxonio-methylene structure
suggested previously by theory. Six fundamentals are detected for protonated formaldehyde; five of these
are new. The O–H stretch detected with argon tagging is strongly red-shifted compared to this vibration
in the isolated cation that was reported previously, and in the spectrum from neon tagging. The other
vibrations are believed to be less perturbed by argon and to have frequencies close to their isolated ion
values. Unusual vibrational dynamics arising from attachment of argon induces activity in the overtone
of the torsion and in an argon combination with the O–H stretch. The methoxy detected is the triplet
species which is metastable with respect to protonated formaldehyde. It lies far higher in energy
(computed to be +96.0 kcal/mol), but can be stabilized behind a significant barrier. Rapid collisional
cooling in the present experiment allows this species to be captured and studied. Ion production in our
pulsed discharge/supersonic expansion source provides a convenient method with which to produce
metastable ion structures and to document the IR spectra of these transient species.

88
References
(1) NIST Mass Spec Data Center, Stein, S.E., director, "Mass Spectra" in NIST Chemistry
WebBook, NIST Standard Reference Database Number 69, Eds. Lindstrom, P.J. and Mallard,
W.G., National Institute of Standards and Technology, Gaithersburg, MD, 20899,
http://webbook.nist.gov, (retrieved May 14, 2012).
(2) Munson, M. S. B.; Franklin, J. L., Energetics of some gaseous oxygenated organic ions. J. Phys.
Chem. 1964, 68 (11), 3191-3196.
(3) Haney, M. A.; Patel, J. C.; Hayes, E. F., Nonempirical LCAO MO SCF and CI studies of the
isomers of CH3O+. J. Chem. Phys. 1970, 53 (10), 4105-4106.
(4) Bowen, R. D.; Williams, D. H., CH3O+ and C2H5O
+: high barriers to isomerisation and low
barriers to symmetry-allowed 1,1-elimination. J. Chem. Soc., Chem. Commun. 1977, (11), 378-
380.
(5) Schleyer, P. V. R.; Jemmis, E. D.; Pople, J. A., 'CH3O+' and CH2OH
+: High barriers to
isomerization. J. Chem. Soc., Chem. Commun. 1978, (5), 190-191.
(6) Dill, J. D.; Fischer, C. L.; McLafferty, F. W., Collisional activation and theoretical studies of
gaseous COH3+ ions. J. Am. Chem. Soc. 1979, 101 (22), 6531-6534.
(7) Bursey, M. M.; Hass, J. R.; Harvan, D. J.; Parker, C. E., Consequences of charge reversal in
gaseous alkoxide ions. Oxenium ions. J. Am. Chem. Soc. 1979, 101 (19), 5485-5489.
(8) Nobes, R. H.; Radom, L.; Rodwell, W. R., Influence of basis set and electron correlation on
calculated barriers to 1,2-hydrogen shifts. The oxoniomethylene cation: A new CH3O+ isomer?
Chem. Phys. Lett. 1980, 74 (2), 269-272.
(9) Hoffmann, M. R.; Schaefer, H. F., Hydroxycarbene (HCOH) and protonated formaldehyde - 2
potentially observable inter-stellar molecules. Astrophys. J. 1981, 249 (2), 563-565.
(10) Bouma, W. J.; Nobes, R. H.; Radom, L., On the nature of the ‘methoxy’ cation. Org. Mass
Spectrom. 1982, 17 (7), 315-317.
89
(11) Gilman, J. P.; Hsieh, T.; Meisels, G. G., The unimolecular decomposition rates of energy selected
methylnitrite and deuterated methylnitrite ions. J. Chem. Phys. 1983, 78 (6), 3767-3773.
(12) Burgers, P. C.; Holmes, J. L., The generation of triplet methoxy cations. Org. Mass Spectrom.
1984, 19 (9), 452-456.
(13) Holmes, J. L.; Hop, C. E. C. A.; Terlouw, J. K., Does the unimolecular dissociation of ionized
methyl acetate produce CH3O˙ or CH2OH radicals? Org. Mass Spectrom. 1986, 21 (11), 776-778.
(14) Zappey, H.; Ingemann, S.; Nibbering, N. M., Gas-phase ion-molecule reactions of the CH3O+
cation. J. Am. Soc. Mass. Spectrom. 1992, 3 (5), 515-517.
(15) Uggerud, E.; Helgaker, T., Dynamics of the reaction CH2OH+ → CHO
+ + H2. Translational
energy release from ab initio trajectory calculations. J. Am. Chem. Soc. 1992, 114 (11), 4265-
4268.
(16) Yarkony, D. R., Theoretical studies of spin-forbidden radiationless decay in polyatomic systems:
Insights from recently developed computational methods. J. Am. Chem. Soc. 1992, 114 (13),
5406-5411.
(17) Kuo, S.-C.; Zhang, Z.; Klemm, R. B.; Liebman, J. F.; Stief, L. J.; Nesbitt, F. L., Photoionization
of hydroxymethyl (CD2OH and CD2OD) and methoxy (CD3O) radicals: Photoion efficiency
spectra, ionization energies, and thermochemistry. J. Phys. Chem. 1994, 98 (15), 4026-4033.
(18) Lee, T. G.; Park, S. C.; Kim, M. S., Reaction dynamics of the four‐centered elimination
CH2OH+→CHO
++H2: Measurement of kinetic energy release distribution and classical trajectory
calculation. J. Chem. Phys. 1996, 104 (12), 4517-4529.
(19) Suárez, D.; Sordo, T. L., Ab initio study of the H2 elimination from CH2OH+, CH2NH2
+, and
CH2SH+. J. Phys. Chem. A 1997, 101 (8), 1561-1566.
(20) Aschi, M.; N. Harvey, J.; A. Schalley, C.; Schroder, D.; Schwarz, H., Reappraisal of the spin-
forbidden unimolecular decay of the methoxy cation. Chem. Commun. 1998, (5), 531-533.
(21) Harvey, J. N.; Aschi, M., Spin-forbidden dehydrogenation of methoxy cation: a statistical view.
Phys. Chem. Chem. Phys. 1999, 1 (24), 5555-5563.
90
(22) Zhu, X. J.; Ge, M. F.; Wang, J.; Sun, Z.; Wang, D. X., First experimental observation on different
ionic states of both methylthio (CH3S.) and methoxy (CH3O
.) radicals. Angew. Chem. Int. Ed.
2000, 39 (11), 1940-1943.
(23) Amano, T.; Warner, H. E., Laboratory detection of protonated formaldehyde (H2COH+).
Astrophys. J. 1989, 342 (2), L99-L101.
(24) Dore, L.; Cazzoli, G.; Civis, S.; Scappini, F., Extended measurements of the millimeter-wave
spectrum of H2COH+. Chem. Phys. Lett. 1995, 244 (1-2), 145-148.
(25) Ohishi, M.; Ishikawa, S.; Amano, T.; Oka, H.; Irvine, W. M.; Dickens, J. E.; Ziurys, L. M.;
Apponi, A. J., Detection of a new interstellar molecular ion, H2COH+ (protonated formaldehyde).
Astrophys. J. 1996, 471 (1), L61-L64.
(26) Del Bene, J. E.; Gwaltney, S. R.; Bartlett, R. J., Base Properties of H2CO in the Excited 1n→π*
State. J. Phys. Chem. A 1998, 102 (26), 5124-5127.
(27) Blowers, P.; Masel, R. I., Calculated vibrational spectra for CHnOHm species. J. Phys. Chem. A
1999, 104 (1), 34-44.
(28) Castro, M. E.; Nino, A.; Munoz-Caro, C., Structural and vibrational theoretical analysis of
protonated formaldehyde in its (X) 1Ã' ground electronic state. Theor. Chem. Acc. 2008, 119 (4),
343-354.
(29) Sears, K. C.; Ferguson, J. W.; Dudley, T. J.; Houk, R. S.; Gordon, M. S., Theoretical
investigation of small polyatomic ions observed in inductively coupled plasma mass
spectrometry: HxCO+ and HxN2
+ (x=1, 2, 3). J. Phys. Chem. A 2008, 112 (12), 2610-2617.
(30) Duncan, M. A., Infrared laser spectroscopy of mass-selected carbocations. J. Phys. Chem. A
2012, 116 (47), 11477-11491.
(31) Cornett, D. S.; Peschke, M.; LaiHing, K.; Cheng, P. Y.; Willey, K. F.; Duncan, M. A., Reflectron
time-of-flight mass spectrometer for laser photodissociation. Rev. Sci. Instrum. 1992, 63 (4),
2177-2186.

91
(32) Bosenberg, W. R.; Guyer, D. R., Broadly tunable, single-frequency optical parametric frequency-
conversion system. J. Opt. Soc. Am. B 1993, 10 (9), 1716-1722.
(33) Gerhards, M.; Unterberg, C.; Gerlach, A., Structure of a b-sheet model system in the gas phase:
Analysis of the C=O stretching vibrations. Phys. Chem. Chem. Phys. 2002, 4 (22), 5563-5565.
(34) Frisch, M. J., et al., Gaussian 03 (Revision B.02). Gaussian, Inc.: Pittsburgh, PA, 2003.
(35) Merrick, J. P.; Moran, D.; Radom, L., An evaluation of harmonic vibrational frequency scale
factors. J. Phys. Chem. A 2007, 111 (45), 11683-11700.
(36) Shimanouchi, T., Molecular Vibrational Frequencies. In NIST Chemistry WebBook: NIST
Standard Reference Database Number 69 [Online] Linstrom, P. J.; Mallard, W. G., Eds. National
Institute of Standards, Technology: Gaitherbburg, MD 20899, 1972. http://webbook.nist.gov.
(37) Dulcey, C. S.; Hudgens, J. W., Multiphoton ionization spectroscopy and vibrational analysis of a
3p Rydberg state of the hydroxymethyl radical. J. Chem. Phys. 1986, 84 (10), 5262-5270.
(38) Johnson, R. D.; Hudgens, J. W., Structural and thermochemical properties of hydroxymethyl
(CH2OH) radicals and cations derived from observations of B 2A‘(3p) X
2A‘‘ electronic
spectra and from ab initio calculations. J. Phys. Chem. 1996, 100 (51), 19874-19890.
(39) Dyke, J. M.; Ellis, A. R.; Jonathan, N.; Keddar, N.; Morris, A., Observation of the CH2OH radical
in the gas phase by vacuum ultraviolet photoelectron spectroscopy. Chem. Phys. Lett. 1984, 111
(3), 207-210.
(40) Botschwina, P.; Oswald, R., On the equilibrium structures of the complexes H2C3H+·Ar and c-
C3H3+·Ar: Results of explicitly correlated coupled cluster calculations. J. Chem. Phys. 2011, 134
(4), 044305.
(41) Roscioli, J. R.; Diken, E. G.; Johnson, M. A.; Horvath, S.; McCoy, A. B., Prying apart a water
molecule with anionic H-bonding: A comparative spectroscopic study of the X-·H2O (X = OH,
O, F, Cl, and Br) binary complexes in the 600−3800 cm-1
region. J. Phys. Chem. A 2006, 110
(15), 4943-4952.
92
(42) Horvath, S.; McCoy, A. B.; Elliott, B. M.; Weddle, G. H.; Roscioli, J. R.; Johnson, M. A.,
Anharmonicities and isotopic effects in the vibrational spectra of X−·H2O, ·HDO, and ·D2O [X =
Cl, Br, and I] binary complexes. J. Phys. Chem. A 2010, 114 (3), 1556-1568.
(43) Douberly, G. E.; Ricks, A. M.; Ticknor, B. W.; Duncan, M. A., Structure of protonated carbon
dioxide clusters: Infrared photodissociation spectroscopy and ab initio calculations. J. Phys.
Chem. A 2008, 112 (5), 950-959.
(44) Myshakin, E. M.; Jordan, K. D.; Sibert, E. L.; Johnson, M. A., Large anharmonic effects in the
infrared spectra of the symmetrical CH3NO2−⋅(H2O) and CH3CO2−⋅(H2O) complexes. J. Chem.
Phys. 2003, 119 (19), 10138-10145.
93
CHAPTER 6
UBIQUITOUS INTERSTELLAR MOLECULES WITH RADICALLY DIFFERENT CATION
STRUCTURES: INFRARED SPECTROSCOPY OF FORMALDEHYDE AND METHANOL
CATIONS
Introduction
Ions play a vital role in astrochemistry, and their structures underlie the significance of
their chemical reactivity in the low densities of interstellar space.1-6
Several organic molecules
have been detected in interstellar space, including the well-known neutral formaldehyde and
methanol molecules.7-10
In fact, the discovery of formaldehyde marked the start of the study of
interstellar organic chemistry.11
Since their first recorded observations, these molecules have
been found in nearly every type of interstellar environment,11-19
and their astrochemical roles
vary richly by environment.12, 20-23
They can exist in their neutral or ionic forms, depending on
the environment.3-6
This work investigates the structure and bonding of the cationic forms of
formaldehyde [C,H2,O]+and methanol [C,H4,O]
+ via infrared spectroscopy.
[C,H2,O]+ has been the subject of mass spectrometric studies for many years.
24-34 Two
important structures are recognized, the formaldehyde cation (CH2O+) and hydroxymethylene
cation (CHOH+). The oxonium ion (COH2
+) was proposed on the basis of computational
studies,35
but there is apparently no experimental evidence for this structure.
Photoionization/fragmentation studies of methanol and its isotopologues reveal that two
fragments at m/z = 30 with roughly equal importance are observed, suggesting that two structural
isomers exist with comparable stabilities.29, 30
The collisional dissociation of a variety of ions

94
having m/z = 30 produces fragmentation with relatively abundant CH2+ and O
+ ions (from
formaldehyde), or CH+ and OH
+ ions (from methanol and cyclopropanol), suggesting that
CH2O+ and CHOH
+ are indeed the structures formed for this ion. Holmes and coworkers also
suggested a barrier to interconversion between these two structures of at least 34 kcal/mol, based
on appearance energies for metastable decay of m/z = 30 ions to HCO+ and H.
32 Numerous
theoretical studies have been employed for this system.35-38
The best theoretical results from the
literature place HCOH+ higher in energy than the global minimum structure, H2CO
+, by 5.5
kcal/mol.36
These results are completely consistent with the thermochemical data.30, 32
Theoretical studies also predict a substantial barrier (+49 kcal/mol)36
to rearrangement between
these similarly energetic isomers, again consistent with the experimental data.32
Interestingly,
the energetics computed at the MP2 level of theory are incorrect not only in terms of the relative
energies but also for the correct energy ordering of formaldehyde and hydroxymethylene ions.37
Formaldehyde cation has also been studied with electron spin resonance (ESR) spectroscopy39
and photoelectron spectroscopy.40-44
To our knowledge, the infrared spectrum for
hydroxymethylene cation has never been observed, although it has been predicted before.45
The
present work provides spectroscopic evidence for CH2O+ and CHOH
+ with infrared
photodissociation spectroscopy.
The [C,H4,O]+ ion has been the subject of numerous mass spectrometric studies.
46-50 Two
isomers are known, the methanol cation (CH3OH+) and the methyleneoxonium ion (CH2OH2
+),
and it is not generally appreciated that the conventional structure is not the more stable ion. The
collision dissociation of ionized methanol having m/z = 32 produces fragmentation with an
intense m/z = 15/14 peak ratio, as is expected for the conventional radical cation structure.
However, when a variety of ions having m/z = 32 are produced from other methods (e.g.,
95
ionization of ethylene glycol), fragmentation with an intense m/z = 14 peak, and a virtually
absent m/z = 15 peak is observed.46
These results are consistent with the two structures of
methanol cation and the methyleneoxonium ion. Ion mobility measurements confirm the
presence of two isomers.50
Thermochemical data suggests that the latter structure is more stable
by about 7 kcal/mol.47
Several theoretical studies confirm that CH2OH2+, rather than CH3OH
+, is
the global minimum structure.51-56
The more stable CH2OH2+ is one of the simplest examples of
a distonic isomer, a phrase coined by Radom and coworkers57, 58
describing a radical cation
structure with separated charge and radical sites. Isomerization to these more stable structures
has been demonstrated for several conventional radical cations.59-62
Furthermore, Holmes et. al.
determined that a barrier to rearrangement between the isomers occurs as the rate-limiting step
for dissociation of CH2OH2+ to CH2OH
+ + H, based on kinetic isotope effects.
48 Theoretical
predictions agree that a large barrier to interconversion exists;55, 56
interestingly, interactions with
water, noble gases, and methanol itself are predicted to substantially lower this barrier.63, 64
The
conventional radical cation has been studied via ESR spectroscopy.65
The infrared spectra has
been predicted for methanol cation,45
but no spectroscopy of any kind has been reported for the
methyleneoxonium ion. Here we describe the infrared spectroscopy of [C,H4,O]+, produced via
discharge of methanol or ethylene glycol, which shows that both methanol cation and
methyleneoxonium ion structures are present.
Experimental Details
[C,H2,O]+ and [C,H4,O]
+ ions are produced in a pulsed discharge/supersonic expansion of
Ar, and/or He containing the ambient vapor pressure of methanol or ethylene glycol at room
temperature. The ions are mass-selected in a reflectron time-of-flight mass spectrometer and

96
observed with infrared photodissociation spectroscopy.66
Since a single IR photon does not
contain enough energy to break a bond, we employ rare gas tagging. Thus, [C,H2,O]+Ar ions are
mass-selected, and IR absorption eliminates Ar. The fragment ion intensity is recorded versus
the frequency of the photodissociation laser (OPO/OPA, LaserVision). CCSD(T) calculations
are carried out as implemented in the CFOUR programming package.67
The atomic natural
orbital (ANO) basis of Almlöf and Taylor is used for C, H and O atoms. The Roos augmented
double ζ ANO basis is used for Ar atoms. Smaller and larger contractions of the Taylor ANO
basis are designated by ANO0 and ANO1, respectively. Theoretical computations are carried
out at the B3LYP/6-311+G** and MP2/aug-cc-pVTZ levels of theory using the GAMESS
software package.68
Results and Discussion
A typical mass spectrum is shown in Figure 6.1 for the ambient vapor pressure of
methanol at room temperature seeded in an expansion of Ar. Clearly, a very rich mass spectrum
is obtained from methanol in our ion source. Several peaks are observed in the low mass region
(m/z > 100) corresponding to ionization/fragmentation products, and their clusters with neutral
methanol and argon. Peaks from the m/z = 14 – 19 range correspond to CH2+, CH3
+, O
+, OH2
+
and OH3+ fragment ions. Carbocations of the form C2Hx
+ (x = 1−3) are observed from m/z =
25−27, while (x = 4−7) could potentially coincide with CHmO+ carboxonium ions (m = 0−3) in
the m/z = 28−31 range. Peaks at m/z = 32 and 33 correspond to [C,H4,O]+ and [C,H5,O]
+.
Reaction products are seen at higher mass-to-charge ratios, as are their clusters with methanol
and argon.
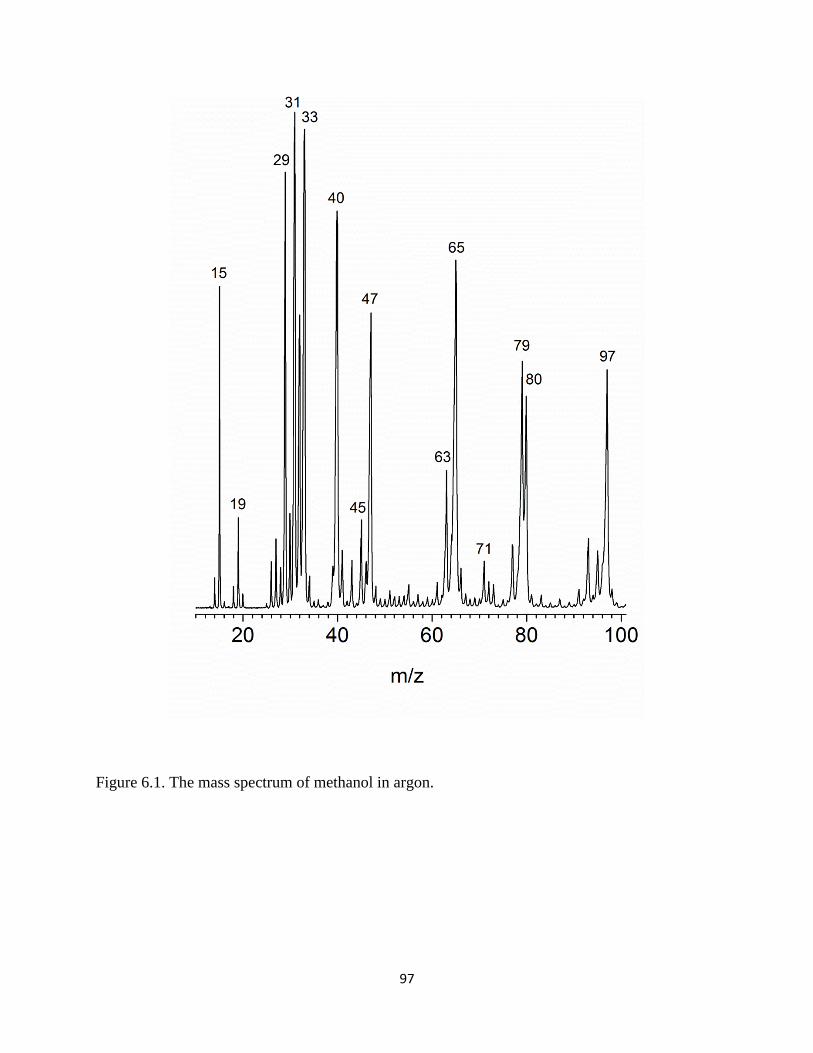
97
Figure 6.1. The mass spectrum of methanol in argon.

98
The infrared spectrum from 2600 − 3200 cm-1
for [C,H2,O]+Ar observed by loss of Ar is
presented in Figure 6.2. Two intense bands at 2757 and 2804 cm-1
dominate the spectrum. Two
partially resolved doublets with moderate intensity are observed at 2892 and 3003 cm-1
, while
three weaker bands are observed at 2835, 2925 and 2953 cm-1
. Seven bands are observed
therefore in the C−H and O−H stretching region; clearly there are too many peaks to be assigned
to just one structure. We also searched for signal in the fingerprint region; however, no bands
were observed in the 600-2600 cm-1
range.
We use computational chemistry to determine the possible structures of [C,H2,O]+.
Results obtained at the CCSD(T)/ANO1 level of theory are presented in Table 6.1. Three stable
minima are found, with the global minimum structure being CH2O+. More energetic isomers are
CHOH+ and COH2
+, with energies of +6.1 and +57.8 kcal/mol relative to the global minimum,
respectively. These results are fully consistent with previous theoretical results.35-38
The COH2+
isomer is much higher in energy and is not considered further here. We also find a first-order
saddle point which lies 43.0 kcal/mol higher than CH2O+. Intrinsic reaction calculations at the
B3LYP/6-311+G** of theory confirm this to be a transition state corresponding to a 1,2
hydrogen transfer reaction between hydroxymethylene and formaldehyde cations (see Figure
6.3). B3LYP overestimates the relative energies between the isomers (+8.2 kcal/mol) and the
barrier height for reaction (+45.7 kcal/mol), compared to the CCSD(T) results; however, it does
succeed in correctly predicting the relative energy ordering of the two structures, whereas the
MP2 level of theory does not.37
Thus, the B3LYP results should give qualitatively accurate
results for such an IRC calculation. The structures of CH2O+ and CHOH
+ with argon were also
investigated (see Table 6.1). Two binding sites for argon were found on each structure. We
consider the CH2O+ ion first. The global minimum structure for CH2O
+−Ar corresponds to

99
Figure 6.2. The infrared spectrum from 2600 – 3200 cm-1
of [C,H2,O]+Ar recorded by loss of Ar.
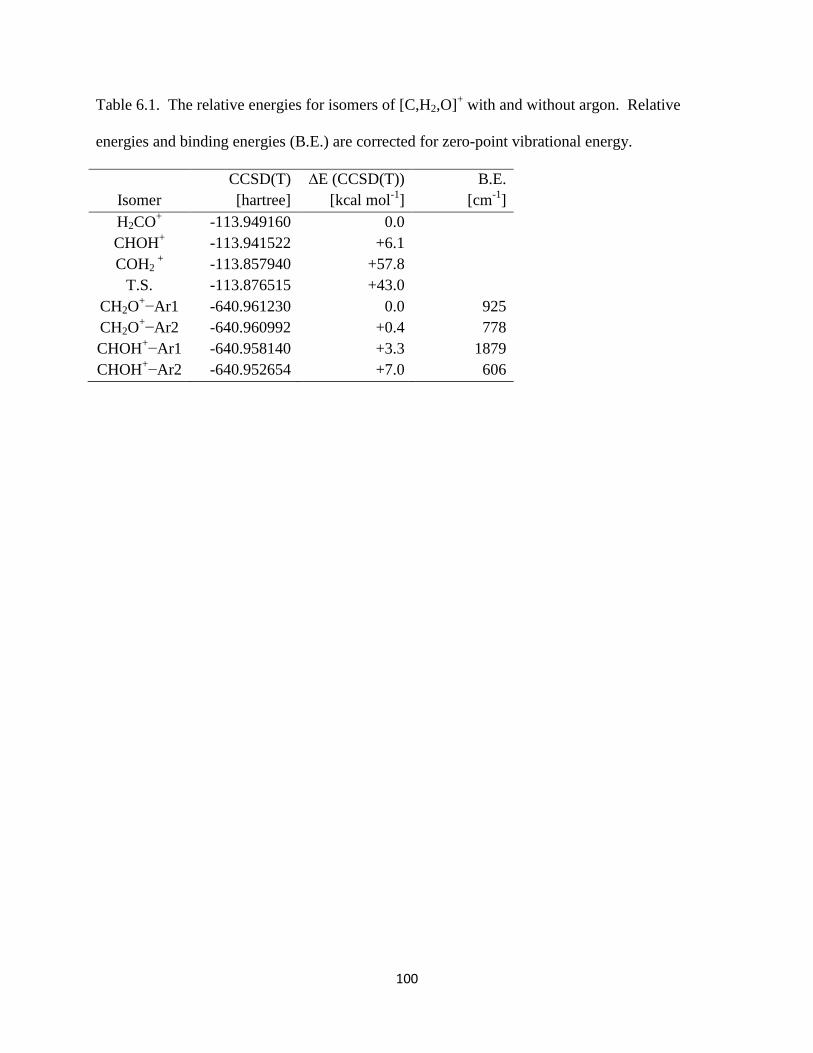
100
Table 6.1. The relative energies for isomers of [C,H2,O]+ with and without argon. Relative
energies and binding energies (B.E.) are corrected for zero-point vibrational energy.
Isomer
CCSD(T)
[hartree]
∆E (CCSD(T))
[kcal mol-1
]
B.E.
[cm-1
]
H2CO+ -113.949160 0.0
CHOH+ -113.941522 +6.1
COH2 +
-113.857940 +57.8
T.S. -113.876515 +43.0
CH2O+−Ar1 -640.961230 0.0 925
CH2O+−Ar2 -640.960992 +0.4 778
CHOH+−Ar1 -640.958140 +3.3 1879
CHOH+−Ar2 -640.952654 +7.0 606
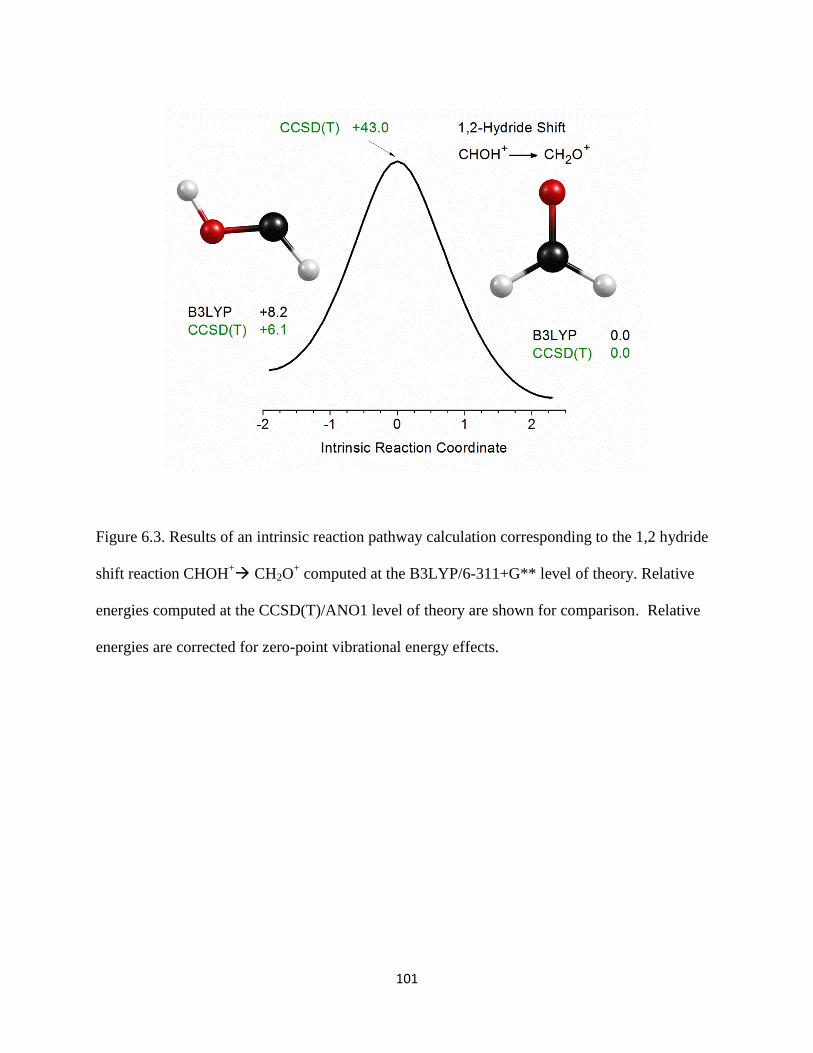
101
Figure 6.3. Results of an intrinsic reaction pathway calculation corresponding to the 1,2 hydride
shift reaction CHOH+ CH2O
+ computed at the B3LYP/6-311+G** level of theory. Relative
energies computed at the CCSD(T)/ANO1 level of theory are shown for comparison. Relative
energies are corrected for zero-point vibrational energy effects.

102
argon binding to a CH group. An argon isomer corresponding to a binding site out of the
molecular plane above the carbon, is found at essentially the same energy, only +0.4 kcal/mol
higher in energy. The global minimum for CHOH+−Ar corresponds to argon binding to the OH
group. An argon isomer exists, with argon binding above the carbon out of the molecular plane.
These structures have energies +3.3 and +7.0 kcal/mol relative to the global minimum for
CH2O+−Ar.
We use computational chemistry to predict vibrational spectra for the [C,H2,O]+Ar ions to
aid spectral assignment. We consider first the possibility that argon isomers may be responsible
for the spectral complexity observed in our experiment. Vibrations for the two structures
predicted by theory at the CCSD(T) level for CH2O+−Ar are presented in Table 6.2 and Figure
6.4 for comparison to our infrared spectrum (black trace, top). Frequencies are scaled by a factor
of 0.951 to correct for vibrational anharmonicity. The scaling factor was derived from the
predicted ν1 frequency values for HCO+ and HCO
+Rg (Rg=Ar,Ne), which are known
experimentally.69-71
Predicted frequencies for the untagged formaldehyde cation, corresponding
to the symmetric and asymmetric C−H stretching modes, are represented as dashed red lines.
Two bands are also predicted for CH2O+−Ar. If argon attaches to a CH group, it interacts
strongly with one hydrogen, and induces a large red shift in both C−H stretching frequencies
(blue trace, second from top). Similar effects are seen in the predicted spectra at the B3LYP
level of theory (dark cyan trace, fourth from top). On the other hand, if argon attaches above the
molecular plane, it weakly interacts with both hydrogens, and only a slight blue shift is observed
for both bands (wine trace, third from top). Similar small shifts to higher frequency are observed
at the B3LYP level (olive trace, bottom). Remarkably, the agreement between theory and
experiment with respect to frequencies is poor. Preliminary results with collaborator John

103
Table 6.2. Predicted infrared bands (in cm-1
) for three isomers of [C,H2,O]+Ar. Intensities are
given in km/mol.
CCSD(T) (Int)a B3LYP (Int)
b Description
2551 (728.6) 2453 (957.8) C−H2 sym str CH2O+−Ar1
2688 (148.5) 2692 (143.7) C−H2 sym str CH2O+−Ar2
2737 (214.2) 2728 (313.1) C−H2 asym str CH2O+−Ar1
2790 (143.4) 2773 (186.4) C−H2 asym str CH2O+−Ar2
2896 (1902.2) 2894 (1834.8) O−H str CHOH +−Ar
2924 (361.2) 2930 (255.3) C−H str CHOH +−Ar
ascaled by 0.95.
bscaled by 0.97.
cThis work.
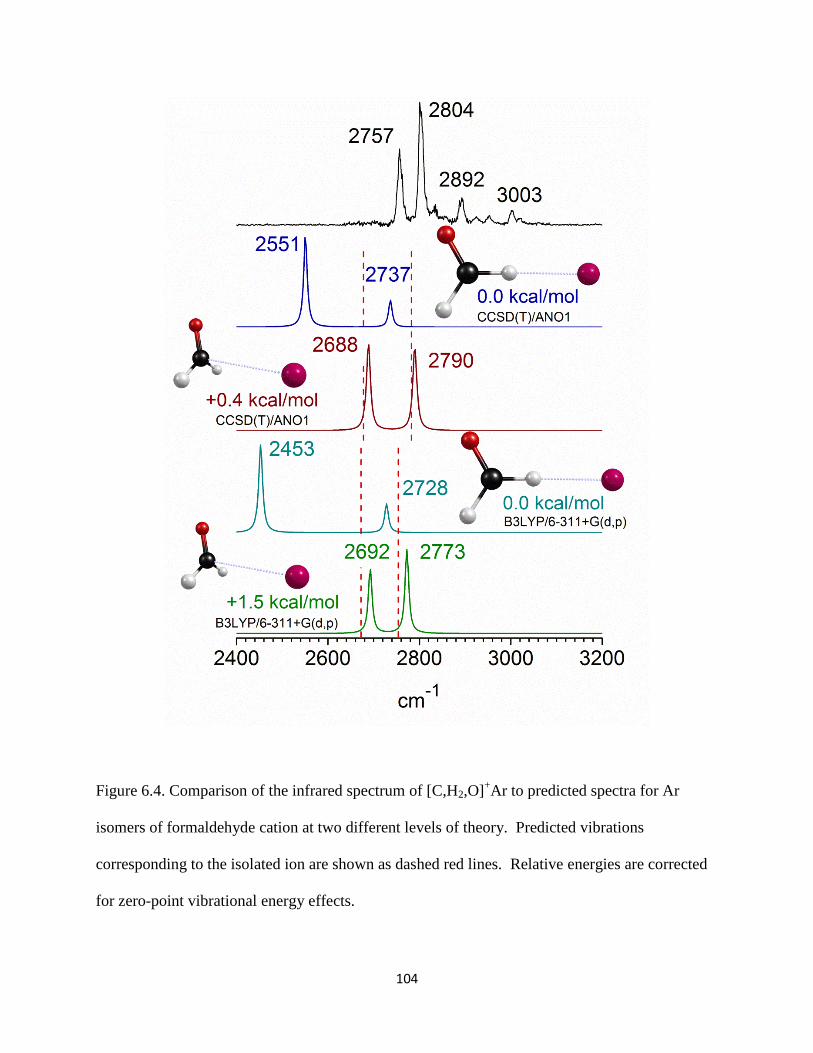
104
Figure 6.4. Comparison of the infrared spectrum of [C,H2,O]+Ar to predicted spectra for Ar
isomers of formaldehyde cation at two different levels of theory. Predicted vibrations
corresponding to the isolated ion are shown as dashed red lines. Relative energies are corrected
for zero-point vibrational energy effects.

105
Stanton at the University of Texas, Austin, have been obtained which use anharmonic
corrections to the predicted frequencies of untagged formaldehyde cation. These results predict
the symmetric and asymmetric C−H stretches at 2636 and 2722 cm-1
, respectively. It seems that
the scaling factor used here produces artificially high values for these bands (2678 and 2781 cm-1
for the untagged species), suggesting that agreement for the tagged species is likely to be worse
if similar anharmonic corrections are employed here! While there are stark discrepancies
between experimental and theoretical values, there is agreement between the different levels of
theory, specifically with the ordering of vibrations between the argon isomers, and the shifts
induced by argon attachment.
Next, we consider the possibility that structural isomers may be responsible for the
infrared spectrum. Predicted vibrations at the CCSD(T) level for the lowest energy structure of
CHOH+−Ar are presented in Table 6.2 and Figure 6.5 (wine trace, third from top). The higher
energy isomer does not have any obvious bands predicted from 2400 to 3200 cm-1
, and is not
considered further. Two bands are predicted for CHOH+−Ar at 2896 and 2924 cm
-1,
corresponding to the O−H and C−H stretching modes, respectively. Predicted frequencies at the
B3LYP level (olive trace, bottom) are in good agreement with the higher level theory for this
structure. The 2892 and 2925 cm-1
peaks appear to correspond to the CHOH+−Ar vibrational
bands both in band position and relative intensity. However, given the poor agreement between
theory and experiment for CH2O+−Ar, it is impossible to definitively assign these peaks to
hydroxymethylene cation.
We have also considered the possibility of rotational structure in our spectrum.
Perpendicular-type transitions can have widely spaced rotational structure, and the peak
separation is roughly equal to four times the A" rotational constant. For CHOH+, we expect two
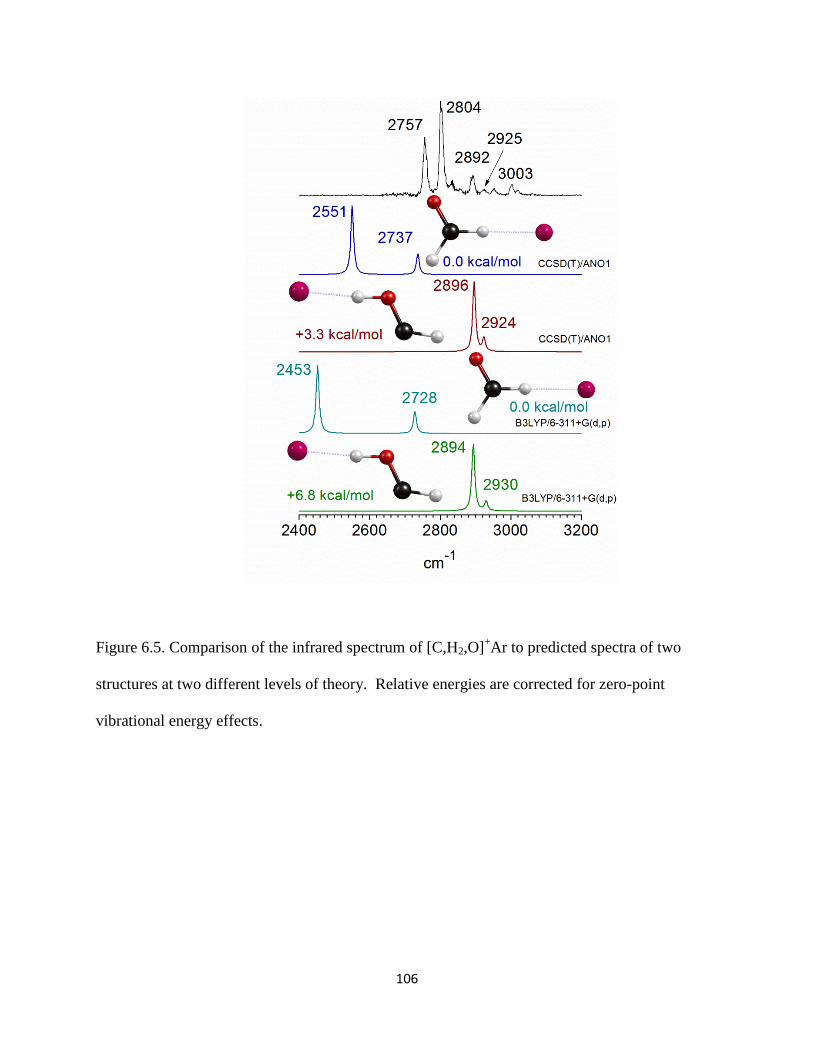
106
Figure 6.5. Comparison of the infrared spectrum of [C,H2,O]+Ar to predicted spectra of two
structures at two different levels of theory. Relative energies are corrected for zero-point
vibrational energy effects.

107
parallel-type transitions, and thus do not expect to see rotational structure from this species. For
formaldehyde cation, we expect one parallel-type and one perpendicular-type transition in the
C−H stretching region. The same transitions are expected for the global minimum CH2O+−Ar
complex, only with a reduced rotational constant. The global minimum structure of CH2O+−Ar
has a ground state rotational constant, A", of 2.0 cm-1
, computed at the CCSD(T)/ANO1 level of
theory (that of CH2O+ is 8.9 cm
-1). The observed spacings between the main peaks in our
spectrum are roughly 100 cm-1
, which are too large to be explained by this type of rotational
structure.
What is the source of the discrepancies between theory and experiment? And, how can
this be sorted out? Being confident in the accuracy of our infrared spectrum, we have tried other
experiments to aid the spectral assignment. Unfortunately, attempts to use other precursors to
generate [C,H2,O]+ ions have been unsuccessful, in part due to insufficient signal levels produced
at m/z = 30. Additionally, the infrared spectrum in the fingerprint region would provide
additional support in assigning the spectrum, especially when more than one structure may be
present. However, no signal is observed in this region, presumably due to inefficient
photodissociation from high argon binding energies (see Table 6.1). Attempts to use other tag
species (such as Ne or N2) or multiple Ar tags, that would have lower binding energies, have also
proved unsuccessful, due to low signal levels. Deuteration could also provide definitive
evidence needed to assign the spectrum. We endeavored to obtain the spectrum for [C,D2,O]+,
but initial attempts were unsuccessful in producing this ion from perdeuterated methanol.
Nevertheless, we plan to persevere.
Let us now consider the infrared spectrum of [C,H4,O]+Ar obtained by loss of Ar. Figure
6.6 presents the spectrum from 2000 – 3800 cm-1
for the mass-selected ion obtained from

108
methanol. This spectrum is quite unusual in appearance. An intense peak at 3156 cm-1
dominates the spectrum, where an O−H stretch might be expected. Three strong bands are
observed at 2473, 2573, and 2654 cm-1 in the C−H stretching region, as part of a larger
progression of seven peaks which span the 2400 – 3000 cm-1
range. Lastly, a weaker band is
observed at 3317 cm-1
, about 150 cm-1
to the blue of the largest peak. The spectrum was
measured in the fingerprint region as well; however, no signal was observed there. We also
recorded the spectrum of [C,H4,O]+Ne obtained by loss of Ne, as shown in Figure 6.7. Notably,
much lower signal levels were achieved with Ne tagging; the spectrum is much simpler,
however, with only a single strong band observed at 3373 cm-1
. No other signal is
distinguishable from the noise in this spectrum.
As for the previous ion, we use theory to predict structures and energies of [C,H4,O]+
ions. We find two isomers that are stable minima on the potential energy surface. Their
structures and relative energies are presented in Table 6.3 and Figure 6.8. The conventional
radical cation of methanol is found to be +6.4 kcal/mol above its distonic isomer,
methyleneoxonium ion, at the CCSD(T)/cc-pVTZ level of theory. The relative energies are
completely consistent with previous theoretical51-56
and experimental47
results. We also find a
first-order saddle point which lies +30.8 kcal/mol higher in energy than CH2OH2+ at the B3LYP
level of theory. This is confirmed to be a transition state for the 1,2-hydride shift between the
two predicted isomers, consistent with previous results.48, 55, 56
The structures of [C,H4,O]+ ions
tagged with Ar and Ne were also investigated at the B3LYP level of theory (computations at the

109
Figure 6.6. The infrared spectrum from 2000 – 3800 cm-1
of [C,H4,O]+AR recorded by loss of
Ar.
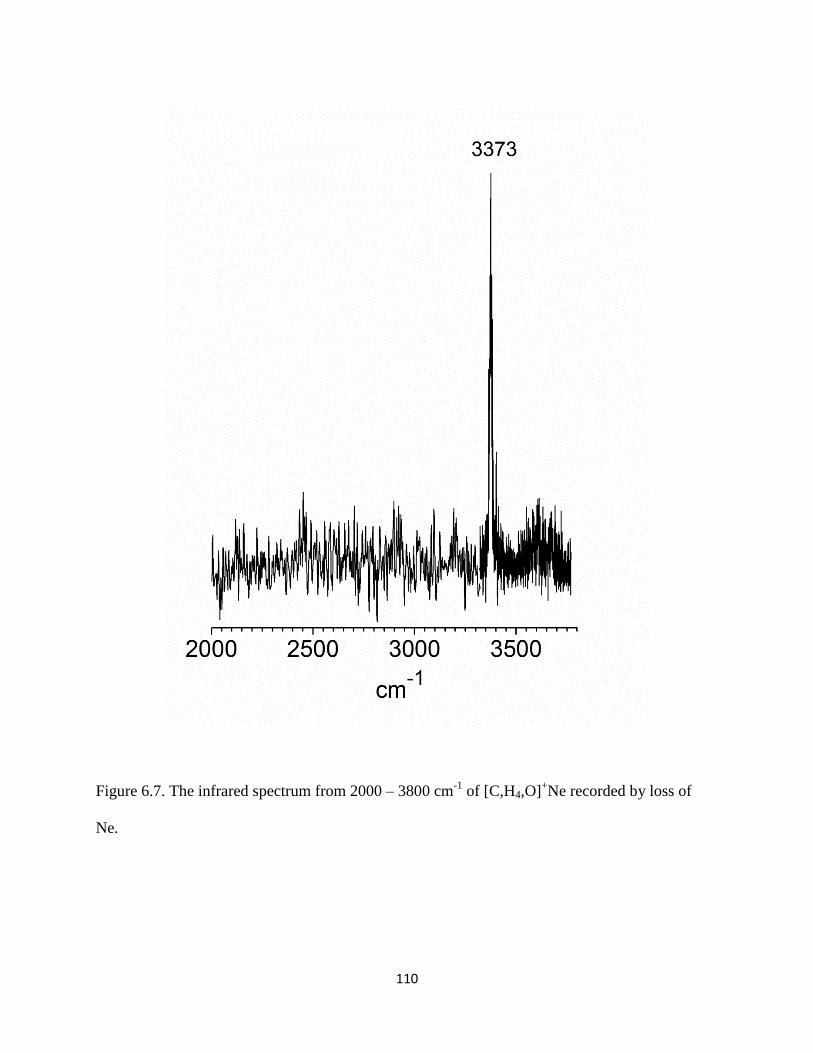
110
Figure 6.7. The infrared spectrum from 2000 – 3800 cm-1
of [C,H4,O]+Ne recorded by loss of
Ne.
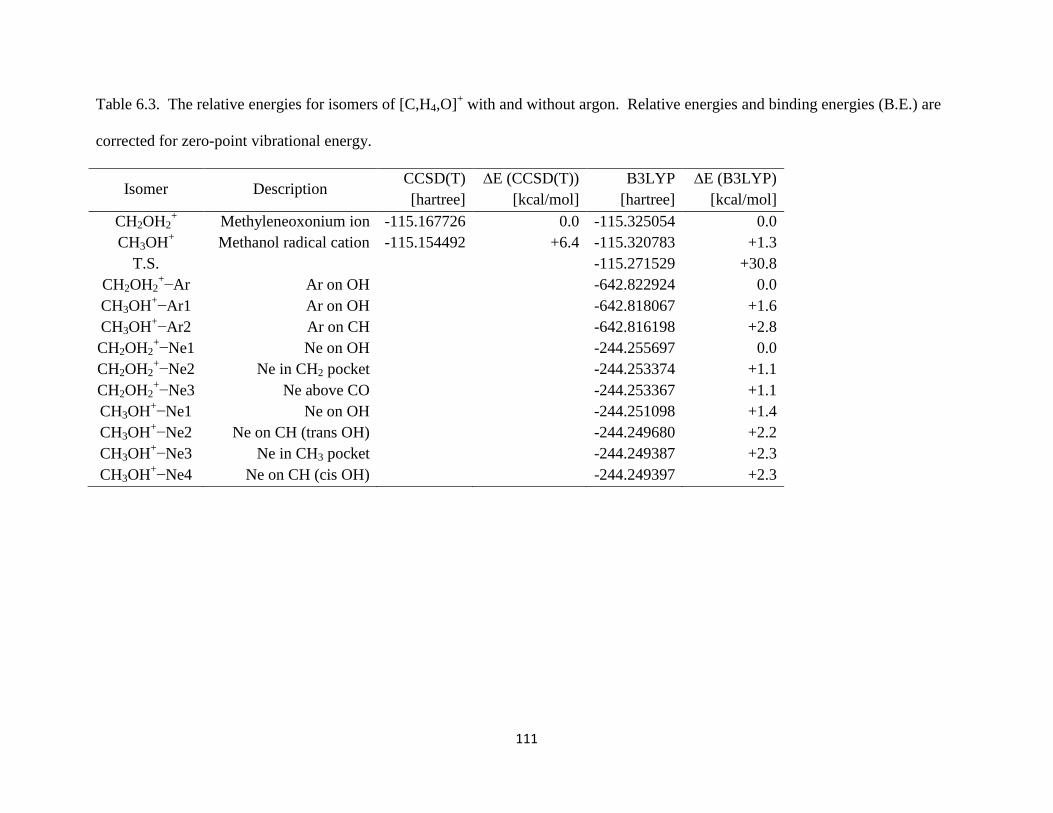
111
Table 6.3. The relative energies for isomers of [C,H4,O]+ with and without argon. Relative energies and binding energies (B.E.) are
corrected for zero-point vibrational energy.
Isomer Description CCSD(T)
[hartree]
∆E (CCSD(T))
[kcal/mol]
B3LYP
[hartree]
∆E (B3LYP)
[kcal/mol]
CH2OH2+ Methyleneoxonium ion -115.167726 0.0 -115.325054 0.0
CH3OH+ Methanol radical cation -115.154492 +6.4 -115.320783 +1.3
T.S. -115.271529 +30.8
CH2OH2+−Ar Ar on OH -642.822924 0.0
CH3OH+−Ar1 Ar on OH -642.818067 +1.6
CH3OH+−Ar2 Ar on CH -642.816198 +2.8
CH2OH2+−Ne1 Ne on OH -244.255697 0.0
CH2OH2+−Ne2 Ne in CH2 pocket -244.253374 +1.1
CH2OH2+−Ne3 Ne above CO -244.253367 +1.1
CH3OH+−Ne1 Ne on OH -244.251098 +1.4
CH3OH+−Ne2 Ne on CH (trans OH) -244.249680 +2.2
CH3OH+−Ne3 Ne in CH3 pocket -244.249387 +2.3
CH3OH+−Ne4 Ne on CH (cis OH) -244.249397 +2.3
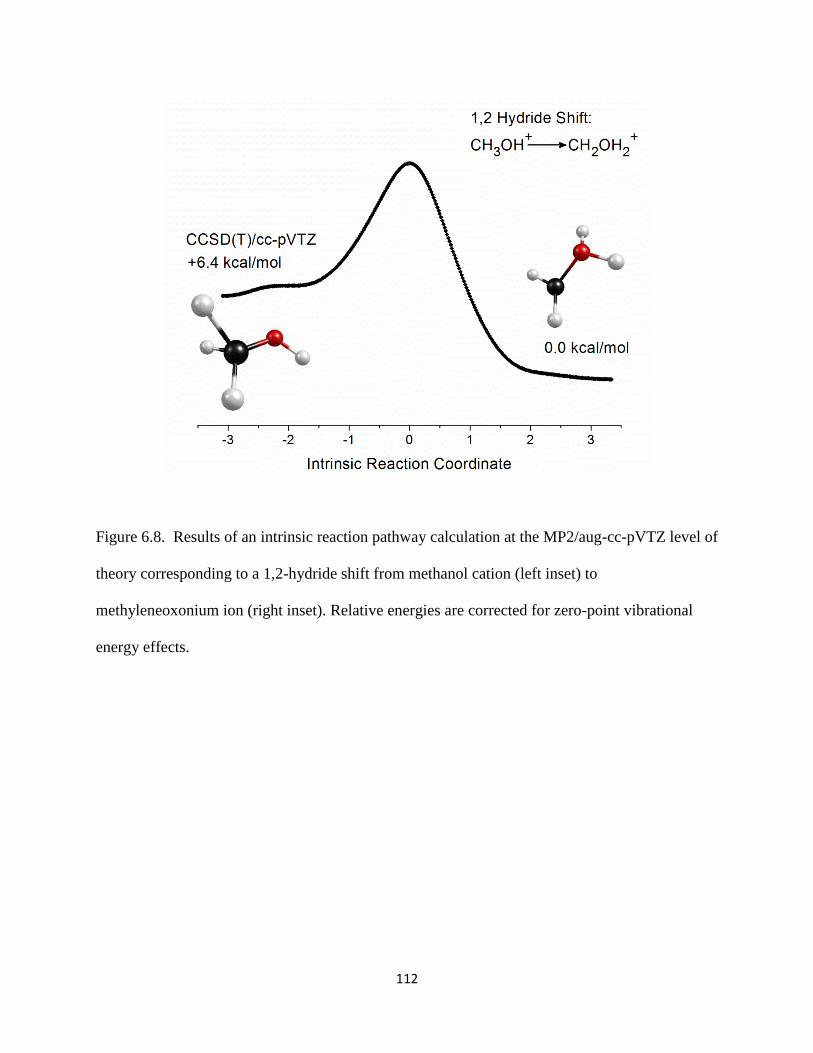
112
Figure 6.8. Results of an intrinsic reaction pathway calculation at the MP2/aug-cc-pVTZ level of
theory corresponding to a 1,2-hydride shift from methanol cation (left inset) to
methyleneoxonium ion (right inset). Relative energies are corrected for zero-point vibrational
energy effects.
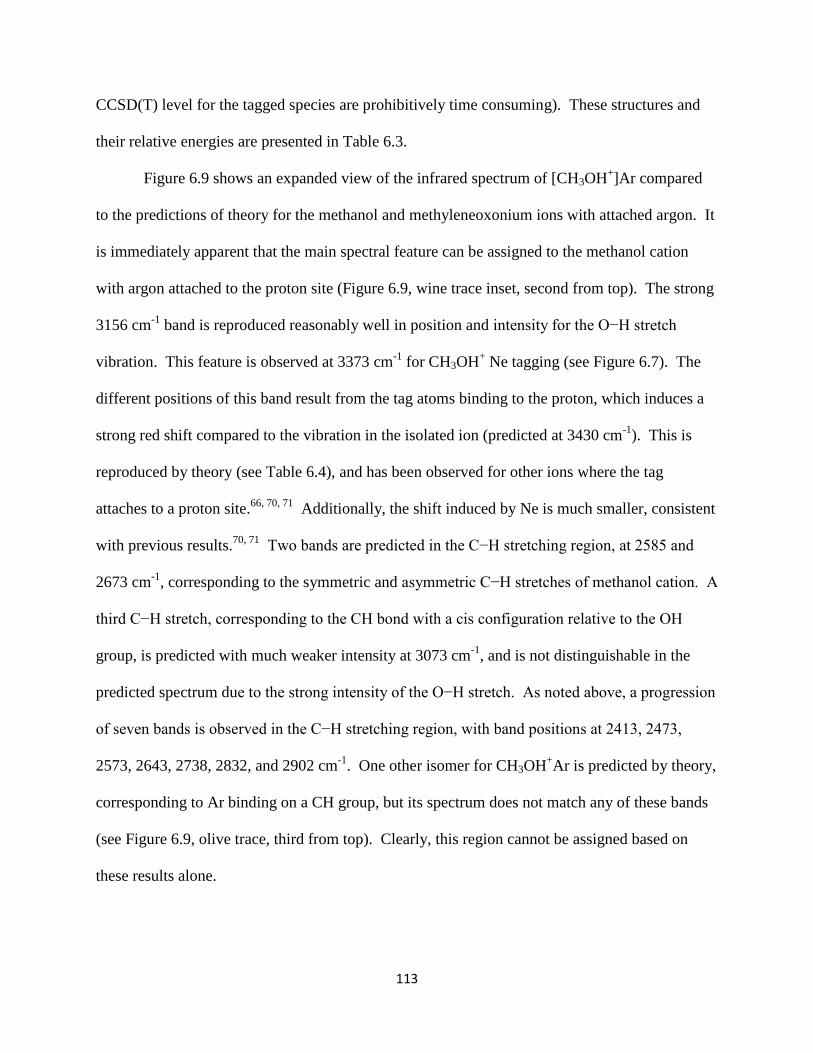
113
CCSD(T) level for the tagged species are prohibitively time consuming). These structures and
their relative energies are presented in Table 6.3.
Figure 6.9 shows an expanded view of the infrared spectrum of [CH3OH+]Ar compared
to the predictions of theory for the methanol and methyleneoxonium ions with attached argon. It
is immediately apparent that the main spectral feature can be assigned to the methanol cation
with argon attached to the proton site (Figure 6.9, wine trace inset, second from top). The strong
3156 cm-1
band is reproduced reasonably well in position and intensity for the O−H stretch
vibration. This feature is observed at 3373 cm-1
for CH3OH+ Ne tagging (see Figure 6.7). The
different positions of this band result from the tag atoms binding to the proton, which induces a
strong red shift compared to the vibration in the isolated ion (predicted at 3430 cm-1
). This is
reproduced by theory (see Table 6.4), and has been observed for other ions where the tag
attaches to a proton site.66, 70, 71
Additionally, the shift induced by Ne is much smaller, consistent
with previous results.70, 71
Two bands are predicted in the C−H stretching region, at 2585 and
2673 cm-1
, corresponding to the symmetric and asymmetric C−H stretches of methanol cation. A
third C−H stretch, corresponding to the CH bond with a cis configuration relative to the OH
group, is predicted with much weaker intensity at 3073 cm-1
, and is not distinguishable in the
predicted spectrum due to the strong intensity of the O−H stretch. As noted above, a progression
of seven bands is observed in the C−H stretching region, with band positions at 2413, 2473,
2573, 2643, 2738, 2832, and 2902 cm-1
. One other isomer for CH3OH+Ar is predicted by theory,
corresponding to Ar binding on a CH group, but its spectrum does not match any of these bands
(see Figure 6.9, olive trace, third from top). Clearly, this region cannot be assigned based on
these results alone.
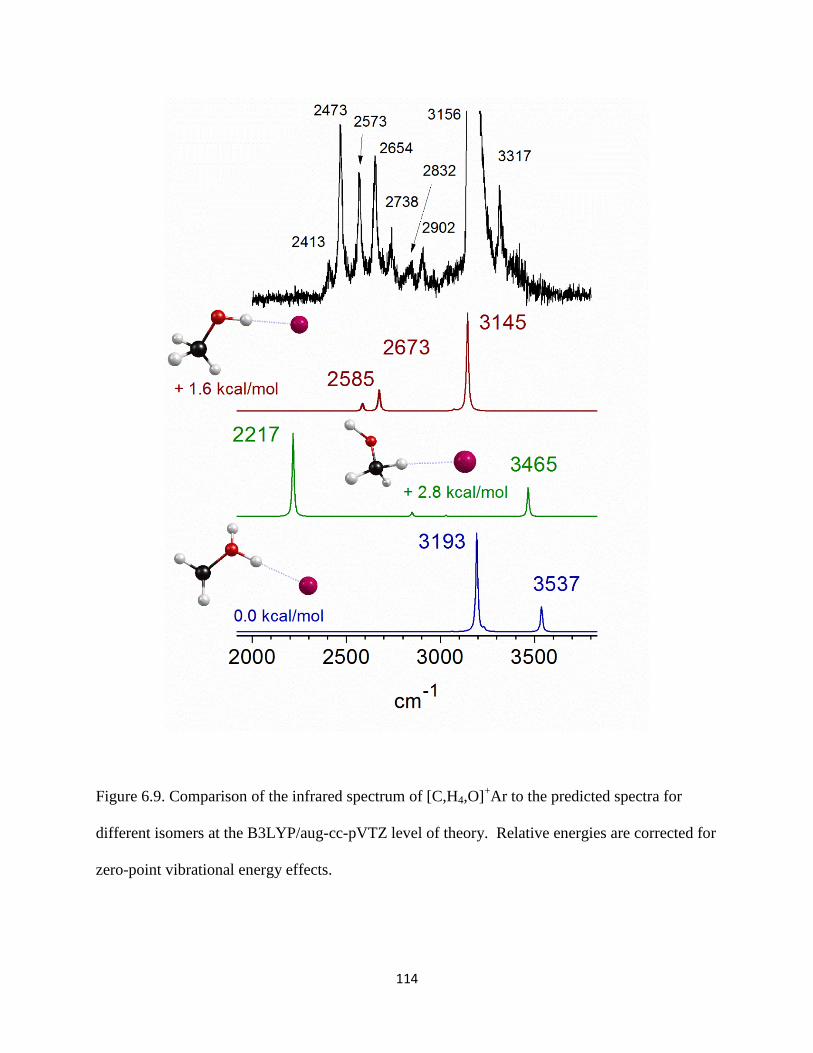
114
Figure 6.9. Comparison of the infrared spectrum of [C,H4,O]+Ar to the predicted spectra for
different isomers at the B3LYP/aug-cc-pVTZ level of theory. Relative energies are corrected for
zero-point vibrational energy effects.
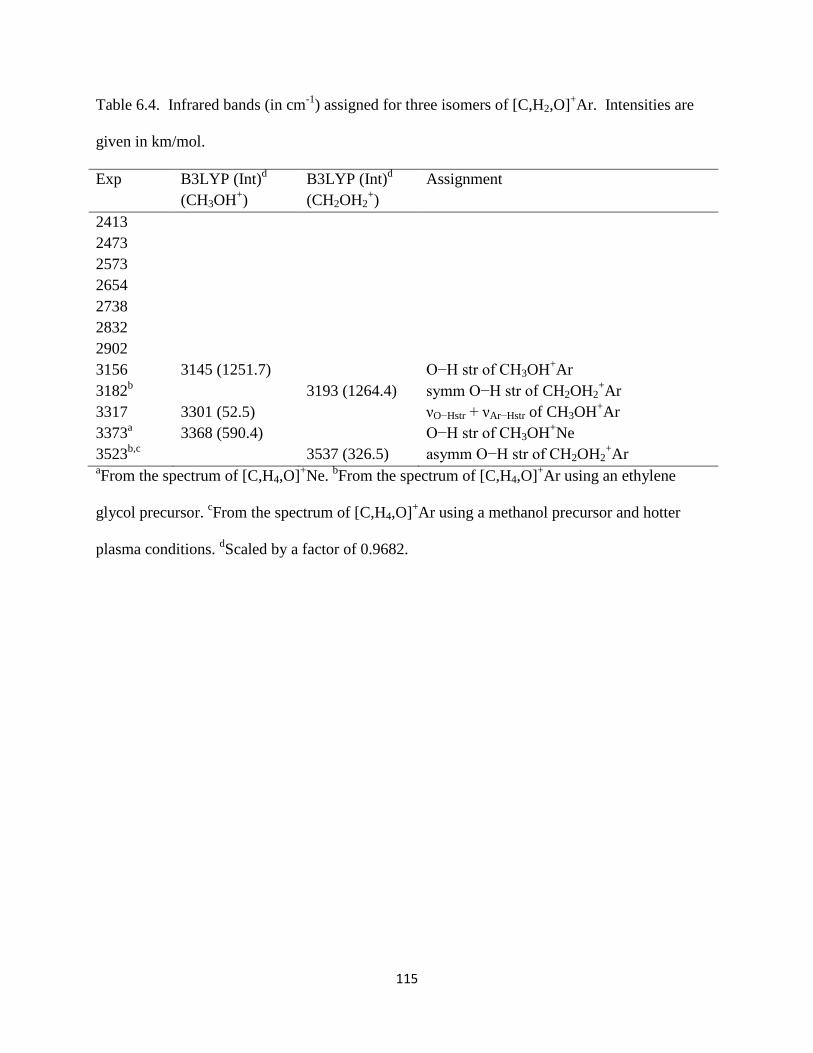
115
Table 6.4. Infrared bands (in cm-1
) assigned for three isomers of [C,H2,O]+Ar. Intensities are
given in km/mol.
Exp B3LYP (Int)d
(CH3OH+)
B3LYP (Int)d
(CH2OH2+)
Assignment
2413
2473
2573
2654
2738
2832
2902
3156 3145 (1251.7) O−H str of CH3OH+Ar
3182b 3193 (1264.4) symm O−H str of CH2OH2
+Ar
3317 3301 (52.5) νO−Hstr + νAr−Hstr of CH3OH+Ar
3373a 3368 (590.4) O−H str of CH3OH
+Ne
3523b,c
3537 (326.5) asymm O−H str of CH2OH2+Ar
aFrom the spectrum of [C,H4,O]
+Ne.
bFrom the spectrum of [C,H4,O]
+Ar using an ethylene
glycol precursor. cFrom the spectrum of [C,H4,O]
+Ar using a methanol precursor and hotter
plasma conditions. dScaled by a factor of 0.9682.

116
To investigate this further, we investigate assignments for these features involving
overtones or combination bands, guided by past experience with similar systems. Such bands
can be quite prominent in ion spectra because of the effects of charge on vibrational couplings
and IR intensities. The peak at 2473 cm-1
is at a frequency roughly twice that of the harmonic
mode corresponding to the OH bend towards the cis CH bond, predicted at 1307 cm-1
. If
anharmonicity is included in the calculation of the energy of this overtone using second order
vibrational perturbation theory, as implemented in Gaussian0972
at the B3LYP/aug-cc-pVTZ
level of theory, the overtone is reduced to 2469 cm-1
, close to the observed band position. Its
predicted infrared intensity is 12.4 km/mol. It is possible that this overtone borrows intensity
from one or both of the C−H stretches via vibrational coupling. A combination band is predicted
at 2855 cm-1 (19.2 km/mol), corresponding to one quantum each of the symmetric C−H stretch
and the OH torsional mode. Another overtone is predicted close to the 2832 cm-1
band at 2843
cm-1
(7.8 km/mol intensity), which corresponds to the CH3 umbrella motion. Extra bands
associated with a C−H stretch/bend overtone Fermi resonance have been observed before in the
formate dimer anion.73
The case of methanol cation is more complex, because of the possibility
of two C−H stretches involved in Fermi resonances with the OH bend overtone, the CH3
umbrella overtone, and the C−H stretch/OH torsion combination band. In collaboration with
Anne McCoy, at the Ohio State University, we are currently investigating the vibrational
dynamics associated with the band progression.
We now consider the unexpected feature at 3317 cm-1
, which lies 161 cm-1
to the blue of
the shared proton O−H stretch. This interval is comparable to the harmonic frequency of the
Ar−H stretch, and could results from a combination of this vibration with the O−H stretch.
Analogous bands have been seen in the spectra of halide-water systems74
and protonated CO2,75
117
as well as our recent work on protonated formaldehyde.76
We follow a similar approach here as
utilized by Anne McCoy in the protonated formaldehyde system.76
Using the harmonic
frequencies of the O−H and Ar−H stretches along with the cubic force constant that is linear in
the Ar−H stretch displacement and quadratic in the OH stretch displacement, we predict an
intensity of the combination band that is roughly 4% that of the O−H stretching mode, and a
frequency that is 156 cm-1
blue shifted from the O−H stretching band position. The intensity
arises from a slight lengthening of the Ar−H bond distance due to vibrational averaging in the
ground and first excited vibrational potentials. Thus, we assign the 3317 cm-1
band to this
combination band.
We have assigned all of the obvious bands predicted for the lowest energy structure of
CH3OH+Ar, and none of the methyleneoxonium bands appear in our spectrum. It would appear
that the methanol cation is initially produced following the energetic ionization and
fragmentation processes, and rapid, efficient cooling prevents any structural rearrangement from
occurring. To estimate the temperature of the ions, we use the computed rotational constants of
methanol cation tagged with argon to simulate a rotational contour for the O−H stretching band,
and adjust its linewidth (FWHM) to match that in the experiment (see Figure 6.10, blue trace,
bottom). This procedure is not perfect; the linewidth may also have contributions from
predissociation. However, it is good enough for a rough estimate. Our normal cold
discharge/expansion conditions using methanol give a rotational temperature of about 100 K,
consistent with ion temperatures measured previously with this source.66
To investigate other structures on the potential surface, we first varied the precursor used
to produce the m/z = 32 ion. Figure 6.11 presents the spectrum in the O−H stretching region of
[CH3OH+]Ar obtained by loss of Ar, using ethylene glycol as a precursor (black trace, top). The

118
Figure 6.10. Comparison of the infrared spectrum of [C,H4,O]+Ar to a rovibrational simulation
using pGOPHER.
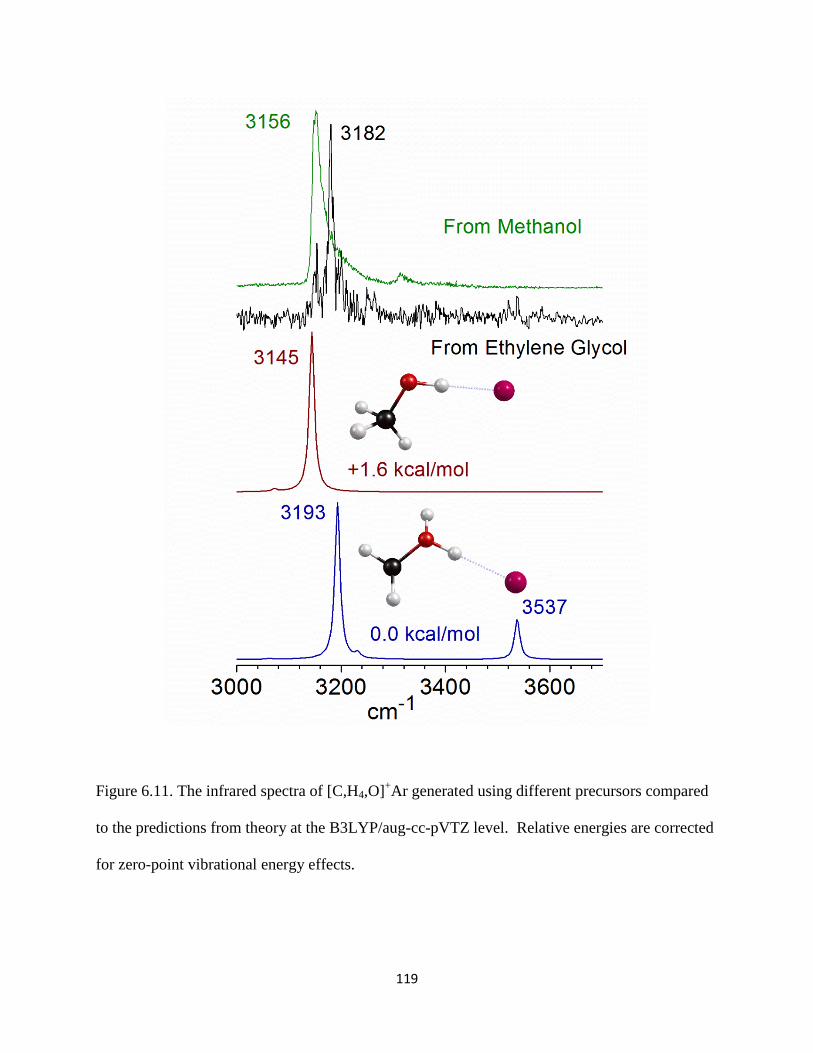
119
Figure 6.11. The infrared spectra of [C,H4,O]+Ar generated using different precursors compared
to the predictions from theory at the B3LYP/aug-cc-pVTZ level. Relative energies are corrected
for zero-point vibrational energy effects.

120
original spectrum, obtained with methanol in the ion source, is shown in comparison (green
trace, top). The new spectrum suffers from low signal levels, but one new peak appears at 3182
cm-1
. This band is clearly at a different position from that corresponding to the O−H stretch of
CH3OH+Ar. The predicted spectrum for CH2OH2
+Ar aids in the assignment of this band (royal
trace, bottom). The new band corresponds to the symmetric O−H stretch of the
methyleneoxonium ion. Due to the low signal levels, we cannot clearly distinguish the higher
energy asymmetric stretch from the baseline. However, the appearance of the O−H stretch at
3182 cm-1
provides strong evidence that the lower energy structure is produced.
To investigate CH2OH2+Ar further, we varied the discharge conditions used to produce
the ions, using methanol as the precursor. Given the barrier to rearrangement between the global
minimum structure and the conventional radical cation,48, 55, 56
the latter's survival depends on its
cooling rate and efficiency in our source. The temperature of the plasma should therefore affect
the trapping efficiency. To change the temperature of the ions, we increase the discharge voltage
level and move its pulse timing relative to the center of the gas pulse. This simultaneously
increases the heating of the plasma and spoils the collisional cooling. The comparison of the
spectrum obtained with these hotter conditions to that with the normal cold plasma is shown in
Figure 6.12. The rotational simulation under cold conditions is reproduced here and is vertically
offset for clarity (blue trace, top). Based on the observed linewidths for the O−H stretching
band, methanol cations have approximately the same temperature under both conditions, but a
new band appears at 3523 cm-1
, where no signal is observed under the cold conditions. This
peak corresponds to the asymmetric O−H stretch of methyleneoxonium. The lower frequency
stretch observed at 3182 cm-1
(see Figure 6.11), overlaps significantly with the rotational tail of
methanol cation's O−H stretch, and is not clearly distinguishable from the shoulder of this peak.
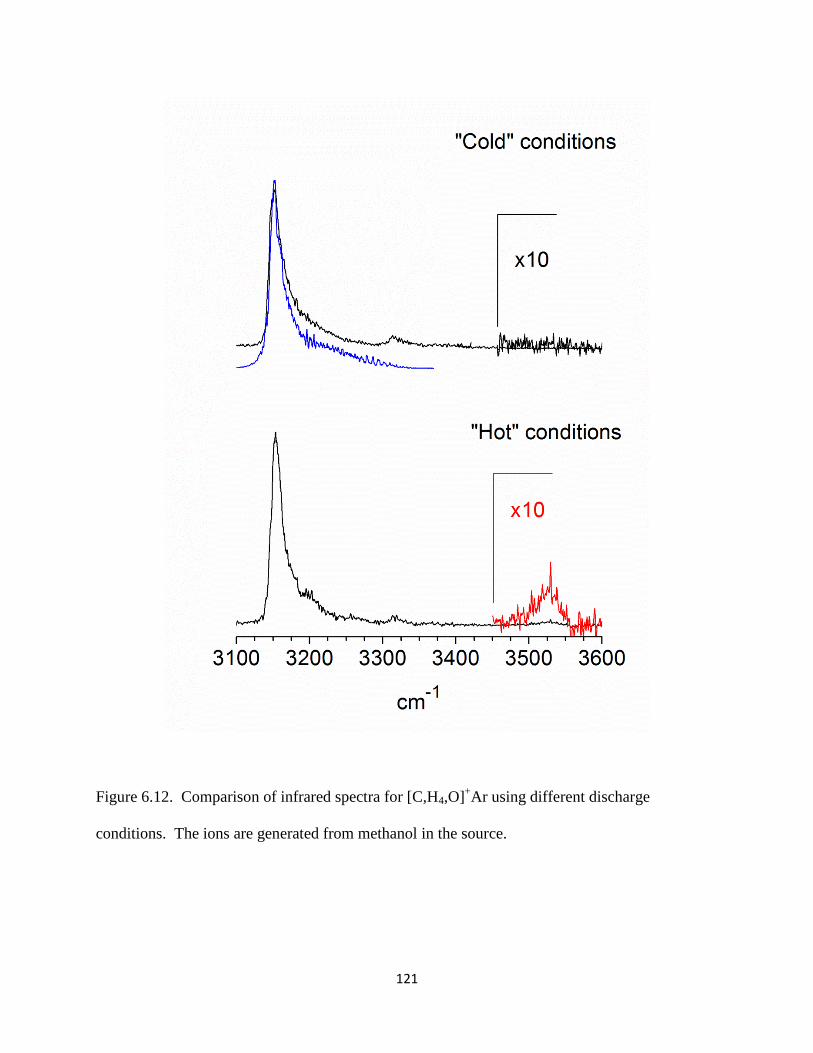
121
Figure 6.12. Comparison of infrared spectra for [C,H4,O]+Ar using different discharge
conditions. The ions are generated from methanol in the source.

122
Apparently, changing the discharge conditions activates new chemistry in the plasma, leading to
production of the global minimum structure. Interestingly, the methanol cations are not heated to
a significant degree. This is consistent with the qualitative aspects of the potential energy
surface predicted previously;48,55,56
the barrier(s) to interconversion (or dissociation) allow only
the coldest subset of ions to survive in our experiment.
Conclusion
[C,H2,O]+ and [C,H4,O]
+ were produced with the discharge/expansion source and the
mass-selected ions were investigated with infrared spectroscopy. The infrared spectrum of
[C,H2,O]+ contains several sharp resonances from 2750 to 3050 cm
-1. Spectral analysis is unable
to definitively assign the bands to either the formaldehyde or hydroxymethylene cations, but
more bands are observed than can be accounted for by either structure alone. Further
investigations are therefore needed into the apparent discrepancies between experiment and
theory. The spectrum of [C,H4,O]+ contains sharp features from 2400 cm
-1 to 3500 cm
-1, when
the ion is made using methanol in our source. A seven band progression is observed in the C−H
stretching region and two peaks are seen in the O−H stretching region. Spectral analysis
confirms the structure is that of the conventional methanol cation; there is no clear evidence for
the lower energy methyleneoxonium structure in this spectrum. Three bands are assigned to
fundamental vibrations of CH3OH+; all of these are new. The O−H stretch detected with argon
tagging is strongly red-shifted compared to the same vibration detected with neon tagging and to
the prediction for that of the isolated cation. The other vibrations have frequencies much closer
to their isolated values. The lower energy methyleneoxonium ion is detected only when the
precursor or source conditions are varied, suggesting that the conventional ion is indeed higher in

123
energy and can be stabilized behind a barrier to interconversion. Rapid collisional cooling in the
present experiment allows this species to be captured and studied. Ion production in our pulsed
discharge/supersonic expansion source provides a convenient method with which to produce and
characterize transient ion species.

124
References
(1) Hartquist, T. W.; Williams, D. A., eds., The Molecular Astrophysics of Stars and
Galaxies. Clarendon Press: Oxford, 1998.
(2) Tielens, A. G. G. M., The Physics and Chemistry of the Interstellar Medium. Cambridge
University Press: Cambridge, U.K., 2005.
(3) Ziurys, L. M., The chemistry in circumstellar envelopes of evolved stars: Following the
origin of the elements to the origin of life. Proc. Natl. Acad. Sci. 2006, 103 (33), 12274-
12279.
(4) Petrie, S.; Bohme, D. K., Ions in space. Mass Spectrom. Rev. 2007, 26 (2), 258-280.
(5) Snow, T. P.; Bierbaum, V. M., Ion chemistry in the interstellar medium. Annu. Rev. Anal.
Chem. 2008, 1 (1), 229-259.
(6) Klemperer, W., Astronomical chemistry. Annu. Rev. Phys. Chem. 2011, 62, 173-184.
(7) Palmer, P.; Zuckerma.B; Buhl, D.; Snyder, L. E., Formaldehyde absorption in dark
nebulae. Astrophys. J. 1969, 156 (3P2), L147-&.
(8) Snyder, L. E.; Buhl, D.; Zuckerma, B.; Palmer, P., Microwave detection of interstellar
formaldehyde. Phys. Rev. Lett. 1969, 22 (13), 679-&.
(9) Ball, J. A.; Gottlieb, C. A.; Lilley, A. E.; Radford, H. E., Detection of methyl alcohol in
Sagittarius. Astrophys. J. 1970, 162 (3), L203-&.
(10) Zuckerma.B; Buhl, D.; Palmer, P.; Snyder, L. W., Observations of interstellar
formaldehyde. Astrophys. J. 1970, 160 (2), 485-&.
125
(11) Snyder, L. E., Interferometric observations of large biologically interesting interstellar
and cometary molecules. Proc. Natl. Acad. Sci. 2006, 103 (33), 12243-12248.
(12) Herbst, E.; Klemperer, W., Formation and depletion of molecules in dense interstellar
clouds. Astrophys. J. 1973, 185 (2), 505-533.
(13) Mutel, R. L.; Broderic.Jj; Carr, T. D.; Lynch, M.; Desch, M.; Warnock, W. W.;
Klempere.Wk, Vlb observations of crab-nebula and wavelength dependence of
interstellar scattering. Astrophys. J. 1974, 193 (1), 279-282.
(14) Johansson, L. E. B.; Andersson, C.; Ellder, J.; Friberg, P.; Hjalmarson, A.; Hoglund, B.;
Irvine, W. M.; Olofsson, H.; Rydbeck, G., Spectral scan of Orion-a and IRC + 10216
from 72 to 91 GHz. Astron. Astrophys. 1984, 130 (2), 227-256.
(15) Tielens, A.; Hagen, W., Model-calculations of the molecular composition of inter-stellar
grain mantles. Astron. Astrophys. 1982, 114 (2), 245-260.
(16) Danks, A. C.; Encrenaz, T.; Bouchet, P.; Lebertre, T.; Chalabaev, A., The spectrum of
comet P/Halley from 3.0 to 4.0 μm. Astron. Astrophys. 1987, 184 (1-2), 329-332.
(17) Allamandola, L. J.; Sandford, S. A.; Valero, G. J., Photochemical and thermal evolution
of interstellar precometary ice analogs. Icar. 1988, 76 (2), 225-252.
(18) Mumma, M. J.; Reuter, D. C., On the identification of formaldehyde in Halleys comet.
Astrophys. J. 1989, 344 (2), 940-948.
(19) Snyder, L. E.; Palmer, P.; Depater, I., Radio detection of formaldehyde emission from
comet halley. Astron. J. 1989, 97 (1), 246-253.

126
(20) Smith, D.; Adams, N. G., Molecular synthesis in inter-stellar clouds - radiative
association reactions of CH3+ ions. Astrophys. J. 1978, 220 (3), L87-L92.
(21) Huntress, W. T.; Mitchell, G. F., Synthesis of complex-molecules in inter-stellar clouds.
Astrophys. J. 1979, 231 (2), 456-467.
(22) Javahery, G.; Petrie, S.; Wincel, H.; Wang, J.; Bohme, D. K., Gas-phase reactions of the
buckminsterfullerene cations C60+, C60
2+, and C60
3+ with water, alcohols, and ethers. J.
Am. Chem. Soc. 1993, 115 (14), 6295-6301.
(23) Schutte, W.; Allamandola, L.; Sandford, S., Formaldehyde and organic molecule
production in astrophysical ices at cryogenic temperatures. Science 1993, 259 (5098),
1143-1145.
(24) Brand, J. C. D.; Reed, R. I., 457. The electronic spectrum of formaldehyde. Part II.
Mechanisms of dissociation of formaldehyde and the formaldehyde molecular ion. J.
Chem. Soc. 1957, (0), 2386-2392.
(25) Kanomata, I., Mass-spectrometric study on ionization and dissociation of formaldehyde,
acetaldehyde, acetone and ethyl methyl ketone by electron impact. Bull. Chem. Soc. Jap.
1961, 34 (12), 1864-1871.
(26) Baer, T.; Ng, C.; Powis, I., The Structure, Energetics, and Dynamics of Organic Ions.
Wiley: New York, 1996.
(27) Holmes, J. L.; Aubrey, C.; Mayer, P. M., Assigning Structures to Ions in Mass
Spectrometry. CRC: Boca Raton, 2007.

127
(28) Olah, G. A.; Laali, K. K.; Wang, Q.; Prakash, G. K. S., Onium Ions. John Wiley & Sons:
New York, 1998.
(29) Beynon, J. H.; Fontaine, A. E.; Lester, G. R., Mass spectrometry: the mass spectrum of
methanol. Part I. Thermochemical information. Intl. J. Mass. Spectrom. Ion Phys. 1968, 1
(1), 1-24.
(30) Berkowitz, J., Photoionization of CH3OH, CD3OH, and CH3OD: Dissociative ionization
mechanisms and ionic structures. J. Chem. Phys. 1978, 69 (7), 3044-3054.
(31) Wesdemiotis, C.; McLafferty, F. W., Mass spectral evidence for the hydroxymethylene
radical cation. Tetra. Lett. 1981, 22 (36), 3479-3480.
(32) Burgers, P. C.; Mommers, A. A.; Holmes, J. L., Ionized oxycarbenes:
hydroxymethylidyne cation ([COH]+), hydroxymethylene cation ([HCOH]
+),
dihydroxymethylene cation ([C(OH)2]+), formoxylium cation ([HCO2]
+) and carboxyl
cation ([COOH]+), their generation, identification, heat of formation, and dissociation
characteristics. J. Am. Chem. Soc. 1983, 105 (19), 5976-5979.
(33) Reed, R. I., Studies in electron impact methods. Part 1.-Formaldehyde,
deuteroformaldehyde and some related compounds. Trans. Farad. Soc. 1956, 52 (0),
1195-1200.
(34) Guyon, P. M.; Chupka, W. A.; Berkowitz, J., Photoionization mass spectrometric study
of formaldehyde H2CO, HDCO and D2CO. J. Chem. Phys. 1976, 64 (4), 1419-1436.

128
(35) Bouma, W. J.; Macleod, J. K.; Radom, L., Ab initio molecular-orbital study of the CH2O+
isomers - stability of the hydroxymethylene radical cation. Int. J. Mass Spectrom. Ion
Process. 1980, 33 (1), 87-93.
(36) Osamura, Y.; Goddard, J. D.; III, H. F. S.; Kim, K. S., Near degenerate rearrangement
between the radical cations of formaldehyde and hydroxymethylene. J. Chem. Phys.
1981, 74 (1), 617-621.
(37) Ma, N. L.; Smith, B. J.; Radom, L., The energy difference between formaldehyde and
hydroxymethylene radical cations: Failure of unrestricted (UMP2) and restricted (RMP2)
Møller—Plesset procedures. Chem. Phys. Lett. 1992, 193 (5), 386-394.
(38) Wiest, O., Density functional theory studies of the methanol radical cation hypersurface.
J. Mol. Struct.: THEOCHEM 1996, 368 (0), 39-48.
(39) Lon B. Knight, J.; Steadman, J., An ESR investigation of the formaldehyde cation
radicals (H212
CO+ and H2
13CO
+) in neon matrices at 4 K. J. Chem. Phys. 1984, 80 (3),
1018-1025.
(40) Baker, A. D.; Baker, C.; Brundle, C. R.; Turner, D. W., The electronic structures of
methane, ethane, ethylene and formaldehyde studied by high-resolution molecular
photoelectron spectroscopy. Intl. J. Mass. Spectrom. Ion Phys. 1968, 1 (4–5), 285-301.
(41) Niu, B.; Shirley, D. A.; Bai, Y., High resolution photoelectron spectroscopy and
femtosecond intramolecular dynamics of H2CO+and D2CO
+. J. Chem. Phys. 1993, 98 (6),
4377-4390.

129
(42) Wiedmann, R. T.; White, M. G.; Wang, K.; McKoy, V., Rotationally resolved
photoionization of polyatomic hydrides: CH3, H2O, H2S, H2CO. J. Chem. Phys. 1994,
100 (7), 4738-4746.
(43) Liu, J.; Kim, H.-T.; Anderson, S. L., Multiphoton ionization and photoelectron
spectroscopy of formaldehyde via its 3p Rydberg states. J. Chem. Phys. 2001, 114 (22),
9797-9806.
(44) Schulenburg, A. M.; Meisinger, M.; Radi, P. P.; Merkt, F., The formaldehyde cation:
Rovibrational energy level structure and Coriolis interaction near the adiabatic ionization
threshold. J. Mol. Spectrosc. 2008, 250 (1), 44-50.
(45) Blowers, P.; Masel, R. I., Calculated Vibrational Spectra for CHnOHm Species. J. Phys.
Chem. A 1999, 104 (1), 34-44.
(46) Bouma, W. J.; MacLeod, J. K.; Radom, L., Experimental evidence for the existence of a
stable isomer of CH3OH+: the methylenoxonium radical cation, CH2OH2
+. J. Am. Chem.
Soc. 1982, 104 (10), 2930-2931.
(47) Holmes, J. L.; Lossing, F. P.; Terlouw, J. K.; Burgers, P. C., The radical cation
[CH2OH2]+ and related stable gas-phase ion-dipole complexes. J. Am. Chem. Soc. 1982,
104 (10), 2931-2932.
(48) Holmes, J. L.; Lossing, F. P.; Terlouw, J. K.; Burgers, P. C., Novel gas-phase ions. The
radical cations [CH2XH]+•
(X=F, Cl, Br, I, OH, NH2, SH) and [CH2CH2NH3]+•
. Can. J.
Chem. 1983, 61 (10), 2305-2309.
130
(49) Bramer, E. M.; Weger, E.; Ischtwan, J.; Brand, W. A.; Levsen, K., Photodissociation of
some small heteroatom-containing organic ions. Intl. J. Mass Spectrom. Ion Proc. 1983,
55 (1), 83-91.
(50) Verbeck, G. F.; Gillig, K. J.; Russell, D. H., Variable-temperature ion mobility time-of-
flight mass spectrometry studies of electronic isomers of Kr2+
and CH3OH+ radical
cations. Eur. J. Mass Spectrom. 2003, 9 (6), 579-587.
(51) Bouma, W. J.; Nobes, R. H.; Radom, L., Methylenoxonium radical cation (CH2OH2+): a
surprisingly stable isomer of the methanol radical cation. J. Am. Chem. Soc. 1982, 104
(10), 2929-2930.
(52) Yates, B. F.; Bouma, W. J.; Radom, L., Ylides and ylidions: A comparative study of
unusual gas-phase structures. J. Am. Chem. Soc. 1987, 109 (8), 2250-2263.
(53) Ma, N. L.; Smith, B. J.; Pople, J. A.; Radom, L., Rearrangement and dissociative
reactions of the methanol radical cation (CH3OH+): a comparison of theory and
experiment. J. Am. Chem. Soc. 1991, 113 (21), 7903-7912.
(54) Ma, N. L.; Smith, B. J.; Radom, L., Refined thermochemistry for the methanol radical
cation (CH3OH+) and its distonic isomer (CH2OH2
+). J. Phys. Chem. 1992, 96 (14), 5804-
5807.
(55) Radom, L., The chemistry of gas-phase ions: A theoretical approach. Intl. J. Mass
Spectrom. Ion Proc. 1992, 118–119 (0), 339-368.

131
(56) Gauld, J. W.; Radom, L., A reappraisal of the structures and stabilities of prototype
distonic radical cations and their conventional isomers. J. Phys. Chem. 1994, 98 (3), 777-
784.
(57) Yates, B. F.; Bouma, W. J.; Radom, L., Detection of the prototype phosphonium
(CH2PH3), sulfonium (CH2SH2), and chloronium (CH2ClH) ylides by neutralization
reionization mass-spectrometry - a theoretical prediction. J. Am. Chem. Soc. 1984, 106
(20), 5805-5808.
(58) Yates, B. F.; Bouma, W. J.; Radom, L., Distonic radical cations : Guidelines for the
assessment of their stability. Tetrahedron 1986, 42 (22), 6225-6234.
(59) Hammerum, S., Distonic radical cations in gaseous and condensed phase. Mass
Spectrom. Rev. 1988, 7 (2), 123-202.
(60) Zeller, L.; Farrell, J.; Vainiotalo, P.; Kenttamaa, H. I., Long-lived radical cations of
simple organophosphates isomerize spontaneously to distonic structures in the gas-phase.
J. Am. Chem. Soc. 1992, 114 (4), 1205-1214.
(61) Leeck, D. T.; Stirk, K. M.; Zeller, L. C.; Kiminkinen, L. K. M.; Castro, L. M.; Vainiotalo,
P.; Kenttamaa, H. I., The long-lived radical cations of simple carbon esters isomerize to
the lowest-energy structure. J. Am. Chem. Soc. 1994, 116 (7), 3028-3038.
(62) Bjoernholm, T.; Hammerum, S.; Kuck, D., Distonic ions as reacting species. J. Am.
Chem. Soc. 1988, 110 (12), 3862-3869.
132
(63) Gauld, J. W.; Audier, H.; Fossey, J.; Radom, L., Water-catalyzed interconversion of
conventional and distonic radical cations: Methanol and methyleneoxonium radical
cations. J. Am. Chem. Soc. 1996, 118 (26), 6299-6300.
(64) Gauld, J. W.; Radom, L., Effects of neutral bases on the isomerization of conventional
radical cations CH3X+ to their distonic isomers (CH2X
+H)-C-(X = F, OH, NH2): Proton-
transport catalysis and other mechanisms. J. Am. Chem. Soc. 1997, 119 (41), 9831-9839.
(65) Knight, L. B.; Kerr, K.; Villanueva, M.; McKinley, A. J.; Feller, D., Theoretical and neon
matrix electron spin resonance studies of the methanol cation: CH3OH+, CH3OD
+,
CH2DOH+, and
13CH3OH
+. J. Chem. Phys. 1992, 97 (8), 5363-5376.
(66) Duncan, M. A., Infrared laser spectroscopy of mass-selected carbocations. J. Phys. Chem.
A 2012, 116 (47), 11477-11491.
(67) CFOUR, a quantum chemical program package written by J. F. Stanton, J. Gauss, M. E.
Harding, and P. G. Szalay with contributions from A. A. Auer, R. J. Bartlett, U. Benedikt,
C. Berger, D. E. Bernholdt, Y. J. Bomble, L. Cheng, O. Christiansen, M. Heckert, O.
Heun, C. Huber, T.-C. Jagau, D. Jonsson, J. Jusélius, K. Klein, W. J. Lauderdale, D. A.
Matthews, T. Metzroth, L. A. Mück, D. P. O'Neill, D. R. Price, E. Prochnow, C.
Puzzarini, K. Ruud, F. Schiffmann, W. Schwalbach, S. Stopkowicz, A. Tajti, J. Vázquez,
F. Wang, J. D. Watts and the integral packages MOLECULE (J. Almlöf and P. R.
Taylor), PROPS (P. R. Taylor), ABACUS (T. Helgaker, H. J. Aa. Jensen, P. Jørgensen,
and J. Olsen), and ECP routines by A. V. Mitin and C. van Wüllen. For the current
version, see http://www.cfour.de.

133
(68) Schmidt, M. W.; Baldridge, K. K.; Boatz, J. A.; Elbert, S. T.; Gordon, M. S.; Jensen, J.
H.; Koseki, S.; Matsunaga, N.; Nguyen, K. A.; Su, S.; Windus, T. L.; Dupuis, M.;
Montgomery, J. A., General atomic and molecular electronic structure system. J. Comput.
Chem. 1993, 14 (11), 1347-1363.
(69) Gudeman, C. S.; Begemann, M. H.; Pfaff, J.; Saykally, R. J., Velocity-modulated infrared
laser spectroscopy of molecular ions: The ν1 band of HCO+. Phys. Rev. Lett. 1983, 50
(10), 727-731.
(70) Nizkorodov, S. A.; Dopfer, O.; Ruchti, T.; Meuwly, M.; Maier, J. P.; Bieske, E. J., Size
effects in cluster infrared spectra: The ν1 band of Arn-HCO+ (n = 1-13). J. Phys. Chem.
1995, 99 (47), 17118-17129.
(71) Nizkorodov, S. A.; Dopfer, O.; Meuwly, M.; Maier, J. P.; Bieske, E. J., Mid‐infrared
spectra of the proton‐bound complexes Nen–HCO+ (n=1,2). J. Chem. Phys. 1996, 105 (5),
1770-1777.
(72) Frisch, M. J., et al., Gaussian 09 (Revision D.01). Gaussian, Inc.: Wallingford CT, 2003.
(73) Gerardi, H. K.; DeBlase, A. F.; Leavitt, C. M.; Su, X.; Jordan, K. D.; McCoy, A. B.;
Johnson, M. A., Structural characterization of electron-induced proton transfer in the
formic acid dimer anion, (HCOOH)2-, with vibrational and photoelectron spectroscopies.
J. Chem. Phys. 2012, 136 (13), 134318.
(74) Horvath, S.; McCoy, A. B.; Elliott, B. M.; Weddle, G. H.; Roscioli, J. R.; Johnson, M.
A., Anharmonicities and isotopic effects in the vibrational spectra of X−·H2O, ·HDO, and
·D2O [X = Cl, Br, and I] binary complexes. J. Phys. Chem. A 2010, 114 (3), 1556-1568.
134
(75) Douberly, G. E.; Ricks, A. M.; Ticknor, B. W.; Duncan, M. A., Structure of protonated
carbon dioxide clusters: Infrared photodissociation spectroscopy and ab initio
calculations. J. Phys. Chem. A 2008, 112 (5), 950-959.
(76) Mosley, J. D.; Cheng, T. C.; McCoy, A. B.; Duncan, M. A., Infrared spectroscopy of the
mass 31 cation: Protonated formaldehyde vs methoxy. J. Phys. Chem. A 2012, 116 (37),
9287-9294.
135
CHAPTER 7
INFRARED PHOTODISSOCIATION SPECTROSCOPY OF THE ACETYL CATION AND
ITS PROTONATED KETENE ISOMER
Introduction
The structures of ions have been of particular interest in mass spectrometry1-3
and
astrochemistry.4-7
Ion reactivity studies and collisional dissociation dynamics can indicate the
presence of more than one isomer, though spectroscopy can give more direct structural
information.1-3
Additionally, the observation of ions in space requires spectroscopy in the
laboratory to confirm their presence in interstellar environments. However, ion spectroscopy is
difficult due to the high internal temperatures and low densities per quantum state resulting from
standard ion production methods.1 On the other hand, quantum chemistry can provide structural
information of ions as well as the relative energetics of isomers. Indeed, theory and spectroscopy
are both needed to corroborate which isomers exist, in nature or the laboratory environment.1-3
Recent developments in ion production methods and infrared laser technology make it possible
to obtain the spectra of mass-selected ions via laser photodissociation.8-10
This work investigates
the [C2,H3,O]+ organic ion with infrared photodissociation spectroscopy.
[C2,H3,O]+ has been studied extensively with mass spectrometry, mainly because ions of
this mass to charge ratio (m/e = 43) are prevalent among the mass spectra produced from
oxygen-containing precursors.1-3, 11-15
Ion/molecule reactions and collisional dissociation studies
suggest that the structure(s) could be that of the acetyl cation (CH3CO+), protonated ketene
(CH2COH+) and/or oxiranyl cation (H2COCH
+).
3, 11-13 Mass spectrometric and thermochemical
studies indicate that the lowest energy structure is CH3CO+.12-15
The infrared spectrum and

136
crystal structure of acetyl have been measured before in superacid matrices.16-18
To our
knowledge, no spectroscopy has been reported for other isomers of [C2,H3,O]+. Previous
theoretical results indicate that a few of the more energetic structures lie behind large barriers to
interconversion, and that the acetyl cation is the global minimum structure.19, 20
[C2,H3,O]+ is
also important in astrochemical models,7, 21-23
though it has not yet been detected in space, in part
due to a lack of laboratory gas phase spectra. Therefore, [C2,H3,O]+ is a compelling target for
study with infrared laser spectroscopy.
Experimental Section
The infrared spectrum of [C2,H3,O]+
is obtained via infrared photodissociation
spectroscopy, which has been described before.24
Briefly, ions are produced in a pulsed
electrical discharge with typical pulse widths of 5−10 microseconds through a supersonic
expansion with typical pulse widths of 250−300 microseconds. The expansion is backed by 15-
17 atm of a mixture of He and Ar seeded with the ambient vapor pressure of methyl acetate
(99%, Alfa Aesar) or acetone (>99.5%, Fisher Scientific) at room temperature. The expansion is
skimmed into a second differentially pumped chamber which houses a home-made reflectron
time-of-flight mass spectrometer (RTOF). The resulting molecular beam contains neutrals,
positive and negative ions and their Ar complexes. Positive ions are pulse-extracted
perpendicular to the molecular beam. [C2,H3,O]+Ar is mass selected with pulsed deflection
plates in the first flight tube of the RTOF and intersected with a tunable infrared laser
(Laservision OPO/OPA system) in the turning region of the reflectron.24
The complex loses an
Ar atom through resonant photodissociation, and parent and daughter ions are separated in the
RTOF's second flight tube. Fragment ion signal is integrated while tuning the laser to obtain an
infrared spectrum.

137
CCSD(T)/cc-pVTZ calculations with zero point vibrational energy (ZPE) corrections are
used to accurately predict the structures and relative energetics of [C2,H3,O]+, and frequencies
are predicted at the CCSD(T) level using a comparably sized atomic natural orbital basis set
(ANO1), playing to the strengths of each basis set for predicting molecular properties.25
Anharmonic corrections are obtained at the CCSD(T)/ANO1 level of theory in conjunction with
second order vibrational perturbation theory (VPT2).26, 27
It is generally not feasible to run
calculations of structures with the Ar tag atom at this level when performing anharmonic
vibrational analyses. Therefore, harmonic frequencies are computed at the MP2/cc-pVTZ level
for the Ar tagged species and are scaled by standard scaling factors to account for vibrational
anharmonicity.28
MP2 computations are performed using the GAMESS-US computational
chemistry package.29
CCSD(T) computations are performed using the CFOUR programming
package (public release version 1.0).30
Results and Discussion
Of the several oxygen containing molecules tested, methyl acetate produces the greatest
ion intensity at m/e = 43, corresponding to [C2,H3,O]+ (see Figure 7.1). Several other fragment
ions are observed in the mass spectrum as well. CH3+ is observed at m/z = 15, and the peak at
m/z = 29 could be C2H5+ or HCO
+. The peak at m/z = 41 is most likely ArH
+. A smaller
fragment peak is detected at m/z = 59, which is likely to be [C3,H7,O]+.3 The protonated form of
methyl acetate is produced in relatively high abundance as evidenced by the peak at m/z = 75.
Signal at larger mass to charge ratios corresponds to clusters of ions and neutrals. Due to the
high ion intensities, particularly at m/z = 43, this precursor is used to generate the ion for
investigation with infrared spectroscopy.

138
Figure 7.1. The mass spectrum of methyl acetate produced by needle electrical discharge in an
expansion of 10% Ar/ 90% He.
139
The infrared spectrum from 750 – 3500 cm-1
for [C2,H3,O]+Ar obtained by loss of Ar is
presented in Figure 7.2 (black, top trace). Three sharp bands are observed in the fingerprint
region of the spectrum at 1025, 1344 and 1378 cm-1
, where stretching and bending vibrations
unique to the molecular structure are typically found. No signal is measured between 1750 and
2150 cm-1
. One sharp band is seen at 2307 cm-1
, which falls close to the frequency typical of CO
stretches. Three bands appear in the C−H and O−H stretching region of the spectrum. Two
intense bands with noticeably different linewidths are seen at 2903 and 2985 cm-1
, and a weaker
sharp band exists at 3200 cm-1
.
To determine the possible structures of [C2,H3,O]+, we performed an extensive search of
the potential energy surface (PES) at the MP2/cc-pVTZ level of theory. This led to the
optimization of nine different structures, six of which were confirmed to be stable minima by
calculating their harmonic frequencies and verifying only positive frequency values. These
structures and their relative energies at the MP2/cc-pVTZ level are presented in Table 7.1 and
Figure 7.3. The lowest energy structure is the acetyl cation (A). Previous theoretical results
confirm that A is the global minimum of the PES.19, 20
The next lowest energy structure is that of
protonated ketene (herein referred to as B). We computed the relative energetics at the
CCSD(T)/cc-pVTZ level for A and B and obtained a value of ∆E = +176.2 kJ/mol, as presented
in Table 7.1. This value is corrected for zero point vibrational energy (ZPE) effects at the same
level, and is consistent with previous results.16, 20
Other computed structures include the oxiranyl
cation (C), oxygen-methylated CO (D), ethynyloxonium cation (E), and protonated oxirene (F).
We use quantum chemistry to assign the bands in our spectrum to molecular vibrations.
Figure 7.2 (red, bottom trace) shows the results of fundamental vibrations (with VPT2
anharmonic corrections) predicted at the CCSD(T)/ANO1 level of theory for A without Ar,
which has C3v symmetry. Predicted frequencies and their computed intensities are given in
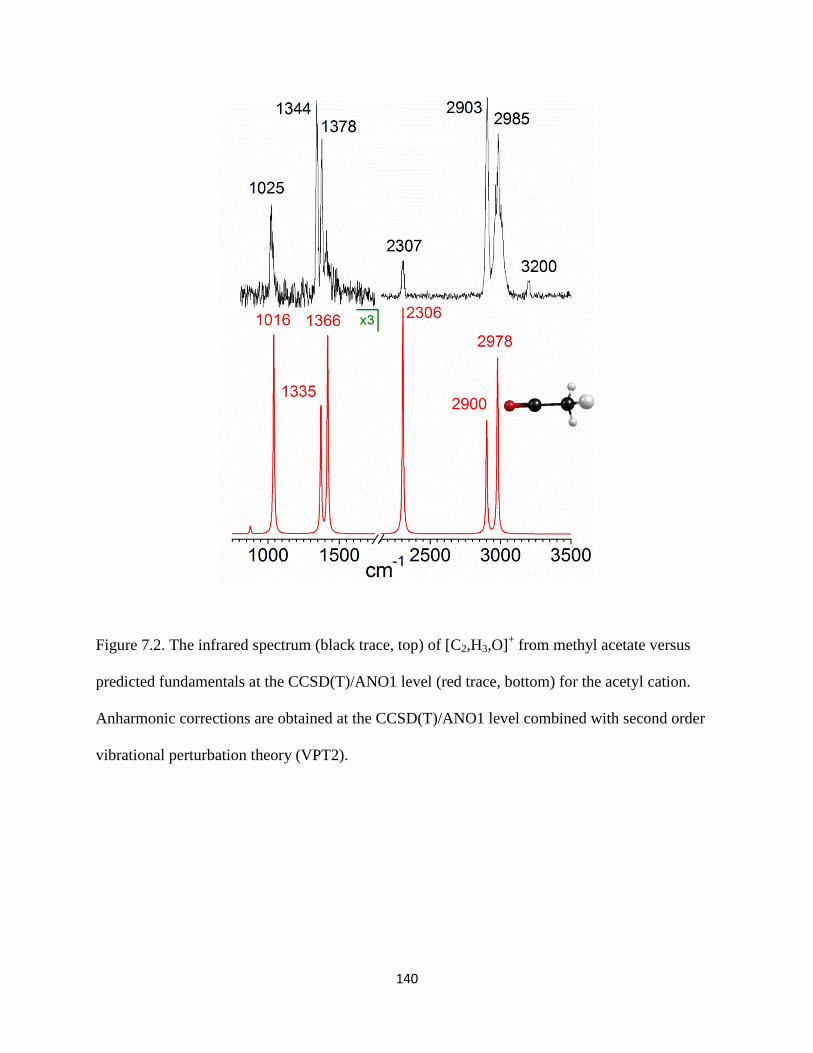
140
Figure 7.2. The infrared spectrum (black trace, top) of [C2,H3,O]+ from methyl acetate versus
predicted fundamentals at the CCSD(T)/ANO1 level (red trace, bottom) for the acetyl cation.
Anharmonic corrections are obtained at the CCSD(T)/ANO1 level combined with second order
vibrational perturbation theory (VPT2).
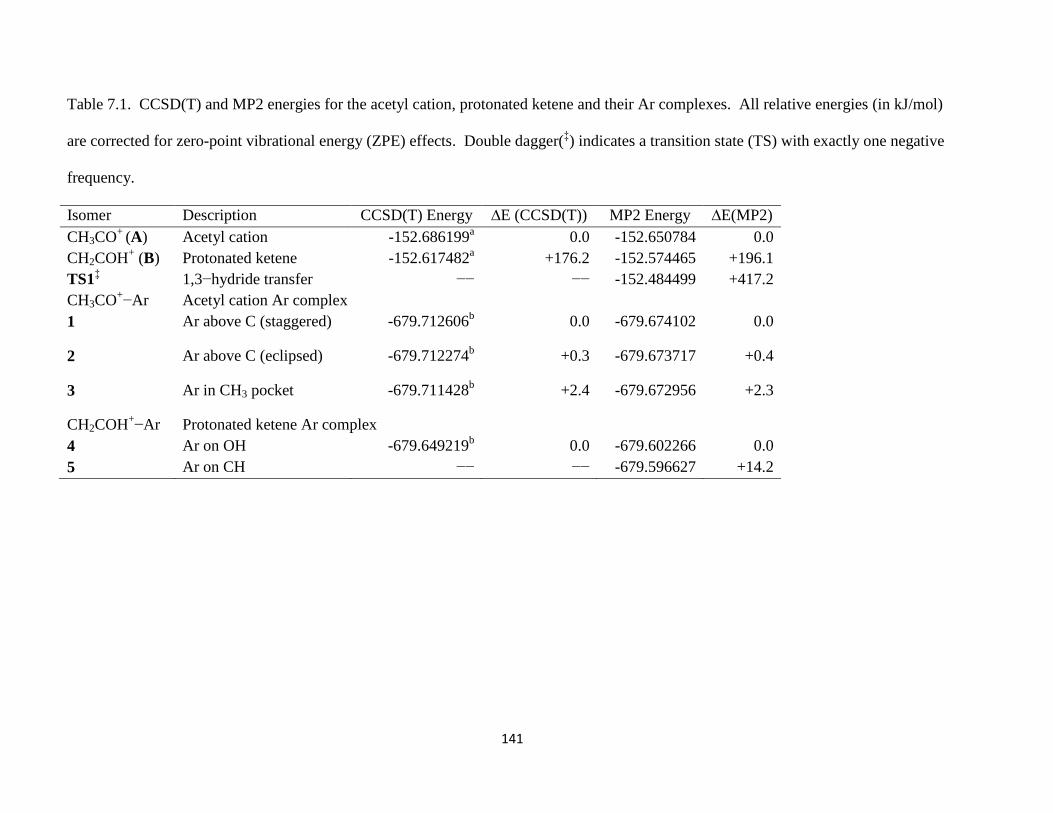
141
Table 7.1. CCSD(T) and MP2 energies for the acetyl cation, protonated ketene and their Ar complexes. All relative energies (in kJ/mol)
are corrected for zero-point vibrational energy (ZPE) effects. Double dagger(‡) indicates a transition state (TS) with exactly one negative
frequency.
Isomer Description CCSD(T) Energy ∆E (CCSD(T)) MP2 Energy ∆E(MP2)
CH3CO+
(A) Acetyl cation -152.686199a 0.0 -152.650784 0.0
CH2COH+ (B) Protonated ketene -152.617482
a +176.2 -152.574465 +196.1
TS1‡ 1,3−hydride transfer −− −− -152.484499 +417.2
CH3CO+−Ar Acetyl cation Ar complex
1 Ar above C (staggered) -679.712606b 0.0 -679.674102 0.0
2 Ar above C (eclipsed) -679.712274b +0.3 -679.673717 +0.4
3 Ar in CH3 pocket -679.711428b +2.4 -679.672956 +2.3
CH2COH+−Ar Protonated ketene Ar complex
4 Ar on OH -679.649219b 0.0 -679.602266 0.0
5 Ar on CH −− −− -679.596627 +14.2

142
Figure 7.3. Six isomers of [C2,H3,O]+ calculated at the MP2/cc-pVTZ level of theory. Relative
energies (in kJ/mol) are corrected for zero-point vibrational energy effects.
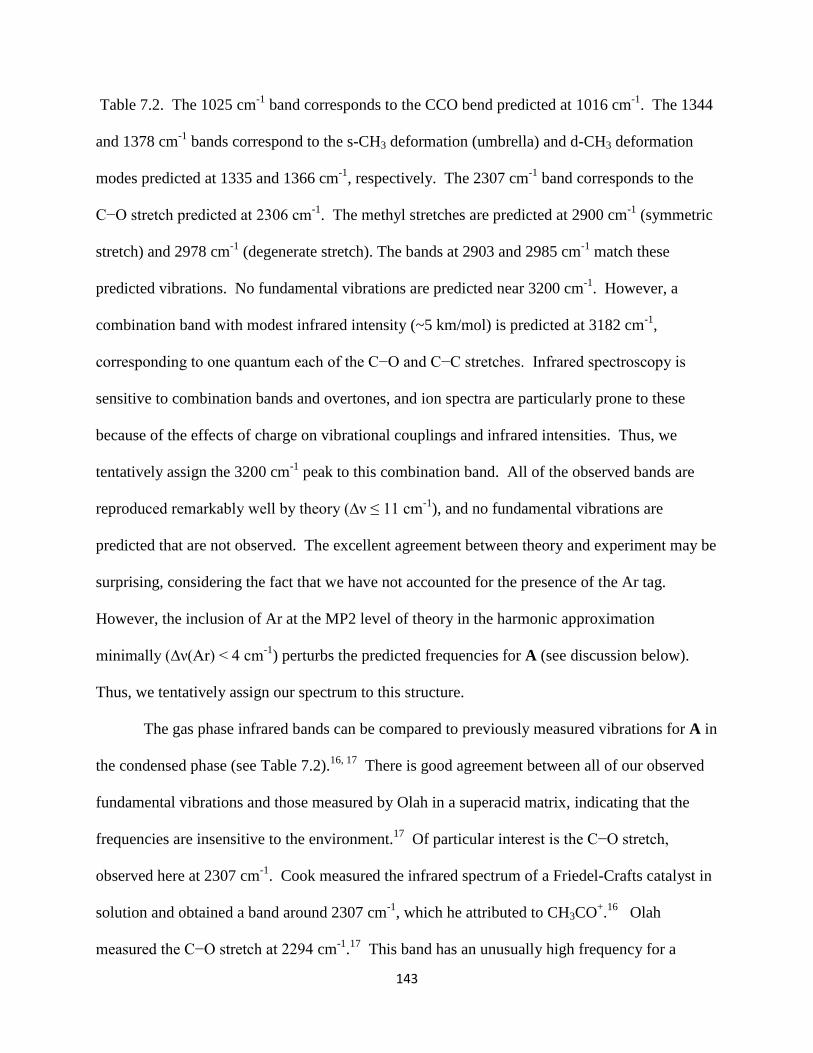
143
Table 7.2. The 1025 cm-1
band corresponds to the CCO bend predicted at 1016 cm-1
. The 1344
and 1378 cm-1
bands correspond to the s-CH3 deformation (umbrella) and d-CH3 deformation
modes predicted at 1335 and 1366 cm-1
, respectively. The 2307 cm-1
band corresponds to the
C−O stretch predicted at 2306 cm-1
. The methyl stretches are predicted at 2900 cm-1
(symmetric
stretch) and 2978 cm-1
(degenerate stretch). The bands at 2903 and 2985 cm-1
match these
predicted vibrations. No fundamental vibrations are predicted near 3200 cm-1
. However, a
combination band with modest infrared intensity (~5 km/mol) is predicted at 3182 cm-1
,
corresponding to one quantum each of the C−O and C−C stretches. Infrared spectroscopy is
sensitive to combination bands and overtones, and ion spectra are particularly prone to these
because of the effects of charge on vibrational couplings and infrared intensities. Thus, we
tentatively assign the 3200 cm-1
peak to this combination band. All of the observed bands are
reproduced remarkably well by theory (∆ν ≤ 11 cm-1
), and no fundamental vibrations are
predicted that are not observed. The excellent agreement between theory and experiment may be
surprising, considering the fact that we have not accounted for the presence of the Ar tag.
However, the inclusion of Ar at the MP2 level of theory in the harmonic approximation
minimally (∆ν(Ar) < 4 cm-1
) perturbs the predicted frequencies for A (see discussion below).
Thus, we tentatively assign our spectrum to this structure.
The gas phase infrared bands can be compared to previously measured vibrations for A in
the condensed phase (see Table 7.2).16, 17
There is good agreement between all of our observed
fundamental vibrations and those measured by Olah in a superacid matrix, indicating that the
frequencies are insensitive to the environment.17
Of particular interest is the C−O stretch,
observed here at 2307 cm-1
. Cook measured the infrared spectrum of a Friedel-Crafts catalyst in
solution and obtained a band around 2307 cm-1
, which he attributed to CH3CO+.16
Olah
measured the C−O stretch at 2294 cm-1
.17
This band has an unusually high frequency for a

144
Table 7.2. Infrared bands (in cm-1
) assigned to two isomers of [C2,H3,O]+. Predicted
fundamental frequencies (in cm-1
) are given for the bare cation structures at the CCSD(T) level
of theory. Predicted (scaled) frequencies (in cm-1) are given for the Ar complex at the MP2
level of theory. Infrared intensities are given in km/mol.
Exp. CCSD(T) (Int)a MP2 (Int)
b Previous Work
c Assignment
e
Acetyl
1025 1017 (40.0) 1037 (46.0) 1022 CH3 rock
1344 1335 (25.5) 1374 (29.8) 1344 s-CH3 deform
1378 1367 (38.9) 1425 (44.4) 1379 d-CH3 deform
2307 2306 (128.6) 2281 (80.2) 2294,~2307d CO stretch
2903 2901 (67.2) 2925 (76.6) 2924 CH3 symm stretch
2985 2978 (102.3) 3029 (114.3) 3030 CH3 asymm stretch
3200 3182 (5.3) CO stretch + CC stretch
Protonated Ketene
2049 2043 (256.5) 2041 (367.6) CO stretch
2727 −− Combination band
2982 2978 (170.1) 3001 (673.7) CH2 symm stretch
3045 3365 (404.0) 3053 (1467.7) OH stretch aanharmonic corrections are obtained at the CCSD(T)/ANO1 level combined with second order
vibrational perturbation theory (VPT2). b
harmonic frequencies are scaled by 0.956 (high
frequency scaling factor) and 0.996 (low frequency scaling factor), obtained from Ref31
. cfrom
Ref21
, unless otherwise noted. dfrom Ref
20.esymm=symmetric, asymm=anti-symmetric.

145
carbonyl stretch. For reference, the vibration of CO is at 2143 cm-1
.31
Ionization (CO+;
cm-1
)31
and protonation (HCO+; cm
-1)32
both induce a 41 cm-1
blue
shift in the carbonyl stretch relative to neutral CO. We observe a 164 cm-1
blue shift for
CH3CO+. Apparently, the effect observed here is significantly greater than that of protonation
and ionization. Nevertheless, the agreement with previous work confirms that the assignment of
our spectrum to A−Ar is unambiguous. Remarkably, it also appears to be the only structure
present when [C2,H3,O]+ is made from methyl acetate, given the lack of any other signal in our
spectrum.
A closer inspection of the C−H stretching region of the infrared spectrum reveals unusual
behavior in the observed linewidths of the bands at 2903 and 2985 cm-1
. Figure 7.4 (black trace,
top) reveals that the band at 2903 cm-1
has a linewidth of 24 cm-1
, and that of the 2985 cm-1
band
is 43 cm-1
, when measured at the full width-half maximum (FWHM). The different linewidths
are further investigated using pGOPHER.33
Two rovibrational bands are computed for a prolate
symmetric top, representing the two methyl stretches of A (C3v symmetry). The band origins
(B.O.) and infrared intensities for the simulation are obtained from theory at the CCSD(T) level
(see Table 7.2). The equilibrium ground state rotational constants of A, computed at the
CCSD(T)/cc-pVTZ level of theory, are 5.13 and 0.30 cm-1
for Ae and Ce, respectively. These
values are used as the upper and lower level constants in the simulation. Figure 7.4 presents the
rovibrational simulation (navy trace, middle) obtained at a 100 K rotational temperature and a
Lorentzian linewidth (ΓIR) of 1.2 cm-1
, corresponding to the linewidth of the infrared laser.
Clearly, more structure is evident in the predicted spectrum than is observed experimentally.
When the linewidth parameter is increased to 6 cm-1
without changing the rotational temperature,
a simulation is obtained that closely resembles the experimental spectrum, in terms of peak
linewidth (wine trace, bottom). This linewidth (ΓVP) presumably corresponds to homogeneous
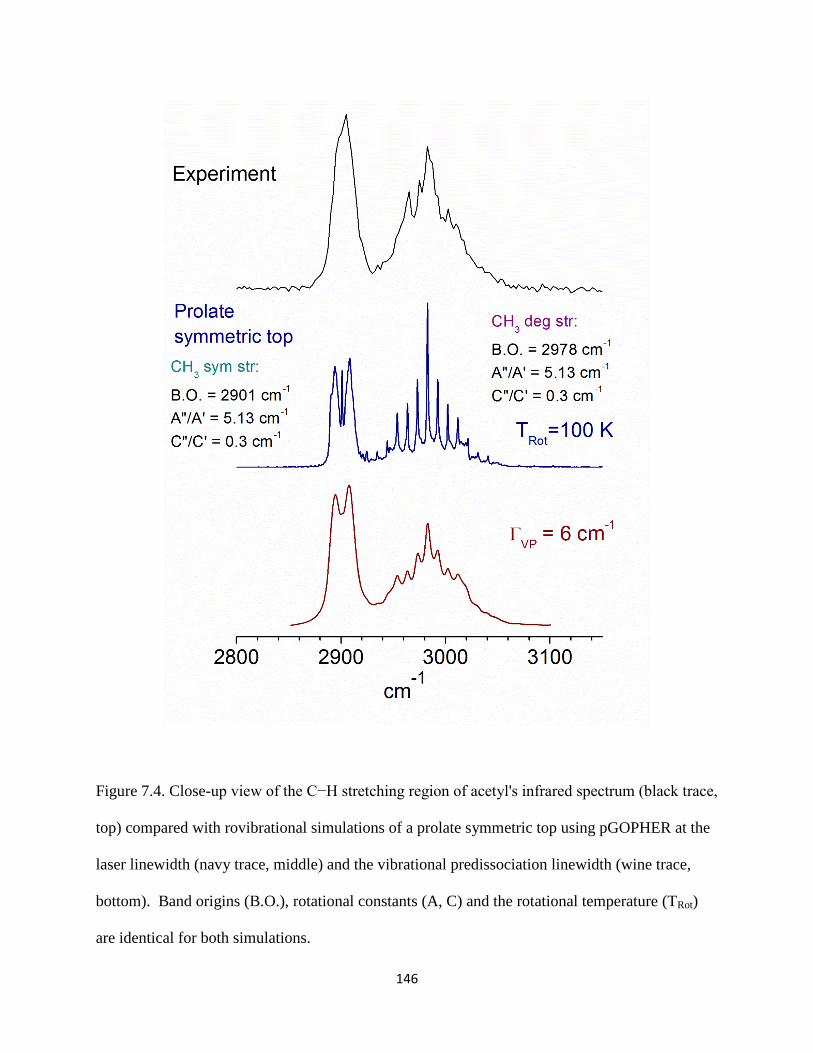
146
Figure 7.4. Close-up view of the C−H stretching region of acetyl's infrared spectrum (black trace,
top) compared with rovibrational simulations of a prolate symmetric top using pGOPHER at the
laser linewidth (navy trace, middle) and the vibrational predissociation linewidth (wine trace,
bottom). Band origins (B.O.), rotational constants (A, C) and the rotational temperature (TRot)
are identical for both simulations.

147
broadening due to the fast (picoseconds) vibrational predissociation lifetime present in the A−Ar
complex, and is what limits the resolution of our experiment. Due to the low resolution of the
experimental data, it is impossible to obtain a perfect contour fit. However, the simulation does
serve to reproduce the different linewidths observed for a parallel (25 cm-1
) versus perpendicular
(43 cm-1
) type bands of a prolate symmetric top at a rotational temperature of 100 K. We believe
this is a reasonable approximation to the rotational temperature. Indeed, varying the temperature
by ± 20 K changes the simulated linewidth of the perpendicular type transition at 2978 cm-1
by ±
18 cm-1
. The band at 2901 cm-1
is much less sensitive (±1 cm-1
) to similar changes, as is
expected for a parallel type transition. Thus, we estimate the temperature of A−Ar to be 100 K.
This value lies within the optimal temperature range of collisionally cooled ions observed in our
ion source.24, 34, 35
The rovibrational simulation suggests that the C3v structure and rotational constants of A
are preserved in the A−Ar complex, within the resolution of our experiment. Quantum chemical
calculations at the MP2 level of theory reveal the presence of multiple Ar isomers whose relative
energetics vary by only 2.3 kJ/mol (see Table 7.1). They are designated isomers 1, 2, and 3.
Isomers 1 and 2 correspond to Ar attachment sites above the central carbon with staggered (1)
and eclipsed (2) orientations of Ar with respect to the methyl group. These isomers are
essentially isoenergetic (∆E=+0.4 kJ/mol including ZPE effects). However, 2 is found to have a
small negative frequency (−43 cm-1
) and is thus not considered a stable minimum. Isomer 3
(∆E=+2.3 kJ/mol) corresponds to Ar binding on the principal axis in the methyl "pocket",
preserving the symmetry of the bare cation. For reference, the rotational energy of the complex
at a temperature of 100 K is 1.2 kJ/mol. Distinguishing between the different binding sites at the
resolution of our experiment is impossible. Based on past experience, it is likely that the lowest
energy Ar binding site is present, while dynamic sampling of other binding sites could possibly

148
occur as well. Nevertheless, the spectral analysis confirms that free methyl rotation occurs,
strengthening the conclusion that the Ar tag does not perturb the symmetry of acetyl.
Prompted by previous mass spectrometric studies,1-3, 11-15
we wanted to see what other
oxygen-containing precursors produce [C2,H3,O]+. Figure 7.5 presents the mass spectrum of
acetone generated in an expansion of 10% Ar / 90% He under optimal conditions in our ion
source. Many similar fragment peaks are seen compared to the mass spectrum from methyl
acetate (see Figure 7.1). CH3+ (m/z = 15) and C2H5
+/HCO
+ (m/z = 29) are present, as well as
[C3,H7,O]+ (m/z = 59). The higher relative intensity of the m/z = 59 peak in the mass spectrum
of acetone suggests the structure is that of protonated acetone, which has been studied before.36
As Figure 7.5 shows, Ar+ is generated in high abundance, with only a small amount of ArH
+, in
contrast to the large amount of ArH+ in the mass spectrum of methyl acetate in a similar
expansion. This observation suggests that different plasma chemistry occurs when using acetone
as a precursor. As seen in the previous mass spectrum, signal at larger mass to charge ratios
correspond to clusters of ions with neutral precursor molecules and argon, which are common in
our ion source. Acetone was found to produce the second most intense ion signal at m/z = 43 in
our mass spectrometer. Previous ion reactivity studies suggested that more than one structure for
[C2,H3,O]+ is formed when using acetone as a precursor.
12
To investigate this possibility, we measured a second infrared spectrum of [C2,H3,O]+
using acetone as a precursor. The spectrum is presented in Figure 7.6 from 2000-3400 cm-1
(black trace, second from top) compared to the spectrum of A obtained using methyl acetate as a
precursor (black trace, top). At first glance, we note that the new spectrum contains bands
similar to those already observed for A. These features at 2307, 2903, 2982 and 3200 cm-1
are
almost identical in appearance to those from the acetyl spectrum, with the exception of the 2903
and 2982 cm-1
bands. The linewidths appear sharper ( 15 and 13 cm-1
, respectively) than those

149
Figure 7.5. The mass spectrum of acetone produced by needle electrical discharge in an
expansion of 10% Ar/ 90% He.

150
Figure 7.6. Infrared spectra of [C2,H3,O]+Ar, obtained by loss of Ar with the ion produced from
methyl acetate (black trace, top) and acetone (black trace, second from top) versus fundamental
frequencies of acetyl cation (blue trace, third from top) and O−protonated ketene (red trace,
bottom), calculated at the CCSD(T)/ANO1 level of theory. Relative energies (in kJ/mol) are
corrected for zero-point vibrational energy effects.

151
of the corresponding bands at 2903 and 2985 cm-1
(see Figure 7.6, black trace, top), which is
likely due to a lower rotational temperature for A made from acetone. In fact, when the
rotational temperature in the pGOPHER simulation is reduced to 25 K, without changing any
other variables, the linewidths of the symmetric and degenerate methyl stretches reduce to 16
and 14 cm-1
, respectively (see Figure 7.7). Similar to before, varying the temperature by ± 5K
produces an average change of about 5 cm-1
in the linewidth of the 2978 cm-1
band. Apparently,
discharge conditions using acetone as a precursor result in colder ions than those using methyl
acetate.
As Figure 7.6 shows, new bands appear in the second spectrum at 2049, 2727 and 3045
cm-1
, which must be due to another structural isomer. For other isomers to survive on the
timescale of our experiment, there must be a barrier to interconversion on the PES. Therefore,
we investigated the PES using intrinsic reaction coordinate (IRC) calculations at the MP2/cc-
pVTZ level of theory. Three first-order saddle points were found by geometry optimization and
subsequent frequency analysis. Each saddle point structure, designated TS1, TS2 and TS3, has a
single negative frequency corresponding to the normal mode of vibration along a unique reaction
coordinate. IRC calculations confirm that these structures are transition states, linking structure
A with structures B, C and D, respectively. Of particular note are the IRC results which show a
large barrier to interconversion (+221 kJ/mol at the MP2 level) between B and A, as shown in
Figure 7.8. TS1 therefore corresponds to the transition state in a [1,3]-hydride shift reaction
between terminal atoms. Radom et al previously found a barrier between B and A which
corresponds to two consecutive [1,2]-hydride shifts through an intermediate.20
Their computed
barrier was ~65 kJ/mol higher than the direct shift computed here.20
Previous results from
similar experiments suggest that the current barrier is sufficiently high for observation of a more

152
Figure 7.7. Close-up view of the C−H stretching region of acetyl's infrared spectrum (black trace,
top) for the ion obtained from acetone, compared to a rovibrational simulation of a prolate
symmetric top using pGOPHER (wine trace, bottom) at a linewidth of 6 cm-1
and a rotational
temperature of 25 K. The linewidth is presumably due to vibrational predissociation (VP).
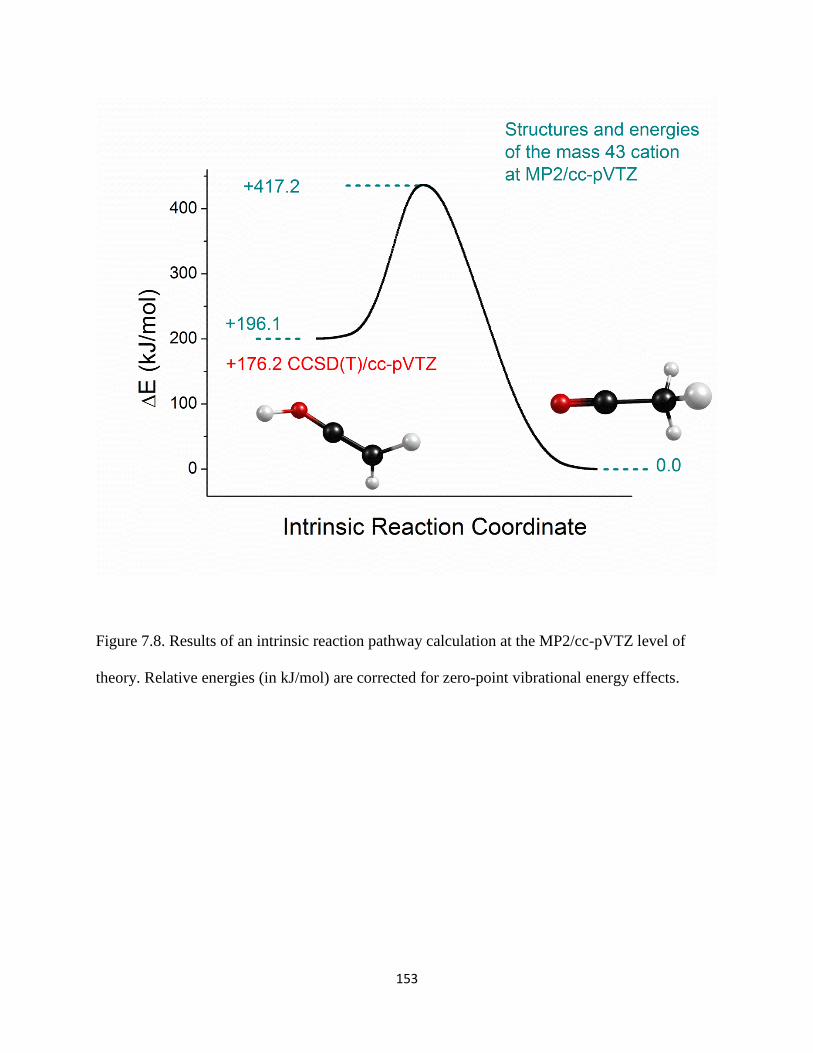
153
Figure 7.8. Results of an intrinsic reaction pathway calculation at the MP2/cc-pVTZ level of
theory. Relative energies (in kJ/mol) are corrected for zero-point vibrational energy effects.

154
energetic isomer.24, 35
Indeed, when frequencies predicted at the MP2/cc-pVTZ level for
isomers B-F are compared to the spectrum obtained from acetone, only isomer B matches the
new bands.
To assign the bands at 2049, 2727 and 3045 cm-1
, we first computed the frequencies of B
without Ar at the CCSD(T)ANO1 level for comparison to the infrared spectrum. The results are
presented in Table 7.2 and in Figure 7.6. We see good agreement between the band at 2049 cm-1
and the predicted C−O stretch at 2043 cm-1
. No fundamental frequency is predicted in the
vicinity of the 2727 cm-1
band. The symmetric methylene stretch, predicted at 2978 cm-1
,
overlaps exactly with A's degenerate methyl stretch, predicted at 2978 cm-1
and observed at 2982
cm-1
in the second spectrum. The anti-symmetric methylene stretch is predicted at 3062 cm-1
,
which coincides with the shoulder of the 3045 cm-1
band. The O−H stretch is predicted at 3365
cm-1
, where no signal is observed. Clearly, this indicates that the high level of theory without Ar
cannot be used to definitively assign these new bands.
To investigate the spectral assignment further, we performed theory for B−Ar at the
MP2/cc-pVTZ level of theory to compare to our spectrum. Predicted frequencies are presented
in Table 7.2 and Figure 7.9 (bottom trace, wine). These values have been scaled by 0.956 to
account for vibrational anharmonicity.28
Four vibrations are predicted in the 2000-3400 cm-1
range. The 2049 cm-1
band corresponds to the C−O stretch of protonated ketene, predicted at
2041 cm-1
(2043 cm-1
at the CCSD(T) level for B without Ar). No fundamental vibration is
predicted in the vicinity of the 2727 cm-1
band for CH2COH+Ar, and no other isomers have
fundamental vibrations predicted in this region. The symmetric methylene stretch is predicted at
3001 cm-1
, and overlaps significantly with A's degenerate methyl stretch at 2982 cm-1
. The 3045
cm-1
band corresponds to the O−H stretch, predicted at 3053 cm-1
. The inclusion of Ar at the
MP2 level shifts the OH stretching vibration to 3053 cm-1
( Δν(Ar) = −326 cm-1
). A 308 cm-1
red

155
Figure 7.9. Infrared spectra of [C2,H3,O]+Ar obtained by loss of Ar with the ion produced from
methyl acetate (black trace, top) and acetone (black trace, second from top). versus (scaled)
predicted frequencies of acetyl cation−Ar (blue trace, third from top) and O−protonated
ketene−Ar (red trace, bottom), calculated at the MP2/cc-pVTZ level of theory. Relative energies
(in kJ/mol) are corrected for zero-point vibrational energy effects.
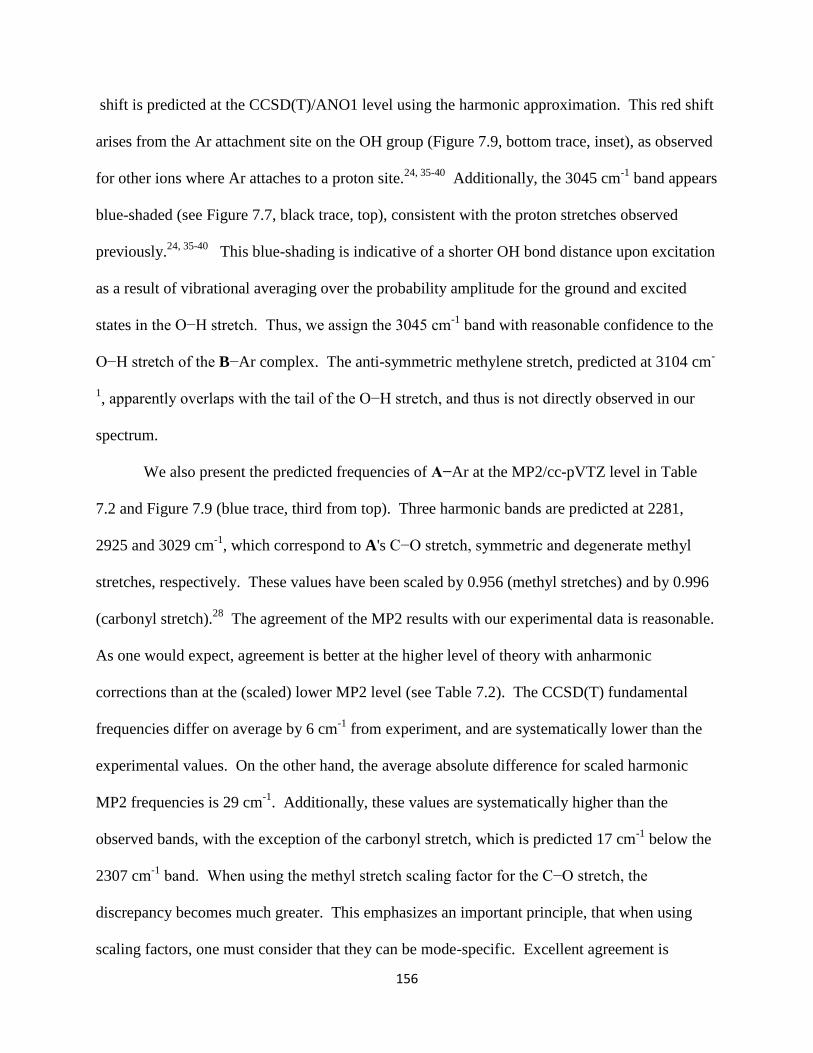
156
shift is predicted at the CCSD(T)/ANO1 level using the harmonic approximation. This red shift
arises from the Ar attachment site on the OH group (Figure 7.9, bottom trace, inset), as observed
for other ions where Ar attaches to a proton site.24, 35-40
Additionally, the 3045 cm-1
band appears
blue-shaded (see Figure 7.7, black trace, top), consistent with the proton stretches observed
previously.24, 35-40
This blue-shading is indicative of a shorter OH bond distance upon excitation
as a result of vibrational averaging over the probability amplitude for the ground and excited
states in the O−H stretch. Thus, we assign the 3045 cm-1
band with reasonable confidence to the
O−H stretch of the B−Ar complex. The anti-symmetric methylene stretch, predicted at 3104 cm-
1, apparently overlaps with the tail of the O−H stretch, and thus is not directly observed in our
spectrum.
We also present the predicted frequencies of A−Ar at the MP2/cc-pVTZ level in Table
7.2 and Figure 7.9 (blue trace, third from top). Three harmonic bands are predicted at 2281,
2925 and 3029 cm-1
, which correspond to A's C−O stretch, symmetric and degenerate methyl
stretches, respectively. These values have been scaled by 0.956 (methyl stretches) and by 0.996
(carbonyl stretch).28
The agreement of the MP2 results with our experimental data is reasonable.
As one would expect, agreement is better at the higher level of theory with anharmonic
corrections than at the (scaled) lower MP2 level (see Table 7.2). The CCSD(T) fundamental
frequencies differ on average by 6 cm-1
from experiment, and are systematically lower than the
experimental values. On the other hand, the average absolute difference for scaled harmonic
MP2 frequencies is 29 cm-1
. Additionally, these values are systematically higher than the
observed bands, with the exception of the carbonyl stretch, which is predicted 17 cm-1
below the
2307 cm-1
band. When using the methyl stretch scaling factor for the C−O stretch, the
discrepancy becomes much greater. This emphasizes an important principle, that when using
scaling factors, one must consider that they can be mode-specific. Excellent agreement is
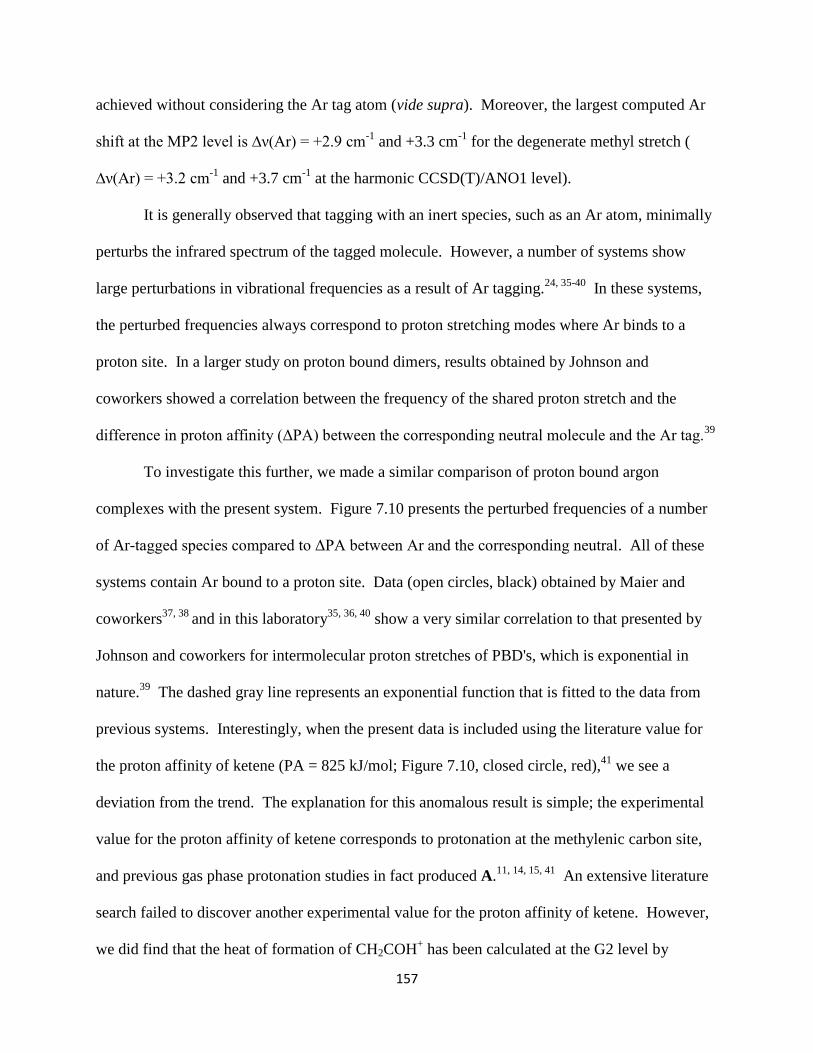
157
achieved without considering the Ar tag atom (vide supra). Moreover, the largest computed Ar
shift at the MP2 level is ∆ν(Ar) = +2.9 cm-1
and +3.3 cm-1
for the degenerate methyl stretch (
∆ν(Ar) = +3.2 cm-1
and +3.7 cm-1
at the harmonic CCSD(T)/ANO1 level).
It is generally observed that tagging with an inert species, such as an Ar atom, minimally
perturbs the infrared spectrum of the tagged molecule. However, a number of systems show
large perturbations in vibrational frequencies as a result of Ar tagging.24, 35-40
In these systems,
the perturbed frequencies always correspond to proton stretching modes where Ar binds to a
proton site. In a larger study on proton bound dimers, results obtained by Johnson and
coworkers showed a correlation between the frequency of the shared proton stretch and the
difference in proton affinity (ΔPA) between the corresponding neutral molecule and the Ar tag.39
To investigate this further, we made a similar comparison of proton bound argon
complexes with the present system. Figure 7.10 presents the perturbed frequencies of a number
of Ar-tagged species compared to ΔPA between Ar and the corresponding neutral. All of these
systems contain Ar bound to a proton site. Data (open circles, black) obtained by Maier and
coworkers37, 38
and in this laboratory35, 36, 40
show a very similar correlation to that presented by
Johnson and coworkers for intermolecular proton stretches of PBD's, which is exponential in
nature.39
The dashed gray line represents an exponential function that is fitted to the data from
previous systems. Interestingly, when the present data is included using the literature value for
the proton affinity of ketene (PA = 825 kJ/mol; Figure 7.10, closed circle, red),41
we see a
deviation from the trend. The explanation for this anomalous result is simple; the experimental
value for the proton affinity of ketene corresponds to protonation at the methylenic carbon site,
and previous gas phase protonation studies in fact produced A.11, 14, 15, 41
An extensive literature
search failed to discover another experimental value for the proton affinity of ketene. However,
we did find that the heat of formation of CH2COH+ has been calculated at the G2 level by

158
Figure 7.10. The difference in proton affinity (∆PA, in kJ/mol) between Ar and the
corresponding neutral molecule plotted against the perturbed frequency (in cm-1
) for proton
bound argon complexes studied previously (open circles, black) and in the current work (closed
circles, colored). The dashed gray line represents an exponential fit to the data. The colored dots
correspond to proton affinities of ketene for different protonation sites.
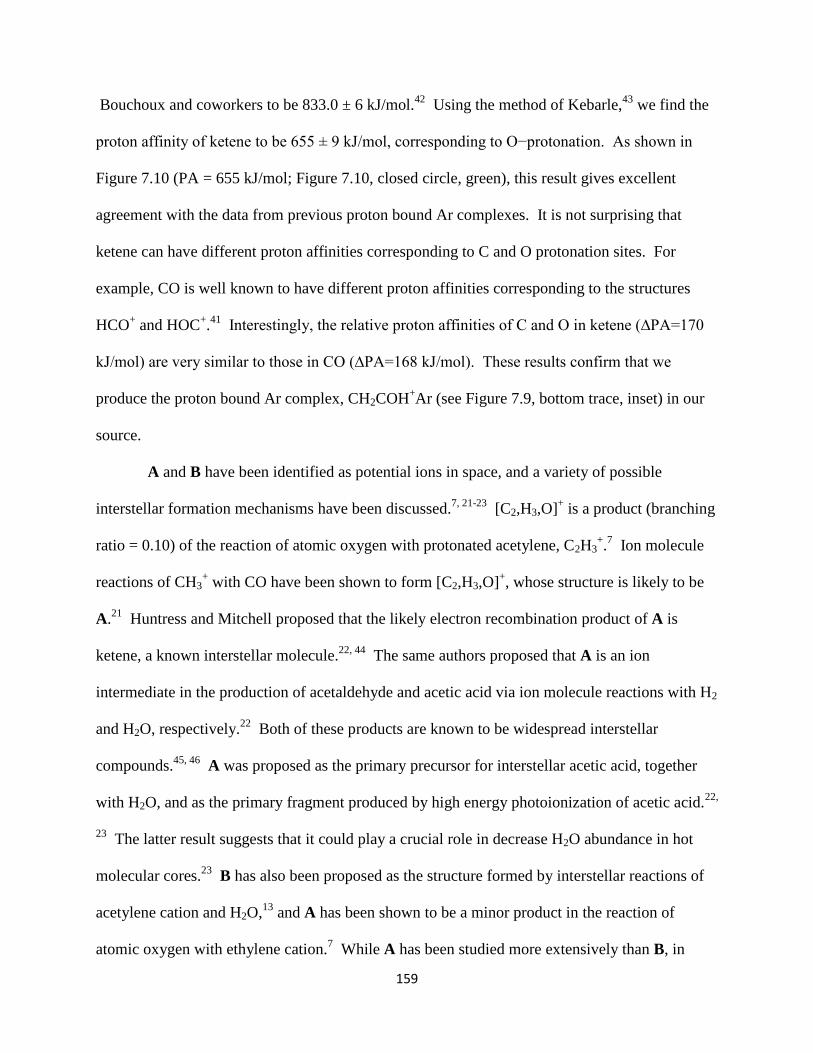
159
Bouchoux and coworkers to be 833.0 ± 6 kJ/mol.42
Using the method of Kebarle,43
we find the
proton affinity of ketene to be 655 ± 9 kJ/mol, corresponding to O−protonation. As shown in
Figure 7.10 (PA = 655 kJ/mol; Figure 7.10, closed circle, green), this result gives excellent
agreement with the data from previous proton bound Ar complexes. It is not surprising that
ketene can have different proton affinities corresponding to C and O protonation sites. For
example, CO is well known to have different proton affinities corresponding to the structures
HCO+ and HOC
+.41
Interestingly, the relative proton affinities of C and O in ketene (∆PA=170
kJ/mol) are very similar to those in CO (∆PA=168 kJ/mol). These results confirm that we
produce the proton bound Ar complex, CH2COH+Ar (see Figure 7.9, bottom trace, inset) in our
source.
A and B have been identified as potential ions in space, and a variety of possible
interstellar formation mechanisms have been discussed.7, 21-23
[C2,H3,O]+ is a product (branching
ratio = 0.10) of the reaction of atomic oxygen with protonated acetylene, C2H3+.7 Ion molecule
reactions of CH3+ with CO have been shown to form [C2,H3,O]
+, whose structure is likely to be
A.21
Huntress and Mitchell proposed that the likely electron recombination product of A is
ketene, a known interstellar molecule.22, 44
The same authors proposed that A is an ion
intermediate in the production of acetaldehyde and acetic acid via ion molecule reactions with H2
and H2O, respectively.22
Both of these products are known to be widespread interstellar
compounds.45, 46
A was proposed as the primary precursor for interstellar acetic acid, together
with H2O, and as the primary fragment produced by high energy photoionization of acetic acid.22,
23 The latter result suggests that it could play a crucial role in decrease H2O abundance in hot
molecular cores.23
B has also been proposed as the structure formed by interstellar reactions of
acetylene cation and H2O,13
and A has been shown to be a minor product in the reaction of
atomic oxygen with ethylene cation.7 While A has been studied more extensively than B, in
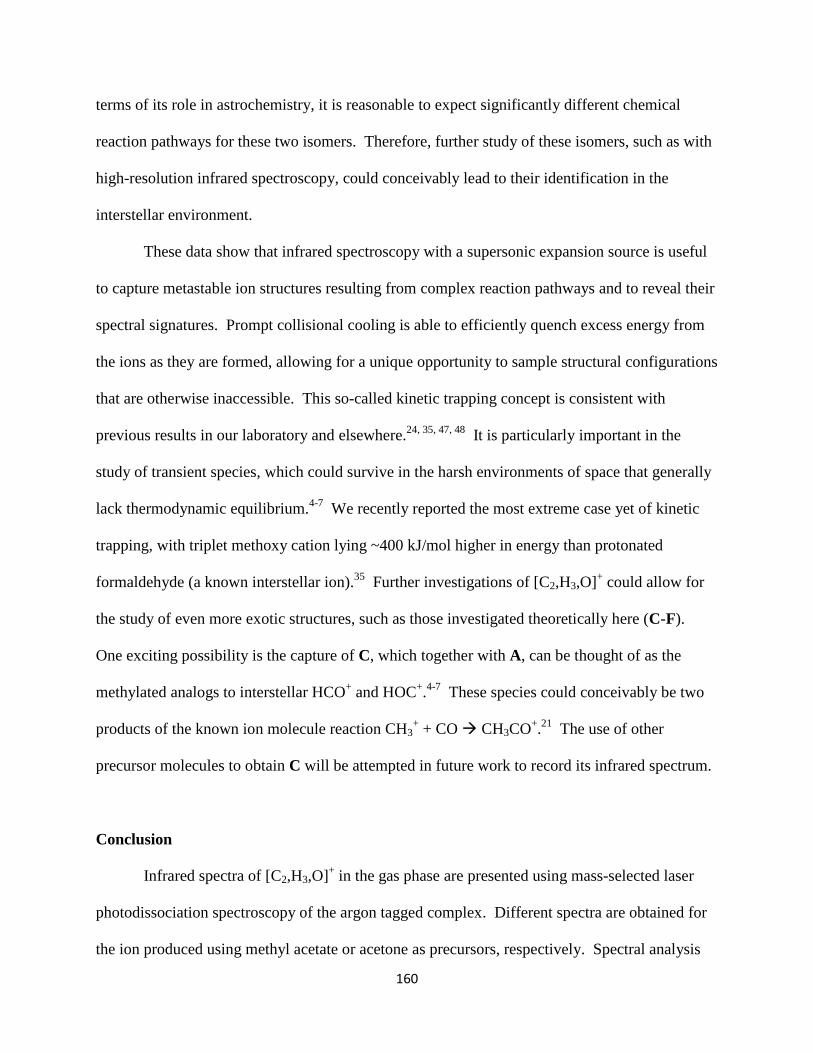
160
terms of its role in astrochemistry, it is reasonable to expect significantly different chemical
reaction pathways for these two isomers. Therefore, further study of these isomers, such as with
high-resolution infrared spectroscopy, could conceivably lead to their identification in the
interstellar environment.
These data show that infrared spectroscopy with a supersonic expansion source is useful
to capture metastable ion structures resulting from complex reaction pathways and to reveal their
spectral signatures. Prompt collisional cooling is able to efficiently quench excess energy from
the ions as they are formed, allowing for a unique opportunity to sample structural configurations
that are otherwise inaccessible. This so-called kinetic trapping concept is consistent with
previous results in our laboratory and elsewhere.24, 35, 47, 48
It is particularly important in the
study of transient species, which could survive in the harsh environments of space that generally
lack thermodynamic equilibrium.4-7
We recently reported the most extreme case yet of kinetic
trapping, with triplet methoxy cation lying ~400 kJ/mol higher in energy than protonated
formaldehyde (a known interstellar ion).35
Further investigations of [C2,H3,O]+ could allow for
the study of even more exotic structures, such as those investigated theoretically here (C-F).
One exciting possibility is the capture of C, which together with A, can be thought of as the
methylated analogs to interstellar HCO+ and HOC
+.4-7
These species could conceivably be two
products of the known ion molecule reaction CH3+ + CO CH3CO
+.21
The use of other
precursor molecules to obtain C will be attempted in future work to record its infrared spectrum.
Conclusion
Infrared spectra of [C2,H3,O]+ in the gas phase are presented using mass-selected laser
photodissociation spectroscopy of the argon tagged complex. Different spectra are obtained for
the ion produced using methyl acetate or acetone as precursors, respectively. Spectral analysis
161
reveals that a single structure, that of A, is produced for the ion made from methyl acetate,
whereas both A and B are produced for the ion made from acetone. An extensive study of the
PES confirms that A is the global minimum structure, and that B lies 173 kJ/mol higher in
energy. IRC results show that a large barrier to interconversion exists between B and A, and a
direct [1,3]-hydride shift reaction mechanism connects the two structures. A−Ar's spectral
signature is found to be identical to that of the bare (untagged) cation, whereas B−Ar is a PBD
whose proton stretches are significantly red-shifted from those of the B monomer. The relevance
of A and B to astrochemistry is discussed. Rapid collisional cooling in the present experiment
allows these species to be captured and studied. Ion production in our pulsed
discharge/supersonic expansion source provides a convenient method with which to produce
metastable ion structures and to document their infrared spectra.

162
References
(1) Bowers, M. T., Gas Phase Ion Chemistry. Academic Press: New York, 1984; Vol. I-III.
(2) Baer, T.; Ng, C.; Powis, I., The Structure, Energetics, and Dynamics of Organic Ions.
Wiley: New York, 1996.
(3) Holmes, J. L.; Aubrey, C.; Mayer, P. M., Assigning Structures to Ions in Mass
Spectrometry. CRC Press: Boca Raton, FL, 2007.
(4) Hartquist, T. W.; Williams, D. A., eds., The Molecular Astrophysics of Stars and
Galaxies. Clarendon Press: Oxford, 1998.
(5) Tielens, A. G. G. M., The Physics and Chemistry of the Interstellar Medium. Cambridge
University Press: Cambridge, U.K., 2005.
(6) Petrie, S.; Bohme, D. K., Ions in space. Mass Spectrom. Rev. 2007, 26 (2), 258-280.
(7) Snow, T. P.; Bierbaum, V. M., Ion chemistry in the interstellar medium. Annu. Rev. Anal.
Chem. 2008, 1 (1), 229-259.
(8) Boo, D. W.; Lee, Y. T., Infrared-spectra of CH5+ core in CH5
+ (H2). Chem. Phys. Lett.
1993, 211 (4-5), 358-363.
(9) Bieske, E. J.; Dopfer, O., High-resolution spectroscopy of cluster ions. Chem. Rev. 2000,
100, 3963-3998.
(10) Duncan, M. A., Frontiers in the spectroscopy of mass-selected molecular ions. Int. J.
Mass Spectrom. 2000, 200, 545-569.
(11) Vogt, J.; Williamson, A. D.; Beauchamp, J. L., Properties and reactions of ketene in the
gas phase by ion cyclotron resonance spectroscopy and photoionization mass
spectrometry. Proton affinity, site specificity of protonation, and heat of formation of
ketene. J. Am. Chem. Soc. 1978, 100 (11), 3478-3483.

163
(12) Eberlin, M. N.; Majumdar, T. K.; Cooks, R. G., Structures and mechanisms of reactions
of isomeric C2H3O+ and C2H3S
+ ions revealed through ion/molecule reactions in
conjunction with 2D and 3D mass spectrometry. J. Am. Chem. Soc. 1992, 114 (8), 2884-
2896.
(13) Momoh, P. O.; Xie, E.; Abrash, S. A.; Meot-Ner, M.; El-Shall, M. S., Gas phase
reactions between acetylene radical cation and water. Energies, structures and formation
mechanism of C2H3O+ and C2H4O
+ ions. J. Phys. Chem. A 2008, 112 (27), 6066-6073.
(14) Fogleman, E. A.; Koizumi, H.; Kercher, J. P.; Sztáray, B.; Baer, T., Heats of formation of
the acetyl radical and ion obtained by threshold photoelectron photoion coincidence. J.
Phys. Chem. A 2004, 108 (24), 5288-5294.
(15) Shuman, N. S.; Stevens, W. R.; Baer, T., Dissociation dynamics of energy-selected acetic
acid ions: The gas phase heat of formation of the acetyl ion. Intl. J. Mass Spectrom. 2010,
294 (2–3), 88-92.
(16) Cook, D., The interaction of Friedel-Crafts catalysts with organic molecules .1. The
CH3COCl-AlCl3 system. Can. J. Chem. 1959, 37 (1), 48-53.
(17) Olah, G. A.; Kuhn, S. J.; Tolgyesi, W. S.; Baker, E. B., Stable Carbonium Ions. II.
Oxocarbonium (acylium) tetrafluoroborates, hexafluorophosphates,
hexafluoroantimonates and hexafluoroarsenates. Structure and chemical reactivity of acyl
fluoride: Lewis acid fluoride complexes. J. Am. Chem. Soc. 1962, 84 (14), 2733-2740.
(18) Boer, F. P., Crystal structure of a Friedel-Crafts intermediate. Methyloxocarbonium
hexafluoroantimonate. J. Am. Chem. Soc. 1968, 90 (24), 6706-6710.
(19) Yarkony, D. R.; Schaefer III, H. F., The acetyl cation and its geometrical isomers. J.
Chem. Phys. 1975, 63 (10), 4317-4328.
164
(20) Nobes, R. H.; Bouma, W. J.; Radom, L., Structures and stabilities of gas-phase C2H3O+
ions: An ab initio molecular orbital study. J. Am. Chem. Soc. 1983, 105 (3), 309-314.
(21) Smith, D.; Adams, N. G., Molecular synthesis in inter-stellar clouds - radiative
association reactions of CH3+ ions. Astrophys. J. 1978, 220 (3), L87-L92.
(22) Huntress, W. T.; Mitchell, G. F., Synthesis of complex-molecules in inter-stellar clouds.
Astrophys. J. 1979, 231 (2), 456-467.
(23) Pilling, S.; Santos, A. C. F.; Boechat-Roberty, H. M., Photodissociation of organic
molecules in star-forming regions - II. Acetic acid. Astron. Astrophys. 2006, 449 (3),
1289-1296.
(24) Duncan, M. A., Infrared laser spectroscopy of mass-selected carbocations. J. Phys. Chem.
A 2012, 116 (47), 11477-11491.
(25) McCaslin, L.; Stanton, J., Calculation of fundamental frequencies for small polyatomic
molecules: A comparison between correlation consistent and atomic natural orbital basis
sets. Mol. Phys. 2013, 111 (9-11), 1492-1496.
(26) Mills, I. M., In Molecular Spectroscopy: Modern Research, Rao, K. N.; Mathews, C. W.,
Eds. Academic Press: New York, 1972; Vol. 1.
(27) Clabo, D. A.; Allen, W. D.; Remington, R. B.; Yamaguchi, Y.; Schaefer, H. F., A
systematic study of molecular vibrational anharmonicity and vibration-rotation
interaction by self-consistent-field higher-derivative methods - asymmetric-top
molecules. Chem. Phys. 1988, 123 (2), 187-239.
(28) Merrick, J. P.; Moran, D.; Radom, L., An evaluation of harmonic vibrational frequency
scale factors. J. Phys. Chem. A 2007, 111 (45), 11683-11700.
(29) Schmidt, M. W.; Baldridge, K. K.; Boatz, J. A.; Elbert, S. T.; Gordon, M. S.; Jensen, J.
H.; Koseki, S.; Matsunaga, N.; Nguyen, K. A.; Su, S.; Windus, T. L.; Dupuis, M.;

165
Montgomery, J. A., General atomic and molecular electronic structure system. J. Comput.
Chem. 1993, 14 (11), 1347-1363.
(30) CFOUR, a quantum chemical program package written by J. F. Stanton, J. Gauss, M. E.
Harding, and P. G. Szalay with contributions from A. A. Auer, R. J. Bartlett, U. Benedikt,
C. Berger, D. E. Bernholdt, Y. J. Bomble, L. Cheng, O. Christiansen, M. Heckert, O.
Heun, C. Huber, T.-C. Jagau, D. Jonsson, J. Jusélius, K. Klein, W. J. Lauderdale, D. A.
Matthews, T. Metzroth, L. A. Mück, D. P. O'Neill, D. R. Price, E. Prochnow, C.
Puzzarini, K. Ruud, F. Schiffmann, W. Schwalbach, S. Stopkowicz, A. Tajti, J. Vázquez,
F. Wang, J. D. Watts and the integral packages MOLECULE (J. Almlöf and P. R.
Taylor), PROPS (P. R. Taylor), ABACUS (T. Helgaker, H. J. Aa. Jensen, P. Jørgensen,
and J. Olsen), and ECP routines by A. V. Mitin and C. van Wüllen. For the current
version, see http://www.cfour.de.
(31) Huber, K. P.; Herzberg, G., Constants of Diatomic Molecules. Van Nostrand-Reinhold:
New York, 1979.
(32) Foster, S. C.; McKellar, A. R. W.; Sears, T. J., Observation of the ν3 fundamental band of
HCO+. J. Chem. Phys. 1984, 81 (1), 578-579.
(33) Western, C. M. PGOPHER, a Program for Simulating Rotational Structure, University
of Bristol: 13 Sep 2010.
(34) Duncan, M. A., Spectroscopy of metal ion complexes: Gas phase models for solvation.
Ann. Rev. Phys. Chem. 1997, 48.
(35) Mosley, J. D.; Cheng, T. C.; McCoy, A. B.; Duncan, M. A., Infrared spectroscopy of the
mass 31 cation: Protonated formaldehyde vs methoxy. J. Phys. Chem. A 2012, 116 (37),
9287-9294.
166
(36) Douberly, G. E.; Ricks, A. M.; Ticknor, B. W.; McKee, W. C.; Schleyer, P. V. R.;
Duncan, M. A., Infrared photodissociation spectroscopy of protonated acetylene and its
clusters. J. Phys. Chem. A 2008, 112 (9), 1897-1906.
(37) Nizkorodov, S. A.; Dopfer, O.; Ruchti, T.; Meuwly, M.; Maier, J. P.; Bieske, E. J., Size
effects in cluster infrared spectra: The ν1 band of Arn-HCO+ (n = 1-13). J. Phys. Chem.
1995, 99 (47), 17118-17129.
(38) Dopfer, O.; Olkhov, R. V.; Roth, D.; Maier, J. P., Intermolecular interaction in proton-
bound dimers.: Infrared photodissociation spectra of RG–HOCO+ (RG=He, Ne, Ar)
complexes. Chem. Phys. Lett. 1998, 296 (5–6), 585-591.
(39) Roscioli, J. R.; McCunn, L. R.; Johnson, M. A., Quantum structure of the intermolecular
proton bond. Science 2007, 316 (5822), 249-254.
(40) Douberly, G. E.; Ricks, A. M.; Ticknor, B. W.; Duncan, M. A., Structure of protonated
carbon dioxide clusters: Infrared photodissociation spectroscopy and ab initio
calculations. J. Phys. Chem. A 2008, 112 (5), 950-959.
(41) Hunter, E. P. L.; Lias, S. G., Evaluated gas phase basicities and proton affinities of
molecules: An update. J. Phys. Chem. Ref. Data 1998, 27 (3), 413-656.
(42) Bouchoux, G.; Penaud-Berruyer, F.; Bertrand, W., Structure, thermochemistry and
reactivity of protonated glycolaldehyde. Eur. J. Mass Spectrom. 2001, 7 (4-5), 351-357.
(43) Davidson, W. R.; Lau, Y. K.; Kebarle, P., Gas phase dissociation of protonated acetic
acid to the acyl cation and water. Heat of formation of CH3CO+ and proton affinity of
ketene. Can. J. Chem. 1978, 56 (7), 1016-1019.
(44) Turner, B. E., Microwave detection of interstellar ketene. Astrophys. J. 1977, 213 (2),
L75-L79.
167
(45) David, M. M.; Lewis, E. S.; Yanti, M.; Frank, J. L., Detection and confirmation of
interstellar acetic acid. Astrophys. J. Lett. 1997, 480 (1), L71.
(46) Chengalur, J. N.; Kanekar, N., Widespread acetaldehyde near the galactic centre. Astron.
Astrophys. 2003, 403 (3), L43-L46.
(47) Dopfer, O.; Roth, D.; Maier, J. P., Infrared spectra of C3H3+-N2 dimers: Identification of
proton-bound c-C3H3+-N2 and H2CCCH
+-N2 isomers. J. Am. Chem. Soc. 2002, 124 (3),
494-502.
(48) Lorenz, U. J.; Solcà, N.; Lemaire, J.; Maître, P.; Dopfer, O., Infrared spectra of isolated
protonated polycyclic aromatic hydrocarbons: Protonated naphthalene. Angew. Chem. Int.
Ed. 2007, 46 (35), 6714-6716.

168
CHAPTER 8
CONCLUSION
The structures of ions are important in mass spectrometry and astrochemistry. Multiple
isomers are often present in ionic systems, and the actual structures formed depend on the
energetics of the ion production methods, the precursor used to generate the ion, the inherent
stability of the binding configurations, and their local environment. Infrared spectroscopy with a
supersonic expansion source is useful to capture metastable ion structures resulting from complex
reaction pathways and to reveal their spectral signatures. The rapid excitation followed by highly
efficient collisional cooling provides a unique opportunity to sample structural configurations that are
otherwise inaccessible.
In chapter 3, we studied the C7H11+ carbocation system with this technique. The ion was
produced with protonation of norbornene, a method that was used previously to generate the 2-norbornyl
cation (2-NB) in the gas phase. Spectral analysis showed that the structure produced in our source was in
fact not 2-NB. Computational chemistry was used to assign the spectrum to the global minimum
structure, that of the 1,3-dimethylcyclopentenyl cation (DMCP). Apparently, the protonating agent used
produced a highly excited ion, which undergoes rapid rearrangement to a much more stable configuration.
Indeed, DMCP contains the carbocation stabilizing allyl resonance in a five-membered ring with
optimally placed methyl groups. This study reveals completely unanticipated complex reaction pathways
connecting these structures, some of which are starting to be investigated. Future studies of this ion will
use softer production methods to attempt to isolate the authentic 2-NB.
We investigated the structure of C7H9+, made from norbornene in our source. This ion was
studied previously, and is known to exist as the global minimum structure, para-protonated toluene. The
infrared spectrum shows the spectral signature of protonated toluene in addition to new bands from

169
another structural isomer. Predictions from theory showed that we had obtained a new structure, that of
1,3-dimethylcyclopentadienyl. This structure is very similar to that of DMCP, and the formation
mechanisms remain unknown for this metastable species.
Switching to oxygen-containing ions, we studied the ubiquitious mass 31 cation of the form
[C,H3,O]+. This ion is widely recognized to have two structural forms, those of protonated formaldehyde
and the metastable methoxy cation. The latter species has eluded previous characterization attempts, and
rapid rearrangements were postulated to explain this behavior. When we made the ion from ethanol in
our source, we observed multiple bands in the infrared spectrum. Comparison to theory showed that
spectral features could be assigned to both species. Upon switching precursors and discharge conditions,
the spectra revealed that the relative amounts of the two structures could be varied and that methoxy was
present in roughly one tenth the abundance of protonated formaldehyde. Methoxy, which has a triplet
ground state and lies behind a substantial barrier to curve crossing to the singlet protonated formaldehyde
surface, is the most extreme case yet of metastable ion trapping in our source.
We also investigated the [C,H2,O]+ and [C,H4,O]
+ systems, which are analogous to the neutral
molecules formaldehyde and methanol. These compounds are some of the most abundant polyatomic
molecules in space, yet their cationic forms have not yet been characterized with infrared spectroscopy.
There are two known structures for [C,H2,O]+, those of the formaldehyde (H2CO) radical cation and the
hydroxymethylene (HCOH) cation. The infrared spectrum of [C,H2,O]+ in the C−H and O−H stretching
region contains more bands than can be assigned to one isomer. Unfortunately, there is strong
disagreement between theory and experiment for the infrared bands of this system. Further experimental
and/or theoretical analyses to definitively assign the spectrum are discussed. The [C,H4,O]+ system also
has two known structures, that of the conventional methanol (CH3OH) cation and its distonic isomer, the
methyleneoxonium (CH2OH2) ion. It is not generally appreciated that the more stable species is
CH2OH2+, which is stabilized by separating the radical character and excess charge within the molecule.
When the ion is made from methanol in our source, only the higher energy conventional structure is

170
formed. However, by changing the precursor and discharge conditions, the more stable structure is
produced.
Finally we measured the spectrum from 1000−3800 cm-1
for the [C2,H3,O]+ ion, made from
methyl acetate, which contains relatively few peaks. Theory predicts several isomers, yet the spectrum
can be completely assigned to just one structure, that of the acetyl cation, which is also the global
minimum structure on the potential surface. Comparison of our gas phase spectrum to previous
condensed phase results show that the ion's spectrum is insensitive to the local environment. Upon
switching precursors to acetone, the spectral features of acetyl appear in the spectrum alongside new
features. Theory for the next highest isomer, protonated ketene, confirms that this ion is also present
when the ion is formed from acetone in our source. Thus, protonated ketene is observed spectroscopically
for the first time. The implications of the different reaction pathways involving the two isomers for
astrochemistry are discussed. All of the studies presented herein confirm that infrared spectroscopy in a
supersonic expansion source is useful for the capture of transient species and characterization of their
infrared spectra.

171
APPENDIX TO CHAPTER 5
ANALYSIS OF THE COMBINATION BAND AT 3340 CM-1
We follow an approach that is similar to the one taken by Myshakin et al in their analysis of
complexes of CH3NO2- and CH3CO2
- with H2O [J. Chem. Phys. 2003, 119, 10138]. In the present
analysis, the Hamiltonian is reduced to the two normal coordinates, which are treated in the harmonic
approximation. The two chosen coordinates are the OH stretch (q1) and the Ar-H stretch (q11). The one
anharmonic term that is included is the cubic coupling term of the form ½ f3q12q11, and the value of all the
constants are obtained from a calculation at the MP2/6-311++G(d,p) level of theory/basis, as
implemented in Gaussian. This gives a Hamiltonian of the form
11
2
132
11
2
112
1
2
1
2
11
2
1
22222qq
fqq
ppH
.
In the present analysis, the energies and wave functions are obtained by employing an adiabatic
approximation in which the OH stretch is treated as the high frequency mode and the eigenvalues and
eigenvectors of the Hamiltonian
2
1113
2
1
2
1111
222qq
fpqh
are evaluated as functions of q11. This yields expressions for the energies of
172
2
1
21
2
1
1112
1
31
1113
2
1111
nqf
nqfqEn
The above approximation is introduced to make the problem analytically solvable, but solving the
problem numerically without invoking the approximation yields essentially the same results.
In the second step, we solve for the eigenvalues of h11:
2
1
2
1
82
1
222
2
1
2
1
222
11
2
12
11
2
1
2
3
22
12
111
311
2
11
2
11
11111
1
32
11
2
11
2
11;11 1
nnf
nf
qp
nqnf
qp
h n
which yields
2
12
11
2
1
2
3
2
111111,2
1
82
1
2
1111
n
fnnE nn
Here the corresponding wave functions are harmonic oscillators, and they are centered around
2
1
212
111
31
min
11 nf
nq
rather than q11=0.
The overlap of shifted harmonic oscillator eigenstates are well-known, and within a Franck-Condon
treatment the intensities of combination bands involving one quantum of excitation in the OH stretch and
n11 quanta in the Ar-H stretch are given by
173
!2 11
2
11
2/
11
11211
11 n
qeI
n
nq
n
where (in dimensionless coordinates)
11
13
2
111
1113
111 ~2
~
2
nFnfnq
Using the values from the electronic structure calculations, 1~ 3503 cm
-1,
11~ 130.6 cm
-1, and 3
~F
72.79 cm-1
leads to the prediction that the fundamental of the OH stretch gets 96.2% of the integrated
intensity while the remaining 3.8% would go to the combination band involving one quantum in each
mode.
Complete citation for reference 34:
Frisch, M. J.; Trucks, G. W.; Schlegel, H. B.; Scuseria, G. E.; Robb, M. A.; Cheeseman, J. R.;
Montgomery, J. A. Jr.; Vreven, T.; Kudin, K. N.; Burant, J. C.; Millam, J. M.; Iyengar, S. S.;
Tomasi, J.; Barone, V.; Mennucci, B.; Cossi, M.; Scalmani, G.; Rega, N.; Petersson, G. A.;
Nakatsuji, H.; Hada, M.; Ehara, M.; Toyota, K.; Fukuda, R.; Hasegawa, J.; Ishida, M.; Nakajima,
T.; Honda, Y.; Kitao, O.; Nakai, H.; Klene, M.; Li, X.; Knox, J. E.; Hratchian, H. P.; Cross, J. B.;
Adamo, C.; Jaramillo, J.; Gomperts, R.; Stratmann, R. E.; Yazyev, O.; Austin, A. J.; Cammi, R.;
Pomelli, C.; Ochterski, J. W.; Ayala, P. Y.; Morokuma, K.; Voth, G. A.; Salvador, P.;
Dannenberg, J. J.; Zakrzewski, V. G.; Dapprich, S.; Daniels, A. D.; Strain, M. C.; Farkas, O.;
Malick, D. K.; Rabuck, A. D.; Raghavachari, K.; Foresman, J. B.; Ortiz, J. V.; Cui, Q.; Baboul,
A. G.; Clifford, S.; Cioslowski, J.; Stefanov, B. B.; Liu, G.; Liashenko, A.; Piskorz, P.

174
Komaromi, I.; Martin, R. L.; Fox, D. J.; Keith, T.; Al-Laham, M. A.; Peng, C. Y.; Nanayakkara,
A.; Challacombe, M.; Gill, P. M. W.; Johnson, B.; Chen, W.; Wong, M. W.; Gonzalez, C. and
Pople, J. A. Gaussian 03 (Revision B.02), Gaussian, Inc., Pittsburgh PA, 2003.

175
APPENDIX TO CHAPTER 6
ANALYSIS OF THE COMBINATION BAND AT 3317 CM-1
We follow an approach that is similar to the one taken by Myshakin et al in their analysis
of complexes of CH3NO2- and CH3CO2
- with H2O [J. Chem. Phys. 2003, 119, 10138]. In the
present analysis, the Hamiltonian is reduced to the two normal coordinates, which are treated in
the harmonic approximation. The two chosen coordinates are the OH stretch (q1) and the Ar-H
stretch (q13). The one anharmonic term that is included is the cubic coupling term of the form ½
f3q12q13, and the value of all the constants are obtained from a calculation at the B3LYP/aug-cc-
pVTZ level of theory/basis, as implemented in Gaussian09. This gives a Hamiltonian of the
form
13
2
132
13
2
112
1
2
1
2
13
2
1
22222qq
fqq
ppH
.
In the present analysis, the energies and wave functions are obtained by employing an adiabatic
approximation in which the O−H stretch is treated as the high frequency mode and the
eigenvalues and eigenvectors of the Hamiltonian
2
1133
2
1
2
1131
222qq
fpqh

176
are evaluated as functions of q11. This yields expressions for the energies of
2
1
21
2
1
1132
1
31
1133
2
1131
nqf
nqfqEn
h
h
The above approximation is introduced to make the problem analytically solvable, but solving
the problem numerically without invoking the approximation yields essentially the same results.
In the second step, we solve for the eigenvalues of h11:
2
1
2
1
82
1
222
2
1
2
1
222
11
2
12
13
2
1
2
3
22
12
131
313
2
13
2
13
11131
1
32
13
2
13
2
13;13 1
nnf
nf
qp
nqnf
qp
h n
hhh
hh
which yields
2
12
13
2
1
2
3
2
131311,2
1
82
1
2
1131
n
fnnE nn
hhh
Here the corresponding wave functions are harmonic oscillators, and they are centered around
2
1
212
131
31
min
13 nf
nq
h

177
rather than q13=0.
The overlap of shifted harmonic oscillator eigenstates are well-known, and within a Franck-
Condon treatment the intensities of combination bands involving one quantum of excitation in
the O−H stretch and n13 quanta in the Ar−H stretch are given by
!2 13
2
13
2/
13
13213
13 n
qeI
n
nq
n
where (in dimensionless coordinates)
13
13
2
131
1313
113 ~2
~
2
nFnfnq
h
Using the values from the electronic structure calculations, 1~ 3255 cm
-1, 13
~ 115.8 cm-1
, and
3
~F -92.31 cm
-1 leads to the prediction that the fundamental of the O−H stretch gets 95.7% of
the integrated intensity while the remaining 4.3% would go to the combination band involving
one quantum in each mode.
178
Full Gaussian09 reference:
Gaussian 09, Revision D.01, Frisch, M. J.; Trucks, G. W.; Schlegel, H. B.; Scuseria, G. E.; Robb,
M. A.; Cheeseman, J. R.; Scalmani, G.; Barone, V.; Mennucci, B.; Petersson, G. A.; Nakatsuji,
H.; Caricato, M.; Li, X.; Hratchian, H. P.; Izmaylov, A. F.; Bloino, J.; Zheng, G.; Sonnenberg, J.
L.; Hada, M.; Ehara, M.; Toyota, K.; Fukuda, R.; Hasegawa, J.; Ishida, M.; Nakajima, T.;
Honda, Y.; Kitao, O.; Nakai, H.; Vreven, T.; Montgomery, J. A., Jr.; Peralta, J. E.; Ogliaro, F.;
Bearpark, M.; Heyd, J. J.; Brothers, E.; Kudin, K. N.; Staroverov, V. N.; Kobayashi, R.;
Normand, J.; Raghavachari, K.; Rendell, A.; Burant, J. C.; Iyengar, S. S.; Tomasi, J.; Cossi, M.;
Rega, N.; Millam, N. J.; Klene, M.; Knox, J. E.; Cross, J. B.; Bakken, V.; Adamo, C.; Jaramillo,
J.; Gomperts, R.; Stratmann, R. E.; Yazyev, O.; Austin, A. J.; Cammi, R.; Pomelli, C.; Ochterski,
J. W.; Martin, R. L.; Morokuma, K.; Zakrzewski, V. G.; Voth, G. A.; Salvador, P.; Dannenberg,
J. J.; Dapprich, S.; Daniels, A. D.; Farkas, Ö.; Foresman, J. B.; Ortiz, J. V.; Cioslowski, J.; Fox,
D. J. Gaussian, Inc., Wallingford CT, 2009.