Embed Size (px)
Citation preview

I MRI.REPORTj! . h
~,,_..~------------------------------~--~------------~------------------~--~------~--------------------------:i,
Determination of Body Burdens for Polychlorinated Dibenzo-p-dioxins (PCDDs)
- and Polychlorinated Dibenzofurans (PCDFs) i in California Residents
,f Final Report\
By John S. Stanley, Karin M. Bauer,
Kay Turman, Kathy Boggess, Paul Cramer
1i For the State of California .1 Air Resources Board
Research Division 1800 15th Street
Sacramento, California 95812
Attn: Ralph Propper
ARB Contract No. A6-195-33 MRI Project No. 8941-A
October 26, 1989(
MIDWEST RESEARCH INSTITUTE 425 Volker Boulevard, Kansas City, MO 64110-2299 • (816) 753-7600

DISCLAIMER
The statements and conclusions in this report are those of the contractor and not necessarily those of the State of California Air Resources Board. The mention of commercial products, their source~ or their use in connection with material reported herein is not to be construed as actual or implied endorsement of such products.

PREFACE \
This final report is provided in fulfillment of the State of California 1 s Air Resources Board (ARB) program to determine the current body burden levels for polychlorinated dibenzo-p-dioxins (PCDD) and polychlorinated dibenzofurans (PCDF) in California residents. This report covers work done under ARB Contract No. A6-195-33. This final report details in the survey design; identifies the sampling and analysis protocols that were necessary to determine background levels of PCDOs and PCDFs in the California population; and provides a review of the existing literature on body burden levels of PCDDs and PCDFs. This draft final report was prepared by Dr. John S. Stanley with assistance from Ms. Karin M. Bauer, Ms. Kathy E. Boggess, Ms. Kay Turman, and Mr. Paul H. Cramer.
The authors of this report wish to acknowledge the assistance of Mr. Michael McGrath, Mr. Jay Wilner, Ms. Donna Miller, Mr. Kelly Thornburg, and Ms. Jean Pelkey, who provided valuable assistance in the preparation and analysis of the samples and data. In addition the authors acknowledge the assistance of Dr. Eli Mishuck of IWG Corporation for recruitment of sample collection facilities in the Los Angeles area. Finally, the authors wish to thank the facilities (Mills Memorial Hospital, Loma Linda University, Pacific Hospitalof Long Beach, and the University of California-San Francisco) that provided
' medical staff to collect the necessary samples.J MIDWEST RESEARCH INSTITUTE
~~ John S. Stanley, Ph.D. Program Manager
uh Jo E. Going, Ph.D., Director Chemical Sciences Department
October 26, 1989 r l1
iii
I

1
TABLE OF CONTENTS
LO Summary e e ♦ • e e e • • • • • " • • • • 0 • 0 • ♦ e ♦ Cl • ♦ • Cl • 0 0 9 • e C e O • • $ • 0 • e • ■ •• • ■ ♦ •
2.0 3
2.1 Program Objectives ... 3cooo•ooe~o••~•~cc~~a••e~ocoo•o••oo
2.2 Report Organization~·••ci•o••~o•eo~oc~••o•••~o•o•~GOOOQ ♦ 4
3.0 6
3.1 Survey Design.oc••o••c••··••o•••o••·••o•o••··•···•••·•· 6 3.2 Sample Collection Protocols •••••••• ~................... 10 3.3 Selection of the Analytical Protocol................... 13
4.0 Results •................................. 19o ••••••••••••••••••
4.1 Sample Collection ...• ••• e.ooo••···••••o••o~oo••·••o•o• 19 4.2 Chemical Analysis Results •••••••••••••••••.. ,.......... 19
Q
4.3 Results of Quality Control Samples..................... 21 4.4 Summary of the lifestyle Questionnaire Results......... 22 4.5 Statistical Data Analysis.............................. 23
5.0 Review of Existing Information on Human Body Burden Levels of PCDDs and PCDFs •••••••••••.••••..•••.••••••••.•• 76
5.1 Literature Searcho.cc••··~··••eo•e••··••O•~··••ee••···· 76 5.2 General Population Studies............................. 77 5.3 Distribution of PCDD and PCDF Congeners in Body
Tissues and Fluidsc.eo¢00 •• 090•·········•~·······••o• 88 5.4 Body Burden Versus Lifestyle Factors................... 92 5.5 Body Burden Versus Age and Sex......................... 94
97
Appendix A - Sample Collection Protocol............................... A-1 Appendix B - Analytical Protocol for Determination of PCD□ s and
PCOFs in Human Adipose Tissue.......................... B-1 Appendix C - Quality Assurance Program Plan (QAPP).................... C-1 Appendix D - Relationship Between Percent Body Fat and Anthropometric
Data in Humans .••.•. Q·••e•e•••e••·••oG ♦♦ Co••··········· D-1 Appendix E - Method Recoveries for the Internal Quantitation
Standards (IQS) .....••... E-1c •••••••••••••••••••••••••••• o
iv

r ii ,I l
Figure
4-1
5-1
5-2
5-3
5-4
5-5
5-6
5-7
5-8
5-9
5-10
LIST OF FIGURES
Incidence of nondetects for each PCDD and PCDF compound on a batch basis. The reference to compound number is given in Section 4.5.1 of the text •••••••••••••••••••••••••• 31
U.S. geographic regions where studies on body burden levels of PCDDs and PCDFs have been or will be conducted •••• 78
U.S. geographic strata considered in the FY82 NHATS study ••• 79
Average wet weight tissue concentration of PCDDs and PCDFs in human adipose tissue from the continental United States and Canada•....•.••••••.•••..•.•••••••••••••.•....••••••.••• 81
Distribution of the frequency of detection of 2,3,7,8-TCDD from specific human adipose tissue studies •••••••••••••••••• 83
Serum 2,3,7,8-TCDD levels of Vietnam and non-Vietnam veterans participating in the Agent Orange validation studies--preliminary data 1987 •••••••••••••••••••••••••••••• 84
Distribution of PCDDs and PCDFs in various adiposetissues ••••••••••••••••••••••••••••••••••••••••••••••••••••• 90
Correlation of serum 2,3,7,8-TCDD concentration vs. adipose tissue 2,3,7,8-TCDD concentration ••••••••••••••••••• 91
2,3,7,8-TCDD adipose tissue concentration from personsclassified as exposed at Times Beach, Missouri, vs. the adipose tissue concentration of controls •••••••••••••••••••• 93
Correlation of PCDD concentration vs. age for the FY82 NHATS composite samples •.••.•••••••••.••••••••...••••••••••. 95
Correlation of 2,3,7,8-TCDD concentration vs. age and fro~ analysis of samples from different geographic
sex
reg1ons ........................................... c, ••••••••• 96
V

LIST OF TABLES
Table Page
2-1 Chlorinated Dioxins and Dibenzofurans of Interest ••••••••••• 5
3-1 Survey Design for the PCDD/PCDF Body Burden Study.••••••••.• 8
3-2 Estimate of Relative Standard Error of the Mean for PCDD and PCDF Congeners Measured in Adipose Tissue Samples from a Human Population••..••..••• o••···•·············•····· 10
3-3 Internal Standard Spiking Solutions for Determination of PCDOs and PCDFs in Human Adipose Tissue ••••••••••••••••••••• 14
3-4 HRGC/HRMS Operating Conditions for PCDD/PCDF Analysis ••••••• 16
3-5 Concentration Calibration Solutions for PCDD/PCOF ••••••••••• 17
4-1 Age Group Distribution of Adipose Tissue Specimens •••••••••. 32
4-2 Lipid Adjusted Concentrations of PCDDs and PCDFs in Human Adipose Tissues--Batch l.o•••·•···········•··••••o••·····••o 33
4-3 Lipid Adjusted Concentrations of PCDDs and PCOFs in Human Adipose Tissue--Batch 2••••••••..•••••••.•• o................ 35
4-4 Lipid Adjusted Concentrations of PCDDs and PCDFs in Human Adipose Tissue--Batch 3•••.••..•..•.•.••.••• o••·•9·········· 37
4-5 Lipid Adjusted Concentrations of PCDDs and PCDFs in Human Adipose Tissue--Batch 4.•... oo••·•Qeoee•o•QQ ♦ OOOOOo ♦ ••·••e•• 38
4-6 Lipid Adjusted Concentrations of PCDOs and PCOFs in Human Adipos·e Tissue--Batch 395.,oc,oec•o,C9()0QC14)•0e-co•eci,;icoQQGOC>OOOQ•·
4-7 Precision of Duplicate Sample Preparations •••••••••• c••····· 40
4-8 Control QC Sample Results CARB~ 1989; Control QC SampleResults from Previous Analysis of NHATS FY 1987 •••••••••••.• 41
4-9 Method Accuracy (Recovery%) for PCOOs and PCDFs Spiked Into Human Adipose Tissue ..•..•.•.•• ~···••oo~•••oo••·····••o 43
4-10 Questionnaire Summary--Anatomical Origin of Adipose Tissue Sample.c6••0•0••·······c,···••oc••·••ooo•••o•·····••oc, 46
4-11 Questionnaire Summary--Race of Donor ••••••• c•c••············ 47
4-12 Questionnaire Summary--Height (in) of Donors •••••••••••..••• 48
vi

r
Table
4-13
4-14
4-15
4-16
4-17
4-18
4-19
4-20
4-21
r 4-22 ,fl
4-23
4-24
4-25
1
r 4-26I
4-27
5-1
5-2
r _,
~ ~ I
LIST OF TABLES (continued)
Questionnaire Summary--Weight {lb} of Donor •••••••••••••••••
Questionnaire Summary--Skinfold Caliper (mm) Measurements of Donors . ...•..............................................
Number of Respondents Presently Living or Working Within 5 Miles of Potential Sources of PCDD and PCDF Contamination, by City...................................... Number of Respondents Who Have Relocated Within the Last 5 Years and Have Previously Lived or Worked Within 5 Miles of Potential Sources of PCDD and PCDF Contamination, by City •••••••••••••••••••••••••••••••••••••.
Number of Respondents With Potential Chemical Exposure at Work, at Home During the Last 5 Years, or From Vietnam, by City••••••••••••••••••••••••••••••••••••••••••••
Number of Respondents in Various Relevant OccupationalCategories, by City .••••••..••••••.•••••••.••.•••••••••••.••
Distribution of Adipose Tissue Specimens Across DesignCells •••••••••••••••••••••••••••••••••••••••••••••••••••••••
Overall Results on Occurrences of Compounds in 57 Samples by City and Across Both Cities ••••••••••••••••••••••••••••••
Concentration Statistics by Compound, City, Sex, and Age_ Group • •••••••••••••••••••••••••••••••••••••••••••••••• o •
Concentration Statistics by Compound, City, and Sex •••••••••
Concentration Statistics by Compound and City•••••••••••••••
Concentration Statistics by Compound, Sex, and Age Group ••••
Concentration Statistics by Compound and Age Group ••••••••••
Concentration Statistics by Compound •••••••••••••••••••.••••
Overall Analysis of Variance Results ••••••••••••••••••••••••
PCDDs and PCDFs in NHATS FY82 Composite Specimens •••••••••••
Levels of PCDDs and PCDFs Found in Human Adipose Tissue from the Swedish Population •••••••••••••••••••••••••••••••••
vii
Page
49
50
51
51
52
52
53
54
55
63
66
68
72
74
75
80
86
LIST OF TABLES (continued)
Table
5-3 Wet Tissue Concentration of PCDDs and PCDFs in Adipose Tissue Samples Collected in Japan ••• e••••o••··········•···•· 87
5-4 Mean PCDO and PCOF Levels (pg/g) in Adipose Tissues from Vietnam (Wet Weight Basis} ••••••••••••••••• o••······••e 88
viii

ABSTRACT
Determination of body burden levels of polychlorinated dibenzo-p-dioxins and dibenzofurans {PCDDs and PCDFs) in residents of California was conducted based on a stratified survey design. Stratification factors included two geographical locations (San Francisco and Los Angeles), three age groups {12 to 34, 35 to 49, and 50 plus years), and sex. A total of 57 adipose tissue specimens were collected across the 12 specific strata. Analysis for the specific2,3,7,8-substituted isomers was achieved based on high resolution gas chromatography/high resolution mass spectrometry {HRGC/HRMS). Detectable levels of PCDDs and PCDFs were measured in all samples with isomer patterns consistent with findings in other studies conducted within the United States, Canada, and Europe. The resulting data base demonstrates the prevalence of these compounds in the general California population. The factors (geographic location, age, and sex) considered in the survey design were not statistically
f I
significant at the 5% significance level. A questionnaire focused on the i lifestyles of participants in the program was conducted to determine residual
and occupational information and possible exposure routes to PCDDs and PCDFs. The data base provides a reference for comparison in future human monitoring programs.
I: I_
(
' "
ix
I

SECTION 1.0
SUMMARY
The research program described in this report required the collection of human adipose tissue specimens via a stratified survey design. Stratification factors included two geographical locations within California (Los Angeles and San Francisco), three age groups (12 to 34, 35 to 49, and 50 plus years), and sex of donor. The resulting survey design covered 12 specific strata. The initial survey design specified a total of 60 fatty samples to be distributed among the 12 strata; the actual collection resulted in 57 adipose tissue
(' specimens. Specimens were analyzed for polychlorinated dibenzo-p-dioxins
1,1 (PCDDs) and polychlorinated dibenzofurans (PCDFs) by high resolution gas1 l chromatography/high resolution mass spectrometry (HRGC/HRMS). The PCDDs and
PCDFs of interest were the 2,3,7,8-substituted compounds.
Detectable levels of the specific PCDDs and PCDFs were measured in the majority of samples analyzed. The PCDD and PCDF isomer patterns detected are consistent with the incidence of these compounds detected in other studies conducted within the continental United States, North America, and Europe.Although the sample collection did not meet the full requirements of the survey design, sufficient data were available to demonstrate the prevalence of
" u these compounds in the general California population.l!I
None of the factors considered in the survey design--geographic location, ageand sex--were significant at the 5% significance level. There is no statistically significant difference in mean concentrations between cities, between sexes, or between age groups at the 95% confidence level, regardless of whether the data are analyzed at the highest level of detail or in any otherr
11 combination. 11
The data presented herein provide a preliminary estimate of the body burden levels of PCDDS and PCDFs in the California population. In order to fully assess the impacts that specific contaminant sources might have on body burden levels of these compounds, it will be necessary to drastically increase the number of individual data points. This will be necessary in order to detect initial differences arising from exposure to these contaminants.
C If ARB anticipates undertaking additional monitoring efforts, it is recomI I mended that a rigorous and consistent sample collection and analysis programL be initiated. Such a program must recognize the importance of long-term
participation of a collection facility, development of the necessary qualitycontrol samples to demonstrate long-term accuracy and precision, and a detailed study design.
1

In the study reported in this document 9 the concentration data have been analyzed individually for each compoundo Correlations between compounds mayexist but have not been considered hereo Relationships between geographiclocation~ age groups or sex and the levels of all detected compounds should be investigated by means of a multivariate analysis approach. The results from a series of principal component analysis and cluster analyses could possiblyindicate some clustering of samples when all compounds are considered simultaneously o
2

SECTION 2.0
INTRODUCTION
Midwest Research Institute (MRI) was contracted by the State of California Air Resources Board (ARB) to determine the current body burdens of polychlorinateddibenzo-p-dioxins and dibenzofurans in California residents. The results of this project will be used by the ARB as part of their assessment of the impact that major stationary combustion sources (municipal incinerators, hazardous waste incinerators, wire reclamation facilities, hospital incinerators, etc.)will have on the impact of air quality and human health.
Body burden levels of PCDDs and PCDFs in California residents have not been established prior to this study.
This final report provides:
• Details of the survey design considered for the collection of tissues from California residents and the analytical protocol required to provide
Ii accurate measurements of the 2,3,7,8-substituted PCDDs and PCDFs at lowI l part-per-trillion (picograms/gram, pg/g) levels.
• The results of the high resolution gas chromatography/high resolution ~
mass spectrometry (HRGC/HRMS) analyses of 57 human adipose tissue specimens and the results for 20 quality control samples analyzed along with
r the design specimens.
)
Iii,
• The approach to the statistical analysis of the analytical data and the extrapolation of the data to upper and lower 95% confidence intervals of
1 the average body burdens.I
L
• A comparison of the results with other studies that focus specifically on body burden levels of the 2,3,7,8-substituted PCOOs and PCOFs.{
2.1 Program Objectives1 ,, I
'-- The objectives of this program were to provide the ARB with a preliminaryestimate of the current body burden levels for PCOOs and PCOFs in a repre
ii sentative sample of the California population. This has been accomplished[ through a program of field sampling and laboratory analysis of human adipose
tissue. ,, ,
The chemical analysis of the adipose tissue were conducted for specific PCOOI_
r and PCOF congeners (tetra- through heptachloro congeners substituted in the
3

2,3,7 ,8-position). The specific PCDD and PCDF congeners of interest are identified in Table 2-1. These data may be used by the ARB to estimate health risks from the dioxins and furans designated as toxic air contaminants, and to compare them with source-specific isomers ( 11 fingerprir.t 11 isomers) detected in future monitoring studies.
The data may also be used to determine if any correlation exists between body burden levels and lifestyle factors such as age,· occupation9 and residence history. For that purpose, a lifestyle questionnaire was developed and was administered to the donor group.
2.2 Report Organization
Section 3.0 presents the details on the experimental approach for this study. This section includes considerations for the survey design that was proposed at the outset of the program, describes considerations used in the development of the study questionnaire, presents the approaches for soliciting cooperation from the necessary medical facilities to collect samples, identifies the genera1 samp1e hand1i ng considerations, describes the genera1 analytical procedures used to conduct the analysis of the samples by HRGC/HRMS, and presents the approach to quality assurance/quality control.
Section 4.0 presents the results of the study to determine the body burden levels of PCDDs and PCDFs in the California population. Data presented in this section include the raw analytical data for each of the 57 adipose tissue samples that were collected, the results of repetitive analysis of a control 1ipid matrix and samples. fortified with known levels of specific PCODs and PCDFS 9 and the statistical analysis of the data.
Section 5.0 presents a synopsis of other human body burden study results to which the results from the ARB study of California residents can be compared. This section was prepared from a review of the existing literature on the levels of the 2,3,7,8-substituted PCDDs and PCDFs in humans. Section 5.0 summarizes the existing literature based on the data for the general United States population and from other countries~ specific exposed populations, demographic factors that are correlated with PCDD and PCDF body burden, and distribution of PCDDs and PCOFs within the body.
Section 6.0 contains the complete listing of pertinent references cited in this report.
Detailed descriptions of the sampling and analytical protocols ·and the QAPP are presented in Appendices A~ B, and C, respectively. Appendix D presents information on the re1at i onsh i p between percent body fat and anthropometric data in humans.
4

Table 2-lo Chlorinated Dioxins and Dibenzofurans of Interest
,I
"
Tetrachloro
Pentachloro
Hexachloro
Heptachloro
Dioxins
2,3,7,8
1,2,3,7,8
1,2,3,4,7,8 1,2,3,6,7,8 1,2,3,7,8,9
1,2,3,4,6,7,8
Dibenzofurans
2,3,7,8
1,2,3,7,8 2,3,4,7,8
1,2,3,4,7,8 1,2,3,6,7,8 1,2,3,7,8,9 2,3,4,6,7,8
1,2,3,4,6,7,8 1,2,3,4,7,8,9
NOTE: The numbers indicate the position of chlorine atoms on the dioxin or dibenzofuran molecule (see diagram below).
9
0 28
00 7 0
46
Dibenzo-p-dioxin
g
0 28
0 7
6 4
Dibenzo-p-furan
5

SECTION 3.0
EXPERIMENTAL APPROACH
This section describes the experimental procedures, including the survey design, the sample collection protocol, and the analytical method, that were required for completion of this program.
3.1 Survey Design
The development of the survey design required consideration of several factors. These included stratification factors (geographical strata, agecategories, and sex of the donor), sample sizes and quotas, classification of individuals according to lifestyle factors, determination of the impact of the design on statistical influences, and determination of total body burden based on the residue levels. These factors and their relation to the initial survey design are addressed below.
3.1.1 Stratification Factors
Ideally, a random sampling from the whole California population, while considering relevant lifestyle factors as stratifying variables, would achieve the goals of establishing background body burden levels of PCDOs and PCDFs for the general California population. However, the scope of the study restricted such a sampling scheme.
Since one of ARB' s overall objectives is to determine the impact of emissions from combustion and/or incineration sources on body burden levels of PCDDs and PCOFs, it would seem logical to have sampled at or near existing sources of airborne PCDDs and PCDFs. However, such an approach would have been biased towards higher PCOO and PCOF concentration levels in the sampled tissue should any correlation between airborne emissions and absorbed levels of these compounds be found significant.To establish baseline body burden levels, the selected population group should be representative of the whole California population. That is, one should aim at obtaining a sample which will reproduce the considered characteristics of the target population as closely as possible.
The collection of adipose tissue samples for this study was based on a stratified sampling design. The stratification factors that were considered for this survey design are:
6

r f f
r,1
i1 !
location within California,• geographical
• age category, and
• sex of donor.
Geographical Strata
The ARB has also funded a study to evaluate the ambient airborne levels of PC00s and PC0Fs (ERT, 1987). This study focused on the air quality and the ambient air levels of PC00s and PCDF in Los Angeles and San Francisco.
The adipose tissue samples were thus targeted for collection from these two major urban areas within California: Los Angeles and San Franci sea. The ARB has suggested that the South Coast Air Basin should be considered the primary area of study. This air basin is one of many areas in which the State of California is subdivided for special air-monitoring purposes. It is a geographical area mainly defined by airflow patterns and natural barriers, and includes Los Ange 1es. Due to extensive air po11 ut ion problems in the highly populated Los Angeles area, this air basin might not be representative of the rest of the state. To minimize the bias towards higher polluted areas, San Francisco was included in the study as an urban control site.
Age Categories
Previous studies {Stanley, 1986b; Graham et al., 1986b; Patterson et al., 1986; Ryan, 1986) have shown a correlation of PCDD and PC0F levels with age. Thus a stratification by age is important to obtain independent concentration estimates within each age group. Even though levels of PCDDs and PCDFs have been found in children as young as or younger than 15 (Stanley, 1986), it was decided to consider only donors older than 12. Filling quotas for the age stratum of 0-12 years within each geographic strata was expected to be very difficult. Three age groups--12 to 34 years,35 to 49 years, and 50 or older--were selected as the second stratifying variable. This stratification provides a good agedistribution given the relatively small sample sizes available.
Sex of Donor Stratum
The literature (Graham et al., 1986a,1986b; Patterson et al., 1986b) has also shown a slight difference in PCDD and PCDF levels between males and females, the latter group showing higher bodyburden levels. Thus sex of donor was considered to be an important stratifying factor in this study.
7

3.1.2 Sample Size and Quotas
Based on the stratification factors described above, MRI proposed to analyze a total of 60 adipose tissue samples, plus the associated quality control samp1 es (replicates, spikes, blanks 9 etc.) o Hence the target sample size of donors was 60. From this figure 9 the quotas within the 12 strata (2 geographical areas x 3 age groups x 2 sex groups) were determined. The restrictions on the allocations of donors to strata were as follows:
• at least two donors per stratum,
• equal allocation to each age group,
• equal allocation to each sex, and
• 40 donors in Los Angeles and 20 donors in San Francisco.
These allocations and quotas are summarized in Table 3-1:
Table 3-1. Survey Design for the PCDD/PCDF Body Burden Study
Los Angeles San Francisco Male Female Male Female
12-34 years 6 6 2 2
35-49 years 7 7 4 4
50 and above 7 7 4 4
Total 20 20 10 10
3.1.3 Lifestyle Questionnaire
In collecting the adipose samples, MRI arranged with medical care ,nstitutions to obtain samples from patients who volunteered for the study after giving informed consent (Appendix A). These patients were selected from those undergoing surgery. During the surgery, a sample of at 1east 5 g of adipose tis sue was removed and used as the tissue sample. Patients were interviewed prior to their surgery to obtain information on a set of lifestyle variables.
A questionnaire (Appendix A) was developed to collect the lifestyle information on all participants. Among the informational items to be collected were:
8

: \
• age,
• sex,
• height/weight,
• residence history,
• military service in Southeast Asia between 1960 and 1971,
• any known exposure to PCDDs/PCDFs (for example, herbicides, pentachlorophenol, etc.), and
• occupational history •
3.1.4 Impact of Survey Design on Statistical Inference
The survey was designed to yield a total of 60 samples of adipose tissue for analysis. Although 60 is not a large number, it is sufficient to determine whether PCDDs and PCDFs are found in detectable quantities in California residents. The sample size should also allow for the determination of whether there are geographical differences among the samples,whether the age and concentration association reported elsewhere is also found in these residents, and investigation of other possible associations based on the lifestyle questionnaire data.
Overall, little information is available in the literature about the bodyburdens of PCDDs and PCDFs, but the study of residents of Missouri (Graham et al., 1986) not known to be exposed to PCDDs and PCDFs reportedlevels of specific 2,3,7,8-substituted congeners. Using this study as a rough guide to the variation expected among individuals, and assumingthat approximately similar levels will be found in California residents, the approximate relative standard errors were estimated (Table 3-2).
Table 3-2 contains information on the mean concentration and standard deviation calculated from the individual sample values. The relative standard error of the mean was calculated by assuming a design effect of 2, which is reasonable for the design suggested.
As can be seen, the relative standard errors are reasonable and would provide useful information. However, of more concern than the precisionof the estimates is any possible bias. With a sample of this size one must be particularly concerned about bias in representing the population.
3.1.5 Determination of Total PCDD and PCDF Body Burden Based on Adipose Tissue Levels
The human population studies conducted to date have focused primarily on the comparison of the adipose tissue 1eve1s of the PCDD s and PCDF s. Since most of these studies have been conducted using samples collected during autopsy, there has not been a good mechanism for assessing total(
9
I

body fat and the relation of total body weight for extrapolating to the true body burden values. One of the approaches that can be taken to generate estimates of total body fat include conducting skinfold measurements of participants or to use the height, weight, and age of the participant and compare these values to reference tabulations.
Table 3-2. Estimate of Relative Standard Error of the Mean for PCDD and PCDF Congeners Measured in Adipose Tissue Samples from a Human Populationa
Concentration Std. Devo Relative Standardb PCDO/PCDF congener (ppt) (ppt) Error of Mean(%)
2,3,7,8-TCDD 8.4 4.69 l0o2 1,2,3,7,8-PeCDD 19. l 10.34 9.9 2,3,4,7,8-PeCOF 12 7.21 11.0 1,2,3,6,7,8-HxCDO 111 69.21 11.4 1,2,3,4,6,7,8-HpCDD 261 214.00 l5o0 Octa 1273 606.00 8.7
Source: Graham, M., F. D. Hileman, R. G. Orths J.M. Wedling, J. D. Wilson, "Chlorocarbons in Adipose Tissue from a Missouri Population, 11 Chemosphere, 15, 1595-1600 (1986).
~ Derived from individual data points from 60 adipose tissue samples. This statistic assumes a design effect of 2.
3.2 Sample Collection Protocols
The request for proposal indicated that both tissue and body fluid should be analyzed for estimating the baseline levels of PCDOs and PCDFs. Previous work by the Centers for Disease Contra l ( Patterson et al. s 1986b) demonstrated a strong correlation between blood serum and adipose tissue concentrations for 2,3,7,8-TCDD, although the actual concentrations in blood serum are roughly two orders of magnitude less than observed in the adipose tissue. These correlations were derived from the analysis of paired adipose and blood serum samples collected from Missouri residents with and without histories of exposure to 2,3,7,8-TCDD. The strong correlation of concentration between adipose and serum suggested that either matrix is suitable for monitoring body burden levels of 2,3,7,8-TCDO. However9 as discussed earlier in the literature review section, the correlation of concentration between higher chlorinated PCDDs and PCDFs in adipose and blood serum may not be as high as shown for TCDO.
3.2.1 Selection of Biological Matrix for Analysis
Analysis of both sample matrices for the proposed study was not necessary. The work conducted by the Centers for Disease Control (Patterson et al., 1986b; Rappe et al., 1986a) has demonstrated that the lower level
10

r
[ /I'L I
f '
of 2,3,7 ,8-TCDD in human blood serum approaches approximately 0.01 pg/g or 10 parts per quadrillion. When the concentration in blood serum is adjusted for lipid content, the reported concentration approaches the 1-10 pg/g (parts-per-tri 11 ion) range. The required level of detection for blood serum presents an extremely difficult and challenging problemin maintaining instrumental capability for analysis. Selection of blood as the matrix for establishing baseline estimates of PCDDs and PCDFs would require high resolution mass spectrometry instrumentation that is dedicated to these levels of analyses. Adipose tissue, on the other hand, has been shown to be a good indicator for PCDDs and PCDFs and offers the advantage that the PCDD and PCDF levels are more concentrated and hence the instrumental requirements although still stringent are less significant. For these reasons, MRI selected adipose tissue as the more desirable matrix for estimating body burden levels of PCDDs and PCDFs in the general California population.
3.2.2 Selection/Recruitment of Sample Collection Centers
Arrangements were made with at least two medical facilities within each of the geographic strata to recruit the patients and obtain the adiposesamples. Among the criteria for selecting the participating institution were:
• the institution's willingness to cooperate,
• the elective surgery load, and
• the geographical area covered by the institution •
3.2.3 Sample Collection Protocols
Recruitment efforts were carried out by MRI staff and IWG Corporationstaff beginning in January 1988.
A 1etter exp1a i ni ng the body burden study objectives and requestingcontribution of adipose tissue specimens was the first contact with all facilities. The letter was sent to the head of surgery of the facility,whose name was obtained by te1ephone contacts. A f o 11 ow-up ca11 to determine level of interest was then made. If the surgeon expressedinterest, a packet containing the survey design, the scope of work, the collection and shipping protocol, the medical exclusion form, the questionnaires, and the consent forms was provided. A sample supply kit was also sent to the surgeon. In several cases, the packets of information and the sample supply kits were presented to the internal review board of the facility as information pertinent to approval. Additional follow-upcalls were made to answer questions and determine status of the approval process within the facility.
In all, 22 facilities and 3 plastic surgeons in private practice were contacted by MRI or IWG staff regarding participation in the study.
11

Three facilities in Los Angeles contributed adipose tissue specimens~ and collection in San Francisco was conducted at two facilitieso
The guidelines for sample collection were a key element in the sampling process. The guideline materials specific to the sample collection protocol are provided in Appendix A of this report. The materials in Appendix A include the sample collection procedure, the information and consent forms to be signed by the hospital participants (donors), and a medical exclusion screening form for use by the hospital coordinators. These were sent to each participating hospital at the start of the recruitment. Although the collection procedure is relatively simple, the guidelines give the cooperating physician a complete understanding of all aspects of the collection procedure. Items included are the requirement for age/sex quota distribution, the criteria for selecting patients to be sampled, legal consideration, forms completion, sample collection, and shipment. The signed consent forms have been retained by the collection facilities to maintain confidentiality of the participating individuals. All of these materials were submitted to MRI 1 s Human Subjects Studies Review Committee for review and approval for this study.
3o2.4 Considerations for Exclusion of Donors from the Study Design
As indicated above, the hospital coordinators were requested to determine from review of the medical charts of the prospective donors, or through personal interviews with the patients or their physicians, if any of the following characteristics would exclude a potential subject from this study.
• pregnancy,
., malignancy, excluding nonmalignant melanoma skin cancers,
e insulin-dependent diabetes,
.. immunosuppression caused by either a disease process or therapeutic medications9
• history of unintentional weight loss greater than 10 lb in preceding 6 months,
e bleeding disorder,
• infectious or serum hepatitis, active tuberculosis, or acquired immune deficiency syndrome, and
• children less than 12 years of age.
These procedures for exclusion are consistent with the approach taken by the Centers for Disease Control in their study of Missouri residents.
12

l . 3.3 Selection of the Analytical Protocol
MRI has developed and validated an analytical method specifically for the analysis of PCDDs and PCDFs in biological tissue (Stanley et al., 1986d). The method performance has been documented to provide accurate quantitative data for the 2,3,7,8-TCDD to concentrations in the range of 1 to 10 pg/g. Method performance for this procedure has been demonstrated for each of the 2,3,7,8-substituted PCDD and PCDF congeners as well as the octachlorodibenzo-p-dioxin{0CDD) and octachlorodibenzofuran {0CDF).
,..
The specific analytical procedures for the determination of PCDDs and PCDFs in adipose tissues are presented in detail in Appendix B of this report. However, there are several deviations to the analytical procedure that should be addressed. Specifically, some modifications of the chromatographic cleanuptechniques were incorporated in this study. These modifications included the use of neutral alumina versus acidic alumina columns to fractionate sample extracts and the use of a carbon-based column which consisted of AX-21 charcoal {Anderson Development Company) on silica gel versus Carbopak Con Celite as described in the protocol in Appendix B. The AX-21/silica column was used only with the first batch of samples. The basis for these modifications resulted from the incorporation of these procedures in EPA's high resolution mass spectrometry {HRMS) procedure, Method 8290, for the determination of PCDDs and PCDFs in multimedia samples {Tondeur 1987; Stanley et al., 1989).[
Ii , 3.3.1 Laboratory Sample Preparation Procedures
A known amount of a series of 1 3C-labeled internal quantitation standards was added (Table 3-3) to each adipose sample (5 to 10 g aliquots). The adipose samples were extracted with methylene chloride using a Tekmar Tissuemizer. The methylene chloride extract was dried by elution throughsodium sulfate. The extraction procedure was repeated at least two additional times per tissue sample. The final extract was adjusted to known volume. A portion of the extract was removed to gravimetrically determine the lipid content and the remaining extract was solvent exchanged to hexane.
The hexane extract was subsequently subjected to an acidic silica gelslurry cleanup procedure. Specifically, 100 g of 40% sulfuric acidimpregnated silica gel was mixed with the hexane/milk fat mixture for 2 hr. Afterwards, the hexane was decanted through a funnel of sodium
t sulfate into a 4-g acid silica gel/1-g neutral silica gel column. The fraction was collected in a Kuderna-Danish (K-D) evaporating flask. The acidic si 1ica gel was slurried an additional two times with 50 ml of hexane for 15 min each time and the rinses placed on the column. After all the solvent from the slurry had passed through the column, an addit i ona1 50 ml of hexane was pl aced on the co1umn and combined with the other eluent in the K-D flask.
The extract was reduced in volume to approximately 2 ml and applied to the top of a chromatography column comprised of 4 g sodium sulfate, 4 gneutral alumina, and 4 g sodium sulfate. The column was eluted with 10 ml of 8% dichloromethane in hexane. This portion was archived. The PCDDs and PCDFs were eluted in 15 ml of 60% dichloromethane in hexane.
13

Table 3-3. Internal Standard Spiking Solutions for Determination of PCDDs and PCOFs in Human
Adipose Tissue
Concentration Compound (pg/µL)
Internal Quantitation Standardsa
13 ( 12-2,3,7,8-TCDD 13( 12-2,3,7,8-TCDF 13( 12-1,2,3,7,8-PeCDD 13C12-l,2,3,7,8-PeCDF 13( 12-1,2,3,6,7,8-HxCDO 13( 12-1,2,3,6,7,8-HxCDF 13( 12-1,2,3,4,6,7,8-HpCDD 13C12-l,2,3,4,6,7,8-HpCDF 13(1rOCDD
Internal Recovery Standardb
13C 12-l,2,3,4-TCDO 13C12-l,2,3,7,8,9-HxCDD
5
5
5
5
12.5
12o5
12.5
12.5
25
50
125
~ Prepared in isooctanes 100 µL spiked. Prepared in tridecanes 10 µL spiked.
14

This fraction was collected and reduced in volume to approximately 2 ml and applied to the final column. Neutral alumina was used rather than acidic alumina specified in the analytical protocol to improve method recoveries.
The f i na1 c1eanup co1umn consisted of 1 g of Carbopak C on Ce1i te 545. The column was prerinsed with 4 ml toluene, 2 ml dichloromethane/methanol/benzene (75:20:5), and 4 ml cyclohexane/dichloromethane {50:50). The fraction from the alumina column was transferred to a Carbopak C/Celitecolumn with two 1-ml rinses of hexane. (Batch 1 samples were chromategraphed in a carbon column consisting of AX-21 dispersed on silica gel.) The column was eluted with 10 ml of the• cyclohexane/dichloromethane solution and 5 ml of the dichloromethane/ methanol/benzene solution. These fractions were combined and archived. The columns were then turned over and eluted with 20 ml of toluene. The toluene was reduced in volume to approximately 100 µL, the internal recovery standards in tridecane were then added (10 µl, Table 3-3), and the extract further evaporated to final· volume (10 µl}.
3.3.2 HRMS Analysis Procedures
The sample extracts were analyzed using either a Kratos MS-50TC or a VS 70 250S high resolution mass spectrometer (HRMS). Analytical parameters for the PCDD and PCDF determination are given in Table 3-4.
A typical analysis day started with the mass calibration of the mass spectrometer, followed by the analysis of a window defining mix. This solution contains the first and last eluting isomers of a homolog groupand is used to determine the ion switching points needed to switch from monitoring one homolog series to the next. This was followed by the analysis of a low level standard (2.5 pg TCDD to 12.5 pg OCDD). Relative response factors (RRFs) were calculated based on this run and were compared to those RRFs established during the initial calibration. The initial calibration curve consisted of a series of up to eight standards ranging in concentration from 1 to 200 pg/µl 2,3,7 ,8-TCDD. All other 2,3,7,8-substituted PCDDs and PCDFs are included in the calibration standards.
The concentration of each isomer varies with the degree of chlorination. For example, the concentration range for the octachloro isomer is 5 to 1,000 pg/µl. Table 3-5 gives the concentration ranges for each of the isomers in the calibration standards.
Criteria for passing the daily calibration must be within ±20% deviation from the initial RRFs. Following the analysis of the low level standard, a solvent blank (tridecane) was analyzed, then field samples were analyzed in a random order. The day was completed with the analysis of an additional calibration standard to verify instrumental stability.
15

Table 3-40 HRGC/HRMS Operating Conditions for PCDO/PCOF Analysis
Mass Spectrometer
Accelerating voltage: Trap current: Electron energy: Electron multiplier voltage: Source temperature: Resolution:
Overall SIM cycle time:
Gas Chromatograph
Column coating: Film thickness~ Column dimensions: He linear velocity: He head pressure:
Injection type: Split flow: Purge flow: Injector temperature: Interface temperature: Injection size: Initial temperature: Init i al time : Temperature program:
Second hold time: Second temperature ramp:
Final hold time:
Kratos MS 50TC VG ?OS 250 (Batch 1) (Batches 2-5)
8,000 V 500 µA 70 eV 70 eV -1,800 V 280°C > 10,000 (10% - valley defini
1 tion) s 1 s
DB 5 0.25 µm 60 m x 0.25 mm ID - 25 cm/s 1. 75 kg/cm2
(25 psi) Splitless, 45 30 ml/min
s
6 ml/min 210°c 300°c 1-2 µL 200°c 2 min 200° to 270°C at
5°C/min 10 min 270° to 330°C at
5°C/min 5 min
16

,; ,,
Table 3-5. Concentration Calibration Solutions for PCOO/PCDF
Concentration in calibration solutions 1n 29l!!L Compound CSl CS2 CS3 CS4 css CS6 c~, c~a
2,3,7,8-TCOO 200 100 50 25 10 5 2.5 l 2,3,7,8-TCOF 200 100 50 25 10 5 2.. 5 1 1,2,3,7,8-PeCCO 200 100 so 25 10 5 2.5 l 1,2,3,7,8-PeCOF 200 · 100 50 25 10 5 2.. 5 1 2,3,4,7,8-PeCOF 200 100 50 25 10 5 2.5 1 1,2,3,4,7,8-HxCOO 500 250 125 62.5 25 12.5 6.25 2,,5 1,2,3,6,7,8-HxCOD 500 250 125 62.5 25 12.5 6.25 2.5 1,2,3,7,8,9-HxCOO 500 250 125 62.5 25 l2o5 6.25 2.5 li2i3i4i7i8-HxCOF 500 250 125 62.5 25 12.5 6.25 2.5
J r 1,2,3,6,7,8-HxCDF 500 250 125 62.5 25 12.5 6.25 2.5 ( 1,2,3,7,8,9-HxCOF 500 250 125 62.5 25 12.5 6.25 2.5
2,3,4,6,7,8-HxCDF 500 250 125 62.5 25 12.5 6.25 2.5 1,2,3,4,6,7,8-HpCOD 500 250 125 62.5 25 12.5 6.25 2.5 1,2,3,4,6,7,8-HpCOF 500 250 125 62.5 25 12.S 6.25 2o5 1,2,3,4,7,8,9-HpCOF 500 250 125 62.5 25 12.5 6.25 2.5
~ OCOD ·1,000 500 250 125 50 25 12.S 5 rr OCDF 1,000 500 250 125 so 25 12.5 5 l
r:1 !nterna1 Ouantitation rr Standards
l3C12-2,3,7,8-TCOO so so so so so so 50 soi r l3C12-2,3,7,S-TCOF 50 50 so 50 50 50 so 50
tlC 12-l,2,3,7,8-PeCOO so 50 50 50 50 50 50 50 T tJC 12-l,2,3,7,8-PeCOF 50 so so so 50 50 50 50 )\ tlC 12-l,2,3,6,7,8-HxCOO 125 125 125 125 125 125 125 125
13C12-l,2,3,4,7,8-HxCOF 125 125 125 125 125 125 125 125 llC12-l,2,3,4,6,7,8-HpCOO 125 125 125 125 125 125 125 125\
i 13C12-l,2,3,4,6,7,8-HpCOF 125 125 125 125 125 125 125 125 - 13C1 rOCOO 250 250 250 250 250 250 250 250 f
I !nterna1 Reccve~l
Standard
l3C12-l,2,3,4-TCOO so so 50 50 50 50 50 50 t3C 12-l,2,3,7,8,9-HxCOD 125 125 125 125 125 125 125 125
)' -
17

3o3.3 Data Reduction Procedures
Data reduction procedures were primarily conducted using a basic computer program which receives a specially formatted data file as input and outputs an extract concentration. Then, the sample weight, percent lipid, dry weight, or other concentration or dilution factors were taken into account to arrive at a final sample concentration. Limits of detection were determined for each 2,3,7 ,8-substituted isomer in each sample by multiplying the median of nonmatching peaks in a retention time window by 2.5 or by reporting the concentration of a coeluting peak that did not match the qualitative ion ratio criteria for that isomer.
3.3.4 Calculation Theory
During the initial calibration, a series of up to eight standards are analyzed and relative response factors (RRFs) are determined for each native relative to the corresponding 13C-labeled internal quantitation standard (IQS) and for each IQS relative to the recovery standards (RS). The average of the RRFs over all the standards is used in all succeeding calculations to determine sample amounts for a specific isomer.
In the data calculations, the response of the IQS, its known concentration, the response of the native, and the average RRF are used to calculate the concentration of the native isomers in the extract. Since the IQS are affected by the sample matrix and the overall extraction procedure, the calculation procedure adjusts for recovery from the sample matrix.
The recovery standards, which are added to the extract just prior to HRGC/HRMS analysis, are used to determine the absolute recovery of the IQS. The delivery of these two RS compounds in 10 µL of a high boiling sol vent a1so assures the integrity of the sma11 vo1ume of the final extractQ
18

'I
J
SECTION 4.0
RESULTS
This section provides a summary of the sample collection efforts; the raw analytic-al data for the individual sample analysis; the supporting qualitycontra l data from rep1i cates, spikes, and method b1anks; a summary of the tabulated responses from the lifestyle questionnaires; and the results of the statistical analysis of the analytical data.
4.1 Sample Collection
A total of 57 adipose tissue samples were collected, which represented 95% of the collection goal of 60 individual specimens. Of the 57 specimens, 28 (49%) were from males and 29 (51%) were from females (31 of the targeted 40 samples were collected in Los Angeles, while 26 samples were obtained from San Francisco). ·
Table 4-1 provides a synopsis of the samples collected based on age groupdistribution. As noted in Table 4-1, most of the samples collected were taken from individuals in the 50+ age category, while the youngest age category, 12 to 34, provides the fewest number of specimens. Although the youngest age group was targeted at 18 to 34 years, a sample was available from an individual 12 years of age and hence was included in the study.
4o2 Chemical Analysis Results
The chemical analysis results for each of the individual adipose tissue samples are provided in Tables 4-2 through 4-6. These results correspond to the analysis of the samples as five separate batches. These tables providethe raw analytical data for each of the specific 2,3,7,8-substituted PCDD and PCDF analytes. Responses to PCDDs and PCDFs were limited to only the 2,3,7,8-substituted isomerso
Each data table indicates the sex and age of the individual and the city from which the sample was collected. All data are reported on the lipid extractable basis, rather than a wet tissue basis. Concentration data reported on a lipid basis is essential for comparing body burden levels with other existingdata bases or for comparison in future program efforts.
Each table also includes a value termed the 2,3,7,8-TCDD toxic equivalents(TE) value. These values were generated from the TE formula developed by the California Department of Health Services. The TE values are based on the
19

assignment of relative toxicities of 2,3,7 ,8-substituted PCDDs and PCDFs to the 2,3,7,8-TCDO. Compilation of TE values allows a comparison of total PCDD and PCDF residue levels between samples. The TE formula for the 2,3,7,8-substituted PCDDs and PCDFs are giv1:n below. The OCOO and OCDF were not assigned TE values by the Department of Health Services Procedure.
TE Formula {TEF} PCOD PCDF
Isomer TEa Isomer TEa
2,3,7,8-TCDD 1 2,3,7,8-TCDF 1 1,2,3,7,8-PeCDD 1 1,2,3,7,8-PeCDF 1 1,2,3,6,7,8-HxCDD 0.03 2,3,4,7,8-PeCDF 1 1,2,3,7,8,9-HxCDD 0.03 1,2,3,6,7,8-HxCOF 0.03 1,2,3,4,7,8-HxCDD 0.03 1,2,3,7,8,9-HxCDF 0.03 1,2,3,4,6,7,8-HpCDD 0.03 1,2,3,4,7,8-HxCDF 0.03
2,3,4,6,7,8-HxCDF 0.03 1,2,3,4,6,7,8-HpCOF 0.03 1,2,3,4~7,8,9-HpCDF 0.03
a California Department of Health Services, 1986, "Technical Support Document on Chlorinated Dioxins and Furans. Part B. Health Effects. Appendix B. Methods for Inferring Total Potency of a Mixture of PCDDs and PCDFs" (Tables 8-1 and B-2).
Several considerations should be noted for further extrapolation of the data reported herein. All samples were analyzed as blinds in the laboratory and were decoded after reduction of the HRMS data. Each sample was assigned a unique identification (bar code) on receipt., The laboratory identification was used for reference throughout the analysis effortc
The data for the samples analyzed for the first sample batch (Table 4-2) were acquired under slightly different conditions than batches 2 through 5 (Tables 4-3 through 4-6). The difference in the sample analyses for batch 1 pertained to the use of final extract cleanup using a carbon column based on AX-21 on silica gel versus Carbopak C on Celite and HRMS analysis on a Kratos MS-50TC versus the VG 70 250S., As will be described in the statistical analysis section, the detection limits for specific compounds for batch 1 samples tended to be somewhat higher than for the other batches. In particular,this result was noted for the hexa- and heptachlorinated PCDF analytes~ The detection limits for the HxCDF isomers were affected by the presence of coeluting interferences 5 potentially octachlorodiphenylethers. The use of Carbopak C/ Celite cleanup on the samples in batches 2 through 5 removed these interferences completely.
20

Table 4-2 {batch 1) presents the results for the 1,2;3,4,7,8-HxCDD and 1,2,3,6,7,8-HxCDD as a combined value because of the incomplete HRGC chromatographic separation. Sufficient separation of these isomers was achieved in the subsequent analyses of batches 2 through 5, and the data are reported as such. The data for these isomers were combined for batches 2 through 5 for consistency in dealing with the statistical analysis of the data.
Several of the samples were analyzed as duplicates within a batch. The data from the duplicate analyses were averaged, and the average value has been
r reported in the data tables. The samples that were analyzed as duplicates are designated as such in the specific data tables.
4.3 Results of Quality Control Samples
As part of the quality assurance program, several different quality control (QC) samples were analyzed along with the study samples. These QC samplesincluded replicate determinations of more than 10% of all samples to assess method precision, samples fortified with known amounts of specific PCDDs and PCDFs to assess method accuracy, and laboratory method blanks to demonstrate that the laboratory procedures did not contribute to measured levels in the adipose tissue samples.
4.3.1 Replicate Analyses
Replicate analyses of samples included duplicate sample preparation and HRMS analyses of selected study samples and the repetitive analysis of one of the quality control samples identified as a control lipidmatrix. The duplicate analyses of the individual samples provide a measure of within batch method precision, while the repetitive analysis of the control matrix provides a measure of between batch method precision.
Table 4-7 provides a summary of the precision for each PCDD and PCDF analyte from the duplicate analysis (within batch precision) for specificstudy samples. Precision for these analyses are reported as the range percent difference (high value-low value/average value * 100%).Table 4-8 provides a measure of precision f ram the repetitive ana1yses(between batch precision) for the control sample matrix. Prior to this study for ARB, this control matrix has been analyzed previously with five other sample sets as part of a study for EPA 1 s Office of Toxic Substances. As noted in Tables 4-7 and 4-8, the precision of the measurements is good for the analytes that are normally detected in adiposetissues. Estimates of precision have not been calculated for the analytes that were reported as not detected.
4.3.• 2 Spiked Samples
Table 4-9 summarizes the results from the analysis of 10 spiked samplesfortified with known levels of the specific PCOOs and PCDFs. Data reported in Table 4-9 are the calculated recoveries for each of the individual analytes. The spiked samples were generally prepared from the control sample matrix, although duplicate spiked samples were prepared
21

from an actual study sample of batch 1. The method recoveries (accuracies) were calculated for a specific compound as the difference of the value between the spiked sample and the control sample divided by the known spiked amount. As noted in Table 4-9, the method accuracies for all compounds are well documented. In some instances, the spiked level was not substantially greater than the level in the control to allow an effective measure of recovery.
4.3.3 Laboratory Method Blanks
The results of the analysis of the laboratory method blanks that were prepared and analyzed along with the study samples demonstrated that there was no contribution of PCDDs or PCDFs from the laboratory reagents or glassware. The results of the analyses of these method blanks are critical with respect to supporting the identification of compounds in the adipose tissues, particularly those with concentrations in the 1 to 10 pg/g level.
4.3.4 Recoveries of Internal Quantitation Standards
The method recoveries for the nine internal quantitation standards were monitored for each of the samples analyzed. Data for the individual recoveries in each sample are presented in Appendix E of this report. It should be noted that the concentrations of the PCDD and PCDF residue levels have been corrected for these method recoveries based on the calculation procedures used. As noted in Appendix E, the method recoveries are fairly consistent across all samples for a given internal quantitationstandard.
4.4 Summary of the Lifestyle Questionnaire Results
Responses to the full lifestyle questionnaire were achieved from 44 of the 57 individuals included in this study (31 out of 41 Los Angeles residents and 13 out of 26 San Francisco residents). A copy of the blank questionnaire is included in Appendix A. For the remaining 13, only partial patient information provided by the hospital (i.e., first page of questionnaire) was availab le. The questionnaire results are presented in two parts, First, the answers to the questions completed by hospital personnel are summarized in a series of tables. Next, a summary of the answers to the questionnaire obtained from the 44 donors is presented. The question numbering is identical to that used in the questionnaire.
4.4.1 Patient Data Statistics (Questions 1 through 11)
Of the 11 questions completed by hospital personnel, statistics on a selected number of them are presented below in Table 4-10, anatomical origin of adipose tissue sample; Table 4-11, race of donor; Table 4-12, height of donor; Table 4-13, weight of donor; and Table 4-14, skinfold caliper measurements. The data in Tables 4-10 and 4-11 are shown in the design cells determined by city and sex; data in Tables 4-12 through 4-14 are shown by sex and age group.
22

4.4.2 Questionnaire Data Summary (Questions 12 through 32)
The donors were asked to fil 1 out a set of questions structured into three categories. The following summarized the donors I answers within each set of questions.
Residential History Information (Questions 12 through 17)
Thirty-one Los Angeles donors presently 1ive in 28 different zipcodes. Slightly over half of them (17) have been living at their present zip code for at least 5 years. Of the 14 residents who have relocated within the last 5 years, 7 have relocated from within Los Angeles, 2 from out of state, and 5 could not remember their previous zip code.
Thirteen San Francisco donors presently live in 11 different zipcodes. Most of them (83%) have been living at their present zipcode for at least 5 years. Only two have relocated within the city limits in the last 5 years.
The donor I s current residency or workp1ace with respect to the vicinity (within 5 miles) of various potential sources of PCDD and PCDF contamination is summarized in Table 4-15.
Similar information could be gathered for those residents (11 in Los Angeles and 2 in San Francisco) who have relocated within the last 5 years. The results are shown in Table 4-16.
Potential Chemical Exposure Information (Questions 18 through 25)
Information on potential chemical exposure on the job or in and around the home during the last 5 years or during service in Vietnam was obtained from most of the 44 respondents. The data are summarized in Table 4-17.
Occupational History Information (Questions 26 through 32)
Only data from · answers to questions on types of occupationsrelevant to this study, that is, occupations that involve potential chemical exposure, were summarized here. Table 4-18 follows the outline of the questionnaire on pages 6 and 7.
4.5 Statistical Data Analysis
4.5.1 General Results
A total of 57 specimens were collected from both cities. The distribution of the specimens across the design cells is shown in Table 4-19. The 57 specimens were analyzed in 5 batches as follows:
r I I
23

Batch 1: 17 Los Angeles specimens Batch 2: 10 Los Angeles and 6 San Francisco specimens Batch 3: 7 San Francisco specimens Batch 4: 2 Los Angeles and 7 San Francisco specimens Batch 5: 2 Los Angeles and 6 San Francisco specimens
Ideally, the specimens would have all been collected first, then randomly assigned to the batches to circumvent a potential confounding effect of the batch and city factors. Because of collection difficulties, however, the samples were analyzed as they arrived, resulting in the above assignment. This potential problem has been investigated throughout the statistical analyses performed on the concentration data.
The 57 specimens were analyzed for the presence and levels (pg/g) of the 17 compounds listed below:
Ref. No. Compound
1 2,3,7,8-TCDF 2 2,3,7,8-TCDD
3 1,2,3,7,B-PeCDF 4 2,3,4,7,8-PeCDF 5 1,2,3,7,8-PeCDD
6 1,2,3,4,7,8-HxCDF 7 1,2,3,6,7,8-HxCDF 8 2,3,4,6,7,8-HxCDF 9 1,2,3,7,8,9-HxCDF
10 1,2,3,4,7,8-1,2,3,6,7,8-HxCDD 11 1,2,3,7,8,9-HxCDD
12 1,2,3,4,6,7,8-HpCDF 13 1,2,3,4,7,8,9-HpCDF 14 1,2,3,4,6,7,8-HpCDO
15 OCDF 16 ocoo
Table 4-20 presents the overall results on the occurrences of compounds in the individual specimens. The distribution of nondetects and detects varies between cities as shown by the percentage figures for Los Angeles and San Francisco.
Figure 4-1 is a bar chart summary of the proportions of nondetects for each compound in the following five categories:
a. Batch 1, i.e., Los Angeles samples only (17 samples) b. Batches 1+2+4+5, Los Angeles samples only {31 samples) c. Batches 2+4+5, Los Angeles samples only (14 samples)
24

d. Batches 2+3+4+5, San Francisco samples only {26 samples) eo All 57 samples
The higher. occurrence of nondetects in the Los Angeles samples versus the San Francisco samples is mostly due to a high occurrence of nondetects in batch 1. The Los Angeles samples in batches 2, 4, and 5 show a similar pattern in percent nondetects as do the San Francisco samples.
The compounds, ordered by the percent of specimens with detectable (positive quantifiable, PQ) levels, correspond to the compounds that are most often cited in other studies related to human body burdens of PCDDs and PCDFs.
% PQ in 57
Compound specimens
0CDD 100 1,2,3,4,6,7,8-HpCDD1,2,3,4,7,8/1,2,3,6,7,8-HxCDD1,2,3,7,8-PeCDD
100 100 95
2,3,7,8-TCDD 93 2,3,4,7,8-PeCDF 89 1,2,3,7,8,9-HxCDD 88 1,2,3,4,7,8-HxCDF 86 1,2,3,4,6,7,8-HpCDF1,2,3,6,7,8-HxCDF
82 79
2,3,7,8-TCDF 77 2,3,4,6,7,8-HxCDF 70 0CDF 58 1,2,3,7,8-PeCDF 23 1,2,3,4,7,8,9-HpCDF1,2,3,7,8,9-HxCDF
19 9
4.5.2 Statistical Analysis of the Concentration Levels
The objective of the statistical analysis of the levels of the compoundsin the 57 specimens is twofold: first, to determine whether the l eve1s between Los Angeles and San Francisco, between males and females, and among age groups are statistically different; and second, to calculate average concentration levels and their confidence intervals for the 12 design cells determined by the survey design. If some or all factors (i.e., city, sex, or age group) are found to be nonsignificant, then the cells can be collapsed and statistics computed across larger cells.
Data Transformation and Calculations
Prior to computing mean concentration levels in the design cells, the data were analyzed to examine the shape of their distribution. It was found that the concentrations followed approximately
25

a lognormal distribution, with most of the ·levels in the lower concentration range and a small proportion in the higher concentration rangeo Taking this fact into account, the concentration data were first log-transformed; the analyses performed on the log scale; and the results transformed back to the original scale bytaking the antilog, that is, using the exponential function. Thus the average results are reported as the geometric mean rather than the arithmetic mean. {The antilog of the mean of the log concentrat i ans is the geometric mean of the untransfarmed concentrations.)
For any cell defined by a given combination of the design factors, the geometric mean concentration and its lower and upper 95% confidence limits were calculated for each compoundo The confidence limits were computed as follows.
In a given eel 1, let Y be the average of the log-transformed concentration levels and SEy be the standard error of the mean, Y. Then a 95% confidence interval for Y, [LLy,ULy], is given by:
[Lly, Uly] = [Y - too025,{n-l)*SEy, y + ta.025,(n-l)*SEy]
where t 0_025 , {n-l) is the 2. 5th-percentile of the t-di stri but ion with n-1 degrees of freedom, where n is the number of samples used to compute the mean, Y. This interval will be on the log scale.
Next, for that cell, the geometric mean, X, of the concentration levels is obtained by taking the antilog of the mean, Y,
X = exp{Y)
To obtain a 95% confidence interval for X, [Llx, Ulxl, simply take the antilog of Lly and Uly,
[Llx, Ulx] = [exp(Y - ta 0 025,(n-l)*SEy), exp(Y + ta.02S,(n-l)*SEy)]
These values will be on the original concentration scale. Note that the confidence interval for the geometric mean, X, will not be symmetrical around X.
Data Set Used for Computation of Average Levels
Based on the high occurrence of nondetects in batch 1 samples as compared to batches 2, 3, 4, and 5, only results above detection limits were included into the analyses. Also, since the detection limits obtained on batch 1 are generally higher than those obtained from the other four batches, using the limit of detections whenever the level of a compound is below detection limit would bias the average concentrations for Los Angeles towards the high side. On the other hand, substituting zero for those concentrations below detection limit would bias the average results for
26

.1
r
Los Angeles towards the low side because of the high proportion of nondetect Los Angeles sampleso
In summary, to eliminate the effect of batch 1 results on overall statistics, it was decided to only include detected concentrations (PQs) in the analysis. This approach resulted in a drastic reduction in the Los Angeles sample size for the majority of the compounds (see Table 4-20). In addition, interferences were frequently experienced for 1,2,3,4,7,8- and 1,2,3,6,7,8-HxCDF in batch 1. Therefore, for those two compounds, all batch 1 results were excluded from all subsequent analyses of variance. However, detected concentrations from batch 1 are included in all tabulated statistics (Tables 4-21 through 4-26).
Analysis of Variance
Analysis of variance was performed -on the log-transformed concentrations for each compound individually. The main factors considered were city (two levels), sex (two levels}, and age group(three levels}. All two-way interactions, i.e., city by sex, cityby age group, and sex by age group, were introduced in the model, if permitted by sample sizes for a given compound. In a first pass-through analysis of variance, all three two-way interactions were included in the general linear model whenever adequate samplesizes allowed it. Appropriate two-way interactions were excluded in the case of empty design cells. The significance of main factors and interactions was based on the probability level associated with the partial sums of squares in each model. All analyses were performed using Type IV sums of squares from the PROC GLM in SAS (Statistical Analysis System).
In the case of a significant main effect but no other significantfactors or interactions (this only occurred once), a second analysis of variance was performed using only that significantfactor. In the case of a significant interaction but no other significant sources of variation, the analysis was performed again to evaluate the effect of one factor within each level of the second factor. (This situation only occurred once.) A 5% significance level was chosen a priori for all analyses.
An analysis of variance was performed for each of the following cases and concentration means, and their 95% confidence limits were calculated:
1. Within each cell defined by city, sex, and age group, that is, 12 cells for each compound. These results are shown in Table 4-21.
2. After collapsing the data across age groups, within each cell defined by city and sex, that is, four cells per compound.These results allow for comparisons of all male versus female
27

levels within a city, regardless of age groupo These results are shown in Table 4-22.
3. After collap$ing the cells further across sex, within each city, that is, two cells per compound. Mean differences in concentration levels can thus be compared between cities. The results are shewn in Table 4-23.
4. After collapsing the first table (item 1) across cities, within each cell defined by sex and age group, that is, six cells per compound. These results allow for age group comparisons within each sex. The results are shown in Table 4-24.
5. After further collapsing across sex in the table from item 5, within each age group, that is, three cells per compound. These results allow for comparisons between age groups, across cities and sex. The results are shown in Table 4-25.
6. Across all design cells, that is, an overall mean concentra-tion level for each compound. The results are shown in Table 4-26.
Discussion
Of all 16 analyses of variance (ANOVA) including main effects and two-way interactions, only one, for 1,2,3,4,7,8/1,2,3,6,7,8-HxCDD, was significant at the 95% confidence level. The second highest F-statistic was obtained for 1,2,3,7 98,9-HxCDF; however, detectable levels of this compound were obtained from only • 5 specimens. The probability levels associated with the overall F-statistic for the remaining 14 analyses ranged from 0.31 to 0.88. Table 4-27 summarizes the ANOVA results.
The significant sex effect for 1,2 9 3~7~8-PeCDF was considered to be inconclusive for two reasonso First 9 the sample size of 13 (23% of total) specimens with detectable levels is relatively sma11 • Second, the 1evels detected were close to the average detection 1imit (0.894 pg/g) for that compound. (The maximum detected level of 1,2,3,7,8-PeCDF is 1.93 pg/g, and the geometric mean of the 13 concentrations above LOO is 00557 pg/g.)
Because of the very small sample size of 5 specimens, the significant age effect on 1,2,3,7,8,9-HxCDF was discounted as well.
A one-way analysis of variance to determine the effect of age group on 1,2,3,4,7,8/1,2,3~6,7,8-HxCDD concentration levels showed that concentration levels significantly increase with age, regardless of sex or city (p-value of 0.05). The means in the three age categories are 51.0, 60.7, and 79.0 pg/g, respectively. The means
28

r from the youngest and oldest age groups are statistically different from each other; however, the remaining two pairwise comparisons (middle group vs. youngest or oldest) are not significant. Because of the small number (7)· of young people, the specimens were grouped into two age categories, below and above 50 years. The analysis of variance provided again a significant age effect (p = 0.02), with an average concentration in the below 50 group (sample size of 27) of 58.l pg/gas compared to an average of 79.0 pg/g for the older group (sample size of 30).
The only significant interaction, city by sex, was found for OCDD. In that case, average concentration levels were significantly higher (p = 0.02) for San Francisco women (634 pg/g,17 specimens) than for Los Angeles women (407 pg/g, 11 specimens). However, average concentration levels in men did not varybetween the two cities (377 pg/g from 9 specimens in San Francisco and 387 pg/g from 20 specimens in Los Angeles).
Comparing average female vs. male OCDD levels within each cityprovided no significant differences between sexes, neither in San Francisco (p = 0.16) nor in Los Angeles (p = 0.26).
In San Francisco, women have higher OCDD levels than men, with average OCDD levels of 634 pg/g from 17 San Francisco women and 482 pg/g from 9 San Francisco men. The nonsignificant difference between these two results is due to the large variability in concentration levels and unequalsample sizes. A relative ratio of 1.48 of female to male results would be necessary to show a significant difference at the 95% confidence level. The ratio of the results here is 1.04. ·
In Los Angeles, men have higher OCDD levels than women, with average OCDD levels of 518 pg/g from 20 men and 407 pg/g from 11 women. This difference is not statistically significant,however. A relative ratio of 1.53 of male to female OCDD levels would be necessary to find a significant difference. In this case, the ratio of male to female OCDD levels is 1.04, the exact inverse of the ratio from San Francisco specimens.
In summary, aside from a significant age effect for 1,2,3,4,7,8/1,2,3,6,7 ,8-HxCDO and a significant city by sex interaction for OCDD (all specimens had detectable levels in both cases), none of the factors considered in the survey design--city, sex, and age group--were statistically significant at the 5% level. Thus there is no statistical evidence that mean concentration levels differ between cities, sexes, age groups, or combinations thereof, for the majority of the compounds.
29

Data from other studies reported in the literature are presentedin Section 5.0 for comparison of the data generated in the ARBsponsored program. The statistical treatment of the data from the 57 samples has not demonstrated consist~nt significant effects across all compounds with respect to age, sex, or geographical region. Some of the studies report (in Section 5.0) "significant differences" based on age and/or sex. However, a correlation of the data from other studies with the data from this ARB program has not been conducted at this time.
Additional Considerations/Recommendations
The concentration data have been analyzed individually for each compound. However, correlations between compounds exist and have not been considered here. One cou1 d investigate poss i b 1 e rel ati onshi ps between age groups or sex, and the levels of all detected compounds by means of a multivariate analysis approach. The results from a series of principal component analyses and cluster analyses could possibly indicate some clustering of the specimens by their age or sex, or both, when considering all compounds simultaneously. Auxiliary variables, such as height and weight, or a derived measurement, such as body mass index, could also be considered to underline differences should they exist.
The questionnaires filled out by the patients who donated the specimens did not provide enough relevant information on most of the patients to include these results in the analysis.
30

, ... -..:..;::_·- """'7=., -\ ) :...._--:.-1 ,-:::, .....;.;;.:_,., r-J--:,;..~ ;,....::...-.....)--J:;;.j ,..-- "".,,- ...... JT.a,:;_.o=W~ -, ,,.,.-
,-:-,:__--,--_-_, ---.--.'..\ r-~ ~--_--::;;, r=----=•1
HISTOGRAM OF NONDETECTS Based on 57 specimen results
en +-' u Q)
Q) -"O
w C I-' 0 z
~ 0
100%
90%-
80%-
70%-
60%-
50%-
40%-
30%-
20%-
10%-
0%
~
e
lit -~
~ -:■-
~
I 7l I I II 7
L:::J Batch 1 - LA Only
.AIILA '1,,
~ Batches 2, 4, and 5 LA Only
~All SF ,.
E:::::::! All Data
..
I
I J
ii~:I Ill ~ II uII '11:lf:f
J, IllNA•J 1-:fl~ ~ ~lfl I 1 2 3 4 5 6 7 8 9 10 11 12 13 14 15 16
Compound No.
Figure 4-1. Incidence of nondetects for each PCOD and PCDF compound on a batch basis. The reference to compound number is given in Section 4.5.1 of the text.

Table 4-L Age Group Distribution of Adipose Tissue Specimens
San Francisco Los Angeles Overall No. of %of No. of %of No. of %of
Age specimens goal specimens goal specimens goal
12-34 1 25 6 50 7 44
35-49 13 163 7 50 20 91
50+ 12 150 18 129 30 136
32

::::-.:;-~ l p--,-_ ,'.::...---. r ~- '-4 ,::..___:_.__,_-~ -:u----.., p ...--,~1 r,;;..._--F~::.::i !___;__ ,, ' ,,-
Table 4-2. Lipid Adjusted Concentrations (pg/g) of PCDDs and PCDFs in Human Adipose Tissues--Batch 1
S::X NJE CITY
Female 59 LA
Male 50 LA
Female 42 LA
Female 52 LA
Female 59 LA
Female 44 LA
Male 49 LA
Male 33 LA
Female 88 LA
Female 46 LA
COvR)LNI)
w w
2378 TCDF 2378 TCDD 12378 PECDF 23478 PECDF 12378 PECDD 123478 HXCDF 123678HXCDF 234678 HXCDF 123789 HXCDF 123478 HXCDD/ 123678 HXCDD * 123789 HXCDD 1234678 HPCDF 1234789 HPCDF 1234678 HPCDD oca= 00])
ND(1.12) 3.02
ND(2.22) 9.15 11.0
ND(9.90) ND(9.72) ND(11.6) ND(12.6)
75.4 11.0 4.48
ND(2.30) 22.0
ND(3.96) 338
ND(0.71) ND(1.30) ND(2.92)
6.66 7.81
ND(7.24) ND(7.11)
10.5 ND(9.24)
40.3 ND(4.42) ND(19.7) ND(28.1)
31.6 ND(1.19)
199
ND(1.83) 2.52
ND(2.32) 6.72 4.24 3.55
ND(1.47) ND(1.61) ND(1.38)
41.7 4.93
ND(5.74) ND(3.29)
58.3 ND(2.02)
695
ND(1.74) 2.46
ND(0.70) 2.11 3.55
ND(3.90) ND(3.83) ND(4.55) ND(4.97)
21.9 22.5 6.37
ND(1.53) 49.9
ND(0.68) 374
1.45 6.77
ND(0.74) 13.2 12.1 1.69 1.83
ND(1.32) ND(1.44)
64.9 8.63
ND(7.24) ND(10.3)
151 ND(1.83)
749
ND(2.27) 2.31
ND(0.75) 11. 1 7.97 7.20 2.02
ND(1.29) ND(1.41)
46.6 6.41
ND(150) ND(6.90)
36.1 ND(7.95)
455
ND(1.89) ND(1.21) ND(0.31)
4.62 4.97
ND(4.10) ND(4.03) ND(4.79) ND(5.23)
20.1 15.7
ND(729.) ND(4.96)
177 ND(0.54)
572
2.34 4.33
ND(2.32) 8.37 5.03
ND(12.5) ND(12.3) ND(14.6) ND(16.0)
56.1 ND(11.8) ND(7.30) ND(7.00)
57.3 ND(2.61)
350
2.61 8.55
ND(3.31) 25.3 24.9
ND(17.1) ND(4.26) ND(5.06) ND(5.33)
114 12.2
ND(7.31) ND(5.38)
75.4 ND(5.66)
415
ND(0.60) 7.34
ND(0.46) ND(0.42)
39.1 5.64
ND(2.61) ND(3.11) ND(3.39)
27.8 ND(10.7)
7.66 ND(3.75)
51.0 ND(0.88)
437
2378 TCDD Toxic Equivalent 26.6 16.9 16.7 11. 1 40.4 24.3 16.0 23.5 67.4 49.2
* - Sum of 123478 and 123678 HXCDD isomers
Note: 2378-TCDD toxic equivalents based on the California Department of Health Services Procedure.
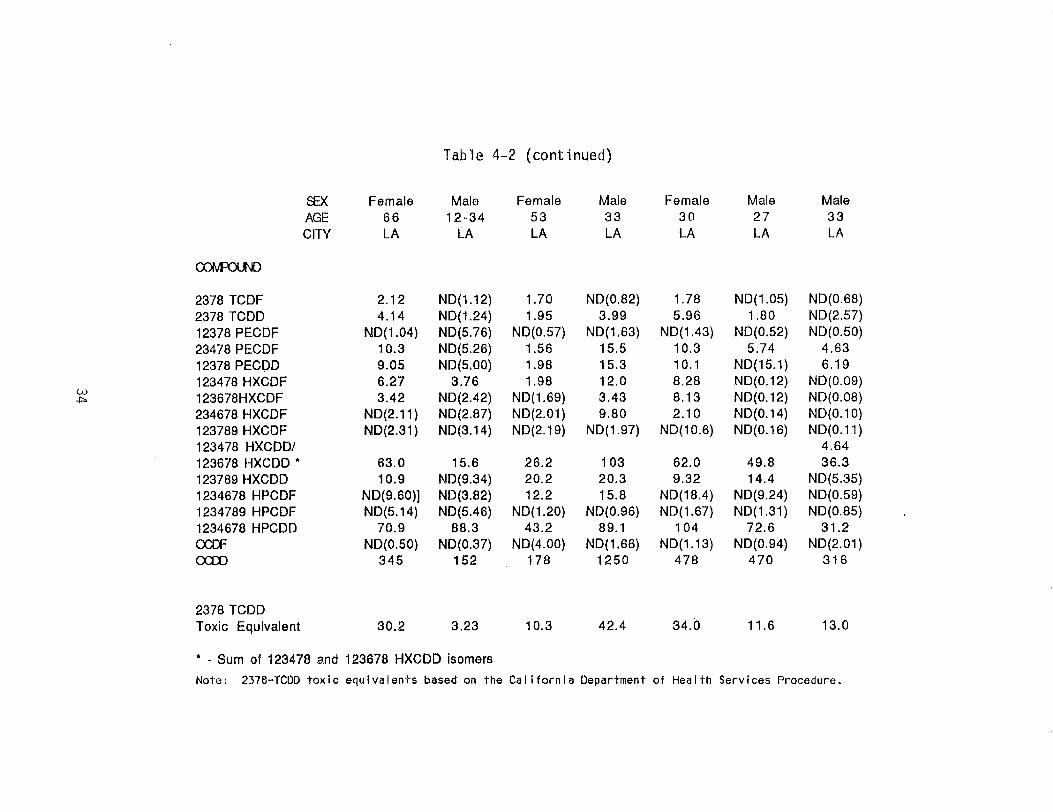
Table 4-2 (continued)
EE)( Female Male Female Male Female Male Male Af3E 66 12-34 53 33 30 27 33 CITY LA LA LA LA LA LA LA
COWR)U\()
2378 TCDF 2.12 ND(1.12) 1.70 ND(0.82) 1.78 ND(1.05) ND(0.68) 2378 TCDD 4.14 ND(1.24) 1.95 3.99 5.96 1.80 ND(2.57) 12378 PECDF ND(1.04) ND(5.76) ND(0.57) ND(1.63) ND(1.43) ND(0.52) ND(0.50) 23478 PECDF 10.3 ND(5.26) 1.56 15.5 10.3 5.74 4.63 12378 PECOD 9.05 ND(S.00) 1.98 15.3 10. 1 ND(15.1) 6.19 123478 HXCDF 6.27 3.76 1.98 12.0 8.28 ND(0.12) ND(0.09)
w ..i:,. 123678HXCDF 3.42 ND(2.42) ND(1.69) 3.43 8.13 ND(0.12) ND(0.08)
234678 HXCDF ND(2.11) ND(2.87) ND{2.01) 9.80 2.10 ND(0.14) ND(0.10) 123789 HXCDF ND(2.31) ND(3.14) ND(2.19) ND(1.97) ND(10.6) ND(0.16) ND(0.11) 123478 HXCDD/ 4.64 123678 HXCDD * 63.0 15.6 26.2 103 62.0 49.8 36.3 123789 HXCDD 10.9 ND(9.34) 20.2 20.3 9.32 14.4 ND{S.35) 1234678 HPCDF ND{9.60)) ND(3.82) 12.2 15.8 ND(18.4) ND(9.24) ND(0.59) 1234789 HPCDF ND(5.14) ND(5.46) ND(1.20) ND{0.96) ND(1.67) ND(1.31) ND{0.85) 1234678 HPCDD 70.9 88.3 43.2 89.1 104 72.6 31.2 cx::a= ND(0.50) ND(0.37) ND(4.00) ND(1.66) ND(1.13) ND(0.94) ND(2.01) ax:o 345 152 178 1250 478 470 316
2378 TCDD Toxic Equivalent 30.2 3.23 10.3 42.4 34.0 11.6 13.0
* - Sum of 123478 and 123678 HXCDD isomers
Note: 2378-TCDD toxic equivalents based on the Cal lfornla Department of Health Services Procedure.

...,:-..L.,-~-,( -::-=-~-, r 0 ·,·-::-~7 ,----_-; r-:=----~ ,,---, -·1 I --=--~-~ 1_;:....-=- C::. 1 -....:..:.--~ 1'"'=-=.r;;;-"" ,-;:....·-+µ:;..I} r.c.. _c,r ~ r -~ • ~ ,,.,,,,- r-=· :7
',
Table 4-3. Lipid Adjusted Concentrations (pg/g) of PCDDs and PCDFs in Human Adipose Tissue--Batch 2
SEX Male Male * Male Male Male * Male Male Male AGE 50 + 50 + 50 + 50 + 50 + 50 + 12-34 35-49 CITY LA LA LA LA LA LA LA LA
CO\AFOUND
2378 TCDF 1.22 6.49 1.76 1.15 0.976 1.1 0.634 0.961 2378 TCDD 3.62 4.46 6.07 2.65 1.98 5.99 2.46 3.78 12378 PECDF ND(0.59) ND( 0.67) ND(0.23) ND( 0.21) ND( 0.81) ND( 0.20) ND( 0.73) 0.35 23478 PECDF 4.89 5.96 5.13 5.28 4.8 2.79 2.7 5.11 12378 PECDD 8.85 7.98 13.3 7.7 6.3 13.6 ND( 5.95) 10.8 123478 HXCDF 6.95 5.4 16.7 4.16 5.17 7.13 4.82 7.55w
u, 123678 HXCDF 4.55 2.92 8.85 2.43 2.96 12.7 2.89 4.18 234678 HXCDF 0.772 0.715 3.15 0.885 0.733 ND(1.5) 1.37 2.08 123789 HXCDF 0.557 ND( 0.74) ND(0.40) ND( 0.24) ND( 1.17) ND(1.5) ND( 1.83 ) ND( 0.46) 123478 HXCDD 13.1 7.25 21.4 7.65 6.4 * * 7.88 18.4 123678 HXCDD 77.1 57.2 116 57.8 63.7 154 44.5 69.4 123789 HXCDD 9.21 4.47 15 5.07 6.12 ND(1.50) 4.79 10.5 1234678 HPCDF 6.07 4.82 25.8 5.73 8.52 12.1 8.85 9.72 1234789 HPCDF ND(0.36) ND (0.32) 0.733 ND( 0.45) 0.38 ND( 2.97} ND(0.16) ND( 0.57) 1234678 HPCDD 84.2 35.8 181 35.4 36.4 290 74.8 154 oca= 0.668 0.836 1.37 ND(0.54) 0.911 0.891 0.946 0.988 OCDD 766 275 1320 237 880 885 304 1060
2378 TCDD Toxic Equivalent 24.7 28.4 37.9 20.4 18.0 37.8 10.3 29.3
* - mean of duplicate sample preparations and analyses **- 123478 HXCDD summed with 123678 HXCDD
Note: 2378-TCDD toxic equivalents based on the California Department of Health Services Procedure.

Table 4-3 (continued)
SEX Male Male Female Male Female Male Male Male AGE 42 42 51 50 52 58 76 55 CITY LA SF SF SF SF SF SF LA
Gav1FDUND
2378 TCDF 0.868 0.898 2.58 ND( 2.26) 0.97 2.28 3.18 ND(1.57) 2378 TCDD 3.87 3.49 3.94 3.8 4.35 9.33 5.6 4.38 12378 PECDF ND(0.62 ) ND( 0.87) ND(0.16) ND(0.67) ND(0.12) ND(0.09) ND(0.64) ND(0.92) 23478 PECDF 15.3 6.61 3.48 ND{0.71) 2.99 0.726 6.83 4.41 12378 PECDD 9.05 12.3 7.71 12.6 11 .8 25.2 1 5 9.52
w CJ'\ 123478 HXCDF 12.6 17.3 7.22 6.32 7.39 11 .2 7.89 8.10
123678 HXCDF 4.24 5.53 4.06 4.13 4.02 7.42 5.41 4.08 234678 HXCDF 0.906 ND( 1.13) 1.27 1.35 0.826 4.41 1.55 1.44 123789 HXCDF ND( 0.11) ND( 2.34) ND(0.36 ) ND( 1.08) 0.643 ND( 1.17 ) ND(0.85) ND( 0.50) 123478 HXCDD 7.33 10.9 8.37 11.5 8.79 38.3 9.8 13.8 123678 HXCDD 47.7 68.8 52.2 71.6 74.2 126 88.5 80.3 123789 HXCDD 6.15 7.21 8.02 9.57 6.05 13.3 6.95 9.89 1234678 HPCDF 8.2 6.48 8.54 7.83 9.27 10.5 8.66 8.71 1234789 HPCDF ND( 0.25) ND( 0.55) ND(0.27) ND(0.24) ND(0.33) ND(0.23) 0.743 ND(0.12) 1234678 HPCDD 39.5 62.7 69 80.3 34.3 297 72 129 oca= 0.857 ND(0.68) 0.78 ND(1.61) 1.00 0.838 ND( 1.3 ) 0.942 occo 341 304 760 469 336 774 669 757
2378 TCDD Toxic Equivalent 32.9 28.7 22.5 22.2 24.5 52.8 36.7 26.0
Note: 2378-TCDD toxic equivalents based on the Cal ifornla Department of Health Services Procedure.

' , '"- -:= -:::i_ ,I--_; -I --.--=---, I::..."=--"' ,-·=::,1--:::;:,:_; P~~.:Ji /1---~p-~ ..-=,-=-,-·-•-, P' J"i, \ ,=-_- f ___:_ .,~ ,__c...:c.=--=---::---7
Table 4-4. Lipid Adjusted Concentrations (pg/g) of PCDDs and PCDFs in Human Adipose Tissue--Batch 3
SEX Female Male Female Female Male Male Female * AGE 37 39 43 43 65 65 65 CITY SF SF SF SF SF SF SF
CCMPOUND
2378 TCDF 1.19 2.13 2.31 3.88 1.82 1.48 1.01 2378 TCDD 7.08 4.03 3.48 3.37 4.84 4.40 5.89 12378 PECDF ND( 0.45) 0.464 ND( 0.37) 0.372 ND(0.19) 0.257 ND(0 .10) 23478 PECDF 3.41 2.74 2.68 2.6 ND( 0.55) 1.12 3.95 12378 PECDD 15.1 8.85 8.24 8.51 9.59 9.56 13.0
w 123478 HXCDF 13.5 6.34 4.67 5.65 5.12 5.73 6.14 -..J 123678 HXCDF 6.72 3.89 2.82 3.5 3.51 3.04 3.61
234678 HXCDF 3.27 1.42 1.60 1.13 1.18 0.674 0.528 123789 HXCDF ND( 0.10) ND( 0.12) ND( 0.62) ND( 0.10) ND(1.35) ND(0.57) 0.742 123478 HXCDD 22.6 9.17 10.3 * * 7.46 11.0 10.5 123678 HXCDD 92.3 56.8 47.7 56.6 50.2 57.6 71.5 123789 HXCDD 15.2 7.17 6.61 5.00 4.90 6.20 7.40 1234678 HPCDF 20.2 11.5 5.03 4.84 7.55 7.35 5.28 1234789 HPCDF ND( 0.60) 0.443 0.341 0.236 ND( 0.17) ND(0.46) 0.34 1234678 HPCDD 334 83.2 120 42.2 60.6 65.9 44.0 OCDF 0.847 0.918 0.675 0.435 0.864 1.01 0.486 ccoo 1230 397 773 137 359 410 923
2378 TCDD Toxic Equivalent 42.0 23.6 22.7 22.3 20.5 21.5 28.4
* - mean of duplicate sample preparations and analyses **- 123478 HXCDD summed with 123678 HXCDD
Note: 2378-TCDD toxic equivalents based on the California Department of Health Services Procedure.

Table 4-5. L1pid Adjusted Concentrations (pg/g) of PCDDs and PCDFs in Human Adipose Tissue--Batch 4
SEX Female • Female Female Female Female Male Male Male Male AGE 35-49 44 35-49 35-49 63 50 + 35-49 50 + 50 + CITY SF SF SF SF SF SF SF LA LA
2378 TCDF 1.22 2.73 5.36 1.29 3.35 1.82 3.58 2.10 2.28 2378 TCDD 2.25 11.8 3.76 4.11 12.5 6.06 5.45 3.22 4.40 12378 PECDF ND(0.39) ND( 0.49 ) ND( 0.58) ND( 0.62) 0.876 ND(0 .23) 0.305 ND( 0.19) 0.278 23478 PECDF 3.13 15.0 ND(0.58) 2.83 24.1 13.7 11.3 6.02 7.74 12378 PECDD 4.36 21.4 5.60 13.0 24.9 12.9 8.63 5.63 9.28 123478 HXCDF 4.30 11.2 4.26 4.27 17.2 7.61 5.72 6.38 7.13 123678 HXCDF 2.42 6.50 2.79 2.30 11. 9 5.23 3.78 3.64 4.64 234678 HXCDF 0.97 1.84 ND( 1.46) 0.741 4.28 0.865 2.38 0.932 0.619
w 123789 HXCDF ND (0.28) ND(0.16) ND(1.46) ND(0.11) ND(0.13) ND( 1.51) ND( 0.37) 0.942 ND( 0.46) Q:_) • •123478 HXCDD 6.84 22.8 10.0 25.1 11. 0 10.7 6.07 9.80
123678 HXCDD 31.8 83.6 44.0 94.7 124 95.4 57.0 49.3 64.6 123789 HXCDD 6.02 17.7 ND( 4.9) 31. 7 22.2 11.8 6.76 6.97 9.13 1234678 HPCDF 12.4 11.2 8.50 4.08 20.2 6.12 5.94 9.38 6.26 1234789 HPCDF ND( 0.97) ND( 0.35 ) ND( 1.46) ND(1.54) 0.633 ND( 0.55 ) ND( 0.42) ND( 0.16 ) ND( 0.21 ) 1234678 HPCDD 79.4 158 92.2 203 317 51.3 109 53.0 33.0 oc..a= 0.95 0.782 0.917 0.586 0.699 0.518 0.379 0.275 0.405 ocm 548 915 728 376 949 676 481 458 521
2378 TCDD Toxic Equivalent 15.3 60.3 19.3 31.8 82.0 40.2 35.3 21. 1 28.0
* - mean of duplicate sample preparations and analyses ••- 123478 HXCDD summed with 123678 HXCDD
Note: 2378-TCDD toxic equivalents based on the California Department of Health Services Procedure.

I · .. .a.- ! ,--=.---7r~_:; -~----i r.:-i-c,~-, ;::--.. r----=::-~·:.i -~--:- r_::_.---~ 1--..:..--:----•-1 r~• ,- ~,.--------i ,:.1:::.~1 1---=--,=~ .G.J ... -=..:r..---, ,,-:.:::r.rr~, 1 ----, ,- -=- l ' ~
Table 4-6. Lipid Adjusted Concentrations (pg/g) of PCDDs and PCDFs in Human Adipose Tissue--Batch 5
SEX Male Male Female Female Female Female Female Female • AGE 50+ 50+ 32 42 39 35-49 50 + 50 + CITY LA LA SF SF SF SF SF SF
COv1POUND
2378 TCDF 2.67 4.46 2.84 5.22 3.21 1.98 2.35 3.10 2378 TCDD 6.25 9.34 6.29 5.79 6.6 10.2 7.45 5.94 12378 PECDF ND( 0.48) 0.472 0.591 1.93 1.57 1.04 ND( 0.22) 0.495 23478 PECDF ND( 2.85 ) 14.0 9.17 6.02 9.82 12.5 19.3 15.2 12378 PECDD 12.6 16.6 7.84 10.7 13.2 18.1 15.8 12.3
w I.O 123478 HXCDF 9.53 15.7 10.1 9.73 11. 7 11.6 12.9 7.92
123678HXCDF 6.29 10.7 5.63 6.53 6.56 7.31 8.93 5.61 234678 HXCDF 2.70 1.86 1.96 2.46 1.22 1.37 2.28 2.39 123789 HXCDF ND( 0.13) ND( 1.69) 0.155 ND( 1.65) ND( 0.26) ND( 1.67) ND(0 .21 ) ND(0.94) 123478 HXCDD 22.6 19.6 9.69 10.9 14.4 21.5 15.1 12.8 123678 HXCDD 88.6 134 52.1 57.0 93.1 95.4 87.2 65.1 123789 HXCDD 15.9 20.0 10.0 11.5 16.5 15.4 14.3 10.8 1234678 HPCDF 10.5 13.7 10.8 13.3 11 .4 13.5 18.6 9.97 1234789 HPCDF ND( 0.54) 0.643 ND( 0.42) 0.561 ND( 0.20) ND( 0.21) 0.579 ND(.30) 1234678 HPCDD 176 133 111 97.5 70.7 108 116 125 oca= 0.917 ND( 0.96 ) ND( 1.01) 0.444 0.983 ND( 1.25) 4.55 3.62 CCDD 621 845 467 799 859 823 623 666
2378 TCDD Toxic Equivalent 31.5 55.3 33.1 35.9 41.2 52.0 53.2 44.1
*-mean of duplicate sample preparations and analyses
Note: 2378-TCDD toxic equivalents based on the California Department of Health Services Procedure.

Table 4-7. Precision of Duplicate Sample Preparations(Relative Percent Difference%)
a Batch 1 Batch 2 Batch 2 Batch 3
Sex Female Male Male Female Age 53 50 + 50 t 65 City LA LA LA SF
Compound
2378 TCDF 13 81 1.8 9.3 2378 TCDD 13 13 19 6.1 12378 PECDF 1.7 NC b NC NC 23478 PECDF 4.0 24 1.5 48 12378 PECDD 12 3.9 8.6 14 123478 HXCDF 0.2 7.2 9.7 6.3
.p,. 0 123678 HXCDF 7.2 4.8 3.4 5.6
234678 HXCDF 13 21 9.7 10 123789 HXCDF 13 NC NC NC 123478 HXCDD 25 8.1 3.2 5.7 123678 HXCDD 35 9.4 4.1 7.0 123789 HXCDD 6.1 1.3 14 6.8 1234678 HPCDF 14 15 4.4 1.0 1234789 HPCDF 0.7 NC NC 7.4 1234678 HPCDD 25 2.5 6.9 16.1 OCDF 14 18 20 2.7 OCDD 7.2 3.6 0.0 6.5
a-Precision measurement from duplicate native spike sample preparations
b- NC: not calculated, compound not detected
Batch 4 Batch 5 Female Female 35-49 50 t
SF SF
24 6.1 55 3.5 NC NC 160 28 9.4 14 9.3 2.6 0.4 7.1 9.1 2.5 16 NC 18 0.8 4.7 0.5 8.6 1.8 4.8 0.6 NC 0.7 8.4 7.3 12 30 4.2 7.4

r ,=---~ r~--:-=-:-·c- 1 (- · ~-, r-.--;-- ,:.....--·----:· r:;_:i-=-.-c::,-1 r------:.,;.-1 f-....:,;..--::...-~ 1;-...c,:--~, ,;;~ p::;-~p~ '""' 1•==-=--7 F""..:...=a..n~ ,-::_.r-=-1 .--~ 1 r ------'·\ f---'-----=:::.:•~-1 -,
Table 4-8. Control QC Sample Results (pg/g) CARB, 1989
Compound Batch 2 Batch 3 Batch 4 Batch 5
2378 TCDF 1.02 0.96 1.17 1.34 2378 TCDD 9.35 9.51 10.10 10.30 12378 PECDF 0.44 ND(0.39) ND(0.36) ND(0.55) 23478 PECDF 12.0 9.69 18.9 24.3 12378 PECDD 21.7 18.1 32.2 20.4 123478 HXCDF 29.0 30.1 28.4 30.9 123678 HXCDF 11.6 11.5 12.0 15.6
+'> 234678 HXCDF 2.27 2.33 2.47 2.85 I--' 123789 HXCDF ND(0.10) ND(0.22) ND(0.10) ND(0.17)
123478 HXCDD 18.5 21.4 19.7 16.6 123678 HXCDD 133 136 133 137 123789 HXCDD 17.4 17.8 19.2 22.1 1234678 HPCDF 28.6 28.2 28.0 30.4 1234789 HPCDF ND(1.12) ND(1.26) ND(1.32) ND(1.34) 1234678 HPCDD 156 159 163 167 OCDF 1.41 1.50 1.88 2.83 OCDD 1,250 1,220 1,230 1,200

Table 4-8 (continued). Control QC Sample Results (pg/g) From
Compound
2378TCDF 2378TCDD 12378PeCDF 23478PeCDF 12378PeCDD 123478HxCDF 123678HxCDF 234678HxCDF 123789HxCDF
.p, N 123478/123678HxCDD
123789HxCDD 1234678HpCDF 1234789HpCDF 1234678HpCDD 12346789OCDF 12346789OCDD
Previous Analysis of NHATS FY 1987
1.24 0.999 ND(0.89) (a) ND(0.74) (a) 10.60 9.13 9.73 8.66
ND (0.1) ND (0.08) 0.48 ND(0.54) 28.2 24.5 24.6 24.9 19.5 21.9 20.9 20.2
ND(42.9) (b) ND(29.2) (b) 18.7 ND(37.2) (b) 12.5 12.2 7,56 9.21
ND (1.96) (c) ND(1.93)(c) ND(14.7) (b) ND(15.8) (b) ND(0.5) ND (0.5) ND(0.64) ND(0.92)
134 140 151 126 19.6 23.0 ND(20.8) (a) 19.5 31.8 27.0 29.1 30.1 1.64 ND(0.9) 1.21 ND(1.36) 151 144 125 140
ND (2.65) 2.37 ND(0.83) 7.30 1130 1250 1170 1180
ND(0.81) (a) 8.34
ND(0.41) 23.1 21.5
ND(33.6) (b) 12.7
ND(14.8) (b) ND(0.73)
133 22.1 31.1
ND(0.97) 138 2.39 1190
(a) - Ion ratios for these compounds were outside the ratio criteria for these compounds (b) -The results for this compound include response for adiphenyl ether interference. (c) -Diphenyl interferences in these samples were separated from the 234678HxCDF isomer.

,_--:,____ __ -1 ~-:__-_-1
,--;;;-------., -_--:;;-.7 ----~--\ I ---::_.....=_----:-1 ,-_--;- r----=----- l 1✓- _:::;:----. ~ ...,i;..;:;:;;...,; f=-.....:....:+•~ r--=~•n r- r- --""\
Table 4-9. Method Accuracy (Recovery%) for PCODs and PCDFs Spiked Into Human Adipose Tissue
Compound
2378 TCDF 2378 TCDD 12378 PECDF 23478 PECDF 12378 PECDD 123478 HXCDF
~ 123678 HXCDFw 234678 HXCDF 123789 HXCDF 123478 HXCDD/ 123678 HXCDD 123789 HXCDD 1234678 HPCDF 1234789 HPCDF 1234678 HPCDD OCDF OCDD
Spike Batch 1 Batch 1 level Rep 1 Rep2 (pg/g)
20 105 91 10 79 92 20 105 104 20 95 91 10 112 98 50 85 85 50 73 78 50 96 85 50 74 64 20 20 56 96 20 111 105 50 111 131 50 96 97 20 32 96 50 106 93
400 92 82

Table 4-9 (continued)
Spike Batch 2 Batch3 Batch 4 Batch 5 Compound level
(pg/g)
2378 TCDF 10 104 114 107 114 2378 TCDD 10 97 117 108 104 12378 PECDF 10 98 118 98 124 23478 PECDF 10 NC* 138 155 124 12378 PECDD 10 NC 126 99 105 123478 HXCDF 25 104 109 97 95 123678 HXCDF 25 108 112 93 118 234678 HXCDF 25 94 97 88 98+>
+> 123789 HXCDF 25 89 91 92 121 123478 HXCDD 25 109 112 100 91 123678 HXCDD 25 105 119 99 143 123789 HXCDD 25 101 107 97 117 1234678 HPCDF 25 112 120 110 122 1234789 HPCDF 25 105 122 107 129 1234678 HPCDD 25 37 174 85 108 OCDF 50 96 99 89 110 OCDD 50 NC 126 49 NC
* - NC; Not Calculated due to high concentrations in control lipid

i--"J-::-----=----=,::::::, 1:::....::_- -..:..::::;;7 ,,----=-----, r··------- r·---=---=- -} ,-~----:..--, ~ F--,:;.:::::..._=:. ,..--.·==, P-...:ir--m..~ pu.~,--. i,:...,.. ==-or-1- j..-_,,_..:-_:_~ r:::. ...L-·-.-7 <---=- '1 i-=-=----::..::......-1 ~ ,-~ ....--::--1 ~:..;.--7
Table 4-9 (continued)
Spike Batch 2 Batch 3 Batch4 Batch 5 Compound level
(pg/g)
2378 TCDF 25 106 117 115 128 2378 TCDD 25 107 114 113 105 12378 PECDF 25 107 121 101 122 23478 PECDF 25 58 23 92 122 12378 PECDD 25 109 147 102 103 123478 HXCDF 63 104 114 98 96
.p. Ul 123678 HXCDF 63 108 125 98 113
234678 HXCDF 63 102 112 92 105 123789 HXCDF 63 95 107 95 112 123478 HXCDD 63 102 117 98 94 123678 HXCDD 63 104 120 107 134 123789 HXCDD 63 100 113 107 108 1234678 HPCDF 63 115 123 113 120 1234789 HPCDF 63 109 115 111 117 1234678 HPCDD 63 103 147 101 118 OCDF 125 96 100 97 118 OCDD 125 89 . 145 91 135

Table 4-10. Questionnaire Su1TDT1ary--Anatomical Origin of Adipose Tissue Sample
CITY!-----------------------------------! ! LOS ANGELES ! SAN FRANCISCO ! BOTH CITIES!-----------------+-----------------+-----------------
SEX ! SEX ! SEX!-----------------+---------- ------+------------------
MALE ! FEMALE ! MALE ! FEMALE ! MALE ! FEMALE !
!------·--+--------+--------+--------+--------+--------! N ! N ! N ! N ! N ! N
----·-----------------------------+--------+--------+--------+--------+--------+--------! ANATOMICAL ORIGIN OF SAMPLE - - - •. - •. - - - "" - - .• - - - - - - - - - - - - - .. - - - - - - ! A[<[IOMEN ! 14! 4! 6! 10! 20! 14!
+:> m ----------------------------------~--------+--------+--------+--------+--------+--------!
AXILLA ! O! 1! O! 1! Q! 2!---------------------------------+--------+--------+--------+--------+--------+--------! BACK ! 2 ! 0 ! 0 ! 0 ! 2 ! 0 !
-------~-------------------------+--------+--------+---------~--------+--------+--------,BREAST , ! O! 5! O! 5! O! 10! - - - - - - - - - - ·- .. - -- - - .. - .. - - - - - - ·- - -.- .. - - +- - - ..... -- .. +·-- -- ----+--- - --- -+- --- -- - -+- - ------+--------! CHEST ! 1! O! O! O! 1! O!----------------------------------+--------+--------+--------+--------+--------+--------! INGUINAL f~EGION ! 3! 1! O! O! 3! 1! - .. - .. - - - - - - - - - .. - - - - - - .. - .. - - - - - .... - ·- - +.. - - - .... - - +- - - - - - .. - +- - .. - - - - - +- - - - - - - - +- - - - - - - - t - - - - - - - - !
!LEG ! O! O! 2! O! 2! O! ! .•.. ··- - - -······ ··- ····-·· .. - - .• - ------- - ··--- -+ .. - ------ ,-------- -+- -- -----+--------+--------+-------- ! !THIGH ! O! O! O! 1! O! 1!
!--------··------------------·------+--------+--------+------ .-+--------+--------+--------! ! UNKNOWN ! 0 ! 0 ! 1 ! 0 ! 1 ! 0 !

r--- r re_-:;--, r---- ;7 r,-.=---1 I - --=::-,---i i=-=-----J~------=-i r-----::::::;;:_--::--"I ~__:-----:ir--..,:::1 F->~--:::.:.7 r=v-~ pr.=~ F=--=1:~Y ,--_.:_---:....:, r:- .:.---:- 7 r-- -.::___-_- l r=- :.~--=---=--1 i:-:-=---=-7
Table 4-11. Questionnaire Summary--Race of Donor
CITY-----------------------------------!
LOS ANGELES ! SAN FRANCISCO ! BOTH CITIES -----------------+-----------------+-----------------
SEX ! SEX ! SEX -----------------+-----------------+-----------------
MALE ! FEMALE ! MALE ! FEMALE ! MALE ! FEMALE --------+--------+--------+--------+--------+--------
N ! N ! N ! N ! N ! N ----------------------------+--------+--------+---------+--------+--------+--------
.p. RACE -..J ----------------------------! ! ! ! ! !
WHITE (NON-HISPANIC) I 16! 41 7! 16! 23! 20!
----------------------------+--------+--------+--------+--------+--------+--------! ItLACK (NON-HISPANIC> ! 1! 1! 2! 1! 3! 2!
----------------------------+--------+--------+--------+--------+--------+--------! HISPANIC I 3! 4! O! O! 3! 4!----------------------------+--------+--------+--------+--------+--------+--------! ASIAN OR PACIFIC ISLANDER ! 01 , 21 O! O! O! 21

+'> 00
Table 4-12. Questionnaire Summary--Height (in) of Donors
!HEIGHT STATISTICS ElY SEX AND AGE ! HEIGHT (INCHES) !GROUP ACROSS CITIES !-----------------------------------------! I N I MIN I MEAN ! MAX ! STD!---------------------------------+-----+--------+--------+--------+--------!SEX !AGE GROUP I ' I
----------------+----------------! MALE !12-34 YEARS I 51 651 68! 711 2.2
1----------------·~-----+--------+--------+--------+--------!35-49 YEARS I 61 651 71! 76! 4.2
!----------------+-----+--------+--------+--------+--------' 50 AND ABOVE I 18 I 6 7 I 71 ! 79 ! 3 • 7
----------------+----------------+------+- --- --·- -+--------+------- -·+--- ---- -FEMALE 112-34 YEARS I 21 65! 65! 65! 0,4
!----------------+-----+--------+--------+--------+--------135-49 YEARS ! 14! 59! 65! 71! 3,3!----------------+-----+--------+--------+--------+--------! !50 AND ABOVE I 121 611 65! 69! 2.1!

I"-.~~-, ,-- -;- ,--. r---.----::ci r=:--7 1-=--:::_ =--:1 ,----=---ai r--·--::--- r---=-:,::c-=--=:i, r--'~---=::Q ,-.....~ r=n:=.-=..-, p::::;;r=--?,-17 1---= =- f • ,.:..~--,
+'> '-0
Table 4-13. Questionnaire Summary--Weight (lb) of Donor
---------------------------------------~--------------------------------------!WEIGHT STATISTICS BY SEX AND AGE ! WEIGHT <LBS> !GROUP ACROSS CITIES 1-----------------------------------------! I N ! MIN ! MEAN ! MAX ! STD!---------------------------------+-----+--------+--------+--------+--------!SEX !AGE GROUP l----------------+----------------! MALE !12-34 YEARS ! 5! 130! 182! 250! 44.0
!----------------+-----+--------+--------·+--------+--------!35-49 YEARS l 61 140! 190! 230! 35.8!----------------+-----+--------+--------·+--------+--------!50 AND ABOVE ! 18! 140! 182! 225! 27.4
----------------+----------------+-----+--------+--------+--------+--------!FEMALE !12-34 YEARS ! 2! 148! 179! 210! 43.B
!----------------+-----+--------+--~-----+--------+--------!35-49 YEARS ! 14! 120! 178! 243! 38.6!----------------+-----+--------+--------·+--------+--------150 AND ABOVE I 12! 105! 160! 220! 39.7

Ul 0
Table 4-14. Questionnaire Summary--Skinfold Caliper (mm) Measurements of Donors
!CALIPER STATISTICS BY SEX AND AGE! CALIPER CHH) ! !GROUP ACROSS CITIES !-----------------------------------------! ! ! N ! HIN ! HEAN ! MAX ! STD!---------------------------------·~-----+--------+---~----+--------+--------
r----------------+-----+--------+--------+--------+--------
! SEX ! AGE GROUP ! ! ! ! ! ----------------+---------------- ! ! ! ! !MALE !12-34 YEARS l 1! 6,0! 6,0! 6.0!
!35-49 YEARS ! 2! 7,0! 7,5! 8,0! 0,71
!----------------+-----+--------+--------+--------+--------. !50 AND ABOVE ! 21 6,0! a~o, 10,0! 2,83!
1-----------------+----------------+-----+--------+--------+--------+--------! !FEMALE !12-34 YEARS ! 1! 26,0! 26,0! 26,0!
!----------------+-----+-----. --+--------+--------+--------! !35-49 YEARS ! 101 10.0! 22.6! 38.0! 8,11!!----------------+-----+--------+--------+--------+--------! !50 AND ABOVE ! 7! 2e0! 15,0! 32.0! 10.91!

r I
J
Table 4-15. Number of Respondents Pres·ently Living or WorkingWithin 5 Miles of Potential Sources of PCDO and
PCDF Contamination, by City
Live Los Angeles near Work near
San Francisco Live near Work near
I Municipal waste incinerator 1 1 1 0 l Sewage sludge incinerator 1 0 1 0
Hospital 19 3 9 3 Wire reclamation incinerator 0 0 0 0
ri i Hazardous waste site 0 0 0 2 ~ Wood treatment facility 0 0 1 0
r ~
I (
f Table 4-16. Number of Respondents Who Have Relocated Within the Last! 5 Years and Have Previously Lived or Worked Within 5 Miles ~
of Potential Sources of PCDD and PCDF Contamination, by City
[[
Los Angeles San Francisco Lived near Worked near Lived near Worked neari
Q
Municipal waste incinerator 0 0 ~ Sewage sludge incinerator 0 0! Hospital 5 1 Wire reclamation incinerator· 0 0
~ Hazardous waste site 0 0 ~ Wood treatment facility 0 0
[ 1I·
~ 11 ~
[ [
~
t
~
~
0 0 0 0 2 1 0 0 0 0 0 0
!
[ ~ 51

Table 4-17. Number of Respondents With Potential Chemical Exposure at Work 9 at Home During the Last 5 Years, or
From Vietnams by City
Job involving handling of chemicals (Q # 18)
Job involving handling of electrical equipment (Q # 19)
Job involving incineration of plastic or wood materials (Q # 20)
Service in Vietnam (Q # 21)
Use of pest control services in/or outside residence (Q # 22)
Use of lawn and garden spraying services at residence (Q # 23)
General use of wood preservatives (Q # 24)
Use of herbicides during leisure activities (Q # 25)
Use of pesticides during leisure activities (Q # 25)
Use of wood preservatives during leisure activities (Q # 25)
~s Angeles San Francisco
6 2
4 0
1 1
1 0 (from March 1968-February 1969 and involved ~n use of defoliant)
8 6
10 3
3 1
3 4
9 5
2 2
Table 4-18. Number of Respondents in Various Relevant Occupational Categories9 by City
Los Angeles San Francisco
Professional (Q # 29 b))
with chemical exposure 3 3
Laborer with chemical exposure (Q # 3lb)) 7 0
Nonprofessional or unskilled laborer with chemical exposure (Q # 32b)
2 1
52

Table 4-19. Distribution of Adipose Tissue SpecimensAcross Design Cells
San Francisco Los AngelesAge Female Male Female Male Total
12-34 1 0 1 5 7
35-49 10 3 4 3 20
50+ 6 6 6 12 30
Total 17 9 11 20 57
I: tiC
53
L

Table 4-20. Overall Results on Occurrences of Compounds in 57 Samples by City and Across Both Cities
SAN FRANCISCO BOTH CITIES LOS ANGELES (57 samples) (31 samples) (26 samples)
%ND %POND PO %ND 0/oPQ ND POND PQ %ND 0/oPQCompound No.
1234789-HpCDF 1234678-HpCDD
OCDD 16 31 100% 26 100% 57 100% OCDF 15 19 12 610/o 39% 5 21 19% 81% 24 33 42% 58%
2378-TCDF 1 12 2378-TCDD 2 4
12123678-HxCDF 7 ~ 1234678-HxCDF 8 15
123789-HxCDF 9 29 1234 78/1 23678-HxCDD 10 123789-HxCDD 11 6
1
4% 96% 23% 77%1 25 13 4419 39% 61% 100%27 7% 93%13% 87% 26 4 53
100%19 210/o 79%390/o 610/o 26 12 45 8% 92% 30% 70%16 48% 52% 2 24 17 40
2 23 3 88% 12% 91% 9%94% 6% 52 5 100%31 100% 26 57 100%
4% 96% 12% 88%25 19% 81% 1 25 7 50
* 1: Interference in analysis could not be removed for two Los Angeles samples
ND= Not detected; PQ = Positive quantifiable.

,----:--~ ,·-....-J•--~ r- _r..:-,, r- \ r~ -:::i i=--'-=-------:i f .~----::;-~ i=-==--~ F===--=-, ,~ P'-=f~ 1-:::ir:r::_...----.:,-;;-, ~-------;i-ic:i r----=-----=---; I....:..:;:.. --l f-- -- -~ I __._ ,-_-:-=-=--- 1
,,.----..._
Table 4-21. Concentration Statistics by Compound, City, Sex, and Age Group
Ul Ul
Number of Minimum detects/ detected
number of level Compound (No.) City Sex Age group specimens {pg/g)
2378-TCDF (1) Los Angeles Female 12-34 years 1 of 1 1.78 35-49 years 0 of 4 50 and above 4 of 6 1.45
Male 12-34 years 2 of 5 0.634 35-49 years 2 of 3 0.868 50 and above 10 of 12 0.976
San Francisco Female 12-34 years 1 of 1 2.84 35-49 years 10 of 10 1.19 50 and above 6 of 6 0.970
Male 12-34 years 0 of 0 35-49 years 3 of 3 0.898 50 and above 5 of 6 1.48
2378-TCDD (2) Los Angeles Female 12-34 years 1 of 1 5.96 35-49 years 3 of 4 2.31 50 and above 6 of 6 1.95
Male 12-34 years 4 of 5 1.80 35-49 years 2 of 3 3.78 50 and above 11 of 12 1.98
San Francisco Female 12-34 years 1 of 1 6.29 35-49 years 10 of 10 2.25 50 and above 6 of 6 3.94
Male 12-34 years 0 of 0 35-49 years 3 of 3 3.49 50 and above 6 of 6 3.80
Lower Geometric 95% limit mean of
of geometric detected mean levels (pg/g) (pg/g)
1.78
1.28 1.92 1.22
0.913 1.27 1.99
2.84 1.63 2.46 1.11 1.99
0.335 1.90 1.42 2.04
5.96 0.707 3.50
2.12 3.89 1.53 2.96
3.82 3.26 4.37
6.29 3.54 5.16 4.00 6.18
2.41 4.25 3.91 5.43
Upper 95% limit Maximum
of geometric detected mean level {pg/g) (pg/g)
1.78
2.89 2.61 2.34
0.961 3.12 6.49
2.84 3.70 5.36 3.56 3.35
10.8 3.58 2.93 3.18
5.96 17.3 7.34 7.15 8.55 5.72 4.33
3.87 5.87 9.34
6.29 7.51 11.8 9.56 12.5
7.47 5.45 7.54 9.33
Note: Upper and lower confidence limits are not computed for less than 3 samples per cell Significant figures for each compound are limited to 3

Table 4-21 (continued)
Ul O'I
Number of Minimum detects/ detected
number of level
Compound (No.) City Sex Age group specimens (pg/g)
12378-PeCDF (3) Los Angeles Female 12-34 years 0 of 1 35-49 years 0 of 4
50 and above 0 of 6
Male 12-34 years 0 of 5 0.524
35-49 years 1 of 3 0.350
50 and above 2 of 12 0.278
San Francisco Female 12-34 years 1 of 1 0.591
35-49 years 4 of 10 0.370
50 and above 2 of 6 0.495
Male 12-34 years 0 of 0 35-49 years 2 of 3 0.305
50 and above 1 of 6 0.257
23478-PeCDF (4) Los Angeles Female 12-34 years 1 of 1 10.3
35-49 years 3 of 4 4.63
50 and above 6 of 6 1.56
Male 12-34 years 4 of 5 2.70
35-49 years 3 of 3 4.62
50 and above 11 of 12 2.79
San Francisco Female 12-34 years 1 of 1 9.17
35-49 years 9 of 10 2.60
50 and above 6 of 6 2.99
Male 12-34 years 0 of 0 35-49 years 3 of 3 2.74
50 and above 4 of 6 0.726
Note: Upper and lower confidence limits are not computed for less than 3 samples per cell Significant figures for each compound are limited to 3
Lower Geometric Upper
95% limit mean of 95% limit Maximum
of geometric detected of geometric detected
mean levels mean level
(pg/g) (pg/g) (pg/g) (pg/g)
0.524 0.524 0.35 0.350
0.3622 0.472 0.591 0.591
0.323 1.04 3.34 1.93 0.6585 0.876
0.3762 0.464 0.257 0.257
10.3 10.3 2.22 7.02 22.2 11 .1
2.18 6.85 21.6 25.3 2.09 6.70 21.4 15.5 1.25 7.12 40.6 15.3 4.36 5.69 7.43 14.0
9.17 9.17 2.95 5.10 8.81 15.0
2.99 8.14 22.2 24.1
0.904 5.89 38.4 11.3
0.314 2.95 27.8 13.7

r- ~-----i ·,~ (~ 1------=~c...-1 p=l r=r~ r-7,.,,-....::= ,--;-;,------.::.;_•-,~ _ --1 ,- -_ 1 ·_·- 7 r....::::. ~-I
Table 4-21 (continued)
U1 .......
Number of Minimum detects/ detected
number of level Compound (No.) City Sex Age group specimens (pg/g)
12378-PeCDD (5) Los Angeles Female 12-34 years 1 of 1 10.1 35-49 years 4 of 4 4.24 50 and above 6 of 6 1.98
Male 12-34 years 2 of 5 5.03 35-49 years 3 of 3 4.97 50 and above 12 of 12 5.63
San Francisco Female 12-34 years 1 of 1 7.84 35-49 years 10 of 10 4.36 50 and above 6 of 6 7.71
Male 12-34 years 0 of 0 35-49 years 3 of 3 8.63 50 and above 6 of 6 9.56
123478-HxCDF (6) Los Angeles Female 12-34 years 1 of 1 8.28 35-49 years 3 of 4 3.55 50 and above 3 of 6 1.69
Male 12-34 years 3 of 5 3.76 35-49 years 2 of 3 7.55 50 and above 11 of 12 4.16
San Francisco Female 12-34 years 1 of 1 10.1 35-49 years 10 of 10 4.26 50 and above 6 of 6 6.14
Mate 12-34 years 0 of 0 35-49 years 3 of 3 5.72 50 and above 6 of 6 5.12
Lower Geometric Upper 95% limit mean of 95% limit
of geometric detected of geometric mean levels mean (pg/g) (pg/g) (pg/g)
10.1 2.01 9.51 45.0 2.96 7.71 20.1
8.77 2.71 7.86 22.8 7.66 9.44 11.6
7.84 7.40 10.6 15.3 8.93 13.4 20.0
5.83 9.79 16.4 9.16 13.3 19.4
8.28 2.05 5.24 13.4
0.423 2.76 18.0 1.21 6.01 29.8
9.75 5.72 7.66 10.2
10.1 5.10 7.27 10.4 6.00 9.12 13.9
1.72 8.56 42.5 5.27 7.07 9.47
Maximum detected
level (pg/g)
10.1 39.1 24.9 15.3 10.8 16.6 7.84 21.4 24.9
12.3 25.2 8.28 7.20 6.27 12.0 12.6 16.7 10.1 13.5 17.2
17.3 11.2
Note: Upper and lower confidence limits are not computed for less than 3 samples per cell Significant figures for each compound are limited to 3

Table 4-21 (continued)
c.n OJ
Number of Minimum detects/ detected
number of level Compound (No.) City Sex Age group specimens (pg/g)
123678-HxCDF (7) Los Angeles Female 12-34 years 1 of 1 8.13 35-49 years 1 of 4 2.02 50 and above 2 of 6 1.83
Male 12-34 years 2 of 5 2.89 35-49 years 2 of 3 4.18 50 and above 11 of 12 . 2.43
San Francisco Female 12-34 years 1 of 1 5.63 35-49 years 10 of 10 2.30 50 and above 6 of 6 3.61
Mate 12-34 years 0 of 0 35-49 years 3 of 3 3.78 50 and above 6 of 6 3.04
234678-HxCDF (8) Los Angeles Female 12-34 years 1 of 1 2.10 35-49 years 0 of 4 50 and above 0 of 6
Male 12-34 years 2 of 5 1.37 35-49 years 2 of 3 0.906 50 and above 11 of 12 0.619
San Francisco Female 12-34 years 1 of 1 1.96 35-49 years 9 of 10 0.741 50 and above 6 of 6 0.528
Male 12-34 years 0 of 0 35-49 years 2 of 3 1.42 50 and above 6 of 6 0.674
Note: Upper and lower confidence limits are not computed for less than 3 samples per cell Significant figures for each compound are limited to 3
Lower Geometric Upper 95% limit mean of 95% limit Maximum
of geometric detected of geometric detected mean levels mean level (pg/g) (pg/g) (pg/g) (pg/g)
8.13 8.13 2.02 2.02 2.50 3.42 3.15 3.43 4.21 4.24
3.45 5.01 7.27 12.7 5.63 5.63
3.03 4.29 6.07 7.31 3.43 5.72 9.55 11 .9
2.49 4.33 7.55 5.53 3.26 4.58 6.44 7.42
2.10 2.10
3.66 9.80 1.37 2.08
0.797 1.43 2.55 10.5 1.96 1.96
1.03 1.47 2.10 3.27 0.683 1.53 3.44 4.28
1.84 2.38 0.687 1.36 2.69 4.41

,-----=-~- ~ -.,__ ( ----= r=-~-=..=.7 r-~ r----==.J--,._ r=------=-l r-=-~~-:ii.. r=..=---,L ='j µ;a::..:i...=-=-~ F=='""f'-'i;:;,..::;;:::J ..,----::;u==..;-.;,-_-_~ 1=_-__.,,."'-; 1--:.-..:..---, 1-~::....__,---r I _--2- ----;:-:i rr~ ~ - • -:: ,::::::::-=---=-i
Table 4-21 (continued)
U1 lO
Number of Minimum detects/ detected
number of level Compound (No.) City Sex Age group specimens (pg/g)
123789-HxCDF (9) Los Angeles Female 12-34 years 0 of 1 35-49 years 0 of 4 50 and above 0 of 6
Male 12-34 years 0 of 5 35-49 years 0 of 3 50 and above 2 of 12 0.557
San Francisco Female 12-34 years 1 of 1 0.155 35-49 years 0 of 10 0.275 50 and above 2 of 6 0.643
Male 12-34 years 0 of 0 35-49 years 0 of 3 50 and above 0 of 6
123478/ Los Angeles Female 12-34 years 1 of 1 62.0 123678-HxCDD (10) 35-49 years 4 of 4 27.8
50 and above 6 of 6 21.9 Male 12-34 years 5 of 5 15.6
35-49 years 3 of 3 20.1 50 and above 12 of 12 40.3
San Francisco Female 12-34 years 1 of 1 61.8 35-49 years 10 of 10 38.7 50 and above 6 of 6 60.6
Male 12-34 years 0 of 0 35-49 years 3 of 3 66.0 50 and above 6 of 6 57.7
Lower Geometric Upper 95% limit mean of 95% limit
of geometric detected of geometric mean levels mean (pg/g) (pg/g) (pg/g)
0.724 0.155 0.275
0.6907
62.0 26.9 38.6 55.2 26.6 52.2 102 20.2 47.2 111 6.38 46.0 331 65.3 85.4 112
61.8 55.8 75.6 102 64.5 88.8 122
54.2 70.9 92.7 61.8 90.9 134
Maximum detected
level (pg/g)
0.942 0.155 0.275 0.742
62.0 46.6 114 103
87.8 154
61.8 117 149
79.7 164
Note: Upper and lower confidence limits are not computed for less than 3 samples per cell Significant figures for each compound are limited to 3

Table 4-21 (continued)
CJ')
0
Number of detects/
number of specimens
Minimum detected
level (pg/g)
Lower 95% limit
of geometric mean (pg/g)
Geometric mean of
detected levels (pg/g)
Upper 95% limit
of geometric mean (pg/g)
Maximum detected
level (pg/g)Compound (No.) City Sex Age group
123789-HxCDD (11) Los Angeles Female 12-34 years 35-49 years 50 and above
1 of 1 2 of 4 6 of 6
9.32 4.93 8.63 8.98
9.32 5.62 13.4 19.9
9.32 6.41 22.5
Male 12-34 years 35-49 years 50 and above
3 of 5 3 of 3
10 of 12
4.79 6.15 4.47
1.55 2.93 6.35
11.2 10.0 9.09
80.8 34.5 13.0
20.3 15.7 20.0
San Francisco Female 12-34 years 35-49 years 50 and above
1 of 1 9 of 10 6 of 6
10.0 5.00 6.05
7.51 6.25
10.0 11 .9 10.4
19.0 17.1
10.0 31.7 22.2
Male 12-34 years 35-49 years 50 and above
0 of 0 3 of 3 6 of 6
6.76 4.90
6.41 5.48
7.04 8.26
7.73 12.4
7.21 13.3
1234678-HpCDF (12) Los Angeles Female 12-34 years 35-49 years 50 and above
0 of 1 1 of 4 3 of 6
7.66 4.48 1.86
7.66 7.04 26.7
7.66 12.2
Male 12-34 years 35-49 years 50 and above
2 of 5 2 of 3
11 of 12
8.85 8.20 4.82 6.55
11.8 8.93 9.04 12.5
15.8 9.72 25.8
San Francisco Female 12-34 years 35-49 years 50 and above
1 of 1 10 of 10
6 of 6
10.8 4.08 5.28
6.37 6.33
10.8 9.30 10.8
13.6 18.3
10.8 20.2 20.2
Male 12-34 years 35-49 years 50 and above
0 of 0 3 of 3 6 of 6
5.94 6.12
2.97 6.54
7.62 7.89
19.5 9.53
11 .5 10.5
Note: Upper and lower confidence limits are not computed for less than 3 samples per cell Significant figures for each compound are limited to 3

r-=--==--~ r ~-"J r---=-1 '>.:------:.-_,,,____ , •-·~=-...:.·, ---=----"-7 ,-;--== "'Z....=-,. r--r,r=~ p-~ ~nr-1 p-:;1n.r---'--" l r...:::.-~, 7 1--=----=---, =-=i r~·--=---1 ,_ __--=, F-..:::·- -=--=---i t-::-•-=i
"' \
Table 4-21 (continued)
0) ......
Number of Minimum detects/ detected
number of level Compound (No.) City Sex Age group specimens (pg/g)
1234789-HpCDF (13) Los Angeles Female 12-34 years 0 of 1 35-49 years 0 of 4 50 and above 0 of 6
Male 12-34 years 0 of 5 35-49 years 0 of 3 50 and above 3 of 12 0.380
San Francisco Female 12-34 years 0 of 1 35-49 years 3 of 10 0.236 50 and above 3 of 6 0.340
Male 12-34 years 0 of 0 35-49 years 1 of 3 0.443 50 and above 1 of 6 0.743
1234678-HpCDD (14) Los Angeles Female 12-34 years 1 of 1 104 35-49 years 4 of 4 31.2 50 and above 6 of 6 22.0
Male 12-34 years 5 of 5 57.3 35-49 years 3 of 3 39.5 50 and above 12 of 12 31.6
San Francisco Female 12-34 years 1 of 1 111 35-49 years 10 of 10 42.2 50 and above 6 of 6 34.3
Male 12-34 years 0 of 0 35-49 years 3 of 3 62.7 50 and above 6 of 6 51.3
Lower Geometric Upper 95% limit mean of 95% limit Maximum
of geometric detected of geometric detected mean levels mean level (pg/g) (pg/g) (pg/g) (pg/g)
0.227 0.564 1.40 0.733
0.114 0.356 1.11 0.561 0.207 0.499 1.21 0.633
0.443 0.443 0.743 0.743
104 104 26.9 42.8 68.0 58.3 29.5 58.1 114 151 60.3 75.5 94.4 89.1 11.7 102 900 177 45.2 75.4 126 290
111 111 73.7 111 169 334 37.9 88.4 207 317
40.1 82.8 171 109 43.1 84.0 164 297
Note: Upper and lower confidence limits are not computed for less than 3 samples per cell Significant figures for each compound are limited to 3

Table 4-21 (continued)
0) N
Number of detects/
number of specimens
Minimum detected
level (pg/g)
Lower 95% limit
of geometric mean (pg/g)
Geometric mean of detected
levels (pg/g)
Upper 95% limit
of geometric mean (pg/g)
Maximum detected
level (pg/g)Compound (No.) City Sex Age group
OCDF (15) Los Angeles Female 12-34 years 35-49 years 50 and above
0 of 1 0 of 4 0 of 6
Male 12-34 years 35-49 years 50 and above
1 of 5 2 of 3 9 of 12
0.946 0.857 0.275 0.501
0.946 0.920 0.731 1.07
0.946 0.988
1.37
San Francisco Female 12-34 years 35-49 years 50 and above
0 of 1 9 of 10 6 of 6
0.435 0.486
0.553 0.483
0.706 1.28
0.900 3.38
0.983 4.55
Male 12-34 years 35-49 years 50 and above
0 of 0 2 of 3 4 of 6
0.379
0.518 0.496 0.59
0.785 1.24 0.918
1.01 OCDD (16) Los Angeles Female 12-34 years
35-49 years 50 and above
1 of 1 4 of 4 6 of 6
478 316 178
273 226
478 457
366 765 594
478 695 749
Male 12-34 years 35-49 years 50 and above
5 of 5 3 of 3
12 of 12
152 341
199
152 133 385
394
591 561
1022
2619 818
1250 1060 1320
San Francisco Female 12-34 years 35-49 years 50 and above
1 of 1 10 of 10
6 of 6
467 137 336
405 452
467 632 673
985 1002
467 1230
949
Male 12-34 years 35-49 years 50 and above
0 of 0 3 of 3 6 of 6
304 359
212 387
387
538 708 746
481 774
Note: Upper and lower confidence limits are not computed for less than 3 samples per cell Significant figures for each compound are limited to 3

f -....J....:'.,-_ ! 1--· ,--::.._ ---::-· ~ --1 r ----:::.~ il ,-...~-• ,=,-,,-·1 ► -_Ju .. ·==----1 ,---....:;;J_J__.,-- 1 I -- - l /T
Table 4-22. Concentration Statistics by Compound, City, and Sex
0-. w
Number of detects/
number of specimens
Minimum detected
level (pg/g)
Lower 95% limit
of geometric mean (pg/g)
Geometric mean of
detected levels (pg/g)
Upper 95% limit
of geometric mean (pg/g)
Maximum detected
level (pg/g)Compound (No.) City Sex
2378-TCDF (1) Los Angeles Female Male
5 of 11 14 of 20
1.45 0.634
1.43 1.13
1.89 1.66
2.50 2.43
2.61 6.49
San Francisco Female Male
17 of 17 8 of 9
0.970 0.898
1.74 1.38
2.30 1.99
3.04 2.86
5.36 3.58
2378-TCDD (2) Los Angeles Female Male
10 of 11 17 of 20
1.95 1.80
2.65 3.16
3.93 3.93
5.83 4.88
8.55 9.34
San Francisco Female Male
17 of 17 9 of 9
2.25 3.49
4.37 3.97
5.56 5.00
7.07 6.30
12.5 9.33
12378-PeCDF (3) Los Angeles Female Male
0 of 11 3 of 20 0.278 0.185 0.358 0.692 0.472
San Francisco Female Male
7 of 17 3 of 9
0.370 0.257
0.480 0.156
0.842 0.331
1.48 0.705
1.93 0.464
23478-PeCDF (4) Los Angeles Female Male
10 of 11 18 of 20
1.56 2.70
3.92 4.78
7.19 6.13
13.2 7.85
25.3 15.5
San Francisco Female Male
16 of 17 7 of 9
2.60 0.726
4.12 1.38
6.30 3.97
9.64 11.4
24.1 13.7
12378-PeCDD (5) Los Angeles Female Male
11 of 11 17 of 20
1.98 4.97
4.83 7.48
8.53 9.06
15.1 11.0
39.1 16.6
San Francisco Female Male
17 of 17 9 of 9
4.36 8.63
8.94 9.28
11.3 12.0
14.3 15.6
24.9 25.2
Note: Upper and lower confidence limits are not computed for less than 3 samples per cell Significant figures for each compound are limited to 3

Table 4-22 (continued)
m +"
Number of detects/
number of specimens
Minimum detected
level (pg/g)
Lower 95% limit
of geometric mean (pg/g)
Geometric mean of detected
levels (pg/g)
Upper 95% limit
of geometric mean (pg/g)
Maximum detected
level (pg/g)Compound (No.) City Sex
123478-HxCDF (6) Los Angeles Female Male
7 of 11 16 of 20
1.69 3.76
2.36 5.93
4.25 7.54
7.65 9.59
8.28 16.7
San Francisco Female Male
17 of 17 9 of 9
4.26 5.12
6.37 5.58
8.03 7.53
10.1 10.2
17.2 17.3
123678-HxCDF (7) Los Angeles Female Male
4 of 11 15 of 20
1.83 2.43
1.08 3.49
3.18 4.60
9.43 6.06
8.13 12.7
San Francisco Female Male
17 of 17 9 of 9
2.30 3.04
3.77 3.63
4.82 4.50
6.17 5.58
11.9 7.42
234678-HxCDF (8) Los Angeles Female Male
1 of 11 15 of 20
2.10 0.619 0.978
2.10 1.61 2.65
2.10 10.5
San Francisco Female Male
16 of 17 8 of 9
0.528 0.674
1.13 0.901
1.52 1.47
2.05 2.39
4.28 4.41
123789-HxCDF (9) Los Angeles Female Male
0 of 11 2 of 20 0.557 0.724 0.942
San Francisco Female Male
3 of 17 0 of 9
0.155 0.049 0.420 3.60 0.742
123478/ 123678-HxCDD (10)
Los Angeles Female Male
11 of 11 20 of 20
21.9 15.6
33.9 50.8
47.5 67.1
66.5 88.6
114 154
San Francisco Female Male
17 of 17 9 of 9
38.7 57.7
65.2 65.4
79.1 83.7
95.9 107
149 164
123789-HxCDD (11) Los Angeles Female Male
9 of 11 16 of 20
4.93 4.47
7.28 7.33
10.6 9.63
15.4 12.7
22.5 20.3
San Francisco Female Male
16 of 17 9 of 9
5.00 4.90
8.46 6.13
11 .2 7.83
14.8 10.0
31.7 13.3
Note: Upper and lower confidence limits are not computed for less than 3 samples per cell Significant figures for each compound are limited to 3

Note: Upper and lower confidence limits are not computed for less than 3 samples per cell Significant figures for each compound are limited to 3
Shaded compound: Significant City by Sex interaction (p=0.04)
0) (J1
p.::::=---i p=--, _.. ..-----~~-"----", 1-..---...::.=·-, ,--=----,----,-; ,--=----, -r~~~ ,=---=...:---, r----==:.;-...:.._~ µ=----:.::.:i- ~..--""'! 1::.::..0,.--...,.;.:::J ~="'=---"i r--=- -1 1~::.__.:_--::---'J r- ~ ;1_ rr.r::-__.__,.--1 --· 1 =-=-=--"1
Table 4-22 (continued)
Lower Geometric Upper Number of Maximum
detects/ 95% limit95% limit mean ofMinimum
of geometric detected number of
of geometric detecteddetected level
Compound (No.)
levels meanlevel mean (pg/g) (pg/g)(pg/g) (pg/g)(pg/g)City Sex I SIJecimens
12.2 Male 15 of 20 4.82 7.37
7.19 13.9Female 4 of 11 4.48 3.70Los Angeles 1234678-HpCDF (12) 11.9 25.89.35 - 12.7 20.2
Male 9 of 9 5.94 6.54 9.88Female 17 of 17 4.08 7.67San Francisco 7.80 9.31 11.5
1234789-HpCDF (13) Female 0 of 11 Male 3 of 20 0.380 0.238
Los Angeles 0.564 1.34 0.733
0.637 0.633
I Male 2 of 9 0.443 0.422San Francisco Female 6 of 17 0.236 0.279 0.574 0.743
79.2 151 Male 20 of 20 31.6 57.4
54.8Los Angeles Female 11 of 11 22.0 37.911234678-HpCDD (14) 29079.0 109
142103
I 334
Male 9 of 9 51.3 55.9 Female 17 of 17 34.3 74.0San Francisco
125 297 OCDF (15) Los Angeles
83.6 Female 0 of 11 Male 12 of 20 0.275 0.589 0.776 1.02 1.37
San Francisco Female 15 of 17 0.435 0.617 0.895 1.30 4.55 Male 6 of 9 0.379 0.475 0.713 1.07 1.01
ffi@!lli?1/:),'jgp
!Jilllllllll11i!JIJll!JJ~liiillil

Table 4-23. Concentration Statistics by Compound and City
Number of detects/
number of specimens
Minimum detected
level (pg/g)
Lower 95% limit
of geometric mean (pg/g)
Geometric mean of detected
levels (pg/g)
Upper 95% limit
of geometric mean (pg/g)
Maximum detected
level (pg/g)Compound (No.) City
2378-TCDF (1) Los Angeles San Francisco
19 of 31 25 of 26
0.634 0.898
1.30 1.78
1.72 2.20
2.27 2.71
6.49 5.36
2378-TCDD (2) Los Angeles San Francisco
27 of 31 26 of 26
1.80 2.25
3.27 4.54
3.93 5.36
4.72 6.34
9.34 12.5
12378-PeCDF (3) Los Angeles San Francisco
3 of 31 10 of 26
0.278 0.257
0.185 0.390
0.358 0.636
0.692 1.04
0.472 1.93
23478-PeCDF (4) Los Angeles San Francisco
28 of 31 23 of 26
1.56 0.726
5.07 3.69
6.49 5.48
8.29 8.13
25.3 24.1
12378-PeCDD (5) Los Angeles San Francisco
·28 of 31 26 of 26
1.98 4.36
7.04 9.78
8.85 11 .6
11 .1 13.7
39.1 25.2
m m
Note: Upper and lower confidence limits are not computed for less than 3 samples per cell Significant figures for each compound are limited to 3

f ·.:..:::-::-- ! r:,::-----~---1. I-:=-~--=-,~, ,=...., 7 =·---=-- 7 r__::cc-=-=.--;-"'\ 1---=---=-=-~ F- -~.,_ F'=='=-.J< \,,~~~ -(-=-~, 1-11,..-r,.-- ·1 ~~-r-i•·-11 r-----=----~- I /·-----~ - I ,-~ r---=---" .- -, "-:-.=-•-""""'"l
Table 4-23 (continued)
CJ) .......
Number of detects/
number of specimens
Minimum detected
level (pg/g)
Lower 95% limit
of geometric mean (pg/g)
Geometric mean of
detected levels (pg/g)
Upper 95% limit
of geometric mean (pg/g)
Maximum detected
level (pg/g)Compound (No.) City
123478-HxCDF (6) Los Angeles San Francisco
23 of 31 26 of 26
1.69 4.26
4.96 6.62
6.33 7.85
8.09 9.32
16.7 17.3
123678-HxCDF (7) Los Angeles San Francisco
19 of 31 26 of 26
1.83 2.30
3.28 3.98
4.26 4.71
5.53 5.57
12.7 11.9
234678-HxCDF (8) Los Angeles San Francisco
16 of 31 24 of 26
0.619 0.528
1.03 1.19
1.64 1.50
2.60 1.90
10.5 4.41
123789-HxCDF (9) Los Angeles San Francisco
2 of 31 3 of 26
0.557 0.155 0.049
0.724 0.420 3.60
0.942 0.742
123478/ 123678-HxCDD (10)
Los Angeles San Francisco
31 of 31 26 of 26
15.6 38.7
48.0 70.0
59.4 80.6
73.4 92.9
154 164
123789-HxCDD (11) Los Angeles San Francisco
25 of 31 25 of 26
4.47 4.90
8.12 8.05
9.97 9.85
12.2 12.0
22.5 31.7
1234678-HpCDF (12) Los Angeles San Francisco
19 of 31 26 of 26
4.48 4.08
7.19 7.65
8.85 9.11
10.9 10.8
25.8 20.2
1234789-HpCDF (13) Los Angeles San Francisco
3 of 31 8 of 26
0.380 0.236
0.238 0.330
0.564 0.455
1.34 0.629
0.733 0.743
1234678-HpCDD (14) Los Angeles San Francisco
31 of 31 26 of 26
22.0 34.3
54.6 75.1
69.4 95.6
88.2 122
290 334
OCDF (15) Los Angeles San Francisco
12 of 31 21 of 26
0.275 0.379
0.589 0.636
0.776 0.839
1.02 1.11
1.37 4.55
OCDD (16) Los Angeles San Francisco
31 of 31 26 of 26
152 137
387 477
475 577
583 698
1320 1230
Note: Upper and lower confidence limits are not computed for less than 3 samples per cell Significant figures for each compound are limited to 3

Table 4-24. Concentration Statistics by Compound, Sex, and Age Group
m CIJ
Number of detects/
number of specimens
Minimum detected
level (pg/g)
Lower 95% limit
of geometric mean (pg/g)
Geometric mean of detected
levels (pg/g)
Upper 95% limit
of geometric mean (pg/g)
Maximum detected
level (pg/g)Compound (No.) Sex Age group
2378-TCDF (1) Female 12-34 35-49 50 and above
2 of 2 10 of 14 10 of 12
1.78 1 .19
0.970 1.63 1.43
2.25 2.46 1.96
3.70 2.68
2.84 5.36 3.35
Male 12-34 35-49 50 and above
2 of 5 5 of 6
15 of 18
0.634 0.868 0.976
0.642 1.50
1.22 1.42 2.01
3.13 2.69
2.34 3.58 6.49
2378-TCDD (2) Female 12-34 35-49 50 and above
2 of 2 13 of 14 12 of 12
5.96 2.25 1.95
3.37 3.48
6.12 4.71 4.90
6.59 6.90
6.29 11.8 12.5
Male 12-34 35-49 50 and above
4 of 5 5 of 6
17 of 18
1.80 3.49 1.98
1.53 3.29 3.84
2.96 4.07 4.72
5.72 5.04 5.80
4.33 5.45 9.34
12378-PeCDF (3) Female 12-34 35-49 50 and above
1 of 2 4 of 14 2 of 12
0.591 0.370 0.495
0.323 0.591
1.04 0.659
3.34 0.591
1.93 0.876
Male 12-34 35-49 50 and above
0 of 5 3 of 6 3 of 18
0.524 0.305 0.257
0.216 0.142
0.524 0.367 0.323
0.625 0.734
0.524 0.464 0.472
23478-PeCDF (4) Female 12-34 35-49 50 and above
2 of 2 12 of 14 12 of 12
9.17 2.60 1.56
3.65 4.00
9.72 5.52 7.47
8.35 13.9
10.3 15.0 25.3
Male 12-34 35-49 50 and above
4 of 5 6 of 6
15 of 18
2.70 2.74
0.726
2.09 3.36 3.08
6.70 6.48 4.78
21.4 12.5 7.40
15.5 15.3 14.0
Note: Upper and lower confidence limits are not calculated for less than 3 samples per cell Significant figures for each compound are limited to 3

r =-1-·-= --~ ,--·-::c- - ~ f ., _------, -, .. .,__ r ....:-" -::.,_ 1 -_:--_- 7 1---= -_- =, f"=-----"r-::...-==i i-,;,,:;,-;i~-=t_ ~F'-'·~ ,c1,--=="• _,.-::..,,:;--,::.Jr-•~.
f ...:::- \_-T-- -I
Table 4-24 (continued)
O'I \.0
Lower Number of Minimum 95% limit
detects/ detected of geometric number of level mean
Compound (No.) Sex Age group specimens (pg/g) (pg/g)
12378-PeCDD (5) Female 12-34 2 of 2 7.84 35-49 14 of 14 4.24 7.15 50 and above 12 of 12 1.98 6.40
Male 12-34 2 of 5 5.03 35-49 6 of 6 4.97 6.34 50 and above 18 of 18 5.63 8.82
123478-HxCDF (6) Female 12-34 2 of 2 8.28 35-49 13 of 14 3.55 5.06 50 and above 9 of 12 1.69 3.40
Male 12-34 3 of 5 3.76 1.32 35~49 5 of 6 5.72 5.00 50 and above 17 of 18 4.16 6.13
123678-HxCDF (7) Female 12-34 2 of 2 5.63 35-49 11 of 14 2.02 2.83 50 and above 8 of 12 1.83 2.85
Male 12-34 2 of 5 2.89 35-49 5 of 6 3.78 3.55 50 and above 17 of 18 2.43 3.80
234678-HxCDF (8) Female 12-34 2 of 2 1.96 35-49 9 of 14 0.741 1.030 50 and above 6 of 12 0.528 0.683
Male 12-34 2 of 5 1.37 35-49 4 of 6 0.906 0.797 50 and above 17 of 18 0.619 0.941
Geometric mean of detected
levels (pg/g)
8.90 10.3 10.2 8.77 8.77 10.6 9.14 6.74 6.12 · 6.01 9.02 7.44 6.77 4.00 4.65 3.15 4.28 4.85 2.03 1.47 1.53 3.66 1.59 1.40
Upper 95% limit Maximum
of geometric detected mean level (pg/g) (pg/g)
10.1 14.8 39.1 16.1 24.9
15.3 12.2 12.3 12.7 25.2
10.1 8.98 13.5 11.0 17.2 27.4 12.0 16.3 17.3 9.04 16.7
8.13 5.66 7.31 7.59 11.9
3.43 5.17 5.53 6.20 12.7
2.10 2.10 3.27 3.44 4.28
9.80 3.17 2.38 2.09 10.5
Note: Upper and lower confidence limits are not calculated for less than 3 samples per cell Significant figures for each compound are limited to 3

Table 4-24 (continued)
-......J a
Number of detects/
number of specimens
Minimum detected
level (pg/g)
Lower 95% limit
of geometric mean (pg/g)
Geometric mean of detected
levels (pg/g)
Upper 95% limit
of geometric mean (pg/g)
Maximum detected
level (pg/g)Compound (No.) Sex Age group
123789-HxCDF (9) Female 12-34 35-49 50 and above
1 of 2 0 of 14 2 of 12
0.155 0.276 0.643
0.155 0.276 0.691
0.155 0.276 0.742
Male 12-34 35-49 50 and above
0 of 5 0 of 6 2 of 18 0.557 0.724 0.942
123478/ 123678-HxCDD (10)
Female 12-34 35-49 50 and above
2 of 2 14 of 14 12 of 12
61.8 27.8 21.9
47.1 47.9
61.9 62.4 68.1
82.6 96.7
62.0 117 149
Male 12-34 35-49 50 and above
5 of 5 6 of 6
18 of 18
15.6 20.1 40.3
20.2 32.5 71.6
47.2 57.1 87.2
110.7 100.2
106
103 87.8 164
123789-HxCDD (11) Female 12-34 35-49 50 and above
2 of 2 11 of 14 12 of 12
9.32 4.93 6.05
6.85 8.93
9.65 10.4 11.8
15.8 15.5
10.0 31.7 22.5
Male 12-34 35-49 50 and above
3 of 5 6 of 6
16 of 18
4.79 6.15 4.47
1.72 5.79 6.89
11.2 8.41 8.77
72.8 12.2 11 .1
20.3 15.7 20.0
1234678-HpCDF (12) Female 12-34 35-49 50 and above
1 of 2 11 of 14 9 of 12
10.8 4.08 4.48
6.51 6.26
10.8 9.14 9.35
12.8 14.0
10.8 20.2 20.2
Male 12-34 35-49 50 and above
2 of 5 5 of 6
17 of 18
8.85 5.94 4.82
5.77 7.03
11.8 8.12 8.62
11.4 10.6
15.8 11.5 25.8
Note: Upper and lower confidence limits are not calculated for less than 3 samples per cell Significant figures for each compound are limited to 3

r-~--,,, r-=<r.='-~ _ i,,_ (s:.-:-"'-·--"T'::;J r-:c~-~ (-~"-i ,-_:.- ----.---! ('=--==-~·•1 .f;_.-=, -7 r--=-...J<=~1 P'===i ,--.....;.;;:;.t-,-1~ f---'-""",---='-'7 P'"-".,___----,---;=,-1 "f -~-::...., -~ / -= ::::--_7' 1c:.__:::_ i,,-.:c. --- ( /-- ._.-_-_-c---_-\ F-=~-\
Table 4-24 (continued)
-...J I-'
Number of detects/
number of specimens
Minimum detected
level (pg/g)
Lower 95% limit
of geometric mean (pg/g)
Geometric mean of
detected levels (pg/g)
Upper 95% limit
of geometric mean (pg/g)
Maximum detected
level (pg/g)Compound (No.) Sex Age group
1234789-HpCDF (13) Female 12-34 35-49 50 and above
0 of 2 3 of 14 3 of 12
0.236 0.340
0.121 0.217
0.356 0.499
1.05 1.15
0.561 0.633
Male 12-34 35-49 50 and above
0 of 5 1 of 6 4 of 18
0.443 0.380 0.366
0.443 0.604 1.00
0.443 0.743
1234678-HpCDD (14) Female 12-34 35-49 50 and above
2 of 2 14 of 14 12 of 12
104 31.2 22.0
57.5 45.1
107 84.8 71.7
125 114
111 334 317
Male 12-34 35-49 50 and above
5 of 5 6 of 6
18 of 18
57.3 39.5 31.6
60.3 51.0 54.2
75.5 92.1 78.2
94.4 167 113
89.1 177 297
OCDF (15) Female 12-34 35-49 50 and above
0 of 2 9 of 14 6 of 12
0.435 0.486
0.553 0.483
0.706 1.28
0.90 3.38
0.983 4.55
Male 12-34 35-49 50 and above
1 of 5 4 of 6
13 of 18
0.946 0.379 0.275
0.362 0.577
0.946 0.737 0.747
1.50 0.97
0.946 0.988
1.37 OCDD (16) Female 12-34
35-49 50 and above
2 of 2 14 of 14 12 of 12
467 137 178
416 358
472 576 496
796 687
478 1230 949
Male 12-34 35-49 50 and above
5 of 5 6 of 6
18 of 18
152 304 199
152 298 430
394 478 553
1022 769 712
1250 1060 1320
Note: Upper and lower confidence limits are not calculated for less than 3 samples per cell Significant figures for each compound are limited to 3

Table 4-25. Concentration Statistics by Compound and Age Group
-.J N
Number of detects/
number of specimens
Minimum detected
level (pg/g)
Lower 95% limit
of geometric mean (pg/g)
Geometric mean of
detected levels (pg/g)
Upper 95% limit
of geometric mean (pg/g)
Maximum detected
level (pg/g)Compound (No.) Age group
2378-TCDF (1) 12-34 years 35-49 years
50 and above
4 of 7
15 of 20 25 of 30
0.634 0.868 0.970
0.572 1.44 1.63
1.66 2.05 1.99
4.78 2.90 2.43
2.84 5.36 6.49
2378-TCDD (2) 12-34 years 35-49 years 50 and above
6 of 7 18 of 20 29 of 30
1.80 2.25 1.95
2.24 3.57 4.03
3.77 4.53 4.80
6.33 5.74 5.70
6.29 11.8 12.5
12378-PeCDF (3) 12-34 years
35-49 years 50 and above
1 of 7 7 of 20 5 of 30
0.591 0.305 0.257
0.326 0.231
0.591 0.665 0.430
1.36 0.797
0.591 1.93
0.876 23478-PeCDF (4) 12-34 years
35-49 years 50 and above
6 of 7 18 of 20 27 of 30
2.70 2.60
0.726
4.04 4.26 4.09
7.58 5.83 5.83
14.2 7.96 8.30
15.5 15.3 25.3
12378-PeCDD (5) 12-34 years 35-49 years 50 and above
4 of 7 20 of 20 30 of 30
5.03 4.24 1.98
4.21 7.58 8.55
8.84 9.81 10.4
18.5 12.7 12.7
15.3 39.1 25.2
123478-HxCDF (6) 12-34 years 35-49 years 50 and above
5 of 7 18 of 20 26 of 30
3.76 3.55 1.69
3.85 5.76 5.60
7.11 7.31 6.96
13.1 9.28 8.64
12.0 17.3 17.2
123678-HxCDF (7) 12-34 years
35-49 years 50 and above
4 of 7
16 of 20 25 of 30
2.89 2.02 1.83
2.18 3.25 3.89
4.62 4.09 4.79
9.77 5.14 5.89
8.13
7.31 12.7
Note: Upper and lower confidence limits are not calculated for less than 3 samples per cell Significant figures for each compound are limited to 3

~. -~-::......:.., ~ -7 i ~ ___, \ --~ ,,,. ,._ =------:_ \ ia'-----,-=-r I~ ...,=-=--7 lc-=-><-'-•=:i-1 1-·=-ri,--i,-~---,., r--,-:.;:,--------' ·~, .------~-•-·-) ,-"=-- r....:...:.r::..-'Y I---::...-~ ~-.it~ =p='1
Table 4-25 (continued)
'1 w
Compound (N_o.)
234678-HxCDF (8)
123789-HxCDF (9)
123789-HxCDD (11)
1234678-HpCDF (12)
1234678-HpCDD (13)
1234678-HpCDD (14)
OCDF (15)
OCDD (16)
Number of IMinimum detects/ detected
Age group number of specimens
12-34 years 4 of 7 35-49 years 13 of 20 50 and above 23 of 30 12-34 years 1 of 7 35-49 years O of 20 50 and above 4 of 30
J:i:iiixi!t!III Illte: :/g{ :::::e: !!ml! it!rti:!:II:ilti2 fRl J!Bi2Atnft:1@§¥.i.t1r:::rmr tAt t@$Ar 12-34 years 5 35-49 years 17 50 and above 28 12-34 years 3 35-49 years 16 50 and above 26 12-34 years o 35-49 years 4 50 and above 7 12-34 years 7 35-49 years 20 50 and above 30 12-34 years 1 35-49 years 13 50 and above 19 12-34 years 7 35-49 years 20 50 and above 30
of of of of of of of of of of of of of of of of of of
7 20 30
7 20 30 7
20 30
7 20 30
7 20 30
7 20 30
level (f)g/g)
1.37 0.741 0.528 0.155 0.276 0.557
4.79 4.93 4.47 8.85 4.08 4.48
0.236 0.340 57.3 31.2 22.0
0.946 0.379 0.275
152 137 178
Lower Geometric 95% limit mean of
of geometric detected mean (pg/g)
0.680 1.16 1.03
0.495
5.39 7.31 8.32 5.52 6.97 7.44
0.208 0.417
67.6 64.8 57.7
0.582 0.646
231 426 439
levels (pg/g)
2.73 1.51 1.44
0.155 0.276 0.707
10.5 9.66 9.95 11.5 8.81 8.86
0.376 0.557
83.5 86.9 75.5
0.946 0.715 0.885
415 545 530
Upper 95% limit IMaximum
of geometric detected mean (pg/g)
10.9 1.96 1.99
1.01
20.6 12.8 11.9 23.8 11 .1 10.6
0.679 0.744
103 117
98.8
0.879 1.21 745 697 639
level (pg/g)
9.80 3.27 10.5
0.155 0.280 0.942
20.3 31.7 22.5 15.8 20.2 25.8
0.561 0.743
111 334 317
0.946 0.988 4.55 1250 1230 1320
Note: Upper and lower confidence limits are not calculated for less than 3 samples per cell Significant figures for each compound are limited to,3
Shaded compound: Significant Age Effect (p=0.05)

Table 4-26. Concentration Statistics by Compound
49 of
57 of 519 595
---.I +"
Compound (No.)
12378-PeCDF (3) 23478-PeCDF (4) 12378-PeCDD
123478-HxCDF (6) 123678-HxCDF (7) 234678-HxCDF (8) 123789-HxCDF (9) 123478/123678 HxCDD (10) 123789-HxCDD 1
1234678-HpCDF (12) 1234789-HpCDF (13) 1234678-HpCDD (14)
:~{\t~:;:/t~t'.tl~~fi~~!i~fl/lj~i~j;~~~/j[ti~~~~f~!tt~l~~l~~fti1~i~~l[l!~\~ttf[~OCDF (15) OCDD (16)
MinimumNumber of detecteddetects/
levelnumber of (pg/g}specimens
0.63444 of 57 1.8053 of 57
1.8345 of 57 0.52840 of 57 0.1555 of 57
15.657 of 57 4.4750 of 57
Note: Significant figures for each compound are limited to 3
UpperLower Geometric Maximum950/o limitmean of950/o limit detectedof geometric detectedof geometric
levelmeanlevelsmean (pg/g)(pg/g}(pg/g)(pg/g)
6.492.321.981.68 12.55.184.584.04
12.75.184.513.93 10.51.931.551.25
0.9421.260.5220.217 16477.968.359.8
31.711 .39.918.66

,---) r-•·-.- (-- -::,-,.-··1 f', • ··,:---·7 =-,-,-:,:i J"~---1:··1 ~-=>i r--"i...:.r. -, r1_.---=J-,1..,1 1 --= =· f;..,_____:_-,
Table 4-27. Overall Analysis of Variance Results -Significance
Sample level of No. Compound size F-statistic Comments
1 2,3,7,8-TCDF 44 0.59 2 2,3,7,8-TCDD 53 0.31 3 1,2,3,7,8-PeCDF 13 0.31 Significant sex effect (p = 0.07)4 2,3,4,7,8-PeCDF 51 0.84 5 1,2,3,7,8-PeCDD 54 0.76 6 1,2,3,4,7,8-HxCDF 40 0.82 Batch 1 results not included
........ 7 1,2,3,6,7,8-HxCDF 40 0.87 Batch 1 results not includedU1
8 2,3,4,6,7,8-HxCDF 40 0.88 9 1,2,3,7,8,9-HxCDF 5 0.07 Significant age effect (p = 0.05)
10 l,2,3,4,7,8/l,2,3,6,7,8-HxCDD 57 0.03 Significant age effect (p = 0.04)11 1,2,3,7,8,9-HxCDD 50 0.81 12 1,2,3,4,6,7,8-HpCDF 45 0.86 13 1,2,3,4,7,8,9-HpCDF 11 0.49 14 1,2,3,4,6,7,8-HpCDD 57 0.56 15 OCDF 33 0.44 16 OCDD 57 0.50 Significant city by sex
interaction (p = 0.04}

SECTION 5.0
REVIEW OF EXISTING INFORMATION ON HUMAN BODY BURDEN LEVELS OF PCDDs AND PCOFs
This section reports on studies of PCDD and PCDF residue levels in human tissues. Data from U.So as well as international studies are included. Efforts are included to determine whether persons exposed to environmental or occupational levels of PCDDs and PCDFs can be identified through body burden measurements are discussed. Data are also presented on the distribution of PCOOs and PCOFs in specific tissues. Studies of other factors (such as ageand sex) that are apparently correlated with body burden levels are also reviewed.
5.1 Literature Search
A 1iterature search was conducted to review the state-of-the-art methods of analysis, to compile body burden data from other specific population studies, and to review potential exposure based on geographic area. The literature search was conducted via automated computer compilation of citations from chemical abstracts from ca. 1980 through 19870 MRI had prepared a review of the literature on the analysis of biological samples for PCDOs and PCDFs in 1983 (Stanley, 1984; Stanley et al., 1985) which provided a valuable source of information o Much of the current information on the body burden levels of PCOOs and PCDFs is not readily found in the open literature.
The most useful references are found in the Proceedings of the national American Chemical Society symposium on dioxins in the environment and from the Proceedings of the 5th International Dioxin Conference held in 1985 {Bayreuth 9
F.RoGo). The 6th and 7th international dioxin conferences were held in 1986 (Fukuoka, Japan) and in 1987 {Las Vegas, Nevada).
Additional data on human body burden levels were presented at the 8th International Dioxin Conference (Umea, Sweden). The data on human body burden levels from the studies presented at these conferences have not yet been published~ but some information has been gleaned from reviewing the extended abstracts from the international conference program listings.
The literature search on analytical methods proved to be more successful due to the fact that the state-of-the-art techniques have matured and specific procedures have been extensively validated and reported to the scientific community for review.
76

5.2 General Population Studies
Several studies have been reported that describe the results of the efforts to determine body burden 1eve1s of PCDDs and PCDF s in the general popu 1at ion. These studies were based on the analysis of adipose tissue samples from distinct areas of the continental United States as well as from various other parts of the world.
5.2.1 Body Burden Data from the Continental United States I l Figure 5~1 presents an overview of locations in the continental United
States where studies on body burden levels of PCDDs and PCDFs have been conducted. More specifically, these studies have focused on a limited number of individuals from Binghamton, New York (Schecter et al., 1986),Atlanta, Georgia (Patterson et al., 1986), Salt Lake City, Utah {Patterson et al., 1986), St. Louis, Missouri {Graham et al., 1986a,1986b), and the State of Missouri {Patterson et al., 1986c). The studies that were conducted using samples from Binghamton, New York, and St. Louis, Missouri, were focused on the determination of total PCDDs and PCDFs. The studies conducted with the samples from the states of Missouri, Georgia, and Utah, however, focused solely on the levels of 2,3,7,8-TCDD (Patterson et al., l986,l986c,1986d).
Only one study has been reported that provides estimates of the generalU.S. population body burden levels of the tetra- through octachloro PCDD and PCDF congeners. These estimates were determined from samples compas i ted from the U.S. Environmental Protection Agency' s National Human Adipose Tissue Survey, NHATS (Stanley et al., 1986b; Stanley 1986c).Forty-six composite tissue samples of approximately 20 g each were prepared from approximately 900 adipose specimens from the NHATS fiscal year1982 repository. The composite samples were stratified by age (0-14,
·15-44, and 45 plus years) and nine census regions (Figure 5-2). This r study is unique in that the lower age groups (specifically the
0-14 years) were included in the study design and that certain composites were statistically weighted such that relevant information could be obtained on potential sex and race differences.
Table 5-1 presents the mean concentrations of the PCDD and PCDF congenersin the FY82 NHATS composites. The data for the tetra- through octachloro PCDD and PCDF congeners from the FY82 NHATS composites are compared with the results from the analysis of samples from St. Louis, Missouri (Graham et al., 1986a,1986b) and Binghamton, New York (Schecter et al., 1986a) in Figure 5-3. Also included in Figure 5-3 are the results of the analysisof up to 46 adipose tissue specimens collected in Canada (Ryan et al., 1986b).
The data in Figure 5-3 are reported as mean wet weight concentration in picograms per gram (pg/g or 10- 12 g/g or parts per trillion). The figurereflects that the most predominant compounds were detected in all studies, provided sufficiently sensitive instrumentation was available for the measurement. This illustration also shows that the levels of the compounds tend to follow the same relative patterns of concentration from study to study.
77

-..J \\ \ \ \'' rr=,,,,ft~t I t00 ' \ \ \ \ '\. ❖:❖·•·····=·=•:•···· ,:::-:,::::::::;:::;:::;• I :
Figure 5-1. U.So geographic regions where studies on body burden levels of PCDDs and PCOFs have been or will be conducted.

~ ,.-, -----,--- I f-;-----_c___::, • l
,--::., .... -1 .-=r....... ,, )c::..l•••-=-...c..>; r...:.=-~- ·l
p~J':.-~,-=1-"-----=--1i--::~rs,=-=-~ ;--::..,•-= I \-·- -;--- -:::..::._-~~ -7 ,----=--•-17--~-·- --,
--.J
'°
Pacific
Mountain
West North Central
West South Central
East North Central
East South Central
New England
Middle Atlantic
South Atlantic
Figure 5-2. U.S. geographic strata considered in the FY82 NHATS study.

Table 5-1. PCODs and PCDFs in NHATS FY82 Composite Specimens
Mean concentration Homolog (pg/g) Range (pg/g)
2,3,7,8-TCOD 5o0 ± 208 NO (LO) - 10
1.2.3.7 ,8-PeCDO 32 ± 38 ND (LO) - 180
HxCDDa 72 ± 70 lo9 - 330
1,2,3,4,7,8,9-HpCOO 87 ± 78 ND (23) - 390
1,2,3,4,6,7,8,9-0CDD 560 ± 290 64 - 1250
2,3,7,8-TCDF 9.1 ± 9.6 ND (2.0) - 32
2,3,4,7,8-PeCDF 27 ± 16 ND (1.8) - 77
HxCDFa 18 ± 8.3 2.9 - 35
1,2,3,4,6,7,8-HpCOF 18 ± 12 ND (10) - 55
1,2,3,4,6,7,8,9-0COF 60 ± 110 ND {2.0) - 360
Source: Stanley, J. S., K. Boggess, J. Onstot, T. Sack, J. Remmers, J. Breen, F. W. Kutz, P. Robinson, and G. Mack. 1986b. Chemosphere, 15, 1605-1612.
a Reference compounds were not available to specify isomers.
80

-_ i ... ~ I- ___::__- -1-:.::-----1.-...., f- ==, ,--::~_._,.., ----c::----'-1 ~==...::::....., ,~,·'\ 1--;::::,,,.i=c::::.i 1.-~~ ~~re-='1 .u___.Jr,=--,.~ 1....---~!..f I
PCDDs & PCDFs IN HUMAN A.DIPOSE SAMPLES Mean Wet Weight Concentrations (pg/g)
TCDF TCDD PeCDF PeCDD HxCDF HxCDD HpCDF HpCDD OCDF OCDD
r-.. (JI
' (JI
0. '-"
C 0
'.µ tJ L
00 .µ ,_. C
Q) u C 0 u C tJ Q)
2
130 ~--------------------
120
110
100
90
80
70
60
50
40
30
20
10
0 lfl 1£1>1 101 '<Ill IOI ICI I IOI l<llf l<llf IOI 1£1 I
1.3
1.2
1. 1
1
0.9
0.8
0.7
0.6
0.5
0.4
0.3
0.2
0.1
0
~ (D 0 ::J
0 "o-I ::J ::ro 0 (D C ::J to no , ::J ~ a.-·14 0 '-J :J
...... "O IQ
' IQ '-"
I I I I
! I
I I
~ NHATS82 Study ~ Canada Study IXZJ New York Study ~ St. Louis Study
Figure 5-3. Average wet weight tissue concentration of PCDDs and PCDFs in human adipose tissue from the continental United States and Canada.

The results of the analysis for 2,3,7,8-TCDD for the FY82 NHATS composites are presented in Figure 5-4 in greater detail along with the results of the analysis of the specimens from Atlanta, Georgia, Salt Lake City, Utah, and St. Louis, Missouri. This figure plots the percentage of samples in each study detected in specific concentration intervals. The concentrations are reported in picograms per gram based on wet tissue weight. This figure demonstrates that the 2,3,7 9 8-TCDO was detected in each study at levels ranging from less than 1 pg/g to approximately 20 pg/g. Most of the samples, however, fall within the 2 to 12 pg/g concentration range.
In addition to these studies, the Centers for Disease Contra l (Anon, 1987) have reported on the results of a study to determine the levels of 2,3,7,8-TCDD in Vietnam veterans who served as ground troops as well as in a control population. Preliminary study results based on blood serum levels (adjusted for lipid content) are shown in Figure 5-5. This figure shows that the mean concentrations of 2,3,7,8-TCDD for both the control group and the Vietnam veterans are within the same range of Oto 10 pg/g as determined in the general U.S. population studies discussed above.
Several studies have been undertaken within the last two years to assess the body burdens of PCDOs and PCDFs in the general population as well as specific exposed groups. These studies include the analysis of additional composite samples from the NHATS 1987 collection; the completion of a collaborative effort between the Veterans Administration and EPA 1 s Office of Toxic Substances; a study of chemical workers by NIOSH and CDC; a continuation of the Vietnam Veterans Study conducted by CDC and two studies undertaken by the California Department of Health Services to address specific exposure instances (residents from Oroville, California, and i ndivi duals consuming contami riated fish). Unfortunately, the data from these studies are not available for review or comparison at this time.
5.2¢2 Body Burden Data from International Studies
Body burden measurements of PCODs and PCOFs have also been conducted on samples from various global regions including Canada (Ryan et al., 1985,1986), Sweden (Nygren et al¢ 9 1986) 9 Germany (Thoma et al., 1987; Beck et al, 1987), Japan (Ryan et al.9 1986a; Ono et al.9 1986) 9 and the north and south of Vietnam (Schecter et al., 1986b, Dai et al., 1987).
Canada: Ryan et al. (1985,1986) reported the results of the analysis of 46 adipose tissue samples that were collected during autopsies. The mean concentration values for each of the PCOOs and PCOFs are presented in Figure 5-3 and are compared to the results for the FY82 NHATS composites and the data generated from samples collected in Binghamton, New York (Schecter et al., 1985a) and St. Louis, Missouri (Graham et al., 1986a,1986b). The data in this figure indicate that the concentration levels and the relative ratio of the PCOOs and PCOFs are fairly consistent for North America (United States and Canada).
82

i (.a>""---,...-- -"I
,, ---cc_---~ r.,-------=----- --, ;---~--- ,-==-!i: ~"'---"I r·--==--------.. µ::--=--;7 F==.::;_<_ :~r~ ,--n---~-) ~F"'4 p.-r---:;--.; J I ':..:l:;-.· 7 p-;-:..~-·1,,:__ "'"•-- '1
2,3, 7,8-TCDD IN ~1UMAN ADIPOSE SAMPLES Wet Weight Concentration (pg/g)
35% ---------------------------,
30%
>. 25%u :::J
4-1 (/)
C·-II)
20% Q)
a. I ~ ~~ ~ t:'j I
0-1 1-3 3-5 5-7 7-9 9-11 11-13 13-15 15-17 17-19 19-21:
Dioxin Adipose Level (ranges in pg/g)
f?E) NHATSB2 Study . ~ .... CDC (Atlanta/Utah) ~ St, Louis Stu:dy
Figure 5-4. Distribution of the frequency of detection of 29 3,7,8-TCDD from specific human adipose tissue studies.
E 0 Ill
00 .....w C Q) u L V
0..
15%
10%
5%
[VJ I) XYl [Yl [ t:I~ XXlt/J ro,:nc, ro:y:rv:1 rn4 na ro)r.a rnyoo royrYJ , , ,0% I 1

C -Q)
~ Q)
Cl.,
00 ~
C -Q)
~ Q)
a..
30
25
20
15
10
5
0 ~41/4L/4fll4W1::rni t f t JQ I I I
25 Non..Vietnam Veterans (n=75)
20
15
to
5
0 r«r<<1 «,vu;::«ru:1«qr<q« t I«tj 1 1 1
1 2 J <4 5 6 7 8 9 10 11 12 13 1( 15 16 17 18 19 20 21 22 23 24 25 26
TCDD Levels (parts per trillion)
Vietnam Veterans (n:444)
Figure 5-5. Serum 213g7 9 8-TCDO levels of Vietnam and non-Vietnam veterans participating in the Agent Orange validation studies--preliminary data 1987.
Source: Anon. 1987. Morbidity and Mortality Weekly Report, 36(26), 470-475.

1
!I
I II li
Sweden: Nygren et al. (1986) reported the PCDD and PCDF levels for 31 adipose tissue samples collected in Sweden. The adipose tissue samplesfor this study were collected from 13 persons who were reportedly exposed to phenoxy herbicides and 18 nonexposed controls. A total of 17 of the 31 persons from whom adipose tissues were collected were classified as cancer patients. The data from this study are presented in Table 5-2. Mean concentration values and the range of measured concentrations are provided for the total sample set and the respective subclassification of exposed versus nonexposed and cancer patient versus noncancer patient.The data generated in this study are comparable with the data generatedfrom the various studies conducted within the United States. The PCODs and PCDFs detected are limited to the 2,3,7,8-substituted compoundso
The general trends of the concentrations of the individual congeners are similar to those reported in the other studies cited previously in this interim report. Nygren et al. (1986) indicate a slight difference in concentration of the PCDDs and PCDFs in exposed patients versus nonexposed patients, especially for the 2,3,4,7,8-PeCDF. However, no statistical confirmation is provided with the data to indicate the significance of this observation. Also, the data from that study were reportedsuch that additional information on age or sex of the patients is not available to the reader.
Federal Republic of Gennany: Two studies that are currently. beingconducted in the Federal Republic of Germany were reported at the 7th International Dioxin Conference, Las Vegas, Nevada, October 1987. These studies are focused on the levels of PCDDs and PCDFs in both the generalpopulation and occupationally exposed workers. Thoma et al. (1987)reported on the PCDD and PCDF levels in 19 samples of human fat from persons· from the Munich area. The subjects were of different ages and health conditions. As noted in the other studies summarized in this report, only compounds with a 2,3,7,8-substitution pattern could be detected. The minimum and maximum concentrations of PCDD and PCDF found in adipose tissue in this study are listed below:
min. max.
TCDD < 1.0 18.2 PCDD 3.5 54.4 H6CDD 52.3 298.0 H7 CDD 49.4 220.0 OCDD 327.2 973.0
TCDF 1.0 12.4 PCDF 13.0 77 .7 H6CDF 18.9 78.8 H7 CDF 9.7 55.3 OCDF < 2.0 24.0
The levels of PCDDs and PCDFs in adipose tissue of occupationally exposedworkers were reported by Beck et al. (1987). These data were reported as part of a comprehensive study on the health risks for TCDD-exposed
85

Table 5-2. Levels of PCDDs and PCDFs Found in Human Adipose Tissue from the Swedish Populationa
Mean Mean value Mean
Mean value Mean value cancer value value Range exposed Range nonexposed Range pat. Range noncancer Range
Compound n=31 n=31 n=l3 n=13 n=l8 n=l8 n=l7 n=17 n=l4 n=14
2,3,7,8-TCDD 3 0-9 2 0-9 3 2-6 3 2-9 3 2-6 1,2,3,7,8-PeCDD 10 3-24 6 3-24 9 4-18 9 4-24 9 3-18 1,2,3,6,7,8-HxCDO 15 3-55 19 8-55 12 3-18 18 3-55 12 8-18 1,2,3,7,8 9 9-HxCDD 4 3-5 5 3-13 4 3-5 4 3-13 4 3-5 l,2,3,4,6,7,8-HpCDD 97 12-380 104 20-380 85 12-176 100 12-380 85 20-168 OCDD 414 90-763 398 90-763 421 98-679 408 90-620 421 182-763
2,3,7,8-TCDF 3.9 0. 3-11 3.7 0-7.2 4.2 0.3-11 3.4 0.3-7.2 4.6 0-11 00 2,3,4,7,8-PeCDF 54 9-87 50 15-87 32 9-54 45 9-87 33 11-65 m 1,2,3,4,7,8/
1,2,3,4,7,9-HxCDF 6 1-15 7 2-15 5 1-6 6 1-15 5 2-7 1,2,3,6,7,8-HxCDF 5 1-13 5 2-13 4 1-5 5 1-13 4 2-7 2,3,4,6,7,8-HxCDF 2 1-7 2 1-7 2 1-4 2 1-7 2 1-4 1,2,3,4,6,7,8-HpCDF 11 1-49 14 5-49 10 1-18 13 1-49 10 5-16OCDF 4
Source: Nygren et al. 1986. In Chlorinated Dioxins and Dibenzofurans in Perspective.
a Values given in pg/g on a wet weight basis.
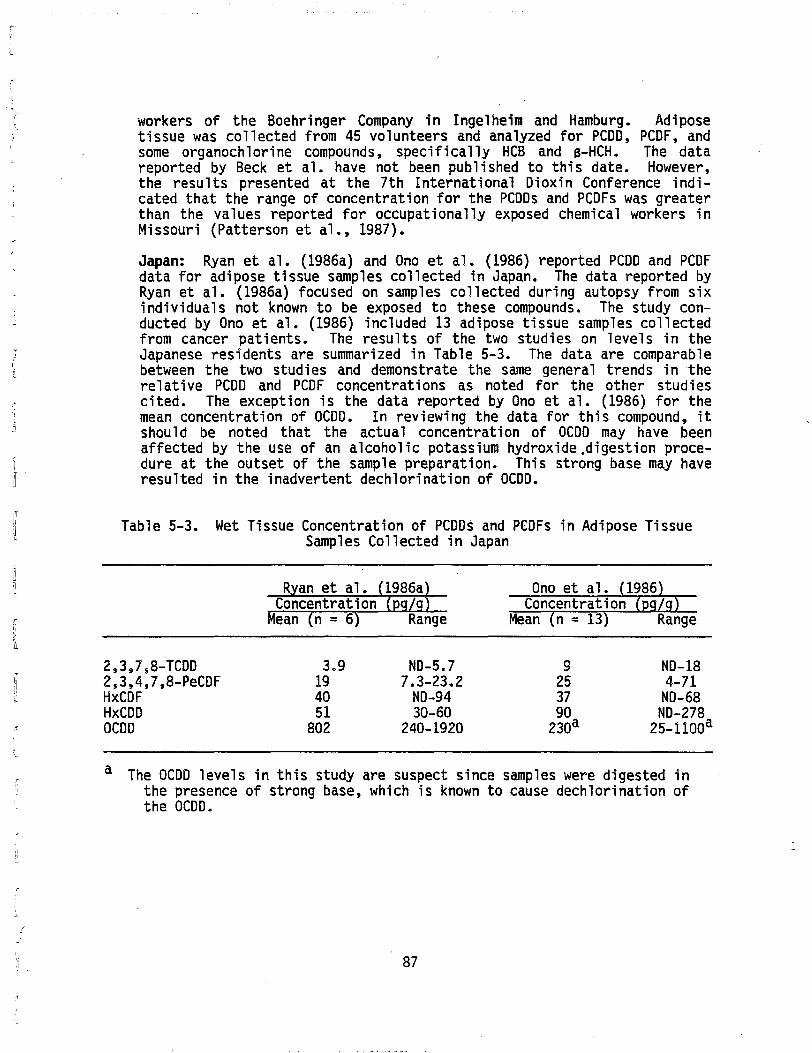
l
r !,i 1 !l
workers of the Boehringer Company in Ingelheim and Hamburg. Adiposetissue was collected from 45 volunteers and analyzed for PCDD, PCDF, and some organoch l ori ne compounds, specifically HCB and s-HCH. The data reported by Beck et al. have not been published to this date. However, the results presented at the 7th International Dioxin Conference indicated that the range of concentration for the PCDDs and PCDFs was greaterthan the values reported for occupationally exposed chemical workers in Missouri (Patterson et al., 1987).
Japan: Ryan et al. (1986a) and Ono et al. {1986) reported PCDD and PCDF data for adipose tissue samples collected in Japan. The data reported byRyan et al. (1986a) focused on samples collected during autopsy from six individuals not known to be exposed to these compounds. The study conducted by Ono et al. (1986) included 13 adipose tissue samples collected from cancer patients. The results of the two studies on levels in the Japanese residents are summarized in Table 5-3. The data are comparablebetween the two studies and demonstrate the same general trends in ·the relative PCDD and PCDF concentrations as noted for the other studies cited. The exception is the data reported by Ono et al. (1986) for the mean concentration of OCDD. In reviewing the data for this compound, it should be noted that the actual concentration of OCDO may have been affected by the use of an alcoholic potassium hydroxide.digestion procedure at the outset of the sample preparation. This strong base may have resulted in the inadvertent dechlorination of OCDD.
Table 5-3. Wet Tissue Concentration of PCDDs and PCOFs in Adipose Tissue Samples Collected in Japan
R an et al. Ono et al. Concentration Concentration
Mean n = 6 Mean n = 13
1986
2,3,7 5 8-TCOO 3.9 N0-5.7 9 ND-18 2,3,4,7,8-PeCDF HxCOF
19 40
7.3-23.2 N0-94
25 37
4-71 N0-68
HxCOD 51 30-60 90 N0-278 ocoo 802 240-1920 230a 25-llOOa
a The OCOD levels in this study are suspect since samples were digested in the presence of strong base, which is known to cause dechlorination of the OCOD.
87
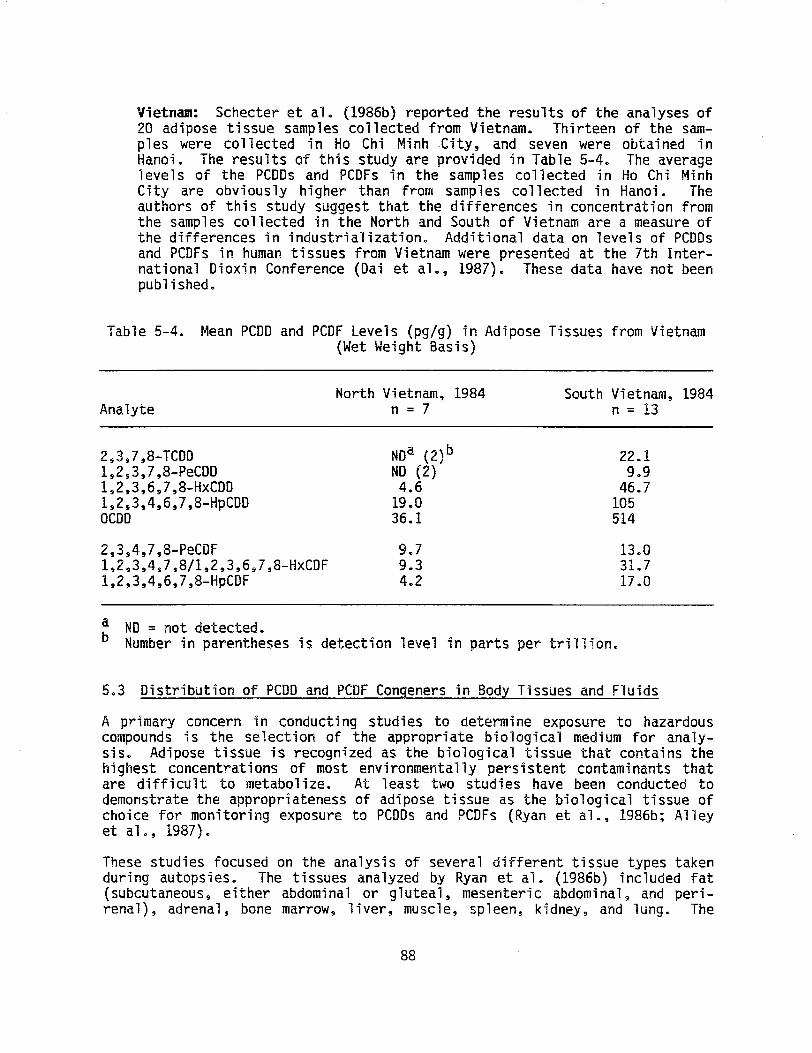
Vietnam: Schecter et al. (1986b) reported the results of the analyses of 20 adipose tissue samples collected from Vietnam. Thirteen of the samples were collected in Ho Chi Minh City, and seven were obtained in Hanoi. The results of this study are provided in Table 5-4. The average levels of the PCDDs and PCDFs in the samples collected in Ho Chi Minh City are obviously higher than from samples collected in Hanoi. The authors of this study suggest that the differences in concentration from the samples collected in the North and South of Vietnam are a measure of the differences in industrialization. Additional data on levels of PCDDs and PCDFs in human tissues from Vietnam were presented at the 7th International Dioxin Conference (Dai et al., 1987). These data have not been published.
Table 5-4. Mean PCDD and PCDF Levels (pg/g) in Adipose Tissues from Vietnam {Wet Weight Basis)
North Vietnam, 1984 South Vietnam, 1984 Analyte n = 7 n = 13
2s3,7,8-TCOO Noa (2)b 22.1 1,2,3,7,8-PeCDD ND (2) 9.9 1,2,3,6 9 7,8-HxCDO 4.6 46.7 1,2,3,4,6,7,8-HpCDD 19.0 105 OCDO 36.l 514
2,3,4,7,8-PeCOF 9.7 13.0 l,2 9 3,4s7,8/l,2,3,6,7,8-HxCDF 9.3 31.7 1,2,3,4,6,7,8-HpCOF 4.2 17.0
a NO= not detected. b Number in parentheses is detection level in parts per trillion.
5.3 Distribution of PCDD and PCDF Congeners in Body Tissues and Fluids
A primary concern in conducting studies to determine exposure to hazardous compounds is the selection of the appropriate biological medium for analysis. Adipose tissue is recognized as the biological tissue that contains the highest concentrations of most environmentally persistent contaminants that are difficult to metabolize. At least two studies have been conducted to demonstrate the appropriateness of adipose tissue as the biological tissue of choice for monitoring exposure to PCODs and PCDFs (Ryan et al., 1986b; Alley et al., 1987).
These studies focused on the analysis of several different tissue types taken during autopsies. The tissues analyzed by Ryan et al. (1986b) included fat (subcutaneous, either abdominal or gluteal, mesenteric abdominal 9 and perirenal), adrenal, bone marrow, liver, muscle, spleen, kidney, and lung. The
88

r
i/
R I_
r,,
tissues were selected on the basis of their known accumulation of lipidsoluble compounds or due to their importance in metabolism of xenobiotics. Samples were collected from three different autopsies. The data were reportedbased on tissue levels for each specific autopsy.
The PCDD and PCDF levels varied widely based on tissue type when the data were reported based on the initial wet tissue weight. For example, a factor of approximately 36 was noted for the ratio of wet tissue concentration of total PCDDs in subcutaneous fat to lung tissue from a particular autopsy. However, when the tissue concentrations were calculated based on the amount of extractable lipid, these values resulted in approximately a 1:1 ratio. Calculations of all tissue concentrations based on extractable lipid significantly reduced the variability on reported concentrations.
The study conducted by Alley et al. (1987) focused more specifically on the distribution of PCDDs and PCDFs in adipose tissues collected from up to five ·anatomical sites for two individuals (one male and one female). The adiposetissue samples analyzed were collected from the breast (female only), buttock, abdomen, omentum, kidney, and heart. An example of the results of the analyses is presented in Figure 5-6. Only results for the hexa- through octachloro congeners are shown, a1though the data for the tetra- and pentach1oro congeners are within the precision noted for the higher chlorinated compounds.
As noted in Figure 5-6, little to no difference in residue levels was detected between the various adipose tissues. This study and also that conducted byRyan et al. (1986b) imply that results of adipose tissue studies should be comparable if corrections are made for the percent extractable lipid for each tissue type. More importantly, the normalization of residue levels based on the extractable lipid should allow latitude in collection of samples for population studies.
Additional studies have been conducted to determine the feasibility of usinghuman blood serum rather than adipose tissues to determine PCDD and PCDF bodyburden levels. The impetus for pursuing blood serum over adipose tissue is an issue of the ease of collection via the relatively noninvasive procedure of blood collection and of separation of serum.
As part of the study .on the residents of Times Beach, Missouri, the Centers for Disease Control (Patterson et al., 1986b) collected up to 200 g of blood serum in addition to adipose tissue from the study participants. Each matrix was analyzed for 2,3,7,8-TCDD following similar analytical protocols. The results of that study demonstrated a strong correlation {R = 0.98) between the residue levels of 2,3,7,8-TCDD in adipose tissue and the serum concentration based on an extractable lipid basis.
Figure 5-7 illustrates this high adipose tissue/blood serum correlation. As noted in the figure, the blood serum concentration is plotted as parts pertrillion (pg/g) based on a lipid weight basis vs. the adipose tissue concentration adjusted for extractable lipid. If the concentration of PCDDs and PCDFs in serum is based on the total mass of the sample rather than the lipid content, the concentration values would be equivalent to parts per quadrillionc10-1s g/g).
89
L


