Embed Size (px)
Citation preview
THE EFFECTS OF A CULTURALLY SENSITIVE HIGH SCHOOL
INTERVENTION PROGRAM FOR NATIVE HAWAIIANS ON STUDENT
ALIENATION, ACADEMIC ACHIEVEMENT, AND DROPPING OUT
A DISSERTATION SUBMITTED TO THE GRADUATE DIVISION OF THEUNIVERSITY OF HAWAI'I IN PARTIAL FULFILLMENT OF THE
REQUIREMENTS FOR THE DEGREE OF
DOCTOR OF PHILOSOPHYIN
EDUCATIONAL PSYCHOLOGY
December 2004
ByBeverly J. Barnard
Dissertation Committee:
Shuqiang Zhang, ChairpersonSelvin Chin-Chance
Ronald H. HeckMorris K. LaiAlan R. Shoho

© Copyright 2004
by
Beverly Joyce Barnard
III

ACKNOWLEDGEMENTS
I would like to acknowledge all those who supported
me throughout my graduate program. I am particularly
grateful for the encouragement from my children, Kathryn
and Nicholas Mitchell. In addition, I thank the members of
my committee, especially Shuiqiang Zhang, for their
enduring patience and on-going guidance to complete this
great project~ Finally, ! thank my good friend Sarah who
stood by me each step of the way from beginning as study
partners for the qualifying exams to this final step.
Thank you all, good friends.
iv
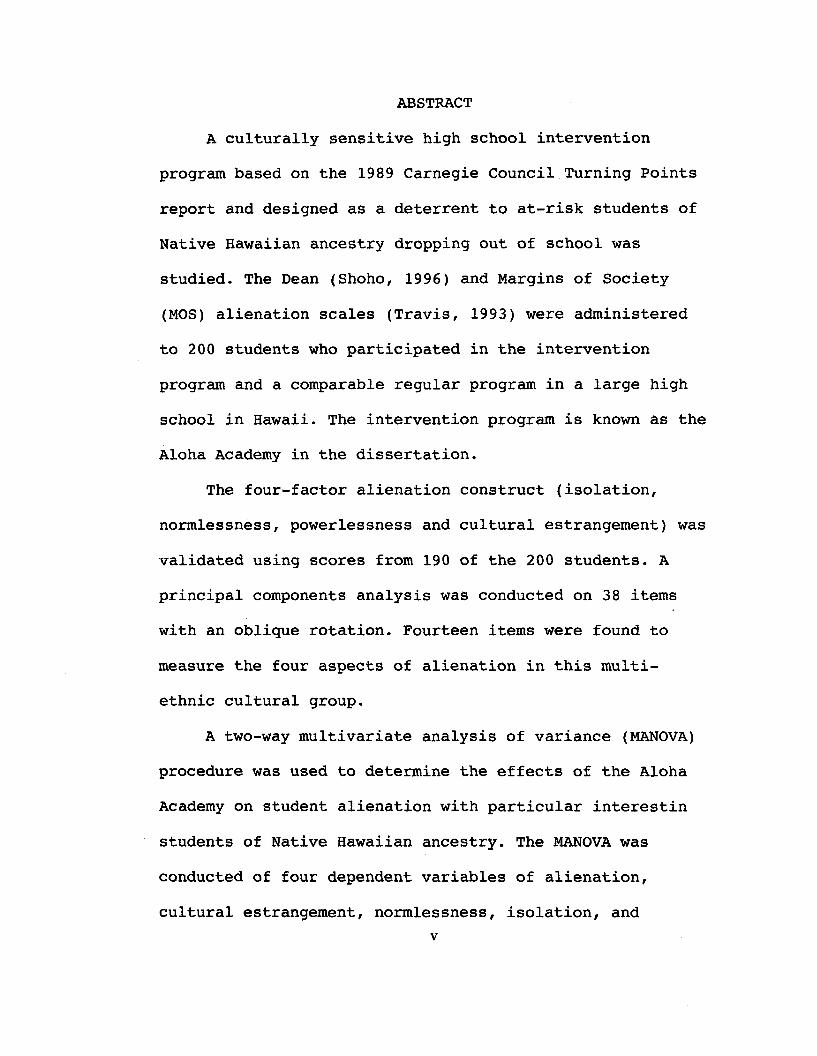
ABSTRACT
A culturally sensitive high school intervention
program based on the 1989 Carnegie Council Turning Points
report and designed as a deterrent to at-risk students of
Native Hawaiian ancestry dropping out of school was
studied. The Dean (Shoho, 1996) and Margins of Society
(MOS) alienation scales (Travis, 1993) were administered
to 200 students who participated in the intervention
program and a comparable regular program in a large high
school in Hawaii. The intervention program is known as the
Aloha Academy in the dissertation.
The four-factor alienation construct (isolation,
normlessness, powerlessness and cultural estrangement) was
validated using scores from 190 of the 200 students. A
principal components analysis was conducted on 38 items
with an oblique rotation. Fourteen items were found to
measure the four aspects of alienation in this multi
ethnic cultural group.
A two-way multivariate analysis of variance (MANOVA)
procedure was used to determine the effects of the Aloha
Academy on student alienation with particular interestin
students of Native Hawaiian ancestry. The MANOVA was
conducted of four dependent variables of alienation,
cultural estrangement, normlessness, isolation, andv

powerlessness. The independent variables were program
(Aloha Academy vs. regular program) and ethnicity (Native
Hawaiian and non-Native Hawaiian. In the MANOVA, 75
students were determined to be comparable in the sample
(Aloha Academy, 36, and the ,regular program, 39). None of
the three effects from the 2 X 2 MANOVA were statistically
significant.
Three years (1997-1998 through 1999-2000) of grade
point averages (GPA), and Stanford Achievement tests (SAT)
for reading and mathematics were examined as indicators of
academic achievement. The ANCOVA procedures was used for
this analysis with the dependent variables program (Aloha
Academy vs. regular program) and ethnicity (Native
Hawaiian vs. non-Native Hawaiian). The independent
variables were GPA, and SAT Reading and Mathematics scores
from 1998-1999 and 1999-2000. The covariates were GPA and
SAT Reading and Mathematics scores from 1997-1998.
Findings from this data showed significance for the
intervention program in GPA but not for the contrast
between Native Hawaiians vs. non-Native Hawaiians after
controlling for the covariate. There was no significance
found for any of the effects with SAT scores.
The most dramatic results were found with students
who stayed in school through their senior year. Fivevi

hundred seventy-seven ninth grade students who entered
school in 1998-1999 were examined as to how the
intervention program reduces the dropout rate of Native
Hawaiian and non-Native Hawaiian students. Eighty-five
percent of the students who participated in the
intervention program during their ninth grade school year
stayed in school through their senior year (12th grade).
Seventy-two percent of students from all other programs
also stayed in school.
A logistic regression model was conducted. It was
found that students who participated in the intervention
program had lower odds of dropping out (chi square =
7.5969, P = 0.0058). The effect of ethnicity (Native
Hawaiian vs. non-Native Hawaiian was non-significant. The
interaction effect (ethnicity X program) was also non
significant.

TABLE OF CONTENTS
Acknowledgements . • • • • • • • • • • • • • • • • • • iv
Abstract
Table of Contents
List of Tables
v
•• viii
•• xi
List of Figures •
Chapter 1. Introduction . . . . . . . . . . . . . .xii
1
Background . . . ., . . . . . . . . . . . . . . .. 1
Contributions . •
Limitations of the Study
Theoretical Framework .
Chapter 2. Literature Review
Alienation
Purpose of the Study
Research Questions
Definition of Terms .
. . · . . . . . . . .
. . . . . . .
. . . . . .
. . . . . . . .
2
3
4
5
5
5
7
8
Adolescent Alienation • •
High School Student Alienation
Minority Student Alienation •
The Dropout Phenomenon
. . . . . .
· . . .
• • • 10
• • • • 12
• • • 14
• • • • 19
· . . . 23. . . . . .School Reform Recommend~tions
Turning Points 2000 • •
· . . . . . · • • 20
Native Hawaiian Culture and Adolescent Alienation • 24viii
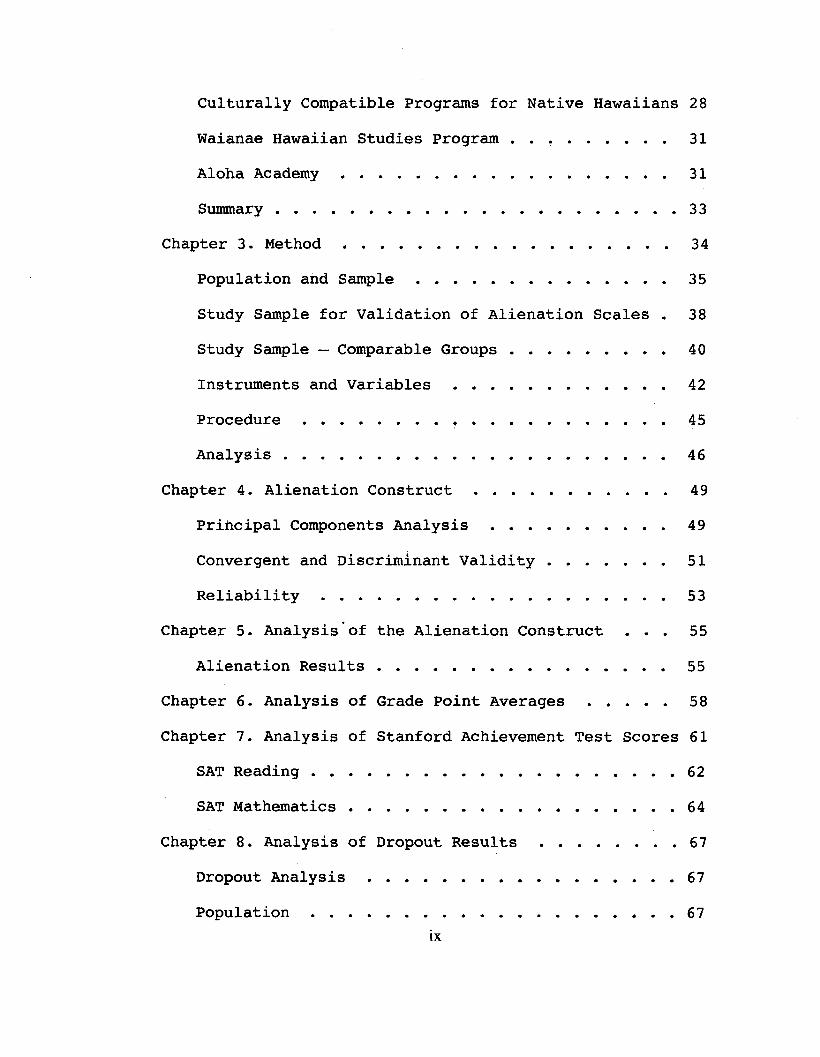
CUlturally Compatible Programs for Native Hawaiians 28
Waianae Hawaiian Studies Program • • • • • •• 31
Aloha Academy . • • . • • . • • • .• • • 31
Summary . . . . . . . . . . . . . . . . . . . . . . 33
Chapter 3. Method • . • •• .•.•.••.••. 34
Population and Sample • • • • • • • • 35
Study Sample for Validation of Alienation Scales. 38
Study Sample - Comparable Groups • •• 40
Instruments and Variables • • • • • • • • • • • . 42
Procedure . . • •. ••••••••••. 45
Analysis • • • • •• ••• • • •• 46
Chapter 4. Alienation Construct • • • 49
Principal Components Analysis . • • • •• 49
Convergent and Discriminant Validity • . • • • •• 51
Reliability • •• ••• • • • • • • . • • 53
Chapter 5. Analysis'of the Alienation Construct • •• 55
Alienation Results ••••••••. • • . 55
Chapter 6. Analysis of Grade point Averages • •• 58
Chapter 7. Analysis of Stanford Achievement Test Scores 61
SAT Reading • • .••.• • • • • • • • 62
SAT Mathematics • • • • . . • • • • • • • • • • 64
Chapter 8. Analysis of Dropout Results
Dropout Analysis ••• . • • • • • • •
Population . •• •• • • • • . • •IX
. . . . 67
• • • • 67
• 67
69
70
. 73
. • • 73
. • 74
• • 76
Dropout Data • •• .•• •••.•.•
Dropout Results •••••••• • • • • • • .
Chapter 9. Discussion ..•••••••.•.•.
summary of Research and Purpose ?f the Study
Findings of the Study • • • • •••••
Conclusions and Implications • • • • • • •
Caveats • • • . . . . . . . . . . . • • 77
Contributions and Recommendations • • • • . . • • • 78
Implications for Future Research • • • • • • • • • 78
References • • • • • • • • • • • • • • • • 80
Appendix A: Surveys • • • . • . • . •• .• • • • • 91
Survey 1 - Dean Alienation Scale • • • • • 91
Survey 2 - MOS Alienation Scale • • • . • • • . 93
x

Table
l.
2.
3.
4.
5.
6.
LIST OF TABLES
Page
Total Sample - Demographics . . . • . . • • • 40
Comparable Participants' Mean academic Scores 42
PCA Promax Factor Structure Matrix for 14 Items51
Inter-factor Correlation Matrix • • • • . 52
Descriptive Statistics of Alienation Scores. 56
Grade Point Averages: Means & Standard
Deviations • • . . • . • . • 59
7. SAT Reading Stanines by Programs .•..••• 61
8. SAT Mathematics Stanines by Programs . .• 62
9. SAT Reading Stanine Means & Standard
Deviations • • • . 63
10. SAT Math Stanine Means & Standard Deviations . 65
11. Student Population Ninth Grade 1998-1999 ••• 68
12. 1998-1999 Ninth Grade Mean Academic Scores •• 69
13. Data for Students in Class of 2002 ~ •.••• 70
14. probability for Dropping Out • • • • . 71
xi
Diagram of Student Alienation Study
Two-group Pre-post Treatment Design
Scree Plot of PCA Promax Analysis
Figure
1
2.
3.
4.
LIST OF FIGURES
Hawaiian Culture Values
xii
. . . .
• • 26
34
• • 47
• • 53
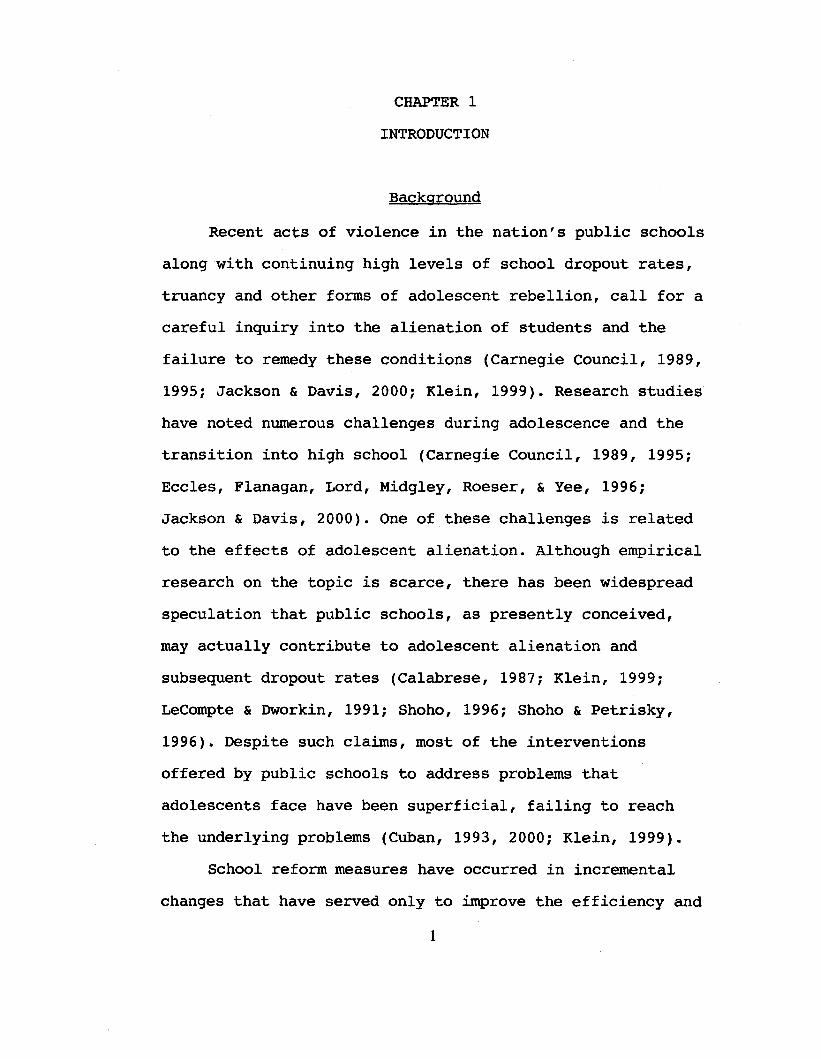
CHAPTER 1
INTRODUCTION
Background
Recent acts of violence in the nation's public schools
along with continuing high levels of school dropout rates,
truancy and other forms of adolescent rebellion, call for a
careful inquiry into the alienation of students and the
failure to remedy these conditions (Carnegie Council, 1989,
1995; Jackson & Davis, 2000; Klein, 1999). Research studies
have noted numerous challenges during adolescence and the
transition into high school (Carnegie Council, 1989, 1995;
Eccles, Flanagan, Lord, Midgley, Roeser, & Yee, 1996;
Jackson & Davis, 2000). One of these challenges is related
to the effects of adolescent alienation. Although empirical
research on the topic is scarce, there has been widespread
speculation that public schools, as presently conceived,
may actually contribute to adolescent alienation and
subsequent dropout rates (Calabrese, 1987; Klein, 1999;
LeCompte & Dworkin, 1991; Shoho, 1996; Shoho & Petrisky,
1996). Despite such claims, most of the interventions
offered by public schools to address problems that
adolescents face have been superficial, failing to reach
the underlying problems (Cuban, 1993, 2000; Klein, 1999).
School reform measures have occurred in incremental
changes that have served only to improve the efficiency and
1
effectiveness of existing strQctures of schooling rather
than transform or alter basic structures (Cuban, 1993;
Cuban & Shipps, 2000). To date, public schools have not
systematically responded in any meaningful way that
demonstrates a commitment to resolve the problems that
contribute to adolescent alienation and school failure
(Cuban & Shipps, 2000; FeIner, Jackson, Kasak, Mulhall,
Brand, & Flowers, 1997; Klein, 1999; LeCompte & Dworkin,
1991; Shoho, 1996). In fact, relatively few intervention
programs have been established to respond to the problems
associated with alienated students during these tumultuous
years (Carnegie Council, 1989, 1995; FeIner et al., 1997;
Klein, 1999; Mau, 1989, 1992; Shoho, 1996; Shoho &
Petrisky , 1996).
The difficulty in addressing adolescents' alienation
and student dissatisfaction with schools has been expressed
by many researchers (Carnegie Council, 1989). The umassive,
impersonal schools,u where most adolescents learn from
unconnected and seemingly irrelevant curricula, where they
know and/or trust few adults have been tolerated for many
years (Carnegie Council, 1989).
Purpose of the Study
This study examined an intervention program that was
designed as a school within a large high school to provide
a culturally sensitive learning environment for students of
Native Hawaiian ancestry. The basic premise was that
2
students who participated in the intervention program, the
Aloha Academy, would experience less alienation than the
comparable group in the regular program, and therefore,
attain higher levels of academic aChievement. It was
hypothesized that Native Hawaiian students within the
intervention program's culturally compatible program would
experience even more noticeable decreases in alienation
than their counterparts within the same intervention group.
It was expected that Native Hawaiian students would
demonstrate higher levels of academic achievement than
their non-Native Hawaiian counterparts. It was further
hypothesized that students who have participated in Aloha
Academy would have a lower dropout rate than all other
students in their grade cohort.
Research Questions
The specific research questions to be addressed in
this study were
(1) Can the theoretical four-factor (isolation,
normlessness, powerlessness, and cultural estrangement)
model underlying the construct of alienation be validated
with data from the adolescent population in Hawaii?
(2) Does the culturally compatible Aloha Academy
reduce the alienation felt by at-risk Native Hawaiian and
non-Native Hawaiian adolescents, as compared to their
counterparts in the regular education setting?
3

(3) Does the culturally compatible Aloha Academy
improve the grade point average (GPA) of at-risk Native
Hawaiian and non-Native Hawaiian adolescents, as compared
to their counterparts in the regular education setting?
(4) Does the cUlturally compatible Aloha Academy
improve the SAT9 Reading and Mathematics Scores of at-risk
Native Hawaiian and non-Native Hawaiian adolescents, as
compared to their counterparts in the regular education
setting?
(5) Does the culturally compatible Aloha Academy
reduce the dropout rate of at-risk Native Hawaiian and non
Native Hawaiian students?
Definition of Terms
For the purposes of this study, alienation is defined
as the gap between an individual's or groups' expectations
and experiences, or between their potentials and objective
realities (LeCompte & Dworkin, 1991). There are four
factors to further define this construct: (1) Isolation
feelings of loneliness, (2) Normlessness - value system
inconsistent with school norms, (3) Powerlessness - lack of
control over one's choices, and (4) Cultural Estrangement
feelings of anomie and social isolation based on a lack of
cultural compatibility with the school. Cultural
Compatibility is defined as the correspondence between the
organizational culture of the school and the home culture
of the child. The term Dropout is taken from the Hawaii
4

Department of Education's 2000 Superintendent's report
which describes those students in a given age range that
have not finished high school and are not enrolled in
school in a given four year period (BIDOE, 2002).
Limitations of the Study
The population was teacher- and self-selected
participants in the Aloha Academy who were registered one
full year and a comparable group of 9th grade students in
the regular education classes. A limitation was that some
comparable students had been removed to alternative classes
that did not provide a comparable education experience.
This factor did figure in the overall analysis of students
who dropped out of school by the 12th grade.
Theoretical Framework
The premise of this study is based on Bronfenbrenner's
bio-ecological model. Briefly described, this model
presents a conceptual framework that addresses the issue
that hereditability measures only a proportion of variation
in individual human differences, whereas the environment
contributes to the psychological growth in Hpro~imal
processes" or Hnature vs. nurture" concept (Bronfenbrenner
& Ceci, 1994).
Contribution§
This study adds to the research on school alienation
and high school dropouts in the following ways. First,
there are very few studies involving the alienation of
5

Native Hawaiian students. Second, there are few studies of
Native Hawaiian students' achievement pertaining to
dimensions of alienation. Third, this study contributes to
the body of work that addresses recommendations of the
carnegie Council Turning points and Great Transitions
reports (1989, 1995). Fourth, this is the first study to
examine the effects of an intervention program designed to
alleviate the problems of alienation and low academic
achievement associated with cUlturally incompatible
schooling in Hawaii. Fifth, this study provides a
significant look at an intervention program that provides a
deterrent to at-risk students dropping out of school.
6
Chapter 2
LITERATURE REVIEW
In 1989, the Carnegie council on Adolescent
Development published Turning Points: Preparing American
Youth for the 21st Century, a report examining the problems
of adolescence. This report noted that lIa volatile mismatch
exists between the organization and curriculum of middle
grade schools and the intellectual and emotional needs of
young adolescents" (Carnegie Council, 1989, p. 8). The
Council described the young adolescent as IIcaught in a
vortex of changing demands," where engagement of learning
diminishes, and rates of alienation, substance abuse,
absenteeism, and dropping out rise (Carnegie Council, 1989,
p. 9).
Early studies of alienation (e.g., Bronfenbrenner,
1977; Mackey, 1977) generally have concluded that
adolescent alienation is a result of the conflict between
the children's developmental needs and that of the world
that surrounds them. As Cuban (1993) and Klein (1999)
pointed out, these studies failed to discuss public
schools' involvement, and thus, their conclusions are
insufficient. Later studies indicate a more direct link
between public schools' and adolescent alienation (Cuban &
Shipps, 2000; Shoho & Petrisky, 1996). This chapter
critically reviews the literature regarding adolescent
7

alienation, high school and minority student alienation,
specifically that of Native Hawaiian adolescents. The
chapter then considers the "dropout" phenomenon or students
who do not stay in school to receive a high school diploma,
followed by a summary and critique of the existing
literature, and a discussion of the specific research
questions and hyPOtheses suggested by the review and
examined in this dissertation.
Alienation
The central point within the concept of alienation is
a sense of a gap between the expectations and experiences,
or between potentials and objective realities that
individuals and/or groups feel (LeCompte & Dworkin, 1991).
This concept received much attention in the late 1960s,
when it was used to explain nearly every kind of aberrant
behaviors (Mackey, 1977). Seeman (1983) noted in his review
that the concept, alienation, refers to the ways in which
individuals, in their own sentiments, are related to the
social structure or their conception of the world. Of the
many problems associated with finding appropriate
definitions of alienation, Seeman (1983) described this
definition as lacking in clarity of the meaning of the
alienation construct. The second problem, he said, is the
reference to alienation as a personality trait, and the
third problem is in the association of the construct with
8
the political-societal problems of the times (Seeman,
1983).
Researchers have identified several dimensions of the
alienation theme. These include (a) upowerlessness,"
referring to a person's lack of control over events, a
sense of helplessness, Or the lack of decision-making
abilities; (b) umeaninglessness," referring to the
incomprehensibility of social dynamics that cannot be
predicted; and, (c) usocial isolation," describing a
failure to integrate into supportive social networks or
experience the sense of community (Seeman, 1983).
Additional dimensions identified as important descriptors
of alienation are (d) uself-estrpngement," which involves
concepts of the despised, disguised, and detached selves;
(e) "normlessness," referring to the belief that socially
unapproved behaviors are required to be recognized; and,
(f) "cultural estrangement," where the adolescent
explicitly rejects the predominant value systems of society
(Mackey & Ahlgren, 1977; Seeman, 1983). The meaning of the
word ualienation" has traditionally had negative
connotations suggesting that the individual is not grounded
in society in terms of efficacy, inclusion, meaningfulness,
engagement, trust and value commitment (Seeman, 1983).
However, this negative connotation maybe culturally derived
from a western perspective.
9

Dean (1961) defined alienation as an affective
construct consisting of isolation (loneliness),
nODnlessness (value system inconsistent with school norms),
and powerlessness (lack of control over one's choices). The
Dean Alienation Scale is a 24-item five-point Likert-type
scale which has been widely used to assess levels of
alienation with a variety of groups ranging from adolescent
students to teachers and administrators (Shoho & Petrisky,
1996). However, the Dean Alienation Scale assesses
adolescence from a global perspective and lacks specificity
to a given context, (i.e., schools). As a result,
researchers like Calabrese (1987) and Shoho (1996) have
either modified its wording or developed new items to make
it more sensitive to issues experienced by adolescents in
schools.
The Margins of Society (MOS) Alienation Scale
encompasses theories of anomie and social iSOlation
(Travis, 1993). The HOS scale was used to interview Alaskan
natives in social situations of lloutside looking in"
(Travis, 1993). It was also used to measure adolescent
alienation in a juvenile delinquency study (Sankey & Huon,
1999). The HOS scale is a 14-item five-point Likert-type
scale.
Adolescent Alienation
Early adolescence, ages 10-14, is characterized by
significant growth and change, physically, mentally, and
10

emotionally (Carnegie Council, 1989). Early adolescents
often experience an increased sense of self, the
development of puberty, an enhanced capacity for intimate
relationships and a new capacity to think in more abstract
and complex ways (Carnegie Council, 1989). Middle
adolescents, ages 15-17, mature intellectually at a
significant rate, and experience increased autonomy and
experimentation (Carnegie Council, 1995). Late adolescents,
ages 18-20+, include those who delay maturation through
continued schooling and other socially constraining
behaviors (Carnegie Council, 1995). The alienated
adolescent characteristically lacks a sense of belonging
and feels cut off from family, friends, and/or school
(Bronfenbrenner, 1986). Adolescents considered to be at
greater risk than others tend to be low achievers with low
involvement, negative self-images and those who have
trouble conforming to society's norms (Calabrese, 1987).
The relationship between alienation and adolescence
can be further described as including deviant, delinquent,
and dysfunctional behaviors (Calabrese, 1987; Calabrese &
Adams, 1990; Calabrese & Raymond, 1989; Goswick, & Jones,
1982). Although the existence of adolescent alienation is
well documented, researchers note that it has not been
taken seriously as a major problem of contemporary society
(Calabrese, 1987; Mackey & Alghren, 1977). Societal
alienation is reported to have important explanatory power
11

in examining the relationships between delinquency,
alienation, and environmental differences such as classroom
practices, peer interaction, and school attachment
(Calabrese & Adams, 1990; Sankey & Huon, 1999). Other
contributors to adolescent alienation are inappropriate
media representations of role models without the parental
support structure needed to facilitate a normal transition
to adulthood (Calabrese, 1987).
In addressing these concerns, Mackey (1977) and Seeman
(1983) identified several operational dimensions of the
alienation theme through the development of alienation
scales based on the conceptual dimensions of powerlessness,
meaninglessness, social isolation, self-estrangement,
normlessness, and, cultural estrangement. Seeman suggested
that these attitudinal variables are the most important
predictors of school achievement and should be used to
evaluate school and community programs (Mackey, 1977;
Mackey & Ahlgren, 1977). Calabrese (1987) and Shoho (1996)
created modified versions of Dean's (1961) Alienation Scale
that included the dimensions of powerlessness,
normlessness, and isolation. These were designed for use in
several research studies with high school students
(Calabrese, 1987; Shoho, 1996; Shoho & Petrisky, 1996).
High School Student Alienation
While Mackey (1977) suggests that the reason for
alienation in high school students is the increase in
12

societal violence, technological advances, and the overall
issues of social change, Bronfenbrenner (1986) blames
changes in family structure and values, suggesting that
alienating behaviors begin with the family and are carried
to school. Other researchers argue that instructional
constraints in the schools force controls over adolescents
segregating them by age and intellectual ability, and
separating them from the outside adult world (Calabrese,
1987; Eccles, Buchanan, Flanagan, Fugiliani, Midgley, &
Yee, 1991). Calabrese (1987) has further suggested that
schools, counselors, and family exacerbate the "pace of
life" for the adolescent thereby increasing alienation.
Another study found significant relationships between
alienated students and unsafe activities (Tucker-Ladd,
1990). Students felt teachers and others did not respect
them, saw the school as "unchanging," felt powerless, and
disliked school rules (Eccles et al., 1991; Eccles et ale
1996; Tucker-Ladd, 1990). Students' family, friends and
their ethnic group's social support for education was found
to have a direct positive eftect on staying in school
(Rosenthal, 1994). In rural schools, researchers found that
middle adolescents felt more normless and powerless than
early adolescents and that those adolescents who
participated in e~tracurricularactivities were less
normless than non-participants (Shoho & petrisky, 1996).
Motivational variables such as teachers' criticism and
13
peers' resistance to school norms were found to be stronger
predictors of alienation than economic status although both
operated uniquely or as additive predictors (Murdock,
1999).
One study found student achievement to be directly
related to feelings of school belonging (Roeser, Midgley &
Urdan, 1996). Student-teacher relationships, negative
attitudes towards cheating, and other identifiable aspects
of alienation have also been correlated with measures of
academic achievement as derived from standardized test
scores and cumulative grade point averages (Loughrey &
Harris, 1992; Roeser, Midgley, & Urdan, 1996; Roig &
Neaman, 1994).
Minority Student Alienation
Are the factors that influence alienation
generalizable to all ethnic groups? Do minority students
experience higher levels of school alienation? LeCompte and
Dworkin (1991) report that minority students believe they
receive poorer treatment and lower grades from teachers,
and have less rewarding school experiences while majority
students seem to assume that everyone, including the
minority students, is treated the same. "The reality,"
according to Klein (1999), "is that ethnic minority
children continue to grow alienated, bored, and frustrated
by a system that underestimates their potential, expects
them to behave badly - and ignores the different cultural
14

backgrounds that are intrinsic to the way they act and
think" (Klein, 1999, p. 7).
An unexpected relationship between ethnicity and
alienation in a Texas rural school revealed that Hispanic
adolescents were less isolated than Caucasians, although
Caucasian students felt less normless than African American
and Hispanic adolescents (Shoho & petrisky, 1996). In
another rural school study, Shoho (1996) found that gang
affiliation was significantly related to stronger feelings
of isolation and that Hispanics felt more powerless to
influence their education than Caucasians. Of the immigrant
minorities, Hispanics have often been linked to a lack of
school success, although several studies indicate that this
is limited to Hispanics of lower socioeconomic status that
continue to measure a disproportionate connection to
alienation (Klein, 1999; McLain, 1998; Ogbu, 1991; Shoho,
1996).
Ethnographers suggest that minority students' school
failure is caused by discontinuities in culture,
communication, and power relations (Ogbu, 1991). Studies
that have attempted to verify these observations note an
inconsistency among the feelings of minority students
(Murdock, 1999). Ogbu (1991) observed that there were
different successes in school for immigrant and non
immigrant minorities. Findings from comparative research
distinguish among minority groups who do relatively well in
15
school from those who do less well in the type and
influence of the cultural model that guides them (Ogbu,
1991). Ogbu (1991) has identified non-immigrant minorities
as those who were brought into their present society
through slavery, conquest or colonization as involuntary
minorities who resent the loss of freedom and the perceived
social, political and economic barriers as oppression.
Involuntary minorities such as Native Americans, African
Americans, and Native Hawaiians, who have suffered
suppressive domination by the majority culture, may have
subsequently experienced long term cultural
underdevelopment (McLain, 1998; Ogbu, 1991).
Differences in teacher/student interactions may have
cultural roots as evidenced in collectivist vs.
individualistic societies (Brislin, 1993; Hofstede, 1986).
Collectivists' values establish close relations to others
that are dependent upon the collective or extended family
to share resources and assist each other (Brislin, 1993).
Individualistic cultures keep a distance from others,
expecting individuals to function independently (Brislin,
1993). Individualistic cultures are found in North America,
Western Europe, Australia, and New Zealand while
collectivist cultures are more common in Asia, Africa,
Central and South America and the pacific Islands (Brislin,
1993).
16
The challenges that students experience as they move
between the culture of their home and that of their school
may seem incomprehensible to the minority student (Phelan,
Davidson, & Cao, 1991). Students' perceptions of the
boundaries between the multiple worlds of family, peers,
and school cultures and the lack of strategies needed to
negotiate between these worlds may make transitions seem
impenetrable (phelan, Davidson, & Cao, 1991).
The conflict that students face when expected to
embrace two worlds with different value systems
metaphorically asks them to "walk with one foot on one side
of a river bank and the other foot on the other side, with
a raging torrent in the middle" (Henze & Vanett, 1993, p.
130). Clearly, minority students experience inequities in
the pUblic schools, particularly those involuntarily placed
in this position (Klein, 1999; McLain, 1998; Ogbu, 1991).
Calabrese (1987) suggested four remedies to adolescent
alienation that would reduce risks, reintegration of all
ages into learning groups, elimination of ability grouping,
assimilation of adolescents into the society, and
enfranchisement of the adolescent by giving them a voice in
decision-making that affects their world. Other researchers
have suggested that educational environments should be
designed for adolescents that provide them with more
control over their lives (Eccles et al., 1991).
17

Mau (1989) conducted a study of student alienation in
Hawaii's public schools using four dimensions of
alienation: powerlessness, meaninglessness, normlessness,
and social estrangement. Cumulative grade point averages,
class tracking, socio-economic status, student ethnicity,
and relationships with teachers and peers were examined in
relation to student alienation in the study. Students with
low academic achievement and in non-college preparatory
Htracks" experienced more alienation than their
counterparts. Her study, including all ethnic groups
without differentiation, suggests that student alienation
is manifested in such a highly multi-cultural school
context by poor academic performance, truancy, and
rebellion. Mau (1989) suggests that the alienation may be
the result of the lack of power students feel when they
have no control over school policies, class tracking, and
academic position (Mau, 1989, 1992). Glasser (1990)
suggests that the lack of power students feel results from
the I'get tough, coercive, boss management approach" to
teaching that is prevalent in public schools. He offers the
idea of a non-coercive, Hlead-teacher" who persuades
students to learn through involvement. The findings
presented by these researchers may be seen as a partial
cause for students leaving school before high school
graduation.
18

The Dropout Phenomenon
Many researchers who examine adolescent alienation and
problems that deter student achievement express concern for
the students who leave school before graduation from high
school (Calabrese, 1987; Calabrese & Adams, 1990; Carnegie
Council, 1989, 1995; LeCompte & Dworkin, 1991; Shoho, 1996;
Shoho & Petrisky, 1996). The U. S. Department of Education
(1996) defines "status" dropouts as those in a given age
range that have not finished high school and are not
enrolled in school.•
By 1989, one of the National Education Goals had
become that 90% of all students would complete high school
(HIDOE, 2000). Hawaii high schools' saw only 70% of the
students who entered ninth grade in 1997 graduate with a
high school diploma four years later (Education Trust,
2004). The Hawaii Superintendent's 2000 report discussed
the dropout phenomenon and how the concern has changed
since the 1960s. The 13~ Annual Report of the Hawaii's
Superintendent noted that of the students who entered in
the fall, 1998, just under 80% graduated from high school
within four years (HIDOE, 2003). There are programs in
place in Hawaii's public schools to address the issues of
students who are at risk for dropping out of school.
One statewide program is the Hawaii Comprehensive
Student Alienation Program (CSAP), designed to provide
support for at-risk students (HILEG, 1996). The goal of
19

CSAP was to provi~e the appropriate instructional and
counseling support and services to students identified as
alienated/at-risk to insure that they were able to meet
high school graduation requirements (HILEG, 1996). State
level support was provided to all middle and high schools
that includes an outreach counselor and special motivation
teachers who work with school level teams to identify
students using a set of criteria for participation in
alternative learning educational environments with small
class sizes and alternative instructional strategies.
School Reform Recommendations
Researchers often refer to the 1989 Turning Points
Report when speaking of reform movements and the need for
change in America's schools (Carnegie Council, 1995; FeIner
et ale 1997; Lipsitz, Jackson, & Austin, 1997; Oakes et ale
1993). The prescriptions of the Turning Points Report
called for a restructuring of schools as an antidote to the
traditional large, cold and impersonal school. The Carnegie
Council report called for schools to direct full attention
to the education and nurturing of the whole adolescent
(Hechinger, 1993). The Carnegie Council's final report,
Great Transitions (1995), made concluding recommendations
to (a) re-engage families with their adolescent children,
(b) create developmentally appropriate schools for
adolescents, (c) develop health promotion strategies for
young adolescents, (d) strengthen communities with young
20
adolescents, and (e) promote the constructive potential of
the media.
The 1995 Great Transitions report described the most
serious risks faced by the young adolescent as (a) physical
injuries, (b) firearm homicide, (c) child abuse and
neglect, (d) alcohol and drug use, (e) pregnancy, and (f)
an increased rate of suicide. In 1994, only 28% of eighth
graders scored at or above the proficiency level in Reading
while 12%-14% became high school dropouts (Bayh, 1995;
Carnegie Council, 1995). This 1995 report for school reform
recommended that educators (a) emphasize cooperative/
collaborative community efforts toward learning; (b)
conduct comprehensive self-assessments of learning and
teaching styles; (c) seek ways to interact with adolescents
in more personalized school units; (d) create positive
teacher-student relationships; and (e) create meaningful
school experiences involving community service (Carnegie
Council, 1995).
School reform components resulting from these
recommendations include (a) teacher teams who share
students in the same block of time; (b) flexible
scheduling; (c) advisories; (d) heterogeneous grouping; (e)
teachers trained in adolescent needs/learning styles; (f)
parent/teacher communication; and (g) field learning
experiences (Carnegie Council, 1989, 1995; FeIner et al.,
1997; HIDOE, 1995).
21
The Carnegie Council used a bio-ecological model,
developed by Bronfenbrenner (1977), as a means to examine
the downward trend in adolescent behaviors (Carnegie
Council, 1995). This model suggested that enhancement of
the proximal processes or societal mechanisms in the
environment will increase the potential for developmental
competence (Bronfenbrenner, 1977; Bronfenbrenner & Ceci,
1994; Carnegie Council, 1995; Felner et al., 1997). This
model presents a conceptual fr~~ework that stipulates
systematic variation in heretability as a joint function of
these proxL~al processes and the characteristics of the
environment in which the processes take place. The model
also deals with variation in heretability as a function of
the nature of the developmental outcomes under
consideration, as well as providing an assessment of the
absolute level of developmental functioning around which
the genetically based individual differences are occurring.
Finally, the bio-ecological model addresses the issue that
heretability measures only a proportion of variation
attributable to individual differences in the actualized
genetic potential; the extent of non-actualized potential
remains. The interim strategies for testing the limits of
the substantial role of both genetics and environment in
contributing to individual differences in psychological
growth are based in the investigation of "proximal
processes" (Bronfenbrenner & Ceci, 1994). Bronfenbrenner
22
· (1986) suggested that according to the bio-ecological
model, the best way to counteract youthful alienation is
for schools to create links or connections between the
child's home culture and the school's culture. The Turning
Points recommendations were purported to encourage schools
to create systemic reforms that would provide more
culturally compatible links with students' homes.
Turning .Points 2000
The Turning Points 2000 report reflects on the
outcomes of the Carnegie Council's Turning Points and Great
Transitions reports' recommendations (Carnegie Council,
1989, 1995; Jackson & Davis, 2000). As cited in the Turning
Points 2000 report, FeIner and his colleagues reported in
their Illinois middle school's study that in schools that
implemented the Turning Points' recommended practices with
greater fidelity, students' scores on standardized tests of
Mathematics, language arts, and Reading achievement
increased significantly (Jackson & Davis, 200Q).
The new Turning Points 2000 recommendations reflect
what has been learned in the decade since the first Turning
Points and Great Transitions (1989, 1995) publications
(Jackson & Davis, 2000). The next steps call for schools
that service adolescents to ensure success for every
student by 1) teaching a curriculum grounded in rigorous,
public academic standards; 2) using instructional methods
designed to prepare all students to achieve higher
23

standards and become lifelong learners; 3) staffing schools
with teachers who are expert at teaching adolescents and
engaging teachers in ongoing, targeted professional
development; 4) organizing relationships to create a
climate of intellectual development and a caring community
of shared educational purpose; 5) governing democratically,
through direct participation of all school staff; 6)
providing a safe and healthy school environment as part of
improving academic performance and developing caring and
ethical citizens; and 7) involving parents and communities
in supporting student learning and healthy development
(Jackson & Davis, 2000). How these new recommendations have
been implemented is being studied as u.s. public schools
move forward with school reform (Jackson & Davis, 2000).
Native Hawaiian Culture and Adolescent Alienation
Overall, the research on adolescent alienation has not
included studies comparing Native Hawaiians to students of
other ethnic groups or CUltures. There are, however,
numerous reports citing the high number of Native Hawaiian
youths who demonstrate many of the contributing components
of adolescent alienation. The 1993 Native Hawaiian
Educational Assessment (NHEA) reports that Native Hawaiian
children (a) are unready to enter kindergarten, (b) score
the lowest of the four major ethnic groups in Hawaii and
below national norms on standardized achievement tests, and
(c) have high dropout levels, high truancies, and are
M
highest in student attrition (Kamehameha Schools/Bishop
Estate, 1993).
Based on Bronfenbrenner's bio-ecological theory, the
NHEA proposed the "Cultural Loss/Stress" hypothesis as a
link to the negative outcomes of Native Hawaiians
(Kamehameha Schools/Bishop Estate, 1983). The hypothesis
links the development of these outcomes (physical health,
mental well being, alienation, and performance) to a
hierarchy of systems influencing individual development
(Minerbi, McGregor, & Matsuoka, 1993). The development of
modern Native Hawaiians, the report states, has resulted in
poor physical health, depression, alienation, and low
academic performance (Hammond, 1988). The NHEA report
indicated that Native Hawaiian students suffer from a "lack
of parity" with their peers, scoring the lowest in
nationally normed standardized tests of Reading and
Mathematics, and higher in special education needs, and
culturally related academic needs (Gibson & Ogbu, 1991;
Hammond, 1988; Tharp & Gallimore, 1988; Yamauchi et al.,
1996).
Bronfenbrenner's (1986) theory of bio-ecological
systems, which provided the underlying theoretical
guideline for the NHEA final report as well as the Carnegie
Council's 1986 and 1995 reports, suggested that the best
way to counteract the problems adolescents face was for
25

schools to create links or connections with the child's
home culture.
The NHEA report described Native Hawaiian cultural
values in a five-way diagram demonstrating the
relationships of llLokahi", harmony and balance; llMalama
'aina," caring for the land; llOhana," family unity;
llKOkua," helping others, and "Aloha 'aina," spirit of
caring, kindness, and acceptance (Minerbi et al., 1993;
Kamehameha SchoolS/Bishop Estate, 1983).
LokahiHarmony & balance
Aloha 'ainaspirit of caring,
kindness & acceptance
Malama 'ainacaring for the land
Kokuahelping others
~
family unity
(Kamehameha Schools/Bishop Estate, 1983)
Figure 1. Native Hawaiian Cultural Values.
A 1995 report noted that Native Hawaiians have become
more llmulti-ethnic" as a result of interracial marriages,
developing different values and different ways of doing
things (Takenaka, 1995). Before 1776, approximately 300,000
pure Native Hawaiians led healthy lives engaged in llaloha
26
'aina," "malama 'aina," and "laulima," working together,
loving, and taking care of the land (Takenaka, 1995). The
concept of family (ohana) and helping others (kokua) was
the unifying force. The 1990 U.S. Census now lists Native•
Hawaiian families with the highest poverty levels, infant
mortality, and teen pregnancies (Takenaka, 1995). Native
Hawaiian students' scores are the lowest for school
readiness and academic achievement in schools.
Although Hawaii's youth experience a diverse multi-
ethnic cultural environment in public schools with aI
multitude of different learning styles, the traditional
classroom continues to be the norm (Yamauchi, 1996; Tharp &
Gallimore, 1988). This creates a dichotomy between the home
culture and the school's structure, thereby discouraging
Native Hawaiian students' participation and interest (Tharp
& Gallimore, 1988). Just as Native Alaskan youths describe
themselves as "walking in two worlds," Native Hawaiian
students are expected to follow role expectations of the
school culture (Henze & vanett, 1993; Yamauchi, 1996; Tharp
& Gallimore, 1988).
Culturally, Native Hawaiians have become "strangers in
their own land" - losing values, life style, language,
beliefs - resulting in alienation and self-disparagement
(Hammond, 1988). Very often, the school's expectations of
students may not be modeled in the home culture (Yamauchi,
1996Y·

Culturally Compatible Programs for Native Hawaiians
Cultural compatibility, as used in this study, refers
to the home culture of the child and its compatibility with
the child's outside world (Jordan, 1985, 1992). Educators
of minority children are advised to use what is known of
the student's home culture to inform and develop
educational practice (Jordan, 1992). Schools with programs
that provide for culturally compatible classroom
environments report that students experience increased
learning (Jordan, 1989, 1992; Tharp & Gallimore, 1988;
Yamauchi, 1996; Yamauchi et al., 1996). Examples of such
CUlturally compatible classroom environments in Native
American classrooms were discussed by Yamauchi and Tharp
(1991) suggested classrooms be designed for the particular
population of students, considering both general principles
of human learning and those which are culturally specific.
Native American students became more involved working in
small groups where learning is contextualized to relate to
their native culture (Yamauchi & Tharp, 1991). An
experimental schooling skills class in a large public high
school in Hawaii, designed to meet the specific needs of
low achieving students, found that the significant effect
of the program on grade point averages (GPA) depended on
the exposure time (more than one semester) and the support
of adults (Zhang & Barnard, 1995). Changing the structure
of classroom interactions and activities so that they are
28
more compatible with home cultures appears to promote
increased learning (Jordan, 1989, 1992; Ogbu, 1991; Tharp &
Gallimore, 1988; Yamauchi, 1996; Yamauchi et al., 1996;
Yamauchi et al., 1998).
Yamauchi, Greene, Ratliffe, and ceppi's (1998) study
of culture and education on Molokai, an island with 49%
Native Hawaiians, found contradictory values between the
importance of education and the threat to one's identity as
a Native Hawaiian. The Molokai project addressed the
educational needs of this island, where in a dominant
Native Hawaiian culture there are ongoing issues in
resolving conflicts between the Native culture and the
public 'schools' expectations (Yamauchi, et al., 1998).
Greene's 1998 study of the ethnic identities of adolescents
in Hawaii did not support depictions of Native Hawaiian
students as self-disparaging or alienated. In contrast, his
research found pride and self-assurance among these
adolescents (Green, 1998). Several school programs
developed in Hawaii have attempted to provide culturally
responsive intervention programs for Native Hawaiian
students (Ceppi, 2000; Kane, 1997; Yamauchi et al., 1998).
Although there ~s little empirical evidence to
demonstrate that a drop in alienation increases student
achievement, there is research that indicates culturally
sensitive school programs provide an increase in student
learning and a reduction in feelings of alienation (Shoho,
29
1996; Shoho & Petrisky, 1996; Yamauchi et al., 1998;
Yamauchi, 1996; Yamauchi et al., 1996; Yamauchi & Tharp,
1991).
The issues of alienation in other involuntary minority
mainland cultures such as Native Americans and African
Americans may share similar features, but the problems of
Native Hawaiians are unique (McLain, 1998,; Ogbu, 1991). The
characteristics of many mainland reform programs designed
to meet the needs of alienated youths are seen in the local
Native Hawaiian programs such as small groups working with
a team of mentoring teachers in hands-on conununity learning
activities (Ceppi, 2000; Klein, 1999; LeCompte & Dworkin,
1991). The more than 100 years of colonization of Native
Hawaiians in the very multi-ethnic and populated islands
have resulted in both "assimilation" and "marginalization"
(Ah Nee-Benham & Heck, 1998; Takenaka, 1995). The unique
factor that differentiates the Native Hawaiian programs
from others in the mainland is that the State of Hawaii
professes two state languages (Native Hawaiian and English)
making the ··culture" available in the inter-workings of the
local governments and daily living. While Hawaii's public
schools remain very similar to the mainland schools, the
Native Hawaiian culture, though suppressed, is present.
A study of the effects of school processes on student
alienation, as well as the effects of intervention
programs, may provide a better understanding of how to
30
reduce adolescent alienation, particularly of Native
Hawaiian high school students (Bronfenbrenner, 1977, 1986;
Bronfenbrenner & Ceci, 1994; Mau, 1992).
Waianae HAwaiian Studies Program
Two programs that address the issues of Native
Hawaiian student alienation in the Hawaii Department of
Education (HlDOE) are the Waianae High School Hawaiian
Studies Program and the Kaneohe Castle High School Aloha
Academy.
The components of the Waianae high school Hawaiian
Studies Program (HSP) include school-community
partnerships, an integrated curriculum and weekly fieldwork
(Ceppi, 2000). Students learn about Native Hawaiian culture
through hands-on experience at the Cultural Learning Center
at Kaala. Teachers work together as a team, developing
integrated curriculum into interdisciplinary--unit-s-tying to
the community cultural experience (Ceppi, 2000). Community
members act as mentors to HSP students sharing Native
Hawaiian cultural practices during the course of study.
Ceppi's research ~uggests that the close relationship of
the teachers and community mentors encourage students'
personal and academic victories in school.
Aloha Academy
A second program that addresses alienation issues for
Native Hawaiian students in Hawaii is Castle High School's
Aloha Academy. This program in Windward School District
31

provides the sample for this study. It was initiated in
1997 as a 'school-within-a-school' to be culturally
compatible for Native Hawaiian high school students. This
program, based on the Turning Points recommendations that
were implemented in the school's uGold Core" program, was
redesigned with a new focus on at-risk students of Native
Hawaiian ancestry. Curriculum activities are often
integrated thematically and with sensitivity to students
needs. Homeroom teachers act as advisors making frequent
contact with the students' homes in parent/teacher
communication. The team met daily to discuss students'
progress and plan activities. The pUrPOse of this program
was to provide an educational program for low achieving
ninth grade students, that is both culturally sensitive and
academically challenging, and meets the emotional and
social needs of Native Hawaiian students (Kane, 1997; Zhang
& Barnard, 1995).
The two programs differ structurally in response to
the available resources of these two large high schools
(Ceppi, 2000; Kane, 1997). The Waianae program is able to
provide a more intense cultural experience in the locale on
Waianae coast, where there are Native Hawaiian mentors
available to promote cultural activities. Due to its'
inclusion on the main campus as a uschool-within-a-school,"
the Aloha Academy is more integrated into the regular
school program (Yamauchi et al., 1998).
32

Summary
Recent studies on student alienation include
reconmendations for future research on intervention
programs designed to reduce alienation, numbers of school
dropouts, and to further examine the relationship between
ethno-cultural factors and alienation (Bronfenbrenner,
1977, 1986; Calabrese & Adams, 1990; Carnegie Council,
1995; Shoho, Katims, & Wilks, 1997; Shoho & petrisky, 1996;
Travis, 1993). Several studies indicate that schools, as
organizations, contribute to the alienation of students
(Calabrese, 1987; LeCompte & Dworkin, 1991; Shoho, 1996;
Shoho & petrisky, 1996). Increased awareness of the effects
of school processes on alienation, the development of
sensitivities to cultural differences, and new studies of
the effects of intervention programs may provide a better
understanding of how to reduce adolescent alienation and
high school dropout rates (Bronfenbrenner, 1986;
Bronfenbrenner & Ceci, 1994; Mau, 1992; McLain, 1998; Ogbu,
1991) •
33

CHAPTER 3
METHOD
The methods of analysis and the procedures used for
this dissertation are described within this chapter. This
study, illustrated below, examines the concept of student
alienation. It further examines the effects of the Aloha
Academy on alienation, academic achievement and dropping
out of school with concern for the particular effects on
the Native Hawaiian student population.
Literature Review
Alienation Turning'Points Recollllnendations EthnicityHigh School Reform
~!I
Dean MOS Native Non- NativeScale Scale Hawaiian Hawaiian
4 Factors of AlienationPowerlessness, Isolation, Aloha Academy
Normlessness Middle School DesignCUltural Estrangement
IReseargh Question 1
Validation of I I 1Multidimensional Research Research Research
Construct Question 2 Ouestions 3 & 4 Question 5peA with Oblique
Alienation Academics School DropoutRotation2-Way MANOVA GPA-SAT/ANCOVA Logistic Regression
Figure 2. Diagram of Dissertation Study
34

population and Sample
The participants in this study were drawn from the
public school population in the Windward District of
Hawaii. The Hawaii Department of Education (HIDOE) has a
centralized school system that incorporates seven
geographical districts. Four districts are located on Oahu
(Honolulu, Windward, Leeward, & Central). One includes the
entire island of Hawaii, another, Kauai, and the remaining
district encompasses Maui, Molokai and Lanai. The HIDOE
reported a student population in 1998 of 185,000 that
included Native Hawaiian students (23.4%), Caucasians
(21.5%), Asians (16.4%), Filipinos (13.2%) and smaller
numbers of other ethnic groups (HIDOE, 1998). For this
study, Native Hawaiians include both students reported as
full Hawaiian and Part-Hawaiian. This report notes, that
~of the students who entered high school in Hawaii in fall,
1998, just under 80% graduated from high school within four
years#l (HIDOE, 2002, p. 2). These figures are reported
because this study began with the 1998-1999 school year.
The Windward District of the State of Hawaii Department of
Education is located on the windward side of the island of
Oahu and had a student population of 19,424 in four high
schools and their 25 feeder schools (HIDOE, 2002).
The high schOol students selected for this study were
enrolled in the ninth grade during the 1998-1999 school
year with a designated four-year graduation date of June
35

2002. The total school population in 1998 was 1981
students. The total school ethnic distribution was 37% for
Native Hawaiians, 24% Asians, 13% Caucasians, 8% Filipinos,
and 18% other ethnic groups. Other demographic data
available are 32% of low socioeconomic status (low SES, as
defined by students who qualify for free or reduced price
lunch), 48% female, 52% male, 12% certified for Special
Education (SPED), and 1% as English as Second Language
Learners (ESLL). The ninth grade population had 577
students, of which the major ethnic groups were Native
Hawaiian (41%), Asian (20%), Caucasian (15%), Filipino
(6%), and (19%) other ethnic groups. Thirty-seven percent
were from the low SES, 46%, female, and 54% male, 6% SPED
and 1% ESLL. Of the 577 students enrolled in the ninth
grade in 1998-1999, 74% stayed in school through their
senior year.
Eighty-nine students participated in the Aloha
Academy, (52% were males, 55% were Native Hawaiian, 58%
were low SES, and 5% were certified for Special Education).
The Aloha Academy provided for (a) an
interdisciplinary team of four teachers who shared two
common meeting/preparation periods, (b) integrated
curricula with flexible scheduling, (c) advisory teachers
communicating regularly with the parents, and (d)
exploratory/field experiences with community resources.
Each teacher maintained his or her classroom and was the
36

advising teacher for the period 1 class. Communication with
parents occurred weekly or daily as needed, with written
progress reports going home every two weeks. Classes met
singly, in pairs, or in whole group activities. The model
for this academy, the Gold Core Program, was based on the
Carnegie Council's Turning points recommendations that also
provide the basis for Hawaii's 1994 Middle School Project
(Carnegie Council, 1985, 1993; Kane, 1997; Wang, Brandon,
Sakaguchi, & Peecook, 1994). The vision of the redesigned
1998 model for the Aloha Academy was rooted in aspects of
Native Hawaiian culture. It provided for a community of
learners committed to nurturing and challenging the mind,
body and spirit through: Aloha - spirit of caring, kindness
and acceptance, Lokahi - harmony, Ohana - family unity,
Hoihi ... respect, and Alu like - teamwork. The curriculum
included the literature and social/environmental issues of
the local culture. For example, a project to restore
ancient Native Hawaiian fishponds was a long-term
integrated activity involving students working side by side
with local community restoration groups.
The structure of the redesigned Aloha Academy
continues to be based on several of the school reform
components recommended by the Carnegie Council's Turning
Points and Great Transitions reports (Carnegie Council,
1989, 1995; Kane, 1997). As an academy, the program acts as
a uschool within a schoolu with a team of four teachers and
37

a counselor sharing the same students and planning periods.
The program starts in the ninth grade. Students are
promoted to the tenth grade within the Aloha Academy and
then return to the regular program in the eleventh grade.
Four hundred and eighty-eight students were registered
in the regular education program (55% male, 38% Native
Hawaiian, 33% low SES, and 10% certified for Special
Education). The curriculum for the regular ninth grade
classrooms during the 1998-1999 school year (SY) can be
described as "traditional" with approximately 30+ students
in each class. Teachers were isolated from their peers with
only one preparation period and no common meeting time with
their colleagues. The only organized focus on Native
Hawaiian culture was through the Modern Hawaiian History
class. All other core classes followed a typical core
subject curriculum script. School counselors provided
advising on a referral basis only. Typically, teachers
communica~ed with parents through a quarterly progress
report.
Study Sample for Validation of the Alienation Scales
Data for the student variables included in this study
were obtained from HrDOE databases, and surveys were
administered by Language Arts teachers and coordinated by
this ~esearcher. A total of one hundred ninety students at
the participating high school were administered the
alienation scales. Sixty-five (65) of the one hundred
38

ninety students were participants in the Aloha Academy, and
one hundred twenty-five (125) students from the regular
education low level (nyz") Language Arts classes. (This
high school tracks students into three tracks.) The
Gifted/Talented track includes students who have been
identified as ngifted" in elementary school and proceed at
an accelerated pace through school. The rest of the general
education program places students according to their
academic achievement into the nx," i.e., high level, or the
nyz" track that includes middle and lower level students as
well as students who are certified for Special Education
services. This sample of one hundred ninety students
provided the data for the validation of the multi
dimensional alienation construct.
Additional demographic data such as gender, ethnicity,
and socioeconomic status were also collected. Of the 190
students who were administered the Alienation Scales, 114
were male (33 Aloha Academy + 81 regular), 76 were female
(32 Aloha Academy, 44 regular), 86 were of Native Hawaiian
ancestry (38 Aloha Academy, 48 regular classroom), 104 were
non-Native Hawaiians (27 Aloha Academy, and 77 regular).
39

Table 1. Total Sample - Demographics
Ethnicitv Gender SES# Non- Low Not Low
Program Students Hawaiian Hawaiian Male Female SES SES
Aloha 65 38(58%) 27(42%) 33(51%) 32(49%) 43(66%) 22(34%)Academv
Regular 125 48(38%) 77 (62%) 81(65%) 44(35%) 49(39%) 76(61%)Proqram
Total 190 86(45%} 104(55%} 114 (60%) 176(40%} 92(48%} 98(52%
Ninety-two of this sample of students were of low SES (43
Aloha Academy, 49 regular). Ninety-eight were not of Low
SES (22 Aloha Academy, 76 regular).
For the eighth grade school year, 1997-1998, students
in the Aloha Academy showed a mean Grade Point Average
(GPA) of 2.3 while those in the regular classrooms recorded
a 2.9 GPA. The average eighth grade Stanford Achievement
Test (SAT) Total Reading stanine for students who enrolled
in the Aloha Academy was 2.8 while those who remained in
the regular program showed an eighth grade Reading stanine
mean of 3.7 (Psychological Corporation, 1992). Similarly,
the Aloha Academy's mean stanine for the SAT Total
Mathematics from the eighth grade 1998 period was 3.6,
whereas the Mathematics 1998 mean eighth grade stanine for
the students who stayed in regular classes was 4.6.
Study Sample - Comparable Groups
Several steps were taken to select the two comparable
pre-treatment samples required by research questions 2, 3,
40
and 4. Students were selected from those who had
participated in the Aloha Academy during the school year of
1998-1999, along with a comparable group of students who
did not participate in the Aloha Academy during this year.
Student records were collected from the 1997-1998, 1998
1999, and 1999-2000 school years. These records were then
organized into a longitudinal Grade 8 through Grade 10
cohort. The cohort consisted of students who took the SAT
during grade 8, grade 9, and grade 10 and remained in
school during grade 12.
The student sample of 190 was split to create two
smaller but comparable groups (Aloha Academy and the
regular program). Students were selected as comparable if
their eighth grade SAT scores for Reading and Mathematics
were between stanines 1 and 5. Students were eliminated if
they had incomplete data for SAT Reading, Mathematics, and
for GPAs, 1998 through 2000. The final sample of comparable
students included 75 students, of whom 36 students had
participated in the Aloha Academy for two years and 39
students who had remained in the regular education "YZ"
Language Arts classes.
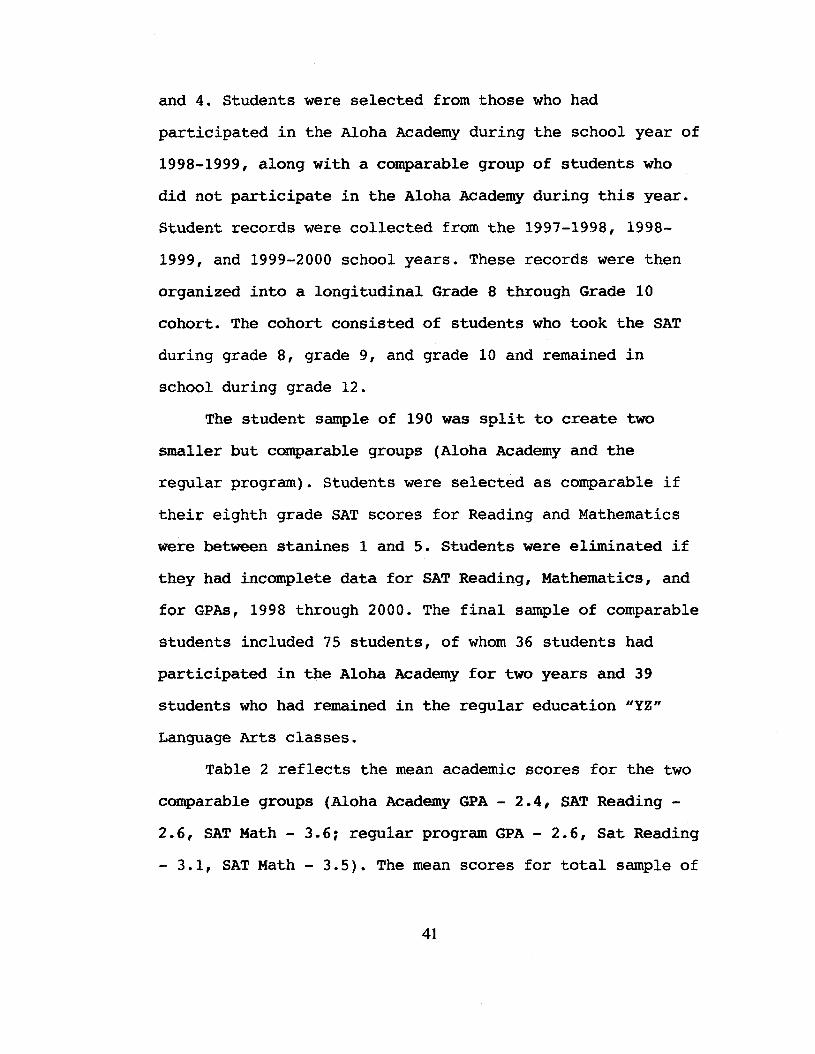
Table 2 reflects the mean academic scores for the two
comparable groups (Aloha Academy GPA - 2.4, SAT Reading
2.6, SAT Math - 3.6; regular program GPA - 2.6, Sat Reading
- 3.1, SAT Math - 3.5). The mean scores for total sample of
41

75 students were GPA - 2.5, SAT Reading - 2.9, and SAT Math
- 3.5.
Table 2. Comparable Participants' Mean Academic Scores
Program # 1997-1998 1997-1998 SAT 1997-1998 SATStudents GPA Readinq Stanine Math stanines
Aloha 36 2.4 2.6 3.6Academy
Regular 39 2.6 3.1 3.5Program
Total 75 2.5 2.9 3.5
A two-group MANOVA on the three 1998 academic
indicators (SAT Reading, Mathematics and GPA) ensures the
comparability of the two groups, the Aloha Academy (36) and
the regular (39) students. The MANOVA reSUlts revealed no
significant difference between the two sample groups [A =
.919, F (3, 71) = 2.099, p > 0.05].
Instruments and Variables
Alienation Measures
Levels of alienation were measured by administering
the Dean Alienation and MOS Scales to the 190 students in
the Aloha Academy and regular classrooms at the beginning
of tenth grade. Each student's levels of alienation for
normlessness, isolation, and powerlessness were measured
using the modified Dean Alienation Scale (Shoho, 1996). The
Dean Alienation Scale (1961) had been modified and tested
with adolescents using more appropriate language
(Calabrese, 1989; Shoho, 1996). The MOS Scale (1993) was42

administered to the same students in this study to provide
additional alienation information pertaining to cultural
estrangement. A PCA was conducted to verify the four
factors (dimensions) expected from the modified Dean scale
(normlessness, isolation, and powerlessness) and the MOS
scale (cultural estrangement).
Dean (1961) defined alienation as an affective
construct consisting of isolation (loneliness),
normlessness (value system inconsistent with school norms),
and powerlessness (inability to influence one's choices).
The Dean Alienation Scale (modified) is a 24-item five
point Likert-tyPe scale which has been widely used to
assess levels of alienation with a variety of school groups
ranging from adolescent students to teachers and
administrators (Shoho & Petrisky, 1996). The total score
ranges from 24 to 120. The three SUb-construct scores have
different ranges: isolation, 9 to 45; powerlessness, 10 to
50; and normlessness, 6 to 30. Higher scores on The Dean
Alienation Scale represent higher levels of alienation in
that particular respect.
The MOS Scale, which encompasses theories of anomie
and social isolation, was first used to interview Alaskan
natives in social situations of "outside looking in"
(Travis, 1993). It was also successfully used to measure
adolescent alienation in a juvenile delinquency study
(Sankey & Huon, 1999). The MOS scale is a 14-item five-
43

point Likert-type scale and was used to measure cultural
estrangement in this study. The scoring range for the MOS
scale is 14 to 70 with higher scores representing higher
levels of the construct of cultural estrangement.
Academic variables
The student academic variables included in this study
were obtained from HlOOE databases including the Stanford
Achievement Test, 8th Edition, the Stanford Achievement
Test, 9th Edition and students' Grade Point Averages (GPA).
The Stanford Achievement Test, 8th Edition, was developed
by the Psychological Corporation in 1992 to measure
academic achievement (Psychological Corporation, 1992).
Individual student scores (stanines) from the Stanford
Achievement Test Total Reading and Total Mathematics
administered during the eighth grade 1997-1998 school year
were used to select academically comparable students for
the study. After the end of ninth grade (1998-1999) and the
tenth grade (1999-2000), the Stanford Achievement Test, 9th
Edition developed by Harcourt-Brace in 1997, was used to
test students in the state of Hawaii. The scores from the
two test versions, Stanford Achievement, eighth Version and
Stanford Achievement, 9th version were adjusted using the
publisher's conversion tables (Harcourt, 1997). The Total
Mathematics (number concepts and Mathematics computations)
and Total Reading (reading, vocabulary, and reading
comprehension) composite scores from the Stanford
44
Achievement Tests (SAT) were used as indicators of
individual student's Reading and Mathematics achievement.
Grade point averages (GPA, 0-4.0) for the school years (SY)
1997-1998, 1998-1999, and 1999-2000 were also collected
from the BIDOE database to provide academic variables for
this study.
Other Variables
Students of Native Hawaiian ethnicity were identified
from Hawaii Department of Education Student Information
records. The eligible participants from the Aloha Academy
were those who had participated one academic year in the
program and took eighth, ninth, and tenth grade SAT tests.
Participants from the regular ninth grade program were
those who participated two academic years in the regUlar
program and took the eighth, ninth and tenth grade Reading
and Mathematics SAT tests. The participants from both
groups were deemed comparable by their eighth grade SAT
scores (stanines 1 through 5) and their academic year
exposure. Those who were attending special education or
alternative education classes were eliminated from the
database as not representative of the true population.
Procedure
The criteria for protection of human subjects were met
with approval given by the University of Hawaii's Committee
on Human Studies for use of the student data and by the
participating high school's administration.
45

Teachers, as instructed by this researcher,
administered the two alienation instruments ('MOS & modified
Dean) to students during class time. Data were collected
from these surveys and entered into a database containing
additional information gathered from the HIDOE student
records.
Analysis
This study used a quasi-experimental design to
investigate the effects of the Aloha Academy on self
perceived alienation and academic achievements of Native
Hawaiian and non-Native Hawaiian students. The study
followed a two-group pre-post design over the period of one
year without random assignment. The quasi-experimental
design was used instead of a true experimental design
because participation in the Aloha Academy was voluntary
according to relevant HIDOE policies. In this study, it
would be difficult to use the true experimental design
because of the voluntary participation or self-selection of
the treatment group. Data were collected from those who
participated in the alienation surveys and possessed all
the academic data needed for the survey. Figure 3 describes
the pre-post treatment design with the symbol of 0
representing the pre-post data entries for the ninth grade
students included in this study and the symbol of X, the
treatment of the Aloha Academy.
46

o
ox o
o
Figure 3. Two-group Pre-Post Treatment Design.
Data analysis proceeded in the following stages:
Stage 1 - A PCA was used to address the first research
question. This question sought to validate the theoretical
four-factor model underlying the construct of alienation
with data from the adolescent population in Hawaii.
Stage 2 - A 2-way multivariate analysis of variance
(MANOVA) was used to determine the effects of the Aloha
Academy on four aspects of student alienation. This
procedure addressed the second research question as to
whether the Aloha Academy reduces the alienation felt by
at-risk Native Hawaiian and non-Native Hawaiian
adolescents, as compared to their counterparts in the
regular education setting.
Stage 3 - Grade point averages (GPA) and standardized
achievement tests (SAT) in Reading and Mathematics were
examined in relation to the effects of the Aloha Academy.
An analysis of covariance (ANCOVA) procedure was used to
address the third and fourth research questions. These
questions asked whether the culturally compatible Aloha
Academy improves the GPA and the SAT Reading and
Mathematics scores of at-risk Native Hawaiian and non
Native Hawaiian adolescents, as compared to their
counterparts in the regular education setting. The
47
covariates in this procedure were the scores from the 8th
grade GPAs and the SAT Reading and Mathematics.
Stage 4 - The last research question examined whether
the culturally compatible Aloha Academy Program reduces the
dropout rate of at-risk Native Hawaiian and non-Native
Hawaiian students. For this study, a logistic regression
was used to measure the effect of the Aloha Academy on the
dropout rate.
48

Chapter 4
ALIENATION CONSTRUCT
This chapter addresses the first research question of
whether the theoretical four-factor model underlying the
construct of alienation could be validated with data from
the adolescent population in Hawaii.
principal Component Analysis
A PCA was conducted on the thirty-eight alienation
items (Appendix A), with twenty-four items representing the
three factors of isolation, normlessness, and powerlessness
from the 1996 modified Dean Scale and fourteen items
representing Ucultural estrangement" from the MOS Scale
(Shoho, 1996; Travis, 1993). According to Hatcher (1994),
the minimum number of need to be at least five times the
number of variables in the PCA. Because of the low ratio of
38 items with the 190 subjects, obtaining clear factors
might be difficult. With the pre-selection of four factors
and the deletion of bad items, the ratio could be
increased. Using PCA, the 38 j.tems (24 Dean & 14 MOS) from
the 190 surveys were factor-analyzed with an oblique
(Promax) rotation. Only fourteen items were found to be
distinctly loaded on the intended factors. The four factors
of Cultural Estrangement, Norm1essness, Isolation, and
Powerlessness include the following items respectively.
49
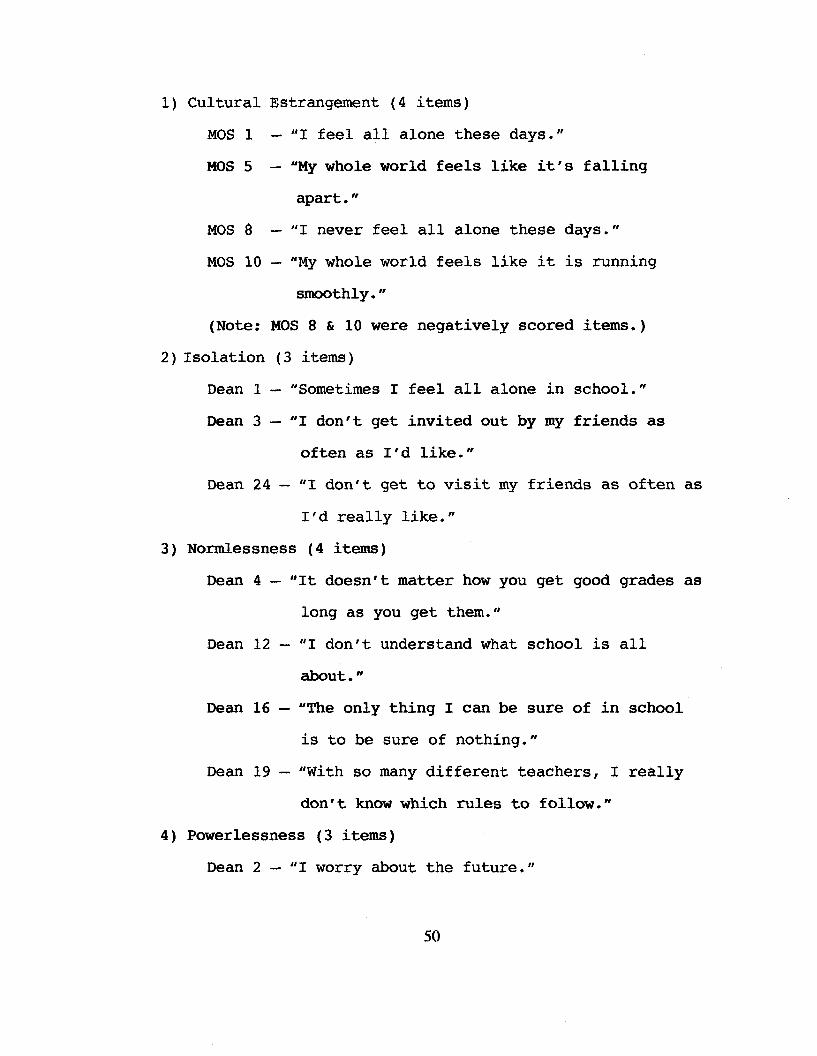
Dean 3
Dean 1
1) Cultural Estrangement (4 items)
MOS 1 III feel all alone these days."
MOS 5 liMy whole world feels like it' s falling
apart."
MOS 8 III never feel all alone these days."
MOS 10 "My whole world feels like it is running
smoothly."
(Note: MOS 8 & 10 were negatively scored items.)
2) Isolation (3 items)
"Sometimes I feel all alone in school."
III don't get invited out by my friends as
often as I'd like."
Dean 24 - III don't get to visit my friends as often as
I'd really like."
3) Normlessness (4 items)
Dean 4 - "It doesn't matter how you get good grades as
long as you get them."
Dean 12 - III don't understand what school is all
about."
Dean 16 - liThe only thing I can be sure of in school
is to be sure of nothing."
Dean 19 - IIWith so many different teachers, I really
don't know which rules to follow."
4) Powerlessness (3 items)
Dean 2 - III worry about the future."
50
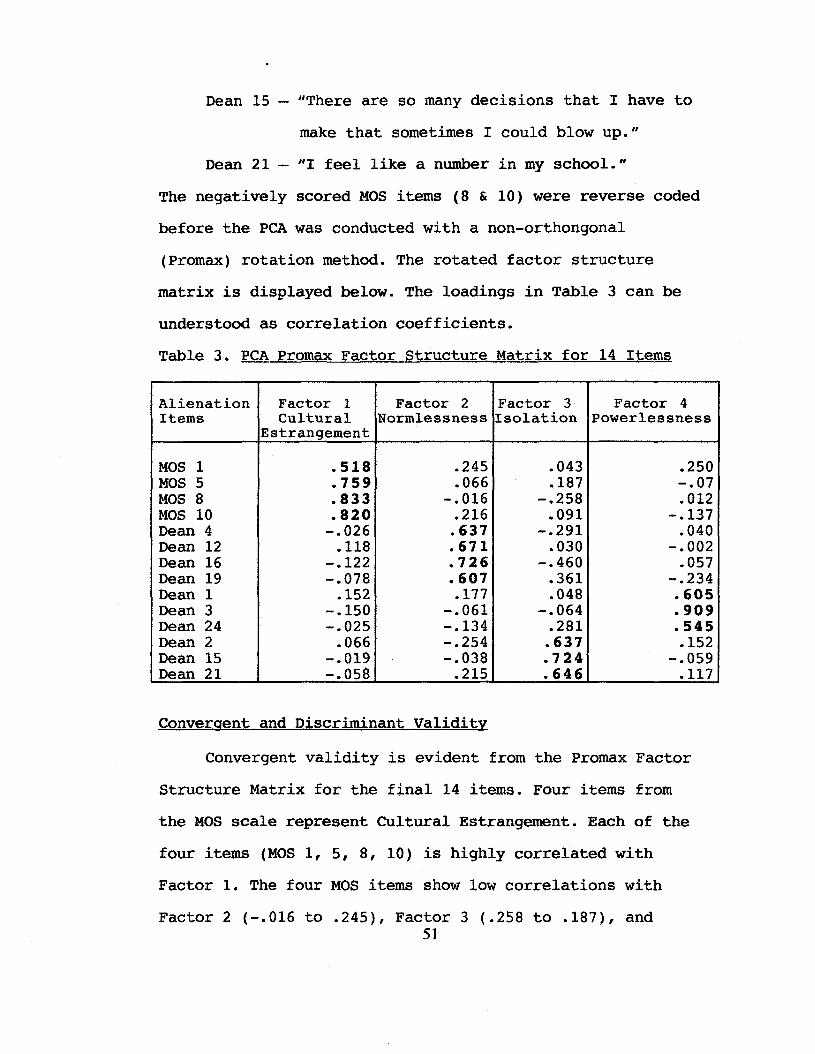
Dean 15 UThere are so many decisions that I have to
make that sometimes I could blow up."
Dean 21 - I'I feel like a number in my school. II
The negatively scored MOS items (8 & 10) were reverse coded
before the PCA was conducted with a non-orthongonal
(Promax) rotation method. The rotated factor structure
matrix is displayed below. The loadings in Table 3 can be
understood as correlation coefficients.
Table 3. PCA Promax Factor Structure Matrix for 14 Items
Alienation Factor 1 Factor 2 Factor 3 Factor 4Items Cultural Normlessness Isolation Powerlessness
Estrangement
MOS 1 .518 .245 .043 .250MOS 5 .759 .066 .187 -.07MOS 8 .833 -.016 -.258 .012MOS 10 .820 .216 .091 -.137Dean 4 -.026 .637 -.291 .040Dean 12 .118 .671 .030 -.002Dean 16 -.122 .726 -.460 .057Dean 19 -.078 .607 .361 -.234Dean 1 .152 .177 .048 .605Dean 3 -.150 -.061 -.064 .909Dean 24 -.025 -.134 .281 .545Dean 2 .066 -.254 .637 .152Dean 15 -.019 -.038 .724 -.059Dean 21 -.058 .215 .646 .117
Convergent and Discriminant Validity
Convergent validity is evident from the Promax Factor
Structure Matrix for the final 14 items. Four items from
the MOS scale represent Cultural Estrangement. Each of the
four items (MOS 1, 5, 8, 10) is highly correlated with
Factor 1. The four MOS items show low correlations with
Factor 2 (-.016 to .245), Factor 3 (.258 to .187), and51
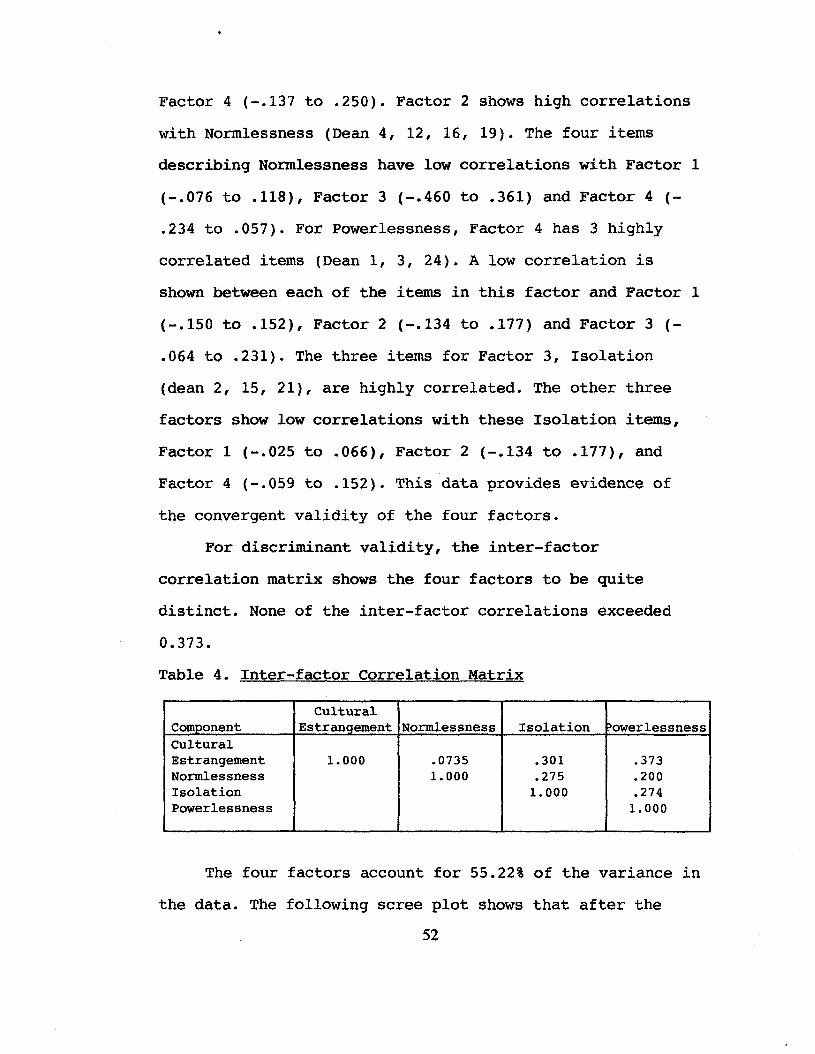
Factor 4 (-.137 to .250). Factor 2 shows high correlations
with Normlessness (Dean 4, 12, 16, 19). The four items
describing Normlessness have low correlations with Factor 1
(-.076 to .118), Factor 3 (-.460 to .361) and Factor 4 (
.234 to .057). For Powerlessness, Factor 4 has 3 highly
correlated items (Dean 1, 3, 24). A low correlation is
shown between each of the items in this factor and Factor 1
(-.150 to .152), Factor 2 (-.134 to .177) and Factor 3 (
.064 to .231). The three items for Factor 3, Isolation
(dean 2, 15, 21), are highly correlated. The other three
factors show low correlations with these Isolation items,
Factor 1 (-.025 to .066), Factor 2 (-.134 to .177), and
Factor 4 (-.059 to .152). This data provides evidence of
the convergent validity of the four factors.
For discriminant validity, the inter-factor
correlation matrix shows the four factors to be quite
distinct. None of the inter-factor correlations exceeded
0.373.
Table 4. Inter-factor Correlation Matrix
CulturalComponent Estrangement Normlessness Isolation ~owerlessness
CulturalEstrangement 1.000 .0735 .301 .373Normlessness 1.000 .275 .200Isolation 1.000 .274Powerlessness 1.000
The four factors account for 55.22% of the variance in
the data. The following scree plot shows that after the
52

.5
first four factors, the remaining factors each contribute
very little to the overall proportion of variance accounted
for in the data.
4.0r--------------------,
(J)~
(ij
E(J)0)i,jj 0.01-- -'
Figure 4. Scree Plot of PCA Promax Analysis
Reliability
For subsequent analysis, four alienation variables
were created, based on the four factors. These variables
were computed from scores entered on the two alienation
surveys (modified Dean and MOS). The scores for both scales
were based on a five-point Likert-type scale with the
higher scores representing higher levels of alienation
after the recoding of the negative questions.
Cronbach's Alpha was calculated for each of the
measures: Cultural Estrangement, a = .74; Normlessness, a =
.59; Isolation, a = .56; and powerlessness, a = .55. Except53

for Cultural estrangement, the internal consistencies were
less than satisfactory which might affect the results of
the subsequent analysis on the form dimensions of
alienation.
Although the study started with 38 items from the Dean
and MOS scales, only 14 items were retained. With the
addition of the MOS scale, it was not possible to replicate
Shoho's (1996) scale results. And, unfortunately, the
reliabilities turned out to be lower than expected.
54
Chapter 5
ANALYSIS OF THE ALIENATION CONSTRUCT
Alienation Results
This chapter addresses the second research question of
whether the Aloha Academy reduced the alienation felt by
at-risk Native Hawaiian and non-Native Hawaiian
adolescents, as compared to their counterparts in the
regular education setting.
The Aloha Academy sample included those students who
continued to participate in the Aloha Academy during their
tenth grade year. A two-way multivariate analysis of
variance (MANOVA) procedure was used to determine the
effects of the Aloha Academy on student alienation with
additional interest in the possible differential effects on
students of Native Hawaiian and non-Native Hawaiian
ancestry. Seventy-five students were in the sample (Aloha
Academy, 36, and the regular, 39). The number in each sub
group is as follows: non-Native Hawaiian in the regular
program, 21; non-Native Hawaiian in the Aloha Academy, 15;
Native Hawaiian in the regular program, 18; and Native
Hawaiian in the Aloha Academy, 21. Table 5 reports the mean
scores and standard deviations for the four alienation
factors by ethnicity (Native Hawaiian, non-Native Hawaiian)
and school program (regular, Aloha Academy).
55

Table 5. Descriptive Statistics of Alienation Scores
StandardProqram Ethnicitv N variable Mean Deviation
Aloha Hawaiian 21 !Cultural 2.36 1.10Academy !Estrangement
lNormlessness 2.51 .98Isolation 2.17 1.05iPowerlessness 3.17 1.09
Regular 18 !Cultural 2.33 .89!EstrangementlNormlessness 2.96 .74Isolation 1.91 .77powerlessness 2.94 1.11
Total 39Standard
Proqram Ethnicitv N Variable Mean Deviation
Aloha Non-Hawaiian 15 Cultural 2.03 .94Academy Estrangement
lNormlessness 2.47 .67Isolation 1.96 .98Powerlessness 2.91 .83
Regular 21 Cultural 2.37 1.00EstrangementNormlessness 2.52 .90Isolation 2.08 .71Powerlessness 2.49 .78
Total 36
A MANOVA was conducted on four dependent variables of
alienation (Cultural Estrangement, Normlessness, Isolation,
and Powerlessness). The independent variables used were
program (Aloha Academy and regular) and ethnicity (Native
Hawaiian vs. non-Native Hawaiian). The main effect of
program was non-significant, [A = 0.91, F (4, 68) = 1.65, P
= 0.17). The main effect of ethnicity was non-significant,
[A = 0.95, F (4, 68) = .86, p = 0.49). The interaction
56

between program and ethnicity was also not significant [A =
0.97, F (4, 68) = .6, p= 0.65]. These results indicate that
participation in the Aloha Academy did not reduce
alienation in either the Native Hawaiian or the non-Native
Hawaiian groups. This finding is unfortunate and has raised
questions about the appropriateness of the design of the
supposedly "culturally sensitive" Aloha Academy.
An examination of the univariate results for the four
alienation variables revealed the same pattern of non
significant main and interactive effects. The low
reliabilities are considered as one cause for the lack of
statistical significance in the comparisons as well as the
low alphas as .70 is the minimum acceptable level.
57
Chapter 6
ANALYSIS OF GRADE POINT AVERAGES
This chapter addresses the third research question
regarding the academic achievement of the comparable sample
groups (75) that include students in the Aloha Academy (n =39) and the regular program group (n = 36). This question
asked whether the Aloha Academy improved the grade point
average (GPA) of at-risk Native Hawaiian and non-Native
Hawaiian adolescents, as compared to their counterparts in
the regular education setting.
The comparable groups (Aloha Academy and Regular
program) had been selected for this study by eighth grade
GPAs, SAT Reading and Mathematics. Table 6 shows Native
Hawaiian students in the Aloha Academy with a mean GPA for
1997-1998, of 2.23, 1998-1999, of 2.43, and for 1999-2000,
of 2.26, while Native Hawaiians in the regular classrooms
recorded 2.59 GPA in 1997-1998, 2.11 GPA in 1998-1999, and
1.99 GPA in 1999-2000. The Aloha Academy for non-Native
Hawaiian students GPA in 1997-1998 Was 2.59, in 1998-1999
was 2.30, and 1999-2000 was 2.11. Students in the Regular
program in 1997-1998 had GPA of 2.64, in 1998-1999, 2.30,
and 1999-2000, 2.11.
58
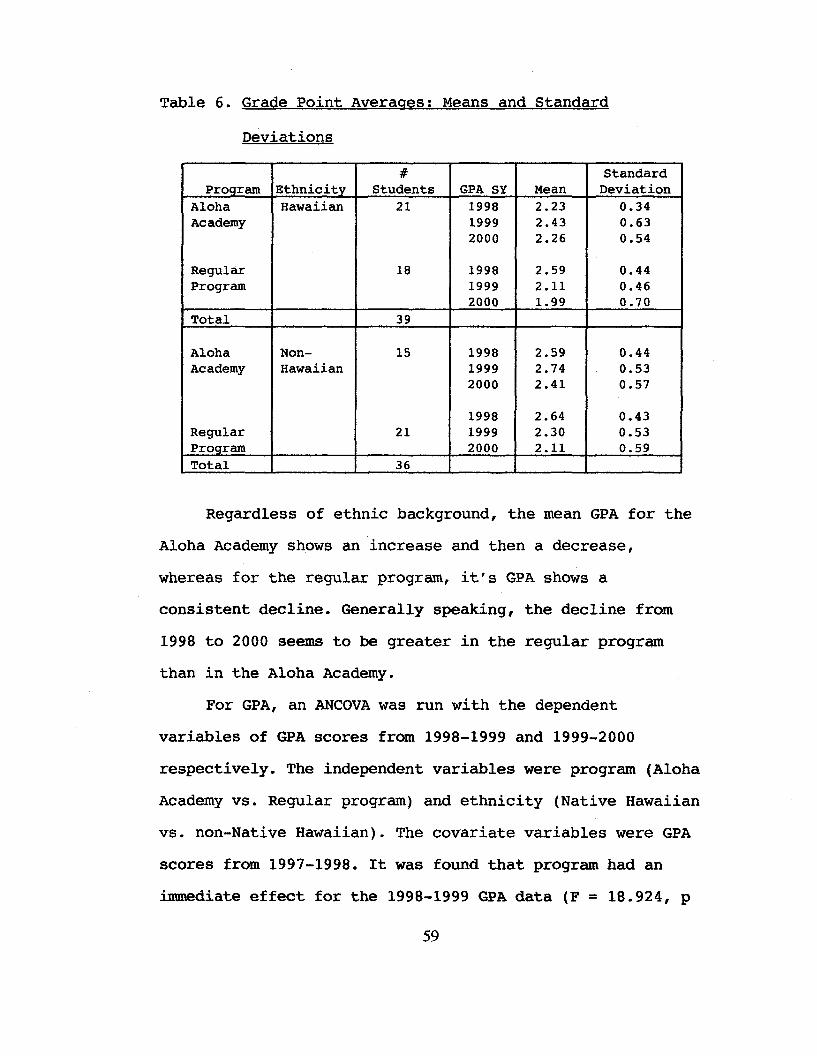
Table 6. Grade Point Averages: Means and Standard
Deviations
# StandardProqram Ethnicitv Students GPA SY Mean Deviation
Aloha Hawaiian 21 1998 2.23 0.34Academy 1999 2.43 0.63
2000 2.26 0.54
Regular 18 1998 2.59 0.44Program 1999 2.11 0.46
2000 1.99 0.70Total 39
Aloha Non- 15 1998 2.59 0.44Academy Hawaiian 1999 2.74 0.53
2000 2.41 0.57
1998 2.64 0.43Regular 21 1999 2.30 0.53Program 2000 2.11 0.59Total 36
Regardless of ethnic background, the mean GPA for the
Aloha Academy shows an increase and then a decrease,
whereas for the regular program, it's GPA shows a
consistent decline. Generally speaking, the decline from
1998 to 2000 seems to be greater in the regular program
than in the Aloha Academy.
For GPA, an ANCOVA was run with the dependent
variables of GPA scores from 1998-1999 and 1999-2000
respectively. The independent variables were program (Aloha
Academy vs. Regular program) and ethnicity (Native Hawaiian
vs. non-Native Hawaiian). The covariate variables were GPA
scores from 1997-1998. It was found that program had an
immediate effect for the 1998-1999 GPA data (F = 18.924, P
59

< 0.001) in favor of the Aloha Academy. There was no
significant effect for ethnicity, (F = .123, P > 0.05). The
interaction between program and ethnicity was non-
significant (F = 0.064, P > 0.05). Regarding the dependent
variable of GPA for 1999-2000 SY, again program showed a
statistically significant effect (F = 8.566, p = 0.005),
although not as strong as for the first year (1998-1999).
The effect of ethnicity was non-significant (F = 0.123,p >
0.05).
The GPA results indicate that while students were
being exposed to treatment in the Aloha Academy, there was
an immediate positive effect (1998 to 1999). This effect
decreased by the second year (1999-2000) although still
significant.
In summary, for statistical results in GPA, the
regular program showed a greater decline in 1998-1999 and
1999-2000 while the students of the Aloha Academy showed a
significant increase in 1998-1999 and a slight increase in
1999-2000. For ethnicity, the regular program showed a
consistent decline in GPA while the 1998-1999 for Aloha
Academy increased their mean GPA and for 1999-2000, a•decrease in GPA.
60

Chapter 7
ANALYSIS OF STANFORD ACHIEVEMENT TEST SCORES
The fourth research question asked whether the
culturally compatible Aloha Academy program improved the
SAT Reading and Mathematics Scores of at-risk Native
Hawaiian and non-Native Hawaiian adolescents, as compared
to their counterparts in the regular education setting.
Table 7 shows the mean 1997-1998 SAT Reading stanine
for students who enrolled in the Aloha Academy was 2.6, in
199a-1999 was 2.9, and in 1999-2000, was 3.7; while those
who remained in the regular program showed Reading stanine
means of 3.1 in 1997-1998, 3.2 in 1998-1999, and 3.7 in
1999-2000.
Table 7. SAT Reading Stanines by Program
# Reading Mean StandardProqram Students SAT SY Stanine Deviation
Aloha Academy 1998 2.6 1.336 1999 2.9 1.3
2000 3.7 1.3Regular Program
1998 3.1 1.339 1999 3.2 1.4
2000 3.7 1.1Total 75
Similarly, Table 8 shows the Aloha Academy's mean
stanine for the SAT Mathematics from the eighth grade 1997
1998 tests was 3.6, in 1998-1999, 3.8, and in 1999-2000,
3.7. The Mathematics 1997-1998 eighth grade mean stanine
61

for the students who stayed in regular classes was 3.5, in
1998-1999, 4.0, and in 1999-2000, 3.8.
Table 8. SAT Mathematics Stanines by Program
# Mathematics Mean StandardProqram Students SAT SY Stanine Deviation
Aloha Academy 36 1998 3.6 1.01999 3.8 0.92000 3.7 1.2
Regular Program 39 1998 3.5 1.01999 4.0 1.32000 3.8 1.5
Total 75
SAT Reading
Table 9 shows that Native Hawaiian students in the
Aloha Academy showed a mean stanine in SAT Reading scores
for school year 1997-1998, of 2.3, 1998-1999, of 2.8, and
for 1999-2000, of 3.4; while Native Hawaiians in the
regular classrooms recorded a mean SAT Reading stanine of
2.9 in 1997-1998, 2.9 SAT Reading in 1998-1999, and 3.7 SAT
Reading.in 1999-2000. The Aloha Academy for non-Native
Hawaiian students' SAT Reading means in SY 1997-1998 was
3.1, in 1998-1999 was 2.9, and 1999-2000 was 4.1. ,Non
Native Hawaiian students in the Regular program in 1997-
1998 had mean Reading stanine of 3.2, in 1998-1999, of 3.5,
and 1999-2000, of 3.8.
62
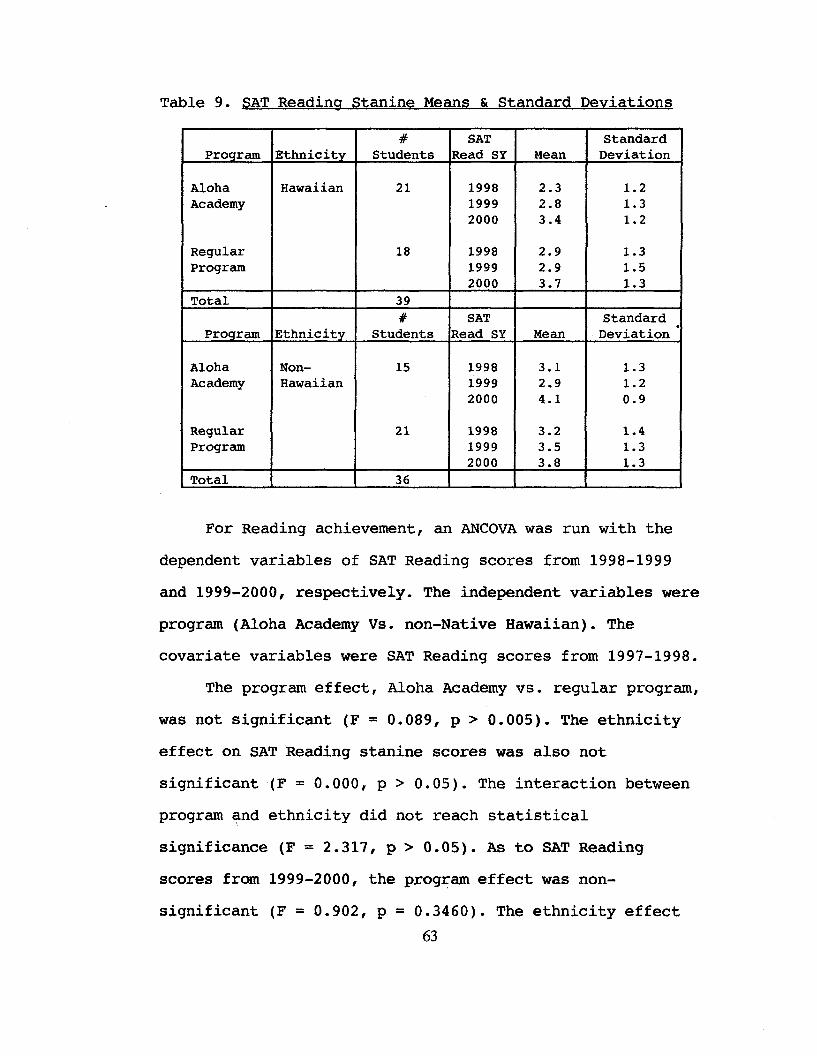
Table 9. SAT Reading Stanine Means & Standard Deviations
# SAT StandardProgram Ethnicitv Students Read SY Mean Deviation
Aloha Hawaiian 21 1998 2.3 1.2Academy 1999 2.8 1.3
2000 3.4 1.2
Regular 18 1998 2.9 1.3Program 1999 2.9 1.5
2000 3.7 1.3Total 39
# SAT StandardProgram Ethnicitv Read SY Deviation
.Students Mean
Aloha Non- 15 1998 3.1 1.3Academy Hawaiian 1999 2.9 1.2
2000 4.1 0.9
Regular 21 1998 3.2 1.4Program 1999 3.5 1.3
2000 3.8 1.3total 36
For Reading achievement, an ANCOVA was run with the
dependent variables of SAT Reading scores from 1998-1999
and 1999-2000, respectively. The independent variables were
program (Aloha Academy Vs. non-Native Hawaiian). The
covariate variables were SAT Reading scores from 1997-1998.
The program effect, Aloha Academy vs. regular program,
was not significant (F = 0.089, P > 0.005). The ethnicity
effect on SAT Reading stanine scores was also not
significant (F = 0.000, P > 0.05). The interaction between
program and ethnicity did not reach statistical
significance (F = 2.317, P > 0.05). As to SAT Reading
scores from 1999-2000, the program effect was non
significant (F = 0.902, P = 0.3460). The ethnicity effect
63

(Native Hawaiian vs. non-Native Hawaiian) was also not
significant (F = 0.139, P = 0.711). The interaction between
program and ethnicity failed to reach significance (F =
0.558, P = 0.458).
SAT Mathematics
Table 10 shows Native Hawaiian students in the Aloha
Academy with a mean stanine in SAT Mathematics stanine
scores for school year 1997-1998, of 3.6, 1998-1999, of
3.7, and for 1999-2000, of 3.7, while Native Hawaiians in
the regular classrooms show a mean Mathematics stanine of
3.4 in 1997-1998, 3.8 SAT Mathematics in 1998-1999, and 3.9
SAT Mathematics in 1999-2000. The Aloha Academy for non
Native Hawaiian students SAT Mathematics mean stanine in SY
1997-1998 was 3.4, in 1998-1999 was 3.8, and 1999-2000 was
3.8. Students in the regular program in 1997-1998 had mean
Mathematics stanine of 3.5, in 1998-1999, of 4.3, and 1999
2000, of 3.7.
64
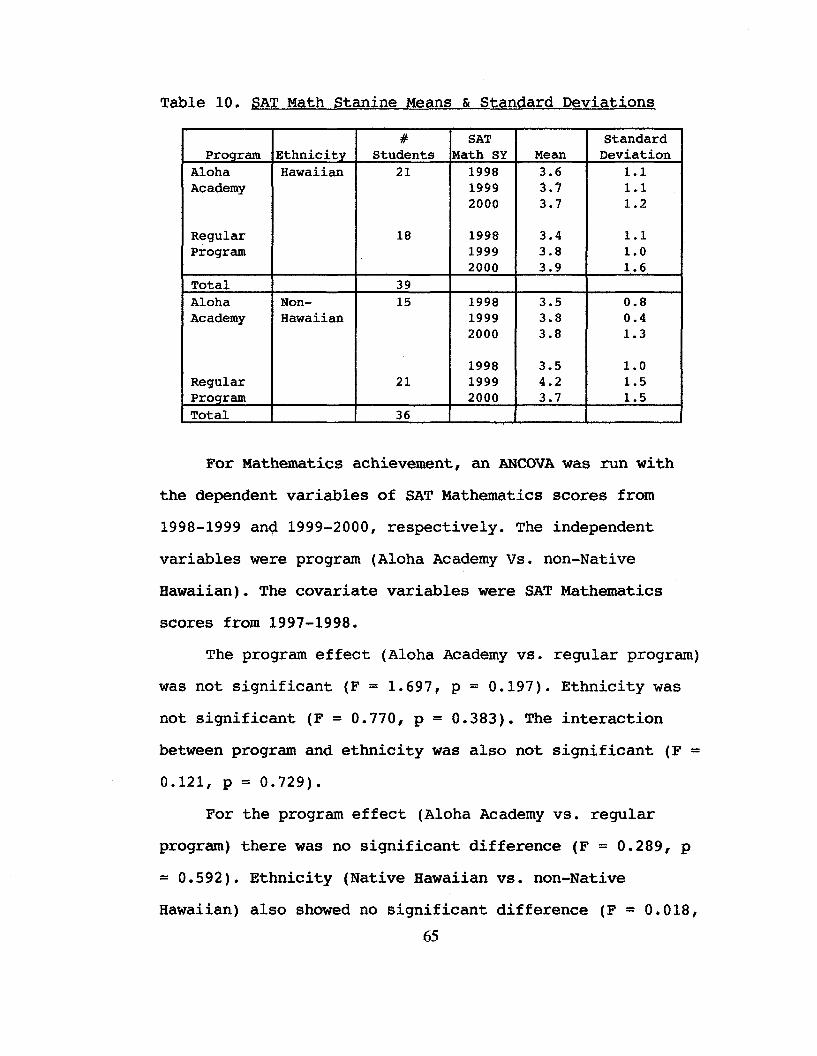
Table 10. SAT Math Stanine Means & Standard Deviations
# SAT StandardProqram Ethnicitv Students Math SY Mean Deviation
Aloha Hawaiian 21 1998 3.6 1.1Academy 1999 3.7 1.1
2000 3.7 1.2
Regular 18 1998 3.4 1.1Program 1999 3.8 1.0
2000 3.9 1.6Total 39Aloha Non- 15 1998 3.5 0.8Academy Hawaiian 1999 3.8 0.4
2000 3.8 1.3
1998 3.5 1.0Regular 21 1999 4.2 1.5proqram 2000 3.7 1.5Total 36
For Mathematics achievement, an ANCOVA was run with
the dependent variables of SAT Mathematics scores from
1998-1999 an~ 1999-2000, respectively. The independent
variables were program (Aloha Academy Vs. non-Native
Hawaiian). The covariate variables were SAT Mathematics
scores from 1997-1998.
The program effect (Aloha Academy vs. regular program)
was not significant (F = 1.697, P = 0.197). Ethnicity was
not significant (F = 0.770, P = 0.383). The interaction
between program and ethnicity was also not significant (F =
0.121, P = 0.729).
For the program effect (Aloha Academy vs. regular
program) there was no significant difference (F = 0.289, P
= 0.592). Ethnicity (Native Hawaiian vs. non-Native
Hawaiian) also showed no significant difference (F = 0.018,
65

p = 0.894). The interaction between program and ethnicity
failed to reach statistical significance (F= 0.675, p=
0.414).
In sununary, the program effect for SAT Reading and
Mathematics was not significant. Likewise the ethnicity
effect showed no significance for SAT Reading or
Mathematics. The interaction effect between program and
ethnicity showed no effect for SAT Reading or Mathematics.
66

CHAPTER 8
ANALYSIS OF DROPOUT RESULTS
Dropout Analysis
The last research question examined the percentage of
students who dropped out of high school before graduation.
This study examined the intervention program, the Aloha
Academy, which was designed to provide a deterrent to at
risk students dropping out of school. This chapter
addresses the question of whether the culturally compatible
Aloha Academy Program reduced the dropout rate of at-risk
Native Hawaiian and non-Native Hawaiian students. For this
stUdy, a logistic progression procedure was used to measure
the effects of the Aloha Academy as opposed to all other
students enrolled in the ninth grade in 1998-1999. This was
done with a particular interest in the students of Native
Hawaiian ancestry.
population
The ninth grade of this high school in the 1998-1999
school year included 577 students. Two hundred twenty-nine
students were registered in Gifted and Talented (GT) or "X"
(high) level classes, 294, in "YZ" (middle and low) level
classes, 51 in SPED, with the remaining assigned to the
special motivation class (alternative program). Of the 577
students, 89 participated in the Aloha Academy during ninth
grade (49 Native Hawaiian, 40 non-Native Hawaiian, 46
67
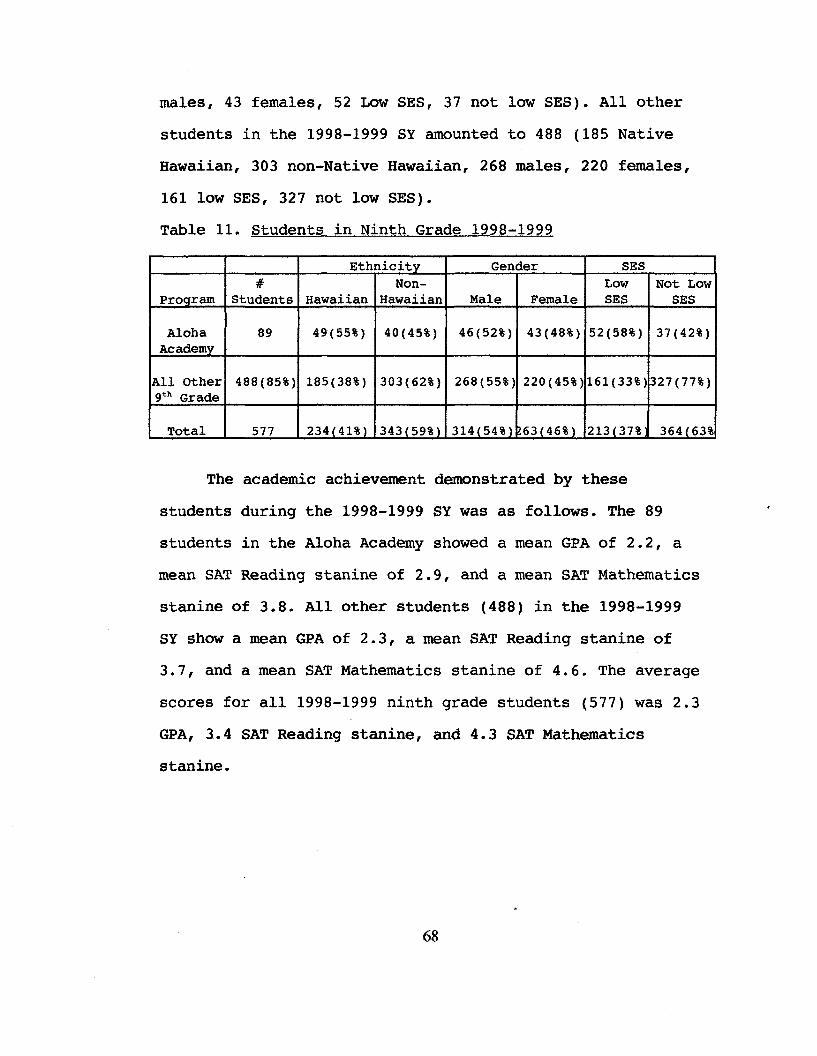
males, 43 females, 52 Low SES, 37 not low SES). All other
students in the 1998-1999 SY amounted to 488 (185 Native
Hawaiian, 303 non-Native Hawaiian, 268 males, 220 females,
161 low SES, 327 not low SES).
Table 11. Students in Ninth Grade 1998-1999
Ethnicity Gender SES# Non- Low Not Low
Proqram Students Hawaiian Hawaiian Male Female SES SES
Aloha 89 49(55%) 40(45%) 46(52%) 43(48%) 52(58%) 37(42%)Academy
All Other 488(85%) 185(38% ) 303(62%) 268(55%) 220(45%) 161(33%) 327(77%)9 th Grade
Total 577 234(41%) 343(59%) 314(54%) 63(46%) 213(37% 364(63%
The academic achievement demonstrated by these
students during the 1998-1999 SY was as follows. The 89
students in the Aloha Academy showed a mean GPA of 2.2, a
mean SAT Reading stanine of 2.9, and a mean SAT Mathematics
stanine of 3.8. All other students (488) in the 1998-1999
SY show a mean GPA of 2.3, a mean SAT Reading stanine of
3.7, and a mean SAT Mathematics stanine of 4.6. The average
scores for all 1998-1999 ninth grade students (577) was 2.3
GPA, 3.4 SAT Reading stanine, and 4.3 SAT Mathematics
stanine.
68
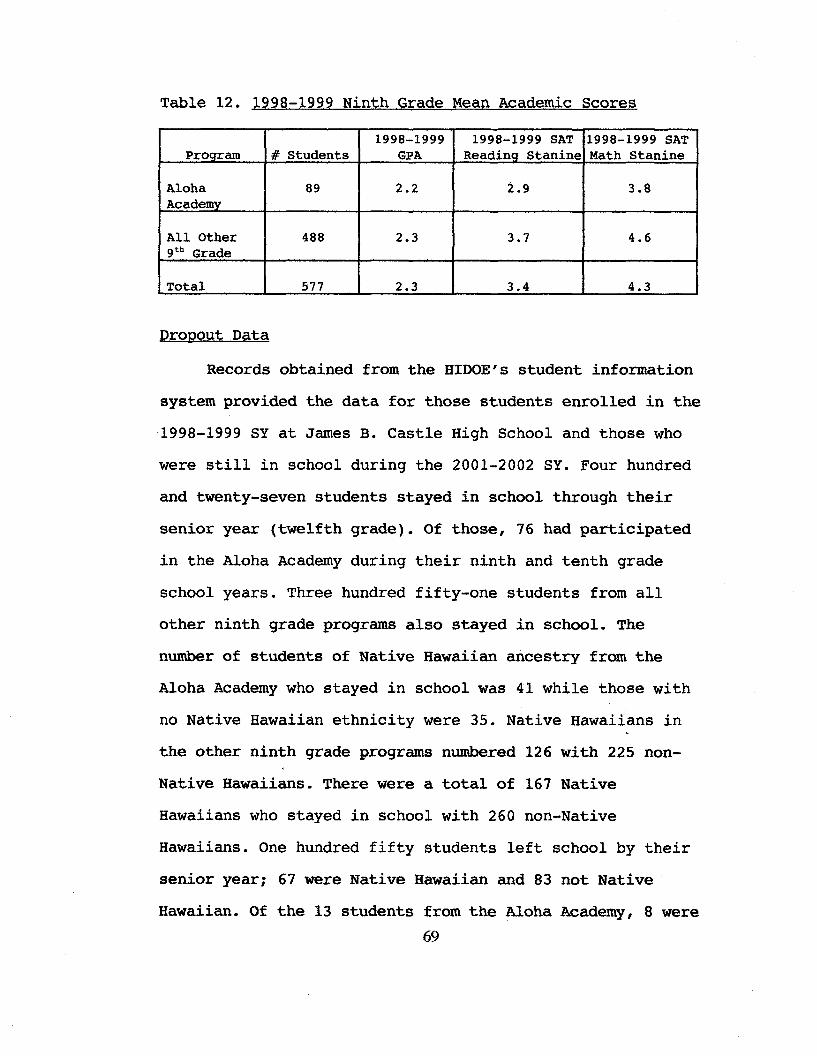
Table 12. 1998-1999 Ninth Grade Mean Academic Scores
1998-1999 1998-1999 SAT 1998-1999 SATProqram # Students GPA Readinq Stanine Math Stanine
Aloha 89 2.2 2.9 3.8Academy
All Other 488 2.3 3.7 4.69th Grade
Total 577 2.3 3.4 4.3
Dropout Data
Records obtained from the HIDOE's student information
system provided the data for those students enrolled in the
1998-1999 SY at James B. Castle High School and those who
were still in school during the 2001-2002 SY. Four hundred
and twenty-seven students stayed in school through their
senior year (twelfth grade). Of those, 76 had participated
in the Aloha Academy during their ninth and tenth grade
school years. Three hundred fifty-one students from all
other ninth grade programs also stayed in school. The
number of students of Native Hawaiian ancestry from the
Aloha Academy who stayed in school was 41 while those with
no Native Hawaiian ethnicity were 35. Native Hawaiians in
the other ninth grade programs ntunbered 126 with 225 non
Native Hawaiians. There were a total of 167 Native
Hawaiians who stayed in school with 260 non-Native
Hawaiians. One hundred fifty students left school by their
senior year; 67 were Native Hawaiian and 83 not Native
Hawaiian. Of the 13 students from the Aloha Academy, 8 were
69

of Native Hawaiian ancestry and 5 were not. Of the 137
students who were not in the Aloha Academy, 59 were of
Native Hawaiian ancestry and 78 were not.
Table 13. Data for students in Class of 2002
Status 1998-1999 Program Hawaiian Non- TotalHawaiian
Stayed in Aloha Academy 41 35 76School
All Other Students 126 225 351Total 167 250 427
Left Aloha Academy 8 5 13School
All Other Students 59 78 137Total 67 83 150
Dropout Results
A logistic regression procedure with interaction was
used to examine the main effects of ethnicity (Native
Hawaiian vs. non-Native Hawaiian) and program (Aloha
Academy vs. all others) to determine whether the
probability of dropping out of school was contingent on
ethnicity, the treatment program or an interaction between
the two. The interaction between the treatment and
ethnicity was not significant (chi-square = 0.0003, P =
0.9864). Therefore, the interaction effect was dropped from
the model. A simplified model with two main effects
(ethnicity and program) was subsequently tested.
Table 14 shows the probabilities for dropping out of
high school. The probability for students of Native
Hawaiian ancestry who participated in the Aloha Academy was70

.16 and for non-Native Hawaiians, .13. Native Hawaiian
students who did not participate in the academy had a
higher probability of 0.32 for dropping out of school while
non-Native Hawaiians who did not participate had a
probability of .26.
Table 14. Probabilities for Dropping Out
Program Ethnicity Probability
Aloha Academy Hawaiian .16
Non-Hawaiian .13
All Other Hawaiian .32Students
Non-Hawaiian .26
The findings showed that ethnicity does not make a
difference on whether a student stays in school or not
(chi-square = 2.4018, P = 0.1212). However, the effect of
the Aloha Academy was significant (chi-square = 7.5969, P =0.0058). Those students who participated in the Aloha
Academy had lower odds of dropping out (0.17 vs. 0.39 for
students in the other programs). Even though, the Aloha
Academy was designed to help students of Native Hawaiian
ancestry in particular, the results indicate that it also
helped non-Native Hawaiian students to more or less the
same extent. The overall odds ratio is 0.44, which is
statistically significant (a = 0.05) and indicates the odds
of an Aloha Academy student dropping out is only about 44%
71

of the odds of a student in the other programs dropping
out. This finding is particularly encouraging, considering
that the Aloha Academy takes in only students who have been
identified as at-risk whereas the other programs include
both at-risk and not at-risk students.
72
Chapter 9
DISCUSSION
This chapter is organized into three sections. The
first section discusses the summary of the research and its
purpose as well as the findings of the study. The second
section develops conclusions and implications drawn from
this study within the framework of Turning Points and Great
Transitions reports' recommendations (Carnegie Council,
1989, 1995). The final section addresses the contributions
of this study to research pertaining to school reform and
the possible implications for practice and future research.
Summary of Research and Purpose of the Study
This study sought to discover the potential effects of
a school reform model, the Aloha Academy, in a large high
school, in the Windward District of the Hawaii Department
of Education on the island of Oahu. The program was based
on the recommendations of the Carnegie Council's Turning
Points and Great Transitions reports and designed further
to be culturally compatible for students of Native Hawaiian
ancestry.
The purpose of this study was to examine whether
students who participated in the intervention program, the
Aloha Academy, eXPerienced less alienation than the
comparable ninth grade group, and therefore, attained
higher levels of academic achievement than comparable
73
students in the regular school program. It was further
hypothesized that Native Hawaiian students within the
intervention program's culturally compatible program would
experience even more noticeable decreases in alienation
than their counterparts within the same intervention group.
It was expected that Native Hawaiian students would
demonstrate higher levels of academic achievement than
their non-Native Hawaiian counterparts within the same
intervention program. It was also hypothesized that
students who have participated in Aloha Academy would have
a lower dropout rate than all other students in their grade
cohort.
Findings of the Study
Although no statistical significance,
ethnicity/program effects emerged to indicate that the
cUlturally compatible Aloha Academy gives Native Hawaiian
students an advantage over non-Native Hawaiians. The scores
both for alienation and academic achievement for students
in the Aloha Academy were lower than the comparable group
who stayed in the Regular program indicating a lower level
of alienation. That the treatment was not found significant
for students of Native Hawaiian ancestry in particular was
disappointing considering the eXPectations arising from the
culturally compatible design of the Aloha Academy. A
possible consideration for the disappointing results may
lie in the high percentage of Native Hawaiian students in
~

the school's population and their personal level of self
pride as Native Hawaiians living on their own land. The
alienation that is felt may be more related to the low
value for education in the family culture, thus feelings of
normlessness, powerlessness, isolation and cultural
estrangement may not be of major importance.
In regards to research question one that sought to
validate the alienation construct, although some
preliminary evidenc~ was found to support the 4-factor
model of alienation, unfortunately, a large number of the
items on the modified Dean's Scale and the MOS scale failed
to load on their intended factors.
Research question two addressed the feelings of
alienation as measured by the four-factor construct. No
significant effect due to the Aloha Academy was found.
Greene's (1998) research that noted Native Hawaiian
students were not seen as self-disparaging or alienated but
rather felt pride and self-assurance may provide reasons
for the non-significant difference.
For research question three, the Aloha Academy showed
significant increases for GPA when compared to the Regular
program from 1997-1998 to 1998-1999 and for 1997-1998 to
1999-2000.
Regarding research question four, no significant
effect due to the Aloh6 Academy was found in SAT Reading
and Math scores which-was disappointing.
75

Regarding the fifth question on the dropout
phenomenon, those students who participated in the Aloha
Academy had significantly lower odds of dropping out. It is
notable that even though the Aloha Academy was designed to
help students of Native Hawaiian ancestry, the results
indicate that it also helped non-Native Hawaiian students
to more or less the same extent. This suggests that the
recommendations of the Carnegie Council reports may work
equally well for Native Hawaiian and non-Native Hawaiian
students. This model may appear to be a culturally neutral
model although more research is necessary in the future.
Conclusions and Implications
Several conclusions were drawn from the data. First,
the 4-factor alienation construct was partially validated
in Hawaii. Second, the students in the Aloha Academy were
studied relative to their counterparts in the regular
classrooms as to their feelings of alienation. Third, the
study sample was examined regarding their achievement
academically and in terms of the SAT scores. Finally, the
sample was examined as to their dropout status. While
results from the academic data did not present a
significant statement for the Aloha Academy, in every
analysis the Aloha Academy provided more positive results
than those students in the regular program did. The
significance of the dropout results for the Aloha Academy
may actually be considered to add to the validity of the
76
original hypotheses while the actual scores were not
significant. Because of this, it may be argued that the
recommendations of the Carnegie Council in their two
reports (1989 & 1995) work equally well for Native Hawaiian
students and non-Native Hawaiian students. In retrospect,
it may be considered that the Native Hawaiian cultural
values of lokahi, malama 'aina, ohana, kokua, and aloha
'aina conceptually fit the recommendations made by the
Carnegie Council and may be valuable recommendations for
all'U. S. public schools.
Caveats
Factors that may have negatively impacted the outcomes
for this study include the following:
1) This is not a true experimental design as the
students in the Aloha Academy were self-selected.
2) In the Principal Components Analysis (PCA), the
reduction in the number of usable items, Dean, items reduced
from 24 to 10 and MOS items from 14 to 4, may be specific
to the population due to the large percentage (41%) of
Native Hawaiian students in this stUdy group.
3) The different instructors make individual
assessments of students that are not standardized in any
measurable forms that control GPAs.
4) The disappointing results to this researcher from
this alienation study may be due in part to the lack of
students' understanding of the Dean and MOS surveys.
77

Shoho's 1997 version of the Dean Alienation Scale that was
modified specifically for high school students may have
provided better results.
Contributions and Recommendations
This study has contributed to the field of educational
research by further clarifying the study of at-risk Native
Hawaiian students in the public education setting. At-risk
students of Native Hawaiian ancestry may benefit from
programs that are based on the Carnegie Council's Turning
Points and Great Horizons recommendations. Further, all
ninth grade students may benefit from such programs.
Implications for Future Research
This study provides implications for future research
with students of Native Hawaiian ancestry. First, the
issues surrounding the alienation of Native Hawaiian
students in their native land continues to be a major
concern that must be further examined. Second, this study
provides additional information regarding the academic
success of Native Hawaiian students in a more culturally
compatible environment that may initiate further research
in this area.
Additional instruments need to be created that relate
directly to the issues of children of Native Hawaiian
ancestry. The MOS scale seemed to bring out the issues of
isolation and loneliness rather than cultural estrangement.
The Dean Scale may be further modified and tested as a part
78
of this. perhaps a new instrument with more appropriate
items based on the research on Native Hawaiian students
will provide a clearer picture of the alienation these
children experience as well as the kinds of school
environment that bring academic success.
That the Turning Points' recommendations for small
student groups shared by teams of teachers who meet
regularly, plan interdisciplinary learning experiences,
provide advising, and communicate regularly with parents
can impact such a large number of potential dropouts, as
this study suggests, is indicative of the need to provide
more caring and relevant education for all adolescents. The
Turning Points' recommendations are the basis of the
concept of umiddle school" education. Further research on
the effects of these recommendations will certainly be
relevant especially in eXamining long-term exposure by
following students from the beginning of middle school
through the completion of the high school diploma. In
addition, exploration of the cultural compatibility of
programs and how they combine with the Turning Points'
model may provide profound implications for how we
structure schools today.
79

References
Ah Nee-Benham, M. K., & Heck, R. H. (1998). Culture
and educational policy in Hawaii: The silencing of native
voices. Mahwah, NJ: Erlbaum.
Bayh, E. (1995). The National Education GOals Report:
Building a nation of learners. Washington DC: U. S.
Government printing Office.
Brislin, R. (1993). Ungerstanding culture's influence
on behavior. Fort Worth, TX: Harcourt Brace.
Bronfenbrenner, u. (1977). Toward an experimental
ecology of human development. American psychologist, 32,
513-530.
Bronfenbrenner, U. (1986). Alienation and the four
worlds of childhood. Phi Delta Kappan, 67, 430-436.
Bronfenbrenner, U., & Ceci, S. J. (1994). Nature
nurture reconceptua1ized in developmental perspective: A
bioecological model. Psychological Reyiew, 101, 568-586.
Calabrese, R. L. (1987). Adolescence: A growth period
conducive to alienation. Adolescence, 22, 929-938.
Calabrese, R. L., & Adams, J. (1990). Alienation: A
cause of juvenile delinquency. Adolescence, 25, 435-440.
Calabrese, R. L., & Raymond, E. J. (1989). Alienation:
Its impact on adolescents from stable environments. The
Journal of psychology, 123, 397-404.
80
Carnegie Council on Adolescent Development. (1989).
Turning points: Preparing youth for the 21st Century. New
York: Carnegie Corporation.
Carnegie Council on Adolescent Development. (1995).
Great transitions: preparing adolescents for a new century
(Concluding report). New York: Carnegie Corporation.
Ceppi, A. K. (1997). The development of a culture
assimilator for the orientation of teachers coming to
Molokai from the mainland. Unpublished Master'S thesis,
University of Hawaii, Honolulu.
Ceppi, A. K. (2000). Examining a culturally relevant,
community based secondary education program: The Waianae
high school Hawaiian studies program. Unpublished doctoral
dissertation, university of Hawaii, Honolulu.
Cuban, L. (1993). How teachers taught: Constancy and
change in American classrooms 1890-1990 (200 ed.) New York:
Teachers College, Columbia.
Cuban L., & Shipps, D. (eds.) (2000). Reconstructing
the common good in education: Coping with intractable
American dilemmas. Stanford, CA: Stanford University.
D'Amato, J. (1988). "Acting": Hawaiian children'S
resistance to teachers. The Elementary School Journal, 88,
529-544.
Dean, D. (1961). Alienation: Its meaning and
measurement. American Sociological Review, 26, 753-758.
81
Eccles, J. S., Buchanan, C. M., Flanagan, C.,
Fugliani, A., Midgley, C. & Yee, D. (1991). Control versus
autonomy during early adolescence. Journal of Social
Issues, 47, 53-68.
Eccles, J. S., Flanagan, C., Lord, S., Midgley, C.,
Roeser, R., & Yee, D. (1996). Schools, families, and early
adolescents: What are we doing wrong and what can we do
instead? Developmental and Behavioral Pediatrics, 17, 267-
278.
Education Trust. (2004). Education watch Hawaii: Key
education facts and figures. EdWatch Online 2004 State
Summary Reports, www•edtrust. org•
FeIner, R. D., Jackson, A. W., Kasak, D., Mulhall, P.,
Brand, S., & Flowers, N. (March, 1997). The impact of
school reform for the middle years: Longitudinal study of a
network engaged in turning points-based comprehensive
school transformation. Phi Delta Kappan, 78, 528-532, 541-
550.
Gibson, M. A., & Ogbu, J. U. (1991). Minority status
and schooling: A comparative study of immigrant and
involuntary minorities. New York: Garland Publishing.
Glasser, w. (1990). The quality school: Managing
students without coercion. New York: HarPer & Row.
82

Greene, W. L. (1998). Determinants of ethnic identity
among adolescents in Hawaii. Unpublished doctoral
dissertation, University of Hawaii, Manoa.
Goswick, R. A., & Jones, w. H. (1982). Components of
loneliness during adolescence. Journal of Youth and
Adolescence, 11, 373-383.
Hammond, O. W. (1988). Needs assessment and policy
development: Native Hawaiians as Native Americans. American
psychologist, 43, 383-387.
Harcourt Educational Measurement. (1997). Stanford
Achievement Test Series (9th ed.). San Antonio, TX: Author.
Hatcher, L. (1994). Step by Step Approach to Using the
BAS System for Factor Analysis and Structural Equation
Modeling. Cary, NC: SAS Institute.
Hawaii Department of Education. (1995). In the middle:
Challenge, change, charge! A framework for middle level
education in Hawaii. (RS 95-7320). Honolulu, HI: Hawaii
Department of Education Office of Instructional Services.
Hawaii Department of Education (1998). The
Superintendent's Ninth Annual Report on School Performance
and Improvement in Hawaii. Honolulu: Hawaii Department of
Education Office of the Superintendent.
Hawaii Department of Education (2003). The
Superintendent's Thirteenth Annual Report on School
PerfOrmance and Improvement in Hawaii, 2002. Honolulu, HI:83

Hawaii Department of Education Office of the
Superintendent.
Hawaii Legislature. Office of the Legislative Auditor
(HILEG), (1996). Audit of the comprehensive school
alienation program and the pregnant and parenting teen
program of the department of education: A report to the
governor and the legislature of the state of Hawaii/
submitted by the auditor, State of Hawaii.
Hechinger, F. M. (1993). Turning point revisited: A
new deal for adolescents. Carnegie Quarterly, 38, 1-13.
Henze, R. C., & Vanett, L. (1993). To walk in two
worlds-or more? Challenging a common metaphor of native
education. Anthropology and Education Quarterly, 24(2),
116-134.
Hofstede, G. (1986). Cultural differences in teaching
and learning. International Joyrnal of Intercultural
Relations, 10, 301-320.
Jackson, A. W., & Davis, G. A. (2000). Turning points
2000: Educating adolescents in the 21st Century. New York:
Teachers Coll~ge Press.
Jordan, C. (1985). Translating culture: From
ethnographic information to educational program.
AnthrQPology and Education Quarterly, 16, 105-123.
84

Jordan, C. (1992). The role of culture in minority
school achievement. The Kamehameha Journal of Education, 3,
53-67.
Kamehameha Schools/Bishop Estate. (1983). Native
Hawaiian Educationsl Assessment project, Final Report.
Honolulu, Hi: Kamehameha Schools.
Kamehameha Schools/Bishop Estate. (1993). Native
Hawaiian Educational Assessment. Honolulu, Kamehameha
Schools
Kane, M. (1997). Proposal for research and development
funds for a school-within-a-school project at Castle High
School to service the need§ of native Hawaiian students.
Presented at the May meeting of the Office of Hawaiian
Affairs, Honolulu, HI.
Klein, R. (1999). Defying disaffection: How schools
sre winning the hearts and minds of reluctant student§.
Staffordshire, England: Trentham Books.
LeCompte, M. D., & Dworkin, A. G. (1991). Giving up on
school: Student dropouts and teacher burnouts. Newbury
Park, CA: Corwin.
Lipsitz, J., Jackson, A. w., & Austin, L. M. (March,
1997). What works in middle-grades school reform. Phi delta
Kappan, 78, 517-520.
Loughrey, M. E., & Harris, M. B. (1992). Adolescent
alienation and attitudes toward §chool in Native American,
85

Hispanic, and Anglo high school students. Paper presented
at the annual meeting of the American Educational Research
Association, San Francisco.
Mackey, J. (1977). Mapping the course of adolescent
alienation. Social Education, 5, 432-435.
Mackey, J., & Ahlgren, A. (1977). Dimensions of
adolescent alienation. Applied Psychological Measurement,
1L 219-232.
Mau, R. Y. (1989). Student alienation in a school
context. Research in Education, 42, 17-28.
Mau, R. Y. (1992). The validity and devolution of a
concept: Student alienation. Adolescence, 27, 731-741.
McLain, M. L. A. (1998). Effects of the long-term
underdevelopment of the Hawaiian cultures and the
relationship to theories of human development. Ann Arbor,
MI: Walden University.
Minerbi, L. , McGregor, D., & Matsuoka, J., (Eds.)
(1993). Native Hawaiian and local cultural assessment
project. (Phase I Problems/Assets Identification).
Honolulu: University of Hawaii at Manoa.
Murdock, T. B. (1999). The social context of risk:
Status and motivational predictors of alienation in middle
school. Journal of Educational Psychology, 91, 62-75.
86
Oakes, J., Quartz, K. H., Gong, J., Guiton, G., &
Lipton, M. (1993). Creating middle schools: Technical,
normative, and political considerations. The Elementary
School Journal, 93, 461-480.
Ogbu, J. U., (1991). Immigrant and involuntary•
minorities in comparative perspective. In M. A. Gibson & J.
u. Ogbu (Eds.), Minority status and schooling: A
comparative study of immigrant and involuntary minorities.
(pp. 3-33). New York: Garland.
Phelan, P., Davidson, A. L., Cao, H. T. (1991).
Students' multiple worlds: Negotiating the boundaries of
family, peer, and school culture. Anthropology & Education
Ouarterly, 22, 224-250.
Psychological Corporation. (1992). Stanford
Achievement Test Series: Technical data report (8th ed.).
San Antonio, TX: Author.
Roeser, R. W., Midgley, C., & Urdan, T. C. (1996).
perceptions of the school psychological environment and
early adolescents' psychological and behavioral functioning
in school: The mediating role of goals and belonging.
Journal of Educational Psychology, 88, 408-422.
Roig, M., & Neaman, M. A. (1994). Alienation, learning
or grade orientation, and achievement as correlates of
attitudes toward cheating. Perceptyal and Motor Skills, 78,
1096-1098.
87

Rosenthal, B. S. (1994, April). The impact of social
support on staying in school: A preliminary report. Paper
presented at the annual meeting of the American Educational
Research Association, New Orleans, LA.
Sankey, M., & Huon, G. F. (1999). Investigating the
role of alienation in a mUlti-component model of juvenile
delinquency. Journal of Adolescence, 22, 95-107.
Seeman, M. (1983). Alien motifs in contemporary
theorizing: The hidden continuity of classic themes, Social
Psychology Quarterly, 46, 171-184.
Shoho, A. R. (1996, April). The alienation of rural
middle §cbool students: Implications for gang membership.
paper presented at the annual meeting of the American
Educational Research Association, New York.
Shoho, A. R., Katims, D. S., & Wilks, D. (1997).
Perceptions of alienation among students with learning
disabilities in inclusive and resource settings. The High
School Journal, 81, 28-36.
Shoho, A. R., & Petrisky, I. T. (1996, April). The
rural school environment and its effect on adolescent
alienation. Paper presented at the annual meeting of the
American Educational Research Association, New York.
Takenaka, C. (1995). A perspective on Hawaiians.
Hawaii COmmunity Foundation Diversity Project. Honolulu,
HI: Hawaii Community Foundation.
88
Tharp, R. G., & Gallimore, R. (1988). Rousing minds to
life. Cambridge, MA: university Press.
Travis, T. (1993). The MOS alienation scale: An
alternative to Sroles's anomia scale. Social Indicators
Research, 28, 71-91.
Tucker-Ladd, P. R. (1990). Alienated Adolescents: How
can schools help? The Clearing House, 64, 112-115.
United States Department of Education, (1996, March).
High school dropout rates. Consumer Guide.
www.gov!pubs!OR/ConsumerGuides!dropout.html.
Wang, z., Brandon, P. R., Sakaguchi, G. E., & Peecook,
E. v. (1994). Final report on the evaluation of the
aonolulu District Middle Schools Project. prepared under a
memorandum of agreement with the Hawaii Department of
Education, Honolulu, Hawaii.
Yamauchi, L. A. (1996). Cultural influences on the
goals and roles of classrooms. Manuscript submitted for
publication.
Yamauchi, L. A., Ceppi, A. K. & Lau-Smith, J. A.
(1998). Sociohistorical influences on the development of
papahana Kaiapuni, the Hawaiian language immersion
programs. Journal of Education for Students Placed at Risk,
4(1), 27-46.
Yamauchi, L. A., & Tharp, R. G. (1991). Culturally
compatible conversations in Native American Classrooms.
89

Paper presented at the annual meeting of the American
Anthropological Association, Chicago.
Yamauchi, L. A., Greene, W. L., Ratliffe, K. T., &
Ceppi, A. (1996). Native Hawaiians on Molokai: Culture,
community, and schooling. Paper presented at the annual
meeting of the American Educational Research Association,
New York.
Zhang, S., & Barnard, B. (1995). An Experimental
Schooling Skills Class in Hawaii. National Association of
Secondary Schools.Bulletin, 79, 97-100.

APPENDIX A: Surveys
Name Survey 1 Date
Modified Dean's Alienation Scale - (Shoho, 1996
Below are some statements regarding your feelings about your school with which somepeople agree and others disagree. Please give us your own opinion about these items.
Please circle the number that best expresses how you feel about the statement:
Strongly StronglyAgree Disagree
1. Sometimes I feel all alone in school. 5 4 3 2 1
2. I worry about the future. 5 4 3 2 1
3. I don't get invited out by my friends as often as I'd like. 5 4 3 2 1
4. It doesn't matter how you get good grades 5 4 3 2 1as long as you get them.
5. Most of my friends feel lonely in school. 5 4 3 2 1
6. Sometimes I have the feeling that teachers use me. 5 4 3 2 1
7. Teacher's ideas change so much that I wonder 5 4 3 2 1if I know what to believe.
8. Good teachers are easy to find. 5 4 3 2 1
9. I am frightened to be responsible for myself. 5 4 3 2 1
10.There aren't any real rules in schools that I need to follow. 5 4 3 2 1
11.1 can always find good friends. 5 4 3 2 1
91

Name _ Page 2
Strongly StronglyAgree Disagree
12. I don't understand what school is all about. 5 4 3 2 1
13. There is little or nothing I can do towards improving 5 4 3 2 1my education.
14. School is basically a friendly place. 5 4 3 2 1
15.There are so many decisions that I have to make 5 4 3 2 1that sometimes I could "blow up."
16. The only thing I can be sure of in school is to be sure 5 4 3 2 1of nothing.
17. There are few dependable ties between teachers 5 4 3 2 1and students.
18. There is little chance for getting a good grade 5 4 3 2 1unless you get a break.
19. With so many different teachers, 5 4 3 2 1I really don't know which rules to follow.
20.My school is so strict that there is no room for choice. 5 4 3 2 1
21.1 feel like a number in my school. 5 4 3 2 1
22.The teachers at my school are friendly and helpful. 5 4 3 2 1
23.1 don't like to think about my future. 5 4 3 2 1
24.1 don't get to Visit my friends as often as I'd really like. 5 4 3 2 1
92

Name Survey 2 Date
MOS Scale (Travis, 1993)
Please circle the number that best expresses how you feel about the statement:
Strongly StronglyAgree Disagree
1. I feel all alone these days. 5 4 3 2 1
2. I'm sure I'll find the right person to care enough about me. 5 4 3 2 1
3. I often feel discriminated against. 5 4 3 2 1
4. I like to live by society's rules. 5 4 3 2 1
5. My whole world feels like it's falling apart. 5 4 3 2 1
6. It's fairly easy for me to tell just what is right 5 4 3 2 1and what is wrong these days.
7. I wish I were somebody important 5 4 3 2 1
8. I never feel all alone these days. 5 4 3 2 1
9. I don't like to live by society's rules. 5 4 3 2 1
10.My whole world feels like it's running smoothly. 5 4 3 2 1
11.lt's hard for me to tell just what is right and wrong 5 4 3 2 1these days.
12.1 rarely feel discriminated against. 5 4 3 2 1
13.1'11 never find the right person to care enough about me. 5 4 3 2 1
14.1 don't wish I were somebody else. 5 4 3 2 1
93


![Powerlessness apart from the Spirit] Recap of Galatians 5newcitychurchla.com/.../sermons/2016/10/NewCitySermon_16_10_0… · [Slide 2: October 2, 2016 Powerlessness apart from the](https://img.dokumen.tips/doc/110x75/60344277c5628f15a151ca0d/powerlessness-apart-from-the-spirit-recap-of-galatians-slide-2-october-2-2016.jpg)