Embed Size (px)
Citation preview

64 Slice CTDedicated Cardiovascular CT
Managing Data
Overload
Minimizing
CT Risk
Patient Focused
Imaging
Clinical AdvancementsI N V O L U M E T R I C C T
A P U B L I C A T I O N P R O D U C E D B Y T O S H I B A M E D I C A L S Y S T E M S
J u l y 2 0 0 5

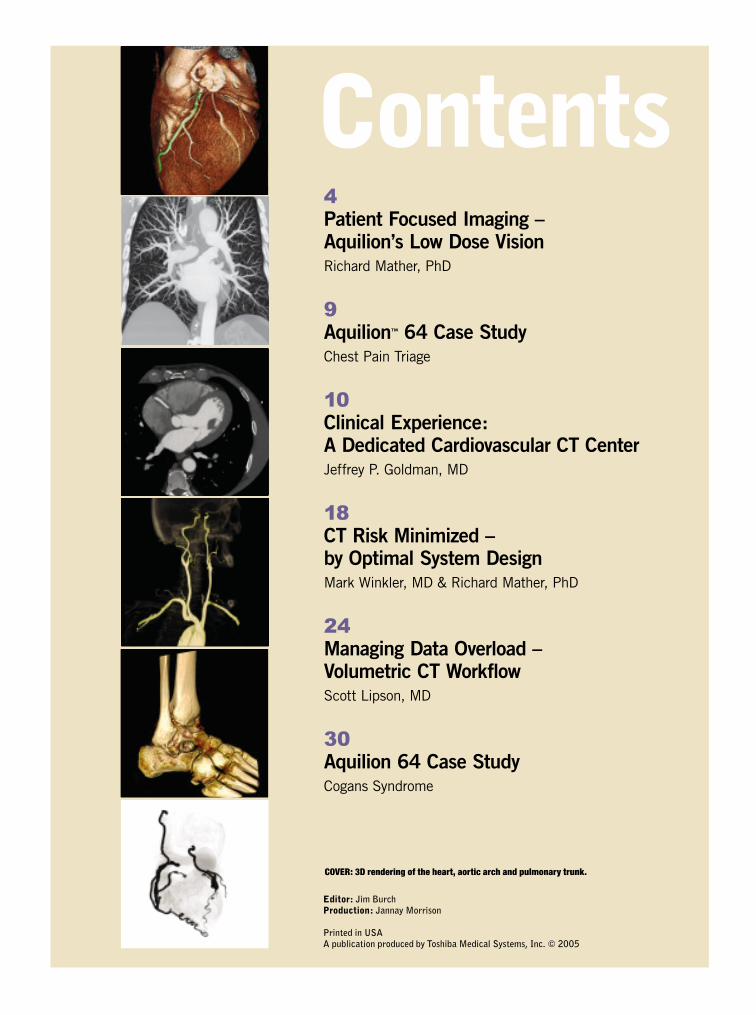
COVER: 3D rendering of the heart, aortic arch and pulmonary trunk.
4
Patient Focused Imaging –Aquilion’s Low Dose VisionRichard Mather, PhD
9
Aquilion™ 64 Case StudyChest Pain Triage
10
Clinical Experience:A Dedicated Cardiovascular CT CenterJeffrey P. Goldman, MD
18
CT Risk Minimized –by Optimal System DesignMark Winkler, MD & Richard Mather, PhD
24
Managing Data Overload –Volumetric CT Workfl owScott Lipson, MD
30
Aquilion 64 Case StudyCogans Syndrome
Contents
Editor: Jim Burch
Production: Jannay Morrison
Printed in USA
A publication produced by Toshiba Medical Systems, Inc. © 2005
4 July 2 0 05
Patient FocusedImagingAquilion’s Low Dose Vision
Introduction
The sole purpose of a CT scanner
system is to produce diagnostic images
and thereby aid a physician in the care
and management of the patient. To
accomplish this, the CT system must
have, above all, superior image quality.
There are many parameters
that describe the quality of a CT
image. These include low contrast
detectability (LCD), spatial resolution,
temporal resolution, noise, and
various artifacts. In the end, it is
the CT system’s ability to faithfully
represent the anatomy that defi nes
its image quality.
Image Quality
Many aspects of system design, such
as the gantry, x-ray tube, detectors,
and data acquisition system infl uence
the various image quality metrics.
However, nearly all the parameters
that describe image quality are heavily
dependent upon the signal to noise
ratio (SNR) of the image. In general, a
better SNR results in improved image
quality. Therefore, in order to improve
a system’s image quality, we need to
improve the SNR.
By defi nition, there are two ways to
improve a system’s signal to noise ratio:
either increase the signal or decrease
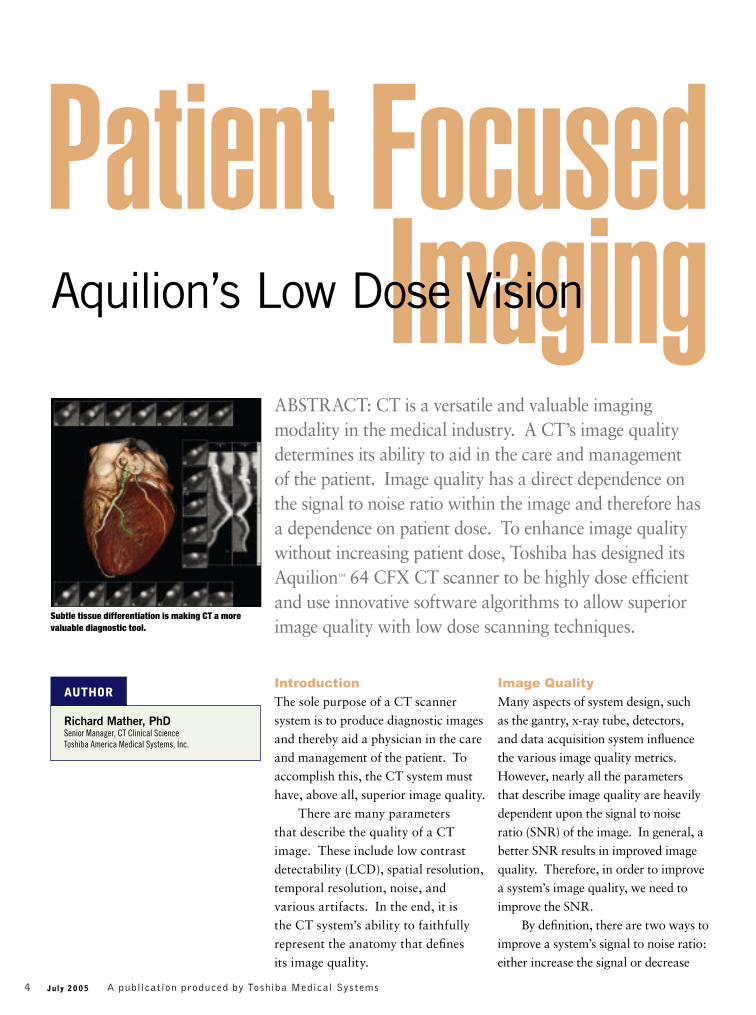
ABSTRACT: CT is a versatile and valuable imaging
modality in the medical industry. A CT’s image quality
determines its ability to aid in the care and management
of the patient. Image quality has a direct dependence on
the signal to noise ratio within the image and therefore has
a dependence on patient dose. To enhance image quality
without increasing patient dose, Toshiba has designed its
Aquilion™ 64 CFX CT scanner to be highly dose effi cient
and use innovative software algorithms to allow superior
image quality with low dose scanning techniques.
AUTHOR
Richard Mather, PhDSenior Manager, CT Clinical Science
Toshiba America Medical Systems, Inc.
Subtle tissue differentiation is making CT a more
valuable diagnostic tool.
A publication produced by Toshiba Medical Systems

the noise. (Figure 1) The conventional
solution has always been to increase the
signal. This is typically done by using
a higher mAs setting to produce more
x-rays to pass through the patient or by
using a higher kVp setting to make the
x-rays more penetrating and, therefore,
more likely to pass through the patient
and be collected at the detector.
Unfortunately, improving the signal by
increasing the mA or kVp also increases
the radiation dose to the patient.
Radiation Dose
Exposure to high levels of radiation
causes cancer. This is a fact well
documented and accepted1. What
remains controversial, however,
is whether low levels of ionizing
radiation, such as medical x-rays, are
defi nitively carcinogenic2. Based on
the assumption that there is no lower
threshold for carcinogenesis, the
Department of Health and Human
Services added medical x-rays to its list
of known carcinogens earlier this year3.
The controversy arises from the lack of
enough empirical evidence to support
carcinogenesis at the low levels inherent
in diagnostic imaging4.
CT has become the primary source
of man-made radiation exposure,
responsible for an estimated 67% of
the total effective dose from medical
imaging exams5. Due largely to its
diagnostic versatility, CT use has been
constantly on the rise in the last 10
years6,7 and the number of applications
for which CT is the modality of
choice has exploded. While it is well
recognized that the benefi ts of CT
imaging greatly outweigh the risks,
it is critical to minimize the patient
dose from CT exams in order to keep
the patient risk as low as reasonably
achievable (ALARA)4,5,6.
The ALARA principle forms the
cornerstone of radiation protection8.
This guideline embraces and defi nes
the risk-benefi t balance inherent in
diagnostic imaging. The ALARA
principle is at the heart of the design
vision of Toshiba’s Aquilion scanner.
This vision maximizes image quality
and minimizes patient dose through
effi cient system design and innovative
software algorithms.
Patient Focused Imaging
Minimizing patient dose minimizes
exam related patient risk1,9,10. However,
a fi ne balance must be struck between
dose related risk and image quality
since the diagnostic effi cacy of the
images will be compromised once the
image quality falls below a certain
level. A dose effi cient system is able to
optimally convert patient dose into high
quality images, allowing the diagnostic
effi cacy to be maintained at the lowest
possible level of patient risk.
Low Contrast Detectability
One simple way of measuring the dose
effi ciency of a CT system is to examine its
low contrast detectability (LCD). LCD is
the measure of how well a CT system can
visualize a small object that is very
similar in density to its surrounding
tissue11,12. Figure 2 shows a simulated
CT image with objects of different sizes
and densities. Naturally, as the objects
become smaller and as their CT numbers
get closer to the background, they
become more diffi cult to visualize.
Figure 3 shows the effect of the SNR on
the system’s LCD: as the image noise
increases, the ability to visualize the
small objects becomes compromised.
Even with a relatively low level of image
noise, the smaller objects and those closer
to the background CT number begin
to disappear completely. It is this
dependence on image noise that
makes LCD a good indication of the
system’s ability to deal with low
signal (dose) situations.
July 2 0 05 5
FIGURE 2: Low contrast detectability, noise free. As
the objects get smaller and closer in density to the
background, they become increasingly diffi cult to
visualize.
FIGURE 3: Low contrast detectability with noise. The
amount of image noise has a profound effect on
LCD. The smaller objects with densities close to the
background disappear even with a moderate amount
of noise.
SIGNAL TO NOISE RATIO
Sig
na
lN
ois
e
Original
SNR = 3:1
S1
N
High mAs
SNR = 4:1
S2
N
Reduced Noise
SNR = 4:1
S1
N'
FIGURE 1: Signal to noise ratio can be improved either
by increasing the signal with high mAs and kVp or by
decreasing the noise through effi cient system design
and innovative software.
A publication produced by Toshiba Medical Systems

LCD is reported in terms of three
parameters: object size, contrast,
and dose. For example, the Toshiba
Aquilion’s LCD of 2mm at 0.3% at
26.7 mGy means that a 2mm object
that is only 0.3% different from
the background (this is equal to 3
Hounsfi eld units) can be visualized with
a dose of 26.7 mGy. It is important that
the dose is included in the specifi cation
because that gives us a point of reference
to compare between systems. The
clinical signifi cance of a CT system with
excellent LCD is its ability to visualize
soft plaque in the coronary arteries or
subtle soft tissue tumors. (Figure 4)
Maximizing Signal to
Noise Ratio
To ensure the best possible image quality,
the SNR must be maximized by either
increasing signal, with higher mAs and
kVp, or decreasing noise. Since higher
mAs and kVp results in higher patient dose,
Toshiba designed a system that focuses
on reducing the noise. Here we will focus
on three ways in which this was done:
• Minimize noise in the acquisition system
• Remove noise and artifacts from the
raw data
• Remove noise from the reconstructed
image
Acquisition System
In designing a dose effi cient CT
scanner, the fi rst step is to build an
acquisition system of detectors and
electronics that perform well under
low signal conditions. To create
the Aquilion CT scanner, Toshiba’s
engineers combined highly the effi cient
Quantum Detector with precise and
highly shielded electronics to ensure
the quietest, truest signal possible.
(Figure 5) The Quantum Detectors
have fast response times and high
light output to ensure maximum
signal in low dose acquisitions13. By
shielding the acquisition electronics,
the amount of added electronic noise
is kept to a minimum. In this way, the
maximum signal is preserved for the
reconstruction system.
Raw Data
Even with an optimized detector and
acquisition system, highly attenuating
anatomy such as the shoulders and
the pelvis severely reduce the number
of photons reaching the detectors in
these areas. This localized reduction
in photon count leads to a degradation
in image quality from excess noise
and streak artifacts. Conventionally,
these highly attenuating areas are
imaged using increased mAs and kVp
to overcome the low photon count.
However, since increasing the imaging
technique results in high patient
dose, Toshiba engineers developed an
adaptive three dimensional fi lter that
preferentially corrects the raw data in
areas with low photon count. This
algorithm, known as Boost3D, seeks
out portions of the raw, projection data
where there is a disproportionate loss
in x-ray signal and applies the three
dimensional fi lter locally to reduce the
image noise and streak artifacts.
In areas of normal signal, no
correction is applied and the native
image quality is preserved. Such local,
or adaptive, techniques produce the
optimum results because the fi lter is
applied only where it is needed. Since
this algorithm removes streak artifacts
caused by photon starvation, it can
either be applied to enhance images
using conventional mAs settings,
or to allow low dose imaging with
acceptable image quality by reducing
the scan technique and, thereby, the
patient dose. Figure 6 shows the
image quality that can be achieved
using this algorithm. Figure 6a
6 July 2 0 05
EVOLUTION OF QUANTUM DETECTORS
Z-
Ax
is
A q u i l i o n 3 2 & 6 4A q u i l i o n 8 & 1 6A q u i l i o n 4
30,464 Elements 35,840 Elements 57,344 Elements
0.5 mm x 4 0.5 mm x 16
1 mm x 15 1 mm x 12
1 mm x 151 mm x 12
0.5 mm x 64
FIGURE 5: Progression of 0.5mm slices in Quantum detectors from Aquilion 4 to Aquilion 64 CFX.
P a t i e n t F o c u s e d I m a g i n g
FIGURE 4: 3D Volume rendered image of the left side
of the heart. Vessel probe is used to segment the
LAD and show the vessel in three orthogonal planes.
Seen here is complex, mixed calcifi ed and soft plaque
in the proximal portion of the vessel with extensive
remodeling throughout the vessel.
A publication produced by Toshiba Medical Systems

demonstrates cardiac and abdominal
images of a large patient using a
relatively low scan technique. The
images exhibit typical structured
noise and streak artifacts resulting
from the low photon count. However,
when the Boost3D algorithm is applied,
Figure 6b shows the resulting image
quality: the image noise is greatly
reduced and the streak artifacts
disappear. By reducing the noise and
mitigating the effects of low dose
scanning, adaptive techniques such
as Boost3D are an invaluable asset
in Toshiba’s commitment to patient
focused imaging.
Image Data
Once the detectors and acquisition
systems have been optimized and the
streaks and excess noise have been
removed from localized areas of
high attenuation, we must turn our
attention to minimizing the general
noise that is left in the reconstructed
image. To tackle this problem,
Toshiba engineers developed a
unique algorithm called Quantum
Denoising Software (QDS). QDS is
an adaptive noise reduction fi lter that
works on reconstructed image data
by preferentially smoothing areas of
uniform density while preserving the
edge information of the image14. The
algorithm uses locally sampled edge
information within the image to blend
together variable strength smoothing
and sharpening fi lters. In areas of
uniform density with few edges, the
algorithm smoothes and reduces the
noise. Near tissue boundaries and
other complex structures where there
are many edges, the algorithm blends
in more of the sharpening fi lter to
enhance the image.
QDS works in both two and
three dimensions and can drastically
reduce image noise allowing a
corresponding savings in patient dose.
Figure 7 illustrates the substantial
dose savings possible using QDS.
Figure 7a shows the relative noise in
the liver of a patient using a standard
scan technique. 7b demonstrates
the increase in image noise as the
mAs is dropped by 47%. Finally, 7c
highlights the ability of the QDS to
reduce the noise in the liver to below
that of the original, higher dose image.
Techniques of this sort are
most useful in reducing patient dose
when they are integrated into the
scanner’s automatic exposure control
mechanism. Toshiba’s SUREExposure
software adjusts the mAs technique
July 2 0 05 7
FIGURE 6: Images of a 300 lb patient with 0.5 mm slices, 120 kV, 140 mAs without (a)
and with (b) the Boost3D algorithm.
150mAs 80mAs 80mAs (w/QDS)
Std. Dev: 32.7 Std. Dev: 47.8 Std. Dev: 31.6
FIGURE 7: Effect of QDS. Noise levels with (a) standard technique, (b) low dose technique, and (c) low dose
technique with QDS.
P a t i e n t F o c u s e d I m a g i n g
A B C
A
A
B
B
A publication produced by Toshiba Medical Systems

based on the expected noise reduction
from the adaptive fi lter. In this way,
patient dose reduction is built right
into the Aquilion’s console software.
Results From an
Optimal System
Figure 8 shows the image quality that
is achievable from a well designed
system. 8a is an excellent example
of the fi ne detail that is achievable
in arbitrary imaging planes with
0.35 mm isotropic resolution in this
Brain AVM case. 8b illustrates the
routine high quality volume imaging
in this renal angiogram. Thin, 0.5
mm slices allow the anatomy to be
viewed in a volume rendered format
with the arteries visualized in three
orthogonal views. Finally, 8c and 8d
demonstrate the need for good low
contrast detectability, fast temporal
resolution, and fi ne spatial resolution
required to visualize in-stent restenosis
in 8c, and soft plaque in 8d, when
imaging the coronary arteries. Thin,
0.5 mm slices and advanced software
algorithms such as Boost3D facilitate
the clear visualization inside the RCA
stent with no blooming artifact. The
fi ne, isotropic resolution and superior
low contrast detectability allow the
excellent delineation of the soft plaque
restenosis beginning to form inside
the stent. This same combination of
thin slices, isotropic resolution, and
LCD allows the clear visualization of
subtle soft plaques and mixed hard
and soft plaques with minimal calcium
blooming. This sort of high quality
imaging with low x-ray doses is only
possible with a well designed, dose
effi cient system.
Conclusion
CT is a versatile and valuable imaging
modality in the medical industry.
Consequently, its use has exponentially
increased since its inception. However,
since there is a quantifi able risk associated
with the radiation dose imparted by a
CT scan, it is critical to keep patient dose
as low as reasonably achievable while
maintaining the image quality that is
essential to the utility of the device.
In our commitment to patient focused
imaging, Toshiba has developed the
Aquilion 64 CFX from the ground up to
be a comprehensive multislice CT imaging
device. Through highly effi cient system
design and innovative reconstruction
software, the Aquilion is the ideal low
dose CT scanner. The Aquilion’s industry
leading slice thickness and low contrast
resolution give it superior image quality
with exceptional dose effi ciency. CA
8 July 2 0 05
P a t i e n t F o c u s e d I m a g i n g
FIGURE 8a: Sagittal image shows fi ne
detail with isotropic resolution in Circle
of Willis CTA in this AVM case.
FIGURE 8b: 3D volume rendered and
orthogonal views of renal CT angiogram.
FIGURE 8c: Images demonstrate the
fi ne detail of RCA stent with clear
evidence of in-stent restenosis and
soft plaque.
FIGURE 8d: Curved planar image of the
LAD highlights importance of low contrast
detectability in the imaging of subtle soft
and mixed plaques.
References1. Brenner DJ, Elliston CD, 2004, Radiation Risks potentially associated with low-dose CT screening of adult smokers, Radiology, 231(2): 440-445.
2. Cohen BL. 2002, Cancer risk from low-level radiation. Am J Roentgenol, 179(5):1137-43.
3. Department of Health and Human Services, 2005, 11th Report on Carcinogens.
4. Brant-Zawadzki M. 2005, Diagnostic Radiology: Major Weapon in Patient Care or Weapon of Mass Destruction?, J Am Coll Radiol. 2(4):301-303.
5. Mettler FA Jr, Wiest PW, Locken JA, Kelsey CA. 2000, CT scanning: patterns of use and dose. J Radiol Prot., 20(4):353-9.
6. Shrimpton P C, Hart D, Hiller M C, Wall B F and Faulkner K 1991 Survey of CT practice in the United Kingdom, Part 1: Aspects of examination frequency and quality assurance. National Radiological
Protection Board Report p.248 (Chilton: NRPB).
7. Shrimpton PC.,Edyvean S.1998 CT scanner dosimetry Br. J. Radiol. 71(841): 1-3.
8. International Commission on Radiological Protection. 1990 Recommendations of the International Commission on Radiological Protection. Publication 60, International Commission on Radiological
Protection. Oxford, England: Pergamon, 1991.
9. Ron, E. 2003 Cancer risks from medical radiation, Health Phys. 5(1):47-59.
10. Nuclear Regulatory Commission. 1990, Health effects of exposure to low levels of ionizing radiation: BEIR V. Washington, DC: National Academy Press.
11. SeeramE. 2001, Computed Tomography: Physical Principles, Clinical Applications, and Quality Control. Second Edition. Saunders.
12. Curry TS, Dowdey JE, Murry RC. 1990, Christensen’s Physics of Diagnostic Radiology. Lea and Febiger.
13. Okumura M, Tamatani M, Igarishi K. 2002, Development of X-ray Detector for Multi-slice CT with 0.5 mm. Slice Thickness and 0.5 Second Revolution. Proceedings of the SPIE Vol. 4682.
14. Okumura M, Toyoshima N, Katada K, Sasaki M, 2003, Performance Evaluation for Image Filters Used for CT Images, Abstract of RSNA, p720.
A publication produced by Toshiba Medical Systems

July 2 0 05 9
Chest Pain Triage
PROFILE: ECG gated chest study performed in 18 seconds, is the ideal examination for the triage of the patient that presents with chest
pain. The 0.5mm x 64 volumetric data set can be used to evaluate the aorta for dissection, the coronary arteries for stenosis and/or
soft plaque or the pulmonary tree for pulmonary embolus. The lungs can also be evaluated for interstitial lung disease or nodules.
SCAN PARAMETERS: 120kV, 0.4 second rotation, pitch 0.25, 360mA, 0.5mm x 64
Aquilion 64 Case Study
Image 1: Coronal MIP of the lungs.
Image 3: 3D volume rendered views of the
heart and main coronary artery vessels, the left
anterior descending artery coming off the left
main and its fi rst diagonal branch can clearly be
seen, as well as the circumfl ex.
Image 4: Curved planar image of the left main,
LAD and RCA helps in evaluating the patency
of the vessel, visualization of soft plaque and
vessel wall remodeling.
Image 5: CPR image of the ascending and
descending aorta helps rule out aortic dissection
or aneurysm.
Courtesy of Beth Israel Deaconess, Boston, MA.
Image 2: 3D volume rendering of heart, aortic arch and pulmonary trunk.
A publication produced by Toshiba Medical Systems

10 July 2 0 05
A DedicatedCardiovascular
CT Center
Setting It Up
A cardiovascular CT practice requires more infrastructure and personnel than
a general imaging center. MDR-CC has assembled a cardiovascular team that
includes a nurse experienced in administering blockers and monitoring cardiac
patients, two highly trained technologists who run the CT scanner and 3D post
processing lab, as well as dedicated cardiac radiologist.
Installation of a 64 detector CT system has also necessitated upgrading
our network in order to process, manipulate, and store the thousands of images
produced in each examination. The upgrade has included a T1 internet line,
cardiac PACS, dedicated advanced image visualization workstations, and a
system with web browser capability to allow referring physicians to directly
view images.
Optimizing the Cardiac CTA Examination
Three factors in the image acquisition phase of a coronary CT angiogram have the
greatest impact on image quality:
1- In patient preparation for the coronary CTA, vigorous beta blocking is used to
slow and steady the heart rate giving us the best chance of achieving a study with
On November 1st 2004, Manhattan Diagnostic Radiology opened MDR-Cardiovascular
Center (MDR-CC), dedicated to cardiovascular CT and MRI. For the fi rst fi ve months,
800 CT angiograms were performed using a Siemens 16 detector system. In mid-March,
MDR-CC installed a Toshiba Aquilion™ 64 CFX; the fi rst 64 detector CT system in
Manhattan. Since then we have performed approximately 400 coronary CTAs. This
article offers a few useful tips based upon our experience in moving from a 16 to a 64
detector CT in a busy outpatient imaging center.
AUTHOR
Jeffrey P. Goldman, MDDirector of Cardiovascular CT and MRI
Manhattan Diagnostic Radiology – Cardiovascular Center
Clinical.
Experience.
A publication produced by Toshiba Medical Systems

the least amount of motion artifact. In our practice, patients
receive oral beta blockers the night before and the morning of
the study, and IV beta blockers during the examination.
2- During the examination optimization of contrast timing
is important in order to produce a tight contrast bolus
in the coronary arteries, for the greatest opacifi cation of
the coronary arteries, and the best contrast to noise ratio
between the open vessel lumen and soft plaque. Contrast
should be bright in the left ventricle and hardly visible in
the right ventricle (Figure 2);
3- After the examination, images of the coronary arteries
need to be reconstructed at the phase in the cardiac cycle
(different points in the R-R interval) during which there
is the least amount of coronary motion. This requires
the technologist (and or physician) to examine the images
and, if necessary, produce additional datasets at different
percents of the R-R interval (Figure 3). Sometimes the
right and left coronary arteries are best seen at different
times within the R-R interval. If the patient has multiple
premature ventricular contractions (PVCs), ECG editing
can be performed to remove images acquired during these
PVCs from the reconstructed images (Figure 4).
Even with the best efforts on any scanner, the patient
may move or the heart rate may vary greatly during the
exam, causing signifi cant motion artifact. It’s important
for the technologist to examine the images before the
July 2 0 05 11
3D volume rendered reconstructions at 70% of R-R interval, Study acquired in 10 seconds using 120 KV 440 mA.
FIGURE 1a: 3D VR image of LAD. FIGURE 1b: 3D VR image of RCA.
SUREStart facilitates good contrast timing which is essential for getting good Coronary Artery CTAs.
FIGURE 2a: Axial image demonstrating poor contrast timing with CM concentration greater on the right side of the heart than the left.
FIGURE 2b: Axial image demonstrating perfect contrast bolus timing. Notice the high conspicuity of the RCA when the correct contrast timing is used (red arrow).
A B
A publication produced by Toshiba Medical Systems
A B

patient gets off the table to determine if the exam was
adequate. If not adequate, the physician monitoring
the examination must be alerted and decide whether to
repeat the study or to let the patient go, keeping in mind
the additional radiation and contrast that this will give
to the patient. The number of inadequate cases can be
minimized by paying attention to optimization of the
patient’s heart rate, timing of the contrast bolus and
reconstructing the images at the optimal R-R interval.
Our goal is to not have to recall any patients for additional
images. Our recall rate is under 2%.
Image Interpretation
A poor image is likely to produce a less accurate reading,
no matter how expert the reader. Image quality is the most
important factor affecting image interpretation because
vessels of varying sizes must be visualized from multiple
angles. Also of key importance is the need for experience
in interpretation of coronary CTA exams. In cases with
complex plaque, the lesion must be viewed in several
orthogonal planes. At MDR-CC we have found the “on
face” view of the vessel (perpendicular to the long axis) to
be the most useful in quantifying the percent of stenosis.
This is especially true in the coronary arteries where positive
remodeling occurs. In positive remodeling, the vessel wall
can expand 50% or more before causing narrowing of the
vessel lumen. (Figure 5) The “on face” view of a vessel,
being an oblique reformat, will be distorted the further the
image acquisition is from isotropic.
Workfl ow
Cardiac datasets can get extremely large due to the need
to reconstruct multiple phases. Therefore, as the number
of cardiac cases performed per day increases, the need
for effi cient workfl ow becomes increasingly important.
MDR-CC has developed a 3D lab to improve case
throughput. We have found the Vital Images workstation
to be very user friendly, allowing the physician and
technologist to quickly post process images. A unique
feature of this workstation is the ability to easily export
images into reports.
Reporting
Our cardiac CT reports include a coronary calcium score,
a vessel by vessel analysis of soft plaque and percentage
of stenosis, evaluation of the visualized lung fi elds, and a
recommendation based upon all the fi ndings. Currently,
there is no similar formal recommended reporting system
for mammography used by BIRADS. In our practice, we
divide patient fi ndings into four categories to help with
therapeutic decision making:
1- For mild atherosclerotic disease, no obstructive stenosis
or signifi cant non-calcifi ed plaque, continued medical
management is recommended;
2- For signifi cant non-calcifi ed plaque and no obstructive
stenosis, aggressive medical management and follow-up is
recommended;
3- For borderline obstructive lesion (50-70% stenosis),
correlation with stress test is recommended;
4- For high-grade stenosis (>70%) suspected, further
12 July 2 0 05
A D e d i c a t e d C a r d i o v a s c u l a r C T C e n t e r
FIGURE 3a: Axial image of coronary CTA reconstructed at 70% of the R-R interval.
FIGURE 3b: The same axial slice reconstructed at 541 ms. Notice the decreased
blurring in the image when the advanced editor is used.
FIGURE 4a: Axial slice in a patient who had multiple PVCs during the examination
resulting in blurring of the RCA (red arrow).
FIGURE 4b: Same slice with the images acquired during the examination where
the Premature Ventricular Contractions (PVCs) have been removed.
FIGURE 5a: Curved reformat through the LAD. The red arrow depicts an eccentric
soft plaque in the vessel.
FIGURE 5b: A cross sectional view at the level of the soft plaque in the LAD. The
yellow arrow points to the outer wall of the vessel demarked by the soft plaque.
The soft plaque has expanded the vessel wall: an example of positive remodeling.
A publication produced by Toshiba Medical Systems
A B
A B
A B

evaluation with a stress test or x-ray angiogram is
recommended. (Figure 6)
In our practice, the 3D lab produces a standard set of
images displaying the RCA, LAD and circumfl ex arteries
that are placed at the end of the report.
The Virtual Reading Room
Cardiac CT poses this challenge: What images should be
sent to referring physicians? The most common practice
is to send a CD with the axial images. Yet, this is not
suffi cient since, as we have said, interpretation of complex
plaque in a curving vessel requires seeing the vessel in
multiple orthogonal planes. We have recently installed a
Vital Connect thin client server (Vital Images) that allows
referring physicians to remotely access and manipulate
images of patient examinations over the internet. The
Vital Connect server also has built-in videoconferencing
capabilities. Videoconferencing and remote access
capabilities are very important in increasing collaboration
between cardiology and radiology, and offer the potential
to create a “virtual reading room.”
Impact of the Toshiba Aquilion 64 CFX on
Coronary CTA in our Clinical Practice
Dealing with artifacts is the greatest challenge for
coronary CTA. The most common and diffi cult artifacts
July 2 0 05 13
A D e d i c a t e d C a r d i o v a s c u l a r C T C e n t e r
FIGURE 6a: Minimal wall thickening in the RCA.
FIGURE 6b: Focal soft plaque causing less than 50% narrowing. Aggressive
medical management and follow-up were recommended.
FIGURE 6c: A 50-60% stenosis. Correlation with thallium stress test was
recommended.
FIGURE 6d: Complex mixed soft and calcifi ed plaque causing a high grade stenosis.
A publication produced by Toshiba Medical Systems
A
B
C
D

to deal with are:
1- Motion artifact;
2- Blooming artifact from dense calcifi cations;
3- Inconspicuous vessel and plaque borders especially on
the “on face” or cross-sectional view. The greatest impact
of our 64 detector CT has been decreasing image artifact,
resulting in an increased confi dence in image interpretation.
(Figure 7)
Motion artifact can be caused by imaging at an elevated
heart rate, imaging during a change in the patients heart
rate, imaging an irregular heart rate, or reconstructing
the images at an R-R interval where the coronary arteries
are moving. Using the 16 detector scanner, we found that
motion accompanied heart rates above 60 bpm. With
the 64 detector scanner, we have
obtained good studies in patients
with heart rates in the 80s. This
is due to the shorter breath hold
times (5-10 seconds) required of the
Toshiba 64 detector CT scanner, as
well as the utilization of the adaptive
multi-segment SURECardio algorithm.
The most problematic studies are in
patients whose heart rate changes
drastically during scanning. This can
even occur in the short 5-10 second
breath hold.
Blooming artifact occurs in densely calcifi ed plaque,
which can cause overestimation of stenosis and limits
our ability to evaluate patients with more advanced,
longer standing disease. With our 16 detector system, we
were unable to give a complete reading on all coronary
segments in patients with calcium scores greater than 400.
(Figure 8) With the 64 detector system, we have found a
decrease in blooming artifact from calcifi ed plaque. The
calcifi ed plaque can often be seen as peripheral and the
vessel lumen can still be evaluated. We have been able to
evaluate several patients with a calcium score over 2000.
(Figure 9) We believe the improved evaluation of patients
with calcifi ed plaque on our Toshiba 64 detector CT is
due to thinner detector collimation (0.5mm) causing less
partial volume artifact as well as faster scan times (10
seconds on average) which decreases motion and blurring.
Additionally we have found that, compared to the 16
detector CT, we can trace longer segments of the coronary
tree using the 64 detector CT system.
Greatest Clinical Utility of Cardiac CT in an
outpatient community practice
Working together, radiologists and cardiologists are
exploring the role of coronary 64
detector CTA. In our practice we
have found the following clinical
indications to be very useful for
coronary CTA:
1- Evaluation of symptomatic patients
who have previously undergone
coronary artery bypass surgery.
With the 16 detector CT system,
evaluation of CABG took between
30-35 seconds while the 64 detector
CT system takes approximately
16 seconds. With the 64 detector
CT system, we not only obtain beautiful images of both
internal mammary and saphenous venous bypass grafts,
but by decreasing the length of the scan we also obtain
images good enough to evaluate the native coronary
vasculature, which is important in therapeutic decision
making. (Figure 11)
2- Increasingly our referring physicians are using coronary
CTA as the arbiter in cases where the results of a stress
thallium test do not correlate with the clinical fi ndings.
(Figure 12)
3- CTA is also very useful for risk stratifi cation of
asymptomatic patients at high risk for CAD. By directly
visualizing non-calcifi ed plaque, we can identify patients
who do not have an obstructive stenosis but who may
need more aggressive medical management and follow up.
(Figure 13)
4- The high negative predictive value of coronary CTA is
useful in patients with atypical chest pain.
5- Coronary CTA has proven to be very useful in
identifying patients with anomalous coronary arteries and
myocardial bridging. (Figures 14, 15)
14 July 2 0 05
A D e d i c a t e d C a r d i o v a s c u l a r C T C e n t e r
CTA is useful
for risk stratifi cation
of asymptomatic
patients at high risk
for CAD
FIGURES 7a and b: 3D volume rendered views of the same patient with a heart
rate of 77 bpm scanned on the (a) 16 and (b) 64 detector systems. Notice the
detail of the stents in (b) where all the major vessels are stented. Notice the
runoff of the Dx, LAD, and OM (red arrows) which can only be visualized on the
64 detector CT system.
A publication produced by Toshiba Medical Systems
A B

July 2 0 05 15
A D e d i c a t e d C a r d i o v a s c u l a r C T C e n t e r
FIGURES 8a and b: The same patient imaged on a 16 detector CT system. Imaging
of the coronary arteries and thoracic aorta (for small ascending aortic aneurysm)
required two injections on the 16 slice detector system. A major advantage
of the 64 detector confi guration is that we now perform this in one 18 second
examination.
FIGURES 8c and d: The same patient imaged on a 64 detector CT system. Notice
we are able to image from the aorta through the heart in 15 seconds with only a
single injection.
FIGURE 9a: The calcium score of the patient in fi gure
8 was 550. On the CT detector study an obstructive
stenosis in the LAD could not be ruled out due to the
dense calcifi cations.
FIGURE 9b: Follow-up study performed on the 64
detector CT system. The LAD is confi rmed of having
an obstructive (>70%) stenosis.
FIGURE 9c: Curved planar reconstruction of the LAD of
a 64-year-old male with a calcium score of 2363. The
64 detector CT image clearly shows less blooming
artifact making it possible to confi rm a diagnosis.
A publication produced by Toshiba Medical Systems
A
B
C
D

FIGURE 12: Patient with a normal stress test, showing high grade stenosis of the
left main, LAD and RCA as seen in these curved planar views is likely causing
balanced ischemia.
16 July 2 0 05
A D e d i c a t e d C a r d i o v a s c u l a r C T C e n t e r
FIGURES 10a and b: Curved planar reconstructed images show increased length of
the RCA and LAD as traced using the 64 detector CT system.
Coronary artery bypass grafts and native vessels.
FIGURE 11a: 3D Volume rendered images show two saphenous venous
bypass grafts.
FIGURE 11b: Axial oblique view of soft plaque in the LAD (red arrow) and second
diagonal of the LAD (green arrow) which were subsequently stented.
FIGURE 13: 39-year-old-male with a calcium score of 0 but the coronary artery
CT scan shows a signifi cant soft plaque in the LAD. This changes treatment
and aggressive medical management was recommended. Soft plaque is well
demonstrated on the axial and curved planar image.
LAD STENOSIS
LT MAIN STENOSIS
A publication produced by Toshiba Medical Systems
A
B
C
D

Radiation – How Much is Not Too Much?
This is a very sensitive issue and a scientifi cally diffi cult
question to answer. There needs to be a standard for
measuring radiation dose per scan. While it is very
diffi cult to determine what radiation dose is too high for
a coronary CTA exam, it seems prudent to compare CT
coronary angiography with X-ray coronary angiography.
While increasing the mAs may improve image quality, we
must consider whether there should be a limit to the total
radiation dose per patient. There are several strategies to
lower the radiation dose:
1- ECG modulation can be used to employ a lower
radiation dose during the systolic phase of the cardiac
cycle; though there is a limitation of heart rate for which
this technique can be utilized.
2- Toshiba also offers a unique Boost3D reconstruction
technique which can be used for all heart rates. Boost3D
is especially useful in reducing noise in larger patients. In
this way, image conspicuity can be increased at a lower
radiation dose. (Figure 16)
Even with these innovative radiation reduction
techniques, guidelines may also need to take into account
differences in patient age and whether or not other tests
such as carotid or peripheral CTA should be performed at
the same time.
Coronary CT Angiography
Where are we Today?
With the advent of the 64 detector CT, coronary CTA
is quickly becoming a useful and important tool in the
evaluation of patients with CAD. Still, as good as it is,
future technical improvements are sure to make it even
better. On the horizon are even higher temporal resolution
and shorter scan times. Ideally, we would like to obtain
all images in a single heart beat, so there would be no
misregistration of images obtained at different points in
the cardiac cycle. Each major manufacturer is working on
the next generation scanner. Toshiba* is developing a 256
detector row scanner and early scans of human patients
have shown promising results.
As the 64 detector CT has transformed coronary
CT from an adjunct test to a robust clinical tool, we look
forward to the next generation CT to expand the clinical
role of coronary CTA by further improving the accuracy of
coronary stenosis quantifi cation, providing a quantitative
measurement of soft plaque burden, and to perhaps even
measure myocardial perfusion. CA
*In cooperation with NEDO, Japan (New Energy & Industrial
Technology Development Organization)
FIGURE 14: Anomalous coronary artery discovered incidentally. The 64 detector confi g-
uration is a very good tool for evaluation of the anatomy and pre-surgery planning.
FIGURE 15: Myocardial bridging.
FIGURE 16: With and without Boost3D.
July 2 0 05 17
A D e d i c a t e d C a r d i o v a s c u l a r C T C e n t e r
A publication produced by Toshiba Medical Systems
18 July 2 0 05
CT Risk Minimizedby Optimal System Design
CT Radiation Dose
Medical imaging is the primary source
of man-made radiation exposure to
the general public1. However, there is a
wide range in the amount of radiation
delivered to the patient depending on
the exam and the imaging modality.
For example, the effective dose from a
chest CT is equivalent to approximately
500 chest x-rays or 100 mammograms2.
The amount of radiation
exposure from a CT exam is largely
underappreciated by the radiological
community and almost completely
unknown by the general public3.
Not only does CT represent a large
fraction of the collective medical
radiation exposure, but its use has
been steadily on the rise since its
introduction4,5. In the US it has been
estimated that CT now represents over
two thirds of the medical dose6.
CT Radiation Risks
There is a fi nite, quantifi able risk of
death from cancer from the radiation
dose of a single CT scan1. The risk of
death from cancer from a single CT
scan ranges from 1 in 500 to 1 in 2500
depending on the age of the patient7,8.
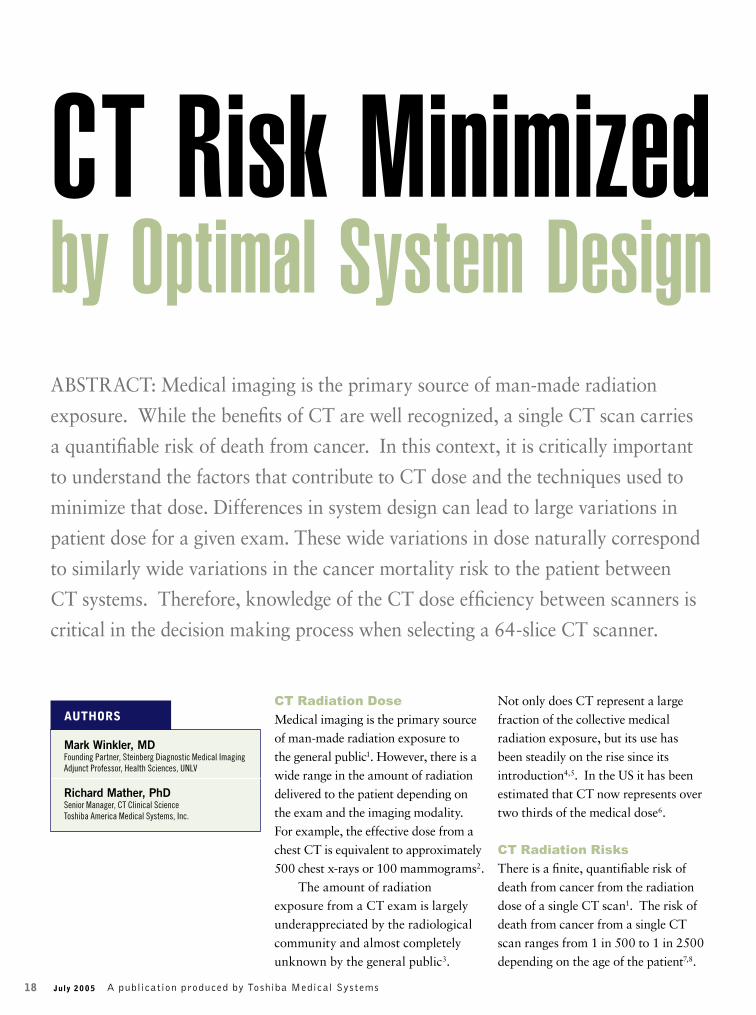
ABSTRACT: Medical imaging is the primary source of man-made radiation
exposure. While the benefi ts of CT are well recognized, a single CT scan carries
a quantifi able risk of death from cancer. In this context, it is critically important
to understand the factors that contribute to CT dose and the techniques used to
minimize that dose. Differences in system design can lead to large variations in
patient dose for a given exam. These wide variations in dose naturally correspond
to similarly wide variations in the cancer mortality risk to the patient between
CT systems. Therefore, knowledge of the CT dose effi ciency between scanners is
critical in the decision making process when selecting a 64-slice CT scanner.
AUTHORS
Mark Winkler, MDFounding Partner, Steinberg Diagnostic Medical Imaging
Adjunct Professor, Health Sciences, UNLV
Richard Mather, PhDSenior Manager, CT Clinical Science
Toshiba America Medical Systems, Inc.
A publication produced by Toshiba Medical Systems

A child under the age of 15 is far more
sensitive to radiation, has a longer life
expectancy, and is at the greatest risk.
For a child under the age of 15, the risk of
death from cancer from a single CT exam
is about 1 in 5008. For a 45 year old
adult, the risk of death from cancer from
a single CT exam is about 1 in 12507.
These estimates are based on the
most widely accepted model of risk
from radiation exposure9,10,11. This
linear no-threshold model uses atomic
bomb survivor data and extrapolates
from their high doses down to the
levels of diagnostic imaging. While this
model is conservative and not yet either
proven or disproven, it is universally
accepted as the most appropriate way
to assess radiation risk in the absence of
more defi nitive data. This is the model
used by the FDA in quantifying risk
from medical imaging exams.
These data have been widely
published in the radiology and medical
physics literature1,3,7,8,9,10,11, but have
been largely ignored by the medical
community. In a recent survey, only
3% of patients and 9% of referring
physicians understood there to be an
increased risk of cancer mortality as a
result of a single CT exam3.
It is well recognized that the
benefi ts of CT greatly outweigh the
risks involved12. However there is
controversy surrounding the overuse
of CT, particularly with respect to
self-referral and screening of non-high
risk individuals13. In any event, to
keep patient risk as low as reasonably
achievable, it is critically important to
understand the factors that contribute
to CT dose and the techniques used to
minimize that dose.
Factors Affecting Dose
Factors affecting CT dose include:
mAs, pitch, kVp, and the minimization
of overscanning.
mAs
Dose is directly proportional to mAs14.
The mAs for an exam should be kept as
low as reasonably achievable to yield a
diagnostic image.
It should be kept in mind that
reduction of mAs will reduce image
quality along with dose, so a careful
balance is needed to ensure that the
necessary diagnostic information is
obtained. To maintain image quality,
the mAs should be adjusted to patient
size. This can easily be accomplished
by utilizing multiple mAs settings
which are adjusted according to patient
size. As a general rule, mAs should
be doubled or halved for every 8-9cm
diameter change in abdominal or pelvic
imaging, and 12-13cm diameter change
for chest imaging15.
Pitch
Pitch is the ratio of table movement to
active detector element size for a single
gantry rotation. Pitch is inversely related
to dose16. Increasing the pitch will
diminish the dose, while diminishing the
pitch will increase the dose.
With single slice CT, pitch was
utilized to improve coverage. However,
coverage is no longer an issue with
multi-slice CT (MSCT), particularly
when combined with advances in
tube capacity, tube cooling, and data
handling available with newer scanners.
Therefore, with multi-detector CT
pitch may be used to modulate dose
rather than coverage.
kVp
Dose is proportional to the square
of kVp16,17. A standard tube potential
of 120 kVp is usually chosen for
the optimum balance of contrast,
penetration and dose. However, certain
circumstances warrant changing the
kVp to minimize dose or optimize
image quality. Low settings of 80 or
100 kVp may be utilized for pediatric
imaging to minimize dose, although
this is partially offset by the increase
July 2 0 05 19
Fine detail in a carotid angiography exam. Excellent temporal and spatial resolution in a gated
cardiac exam.
Exquisite detail in a renal CTA.
A publication produced by Toshiba Medical Systems

in mAs required to maintain image
quality. High kVp settings of 135-140
can be useful to increase penetration of
objects with very high attenuation such
as when imaging orthopedic hardware,
the shoulders, or very large patients.
Overscanning
Overscanning should be eliminated to
minimize patient dose. Multiplanar
examinations are no longer necessary
with MSCT. The isotropic resolution
achievable by MSCT means that the
images may be reformatted into any
plane with no loss of resolution. For
example, imaging of the sinuses,
orbits, temporal bones and small joints
is no longer accomplished with both
axial and direct coronal imaging, but
solely with axial thin slice scanning
and multiplanar reformations.
Multiphasic examinations should
also be kept to a minimum. The lack
of tube and data handling constraints
on modern CT scanners has led to
the over utilization of multiphasic
examinations with signifi cant
increases in patient radiation exposure.
The thinner slices available with
multi-detector CT obviate the need
for multiple images through the same
anatomic region. For example, while
a routine lung study may be displayed
at 5-7mm image thickness, the 0.5mm
acquired slices are available for review
to defi nitively determine if a small
nodule contains calcifi cation which
may not be detectable on the thicker
images. This may also be apparent on
the multiplanar reformations (MPRs)
which are now routinely performed.
Also, the length of the anatomy
examined should be kept to a
minimum. There is a tendency to
scan a greater length than needed
since there are no system limitations
on coverage. Excessive scan length
results in unnecessary radiation and
unnecessary risk of cancer mortality to
the patient.
System Design
Multiple elements of a CT system’s
design will impact the scanner’s dose
effi ciency18,19,20,21. These elements include
both hardware and software features.
Hardware
Radiation dose is inversely related
to the effi ciency of the detector17. A
system’s low contrast detectability
(LCD) is a good indication of
its overall effi ciency. LCD is a
measurement of how well a system can
visualize small objects that are similar
in density to their surrounding tissue
for a given dose22. Differences in the
dose required to visualize a small
lesion can vary between systems by as
much as 73%. Figure 1 demonstrates
the higher doses required by less
effi cient systems.
A major contributor to a system’s
dose effi ciency is the detector system.
Figure 2 demonstrates the differences
in detector effi ciency between vendors
which can vary by as much as 28%.
Detector effi ciency is related to the
light output of the detector material.
Higher light output means that smaller
signals will be detectable and results in
better low contrast detectability (LCD).
Detectors also vary widely in residual
20 July 2 0 05
DETECTOR SENSITIVITY
140%
120%
100%
80%
60%
40%
20%
0%
De
te
ct
or
Se
ns
itiv
ity
M a n u f a c t u r e r
Toshiba A B C
DOSE REQUIRED TO DETECT SMALL LESIONS
180%
160%
140%
120%
100%
80%
60%
40%
20%
0%
Re
lat
ive
Do
se
M a n u f a c t u r e r
Toshiba A B C
C T R i s k M i n i m i z e d b y O p t i m a l S y s t e m D e s i g n
There is a fi nite,
quantifi able risk
of... cancer from the
radiation dose of a
single CT Scan1
FIGURE 1: More effi cient detectors require less radiation dose. FIGURE 2: Detector effi ciency varies as much as 28%.
A publication produced by Toshiba Medical Systems

afterglow (up to 600-fold) and decay
time (up to 300 fold)19.
Shortcomings in detector
effi ciency can often be overcome
simply by increasing the dose for an
examination. However, the use of
higher doses increases the cancer
mortality risk to the patient from a
single CT scan.
Software
Advanced software features of a
system can be used to minimize the
dose of a CT scan. Conventionally,
this has been accomplished by
automatically modulating the mA
during the exam. This can be done
along the length of the patient by
decreasing the mA through smaller
anatomy such as the neck or less dense
anatomy such as the chest. However,
as detector coverage becomes larger,
as with the 64-slice systems, this kind
of modulation becomes less effective
because such a wide swath anatomy is
being scanned per rotation. Similarly,
mA can be modulated within an
individual rotation. For example,
through the shoulders, the system
needs more mA right to left than
anterior to posterior21.
With CT coronary angiography,
dose can be modulated during each
heart beat with EKG monitoring.
Since we are most interested in the
diastolic phase of the heart cycle
where there is less cardiac motion
artifact, the mA can be lowered a
great deal during the systolic phase
without compromising image quality.
Thus, conventional mA is used during
diastole to obtain high quality images
while lower mA is used during systole
when image quality is less important.
EKG modulation can lead to dose
reductions as high as 50%.
Even more advanced software
features reduce the overall image noise
allowing a profound reduction in the
mAs and therefore the dose to the
patient. Two new software techniques
have recently been released to reduce
the overall image noise and allow for
even lower dose scanning. Boost3D is a
novel approach to processing the raw
data to reduce the noise caused by low
dose techniques. Quantum Denoising
Software (QDS) is a unique approach
to processing the reconstructed data
further reducing noise caused by low
dose techniques. These techniques
have an expected dose reduction of
up to 40%.
Thin Slice Dose Effi ciency
The change in technology from
single slice CT to MSCT increased
the awareness of the inherent dose
increase from thin slice scanning. With
4-slice scanners, the dose effi ciency
diminished with very thin slices
because the penumbra - the unused
portion of the x-ray beam that lands
outside the active portion of the
detector array - becomes a much larger
fraction of the total dose profi le with
very thin slices, thus increasing the
dose. With 8 and 16 slice systems this
effect is reduced, and with 64-slice
systems, it disappears completely as
the entire detector array is used for the
thinnest slices (Figure 3).
July 2 0 05 21
DOSE VS. SLICE THICKNESS
250%
200%
150%
100%
50%
0%
Re
lat
ive
Do
se
S l i c e T h i c k n e s s ( m m )
8 5 4 3 2 1 0.5
4 Slice 16 Slice 64 Slice
C T R i s k M i n i m i z e d b y O p t i m a l S y s t e m D e s i g n
A system’s low contrast
detectability is a good
indication of its overall
effi ciency
FIGURE 3: As the number of slices increase, radiation effi ciency increases
due to more effective use of the entire beam.
A publication produced by Toshiba Medical Systems

CT Dose Index
CT Dose Index (CTDI), the
conventional method of reporting
scanner dose, is not useful in
comparing different CT systems.
CTDI is heavily dependent on the
scanner’s fi ltration. A scanner
with heavy fi ltration may have a
low CTDI, but need high mAs
for adequate image quality.
Furthermore, CTDI does not account
for differences in detector effi ciency,
low contrast detectability, and
reconstruction software which can
play major roles in determining the
scanner’s dose effi ciency. For these
reasons, a scanner with a low CTDI
may actually require a higher patient
dose for a given study.
Only when CTDI is combined
with the actual scan techniques
used in specifi c examinations does
it provide useful information about
the radiation dose delivered to the
patient23. It is critical to examine
the actual scan techniques used on
different manufacturers’ systems to
compare the relative patient doses for
a given examination. For example,
for CT carotid angiography, effective
mAs vary from about 181 for one
vendor to 300 for another. When
adjusted for CTDI, this represents a
29% difference in the effective patient
dose between these systems.
Dose Comparison
The differences in dose effi ciency
between multi-detector CT scanners
have been well recognized. An
independent German study
demonstrated that the actual patient
radiation exposure with routine
clinical imaging for 14 common
examinations varied signifi cantly
between vendors24. This data is
displayed in Figure 4 and highlights
the differences in CT dose effi ciency
between manufacturers.
These differences in system dose
effi ciency have become even more
apparent with 64-slice systems.
Detector effi ciency, low contrast
detectability, and reconstruction
algorithms are put to the greatest
test with 64-slice systems which are
always acquiring at their thinnest
slice thickness. This unmasks the
underlying design differences affecting
dose effi ciency.
To appreciate these differences,
it is important to look at how the
systems are used in clinical practice.
Vendor distributed show site images
show dramatic differences in
technique.
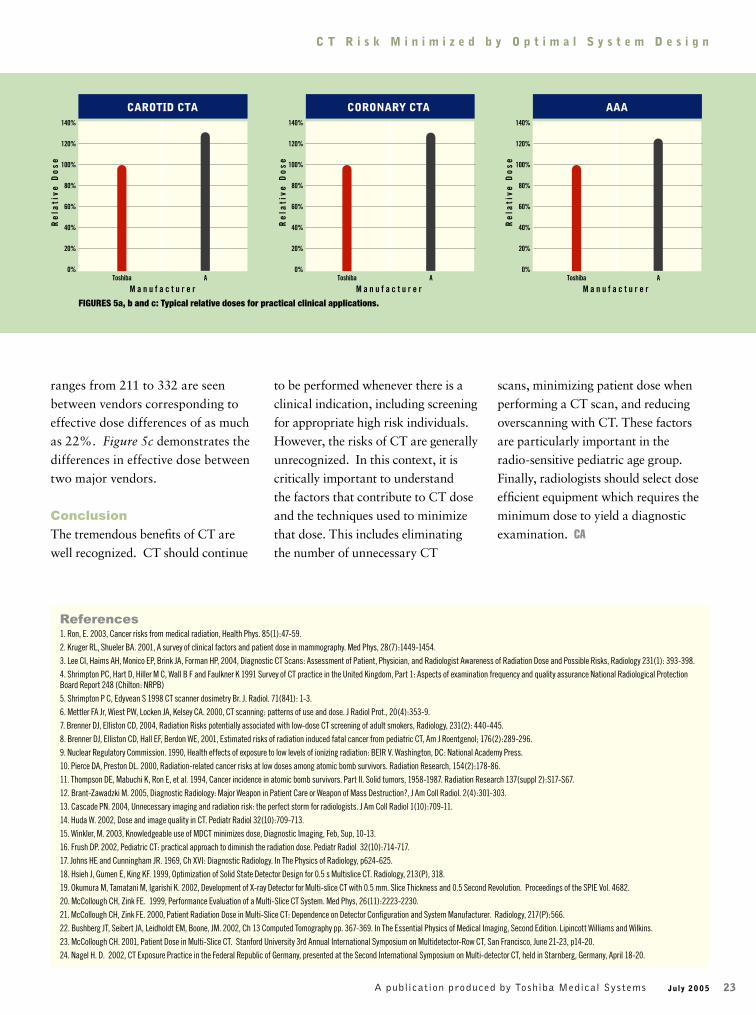
For body imaging, effective mA
ranges from 181 to 300 are seen
between vendors corresponding to
effective dose differences of as much
as 29%. Figure 5a demonstrates the
differences in effective dose between
two major vendors.
For CT coronary angiography,
effective mA ranges from 600 to
990 are seen between vendors
corresponding to effective dose
differences of as much as 28%.
Figure 5b demonstrates the differences
in effective dose between two major
vendors.
For body CTA, effective mA
22 July 2 0 05
C T R i s k M i n i m i z e d b y O p t i m a l S y s t e m D e s i g n
PATIENT DOSE IN CLINICS VS. MANUFACTURER
180%
160%
140%
120%
100%
80%
60%
40%
20%
0%
Re
lat
ive
Do
se
M a n u f a c t u r e r
Toshiba A B C
FIGURE 4: In clinical practice, patient dose varies signifi cantly between
manufacturers24.
Knowledge of CT dose
effi ciency between
scanners is critical
when selecting a
64-slice CT scanner
A publication produced by Toshiba Medical Systems
July 2 0 05 23
ranges from 211 to 332 are seen
between vendors corresponding to
effective dose differences of as much
as 22%. Figure 5c demonstrates the
differences in effective dose between
two major vendors.
Conclusion
The tremendous benefi ts of CT are
well recognized. CT should continue
to be performed whenever there is a
clinical indication, including screening
for appropriate high risk individuals.
However, the risks of CT are generally
unrecognized. In this context, it is
critically important to understand
the factors that contribute to CT dose
and the techniques used to minimize
that dose. This includes eliminating
the number of unnecessary CT
scans, minimizing patient dose when
performing a CT scan, and reducing
overscanning with CT. These factors
are particularly important in the
radio-sensitive pediatric age group.
Finally, radiologists should select dose
effi cient equipment which requires the
minimum dose to yield a diagnostic
examination. CA
References1. Ron, E. 2003, Cancer risks from medical radiation, Health Phys. 85(1):47-59.
2. Kruger RL, Shueler BA. 2001, A survey of clinical factors and patient dose in mammography. Med Phys, 28(7):1449-1454.
3. Lee CI, Haims AH, Monico EP, Brink JA, Forman HP, 2004, Diagnostic CT Scans: Assessment of Patient, Physician, and Radiologist Awareness of Radiation Dose and Possible Risks, Radiology 231(1): 393-398.
4. Shrimpton PC, Hart D, Hiller M C, Wall B F and Faulkner K 1991 Survey of CT practice in the United Kingdom, Part 1: Aspects of examination frequency and quality assurance National Radiological Protection
Board Report 248 (Chilton: NRPB)
5. Shrimpton P C, Edyvean S 1998 CT scanner dosimetry Br. J. Radiol. 71(841): 1-3.
6. Mettler FA Jr, Wiest PW, Locken JA, Kelsey CA. 2000, CT scanning: patterns of use and dose. J Radiol Prot., 20(4):353-9.
7. Brenner DJ, Elliston CD, 2004, Radiation Risks potentially associated with low-dose CT screening of adult smokers, Radiology, 231(2): 440-445.
8. Brenner DJ, Elliston CD, Hall EF, Berdon WE, 2001, Estimated risks of radiation induced fatal cancer from pediatric CT, Am J Roentgenol; 176(2):289-296.
9. Nuclear Regulatory Commission. 1990, Health effects of exposure to low levels of ionizing radiation: BEIR V. Washington, DC: National Academy Press.
10. Pierce DA, Preston DL. 2000, Radiation-related cancer risks at low doses among atomic bomb survivors. Radiation Research, 154(2):178-86.
11. Thompson DE, Mabuchi K, Ron E, et al. 1994, Cancer incidence in atomic bomb survivors. Part II. Solid tumors, 1958-1987. Radiation Research 137(suppl 2):S17-S67.
12. Brant-Zawadzki M. 2005, Diagnostic Radiology: Major Weapon in Patient Care or Weapon of Mass Destruction?, J Am Coll Radiol. 2(4):301-303.
13. Cascade PN. 2004, Unnecessary imaging and radiation risk: the perfect storm for radiologists. J Am Coll Radiol 1(10):709-11.
14. Huda W. 2002, Dose and image quality in CT. Pediatr Radiol 32(10):709-713.
15. Winkler, M. 2003, Knowledgeable use of MDCT minimizes dose, Diagnostic Imaging, Feb, Sup, 10-13.
16. Frush DP. 2002, Pediatric CT: practical approach to diminish the radiation dose. Pediatr Radiol 32(10):714-717.
17. Johns HE and Cunningham JR. 1969, Ch XVI: Diagnostic Radiology. In The Physics of Radiology, p624-625.
18. Hsieh J, Gumen E, King KF. 1999, Optimization of Solid State Detector Design for 0.5 s Multislice CT. Radiology, 213(P), 318.
19. Okumura M, Tamatani M, Igarishi K. 2002, Development of X-ray Detector for Multi-slice CT with 0.5 mm. Slice Thickness and 0.5 Second Revolution. Proceedings of the SPIE Vol. 4682.
20. McCollough CH, Zink FE. 1999, Performance Evaluation of a Multi-Slice CT System. Med Phys, 26(11):2223-2230.
21. McCollough CH, Zink FE. 2000, Patient Radiation Dose in Multi-Slice CT: Dependence on Detector Confi guration and System Manufacturer. Radiology, 217(P):566.
22. Bushberg JT, Seibert JA, Leidholdt EM, Boone, JM. 2002, Ch 13 Computed Tomography pp. 367-369. In The Essential Physics of Medical Imaging, Second Edition. Lipincott Williams and Wilkins.
23. McCollough CH. 2001, Patient Dose in Multi-Slice CT. Stanford University 3rd Annual International Symposium on Multidetector-Row CT, San Francisco, June 21-23, p14-20.
24. Nagel H. D. 2002, CT Exposure Practice in the Federal Republic of Germany, presented at the Second International Symposium on Multi-detector CT, held in Starnberg, Germany, April 18-20.
C T R i s k M i n i m i z e d b y O p t i m a l S y s t e m D e s i g n
CAROTID CTA
140%
120%
100%
80%
60%
40%
20%
0%
Re
lat
ive
Do
se
M a n u f a c t u r e r
Toshiba A
CORONARY CTA
Re
lat
ive
Do
se
M a n u f a c t u r e r
Toshiba A
AAA
Re
lat
ive
Do
se
M a n u f a c t u r e r
Toshiba A
140%
120%
100%
80%
60%
40%
20%
0%
140%
120%
100%
80%
60%
40%
20%
0%
FIGURES 5a, b and c: Typical relative doses for practical clinical applications.
A publication produced by Toshiba Medical Systems

24 July 2 0 05
The transition from a single slice or a 4-slice scanner to a volumetric scanner
with 16 or more slices is not always straightforward and can be fraught
with problems. Scanning with these new volumetric scanners requires both
the radiologist and technologist to accept a new paradigm in how images
are acquired and reviewed. Gone is the old concept of individual slices and
acquisition planes, replaced simply with the paradigm of acquiring and
reviewing data as a volume.
Volumetric data sets affect not only how we review the data but the type of
exams we perform with CT and how we scan the patients. The most dramatic
impact is in the area of CT angiography (CTA). CTA is rapidly replacing
diagnostic catheter angiography throughout the body (and perhaps soon even
in the heart). The purely diagnostic catheter angiogram may soon become a
rarity, gone the way of the exploratory laparotomy. The benefi ts of volumetric
imaging are not limited to CTA however. Every facet of CT imaging can be
improved dramatically. For example, for musculoskeletal imaging, volumetric
data sets from a single acquisition can be reconstructed in any conventional
or oblique plane with no loss of resolution. Patient positioning is no longer of
Multi-detector CT is the fastest growing and most exciting imaging technology
to come along in many years. It has revolutionized the way CT is performed
and interpreted. Amazing 3D images now regularly fi ll the pages of books
and journals and are quite familiar to most radiologists. Over the last 3 years
this technology has rapidly expanded from academic centers into community
hospitals and imaging centers around the country. 16, 32 and even 64-slice
scanners are being installed at an increasingly rapid pace.
AUTHOR
Scott Lipson, MDAssociate Director of Imaging
Long Beach Memorial Medical Center
ManagingDataOverload:Volumetric CT
Workfl ow
A publication produced by Toshiba Medical Systems

major importance and the need to obtain direct coronal
or sagittal scans no longer exists. For trauma patients
this has been an amazing revolution. With a single
data acquisition multiple different exams can be rapidly
generated and interpreted.
With a volumetric data set, parameters such as image
slice thickness, viewing plane
and image-rendering algorithm
(MPR, MIP, volume etc.) can
be determined retrospectively,
often on the fl y, and are
essentially independent of data
acquisition. The radiologist
now possesses almost
unlimited choices for image
review. This fl exibility has
resulted in dramatic benefi ts in
image quality and diagnostic
information and therefore
patient care, but has come with
an often overlooked down side:
an explosion of data can clog a
hospital network, send storage
costs through the roof, and
bring workfl ow to a crawl if
not managed appropriately.
Fortunately, there are
many strategies that can
be employed that preserve
the clinical and diagnostic
benefi ts of multi-detector CT
without overburdening the
PACS system or destroying
physician productivity. To
accomplish this, the processes
of data acquisition, image post-
processing and image review
should all be addressed separately with a different solution
needed for each process.
Data acquisition
Multi-detector CT scanners with 16 or more slices are
capable of routine acquisition of volumetric data sets in
almost all patients, for all exams. Volumetric data sets are
defi ned as data sets that have been acquired over a large
amount of anatomy in a short time with isotropic (or near
isotropic) voxels.
An isotropic voxel is a cube, measuring the same in
the x, y and z planes. A typical single slice voxel has a
dimension much longer in the z-axis than the x or y-
axis. This leads to adequate resolution in the plane of
acquisition (usually axial) but poor quality images for
MPR and 3D reconstructions. Isotropic voxels allow for
true 3D imaging. No matter how the data set is projected
there is no signifi cant loss
in resolution. Isotropic
voxels are the essential
building blocks for all
types of advanced 3D and
multiplanar visualization.
Voxel size in the
x and y dimension is
dependent on the image
matrix size and the fi eld of
view (FOV). All current
scanners routinely use a
standard 512 X 512 image
matrix; therefore the only
independent variable for
x-y voxel size is the FOV.
With a small FOV such
as 25cm, the voxel size is
0.5mm. With a large FOV
such as 50cm the voxel
size is 1.0mm. The z-axis
voxel size is determined by
the slice thickness of the
scan. Whenever possible
slice thickness should match
the voxel size in the x-y
dimension as determined by
the FOV (Figure 1).
16-slice scanners are
capable of isotropic or near
isotropic acquisitions in
most cases, except during very long scans that are time
limited by a contrast injection. This may occur in exams
such as gated cardiac studies and CTA runoff exams.
Scanners with 32 or more slices should be able to generate
isotropic acquisitions in every case.
High-level multi-detector CT scanners have removed
much of the variability and uncertainty from the process
of generating CT protocols. It is no longer a concern that
image resolution is sacrifi ced for the sake of speed or vice-
versa. We can have our cake and eat it too. Important
factors to consider when designing CT protocols besides
July 2 0 05 25
FIGURE 1: Isotropic voxels at 2 different fi elds of view (FOV). With a large FOV
(50cm) and a 512 X 512 matrix, isotropic voxels are achieved with 1mm slice
thickness. With a smaller FOV (25cm) 0.5mm slice thickness is needed to
achieve isotropic voxels.
A publication produced by Toshiba Medical Systems

acquisition slice thickness are: helical pitch, radiation dose
management, contrast administration and timing, and
cardiac gating. A full discussion of these parameters is
beyond the scope of this article.
Data reconstruction
Volumetric image review depends on starting with high
quality data sets, and that requires reconstruction of
thin-section data. In general, the thinnest slice thickness
possible (equal to acquisition slice thickness) should be
reconstructed. These thin-section images are the building
blocks used to create high quality multiplanar and volume
reconstructions. Because of this, the CT community
refers to these thin-slice images as “raw data”. Aside
from slice thickness, two other important variables to
consider with image reconstruction are slice overlap and
reconstruction fi lters.
Conventional CT wisdom dictates that to achieve
high quality multiplanar and 3D reformations the images
should be reconstructed with an overlap of approximately
50%. This was certainly true when non-isotropic data
sets with image slice thickness between 1.25mm and
3mm were the norm. However with true isotropic sub
millimeter data, image quality is so good that overlapping
reconstruction is often unnecessary and will substantially
increase the amount of data to process (Figure 2).
Overlapping reconstructions may still be useful in certain
cases when the highest quality 3D images are needed. The
quality difference will vary from scanner to scanner and
each site must individually weigh the quality improvement
against the increased amount of data. At Long Beach
Memorial, using a Toshiba Aquilion™ Volumetric CT
scanner, we almost never reconstruct overlapping data sets.
Choice of reconstruction fi lters is an important
decision that will affect both image quality and data
volume. All scanners offer a wide range of reconstruction
fi lters ranging from smoother fi lters best used for soft
tissue reconstruction, to sharper fi lters used more for bone
or lung. In general, smoother (soft tissue) fi lters are used
to reconstruct the raw data, as sharper fi lters will often
produce images that are unacceptably grainy, particularly
when looking at very thin slice sections. Smoother soft
tissue reconstruction kernels also generally produce better-
looking 3D volume and surface reconstructions (Figure 3).
True raw data can be reconstructed with as many
different fi lter kernels as necessary to provide the desired
information. For example chest scans can be routinely
reconstructed with both a soft-tissue fi lter as well as
a sharper fi lter to better see lung detail. Another way
to achieve a similar look and save storage space and
reconstruction time is to apply an edge enhancement
algorithm to the images after they are reconstructed. Most
PACS systems allow for a sharpening fi lter to be applied
to the images as a post-processing feature. This approach
is not quite as good as applying the fi lter directly to the
CT raw data, but it can be a good compromise for sites
that want to decrease the number of images reviewed and
26 July 2 0 05
M a n a g i n g D a t a O v e r l o a d
FIGURE 2: Thin slab MIP (top) and 3D volume rendered image (bottom) of a patient
with a peripheral mycotic MCA aneurysm. The data was acquired with 0.5mm
slice thickness and reconstructed with no overlap. Note the excellent detail of
the vessels and the smooth, sharp volume reconstructions.
A publication produced by Toshiba Medical Systems

stored, and speed up reconstruction
times. Special scanning techniques and
fi lters can also be applied on the scanner
for orthopedic cases to reduce artifacts
in patients being scanned with metal
rods or joint prostheses in place.
CT manufactures can recommend
certain kernels for reconstruction of
images for different types of cases,
but I recommend that each site work
with their applications people to try
out various options and choose the
fi lters that they like best for each
different exam. Applications specialists can take the
same data set and reconstruct images using different
fi lters for direct comparison by the radiologists. The
decision whether to reconstruct the data in a single (soft
tissue) algorithm or multiple algorithms (soft tissue,
lung, bone) must be decided by each site. The benefi ts of
multiple reconstructions are better image quality for bone
and lung studies, but the disadvantages are signifi cant
and include longer reconstruction times for each case,
increased network traffi c, and much more data to review
and archive. Especially when much of the same benefi t
can be achieved using post-processing features on a PACS
workstation.
Data post-processing
Post-processing of CT data is an essential part of the
multi-detector CT examination and may occur directly
on the scanner, on an independent workstation or even
entirely on the PACS viewing station.
A fundamental benefi t of volumetric data sets is the
ability to quickly and easily review very high quality
multiplanar images. With multi-detector CT, multiplanar
imaging should be part of the routine
practice and incorporated into almost
all CT exams in some form. Standard
thicker section (2-3mm) coronal and
sagittal images are simple to create
and can be reviewed quickly and
effi ciently. With volumetric data,
radiologists are now free to interpret
images in the plane that is most
appropriate. In this respect CT now
has the same capability as MRI. As
radiologists become more comfortable
with multiplanar imaging, diagnostic
accuracy and confi dence unquestionably improves. Many
diagnoses are now much easier to make in non-axial
planes. This can be diffi cult to fully understand and
appreciate until it becomes a routine part of your practice.
The decision of where to create multiplanar images
will vary from site to site depending on network and
PACS capabilities and storage limitations (Figure 4).
MPR images created directly on the CT scanner and sent
to PACS have the advantage of being immediately and
permanently available to the radiologists and clinicians.
Thicker slice images in the axial, sagittal and/or coronal
planes are generated for reviewing and archiving. The
thin section data is then discarded from the scanner after
a few days. The main advantage of this approach is speed
and effi ciency. Fewer images are sent through the network
and archived on PACS. Very large data sets that can clog
networks, slow PACS terminals and increase storage costs
are avoided.
A second, different approach is to send the thin section
data directly to PACS for post processing and archiving.
Many PACS systems allow the user to easily create and
review multiplanar images in any plane. This approach
July 2 0 05 27
M a n a g i n g D a t a O v e r l o a d
FIGURE 3: Sagittal and 3D volume reconstructions of a patient with severe arthropathy of the ankle with large subchondral cysts. The slice thickness was 0.5mm
reconstructed with no overlap. 3a and 3b are reconstructed with a soft tissue algorithm, while images 3c and 3d are reconstructed with a bone algorithm. Image
quality is much better seen on the sagittal image with the bone algorithm. This image is much sharper and shows far more bone detail. The 3D reconstruction is better
with the soft tissue reconstruction however. This image is smoother and less noisy.
Thin-section images
are building blocks for
high quality
multiplanar and
volume
reconstructions
A B C D
A publication produced by Toshiba Medical Systems

28 July 2 0 05
M a n a g i n g D a t a O v e r l o a d
has the great advantage of being an interactive process.
Slice thickness, image plane and rendering technique can
be varied dynamically for individual cases. The downside
is the amount of data that must be transferred, loaded and
archived. Many networks and PACS systems are currently
unable to handle this volume effectively. For these sites the
fi rst approach is recommended.
Advanced post-processing typically occurs on an
independent 3D workstation or a PACS station with 3D
capability. Advanced visualization techniques such as
volume or surface rendering, sliding slab MIP, curved
MPR, and segmentation are extremely important
adjunctive techniques but are not needed in every case.
They should be part of the routine evaluation of certain
exams such as CT angiography and extremity CT. These
images can be generated by either a trained technologist or
a radiologist and sent to PACS for reviewing and archiving.
Image Review
When it comes to acquiring data, thinner is usually better,
but is not always true for reviewing images. Very thin slice
images are sometimes grainy with increased noise and have
poorer contrast resolution than thicker images. Review of
these images is slow and ineffi cient compared with thicker
(2-5mm) reconstructions. It is a common concern among
radiologists new to multi-detector CT that they will miss
something important - and therefore be liable - unless
they review all the thin section data in each patient. This
concern is unfounded. There is virtually no signifi cant
pathology that can be identifi ed on a 0.5mm image
that would be completely overlooked on a 3mm image.
Conversely, is much more likely that an important lesion
could be missed on the thin sections because of poorer
signal to noise (decreased contrast resolution), but seen
on the thicker image. In rare instances it may be useful to
review the thin section data to characterize a lesion seen
on the thicker reconstructions such as a small pulmonary
nodule or a subtle fracture. This is uncommon but can
easily be done retrospectively when needed.
For routine cases, I recommend reviewing 2-5mm
axial images and 2-3mm coronal and/or sagittal images.
The slice thickness chosen should vary with the body
part. 2-3mm images for exams of the brain, sinuses,
neck, extremities, pancreas etc., and 3-5mm images for
chest and abdomen. If the MPR images are created on
the scanner, then the slice thickness will be fi xed and
predetermined by the protocol, and for images created on
PACS or a workstation this is usually an interactive process
that will vary by patient. In either case, the process
should be similar. The radiologist quickly reviews a fi xed,
relatively small (< 300) number of images.
Cases that require advanced visualization tools such
as CTA and musculoskeletal cases are often best reviewed
directly on the workstation. This allows for real-time
interactive review of volumes and MIPS. These cases can
be effectively reviewed on PACS if a technologist has taken
the appropriate images and sent them to PACS in advance.
FIGURE 4: Time and storage space can be saved by reconstructing multiplanar
images directly on the scanner and sending only thicker slice axial and MPR
images to PACS. Maximal fl exibility is obtained by sending all the thin-section
data to PACS and reconstructing MPR images on the workstation.
FIGURE 5: CT workfl ow. Flow chart demonstrating fl ow of image data from the
scanner to the PACS system and workstation and subsequently to the radiologist
and referring doctors.
MULTIPLANAR RECONSTRUCTION OPTIONS
A publication produced by Toshiba Medical Systems

July 2 0 05 29
M a n a g i n g D a t a O v e r l o a d
CT Workfl ow
There is no one roadmap for effi cient CT workfl ow that
will succeed for all sites. Each site will need a slightly
different solution based on the available equipment and
the preferences of the radiologists. One of the most
important components to effi cient workfl ow is setting up
detailed protocols and pathways for each case (Figure 5).
Having a detailed protocol eliminates the guesswork
and minimizes errors, and saves time for both the
technologist and the radiologist. If the protocol covers
everything that needs to be done from start to fi nish,
the technologist does not need to waste time fi guring
out what to do. The radiologist will not waste time
answering unnecessary questions and when he reviews
a case he can be confi dent that the images he expects to
see will be there in the desired format.
A comprehensive protocol includes not only the
parameters needed to acquire the data, but a detailed
outline of how the data should be reconstructed, post-
processed and archived for each type of exam. Getting
the right data to the radiologist in the proper format is
half the battle.
True effi ciency also requires a frame shift in the
minds of interpreting radiologists. For years the CT
paradigm has dictated careful review of axial images
with multiplanar correlation in select cases. This
paradigm is obsolete in the multidetector era with
volumetric data sets. Radiologists familiar with MRI
can easily understand this. No experienced MRI reader
would ever feel content with axial images alone. For
years MRI readers have been able to review images in
whichever plane best demonstrates the anatomy and
pathology, and correlate the fi ndings with other planes.
CT should now be treated exactly the same way. Many,
if not most exams are better suited to primary image
review in the sagittal, coronal or even oblique planes.
This is fairly obvious for exams like the spine, sinuses
and hips, but can even be true for body cases (Figures
6 and 7). The body is much longer than it is wide and
therefore 80 2mm coronal images can be reviewed much
more quickly than 200 3mm axial images.
Making the transition from axial image based
review to a true multiplanar and volumetric approach
does not occur overnight. It is a gradual process that
takes weeks or months to fully integrate into daily
practice. The rewards are substantial as more effi cient
image review couples with the potential for improved
diagnostic accuracy. CA
FIGURE 6: 2mm coronal reconstruction from a CT abdomen in a patient with
jaundice. 2 very large stones (*) are impacted in the distal common bile duct.
The coronal plane is ideal for demonstration of biliary abnormalities.
FIGURE 7: 2mm coronal reconstruction from a CT abdomen of a patient with Crohn’s
disease and small bowel obstruction. A long segment of narrowed and thickened
small bowels present. Note the small bowel feces sign in the dilated loop proximal
to the obstruction. The pathology in this patient was much easier to characterize in
the coronal plane.
ReferenceLipson, Scott. Multidetector CT and 3D workstations: A Practical Guide and Teaching Files,
Springer Science and Business Media. 2005.
Figures used with kind permission of Springer Science and Business Media.
A publication produced by Toshiba Medical Systems

30 July 2 0 05
Cogans Syndrome
DESCRIPTION: Cogans Syndrome: an infl ammatory disease involving the eye, ear, and aorta, characterized by uveitis, otitis and aortitis,
and near total occlusion of most major vessels originating from the aorta.
PROFILE: 70-year-old female patient with known Cogans Syndrome affecting both coronary arteries, left carotid, left subclavian ves-
sels, both renal arteries, and both mesenteric arteries. An initial coronary artery bypass graft was performed using saphenous veins,
but both grafts later occluded at their ostia. A second coronary artery bypass graft was performed using bilateral mammary artery
grafts. These grafts remain patent. Patient then developed angina due to progressive left subclavian stenosis, which was successfully
treated by stenting.
SCAN PARAMETERS: 120 KV, 400 mA, 0.4msec, 0.25 pitch Acquired with 0.5mm x 64
Aquilion 64 Case Study
Image 4: Volume rendering in 3D
shows the saphenous vein graft and
RIMA on the right side.
Image 5: Inferior superior view from
the apex shows the extent of the
infl ammatory condition at the root
of the aortic arch extending upward
and the anastamosis of the SVG and
the LIMA and original LAD.
Images courtesy of Johns Hopkins Bayview, Baltimore, MD.
Image 6: Sagittal view of the heart
and chest show the extent of the
infl ammation of the aortic root and
aorta.
Image 3: 3D Volume rendered
image with the myocardial mass
in background clearly show the
anatomical relationship of the
grafts: RIMA, LIMA and saphenous
vein grafts and the infl ammatory
condition of the aortic root and arch
and surrounding anatomy.
Images 4 and 5: Angio-emulation rendering are used to show in these AP and AP-Oblique views which demonstrate the relationship of the vessels of the
heart and the associated RIMA, LIMA and SV grafts.
A publication produced by Toshiba Medical Systems


DI_OUTSERT12


![Forward [PDF:2.8MB]](https://img.dokumen.tips/doc/110x75/587f6a2d1a28abf0298c07a6/forward-pdf28mb.jpg)


