Embed Size (px)
Citation preview

#7 AnthropometryBy : Dewi Hardiningtyas, ST., MT., MBA.Industrial Engineering Dept. – University of Brawijaya

Diversity in the human body

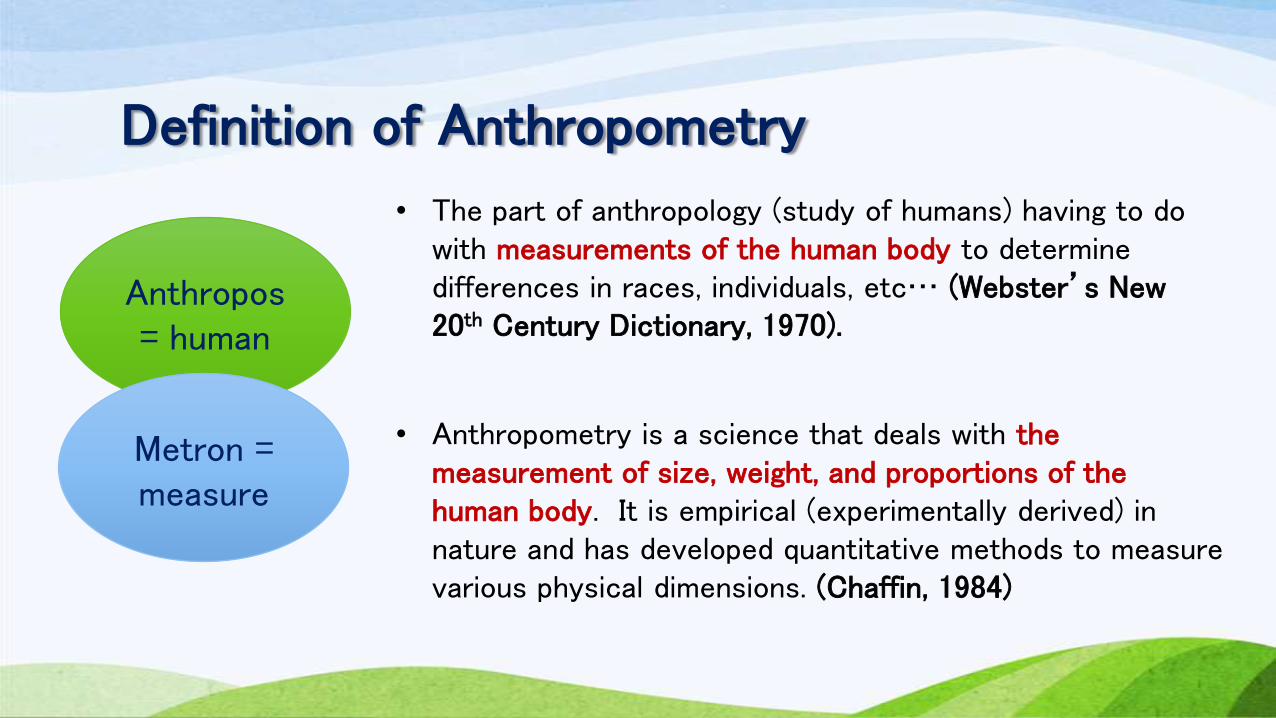
Definition of Anthropometry
• The part of anthropology (study of humans) having to do with measurements of the human body to determine differences in races, individuals, etc… (Webster’s New 20th Century Dictionary, 1970).
• Anthropometry is a science that deals with the measurement of size, weight, and proportions of the human body. It is empirical (experimentally derived) in nature and has developed quantitative methods to measure various physical dimensions. (Chaffin, 1984)
Anthropos= human
Metron = measure

Engineering Anthropometry
The application of anthropometric data
to equipment, workplace, and job design
to enhance the efficiency, safety and comfort
of the operator.

What is the difference of products developed by fashion designer and industrial designer ?


Application of Anthropometric Data
1. To specify the physical dimensions of :
Workspaces
Equipment
Furniture
Clothing
So on…
2. To ensure that physical
mismatches between the
dimensions of equipment /
products and the user are
avoided.

Human Variability1. US Civilians
2. British Civilians
3. Swedish Civilians
4. Japanese civilians
5. US Air Force Fliers
6. Italian Military
7. French Fliers
8. Japanese Civilians
9. Turkish Military
190
180
170
160
150
140
12
3
4
5
67
89
Female Male
Standing Height (cm)

Factors affecting anthropometry data
Age Sex JobsBody
Position
ClothingDaily
changesGenerational
changesEthnicity
Pregnancy Disability
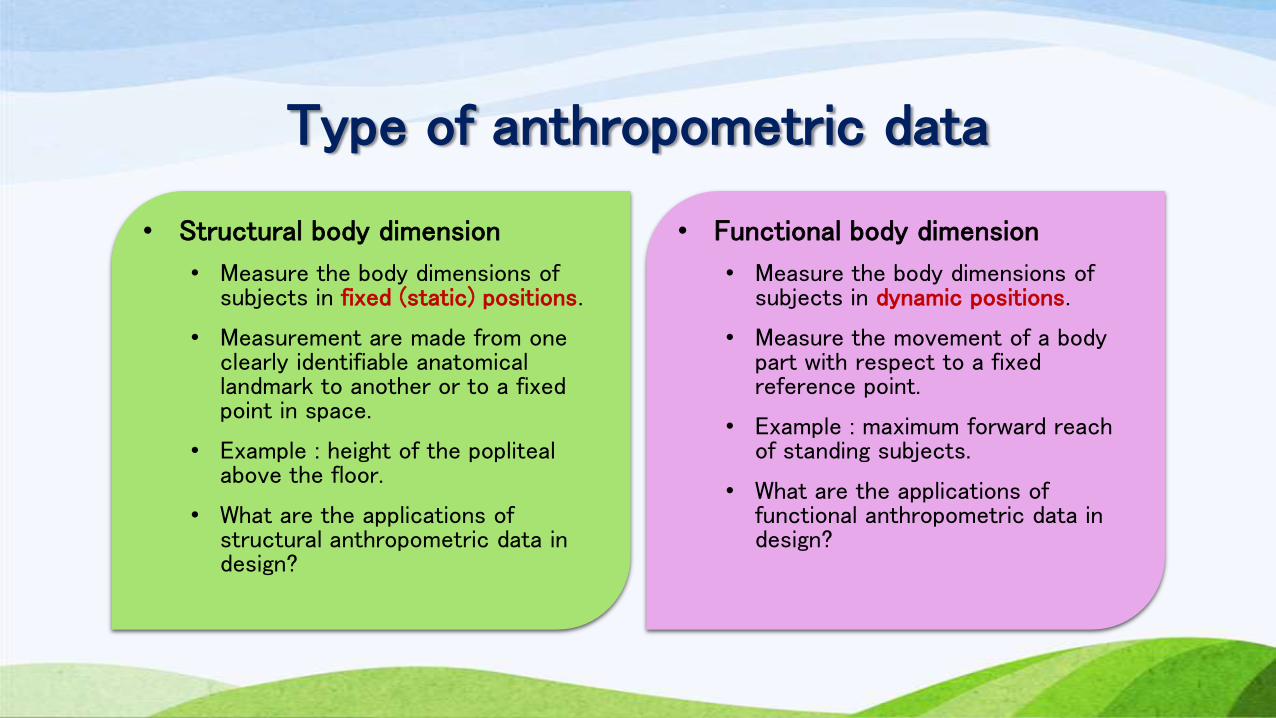
Type of anthropometric data
• Structural body dimension
• Measure the body dimensions of subjects in fixed (static) positions.
• Measurement are made from one clearly identifiable anatomical landmark to another or to a fixed point in space.
• Example : height of the poplitealabove the floor.
• What are the applications of structural anthropometric data in design?
• Functional body dimension
• Measure the body dimensions of subjects in dynamic positions.
• Measure the movement of a body part with respect to a fixed reference point.
• Example : maximum forward reach of standing subjects.
• What are the applications of functional anthropometric data in design?

Measurement tools• Spreading and sliding calipers• Anthropometer• Segmometer• Head board• Anthropometric Tape
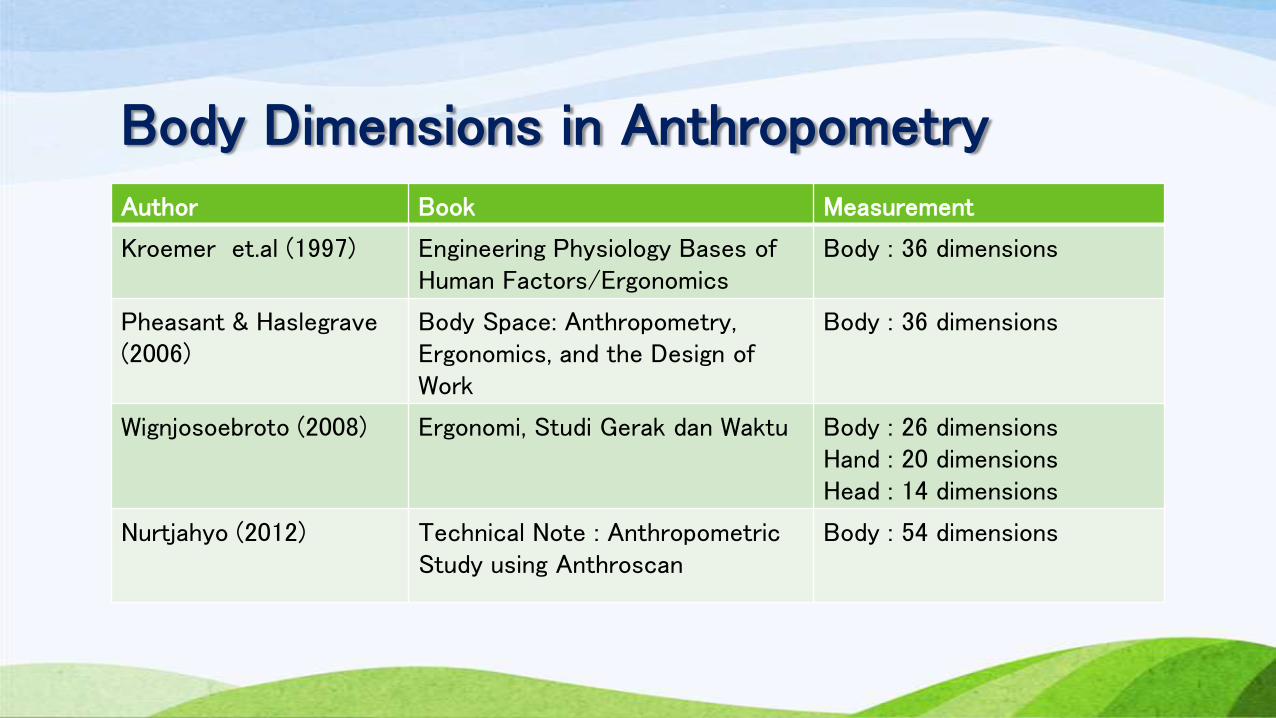
Body Dimensions in AnthropometryAuthor Book Measurement
Kroemer et.al (1997) Engineering Physiology Bases of Human Factors/Ergonomics
Body : 36 dimensions
Pheasant & Haslegrave(2006)
Body Space: Anthropometry, Ergonomics, and the Design of Work
Body : 36 dimensions
Wignjosoebroto (2008) Ergonomi, Studi Gerak dan Waktu Body : 26 dimensionsHand : 20 dimensionsHead : 14 dimensions
Nurtjahyo (2012) Technical Note : Anthropometric Study using Anthroscan
Body : 54 dimensions
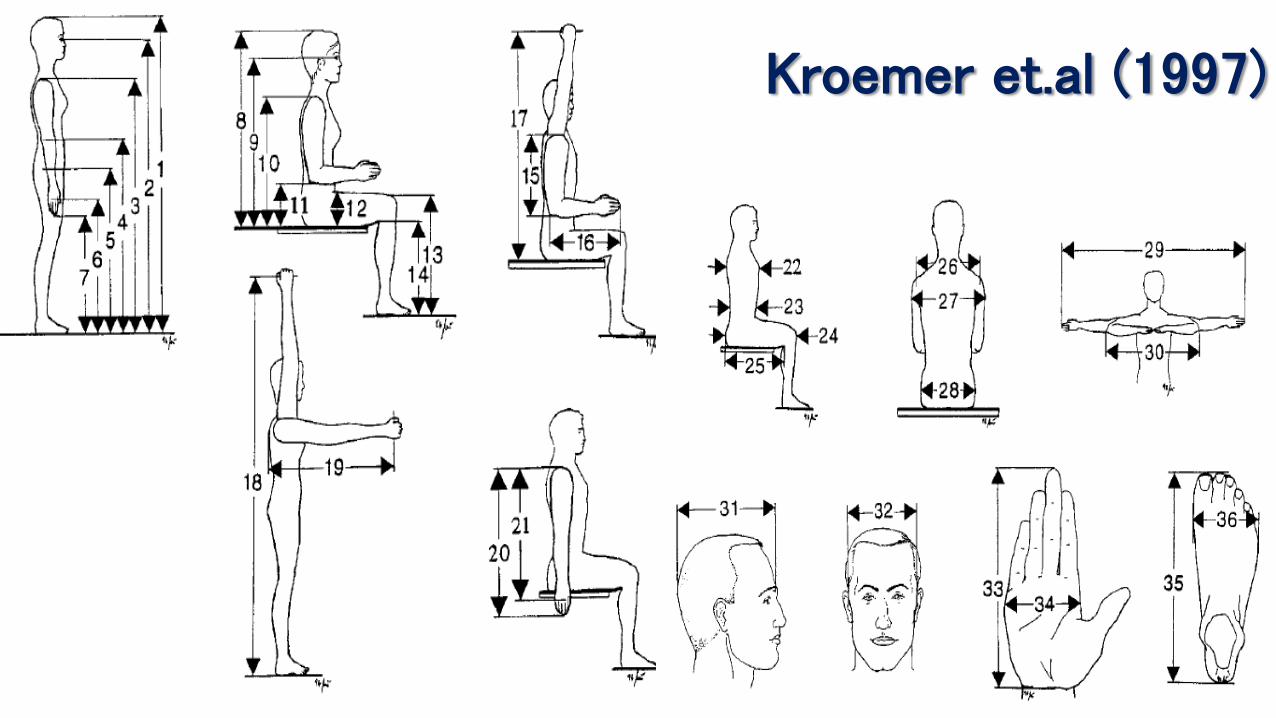
Kroemer et.al (1997)
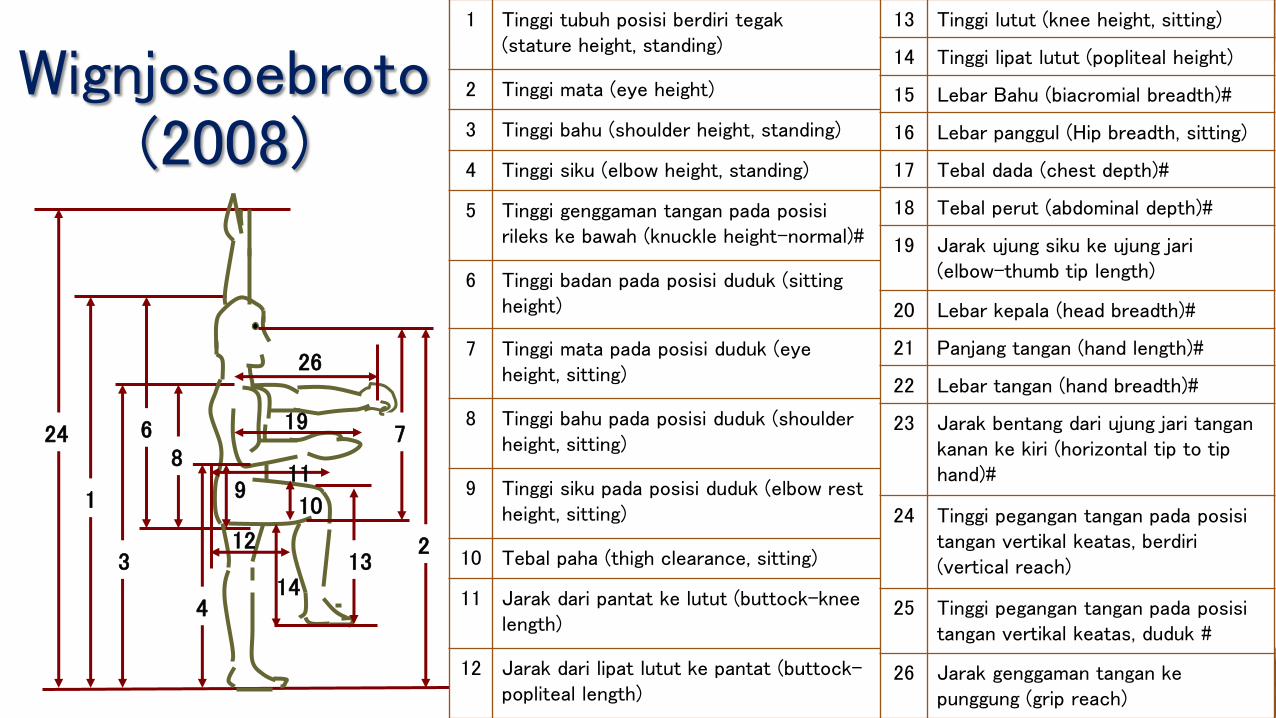
Wignjosoebroto(2008)
24
1
3
68
4
910
19
12
14
11
213
26
7
1 Tinggi tubuh posisi berdiri tegak(stature height, standing)
2 Tinggi mata (eye height)
3 Tinggi bahu (shoulder height, standing)
4 Tinggi siku (elbow height, standing)
5 Tinggi genggaman tangan pada posisirileks ke bawah (knuckle height-normal)#
6 Tinggi badan pada posisi duduk (sitting height)
7 Tinggi mata pada posisi duduk (eye height, sitting)
8 Tinggi bahu pada posisi duduk (shoulder height, sitting)
9 Tinggi siku pada posisi duduk (elbow rest height, sitting)
10 Tebal paha (thigh clearance, sitting)
11 Jarak dari pantat ke lutut (buttock-knee length)
12 Jarak dari lipat lutut ke pantat (buttock-popliteal length)
13 Tinggi lutut (knee height, sitting)
14 Tinggi lipat lutut (popliteal height)
15 Lebar Bahu (biacromial breadth)#
16 Lebar panggul (Hip breadth, sitting)
17 Tebal dada (chest depth)#
18 Tebal perut (abdominal depth)#
19 Jarak ujung siku ke ujung jari(elbow-thumb tip length)
20 Lebar kepala (head breadth)#
21 Panjang tangan (hand length)#
22 Lebar tangan (hand breadth)#
23 Jarak bentang dari ujung jari tangankanan ke kiri (horizontal tip to tip hand)#
24 Tinggi pegangan tangan pada posisitangan vertikal keatas, berdiri(vertical reach)
25 Tinggi pegangan tangan pada posisitangan vertikal keatas, duduk #
26 Jarak genggaman tangan kepunggung (grip reach)

How to get and use the anthropometric data ?
Preparation
• Sample of objects (By age? By ethnic? By job?)
• Measurement tools
• Recording table
Measurement
• Read the instructions carefully!
• Person who measure should be understand the standard of body dimension.
Data Tabulation (1)
• Re-check the data (have followed the normal distribution or not).
• Calculate mean per dimension.
• Calculate standard deviation per dimension.
Data Tabulation (2)
• Select required percentile factor.
• Calculate data with its percentile factor.
Application to Design
• Select body dimension appropriate with product dimension.
• Add adjustment / allowance (if needed).

Data Tabulation (1-2)
Frequency distribution of body height (stature) in
Americans. About 95% of all males
are between 162 and 188 cm tall, about 2.5% are shorter, another 2.5%
taller (Kroemer, 1997).
1
n
X
Xmean
n
1ii
1n
xx
SD
n
1i
2
i
2
Percentile is a value that indicate the percentage of a group who have the same value or under.Percentile <50th : lower percentilePercentile >50th : upper percentile
3
Percentile Tabulation
1st X – 2,32 SD
2,5th X –1,96 SD
5th X – 1,64 SD
10th X – 1,28 SD
50th X
90th X + 1,28 SD
95th X + 1,64 SD
97,5th X + 1,96 SD
99th X + 2,32 SD
Percentile Factor
1st - 2,32
2,5th - 1,96
5th - 1,64
10th - 1,28
50th 0
90th 1,28
95th 1,64
97,5th 1,96
99th 2,32

Case Study :Dari hasil pengukuran tubuh manusia Indonesia (dewasa, laki-laki, usia 19 – 40 tahun) diperoleh data yang berdistribusi normal dengan tinggi rata-rata 170 cm dgn standar deviasi 7 cm. Berapakah ukuran 95th dan 5th percentile?
95th percentile :
= X + 1,64 SD= 170 + 1,64 (7) = 182 cm
5th percentile
= X – 1,64 SD= 170 – 1,645 (7) = 159 cm
The Story of Lacy and Andrew
Does one size fit all?
Lacy is 4’10” (147 cm)
Andrew is 6’10” (208 cm)


Have an enjoy study and see you next week…