Embed Size (px)
Citation preview

1841
Bulletin of the Seismological Society of America, Vol. 95, No. 5, pp. 1841–1855, October 2005, doi: 10.1785/0120040181
Global Observational Properties of the Critical Earthquake Model
by C. B. Papazachos, G. F. Karakaisis, E. M. Scordilis, and B. C. Papazachos
Abstract The preshock (critical) regions of 20 mainshocks with magnitudes be-tween 6.4 and 8.3, which occurred recently (since 1980) in a variety of seismotectonicregimes (Greece, Anatolia, Himalayas, Japan, California), were identified and inves-tigated. All these strong earthquakes were preceded by accelerating time-to-main-shock seismic crustal deformation (Benioff strain). The time variation of the cumu-lative Benioff strain follows a power law with a power value (m � 0.3) in very goodagreement with theoretical considerations. We observed that the dimension of thecritical region increased with increasing mainshock magnitude and with decreasinglong-term seismicity rate of the region. An increase of the duration of this critical(preshock) phenomenon with decreasing long-term seismicity rate was also observed.This spatial and temporal scaling expresses characteristics of the critical earthquakemodel, which are of importance for earthquake prediction research. We also showedthat the critical region of an oncoming mainshock coincides with the preparing regionof this shock, where other precursory phenomena can be observed.
Introduction
The critical earthquake model is based on principles ofstatistical physics and has been proposed (Sornette and Sor-nette, 1990; Allegre and Le Mouel, 1994; Sornette and Sam-mis, 1995) to explain accelerating intermediate magnitudeseismicity observed before strong mainshocks (Tocher,1959; Mogi, 1969; Varnes, 1989; Sykes and Jaume, 1990;Knopoff et al., 1996; Tzanis et al., 2000; among others).According to this model, the physical process of generationof these moderate magnitude shocks (preshocks) is consid-ered a critical phenomenon, culminating in a large event(mainshock), which is considered as the critical point. Suchbehavior has been also supported by independent observa-tions, which suggest that rupture in heterogeneous media isa critical phenomenon (Vanneste and Sornette, 1992; La-maignere et al., 1996; Andersen et al., 1997). Thus, the criti-cal earthquake model is now supported by seismological ob-servations, by principles of statistical physics, and rockmechanics experiments.
Several researchers have recently investigated proper-ties of the model (Bufe and Varnes, 1993; Bowman et al.,1998; Brehm and Braile 1999; Jaume and Sykes, 1999; Run-dle et al., 2000). Bufe and Varnes (1993) proposed a powerlaw for the time variation of the cumulative Benioff strain,S (square root of energy), released by preshocks in the criti-cal region:
mS � A � B(t � t ) (1)c
where tc is the failure time (origin time of the mainshock)and A, B, and m are model parameters. Bowman et al. (1998)
quantified the degree of deviation of the time variation of Sfrom linearity by proposing the minimization of a curvatureparameter, C, which is defined as the ratio of the root meansquare error of the power-law fit (relation 1) to the corre-sponding linear fit error, and showed that the size of theaccelerating (critical) region scales with the mainshock mag-nitude. Similar results were independently obtained byBrehm and Braile (1998, 1999) and supported by mining-induced seismicity and laboratory experiments (Quillon andSornette, 2000; Johansen and Sornette, 2000). Furthermore,Zoller et al. (2001) and Zoller and Hainzl (2002) have per-formed systematic spatiotemporal tests in an attempt toquantify the predictive power of accelerated deformation re-lease and the related growing of the spatial correlationlength. Despite the fact that the critical earthquake concepthas been questioned regarding the robustness of the reportedanalyses (Gross and Rundle, 1998), several theoretical ap-proaches (Ben-Zion et al., 1999; Rundle et al., 2000; Ben-Zion and Lyakhovsky, 2002), as well as laboratory results(Guarino et al., 1999, 2002) have verified the existence ofcritical behavior, at least under some conditions.
Papazachos and Papazachos (2000, 2001) suggested theuse of elliptical critical regions and several constraints to thecritical earthquake model expressed by relations between pa-rameters of the accelerating Benioff strain (seismic crustaldeformation) and the long-term mean rate of the seismicdeformation (seismicity release rate). As a representativemeasure of the seismicity/seismic deformation, they used theaverage annual Benioff strain rate in the critical region, Sr
(in J1/2/yr), as this is determined from the cumulative, long-

1842 C. B. Papazachos, G. F. Karakaisis, E. M. Scordilis, and B. C. Papazachos
term Benioff strain release for events with M �5.2. The useof this specific cutoff magnitude value was imposed by thefact that such events are usually available for a long-timeinterval (in some areas almost for the whole twentieth cen-tury) for many seismogenic regions worldwide, allowing thereliable determination of the average seismic release rate foreach examined critical region. The most important of theseconstraint relations are: (1) A relation between the logarithmof the radius R (in km) of the circle with area equal to thearea of the elliptical critical region and the magnitude M(moment magnitude) of the mainshock; (2) a relation be-tween the logarithm of the duration tp (in years) of the pre-shock sequence (that is, of the duration of the acceleratingseismic deformation) and the logarithm of the long-term rateof seismic crustal deformation per unit area, Sr (in J1/2/yr andper 10 km2); (3) a relation between the log(A/tp) and log Sr,where A is the constant of relation (1); and (4) a relationbetween the magnitude of the mainshock, M, and the meanmagnitude of the three largest preshocks, M13.
Observations for 18 mainshocks of the Aegean area (Pa-pazachos et al., 2002a, b) showed that preshock acceleratingdeformation can be identified in all cases with C � 0.6 andm � 0.35. The C cutoff value observed for the Aegean isslightly smaller than the cutoff value used by Bowman et al.(1998). The average observed value for m for the Aegeanarea is 0.3 (Papazachos et al., 2001), in accordance withtheoretical considerations and a large number of worldwideobservations (see Ben-Zion and Lyakhovsky [2002] for anindicative summary of results from various studies). Papa-zachos and Papazachos (2001) defined a parameter P as theaverage value of the probability that each of the four param-eters (R, tp, A, M) attains a value close to its expected one.Furthermore, Papazachos et al. (2002a) chose a quality in-dex, q, defined by the relation
Pq � (2)
mC
in an attempt to simultaneously evaluate the compatibilityof an investigated accelerating seismic deformation with thebehavior of past real preshock sequences (large P), the de-gree of seismic acceleration (small m), and the fit of the datato the power law (small C). From the investigation of thesame sample of 18 preshock sequences in the Aegean area,the cutoff values of P � 0.45 and q � 3.0 have also beendetermined (Papazachos et al., 2002a,b).
The main target of the present work is to investigateproperties of critical regions in active areas with differentseismotectonic conditions (Greece, Anatolia, Himalayas, Ja-pan, California) by using the most recent and reliable data.Furthermore, an attempt is made to derive globally validrelations between model parameters that can be used as ad-ditional constraints to the critical earthquake model. It isshown that such work supports the validity of the criticalearthquake model and can contribute to the improvement of
methodology for intermediate-term earthquake prediction,since certain basic properties of the model have a premoni-tory character for the oncoming mainshock.
The terms “preshocks” and “postshocks” are used in thepresent article in their broad sense. Thus, while foreshocksand aftershocks are spatially distributed in or near the fault(rupture) zone of the mainshock, and the duration of theirsequences is of the order of months, preshocks and post-shocks are distributed in a broader region, with dimensionsthat are typically an order of magnitude larger than the faultlength of the mainshock, while the duration of preshock andpostshock sequences is of the order of years or decades.
The choice of the critical region shape is of importancefor the identification of such regions, and several shapes suchas circular (e.g., Bufe and Varnes, 1993; Bowman et al.,1998), elliptical (e.g., Papazachos and Papazachos 2000,2001), predicted stress-drop pattern (e.g., Bowman andKing, 2001) have been used. Circular ones, traditionallyused in most studies, have the advantage that the probabilitythat parts of more than one preshock (critical) region will beincluded in such a shape is small. There are, however, sev-eral elongated seismic zones for which no solutions can befound using circular critical regions and reliable solutionsare found only for elongated shapes (e.g., elliptical). This iseither due to data limitations and critical region overlap orto the real necessity to use ellipses to approximate the truecritical region, which some studies have suggested havecomplicated shapes (e.g., Bowman and King, 2001). Unfor-tunately, elliptical regions include two additional degrees offreedom (ellipticity, azimuth), hence increasing the proba-bility of finding valid solutions even in random catalogs(e.g., Papazachos et al., 2002a). For this reason, identifica-tion of a critical region in a broad area must be tested forboth circular and elliptical shapes. Thus, for the 20 preshocksequences studied in the present paper, for 16, both circularand elliptical shapes gave valid solutions, while for the re-maining 4 cases, which concern preshock sequences in elon-gated seismic regions, only elliptical shapes gave valid so-lutions.
Data and Procedure
Three samples of data are used for each of the five areasconsidered in the present article. The first sample concernsthe mainshocks, the second the preshocks of each main-shock, and the third one includes the shocks that define thelong-term mean seismicity in each critical region. Each sam-ple must be complete (including all shocks that occurredduring a certain time period with magnitudes larger than acertain value), large enough (to be representative) and ac-curate (a property that is better satisfied for recent earth-quakes). These properties differ from area to area; hence,each area of interest was examined separately.
The main target of the data processing procedure wasto obtain homogeneous catalogs exhibiting similar charac-teristics for all examined areas. For this reason, all magni-
Global Observational Properties of the Critical Earthquake Model 1843
tudes of earthquakes included in the final catalogs are mo-ment magnitudes or equivalent to moment magnitudes, thatis, magnitudes that have been converted to moment magni-tudes from other scales (i.e., Ms, mb published by ISC and/or NEIC) by using appropriate formulas and/or graphs pro-posed by Scordilis (2005). The finally adopted magnitudefor each earthquake is the weighted mean of the values cal-culated by the above transformations by taking as weight foreach magnitude value the inverse of the standard deviation,r, of the corresponding transformation formula. A similarprocedure was successfully applied in order to create a ho-mogeneous earthquake catalog, which was used in a retro-spective study of accelerated crustal deformation in the Adri-atic (Scordilis et al., 2004).
An example of the adopted procedure is shown in Fig-ure 1a, where the equivalent moment magnitude, , com-*MW
puted from other magnitudes (MS, mb, ML) is plotted againstoriginal MW determinations for more than 700 events inCalifornia for which both estimates were available. In gen-eral a very good correlation between the two magnitudes isobserved with the standard error being less than 0.2, sug-gesting that the equivalent moment magnitude can be reli-ably used in the present study.
Furthermore, in all cases the data completeness has beenchecked using both, the frequency–magnitude distributionand the cumulative frequency–magnitude relation. Severaltime periods have been tested to assure the data complete-ness for each region. For instance, the data completeness forthe broader Himalayas area for the time period from 1965until 2003 has been checked for seven subperiods. It hasbeen finally determined that the data are complete for earth-quakes of M �4.7 since 1965 and M �4.2 since 1981 (Fig.1b and 1c).
In order to ensure the reliability of the data set used,only mainshocks that occurred during the last two decadesor so (1980–2002) were considered. The starting time waschanged to 1981 for Greece (date of full operation of thefirst digital telemetric network in Greece) and 1990 for theHimalayas, which is the only area for which a regional cat-alog source was not available; hence we limited the searchto the last decade in order to use the most reliable main-shock–preshock–postshock information.
The main sources of all the catalogs used in the presentwork were the bulletins of the International SeismologicalCentre (ISC, 2005) and of the National Earthquake Infor-mation Center (NEIC, 2005), as well as the CMT solutionscatalog of Harvard (Harvard Seismology, 2005), which wereused to create the master catalog for each area until the endof 2002. Using this master catalog for the Himalayas andsurrounding area (20�N–45�N, 60�E–90�E) four mainshockswith M �7.0 that occurred since 1990 were considered. Thefinal data sample used concerns shocks with M �4.7 thatoccurred since 1965.
However, for several of the examined areas, we alsoused individual catalogs available mainly from reliable localsources, which were merged with the master catalog. Spe-
cifically, for the Mediterranean region (Greece and Anatolia,28�N–55�N, 15�W–46�E), data from the catalogs of Euro-pean earthquakes compiled by Karnik (1996), which wascomplemented by the catalog of Papazachos et al. (2003)for earthquakes in Greece and surrounding areas, as well asthe bulletins of National Observatory of Athens and the Geo-physical Laboratory of the University of Thessaloniki havebeen used. Using the final catalog for the area of Greece andsurrounding region (34�N–42�N, 19�E–28�E), all six main-shocks with M �6.4 that occurred between 1981 and 2002were considered. The following three complete samples ofdata have been used: 1911–2002, M �5.2 (used for calcu-lation of the mean seismic deformation); 1950–2002, M�5.0; 1965–2002, M �4.5 (used for estimation of the pre-shock seismic deformation). Similarly, for Anatolia (35�N–42�N, 28�E–42�E), three mainshocks that occurred duringthe last decade with magnitude M �6.4 were considered.The following three complete samples have been used:1911–2002, M �5.2; 1950–2002, M �5.0; 1965–2002,M �4.5.
For the area of Japan (30�N–50�N, 130�E–150�E), thecatalog has been enriched with data of the Japan Meteoro-logical Agency (JMA), in order to obtain additional infor-mation for low-magnitude earthquakes. Four mainshockswith M �7.3 that occurred since 1980 were considered. Ex-amination of completeness showed that the data were com-plete for M �5.0 since 1926.
Finally, for California (33�N–42�N, 125�W–114�W),additional data from NEIC regarding significant U.S. earth-quakes, as well as moment magnitudes from the USGS(Earthquake Hazards Program) have also been used. Fur-thermore, additional data have been extracted from the Ad-vanced National Seismic System (ANSS) composite earth-quake catalog (http://quake.geo.berkeley.edu/anss), whichincludes contributions from the Southern California SeismicNetwork, the Seismographic Station of the University ofCalifornia at Berkeley, and the Northern California Seismicnetwork, among other contributing members. Earthquakemagnitudes for California in the ANSS catalogue are givenin various scales (Ms, mb, ML, Mw, Mc, Md, etc.). For ex-ample, about 65% of the M �3.0 events have ML or Mc
(which is essentially equal to ML, [Felzer et al., 2002]) mag-nitudes. All magnitudes were also converted to equivalentmoment magnitudes using appropriate relations (Scordilis,2005). Finally, four mainshocks with M �7.0 that occurredsince 1980 were considered, while the examination for com-pleteness showed that the data were complete for M �4.8since 1930.
The involved uncertainties are typically less than 30 kmfor the epicenter and less than 0.3 for the equivalent momentmagnitude. Therefore, for 20 normal-depth mainshocks thatoccurred since 1980 and had magnitudes between 6.4 and8.3 (Table 1), reliable data (magnitude, epicenters of pre-shocks, etc.) were available, and these data are used to defineparameters of their critical (preshock) regions. Although afew preliminary results for some intermediate-depth events

1844 C. B. Papazachos, G. F. Karakaisis, E. M. Scordilis, and B. C. Papazachos
Figure 1. (a) Comparison of the equivalent moment magnitudes, , determined*MW
from various magnitude sources (MS, mb, ML) with original MW estimations using therelations of Scordilis (2005) for the catalog used for the broader California area. (b, c)Frequency–magnitude and cumulative frequency–magnitude distributions used for theHimalayas area to define the data completeness for two time periods: 1965–1980 (b)and 1981–2003 (c).
indicate that they also exhibit a similar accelerated defor-mation preshock behavior, we decided to exclude them fromthe present work owing to the limited number of associatedpreshocks, as well as their special characteristics, and leavetheir study for future work.
To identify an elliptical critical (preshock) region of analready occurred mainshock, the algorithm of Papazachos(2001) has been used. According to this algorithm, the broadseismic zone (e.g., of dimensions 400 km � 400 km), wherethe mainshock is located (e.g., Hokkaido zone in Japan) is
divided using a grid with the desired density (e.g., 0.2� NS,0.2� EW). Each point of the grid is considered as the centerof the elliptical (or circular) critical region, and magnitudesof shocks (preshocks) with epicenters in this region are usedto calculate parameters of relation (1) and the curvature pa-rameter C. Calculations for each point of the grid are re-peated for a large set of values for the azimuth, z, of thelarge ellipse axis, its length, a, ellipticity, e, the start time,ts, of the preshock sequence, the minimum preshock mag-nitude, Mmin, and the magnitude of the mainshock (starting

Global Observational Properties of the Critical Earthquake Model 1845
Table 1Information on the Dates, Geographic Coordinates of the
Epicenter, E, and Magnitudes of the 20 Mainshocks for whichData Have Been Used in the Present Study
Area Date (tc) E(�, k) M Q(�1, k1)
Greece 1 1981, 02, 24 38.2, 22.9 6.7 40.8, 21.92 1981, 12, 19 39.0, 25.3 7.2 41.0, 22.83 1983, 01, 17 38.1, 20.2 7.0 39.0, 19.84 1995, 05, 13 40.2, 21.7 6.6 38.8, 21.05 1995, 06, 15 38.4, 22.2 6.4 38.7, 21.26 1997, 11, 18 37.6, 20.6 6.6 39.4, 21.1
Anatolia7 1995, 10, 01 38.1, 30.2 6.4 38.4, 28.88 1999, 08, 17 40.8, 30.0 7.4 39.6, 28.29 2002, 02, 03 38.7, 31.2 6.5 38.6, 29.6
Himalayas10 1992, 08, 19 42.1, 73.6 7.2 41.4, 72.211 1997, 02, 27 30.0, 68.2 7.1 26.8, 66.212 1997, 11, 08 35.1, 87.4 7.5 35.0, 90.813 2001, 01, 26 23.4, 70.3 7.6 26.4, 72.2
Japan14 1983, 05, 26 40.4, 139.1 7.7 40.2, 139.415 1993, 07, 12 42.8, 139.2 7.7 41.2, 141.016 1994, 10, 04 43.7, 147.7 8.3 44.6, 146.4
California17 1980, 11, 08 41.1, 124.6 7.3 38.4, 125.218 1989, 10, 18 37.0, 121.9 7.0 38.0, 117.019 1992, 04, 25 40.3, 124.2 7.2 38.9, 122.420 1992, 06, 28 34.2, 116.4 7.3 34.8, 120.8
The geographic coordinates are also given for the point, Q, which cor-responds to the best solution and is considered as the center of the criticalregion.
typically from 6.2, up to the magnitude of the largest earth-quake in the zone). Calculations were initially performedwith variable m value, allowing a wide range of m valuesbetween 0.1 and 0.5. The final calculations were made usinga constant m value equal to 0.3, as this was determined fromthe average m value, in very good agreement with theoreticalvalues and laboratory results ranging between 0.25–0.33(Ben-Zion et al., 1999; Guarino et al., 1999; Rundle et al.,2000; Ben-Zion and Lyakhovsky, 2002) and standard prac-tice in similar studies (e.g., Zoller and Hainzl, 2002; Rundleet al., 2003). All grid points with valid solutions (using thecutoff determined for the Aegean area, C � 0.60, with mfixed
� 0.30, and a minimum number of 20 preshocks) are con-sidered and the geographical point, Q, with the smallest Cvalue was considered as the center of the critical region,while the solution (q, C, M, a, z, e, Mmin, n, ts) for this pointwas adopted as the best solution. The application of thisalgorithm was repeated for all 20 cases by considering cir-cular regions, and it was found that the results are very simi-lar for 16 cases. For this reason, the solution for the simplestshape (circular) was adopted in these 16 cases. For the otherfour cases, no valid solutions were found when circularshapes were used. For this reason, the best elliptical solutionfor each of these four cases was adopted. One of these casesconcerns a mainshock along the elongated zone of northAnatolia (case with code number 8 in Tables 1 and 2, with
ellipticity e � 0.9 and major-axis azimuth z � 60�), andthree concern mainshocks in the Indian plate boundary (case10 with e � 0.9, z � 0�; case 11 with e � 0.7, z � 120�;and case 12 with e � 0.7, z � 0�).
Results
Application of the previously described algorithm forthe 20 critical regions resulted in the calculation of appro-priate model parameters, which are listed in Tables 1 and 2.These parameters can be used to derive several empiricalrelations. Figures 2–6 show the critical regions (circular orelliptical), while the inset figures show the correspondingtime variations of the cumulative Benioff strain.
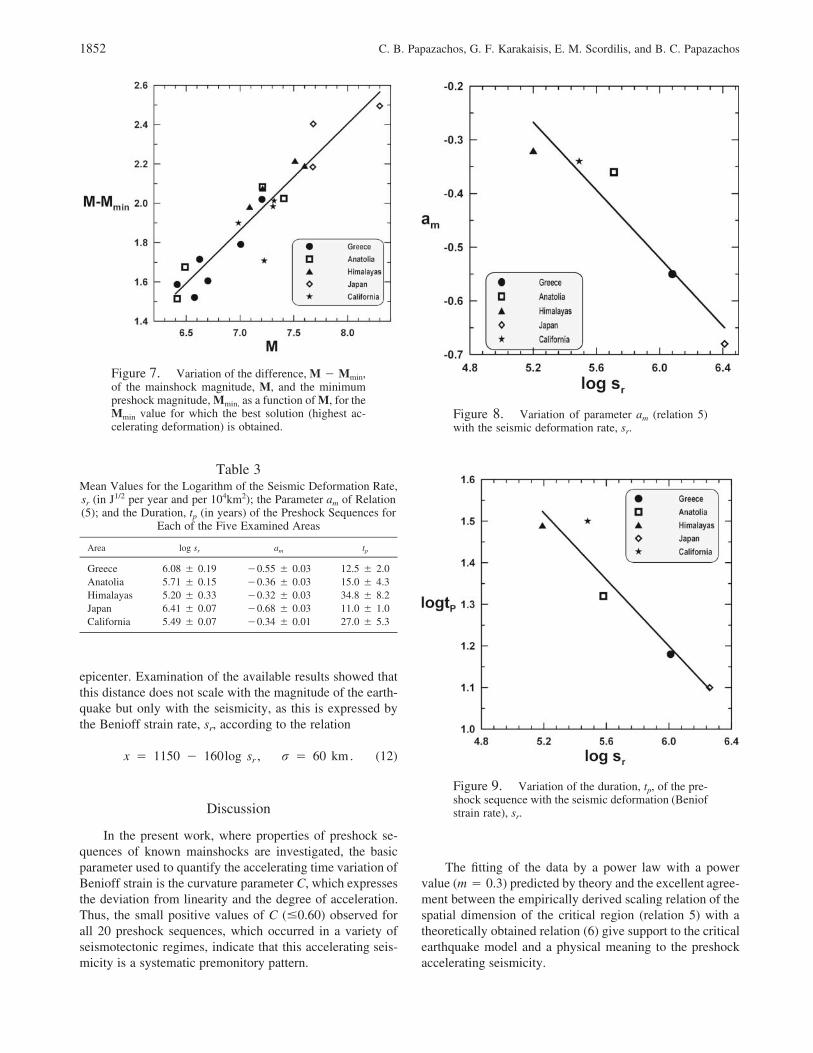
From the estimated values of M* and the minimum pre-shock magnitude, Mmin (Table 2) for which the best solution(smallest C value) was obtained, the following relation canbe derived (Fig. 7):
M* � M � 0.54M* � 1.92, r � 0.08 , (3)min
which is similar to the equation obtained by Papazachos(2003). We made a further attempt to examine the effect ofthe variation of the minimum preshock magnitude on theresults, and we observed that for each mainshock there wasa lower as well as a higher cutoff minimum preshock mag-nitude for which valid solutions (C � 0.60, mfixed � 0.3)still existed. Thus, for the Japanese mainshock of 4 October1994, M 8.3, valid solutions were obtained only for Mmin
between 5.5 and 5.9. The higher minimum-magnitude limitwas clearly a result of the minimum number of preshocks(typically 20), which we imposed in the optimization pro-cedure in order to ensure the reliability of the obtained re-sults (Papazachos and Papazachos, 2000, 2001). Further-more, the lower minimum magnitude verifies the theoreticalresults (Rundle et al., 2000), as well as independent obser-vations (e.g., Jaume, 2000; Karakaisis et al., 2002) that sucha minimum magnitude exists as a slope change above Mmin
in the Gutenberg–Richter distribution during the preshockperiod. Equation (3) verifies that it is the accelerating gen-eration of intermediate-magnitude preshocks that character-izes the critical phenomenon. This observation also explainswhy the time variation of the crustal deformation (Benioffstrain) better expresses the critical phenomenon (Bufe andVarnes, 1993) than other quantities, such as the frequencyof shocks, which is dominated by a large number of smallshocks, or the seismic moment, which is dominated by themagnitudes of the largest preshocks.
Extending the initial results of Bowman et al. (1998),Papazachos and Papazachos (2000) have shown that the ra-dius, R (in km), of the circle with area equal to the area ofthe elliptical critical region, scales with the magnitude, M,of the mainshock according to a relation of the form:
logR � 0.42M � a (4)m

1846 C. B. Papazachos, G. F. Karakaisis, E. M. Scordilis, and B. C. Papazachos
Table 2Information on the Critical Regions of the 20 Mainshocks
Area M* C q A R M13 log Sr Log sr Mmin n ts ti
Greece 1 7.0 0.43 4.6 0.16 247 6.4 7.18 5.90 5.1 33 1972 1980.72 7.4 0.41 6.0 0.40 368 6.8 7.38 5.91 5.4 41 1969 1980.73 7.4 0.44 6.1 0.52 348 6.8 7.50 5.87 5.4 42 1968 1980.74 6.6 0.35 7.9 0.21 167 6.0 7.21 6.27 4.9 48 1984 1993.15 6.5 0.57 4.6 0.18 139 6.0 7.13 6.35 4.9 43 1984 1993.06 6.9 0.45 6.5 0.34 216 6.4 7.31 6.15 5.1 60 1984 1994.8
Anatolia7 6.4 0.24 8.8 0.13 207 5.8 7.01 5.88 4.9 39 1983 1993.08 7.4 0.25 7.0 0.96 621 6.8 7.88 5.80 5.2 124 1986 1996.99 6.6 0.49 4.7 0.21 234 6.1 6.93 5.69 4.9 62 1981 1995.9
Himalayas10 6.9 0.42 5.0 0.39 373 6.2 7.39 5.75 5.1 69 1979 1990.411 7.1 0.59 5.4 0.34 447 6.5 6.91 5.11 5.2 43 1962 1990.712 7.2 0.44 4.6 0.31 454 6.3 6.86 5.05 5.2 37 1961 1994.913 7.6 0.49 5.2 0.49 735 7.0 7.09 4.89 5.5 42 1956 1992.4
Japan14 7.7 0.52 5.3 0.67 393 7.2 8.02 6.43 5.5 76 1972 1981.615 7.5 0.47 5.2 0.12 336 7.1 8.03 6.48 5.1 180 1984 1990.816 8.1 0.46 4.9 2.60 614 7.5 8.35 6.32 5.6 121 1983 1993.2
California17 6.9 0.36 5.0 0.69 356 6.1 6.87 5.59 5.1 32 1962 1977.118 7.1 0.34 8.3 0.52 458 6.4 7.22 5.48 5.1 84 1962 1983.519 7.6 0.48 5.9 0.98 726 7.1 7.46 5.39 5.5 86 1964 1984.320 7.3 0.32 7.8 0.90 529 6.7 7.35 5.50 5.3 89 1955 1988.3
M* is the predicting magnitude, C is the curvature parameter, q is the quality index, A (in 109 J1/2) is theparameter of the power-law relation (1), R (in km) is the radius of the circular critical regions (or the radius ofthe circle with area equal to the area of the elliptical regions for cases 8,10,11,12), M13 is the average magnitudeof the three largest preshocks, Sr (in J1/2/yr) is the long-term Benioff strain rate in the critical region, sr is thesame quantity per 104km2, Mmin is the smallest preshock magnitude, n is the number of preshocks, ts the startyear of the preshock sequence, ti is the identification time.
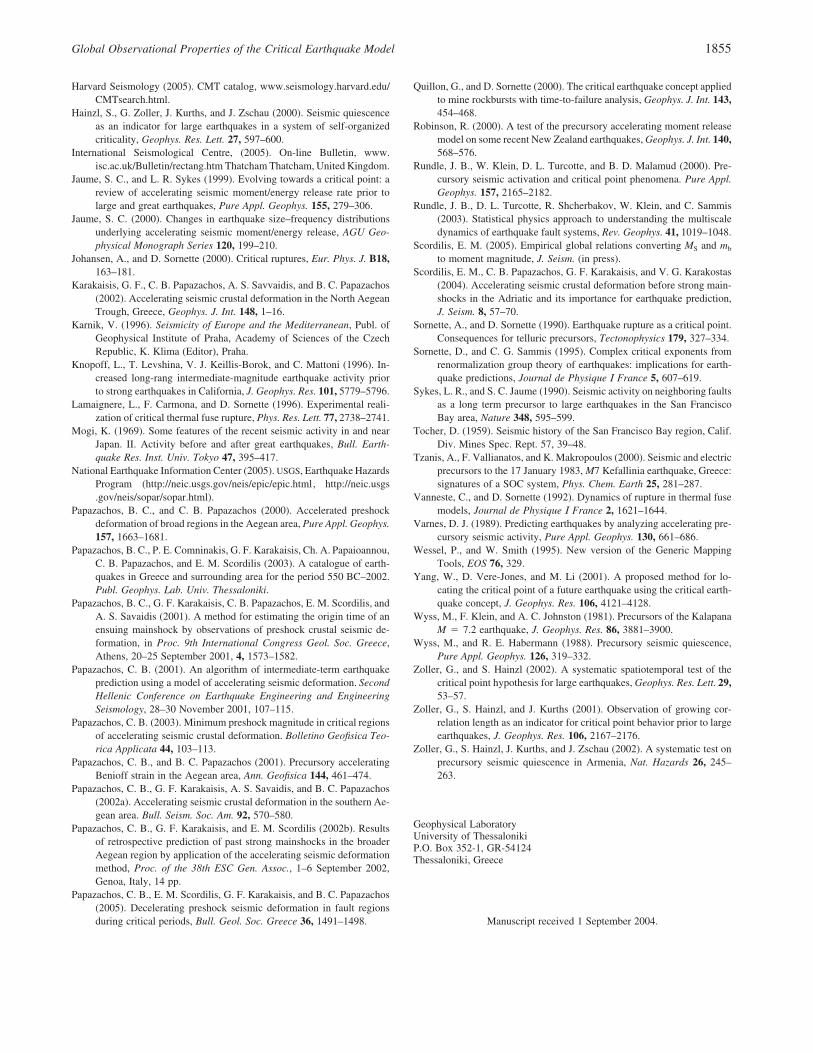
This relation fits a large sample of data (mainshock magni-tude range 4.6–8.6), which concerns elliptical critical re-gions in the Aegean area as well as data for California andother areas presented by Bowman et al. (1998). The valuesof R and M* presented in Table 2 have been used to calculatethe values of am for each of the twenty mainshocks listed inthis table. The mean am value for each of the five areas islisted on Table 3, where the corresponding mean deforma-tion rate, sr (in J1/2/yr and per 104 km2) is also given. Theplot of am as a function of sr is presented in Figure 8, wherea linear relation can be identified (am � 1.38 � 0.32 log sr,r � �0.95). Thus, relation (4) becomes:
log R � 0.42M* � 0.32log s � 1.38, r � 0.11 . (5)r
This equation suggest that the size of a critical region scaleswith both the magnitude of the mainshock, M*, and thelong-term rate of seismic crustal deformation, sr, in the criti-cal region. In particular, this dimension increases with themagnitude of the mainshock but decreases with the rate ofseismic crustal deformation. Hence, the size of a critical re-gion, which corresponds to a mainshock of certain magni-tude is, for example, smallest for Japan, where the crustaldeformation rate is high, larger for Greece, and much largerfor Anatolia, California, and the Himalayas (Fig. 8).
Dobrovolsky et al. (1979) adopted the model of an elas-tic soft inclusion in a more rigid elastic space in order todetermine the region of precursory deformation for a futureearthquake. In their model, they assumed that this region iscentered at the epicenter of the oncoming mainshock andshowed that the mean radius, r (in km), of the region isrelated to the magnitude, M, of the expected earthquake bythe formula:
log r � 0.43M � 0.33log e � 2.73, M � 5.0 (6)
where e is the greatest principal strain. Comparison of theirtheoretical results with observations on several precursoryphenomena (geochemical, resistance, telluric, radon, lighteffects) showed that most precursors were observed for dis-tances corresponding to a strain levels, e, between 10�6 and10�8. The similarity between relation (5), which gives theradius of the critical region, and relation (6), which gives thesize of the preparing region, is striking since in both relationsthe radius scales with the magnitude of the oncoming main-shock and with the deformation measure with almost iden-tical coefficients. Furthermore, by using the values of theparameters am of relation (4) given in Table 3, we can obtainthe corresponding values of e (relation 6), which vary be-

Global Observational Properties of the Critical Earthquake Model 1847
Figure 2. The circular critical regions associated with the preshock acceleratingseismic sequences of six mainshocks (M �6.4) which occurred in Greece. Preshockepicenters are shown by small circles, and the mainshock epicenter is denoted by astar. Numbers and dates correspond to the code numbers and dates in Tables 1 and 2.The inset figures display the time variation of seismic deformation (Benioff strain).
1848 C. B. Papazachos, G. F. Karakaisis, E. M. Scordilis, and B. C. Papazachos
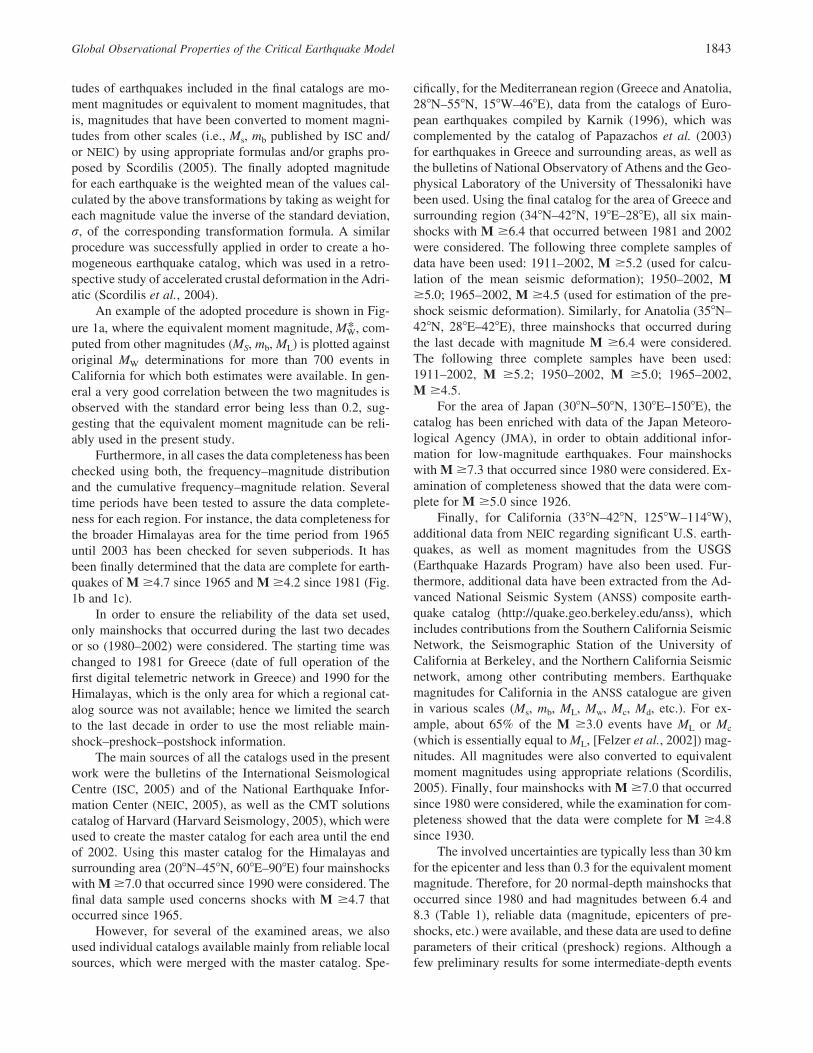
Figure 3. One elliptical and two circular critical regions associated with preshockaccelerating seismic sequences of three mainshocks (M �6.4), which occurred in An-atolia (Turkey). Symbols are as in Figure 1.
tween 10�6.3 and 10�7.3, in agreement with the values of efor which precursory phenomena are observed.
The similarity of equations (5) and (6) should take intoaccount that, despite the fact that Benioff strain is a stablequantity to use in similar studies, as early works (e.g., Var-nes, 1989; Bufe and Varnes, 1993) have shown, it is difficultto assign a clear physical meaning to Benioff strain owingto its divergence when smaller magnitude events are grad-ually included. However, Benioff strain is finite if onlyevents above a threshold value (e.g., Mmin in this work) areconsidered, which are those events that contribute to the ac-celerated deformation phenomenon examined in the presentstudy (equation 3). In this case and for several models, itcan be shown that the Benioff strain is proportional to theclassical strain, e, (e.g., Ben-Zion and Lyakhovsky, 2002),hence log sr and log e have a simple constant shift. In anycase, the similarity of equations (5) and (6) shows that for a
specific model (Dobrovolsky et al., 1979), the scaling rela-tions have a similar dependence not only on the mainshockmagnitude but also on the loading/seismicity rate, as is alsoshown by real data. An important point is that this similarityalso suggests that the critical (preshock) region of an oncom-ing mainshock coincides with its preparing region, whereother geophysical precursors are also observed.
Table 3 presents the mean values of the durations, tp (inyears), of the preshock sequence for each of the five areas.The plot of tp versus sr in Figure (9) shows that the durationof preshock sequences scales with the rate of seismic crustaldeformation according to the relation
log t � 3.87 � 0.45log s , r � 0.10 . (7)p r
Thus, for Japan (highest sr values), the duration of the pre-shock sequence is of the order of 11 years and increases for

Global Observational Properties of the Critical Earthquake Model 1849
Figure 4. Three elliptical regions and one circular critical region associated withthe preshock accelerating seismic sequences of four mainshocks (M �7.1), whichoccurred in the Himalayas area; symbols are as in Figure 1.
lower deformation rates, becoming about 13 years forGreece, 15 years for Anatolia, 27 years for California, and35 years for the Himalayas.
From the values of A, tp, and Sr presented in Table 2,we find that
Alog � 1.01log S , r � 0.04 , (8)r� �tp
which is similar to the relation derived for the Aegean area.This relation suggests that the mean rate of deformation,A/tp , during the accelerating deformation in the critical re-gion is almost equal to the long-term rate of seismic defor-mation, Sr, in the same critical region.
From the values of M* and M13 given in Table 2, thefollowing relation can be derived:
M* � M � 0.60, r � 0.15. (9)13
This simple formula constitutes an important constraint tothe critical earthquake model and can be used for an inde-pendent estimation of the magnitude of an ensuing main-shock. A linear relation between the magnitude of a main-shock and the mean magnitude of the three largest shocksof preshock swarms has also been proposed by Evison andRhoades (1997).
We should note that the results previously presentedwere recomputed using the highest q value (equation 2),where the smallest C value is combined with the highest Pvalue, as this is determined from the compatibility of theobserved accelerated deformation behavior with the prelim-inary form of equations (5), (7), (8), and (9). This is clearlyseen in Figure 10, where the spatial distribution of the C andQ values is presented for event 15 of Table 1. A muchsharper peak of the q value is observed close to the epicenterthan of the C value, verifying the usefulness of the q param-eter in the search for valid accelerated deformation patterns.
1850 C. B. Papazachos, G. F. Karakaisis, E. M. Scordilis, and B. C. Papazachos
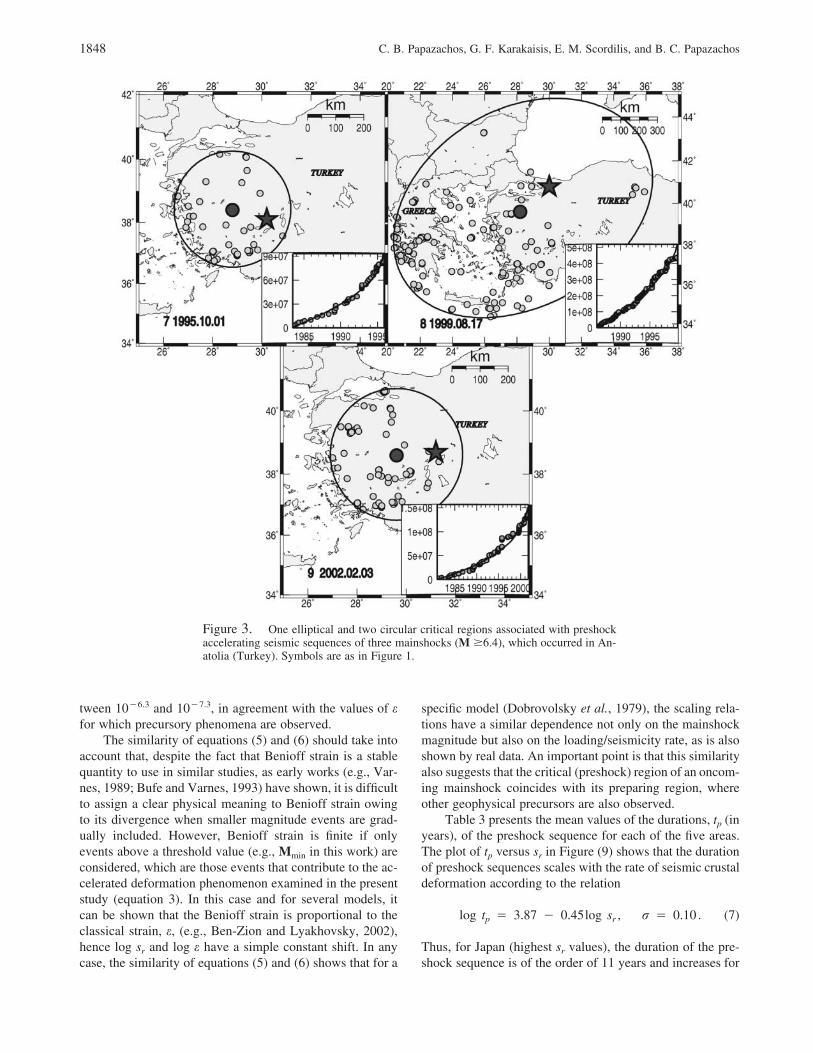
Figure 5. The circular critical regions associated with the preshock acceleratingseismic sequences of three mainshocks (M �7.3), which occurred in Japan; symbolsare as in Figure 1.
Valid accelerating seismic deformation (C � 0.60, m �0.30) cannot be identified until a certain time, ti (before theorigin time of the mainshock), which can be considered asthe identification time. This is the earliest time up to whenthe available data of a preshock sequence give a valid so-lution, and it is usually associated with a seismic excitation(Papazachos et al., 2001). To estimate the identification timeof a preshock sequence before the generation of the main-shock, the following procedure is applied. Considering sev-eral assumed values, Tc, for the unknown origin time of themainshock (e.g., in steps of 1 month), we let the programtry to fit relation (1) to the data until the first valid solution
is obtained. At this time, the assumed origin time has a value,Ti , which corresponds to a value, ti , of the time up to whenpreshock data have been used and which is the identificationtime. In the last column of Table 2, the values of ti deter-mined by this procedure are given for each one of the 20preshock sequences. From the values of ti given in Table 2,it is clear that the difference tc � ti also scales with the long-term seismicity rate sr, with a scaling coefficient (slope)similar to the total preshock duration, tp (relation 7). Thescaling coefficient of the corresponding linear relation is�0.43, hence practically identical to that of equation (7),which applies for the total preshock duration. For this rea-

Global Observational Properties of the Critical Earthquake Model 1851
Figure 6. The circular critical regions associated with the preshock accelerating seis-mic sequences of four mainshocks (M �7.0) in California; symbols are as in Figure 1.
son, we adopted the same scaling coefficient (�0.45), andfrom the listed values the following relation was obtained:
log(t � t ) � 3.08 � 0.45log s , r � 0.24. (10)c i r
Comparing equation (10) with equation (7) shows that theratio of the duration of the identification period, tc � ti , is�16% of the total duration, tp, of the preshock sequence, inagreement with previous results concerning preshock se-quences in the Aegean area (Papazachos et al., 2002b), as
well as with the value (0.17) determined by an independentmethod and data (Yang et al., 2001). Relation (10) can takethe form
t � t � exp(7.09 � 1.04log s ), r � 1.7 years , (11)c i r
which can be also used to estimate the origin time, tc, of anoncoming mainshock.
It is interesting to examine the average distance of thepoint where the highest q value is observed from the true
1852 C. B. Papazachos, G. F. Karakaisis, E. M. Scordilis, and B. C. Papazachos
Figure 7. Variation of the difference, M � Mmin,of the mainshock magnitude, M, and the minimumpreshock magnitude, Mmin, as a function of M, for theMmin value for which the best solution (highest ac-celerating deformation) is obtained.
Table 3Mean Values for the Logarithm of the Seismic Deformation Rate,sr (in J1/2 per year and per 104km2); the Parameter am of Relation(5); and the Duration, tp (in years) of the Preshock Sequences for
Each of the Five Examined Areas
Area log sr am tp
Greece 6.08 � 0.19 �0.55 � 0.03 12.5 � 2.0Anatolia 5.71 � 0.15 �0.36 � 0.03 15.0 � 4.3Himalayas 5.20 � 0.33 �0.32 � 0.03 34.8 � 8.2Japan 6.41 � 0.07 �0.68 � 0.03 11.0 � 1.0California 5.49 � 0.07 �0.34 � 0.01 27.0 � 5.3
Figure 8. Variation of parameter am (relation 5)with the seismic deformation rate, sr.
Figure 9. Variation of the duration, tp, of the pre-shock sequence with the seismic deformation (Beniofstrain rate), sr.
epicenter. Examination of the available results showed thatthis distance does not scale with the magnitude of the earth-quake but only with the seismicity, as this is expressed bythe Benioff strain rate, sr, according to the relation
x � 1150 � 160log s , r � 60 km. (12)r
Discussion
In the present work, where properties of preshock se-quences of known mainshocks are investigated, the basicparameter used to quantify the accelerating time variation ofBenioff strain is the curvature parameter C, which expressesthe deviation from linearity and the degree of acceleration.Thus, the small positive values of C (�0.60) observed forall 20 preshock sequences, which occurred in a variety ofseismotectonic regimes, indicate that this accelerating seis-micity is a systematic premonitory pattern.
The fitting of the data by a power law with a powervalue (m � 0.3) predicted by theory and the excellent agree-ment between the empirically derived scaling relation of thespatial dimension of the critical region (relation 5) with atheoretically obtained relation (6) give support to the criticalearthquake model and a physical meaning to the preshockaccelerating seismicity.

Global Observational Properties of the Critical Earthquake Model 1853
Figure 10. Comparison of the spatial variation of the C (a) and q (b) values for the1993 M 7.7 Hokkaido Nansei-Oki earthquake in Japan (event 15 in Table 1). A muchsharper high-value peak close to the epicenter (solid circle) is observed for the q dis-tribution.
The results of the present work can be of importancefor intermediate-term earthquake prediction research, be-cause the magnitude, the origin time, and their uncertaintiesfor an oncoming mainshock can be estimated by relationsthat express properties of the critical earthquake model. Bysuch relations, useful information can also be obtained forthe epicenter of an oncoming mainshock, which can lead tothe estimation of the epicenter coordinates and their uncer-tainties, in combination with other data.
The magnitude of an ensuing mainshock can be esti-mated by relations (5) and (9). Comparison of the magni-tudes estimated by this method (M* in Table 2) with ob-served magnitudes (M in Table 1) shows differences rangingbetween �0.4 and 0.4, with a mean difference about zeroand a standard deviation of 0.22. This result indicates thatthe magnitude of an oncoming mainshock can probably beestimated with a maximum error of � 0.4 with a high con-fidence (� 95%).
Relations (10) and (11) can be used to estimate the or-igin time of an ensuing mainshock because the identificationtime, ti , can be estimated from properties of the preshocksequence. The uncertainties in these relations (r � 1.7 yrs)indicate that the origin time of the ensuing mainshock canprobably be estimated by this method with an error of �3.4yrs with high confidence (�95%).
It should be pointed out that there are a few additionalevents in the specific time–magnitude–space windows pre-viously defined for each study area, for which results are notpresented in this work. In most cases (e.g., five cases inGreece, one in Anatolia, and one in Japan), these events arenormal aftershocks or foreshocks (one case in Greece),where the process is controlled by the mainshock and noaccelerated deformation pattern can be identified and sepa-rated for these events. The same is true for the 16 October
1999, M 7.1, Hector Mine event in California, which can beconsidered as a late aftershock of the Landers 1992, M 7.3,mainshock. Moreover, no identification of accelerated de-formation was possible for the 28 December 1994, M 7.7,event, which occurred immediately after the big 4 October1994, M 8.3, Shikotan event in Japan (event 16 in Table 1)within its critical region, as well as for the 1 November 1989,M 7.4 event, which again fell in the critical region of the 26May 1983, M 7.7 (event 14 in Table 1), and occurred withina few years after the previous larger event (M 7.7) withinits critical region. Hence, it appears that it is impossible toidentify an accelerated deformation pattern for smaller mag-nitude events within the critical region or for a few yearsafter the generation of a large mainshock such as the bigShikotan 1994 event, as the pattern of the mainshock dom-inates and does not allow the grid-search algorithm to iden-tify and separate the phenomena for the later, smaller mag-nitude event. This observation sets a limit on the possiblepredictive ability of the described pattern, as the method isblind for a few years after the generation of a large main-shock, at least within its critical region.
The information given in the present work shows thatidentification of accelerated deformation is not enough forlocating the epicenter of an oncoming mainshock, with areasonable accuracy, since the epicenter tends to lie at a dis-tance (equation 12) from the best solution (point Q). Similarresults have been obtained by other researchers (Robinson,2000), who have examined cases where the center of thecritical region (maximum q value in our grid search) doesnot coincide with the mainchock epicenter. A possible physi-cal explanation for this bias (relation 12) could be the factthat a large number of observations suggest that deceleratingseismic deformation (quiescence) occurs in the narrowerrupture zone of an ensuing mainshock (Wyss et al., 1981;

1854 C. B. Papazachos, G. F. Karakaisis, E. M. Scordilis, and B. C. Papazachos
Figure 11. Variation of the cumulative Benioffstrain for the narrower seismogenic source region ofthe 1993 M 7.7 Hokkaido Nansei-Oki earthquake inJapan (elliptical area in Fig. 10). A clear deceleratingpattern is observed, in contrast to the accelerating de-formation pattern of the broader critical region (cir-cular area in the upper right part of Fig. 5).
Wyss and Habermann, 1988; Hainzl et al., 2000; Zoller etal., 2002; Papazachos et al., 2005). Thus, the epicenter zoneof the mainshock where decelerating deformation occursduring the critical period has the tendency to push the bestsolution obtained from the grid-search algorithm away fromthe center of the region where accelerating deformation oc-curs (see Fig. 10), as this is seen by relation (12). This isclearly seen in Figure 11, where the variation of the cumu-lative Benioff strain is shown for the same event examinedin Figure 10, for a narrower seismogenic source area (ellip-tical region in Fig. 10). A clearly decelerating pattern is ob-served, and we can easily apply equation (1) with an expo-nent m �1 in an attempt to model this decelerating(quiescence) behavior. This observation and equation (12)suggest that the results obtained in this work should be com-bined with independent information (decelerating seismicityin the rupture zone, location of active faults, etc.) to locatethe epicenter of an oncoming mainshock with a higher ac-curacy.
The procedure followed in the present work must beapplied to future mainshocks in order to test its capabilitymore objectively. It must be noticed that the identificationof the critical region of an ensuing mainshock has to bebased on the spatial distribution of the values of the qualityparameter q(� P/[C*m]), because it expresses the degree ofaccelerating seismicity (through C), the degree of fit of ob-servations to a power law (through m), and the degree ofagreement of properties of the examined region to preshockproperties expressed by relations (5, 7, 8, and 9) through P.
We should also point out that the critical region of anoncoming mainshock, where a preshock accelerating defor-mation is observed, coincides with the preparing region forthis earthquake, where other precursory phenomena are ob-served. This is of importance from a practical point of view,because these regions, which are easily defined by themethod presented in the present article, can be searched toidentify other precursors of oncoming mainshocks.
Acknowledgments
We would like to thank two anonymous reviewers for their construc-tive comments and suggestions, which helped to improve our work. Thanksare also due to Wessel and Smith (1995) for their generous distribution ofthe GMT software, which was used to generate some of the figures of thisstudy. This work has been partly financed by the Greek Earthquake Plan-ning & Protection Organization (OASP) under project 20242 and the Py-thagoras EPEAEK project 21945 Aristotle Univ. Thessaloniki ResearchCommittee, and it is Geophysical Lab. Univ. Thessaloniki contribution#631/2003.
References
Allegre, C. J., and J. L. Le Mouel (1994). Introduction of scaling techniquesin brittle failure of rocks, Phys. Earth Planet. Interiors 87, 85–93.
Andersen, J. V., D. Sornette, and K. T. Leung (1997). Tri-critical behaviorin rupture induced by disorder, Phys. Rev. Lett. 78, 2140–2143.
Ben-Zion, Y., K. Dahmen, V. Lyakhovsky, D. Ertas, and A. Agnon 1999.Self-driven mode switching of earthquake activity on a fault system.Earth Planet. Sci. Lett. 172, 11–21.
Ben-Zion, Y., and V. Lyakhovsky (2002). Accelerated seismic release andrelated aspects of seismicity patterns on earthquake faults, Pure Appl.Geophys. 159, 2385–2412.
Bowman, D. D., G. Quillon, C. G. Sammis, A. Sornette, and D. Sornette(1998). An observational test of the critical earthquake concept, J.Geophys. Res. 103, no. 24, 372.
Bowman, D. D., and G. C. King (2001). Stress transfer and seismicitychanges before large earthquakes, CR Acad. Sci., Series IIA, EarthPlanet. Sci. 333, 591–599.
Brehm, D. J., and L. W. Braile (1998). Intermediate-term earthquake pre-diction using precursory events in the New Madrid seismic zone,Bull. Seism. Soc. Am. 103, 24,359–24,372.
Brehm, D. J., and L. W. Braile (1999). Refinement of the modified time-to-failure method for intermediate-term earthquake prediction,J. Seism. 3, 121–138.
Bufe, C. G., and D. J. Varnes (1993). Predictive modeling of seismic cycleof the greater San Francisco Bay region, J. Geophys. Res. 98, 9871–9883.
Dobrovolsky, J. P., S. I. Zubkov, and B. J. Miachkin (1979). Estimation ofthe size of earthquake preparation zones, Pure Appl. Geophys. 117,1025–1044.
Evison, F. F., and D. A. Rhoades (1997). The precursory earthquake swarmin New Zealand. N.Z. J. Geol. Geophys. 40, 537–547.
Felzer, K. R., T. W. Becker, R. E. Abercrombie, G. Ekstrom, and J. R. Rice(2002). Triggering of the 1999 Mw 7.1 Hector Mine earthquake byaftershocks of the 1992 Mw 7.3 Landers earthquake. J. Geophys. Res.107, 2190, doi 10.1029/2001JB000911.
Gross, S., and J. Rundle (1998). A systematic test of the time-to-failureanalysis, Geophys. J. Int. 133, 57–64.
Guarino, A. S., S. Ciliberto, and A. Garcimartin (1999). Failure time andmicrocrack nucleation, Europhys. Lett. 47, 456–461.
Guarino, A. S., S. Ciliberto, A. Garcimartin, M. Zei, and R. Scorretti (2002).Failure time and critical behaviour of fracture precursors in hetero-geneous materials, Eur. Phys. J. 26, 141–151.
Global Observational Properties of the Critical Earthquake Model 1855
Harvard Seismology (2005). CMT catalog, www.seismology.harvard.edu/CMTsearch.html.
Hainzl, S., G. Zoller, J. Kurths, and J. Zschau (2000). Seismic quiescenceas an indicator for large earthquakes in a system of self-organizedcriticality, Geophys. Res. Lett. 27, 597–600.
International Seismological Centre, (2005). On-line Bulletin, www.isc.ac.uk/Bulletin/rectang.htm Thatcham Thatcham, United Kingdom.
Jaume, S. C., and L. R. Sykes (1999). Evolving towards a critical point: areview of accelerating seismic moment/energy release rate prior tolarge and great earthquakes, Pure Appl. Geophys. 155, 279–306.
Jaume, S. C. (2000). Changes in earthquake size–frequency distributionsunderlying accelerating seismic moment/energy release, AGU Geo-physical Monograph Series 120, 199–210.
Johansen, A., and D. Sornette (2000). Critical ruptures, Eur. Phys. J. B18,163–181.
Karakaisis, G. F., C. B. Papazachos, A. S. Savvaidis, and B. C. Papazachos(2002). Accelerating seismic crustal deformation in the North AegeanTrough, Greece, Geophys. J. Int. 148, 1–16.
Karnik, V. (1996). Seismicity of Europe and the Mediterranean, Publ. ofGeophysical Institute of Praha, Academy of Sciences of the CzechRepublic, K. Klima (Editor), Praha.
Knopoff, L., T. Levshina, V. J. Keillis-Borok, and C. Mattoni (1996). In-creased long-rang intermediate-magnitude earthquake activity priorto strong earthquakes in California, J. Geophys. Res. 101, 5779–5796.
Lamaignere, L., F. Carmona, and D. Sornette (1996). Experimental reali-zation of critical thermal fuse rupture, Phys. Res. Lett. 77, 2738–2741.
Mogi, K. (1969). Some features of the recent seismic activity in and nearJapan. II. Activity before and after great earthquakes, Bull. Earth-quake Res. Inst. Univ. Tokyo 47, 395–417.
National Earthquake Information Center (2005). USGS, Earthquake HazardsProgram (http://neic.usgs.gov/neis/epic/epic.html, http://neic.usgs.gov/neis/sopar/sopar.html).
Papazachos, B. C., and C. B. Papazachos (2000). Accelerated preshockdeformation of broad regions in the Aegean area, Pure Appl. Geophys.157, 1663–1681.
Papazachos, B. C., P. E. Comninakis, G. F. Karakaisis, Ch. A. Papaioannou,C. B. Papazachos, and E. M. Scordilis (2003). A catalogue of earth-quakes in Greece and surrounding area for the period 550 BC–2002.Publ. Geophys. Lab. Univ. Thessaloniki.
Papazachos, B. C., G. F. Karakaisis, C. B. Papazachos, E. M. Scordilis, andA. S. Savaidis (2001). A method for estimating the origin time of anensuing mainshock by observations of preshock crustal seismic de-formation, in Proc. 9th International Congress Geol. Soc. Greece,Athens, 20–25 September 2001, 4, 1573–1582.
Papazachos, C. B. (2001). An algorithm of intermediate-term earthquakeprediction using a model of accelerating seismic deformation. SecondHellenic Conference on Earthquake Engineering and EngineeringSeismology, 28–30 November 2001, 107–115.
Papazachos, C. B. (2003). Minimum preshock magnitude in critical regionsof accelerating seismic crustal deformation. Bolletino Geofisica Teo-rica Applicata 44, 103–113.
Papazachos, C. B., and B. C. Papazachos (2001). Precursory acceleratingBenioff strain in the Aegean area, Ann. Geofisica 144, 461–474.
Papazachos, C. B., G. F. Karakaisis, A. S. Savaidis, and B. C. Papazachos(2002a). Accelerating seismic crustal deformation in the southern Ae-gean area. Bull. Seism. Soc. Am. 92, 570–580.
Papazachos, C. B., G. F. Karakaisis, and E. M. Scordilis (2002b). Resultsof retrospective prediction of past strong mainshocks in the broaderAegean region by application of the accelerating seismic deformationmethod, Proc. of the 38th ESC Gen. Assoc., 1–6 September 2002,Genoa, Italy, 14 pp.
Papazachos, C. B., E. M. Scordilis, G. F. Karakaisis, and B. C. Papazachos(2005). Decelerating preshock seismic deformation in fault regionsduring critical periods, Bull. Geol. Soc. Greece 36, 1491–1498.
Quillon, G., and D. Sornette (2000). The critical earthquake concept appliedto mine rockbursts with time-to-failure analysis, Geophys. J. Int. 143,454–468.
Robinson, R. (2000). A test of the precursory accelerating moment releasemodel on some recent New Zealand earthquakes, Geophys. J. Int. 140,568–576.
Rundle, J. B., W. Klein, D. L. Turcotte, and B. D. Malamud (2000). Pre-cursory seismic activation and critical point phenomena. Pure Appl.Geophys. 157, 2165–2182.
Rundle, J. B., D. L. Turcotte, R. Shcherbakov, W. Klein, and C. Sammis(2003). Statistical physics approach to understanding the multiscaledynamics of earthquake fault systems, Rev. Geophys. 41, 1019–1048.
Scordilis, E. M. (2005). Empirical global relations converting MS and mb
to moment magnitude, J. Seism. (in press).Scordilis, E. M., C. B. Papazachos, G. F. Karakaisis, and V. G. Karakostas
(2004). Accelerating seismic crustal deformation before strong main-shocks in the Adriatic and its importance for earthquake prediction,J. Seism. 8, 57–70.
Sornette, A., and D. Sornette (1990). Earthquake rupture as a critical point.Consequences for telluric precursors, Tectonophysics 179, 327–334.
Sornette, D., and C. G. Sammis (1995). Complex critical exponents fromrenormalization group theory of earthquakes: implications for earth-quake predictions, Journal de Physique I France 5, 607–619.
Sykes, L. R., and S. C. Jaume (1990). Seismic activity on neighboring faultsas a long term precursor to large earthquakes in the San FranciscoBay area, Nature 348, 595–599.
Tocher, D. (1959). Seismic history of the San Francisco Bay region, Calif.Div. Mines Spec. Rept. 57, 39–48.
Tzanis, A., F. Vallianatos, and K. Makropoulos (2000). Seismic and electricprecursors to the 17 January 1983, M7 Kefallinia earthquake, Greece:signatures of a SOC system, Phys. Chem. Earth 25, 281–287.
Vanneste, C., and D. Sornette (1992). Dynamics of rupture in thermal fusemodels, Journal de Physique I France 2, 1621–1644.
Varnes, D. J. (1989). Predicting earthquakes by analyzing accelerating pre-cursory seismic activity, Pure Appl. Geophys. 130, 661–686.
Wessel, P., and W. Smith (1995). New version of the Generic MappingTools, EOS 76, 329.
Yang, W., D. Vere-Jones, and M. Li (2001). A proposed method for lo-cating the critical point of a future earthquake using the critical earth-quake concept, J. Geophys. Res. 106, 4121–4128.
Wyss, M., F. Klein, and A. C. Johnston (1981). Precursors of the KalapanaM � 7.2 earthquake, J. Geophys. Res. 86, 3881–3900.
Wyss, M., and R. E. Habermann (1988). Precursory seismic quiescence,Pure Appl. Geophys. 126, 319–332.
Zoller, G., and S. Hainzl (2002). A systematic spatiotemporal test of thecritical point hypothesis for large earthquakes, Geophys. Res. Lett. 29,53–57.
Zoller, G., S. Hainzl, and J. Kurths (2001). Observation of growing cor-relation length as an indicator for critical point behavior prior to largeearthquakes, J. Geophys. Res. 106, 2167–2176.
Zoller, G., S. Hainzl, J. Kurths, and J. Zschau (2002). A systematic test onprecursory seismic quiescence in Armenia, Nat. Hazards 26, 245–263.
Geophysical LaboratoryUniversity of ThessalonikiP.O. Box 352-1, GR-54124Thessaloniki, Greece
Manuscript received 1 September 2004.


![Journal of Seismology Volume 10 Issue 2 2006 [Doi 10.1007%2Fs10950-006-9012-4] E. M. Scordilis -- Empirical Global Relations Converting M S and m b to Moment Magnitude](https://img.dokumen.tips/doc/110x75/55cf9aac550346d033a2d5f4/journal-of-seismology-volume-10-issue-2-2006-doi-1010072fs10950-006-9012-4.jpg)