Embed Size (px)
Citation preview

MALAYSIA TOURISM AND ECONOMIC GROWTH:
INPUT OUTPUT ANALYSIS
By
ANUSUYA A/P RAVINDRAN
MASTER OF ECONOMIC
UNIVERSITI UTARA MALAYSIA
December 2014

MALAYSIA TOURISM AND ECONOMIC GROWTH:
INPUT OUTPUT ANALYSIS
By
ANUSUYA A/P RAVINDRAN
Thesis Submitted to
Othman Yeop Abdullah Graduate School of Business,
Universiti Utara Malaysia,
In Fulfillment of the Requirement for the Master of Economic.

PERMISSION TO USE
In presenting this project paper in partial fulfilment of the requirements for a Post
Graduate degree from the Universiti Utara Malaysia (UUM), I agree that the Library
of this university may make it freely available for inspection. I further agree that
permission for copying this project paper in any manner, in whole or in part, for
scholarly purposes may be granted by my supervisor or in their absence, by the Dean
of Othman Yeop Abdullah Graduate School of Business where I did my project
paper. It is understood that any copying or publication or use of this project paper
parts of it for financial gain shall not be allowed without my written permission. It is
also understood that due recognition shall be given to me and to the UUM in any
scholarly use which may be made of any material in my project paper.
Request for permission to copy or to make other use of materials in this project paper
in whole or in part should be addressed to:
Dean of Othman Yeop Abdullah Graduate School of Business
Universiti Utara Malaysia
06010 UUM Sintok
Kedah Darul Aman

ABSTRACT
Tourism sector is an important sector that many countries are focusing on the
development of tourism sector. There are many studies show there is a significant
relationship between tourism sector and economic growth. The objective of this
study is to see how significant the tourism sector extension would give impact on the
Malaysia GDP and other macroeconomics aspects. The method used in this study is
input output analysis. Using Malaysia input output table 2010, the 124 commodities
were aggregated into main sectors in Malaysia and disaggregate the tourism sector.
After that, the technical coefficient were calculate to the see the direct requirement of
input needed by the sector to produce outputs. Then the multiplier effect which is the
output multiplier and export of tourism sector multiplier and also the backward and
forward linkages between tourism and non-tourism sectors in Malaysia. The
multipliers shows that the tourism sector contributes to Malaysia economic by
generating output and the export of tourism sector. Besides that, the interlinkages
between sectors shows that there are strong linkages between tourism sectors with
other sectors. It creates the demand and supply of outputs that can stimulates the
economy.

ABSTRAK
Sektor pelancongan adalah penting bagi negara yang mementingkan pembangunan
ekonomi. Banyak kajian menunjukkan terdapat hubungan signifikasi di antara sektor
pelancongan dan pertumbuhan ekonomi. Objektif kajian ini ialah untuk melihat
sejauh mana pembangunan sektor pelancongan memberi kesan terhadap
pertumbuhan ekonomi dan aspek makroekonomi yang lain. Keadah kajian yang
digunakan adalah analysis input output. Dengan menggunakan jadual input output
2010, 124 komoditi telah diagregatkan kepada 8 sektor di malaysia dan sektor
pelancongan dipisahkan. Kemudian kesan pengganda and hubungan antara sektor
telah dikaji. Kesan pengganda menunjukan sektor pelancongan kepada pengeluaran
dan eksport sector pelancongan. Selain itu, hubungan yang kuat diantara sektor telah
diperolehi dimana permintaan dan penawaran pengeluaran akan membantu dalam
pertumbuhan ekonomi.

ACKNOWLEDGEMENT
First and foremost, my humble gratitude and appreciation to God , for enabling me
proceed with this Project Paper work until its final form.
I am greatly indebted to my supervisor, Dr Mukaramah binti Harun who has made a
significant contribution until the completion of this research and deserves special
thanks for her kindness, patient, generosity and guidance when supervising my work.
My thanks also to my examiner, Dr .............................................................................
for his/her support in order to make this research more meaningful.
Finally, special respects and thanks to my beloved father, Mr. Ravindran Kannan
who inspires me to succeed now and hereafter. My special respects and thanks also
goes to my mother, Mrs. Murugasevary Raman for her unconditional love and
encouragement, and for my family and friends for being supportive throughout my
study at University Utara Malaysia.
Last but not least, I am grateful to God for giving me faith, will and strength to
complete my study.
Thank you.

TABLE OF CONTENT
CERTIFICATION OF THESIS WORK
PERMISSION TO USE
ABSTRACT
ABSTRAK
ACKNOWLEDGEMENT
TABLE OF CONTENTS
LIST OF TABLE
LIST OF FIGURES
1. CHAPTER 1: INTRODUCTION 1
1.1. INTRODUCTION 1
1.1.1. HISTORY OF MALAYSIA TOURISM 3
1.1.2. CONTRIBUTION OF MALAYSIA TOURISM 5
1.2. PROBLEM STATEMENT 14
1.3. OBJECTIVE OF STUDY 17
1.3.1. GENERAL OBJECTIVE 17
1.3.2. SPESIFIC OBJECTIVES 18
1.4. SCOPE AND LIMITATION 18
1.5. SIGNIFICANT OF STUDY 19
1.6. STUDY OUTLINE 20
2. CHAPTER 2: LITERATURE REVIEW 21
2.1. INTRODUCTION 21
2.2. OVERVIEW OF INTERNATIONAL TOURISM 21
2.3. OVERVIEW OF MALAYSIA TOURISM 23
2.4. EMPIRICAL REVIEW ON RELATIONSHIP BETWEEN TOURISM
AND ECONOMIC GROWTH 23
2.4.1. INPUT OUTPUT ANALYSIS 23
2.4.2. COMPUTABLE GENERAL EQUILIBRIUM (CGE) 27
2.4.3. CAUSALITY TEST 29
2.5. INPUT OUTPUT TABLE 29
2.6. MULTIPLIER EFFECT 31
2.7. FORWARD AND BACKWARD LINKAGES 32

2.8. CONCLUSION 33
3. CHAPTER 3: METHODOLOGY 34
3.1. INTRODUCTION 34
3.2. DATA RESOURCES 34
3.3. TYPE OF STUDY 35
3.4. TECHNIQUE OF DATA ANALYSIS 35
3.5. BASIC INPUT OUTPUT ANALYSIS 38
3.6. TOURISM MULTIPLIERS 41
3.6.1. OUTPUT MULTIPLIER 42
3.6.2. EXPORT OF TOURISM MULTIPLIER 43
3.7. INTERLINKAGES BETWEEN TOURISM AND NON TOURISM
SECTOR 43
4. CHAPTER 4 : RESULT AND DICUSSION 45
4.1. INTRODUCTION 45
4.2. TECHNICAL COEFFICIENT 45
4.3. MULTIPLIER EFFECTS 48
4.3.1. OUTPUT MULTIPLIER 49
4.3.2. EXPORT OF TOURISM SECTOR 51
4.4 INTERLINKAGES BETWEEN TOURISM AND NON
TOURISM SECTORS 53
5. CHAPTER 5 : CONCLUSION AND RECOMMENDATION 56
5.1 INTRODUCTION 56
5.2 SUMMARY OF FINDING 56
5.2.1 RESEARCH SUMMARY 56
5.2.2 FINDING SUMMARY 57
5.2.2.1 OBJECTIVE ONE 57
5.2.2.2 OBJECTIVE TWO 57
5.3 RESEARCH IMPLICATION 58
5.3.1 RESEARCHERS AND ACADEMICIANS 58
5.3.2 MINISTRY OF TOURISM 58
5.3.3 PRIVATE SECTOR, LOCAL BUSINESSES AND
PEOPLE 59
5.4 RECOMMENDATION 59
5.5 CONCLUSION 61

REFERENCE 63
APPENDIX 68

List of Table
Table 1.1 Tourist Arrival and Receipts in Malaysia 6
Table 1.2 Top Ten Tourist Arrival by Countries Nationality 2012 7
Table 1.3 Key of Statistic of Domestic Tourism 2012 and 2013 8
Table 1.4 National and International Tourism Expenditure 10
Table 1.5 Hotel Occupancy Rate by 2012 and 2013 12
Table 1.6 Employment in Tourism Sector 2005-2008 13
Table 1.7 Contribution of Tourism Sector to GDP 14
Table 1.8 Contribution of Tourism to Malaysia Employment 16
Table 4.1 Output Multiplier of Main Sectors in Malaysia 50
Table 4.2 Output Multiplier of Tourism Subsectors in Malaysia 51
Table 4.3 Export of Tourism Multiplier Main Sectors in Malaysia 52
Table 4.4 Export of Tourism Multiplier of Tourism Subsectors in Malaysia 53
Table 4.5 Backward And Forward Linkages Between Sectors in Malaysia. 54

List of Figure
Figure 3.1 Flow of Data Analysis 37
Figure 3.2 A General Structure of Input Output Table. 38
1
CHAPTER 1
INTRODUCTION
1.1 Introduction
For past six decades, international tourism have shown a huge development and also
experiencing continued diversification. Experiencing continued expansion tourism is
becoming one of the largest and significantly growing economic sector. International
tourist arrivals grew by 5% in 2013 which is 1087 million arrival worldwide. This
shows an increment from year 2012 with 1035 million arrival million (UNWTO,
2014). Tourism industry which already growing since ancient time found successful
in generating income of a countries. Number of tourist destination are growing
bigger and bigger. According to Khaleed (2009), tourism is one of the method to
overcome macroeconomic problems. By focusing in tourism sector brings promising
benefits to the country as it is one of the tool to generators of income and
employment creation. Tourism based development plays a vital pivotal role in
contributing to its GDP growth both in developed and developing countries.
Nowadays many countries focusing on tourism sector as a tool to develop their
countries in term of many facets. Countries mainly developing countries are
promoting and sustaining a world class tourism to generate economic growth.
Developing countries are trying to enact policies to improve their tourism industry as
a tool to develop their foreign exchange earnings. Malaysia are never left out in
promoting their tourism in many ways. According to Elsadig and Abdur (2011) said
that Malaysia is becoming of the leading tourist destination competing with other
2
popular tourist spots around the world. Besides that, those countries worldwide,
including Malaysia, have a successful tourism sector, is often measured in dollars or
specifically by the number of international tourist arrived and the income they bring
in (Baharuddin, Ahmad, Jamil & Kong, 2000)
Malaysia is located in south East Asia and divided into peninsula Asian mainland
and third of Borneo Island. Malaysia have total land mass of 329,845 square
kilometres (127,354 sq. mi). Geographically Malaysia having 11 states with 2
federals territories (Kuala Lumpur and Putrajaya) form peninsular Malaysia.
Peninsular Malaysia is separated by the South China Sea from east Malaysia which
includes Sabah and Sarawak and also Labuan the third federal territory (Tourism
Malaysia).
In Southeast Asia, Malaysia is one of a top tourist destination having an endless
range of attractions for many types of tourist. Malaysia considered as a unique
country and described as ‘Asia in miniature’ because the uniqueness of various
cultures. The multicultural structure of Malaysia is filled with the cultures of three
main ethnics such as Malay, Indian and Chinese. Besides that, there are complement
from minority ethnics such as aboriginals and Eurasian ethics such as Iban, Dayak,
Melanau, Kadazan, Bajau and others. By this, Malaysia can be best described as a
place, allowing the convergence of cultures.
Nevertheless, the huge biodiversity of flora and fauna in Malaysia have attracted
number tourists to visit Malaysia. As there is massive development on the tourism

3
sector, Malaysia government have step into an effort to diversify the economy and
not solely depend on exports. Government started to focus on tourism industry by
having policies and promotion to attract tourist around the world. By this the tourism
sector is the second engine that help the growth of the country for developing global
competitiveness. This industry effects positively on the Malaysian economy for
increasing foreign exchange earnings, and employment opportunities (Bhuiyan et al.,
2013).
1.1.1 History of Malaysia Tourism
Earlier, before independence in 1957 Malaysia economy was only focusing in
agriculture sector such as tin, rubber and oil palm. At that period, tourism doesn’t
give any effects on Malaysia economy. In 60’s tourism in Malaysia started as a new
sector in the economic sector for the starting there was a slow growth. A tourist plan
was added into the country’s 1971-1975 plan and this shows the beginning of
tourism contributing in Malaysia’s economic. Malaysia government tried to develop
Malaysia tourism and in year 1972 Malaysia government established Tourist
Development Corporation of Malaysia (TDC) under former Ministry of Trade and
Industry. However Malaysia give more attention on 1980’s due to the fall in oil price
and world’s economic crisis. Beside economic, tourism sector gives positive impacts
on foreign exchange earnings, job opportunities and tax revenues in 1980s. In 1987,
another department was established called the ministry of culture, Arts and Tourism
(MoCAT) and TDC has emerged to this department in year 2004, became Ministry
of Tourism. Malaysia government have brought up many plan in order to encourage
and improve local and private investment in tourism industry.

4
In 2001, Malaysia government had created fund to help investors which is tourism
infrastructure fund with RM 700 Million allocation and increased the fund to RM 1.2
billion in 2005 and special fund for tourism infrastructure with allocation of Rm 400
Million. In 1992, TDC was replaced by Malaysia Tourism Promotion Board
(MTPB). MTPB function according to the Malaysia Tourism Promotion Board act
1992 are:
To stimulate and promote tourism to and within the country
To stimulate, promote and market Malaysia as a best destination for tourism
in international and domestic arena.
To co-ordinate activities relating to tourism conducted by any organisation ,
government or non-government agencies and;
To recommend to the minister as to create of appropriate methods, measures
and programmes to facilitates or stimulate the development tourism industry
in Malaysia and to implement or assist in the implementation of these
recommendations.
In 2012, MTPB have 36 overseas and 9 marketing representative offices in 29
countries. Malaysia has a strong position today as tourist destination. By realising
the strong potential in tourism sector globally, Malaysia government is taking steps
to develop this service sector together with the collaboration private sectors to bring
benefit to all.

5
1.1.2 Contribution of Malaysia Tourism
Tourism sector plays important role in many economic facets in Malaysia. Malaysia
has been and still an attractive tourism destination in the world. Attracting more and
more international tourist to Malaysia been a main focus of Malaysia government,
besides development interesting tourist destination such as Langkawi Island, Pangkor
Island, Cameron highland and many more. Besides that, the natural and cultural
tourism combined with heritage and multicultural aspects such as and the tropical
climate of Malaysia creates a sustainable tourist development.
Malaysia have brought in number of international tourist around the world year by
year. From the Table 1.1 below, it can be seen that the number tourist arrival
increase year by year. This table shows the arrival of tourist starting from the year
1998 till 2013 which shows a constant increment. In year 1998, tourist arrival was
5.56 million and 1999 there an increase in the tourist arrival which is 7.93 million. It
increase more in year 2000 to 10.22 million. Continue to increase up to 12.78 million
and 13.29 million in year 2001 and 2002 respectively. In year 2003, there was slight
drop in the tourist arrival which was 10.58 due to the SARS and Gulf War in 2003,
but in year 2004 until 2013 the number of tourist to Malaysia increase significantly.
In year 2013 the number of tourist arrive was 25.72 million which shows a good
number of tourist visited Malaysia. Beside arrivals, receipts also shows a drastic
increment starting year 1998 till 2013. In year 2013, Malaysia have performed more

6
than expected in term of tourist receipt of RM 65.44 billion exceeding the initial
target which is RM 65 billion.
Table1.1: Tourist Arrival and Receipts to Malaysia
Source: Tourism Malaysia, 2014
Malaysia have tourist around the world coming to Malaysia due to many factors that
attract international and also domestic tourist. According to UNWTO, Malaysia is
the 10th
most visited country in the world, having more than 25 million tourist visited
Malaysia last year. Table 1.2 below shows the top ten tourist arrival by countries of
nationality in year 2012. Tourist from Singapore have visited Malaysia the most with
the number of 13.01 million, which is 51.99% from the total of tourist arrivals.
Following by Indonesia (2.38 mill), China (1.56 mill), Thailand (1.26mill), Brunei

7
(1.26 mill), India (0.69 mill), Philippine (0.508 mill), Australia (0.507 mill), Japan
(0.47 mill), and United Kingdom (0.41 mill).
Table 1.2: Top Ten Tourist Arrivals by Countries of Nationality
2012.
Country of Nationality Number of tourist arrival
( million)
Total of tourist arrivals
(%)
Singapore 13.01 51.99
Indonesia 2.38 9.52
China (including Hong Kong
and Macau )
1.56 6.23
Thailand 1.26 5.05
Brunei 1.25 5.03
India 0.69 2.76
Philippine 0.508 2.03
Australia 0.507 2.02
Japan 0.47 1.88
United kingdom 0.402 1.61
Source: Tourism Malaysia with the cooperation of Immigration Department, 2012
Besides having international tourist, Malaysia with attractive tourist destination have
also attract domestic tourist. Domestic tourist do contribute to the tourism sector.
The number of domestic tourist taking vacation is bigger than international tourist in
most countries (Weaver and Oppermann, 2000). According to the Malaysian
Ministry of Culture, Arts and Tourism (MOCAT), domestic tourism receipts

8
increasing at estimated 15% a year, and surveys done by the tourist office indicated
that over 50% of hotel bed-nights were occupied by domestic tourists (The
Economist Intelligence Unit, 1994).
Tables 1.3 shows the key statistic of domestic tourist in Malaysia for year 2012 and
2013. The number domestic tourist should be taken into consideration because
domestic visitor will also help to improve the tourism sector. In 2013, it shown that
152.9 million visitor was recorded with an increase of 8.1 % compared to 2012 with
141.4 million visitors. The number trip of domestic visitor increase from 174.4
million in 2012 to 193.3 million in 2013 with growth of 10.8 %. A total of RM54.0
billion was spent for domestic tourism in 2013 as against RM47.8 billion registered
in 2012. Meanwhile, the average expenditure per trip registered RM279 in 2013, an
increase of 1.8 per cent from 2012. The growth of domestic visitors’ expenditure was
driven by the increase in the number of visitors and trips in 2013.
Table 1.3: Key statistics of domestic tourism, 2012 and 2013
Source: Department of Statistic Malaysia, 2013

9
During 1980’s in order to overcome balance of payment deficit, Malaysia
government planned to bring up a strong and developed tourism sector as an
alternative source of foreign exchange. Improving tourism gives positive impact on
development of direct tourism related sector and indirectly related sector. Thus,
tourism generates the economics of developing countries and its importance is
gaining huge recognition. Now Malaysia and other developing countries considering
tourism as one of the important to of development of economy and also gain
attention from government’s industrial strategy. Malaysia government try to increase
its allocation on the development of the industry over years. It has been increased
from RM605.5 million in the 7th Malaysian plan to RM1009.0 million in the 8th
Malaysian plan period, experiences 60% increase in its allocation (EPU, 2001). In
the 9th Malaysian plan period, the allocation reached to RM1367.0 million (EPU,
2006).
Development of tourism sector do help the growth in Malaysia economic. Its
contribution in economic growth is very important as it gives impact on growth
sector directly related to tourism and also indirectly related. Tourism sector
contributes in sales and production of output, employment, tax revenue and income
(Horvath and Frechtling, 1999). The income generated by tourism through tourist
expenditure are important earning for the country. By this the public and private
sector can generate income via inter- sector linkages their earning can generate
earning, besides creating employment opportunity to the locals. According to
Department of Statistic Malaysia (2013), every year the amount of expenditure done
by domestic and international tourist is raising because Malaysia is the best tourist
destination and also number services beside interesting activities can be done here.

10
Table 1.4: National and International Tourism Expenditure
Source: Tourism Satellite Account ( TSA) 2005-2012, 2012
Table 1.4 shows the national and international tourist expenditure occur in Malaysia
from year 2005 till 2012. In 2005 national tourist expenditure is RM 28 177.6 million
and international tourist expenditure was RM 42.183.2 million. In 2006 the
expenditure of both national and international tourist expenditure have increased to
RM 32 294.4 million and RM 48 264.3 million. Also in 2007, there was a drastic
increase by RM 39,109.0 million and RM 59,267.1 million total expenditure of
national and international tourist. In 2008, there declining rate where the expenditure
of national tourist were at RM 32,069.2 million but there is a rise in international
tourist expenditure which was at RM 64, 370.1 million. Then there are continues
rising in both national and international tourist expenditure.

11
The tourists will spend in Malaysia. Transaction happens in Malaysia will help value
of Malaysia currency increase. Besides that, many transaction such as hotel services,
restaurant, transportation services and many others would help economic growth and
also due to high demand for certain sector will help the sector to develop and create
job opportunities to local people.
According to Dritsakis (2004), the most direct effect happen within some sectors for
instead, hotels and restaurants, wholesale and retail trade, transportation and business
services. Meanwhile indirect effects is to the other sectors that indirectly related to
the development of tourism sector. Since numbers of international and domestic
tourist visit Malaysia, the number of hotel and restaurants have increased drastically
over years all over Malaysia. The hotel industry is consist of five star, four star,
motels, chalet, homestays and many more. The demand for hotel industry increase as
the arrival of international tourist visit Malaysia increase.
According to website of Tourism Malaysia, in 2013 the countries average hotel
occupancy rate rose to 62.6% than 62.4% in 2012 and 60.6% in year 2011. This is in
tandem with the increase in international and domestic tourists. In year 2013 Pahang
recorded the highest occupancy rates at 80.4%. The Federal Territory of Kuala
Lumpur and Selangor recorded the second and third highest occupancy rates of 69.5
% and 67.5% respectively.

12
Table 1.5: Hotel occupancy rate by state 2012-2013
Source: Tourism of Malaysia, 2013
Tourism sector have significantly gives positive impact on employment in Malaysia.
The rise in many sector which is related to the tourism lead to increase in labour
demand. Most of the sector in tourism sector are relatively labour intensive and the
development of this sector would require for more labour to work in this sector.
Other than that, the strong connection between sectors such as transportation, retail,
utilities, food and beverages as well as financial services. In Malaysia there are
many higher education institution are offering programmes on tourism and
hospitality which creates thousands of graduates to works in this tourism sector. By
creating job opportunities, this will also help low income group to upgrade their
lifestyle by involving in tourism related small business or activities such as rural
13
homestay programme. By this Malaysia can overcome one of the macroeconomic
problem.
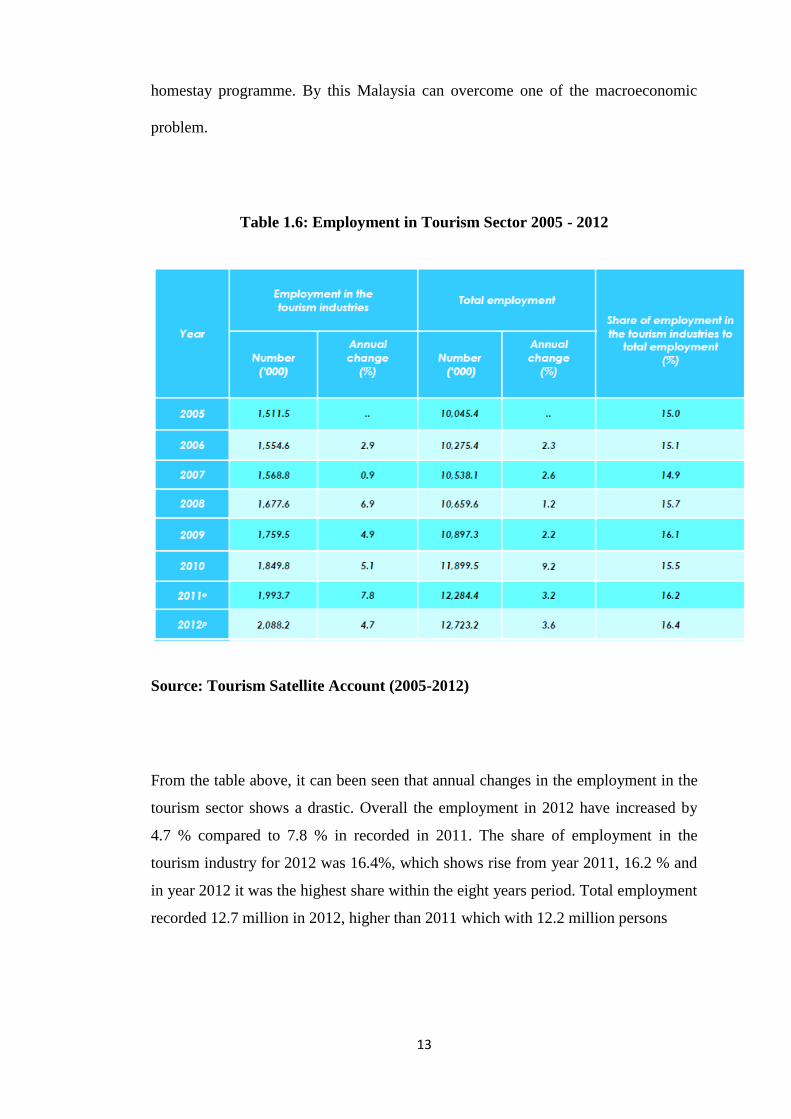
Table 1.6: Employment in Tourism Sector 2005 - 2012
Source: Tourism Satellite Account (2005-2012)
From the table above, it can been seen that annual changes in the employment in the
tourism sector shows a drastic. Overall the employment in 2012 have increased by
4.7 % compared to 7.8 % in recorded in 2011. The share of employment in the
tourism industry for 2012 was 16.4%, which shows rise from year 2011, 16.2 % and
in year 2012 it was the highest share within the eight years period. Total employment
recorded 12.7 million in 2012, higher than 2011 which with 12.2 million persons

14
Tourism plays crucial role in contribution of GDP. Tourism sector will generate
employment and income which lead to a positive tourism balance of payment.
Besides it also will stimulate the supply of goods and services of sectors of tourism
due to demand of tourist and will generally increase the level of economic activity in
the country. This will lead to the development and the rise in GDP.
1.2 Problem Statement
Tourism been a sector that boost the development of a country. After seeing at the
potential of tourism sector towards economic growth, government involves on the
extension of the sector as it give significant impact on the economy. There are many
research done on the relationship between tourism sector and economic growth.
There is a positive relationship in tourism sector and economic growth. As the
tourism sector develop, the economic growth would also increase accordance to it.
Malaysia government is giving importance to this sector because it creates job
opportunity either in direct or indirectly sector, increase sales and profit, income and
many more. Direct sectors such as hotel, restaurant, and transport are the sector
which directly involve in the sector and the indirect sector are such that that
contribute indirectly towards to the sector. Thus as many sector are involved in the
sector, the business and people received a lot of good effect from the sector. For
example, as more and more tourist visit Malaysia there will more transaction happen
where the local business would gain profit and also the job opportunity will be
created when this sector is developing which can reduce the number of
unemployment in Malaysia. Government are allocating a huge amount of money to
develop this sector and try to increase the benefit that can be gain from this sector.

15
Few thing should be taken into consideration such as even though the number of
tourist is increasing annually but Malaysia is fail to attract tourist from developed
country such as United States, Korea, Japan and other developed country. As
indicated in Table 1.2, it can be seen that the number of tourist from developed
countries such as Australia, Japan and United Kingdom less visit Malaysia. This
means that Malaysia fail to attract those developed count and not competitive enough
to bring tourist from rich countries. Although there is few matter that are lacking but
tourism sector is tremendously important as other sector in the development of the
economic. In term of Gross domestic product (GDP), there is a positive correlation
with the improvement of tourism
Table 1.3: Contribution of Tourism To Malaysia GDP
YEAR TOURIST ARRIVAL
(MILLION)
GDP
(BILLION)
2008 20.9 50.6
2009 22.0 53.1
2010 23.6 52.2
2011 24.6 55.9
2012 24.7 59.0
2013 25.7 70.6
Source: Department Of Statistic, Malaysia 2014
According to the Table above, there are a positive relationship between tourist arrival
and its contribution to GDP. In year 2008, there tourist arrival 20.9 million and the
total GDP is RM 50.6 billion. In 2009 the tourist arrival have increased to 22.0

16
million and also there is an increase to RM 53.1 billion in Malaysia GDP. In 2010,
tourist arrival went up to 23.6 million and in 2011 was at 24.6 million and there is
also increment in GDP RM 52.2 billion in 2010 and RM 55.9 billion 2011. As in
2012 the tourist arrival was at 24.7 million and the total GDP at that year was RM
59.0 billion. Lastly in 2013 the tourist arrival was at 25.7 million and the total GDP
was at RM 70.6 billion. From the table, the higher the arrival of tourism, the higher
to number of GDP will increase. This prove that the higher tourist arrival, the higher
the total GDP. This shows that tourism sector contribute the largest to GDP.
Not only to GDP, the tourism sector also given impact to the total employment.
Table 1.8: Contribution of Tourism to Malaysia Employment
YEAR NUMBER OF JOB
(‘000)
PERCENTAGE TO
TOTAL EMPLOYMENT
2008 780 6.9%
2009 810 7.4 %
2010 810 7.18 %
2011 800 6.6%
2012 820 6.5 %
2013 870 6.7%
Source: World Travel and Tourism Council, 2014
From the table above, there is a contribution tourism sector to the total employment
in Malaysia. In year 2008 number of job created by tourism was 780 000 and the
percentage contributed to the total employment was at 6.9 per cent. In 2009 job

17
created by tourism sector was 810 00 and the contribution to the total employment is
7.4 per cent. As for 2010, the total job created by tourism sector 810 000 and the 7.18
per cent contribution to the total employment in Malaysia. In 2011 800 000 and for
2012, 820 000 job created with contribution of 6.5 per cent and 6.7 per cent t6o the
total employment. From the table, there huge number of jobs opportunity created by
the sector.
It can said be said that it is important to develop tourism sector in order to improve
economic growth. In this study, the impact of tourism sector on the economic growth
by using multipliers effect and also interlinkages between sector in Malaysia
economic
The study uses multiplier effect to indicate that each Ringgit of direct expenditure
generate another Ringgit in output and the export of tourism sector. There are
research question on what this study will be done in order to answer those questions:
1.2.1 What is the total impact of tourism towards economic?
1.2.2 What is the contribution of tourism sector towards Malaysia output
1.2.3 What is the impact of tourism sector on export?
1.2.4 What is the backward and forward linkages between tourism related sectors
and non- tourism related sector
1.3 Objective Of Study
1.3.1 General Objective

18
The general objective of this paper to see on how tourism sector gives impact on
Malaysia economic as it is one of the main tool being use for economic growth.
1.3.2 Specific Objectives
I. To examine the total impact of tourism towards economy
II. To examine the contribution of tourism sector towards Malaysia output
III. To examine the effect of tourism sector on export
IV. To examine the backward and forward linkages between tourism related
sector and non-tourism related sector.
1.4 Scope And Limitation
The main objective of this study to see the impacts of tourism toward economic
growth by using input output analysis. Input output analysis can be used to estimate
the sectorial impact of changes of tourism on Malaysia economics. By using the
input output table, the impact of tourism on the Malaysia output and also the impact
of tourism on export can be determine. Besides that, the forward and backward
linkages can be seen between tourism related sector and non-tourism sector. By this
we can know how changes in tourism sector would affect the Malaysia economy.
The limitation in this study is limited data. The data collected is just from the input
output table published by department of statistic Malaysia. Thus this study is going
to see the impact of tourism on the economic growth through looking at the

19
production structure of the sector. There is other things matter in tourism beside the
production of the sector that can effect economic growth of Malaysia. Aspects such
as environment and social factors created from tourism that will also effect economic
growth should be taken into consideration.
Besides that, trade and technology factor play important part that can affect the
production of the sector over time. A drastic changes will happen in the sector if
there is any changes in trade or technology. Although input output table an important
tool which can measured the impact of tourism and other sector but it can be used
for short run purpose but not for long run as this method ignore important factors that
will bring drastic changes to the quantity of input and output produced.
1.5 Significant of Study
Since Malaysia is now focusing on the development of service sector to increase
GDP. Tourism is mainly in government’s attention to be developed as tourism has
potential to bring in tourist and this will create lots of positive effect to the
development of the country. By this study, it can be seen that tourism can increase
the investment and business opportunity. Seeing the potential in generating income
by the tourism sector it, the investors and businessman can invest in this sector and
open business to gain profit from the sector.

20
Other than that, policy maker and government can use this study can use the tables
on tourist arrival, tourist expenditure, hotel occupancy rate and other to plan policies
that related to tourism to improve the sector better. Tourism also playing an
important role in creating job opportunities. It creates around 1,331,000 jobs in 2010
and this tourism investment bring income RM 19.9 billion revenue in the same year.
It is estimated will reach RM 49.8 billion in year 2020. By looking as the potential
of tourism sector policy maker can develop policies related to tourism.
By using the input output table, we can see the linkages among various sector either
its directly related or indirectly related to tourism. The production processes are
always interdependent. The products of one sector are used in another sector while
the product of that sector will be used as input by other many sectors and changes in
any sector’s output would affect the production of another sector. So this can use by
sector to know better about the need, opportunity, profit and avoid the shortness of
supply of inputs.
1.6 Study Outline
This study is organized as follow: Chapter 2 reviews the releated literature on the
economic impact of the tourism sector using various input-output model in different
economies. Besides that the relationship between tourism and economic growth will
be review empirically. Chapter 3 describes the method and the source of data
collection besides discussing about the methodology used in the study. Chapter 4
discusses the results of economic multipliers and total economic impact of the

21
tourism sector in the country and also discusses about the forward and backward
linkages of sectors tourism sector. In the end, in chapter 5 will discuss the summary
of the finding, the conclusion and suggest few recommendation on overcome the
problem in tourism sector on economic growth.

22
Chapter 2
Literature Review
2.1 Introduction
In this chapter, collection of research will be reviewed to gather information from
previous research. In this literature review, some published information on an area
will be reviewed to support the objective of a research that will be conducted.
Article, journal, theses, newspaper and any academic material from accountable
website or publication will be use in order to attain the objective. This study is about
the impact of tourism on economic growth in Malaysia. In this section, reviews will
be done on the economic impact of tourism. There is a need to gather and investigate
upon the research done on the tourism to support the result in the end of this project
paper. This summary of literature review on economic impact of tourism will depict
by exploring research, looking at the methodology and their uses in attaining the
objective. In this section review on Malaysia tourism will be done, second the
empirical review on the relationship of tourism and economic growth and lastly, the
literature review on input output analysis.
2.2 Overview of International Tourism’s Impact on Economic
Tourism has become as one of a leading and one of the fast growing industries in the
world over year. As stressed by WTO (2003), definition of tourism is a process,

23
activity and result which from relationship and interaction among tourism, suppliers,
host government, host communities and surrounding environments that involves in
attracting and hosting of visitors. Tourism is a sector that obtaining attention in many
countries because of its contribution in the economic growth. Every year it been
reported that the number of international tourist arrival have grew significantly in
many countries which have directly and indirectly. International tourist arrival have
rose by 4.6% in the first half 2014. Tourist destination around the world have
received around 517 million international tourist from January till June 2014 which
is 22 million more than first half year of 2013 (WTTC , 2014). The increment of
international tourist arrival have led to increase of many economic aspect and
countries which taken tourism as key of economic development have gain a lot from
this sector.
Tourism is used as an engine to develop the economy of many countries around the
world. Tourism, in government’s view, will increase GDP of a country is important
because its lead to increase the standard of living, income per capita , business
opportunity , employment level and economic stability. Many government sees
tourism as a tool of development that will protect the environment and traditions with
minimum negative impacts (Liu & Wall, 2006). According to UNWTO 2014, the
total contribution of travel and tourism to GDP in 2013 was USD 6,990.3 billion
which is 9.5% of total GDP. Besides that, in 2013, the total contribution of travel and
tourism to employment including job which is indirectly supported by tourism
industry 8.9% from total employment and assume will increase by 2.5% in 2014.

24
2.3 Overview on Malaysia Tourism on Economic Growth.
In Malaysia, tourism is the fifth largest sector after oil, gas and energy, financial
services palm oil and financial services largest sector. Malaysia is now recognised as
the best tourist spot, ranking in top 10 best in arrival and in top 15 in global receipts.
Besides that, tourism give impact on Malaysia economy, generating RM 39.9 billion
in year 2009 to gross national income (GNI). It been assume that Malaysia’s tourism
industry will contribute income to RM103.6 million in GNI with RM 36 million
arrivals in 2020 (Malaysia, 2010). This industry effects positively on the Malaysian
economy for increasing foreign exchange earnings, and employment opportunities
(Bhuiyan et al., 2011). Malaysia has secured third position in tourist arrivals among
the Commonwealth countries after Britain and Canada. According to the statistics of
2005, tourism is contributing over 40% in the balance of payment of Malaysia and
becomes the key foreign exchange earner of the country (Malaysia, 2006). In 2006,
tourism contributed second largest foreign exchange earning sector after
manufacturing. Tourism earned US$18.1 billion in export revenue which is
representing 10 % of the total exports of Malaysia in 2006 (WTTC, 2006)
2.4 Empirical Review on Relationship between Tourism and Economic Growth.
2.4.1 Input Output Analysis
In this study, the relationship between tourism and economic growth will be studied.
There are many studies done on the tourism sector which lead to the economic
growth in different countries using input output analysis. As study done by Khan,

25
Chou and Wong in 1990 have used input output analysis. They used input output
transaction table of 1983 to see the impact of economic impact of tourism in
Singapore. This studies it shows that the tourism contributes 12.5% in GDP. The
tourism income multiplier is 0.94 which is lower than multiplier obtained by Heng
and Low (1990) but higher than Bahamas, Cayman islands and Fiji. Meanwhile, the
estimated tourism employment multiplier were 33 jobs per million of Singapore and
also output multiplier is 1.96 per Singaporean dollar and it nearly similar to the other
research which done by Heng and Low. The import multiplier were also used and
estimated to be 0.38 per Singaporean dollar.
Another research that written by Rashid et al. is an inter-sectoral analysis on
Malaysian economy concern tourism impact analysis in which static input output
analysis was the basic of the analysis. The author have used the 1983 input output
table to assume the impact of tourism for 1991 on economy. Resulting from tourist
expenditure, the direct and indirect impact on sectoral output, employment, non-
competitive imports and commodity taxes were estimated following with
questionnaire method in 1991. According to the research that, many sectors receiving
benefits from this tourism sector either directly or indirectly. The influence on
output, employment and commodity taxes by the contribution of tourist expenditure
found to be varied and small which is less than 5%. The study conclude that the other
sector do have strong technological linkages with other domestic supply sector,
therefore it is important to give to develop these strategic and non-strategic tourism
sector in designing tourism policy.

26
As emphasis Archer (1995) to see the importance of tourism on Bermudan‘s
economy. Archer have used input out model in his research. In early 1980s till 1992
due to worldwide recession, the arrival of Bermudan’s tourist receipt was decreasing.
Input output model were developed in year 1985, 1987 and 1992 to measure the
influence on income, employment, import and government revenue by specific
tourist sector for overnight and cruise passengers. The result of the finding is that the
tourism became the main source of employment even though tourism sector wasn’t
influence the foreign exchange and income for Bermudan economy. Besides that, the
income multiplier show improvement from 1.095 in 1985 to 1.257 in 1992 and
employment was 11500. In the end Archer suggested that Bermudian government
need to emphasis on strategies measures to improve the tourism product.
Surugiu (2009) a research done on Romania’s tourism. The author have employed
input output analysis as the tool to measure the impact of hotel and restaurants for
two different years, 2000 and 2005. The author have used output, value added,
earning and employment multiplier as a backward linkages and used Augustinovics
(1970) as the forward linkages for output, earning and employment. In this research
the output (1.736/1.560) and employment (0.023/0.005) multiplier in hotels and
restaurants reached higher value but in 2005, those regarding the value added
(0.781/0.837) and earning (0.269/0.276) were smaller than 2000. As for the forward
linkages coefficient, the result shows that hotel and restaurant have the lowest
interdependence means output forward linkages (OFL) is 1.077 in 2005 is low than
2000 which is 1.91. For the earning forward linkage coefficient shows the
importance of hotels are low 0.198 in 2000 and decrease to 0.171 in 2005.
Employment forward linkages (LFL) there is a change of 0.014 in employment due
27
to a change in the final payment of hotel and restaurant. Using the I-O year 2005, the
author have forecasted the final demand, intermediate consumption and value added
for hotels and restaurant in Romania. The forecast of the macroeconomic indicators
shows the final demand will reach up to 18.655 billion RON, intermediate
consumption 9.999 billion RON and value added 12.438 billion RON. As a
conclusion, the tourism sector can be effective even higher even double but with a
strong tourism industry and transport infrastructure and diversified services.
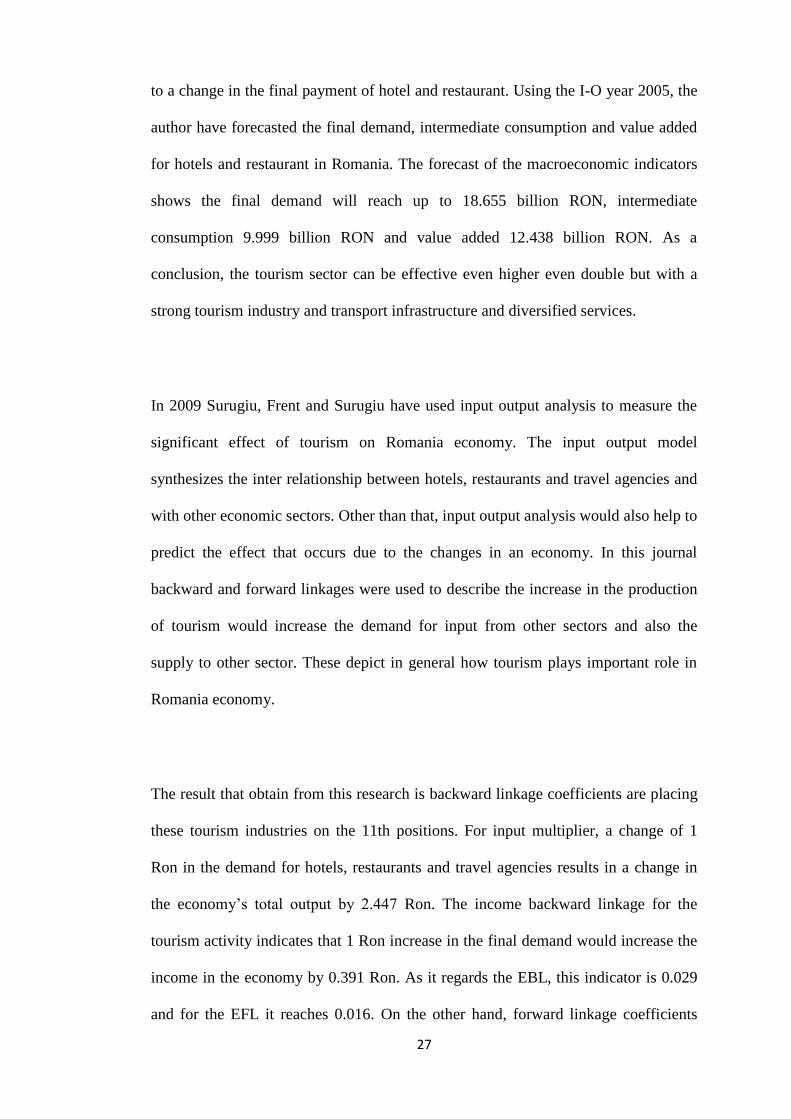
In 2009 Surugiu, Frent and Surugiu have used input output analysis to measure the
significant effect of tourism on Romania economy. The input output model
synthesizes the inter relationship between hotels, restaurants and travel agencies and
with other economic sectors. Other than that, input output analysis would also help to
predict the effect that occurs due to the changes in an economy. In this journal
backward and forward linkages were used to describe the increase in the production
of tourism would increase the demand for input from other sectors and also the
supply to other sector. These depict in general how tourism plays important role in
Romania economy.
The result that obtain from this research is backward linkage coefficients are placing
these tourism industries on the 11th positions. For input multiplier, a change of 1
Ron in the demand for hotels, restaurants and travel agencies results in a change in
the economy’s total output by 2.447 Ron. The income backward linkage for the
tourism activity indicates that 1 Ron increase in the final demand would increase the
income in the economy by 0.391 Ron. As it regards the EBL, this indicator is 0.029
and for the EFL it reaches 0.016. On the other hand, forward linkage coefficients
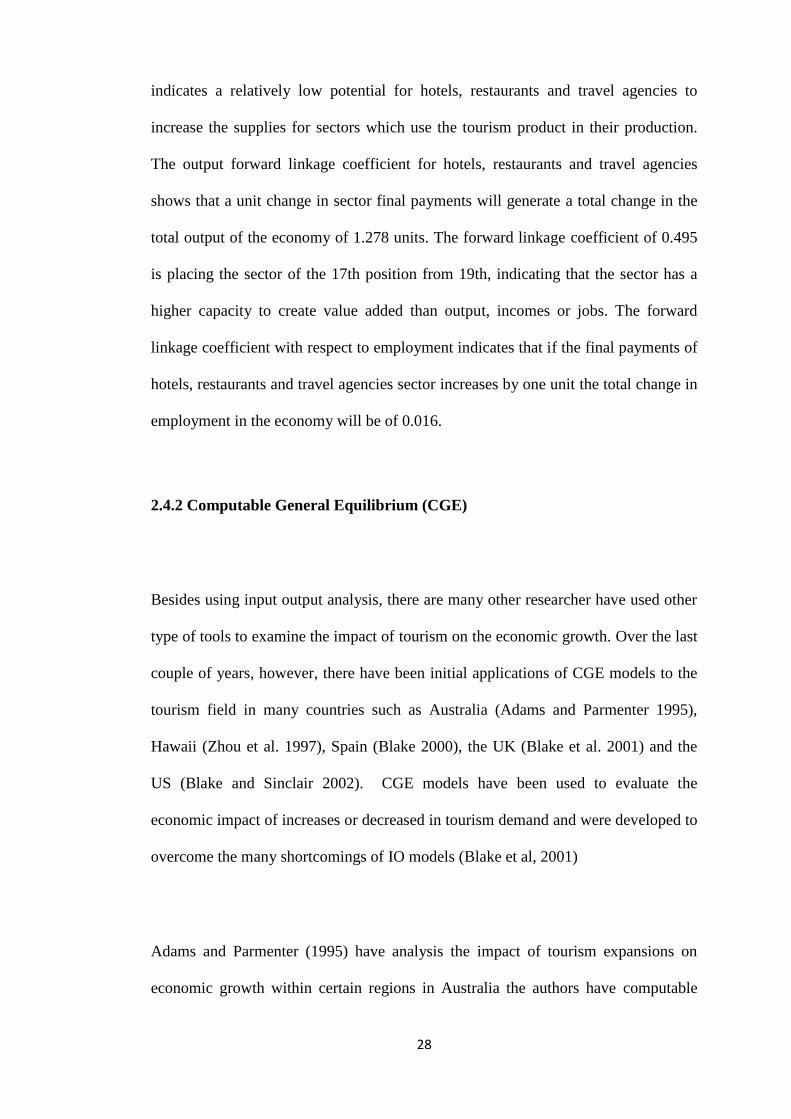
28
indicates a relatively low potential for hotels, restaurants and travel agencies to
increase the supplies for sectors which use the tourism product in their production.
The output forward linkage coefficient for hotels, restaurants and travel agencies
shows that a unit change in sector final payments will generate a total change in the
total output of the economy of 1.278 units. The forward linkage coefficient of 0.495
is placing the sector of the 17th position from 19th, indicating that the sector has a
higher capacity to create value added than output, incomes or jobs. The forward
linkage coefficient with respect to employment indicates that if the final payments of
hotels, restaurants and travel agencies sector increases by one unit the total change in
employment in the economy will be of 0.016.
2.4.2 Computable General Equilibrium (CGE)
Besides using input output analysis, there are many other researcher have used other
type of tools to examine the impact of tourism on the economic growth. Over the last
couple of years, however, there have been initial applications of CGE models to the
tourism field in many countries such as Australia (Adams and Parmenter 1995),
Hawaii (Zhou et al. 1997), Spain (Blake 2000), the UK (Blake et al. 2001) and the
US (Blake and Sinclair 2002). CGE models have been used to evaluate the
economic impact of increases or decreased in tourism demand and were developed to
overcome the many shortcomings of IO models (Blake et al, 2001)
Adams and Parmenter (1995) have analysis the impact of tourism expansions on
economic growth within certain regions in Australia the authors have computable

29
general equilibrium (CGE) model stimulating 10% growth of tourism for 117 sectors
in in Australia economy. The results of this research shows that an increase of 10%
of tourism would give positive impact which is exchange rate appreciation and
increase in import. The negative impacts are on traditional export sectors production
and declining balance of trade. The author have added here that even though
Queensland is one of the centres of tourism in the country but it experience a
downturn in economic growth due to the crowding out in exports sectors for
example agriculture and mining. Furthermore, it is suggested to that Queensland
should highly depend on traditional export which is declining due to an expansion of
international tourism.
Besides that, a study done by Blake (2000) estimates the effect of on 10 % increase
in tourism would affect the Spain economy by using the CGE model. As a result 10
% increase in tourism would affect the GDP by 0.05%, 0.61% increase in real
exchange rate and also a slight increase in household consumptions, domestic
tourism and investment. The finding shows that the benefit from the expansion of the
tourism would offset the increase in import and also decease in value of other export.
Zhou et al. (1997) analyse the economic effect of the declining tourism demand in
Hawaii. In doing so they draw comparisons as to the effectiveness of the I-O and
CGE analyses. They simulate a 10% decline in visitor expenditures in Hawaii’s CGE
and I-O models and compare the two results.it been found the decline of tourist
demand would drop the number of output produced by the tourism sector such as
transportation, hotels, restaurant and bars with smaller reduction in outputs for other
sectors. In General, IO results provide estimates with larger magnitudes than CGE

30
results because the I-O model does not allow prices to fall. The CGE model
apparently has specific advantages such as the ability to account for resource flows
between sectors, to show price effects and to allow greater modelling flexibility
2.4.3 Causality test
This paper was done to examine the impact long run economic growth of Greece
from 1960–I till 2000-IV and used causality analysis between real gross domestic
product, real exchange rate and international tourism earning. The result obtain from
Granger causality tests based on error correction models (ECM), this indicates the
presence of long-run relationships among these variables. The results of the causality
analysis denote that international tourism earnings and real exchange rate cause
economic growth with a “strong causal” relationship, while economic growth and
real exchange rate cause international tourism earnings with a “simply causal”
relationship. The results of the cointegration analysis suggest the existence of
cointegration relationship between the three variables (Dritsakis, 2004)
2.5 Input Output Table
Economic impact analysis is a way to estimate the effects from various economic
event or changes that occurs in area’s economy. Input output (I-O) model is the most
command method used to see the impact on the economic at regional and state level.
I-O model allow local communities, businesses and governments to estimate the
effect of types of economic changes in an area or community (Montana Department

31
of Labour And Industry, 2013). The input output analysis is a standard method to
measure the spread effects of the changes happen in final demand for the product in
an industry or sector (Surugiu, 2009). The basic information used in input output
analysis is the flow of product from each industry which is a producer to each of the
sectors, itself or others as a consumer (Miler and Blair, 2009). Bekhet (2010), the
basic I-O table describes rows showing “Who gives to whom?” and columns
showing “Who receives from whom?” in an economy.
The structure of each sector’s production activity is represented by appropriate
structural coefficient that shows the quantitative term of the relationships between
input and output. A set of linear equation interpret the interdependence among
sectors which express the balance between the total input and total output of each
good and services (Eurostat, 2008). The main need of in the input output analysis is
the input output table. An input-output table records the “flows of products from
each industrial sector considered as a producer to each of the sectors considered as
consumers” (Miller and Blair, 1985). The production process of each good and
services are always connected to each other. The product produce a sector will be
used as inputs by other sectors while the product of the process many be used by
other sector as input or also as final product. As the global becoming more
competitive, stronger interdepends between sector are created, deeper division of
labour and greater diversity and complexity of products , and the exchange of
intermediate product become more important. Thus this makes to see the impact and
estimating the consequence of changes in an economy is necessary (Eurostat, 2008).
By using the input output analysis, the estimation of the input output coefficient
which also called as the technical coefficient can be done. The technical coefficient

32
obtained by dividing each column of the transaction table with corresponding “total’’
column.
I-O tables give a comprehensive and detailed information about the sales and
purchases of goods and services among numbers of industries in the economy and it
also been used by planner, policy-maker and economist in tourism (Economic and
Social Commission for Asia and Pacific, 1990). The advantages of using Input
Output analysis as a tool to measure the economic impact are it will reveal the
interrelation of tourism industry with other industry in the country. Besides that, it
provide consistent and systematic approach to understand the economic impact on
certain economic and also able to determine the relative size of the tourism sector in
the overall economy and enables to see the comparison of tourism sector with other
sectors (Surugiu,2009).
2.6 The multiplier effect
Economists have long been interested in measuring the total impact upon output,
income and employment resulting from a given change in demand or investment. To
this end, the multiplier as developed by Keynes is one of the most useful analytical
techniques (Mieryk, 1967). Multiplier can be used to estimating the overall changes
in in economy due to changes in final demand. Among all the information provided
by input output, multiplier is most frequently used (Surugiu, 2009). Economic
multiplier measure the economic impact or effect in term of output, household

33
income or employment resulting from a change in the final demand within an
economy (Mazumder et al, 2009).
Multiplier is used to describe the final change in visitor expenditure and is central to
any measure of the economic impact of tourism (Archer, 1982). The larger the
multiplier, the greater the impact on unit of visitor spending in the local economy.
According to Krumme (2009) there a few multipliers which popularly used in the
input output analysis. First output multiplier which is expressed as the ration of
output changes due to increase in a unit in final demand. Secondly the employment
multiplier which is used to estimate the total employment attributable to the stimulus
per job or man-year of employment directly created. Income multiplier is used to
measure the changes income (wages, salaries and profits etc.) that happen due to the
changes in final demand.
2.7 Forward and Backward Linkages
We also can get useful interpretation from the transaction table, is the measure of
economic linkages in the economy. The I-O analysis show two results on analysed
sector which are backward and forward linkages. Highly linked regional economies
mostly will be self-sufficient than those with low linked. Other than that, this
economy less rely on inputs from outside source. By analysing the value of the off
diagonal element, the degree of linkages can be obtained from the input output table.
According to Deller, Sumathi, Marcouiller (1993) the bigger the value show tightly
linked economy, meanwhile smaller values shows that more open or looser economy.

34
Since Malaysia have is an open economy, the coefficient in the off diagonal being
very small. Using this linkage analysis, the strengths of intersectoral forward (FL)
and backward (BL) relationship between the tourism sector and other sector in the
economy can be determine. FL measures the importance of tourism industry from the
point as a supplier to the other industries and BL measures its relative important as
demander (Cai, Leung & Mak, 2006).
2.8 Conclusion
There are many research done using different methods to examine the economic
effect of tourism In this research the new input output table, 2010 which was released
in 2014 will be used. The multiplier impact of output and the export of tourism
sector will be examined and the backward and forward linkages will be examine
using 8 subsector of tourism in Malaysia.

35
Chapter 3
Methodology
3.1 Introduction
A research design is very essential procedure in methodology. It is a blueprint
containing the procedure for collecting information and methodology analysing the
data. Information gathered through the research design is to identify whether the
collected information is appropriate for answering the problem (Zikmund, 2003).
Section the data source and methodology will describe. First the data source and data
analysis method will be explained then continue with brief explanation on basic input
output analysis. Next the estimation of tourism economic multiplier which consist of
output multiplier and export of tourism multiplier. Lastly the backward and forward
linkages will be explained.
3.2 Data resource
The main data that need in input output analysis is the input output table .The data
used in this research is the 2010 Malaysia Input Output table and it is a secondary
data obtained from the Department of Statistic Malaysia. The department of statistic
Malaysia have uploaded the Input output table in their official website at
www.statistics.gov.my.

36
3.3 Type of study
Quantitative method will be used in this research. By using input output table, the
interrelationship of sectors in tourism industry itself and also with other sector can be
evaluate. In input output table, there are 120 commodity x commodity input output
matrix of Malaysia. The figures in the table shows the number of product that will be
used as input to produce other commodity and also a final product that can be
consumed. By using the figures in the table, tourism multipliers and also the
interlinkage of the between sector will be calculated.
3.4 Technique of Data Analysis
Input output analysis always been used to see the impact of changes in economic.
Due to cost and time saving, most of the researchers prefer to use this method to
estimate the influence of certain changes in an economy. The main data for this
research which is the input output table for year 2010 is obtained from the
department of statistic official website. The input output table contained with 124
commodity x 124 commodity which show the amount output produced and input
need by sector in Malaysia. Input output table of year 2010 will be used to do
examine the impact of changes in final demand on economic growth in Malaysia.
There are many sectors that fall under tourism sector and those sector directly serves
tourism sector.
In the input output table, 124 commodities will be aggregated and arranged main
sectors according to the list of 124 activity and 124 commodity classification

37
obtained from the department of Statistic Malaysia (2010). This will make to work
more easily than looking the data in term of commodity which is nearly 124
commodity. Besides that, we can only focus on the sector which is falls under
tourism sector and it total contribution to tourism sector itself and other sectors.
After aggregating the commodity into sectors, the table will be used to find the
technical coefficient. This technical coefficients later will be used to obtain the
multipliers such as output multiplier and the export of tourism sector multiplier by
using the formulas provided. The data in input output table will be analysed using the
Microsoft Office Excel to answer research objective. At last the result and the
estimation will be interpreted and explain using tables and recommendation on how
to improve the situation.
38
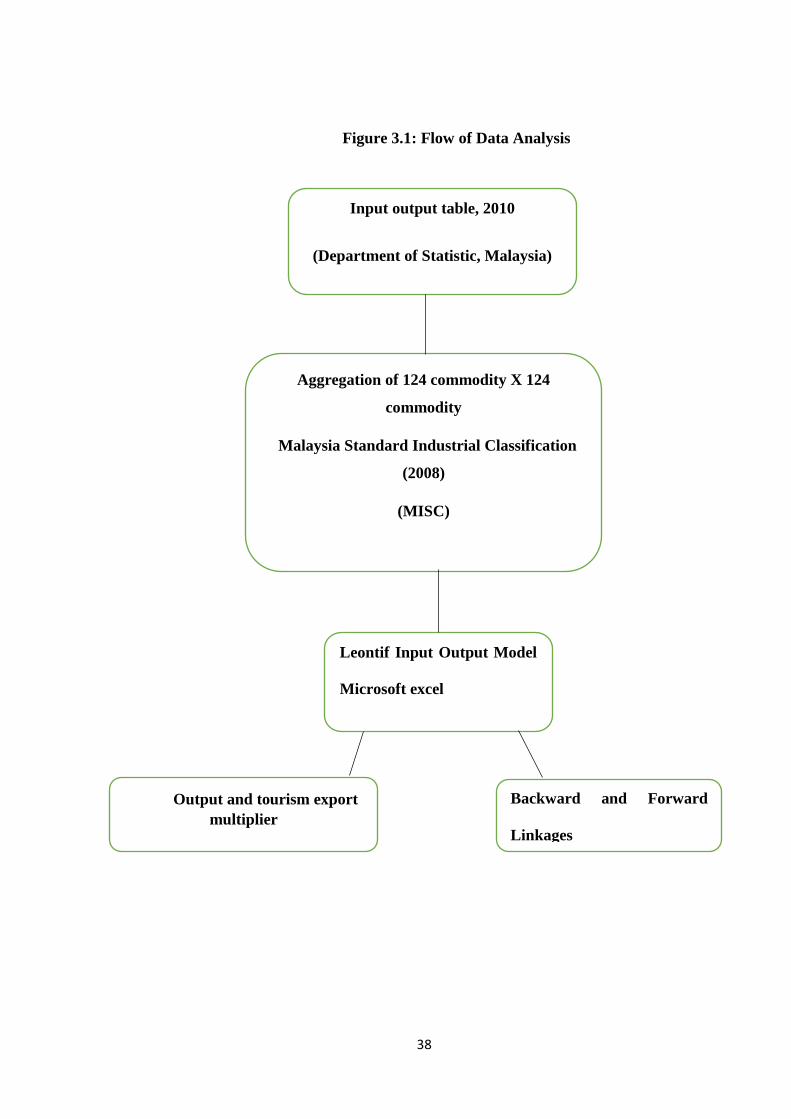
Figure 3.1: Flow of Data Analysis
Input output table, 2010
(Department of Statistic, Malaysia)
Aggregation of 124 commodity X 124
commodity
Malaysia Standard Industrial Classification
(2008)
(MISC)
Leontif Input Output Model
Microsoft excel
Output and tourism export
multiplier
Backward and Forward
Linkages

39
3.5 Basic Input Output Analysis.
Table below shows a very general view of I-O table which consist of four quadrants
which quadrant 1 (Q1), quadrant 2(QII), quadrant 3(QIII) and quadrant 4 (QIV)
Figure 3.2: A General Structure of Input Output Table.
Adapted from: Surugiu (2009), The Economic Impact Of Tourism. An Input Output
Analysis
In each quadrants, there are transactions have among various sector and also the
amount. QI shows the intermediate consumption. It is the basic of the input output
table. It represent the transaction for intermediate sales and purchases of goods and
services among firms. QII shows the final use of goods and services product local
and state government unit, investment and exports. QIII is the requirement of each
sector for primary input such as capital, land and labour and also the input absorb by
the sectors in the economy sector and outside of the country (import). In this QIII we

40
have imported commodities, taxes on products, subsidies on product, and gross value
added. Gross value added is the total of compensation of employee, other net taxes
on production and operating surplus, gross. The operating surplus, gross itself is a
total of consumption of fixed capital and operating surplus, net. In quadrant QIV,
there is no any transaction occurs in this this sphere as there is very few market
transaction reported in this section. The transaction table above can be also describe
as this following equation:
(1)
Where:
aij: the technical coefficient of sectors
Xij: amount of input sector other sector purchase from the selling sector tourism
sector
Xj: output for the tourism sector
In the output input model the total input is equal to total output which means the total
receipts by seller must balance with the total expenditure by buyers. Devkota (2003)
mention the three basic I-O table equation:
Intermediate input + gross value added = total inputs
Intermediate demand + final demand = total output

41
Total inputs = total output
Firstly the I-O model be turned into an analytical model and it can be done by
converting the interbranches into a matrix A form. Matrix A is also called as the
technical coefficient. By using this matrix A or technical coefficient, the direct
requirement of a sector can be known in order to produce a unit of its product. The
technical coefficient can be calculated by dividing the value from the transaction
matrix by total input
a ij =
Coefficient aij can be interpreted as the proportion of tourism industry total
production input of industry supplied by any other industry. Assume that xij = aij * Xj,
the equation (1) can be written by replacing xij and obtain this
(2)
Equation above shows that the production of each sector depends on the production
level of other sectors and also the final demand. From equation (2), total output (X)
equals to the sum of the total final demand for its output (Y) and intermediate
demand for its output

42
X=A*X + Y (3)
Then by solving equation (3) for total output we will get
X= (I-A)-1
*Y (4)
And thus
X= (I-A)-1
* Y (5)
I is identity matrix and (I-A)-1
is also known as Leontif inverse or also as the
interdependence coefficient or total requirements table. The last equation shows that
the product of a change in total final demand multiplied with (I-A)-1
is the change in
total output. Using the Leontif matrix which is matrix transformation which can be
used to calculate multiplier coefficient. These coefficient will depict all the indirect
effects.

43
3.6 Tourism Multipliers
Multiplier measures the impact of additional expenditure in happens in an economy..
Multipliers can be used to predict the change in the economy due to a change in final
demand. Multipliers are one of the important tool that mostly used in input output
analysis. In this study, tourism sector divided into seven subsectors
Manufacture of food and drink
Accommodation
Restaurant
Transportation
Communication
Finance and insurance
Amusement and recreational services
By using these subsector the multiplier effect will be computed.
To achieve objective I, output multiplier is used to examine the impact of tourism on
Malaysia output level

44
3.6.1 Output multiplier
The output multiplier shows how much one additional unit of tourist spending
increases the level of output in the Malaysian economy.
OM= (I-A)-1
x FD
OM=output multiplier
(I-A)-1
= inverse matrix
3.6.2 Export of Tourism Multiplier
To achieve the II objective, the export of tourism sector will be used. In this
multiplier, one additional unit of export of tourism sector would affect the level of
output can be obtained
EM= (I-A)-1
* E
EM=Export multiplier
45
(I-A)-1
= Inverse matrix
E= total export
3.7 Interlinkages between Tourism Sector and Non-Tourism Sector.
Linkages analysis is used in this research to achieve objective III which is to see the
interlinkages relationship between tourism related sector and non-tourism related
sector. Linkages analysis is always used to show the importance of sector that
produced goods and services. The linkages analysis were used to examine the
strength of intersectoral forward and backward relationship between tourism sector
and other sector The interdependence of production structure have been introduced
by Rasmussen (1956), Chenery & Watanabe (1958). One of the well know method in
this analysis is forward and backward linkages.
Backward linkages are also known as the column sums of the Leontief-inverse from
the demand-driven input-output model which measures its relative importance as
demander. Forward linkages is the row sums of the Ghosh-inverse from the supply-
driven input-output model measures relative importance of the tourism sector as
supplier to the other (non-tourism) industries in the economy. Besides these models,
direct input coefficients, and direct output coefficients, and hypothetical extraction of
sectors from the demand-driven and supply-driven model are used to define key
sectors (Oosterhaven, 2008).

46
Chapter 4
Result and Discussion
4.1 Introduction
In this chapter discusses the result obtained after all the data from input output table
2010 by using formulas in Microsoft excel. Firstly the structure of Malaysia input
output table 2010 will be describe. Then the technical coefficient will be discussed
and multipliers will be estimated. Lastly the backward and forward intersectoral
linkages will be calculated.
4.2 The Technical Coefficient
Technical coefficient is also known as the direct requirement table. This technical
coefficient can be obtain from the transaction table by calculating using the formula.
Technical coefficient shows the fraction of total expenditure of purchase input or
what direct amount needed from the sector at the side. Technical coefficient can be
computed using this simple formula.
aij = xij / xj
aij is shows the quantity of output sector tourism sector absorbed by another sector
per unit in order to produce its output. This aij is also called as the input coefficient of
commodity of sector tourism in to other sector. By using this technical coefficient ,

47
how much a sector need to produce its output in order to satisfy the depending
intermediate demands of other sector to produce its output.
From Technical coefficient Table in Appendix, show the direct requirement of input
needed from tourism sector by other sectors in Malaysia produce output and also the
input need by tourism sector to produce its output from other sector in economy.
Agriculture, forestry and fishery needed output from tourism sector as input by
0.0950 and mining and quarrying need 0.022 input from tourism sector. As for
manufacturing, it needs 0.04 input from tourism sector and electricity, water and gas
needed 0.016 unit of input from tourism sector. Other than that, construction needs
0.015 input from tourism sector and 0.0834 by wholesale and retail trade and motor
vehicle. 0.091 unit of input needed by service sector from the tourism sector and
lastly, tourism sector needed 0.32 from itself to produce its output.
Input needed by sectors from seven subsector of tourism to produce it output is
shown in the same table and also the input required from other sector by the seven
subsector to produce its output. Agriculture, forestry and fishery doesn’t need any
input from amusement and recreational services and also from accommodation.
Agriculture, forestry and fishery needs 0.002 from restaurant and from transportation
by 0.014. Next it needs 0.00 from communication and from finance and insurance
0.05 as input. Agriculture, forestry and fishery need 0.03 from manufacturing of food
and drinks to produce its output.

48
Mining and quarrying need nothing from amusement and recreational services,
accommodation and need very little input from restaurants. Mining and quarrying
needs 0.0012 input from transportation and 0.001 from communication sector. For
finance and insurance it needs 0.001 as input and 0.00 from manufacturing of food
and drink to produce its output. Manufacturing sector needs 0.02 from transportation
.0.00 from communication, 0.013 from finance and insurance and lastly 0.007 from
manufacture of food and drink. As for electricity, water and gas requires no input
from amusement and recreational services, accommodation and restaurant. It requires
0.007 from transportation and 0.005 from communication and also 0.043 from
finance and insurance. Lastly 0.000 from manufacturing of food and drinks.
Construction sector needs 0.008 from transportation, 0.002 from communication,
0.004 from finance and insurance. For wholesale retail trade and motor vehicle ,it
need input from 0.009 from restaurant, 0.02 from transportation ,0.006 from
communication , 0.022 from finance and insurance and 0.028 from manufacturing of
food and drinks. Services sector need 0.0006 from amusement and recreational
services as input to produce its output and 0.002 from accommodation, 0.006 from
restaurant and 0.02 from transportation. From communication, service sector needs
0.025 and 0.04 from finance and insurance. Lastly needs 0.003 from manufacturing
of food and drink. Tourism sector needs 0.004 from amusement and recreational
services as input, 0.005 from accommodation, 0.008 from restaurant, 0.03 from
transportation and from communication, it needs 0.07. Lastly for finance and
insurance it needs 0.093 and 0.11 from manufacturing of food and drinks.
Besides that, the subsector needs input from other subsector of tourism to produce its
output. For amusement and recreational services needs 0.13 input to produce its own

49
output, 0.00 from accommodation, 0.007 from restaurant, 0.008 from transportation,
0.04 from communication, 0.02 from finance and insurance and lastly 0.013 from
manufacturing of food and drinks. For accommodation, it needs 0.12 from restaurant,
0.005 from transportation, 0.017 from communication, 0.019 from finance and
insurance and 0.04 from manufacturing of food and drinks. Restaurant needs 0.047
from restaurant, 0.009 from transportation, 0.032 from communication, 0.037 from
finance and insurance and lastly 0.22 from manufacturing of food and drinks. Next
transportation need 0.01 inputs from restaurant, 0.01 from transportation, and 0.008
from communication. For communication, it needs 0.04 from transportation, 0.32
from communication and 0. 93 finance and insurance. For finance and insurance, it
requires 0.02 from accommodation, 0.01 from transportation, 0.04 from
communication, and 0.3 from finance and insurance. As for manufacturing of food
and drinks, it needs 0.02 from restaurant, 0.001 from transportation and from
communication, it needs 0.01 from finance and insurance and lastly needs 0.27 from
manufacturing of foods and drinks.
4.3 Multiplier Effects.
There are many types of multiplier that can be used to see the economic impact of
tourism sector. In this research, output multiplier and the multiplier effect of export
from tourism sector can be obtain. This multiplier effect will examine the impact of
every additional of RM 1 toward the output and the export of tourism sector.

50
4.3.1. Output Multiplier
The output multiplier shows how much one additional unit of RM 1 in final demand
would give impact on total output
Table 4.1: Output Multiplier of Sectors in Malaysia
SECTORS TOTAL EFFECT
AGRICULTURE, FORESTRY AND FISHERY 27.28
MINING AND QUARRYING 2.89
MANUFACTURING 32.28
ELECTRICITY ,WATER AND GAS 3.77
CONSTRUCTION 2.46
SERVICE SECTOR 18.68
TOURISM SECTOR 78.73
The Table above show the output multiplier to all sectors in Malaysia. This
multiplier shows how much one additional unit of tourist spending to will affect
other sectors’ output in Malaysia. For the additional RM 1 final demand would affect
the total product of agriculture, forestry and fishing by RM 27.28. For mining and
quarrying, RM 2.89 will be effected in total output for RM 1 additional for final
demand. Next for manufacturing the effect on output is RM 32.28 for every
additional of RM 1 in tourist spending. This because the demand for manufacturing
product high which make the production of manufacture sector will have a great
impact from the increase of tourist spending. There is RM 3.77 of effect on electric,

51
gas and water output for every RM 1 spending of tourist in Malaysia. Construction
sector will have the effect by RM 2.46 and gain the lowest effect from every
additional RM 1 tourist spending which means there is no much effect on the
construction for every additional RM 1 tourist spending. For service sector the effect
on total output for every additional RM 1 is RM 18.68. And for tourism sector itself
the effect RM 78.73 from every additional RM 1 of tourist spending. There are a
huge effect on tourism sector as there is additional RM 1of tourist spending. There is
a direct of effect on the tourism sector on tourist spending.
Table 4.2: Output Multiplier on Tourism Subsectors
SECTOR TOTAL EFFECT
Manufacture Of Food And Drinks 5.6620207
Accommodation 0.0119503
Restaurant 0.1063736
Transportation 0.9121306
Communication
0.3924094
Finance And Insurance 3.4132725
Amusement And Recreational Services 0.0002521
In the table above, it can be seen that the manufacture of food and drink have the RM
5.66 which means that the every one unit of changes in final demand would give

52
impact RM5.66 changes in total output. For accommodation, the effect to the total
output is RM 0.01 and for restaurant is by RM 0.11 effect on total output for every
additional of RM 1 in final demand. As for transportation, the effect on total output is
RM 0.91 for the every additional RM 1 in final demand and for communication, the
effect is by RM 0.30 for total output. Other than that, the effect on finance and
insurance is RM 3.41 for every addition of RM 1 in the final demand. The
amusement and recreational services, there were very only a very mild impact on the
total output for every RM 1 changes in final demand.
4.3.2 Export of Tourism Sector
Table 4.3: Export of Tourism Multiplier
SECTORS TOTAL EFFECT
AGRICULTURE, FORESTRY AND FISHERY 10.851
MINING AND QUARRYING 1.112
MANUFACTURING 12.440
ELECTRICITY ,WATER AND GAS 1.453
CONSTRUCTION 0.947
SERVICE SECTOR 7.197
TOURISM SECTOR 30.201
The Table 4.3 show the export of tourism multiplier which show the effect on one
additional unit of export of tourism sector on total output. The agriculture, forestry
and fishery will be effect by 10.85 per cent. As for mining and quarrying, the

53
additional of every RM 1 in export of tourism will effect RM 1.18 of total output.
For manufacturing sector every spending RM 1 will effect RM 12.44 of the total
output. Other than that, the electricity , water and gas will be effect by RM 1.45 for
every RM 1 additional of export of tourism sector and construction is effected by
RM 0.95 for every additional of RM 1 in total output. The services sector, for a every
RM 1 will affect the total output by RM 7.20 and for tourism sector of itself will be
effect by RM 30.20 for every additional of RM 1.00.
Table 4.4: Export of Tourism Sector Multiplier on the Tourism Subsector
SECTOR TOTAL EFFECT
Manufacture Of Food And Drinks 3.3546
Accommodation
0.000000000
Restaurant
0.000000000
Transportation
0.507394614
Communication
0.098669614
Finance And Insurance
0.499719470
Amusement And Recreational Services
0.000006656
For the export based multiplier, it can been that, for every additional of RM 1 in final
demand, the impact on the manufacture of food and drinks are RM 3.35 in the total
export. There is no any impact for both accommodation and restaurant in export for
changes in final demand. As for transportation the effect on the export is RM 0.51 for

54
every RM 1 and for communication is by RM 0.10 and also for finance and
insurance by RM 0.50 impact of export for every RM 1. There is a very low changes
in the amusement and recreational services.
4.4 Inter Linkages Between Tourism And Non Tourism Sector
Table 4.5: Backward and Forward Linkages between Sectors
SECTORS BACKWARD
LINKAGES
RANK FORWARD
LINKAGES
RANK
Agriculture,
Forestry And
Fishery
1.518452
15
2.036061179 5
Mining And
Quarrying
1.184986
17
1.405304658 12
Manufacture Of
Food, Drink
And Tobacco
2.441078
1
2.055866887 4
Manufacture Of
Textile, Apparel
And Leather
Product
1.672664
10
1.146554923 11
Other
Manufacturing
1.637305
11
3.789731653 1
Electricity,
Water And Gas
1.535680
13
1.774424797 8
Construction
1.851662
6
1.282527422 14
Wholesale &
Retail Trade
And Motor
Vehicle
1.542880
14
2.011094909 7
Accommodation
1.1890467
4
1.062914962 16
Restaurants 1.995229 2 1.278613422 15

55
Transportation
1.854267
7
1.650951640 8
Communications
1.953311
3
2.087060267 3
Finance And
Insurance
1.860486
5
2.386003946 2
Real Estate And
Ownership Of
Dwelling
1.686762
9
1.325956632 13
Private Sector 1.544019
12
2.020718828 6
Amusement And
Recreational
Services
1.826980
8
1.154627648 10
Public Services 1.5033 16
1.036149424 17
In the table above, shows both backward and forward linkages between tourism
sector and non-tourism sector. The higher value in backward linkages than forward
linkage means that demand for input is more than its supply The manufacture of
food, drinks and tobacco have the highest backward linkages which is 2.44 and its
forward linkages is 2.055. This means that the manufacture of used more input from
other sector to produce its input. Secondly the restaurant have 1.99 backward
linkages and 1.27 for forward linkages. Followed by communication with backward
linkages at 1.95 and forward linkages 2.087. For communication case,

56
communication sector need less from other sector to produce its output. Same goes
for accommodation for backward linkages 1.89 and forward linkages is 1.06. Next
for finance and insurance the backward linkages 1.86 and forward 2.37. As for
construction backward linkages is 1.85 and forward linkages is 1.28. After that, for
transportation the backward 1.85 and forward is at 1.65. For amusement and
recreational services its backward linkages is 1.82 and forward linkages 1.15
followed by real estate 1.69 for backward and 1.33 for forward linkages. At 10th
place manufacture of textiles, apparel and leather product have 1.67 as the backward
and 2.055 for forward linkages and as for other manufacturing the backward linkages
1.63 and forward linkages is 3.79. Private sector is recorded 1.544 as backward and
2.02 as forward linkages. Next, as for electricity, water and gas have 1.535 is
backward and 1.77 for forward linkages. Wholesale and retail trade and motor
vehicle is 1.54 for forward linkages and 2.011 for backward linkages. Agriculture,
forestry and fishery have 1.52 for backward linkages and 2.036 as forward linkages.
Lastly public services have 1.51 for backward and 1.036 as forward linkages and
mining and quarrying have 1.18 as backward and 1.41 for forward linkages.

57
Chapter 5
Conclusion and Recommendation
5.1 Introduction
In this chapter, a summaries will be done according to the literature review, research
methodology and the result analysis. Besides that the research objective will be
discussed according to the result obtain from the previous chapter. In the last part,
according to the result obtain, the expectation and future recommendation will be
given for future use. The I-O analysis is used to see the impact of tourism sectors in
economic growth. Thus the result generated will be used as a reference in future for
policy making regarding the tourism sector.
5.2 Summary of Finding
5.2.1 Research Summary
In this research the impact of tourism sector towards economic growth was
analysed. Using the Malaysia input output table 2010 which obtained from the
Department of Statistic Malaysia and to obtain the result input output analysis was
used. Firstly the 124 commodity x 124 commodity will be aggregated in to 8 main
sectors. To fulfil the objectives of the research, multiplier effect and the backward
and forward linkages were used on the sector related to the tourism and non-tourism.

58
5.2.2 Summary of Finding
5.2.2.1 Objective one:
In the first objective, the multiplier impact have been examined to see the effect of
the changes of final demand on the total output and same goes for the export
multiplier to see the effect on the tourism based export. Thus in the output multiplier
result there are a significant effect in for manufacture of food and drinks where every
additional of RM 1 final demand would impact total final demand as much as RM
5.66 and next shows that the finance and insurance have RM 3.41 of final demand
effect if there is an additional of RM 1 in final demand. For amusement and
recreational services there is no effect in the total final demand if there is an
additional RM 1.
5.2.2.2 Objective two
As for objective two the inter linkages between sector are examined to see the
interlinkage between tourism related sector and non-tourism sector. Tourism sector
with high linkage effects have big potential to boost economic and will directly
improve the economic growth. The backward linkages will shows the demander side
of the sector and as for forward linkages it shows the supplier side of the sectors.
From the result we can see that the manufacture of food, drinks and tobacco have the
highest demand of input from other sectors to produce its output. The mining and
quarrying have the lowest backward linkages with other sectors shows that it doesn’t
rely on other sector to produce it output. For forward linkages, other manufacturing
sector except food, drink and tobacco supply its output as input to other sectors to

59
produce its output and public services have weakest forward linkages which means
the other sectors doesn’t use public services output as its input.
5.3 Research Implication
In this study the influence of tourism sector on economic growth is shown. Thus this
research can be used by many parties in order to obtain some idea or framework on
how input output can be used and the result gained from the research done for many
purposes. The result of this research will give an idea to improve the tourism sector
in Malaysia. This can be used by academicians, researchers, policy makers, tourism
ministry and many others stakeholders.
5.3.1 Researchers and Academicians
This study can be used by the researchers or academician from higher institution to
do research on the tourism sector. Thus the method that been used in the research is
to find the direct, indirect and induce effect of multiplier on the tourism sector.
Besides that the backward and forward linkages were used to see the strength of
linkages between the tourism sector and non-tourism sector.
5.3.2. Ministry of Tourism.
Many countries are taking tourism as an engine to develop the country in term of
economic growth and economic development. Malaysia also have creates many
policy and project for tourism sector. This research would help to see the impact of
tourism sector on economic growth, this research can be used as a guideline to create
policies that would improve the development of tourism sector as well as Malaysia

60
economy. After seeing the effect of the multiplier, the policy maker can bring up
policy that could help the extent of tourism industry.
5.3.3 Private Sector, Local Businesses and People.
Private and local businesses can use this research and see the prospect in this
business. By this, local business and tourism related private sector could reorganise
the tourism product and marketing structure accordance to the need, current trend
and demand of tourist. By fulfil the need of tourist, the local business could develop
their business accordingly and gain profit that could also contribute to the economic
growth. Besides that, the development business would help to create job opportunity
and will reduce the unemployment rate in Malaysia.
5.4 Recommendation
There are many ways to improve the tourism sector in Malaysia. By looking at the
rise in tourism sector, it create opportunity to improve the development of tourism by
diversifying tourism active. There few suggestion that can be used to improve the
development of tourism sector.
Government should increase their effort in improving the economic impact of
tourism sector.
Government should promote activities that should be directed towards rising
the awareness on the important in improving the tourism sector and also
encourage tourist to visit Malaysia
Improvements to attraction and present markets and developing tourist
infrastructure.
61
Government should create inter-ministerial committees include the
representative from tourism sector in order to monitor and coordinate the
implementation of tourism policy
Malaysia government must make improvements in procedures for the
issuance of visas, border formalities and customs regulation to ease
international travel.
Besides government, private sector together with other stakeholders should
collaborate in order to develop tourism. In order attract tourism around the world,
there is a needed for a strategy that involve customer marketing to promote tourism
product offering which must be different than other countries. For example
promoting tour package with other tourism packages such as welfare tour packages
with tourism homestay. This likely to be an “added value” for tourist product and
will contribute to the extension of tourist visit to Malaysia.
Other than that, beautiful and unique need to be explored and introduce natural
product that are invaluable to national treasure such as beautiful flora and fauna. This
can increase the demand for tourism product to attract more tourists. Moreover as
Malaysia is rich with racial diversity, it’s important to focus on environmental and
socio culture and integrate it international tourism policies and plans for tourism
development by ministry of tourism Malaysia. In realizing the vision of 2020 to
develop nation and introduce Malaysia at the international level, government and
private sector should collaborate. Multilateral bilateral, and sub-regional cooperation
should be strengthened.

62
In conclusion, the above recommendation are ways to improve Malaysia tourism
sector for tourist attractions. However, tourism sector need to be improve and
develop accordance needs, demands, current trend, tastes and quality of tourism
sector.
5.6 Conclusion
In this study, the impact of Malaysia tourism on economic growth. In this research
the importance of tourism on in improving the economic is highlighted and tourism
effect on its sectors and also indirectly towards non tourism sector. Tourism sector is
a collaboration several sectors and these functions of these sectors will developed
Malaysia tourism sector with the help of government and private sectors intervention
by policy making and enforcement of law. This research will be good material for
policy maker, tourism ministry researchers and others to see the effect of tourism and
how to develop it further.
The method used in this research is input output analysis, a method used to evaluate
the economic impact at regional and state level. Multiplier effect is commonly used
in this method to find the significant level in generating output and export of tourism
sector. There are few information that we can obtain by using this multiplier. We
can see influence of Malaysia tourism in order to generate output and export from
tourism sector. Other than that, the strength of linkages between sectors can be
determine using backward and forward linkages This tourism sector have strong

63
linkages among other sectors. Policy maker can use this information as a guide to
make policies on tourism sector that can help in the extension tourism industry and
promote the industry to next level to attract tourist. From the result of this research
we can conclude that tourism sector are significantly impacts on the economic
growth by generating the output and the export from tourism sector. Lastly the
development of tourism sector can be achieved if there collaboration between various
parties and also promoting tourism by implementing effective policies and projects to
attract tourist and by 2020, Malaysia can be a develop nation by 2020.

64
Reference
Malaysia Input Output Table 2010 (2014)
Weaver, D., & Oppermann, M. (2000). Tourism management. Brisbane: John Wiley
& Sons Australia, Ltd.
The Economist Intelligence Unit (1994) Malaysia (EIU International Tourism
Reports No.2).The Economic Intelligence Unit Limited.
Horvath, E., and Frechtling, D. C. (1999). Estimating the Multiplier Effects of
Tourism Expenditures on a Local Economy through a Regional Input-Output Model,
Journal of Travel Research, Vol. 37 (4), pp. 324-332.
Mazumder, M. N. H., Ahmed, E. M., and Al-Amin, A. Q. (2009). Does Tourism
Contribute Significantly to the Malaysian Economy? Multiplier Analysis Using I-O
Technique, International Journal pf Business and Management , Vol. 4 (7), pp. 146-
159.
Dritsakis, N. (2004). Tourism as a Long-Run Economic Growth Factor: An
Empirical Investigation for Greece Using Causality Analysis, Tourism Economics,
Vol. 10 (3), pp. 305-316.

65
Khan, M. M. A. (2013). Tourism Development in Malaysia: A Review on
Government Plans And Policies.
Liu, A., & Wall, G. (2006). Planning tourism employment: a developing country
perspective. Tourism Management, 27, 159-170.
http://dx.doi.org/10.1016/j.tourman.2004.08.004
10th Malaysia plan
Rashid, Z. A., Rahman, A. A. A., Othman, M. S., & Suib, A. (1993). Tourism impact
analysis–an inter-sectoral analysis of the Malaysian economy. Jurnal Ekonomy
Malaysia, 27, 99-119.
World Tourism Organization (WTO). (2010). UNWTO Tourism Highlights 2010
Edition. Retrieved on 25 April 2011. Retrieved from www.UNWTO.org/facts
UNWTO, E. (2014).UNWTO Tourism Highlights 2014 Edition.
Performance Management & Delivery Unit (Pemandu) (2010a). Chapter 1: New
Economic Model of Malaysia, viewed on 1 April 2011.
66
SURUGIU, Camelia. (2009). The Economic Impact of Tourism. An Input-Output
Analysis.
Oh, C. O. (2005). The contribution of tourism development to economic growth in
the Korean economy. Tourism Management, 26(1), 39-44.
Surugiu, C., Frent, C., & Surugiu, M. (2009). Tourism and its impact upon the
Romanian economy: an input-output approach. Analele ŞtiinŃifice ale UniversităŃii
„Alexandru Ioan Cuza” din Iaşi, 50, 355-376.
Miller, R. E., & Blair, P. D. (2009). Input-output analysis: foundations and
extensions. Cambridge University Press.
Archer, B. (1995). Importance of tourism for the economy of Bermuda. Annals of
Tourism Research, 22(4), 918-930.
Cai, J., Leung, P., & Mak, J. (2006). Tourism’s forward and backward
linkages.Journal of Travel Research, 45(1), 36-52.
Bhuiyan, M. A. H., Siwar, C., & Ismail, S. M. (2013). Tourism Development in
Malaysia from the Perspective of Development Plans. Asian Social Science,9(9),
p11.

67
Hanafiah, M. H. M., Harun, M. F., & Jamaluddin, M. R. (2011, January). Trade and
Tourism Demand: A Case of Malaysia. In International Conference on Business and
Eonomic Research. Malaysia.
Dritsakis, N. (2004). Tourism as a long-run economic growth factor: an empirical
investigation for Greece using causality analysis. Tourism Economics, 10(3), 305-
316.
Khaleed, O. A. (2009). Analysis of Tourism Developmet in Libya. Studies Colege of
Busines , 1- 92.
Mohammad, N. H., Elsadig, M. A., & Md. Abdur, R. (201). Estimating total
contribution of tourism to Malaysian economy. International Journal of Busines,
Management and Social Sciences, 29-34.
Badarudin, M., Ahmad, P. M., & Jamil, J. (n.d). Island Tourism In Malaysia: The
Not So Good News. Schol of Housing, Building & Planing , 1-8.
Adams, P. D., & Parmenter, B. R. (1995). An applied general equilibrium analysis of
the economic effects of tourism in a quite small, quite open economy. Applied
Economics, 27(10), 985-994.

68
Blake, A. (2000). The economic effects of tourism in Spain. Christel DeHaan
Tourism and Travel Research Institute.


